Article

Towards a Sustainable Spatial Planning Approach for PV Site Selection in Portugal

by
Sofia Spyridonidou
1,*,
Eva Loukogeorgaki
2,*,
Dimitra G. Vagiona
1 and
Teresa Bertrand
3
1
Department of Spatial Planning and Development, Faculty of Engineering, Aristotle University of Thessaloniki, 54124 Thessaloniki, Greece
2
Department of Civil Engineering, Faculty of Engineering, Aristotle University of Thessaloniki, 54124 Thessaloniki, Greece
3
Enercoutim, 1050-012 Lisbon, Portugal
*
Authors to whom correspondence should be addressed.
Energies 2022, 15(22), 8515; https://doi.org/10.3390/en15228515
Submission received: 6 October 2022 / Revised: 3 November 2022 / Accepted: 10 November 2022 / Published: 14 November 2022

Abstract

:
In the present paper, we introduce a decision-support framework to (a) classify and prioritize the municipalities of a country based on their suitability to host PV energy projects and (b) pinpoint and evaluate suitable technically and economically viable, as well as environmentally and socially sustainable, sites for PV installation in the most suitable municipalities of a country. The proposed framework is applied in Portugal. It consists of two distinctive stages: ‘Energy Roadmap for PV Deployment’ and ‘PV Site-Selection Analysis and Assessment’. In the first stage, the most and least suitable municipalities for PV deployment in Portugal are identified by analyzing important environmental and technoeconomic PV siting criteria in GIS and applying the TOPSIS method. In the second stage, an integrated PV site-selection assessment is conducted in the Portuguese municipality with the highest suitability index for PV installations. This is achieved by combining a proper GIS siting model with various multicriteria decision-making methods, such as ENTROPY, AHP and TOPSIS. The results illustrate the suitability of numerous municipalities in the country for PV deployment and verify the excellent suitability of the Municipality of Mértola for PV installations. In conclusion, a PV energy roadmap for Portugal is formulated, contributing to national energy autonomy.

1. Introduction

The role of renewables in improving energy security and sovereignty by replacing fossil fuels was an essential and popular issue in late 2021. Despite the increase in global commodity prices, which perturbed renewable energy supply chains, renewables had another record-breaking year, with the additional installation of 314 GW by the end of 2021 [1]. The cumulative renewable power capacity reached 3146 GW in 2021, although additional deployment of renewable energy is needed in order to achieve net-zero global emissions by 2050. In 2021, the renewable energy sector was driven by record expansion of solar photovoltaic (PV) and wind energy. In particular, for the first time, solar and wind energy provided more than 10% of global electricity [1].
Regarding global PV deployment, the solar PV industry experienced an additional growth of 175 GW in 2021, reaching a cumulative total capacity of around 942 GW, despite numerous barriers in various countries that can restrict the deployment of PV projects (e.g., limited manufacturing facilities, lack of political commitment, and lack of standards and quality control measures) [2]. Solar PV power is currently one of the leading renewable energy sources, along with hydro power (1195 GW) and wind power (845 GW). China is currently the country with the largest PV power capacity (305.9 GW), followed by the United States (121.4 GW), Japan (78 GW), India (60.4 GW) and Germany (59.2 GW) [1]. As a result, Germany is the leading country in the deployment of PV projects in Europe, whereas Portugal is ranked in 15th position.
In Portugal, renewable power capacity reached 15.06 GW at the end of 2021 [3]. Hydro power, with 7.24 GW, and wind energy, with 5.24 GW, are currently the leading renewable energy sources in the country, followed by solar PV energy, 1.8 GW installed at the end of 2021 [4]. The PV power capacity increased by approximately 63.73% during the last year, with the additional installation of 0.701 GW. This accelerated realization of PV projects in Portugal should be accompanied by an appropriately designed decision-support framework for efficient and sustainable PV deployment in the country. Such a framework could contribute to the determination of the most suitable geographic regions in the country for PV installation. In addition, it would be conducive to the precise identification of the most technically and economically viable, as well as environmentally sustainable, sites for PV siting within the predetermined highly suitable geographic regions.
In the context of the widespread spatial deployment of PV globally, all technical, economic, environmental, social, cultural, political and geographic aspects should be investigated in detail in order to address the sustainable and efficient deployment of PV projects. Several PV siting studies [5,6,7,8,9,10,11,12,13,14,15,16,17,18,19,20,21,22,23,24,25,26,27,28] have aimed to solve this complex siting problem with the application of geographic information systems (GIS) and/or various multicriteria decision-making (MCDM) methods (e.g., preference ranking organization methods for enrichment evaluations (PROMETHEE) or weighted aggregated sum product assessment (WASPAS)). Charabi and Gastli [6] deployed a GIS-based fuzzy multicriteria evaluation approach for the assessment of land suitability for large-scale PV farm implementations in Oman. Merrouni et al. [7] applied a GIS-based technique for the determination of suitable sites, as well as for the evaluation of their suitability for PV installation, using the analytic hierarchy process (AHP) method to determine the weights of the evaluation criteria. In addition, Sánchez-Lozano et al. [13] used GIS for the identification of suitable sites for PV installation in the Municipality of Torre Pacheco (southeast of Spain) and assessed the suitability of sites by applying the ÉLimination Et Choix Traduisant la REalité—TRI (ELECTRE-TRI) method. Al Garni and Awasthi [16] employed GIS in combination with AHP for the evaluation of the region of Saudi Arabia for PV siting according to a five-class land suitability index (SI). Dias et al. [20] proposed a methodology for the assessment of the technical potential for utility-scale solar PV in the Municipality of Évora in Portugal by identifying suitable areas for siting and estimating their technical potential with the use of two different PV technologies. Lastly, Fernandez-Jimenez et al. [22] developed a new methodology based on the fuzzy viewshed and the distance decay methods to rank feasible sites for the installation of new PV plants according to their observability.
However, an efficient decision-support framework that can contribute to the formulation of an energy roadmap for PV technologies in a country has yet to be developed. Specifically, no studies have been published in the literature proposing a set of criteria and/or methods that could be used for analysis, classification, evaluation and prioritization of the municipalities of a country in order to determine the most and least suitable regions for hosting PV projects. Such a study could illustrate a useful PV energy roadmap, which would contribute to the sustainable and accelerated deployment of PV projects on a national scale. The present study fulfills the above gap by deploying a decision-support framework for the site selection (DSF-SS) of PV technologies in Portugal. In addition, a linear geoprocessing model is deployed, which is combined with various MCDM methods to determine a set of highly suitable land areas for PV farm siting in the geographic regions suggested by the national PV energy roadmap. A study focusing on sustainable PV site selection in Portugal on national scale and/or on multiple spatial scales is lacking in the literature.
Motivated by the above, in the present paper, we introduce a DSF-SS of PV technologies in Portugal in order to (a) classify and prioritize the municipalities of the country according to their suitability (i.e., geographic, environmental, technical, economic and social characteristics) to host PV energy projects and (b) pinpoint and evaluate suitable technically and economically viable, as well as environmentally and socially sustainable, sites for PV installations in the Portuguese municipality with the highest PV SI. The proposed DSF-SS consists of four successive phases allocated in two distinctive stages (Stage I: Energy Roadmap for PV Deployment and Stage II: PV Site-Selection Analysis and Assessment). In Stage I (Phases 1 and 2) of the DSF-SS, the municipalities of Portugal are classified and prioritized. The latter is performed by creating a geographic information database; analyzing important environmental, technical, economic, social and cultural PV siting criteria in GIS; and finally, by applying the technique for order preference by similarity to ideal solution (TOPSIS) method. In Stage 2 (Phases 3 and 4), an integrated site-selection analysis and assessment is conducted for PV installations in the Portuguese municipality with the highest SI for PV deployment (Municipality of Mértola). This is achieved by deploying a proper GIS siting model, considering 24 PV siting criteria (SC) and 15 assessment criteria (AC) and by applying various MCDM methods, namely AHP, ENTROPY and TOPSIS. The overall outputs of the proposed DSF-SS are (i) a set of highly suitable municipalities in Portugal for hosting PV energy projects and (ii) a set of highly suitable sites for PV installations in the Portuguese municipality with the highest SI for PV deployment.
The remainder of the article is structured as follows. In Section 2, we briefly present the proposed DSF-SS, and in Section 3 and Section 4, the ‘Energy Roadmap for PV Deployment’ and ‘PV Site-Selection Analysis and Assessment’ stages of the proposed decision-support framework are described in detail. The results of the present investigation are presented and discussed in Section 5, whereas in Section 6 the concluding remarks and key findings of the research study are presented.

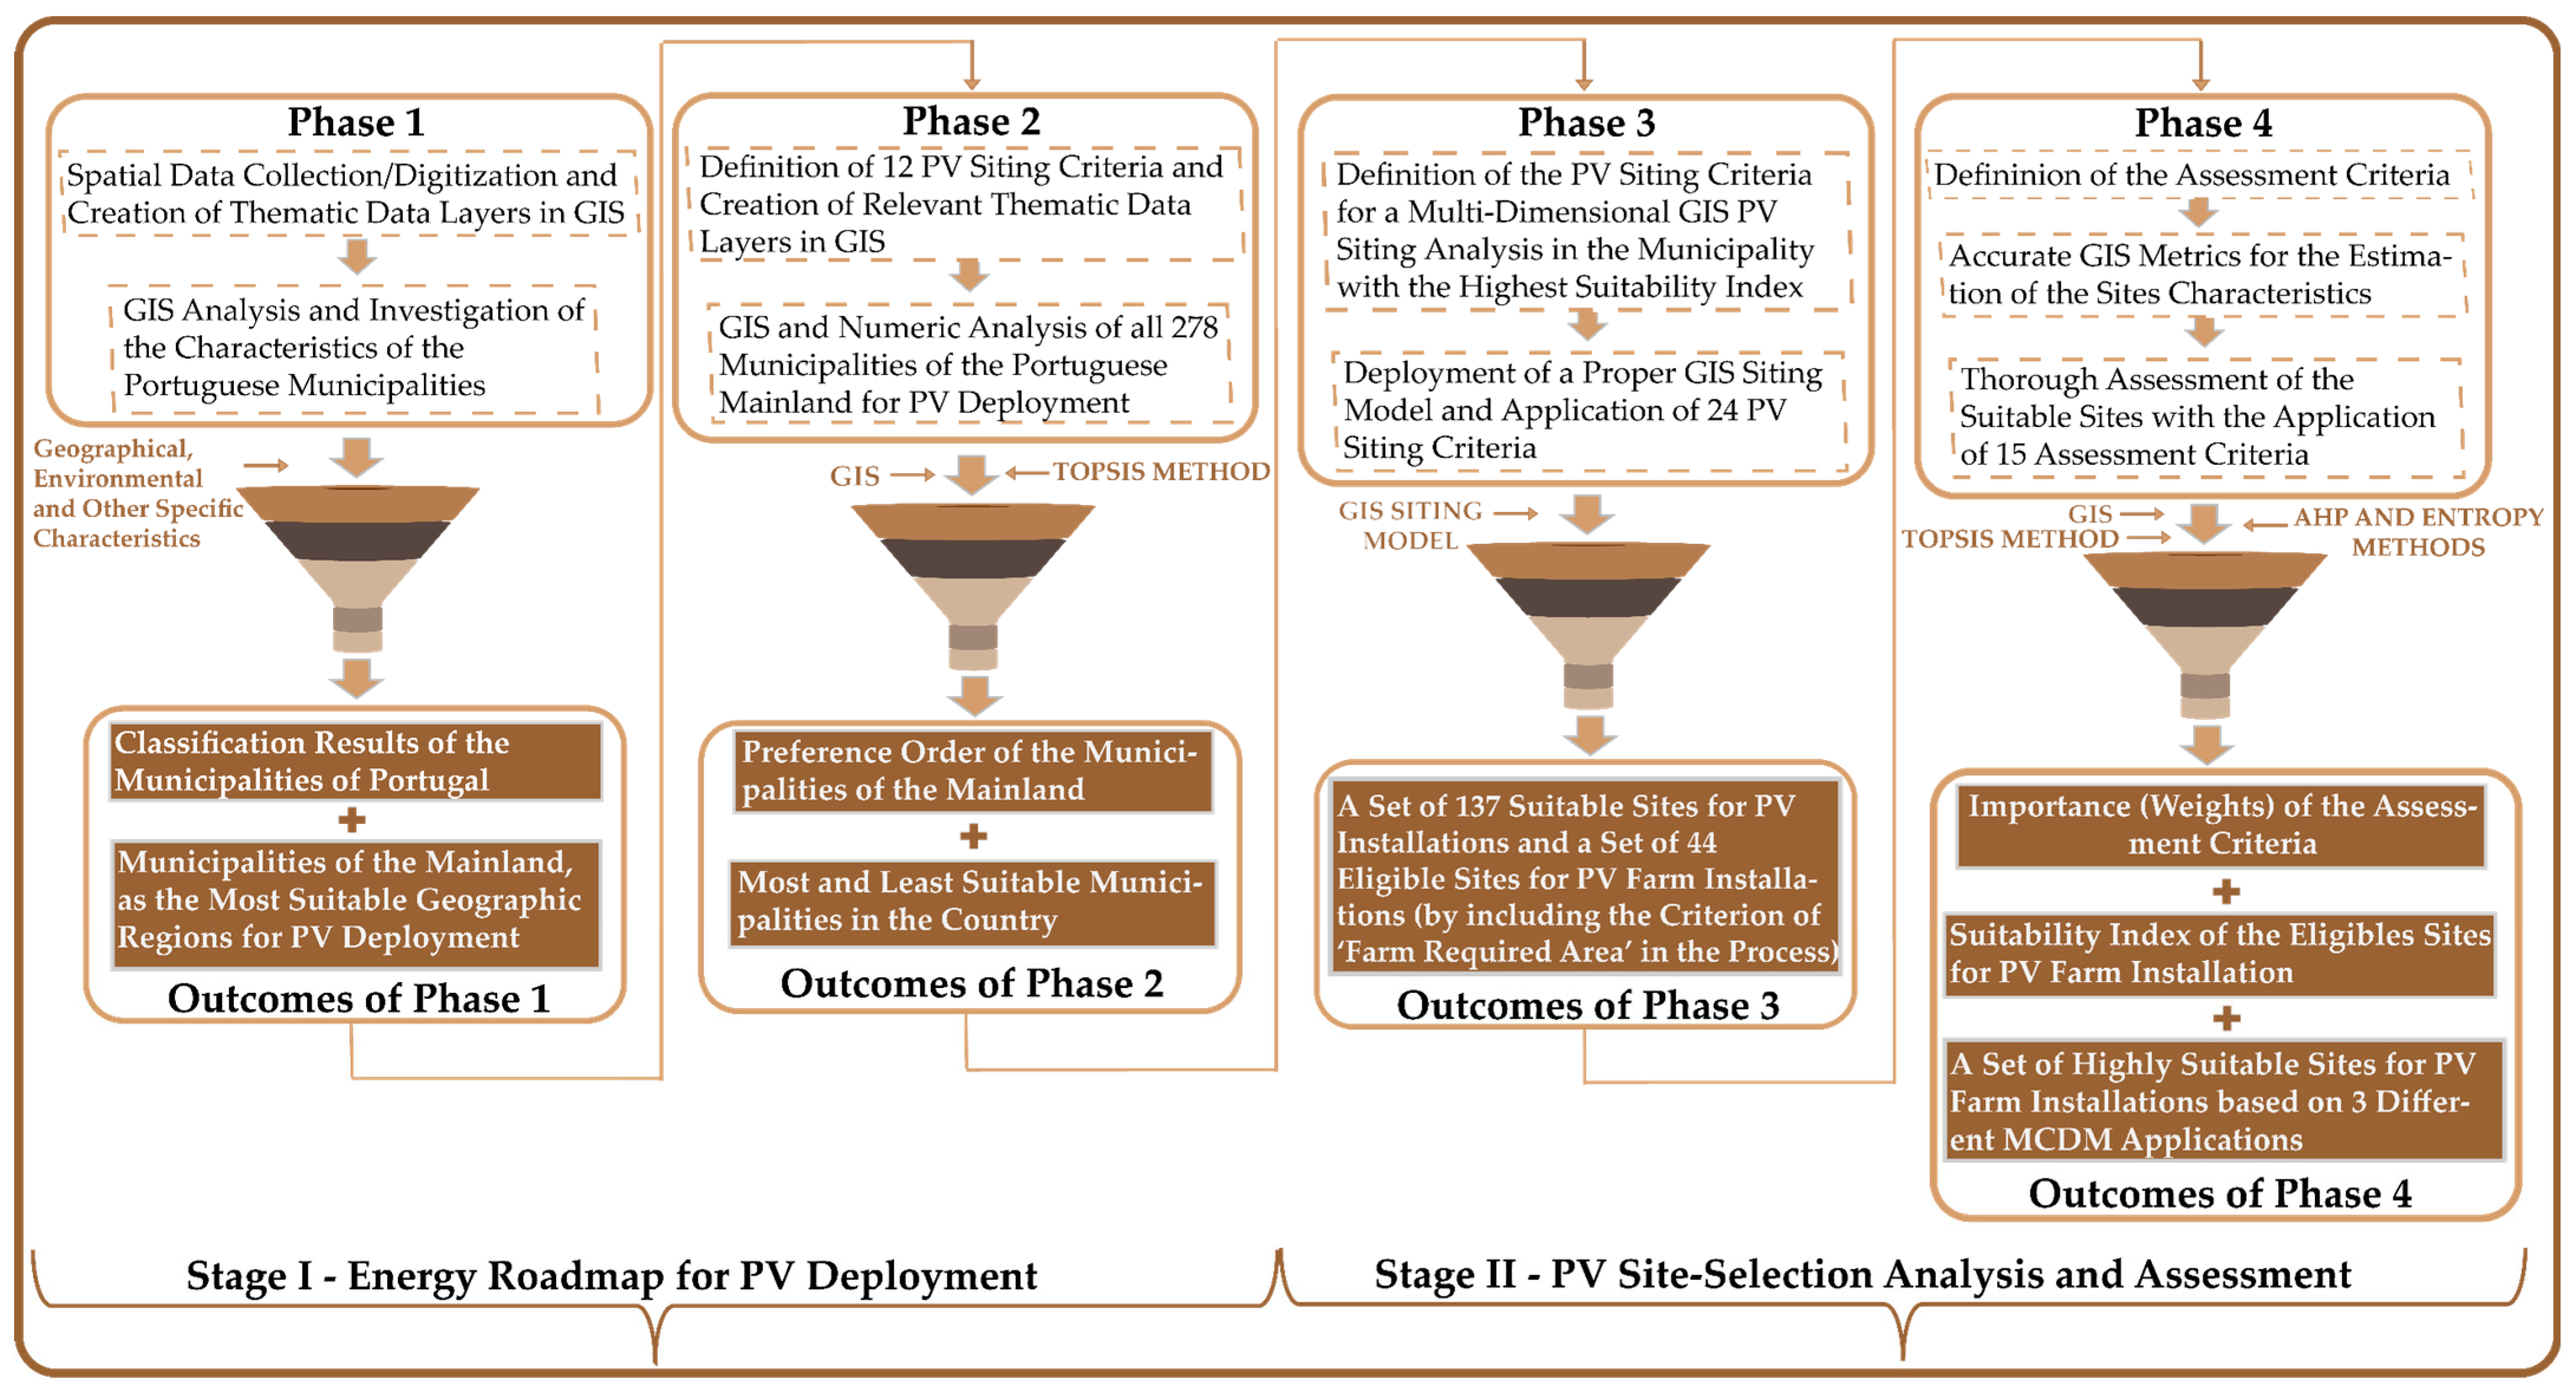
2. Overview of the Decision-Support Framework for the Site Selection of PV Technologies

The proposed DSF-SS is shown in Figure 1. It represents an efficient approach for the formulation of an energy roadmap for PV deployment on national and regional scales in Portugal and for the application of a relevant integrated PV site-selection analysis and assessment.
The aim of Stage I is to identify the most and least suitable regions and municipalities of the country for sustainable PV deployment (Phases 1 and 2; Figure 1). In particular, in Phase 1, a geographic information database is developed, and numerous thematic data layers of important PV siting criteria (e.g., practical photovoltaic energy output (PVOUT), protected areas and air temperature) are created. Then, a GIS analysis of the municipalities of the investigated country (Portugal) is conducted by examining their geographic, environmental, technoeconomic and other specific characteristics. The main outcomes of the first phase are (i) the classification results of the municipalities of Portugal (i.e., municipalities of the mainland (MoM) and municipalities of the island regions (MoIR)) and (ii) the identification of the MoM as the most suitable geographic regions to host PV energy projects in the country based on the examination of their characteristics in GIS. Next, in Phase 2, the SC for the municipalities of the Portuguese mainland are prioritized for PV deployment. Then, a detailed GIS and numeric analysis of all 278 MoM is conducted in accordance with the predefined SC. The main outcomes of Phase 2 are (i) the preference order of all the municipalities on national and regional scales and (ii) the most and least suitable municipalities of the country based on their determined specific SI to host PV energy projects.
The most suitable municipality of Portugal for PV deployment (i.e., Municipality of Mértola) obtained in Stage I is then considered as an input in Stage II to conduct an integrated PV site-selection analysis. Specifically, in Phase 3, additional PV SC are defined, and an appropriately designed siting model is created in GIS for implementation of a multidimensional siting analysis in the aforementioned municipality. The outcomes of this phase are a set of 137 suitable sites for PV installation and a set of 44 eligible sites for PV farm installation, including in the latter case the SC of ‘farm minimum required area’ in the site-selection process. In the last phase of the proposed DSF-SS (Phase 4), 15 AC are defined to evaluate the suitable sites. Accurate GIS metrics are employed to estimate the site characteristics for each AC. The suitable sites are then assessed by deploying three different MCDM approaches, namely AHP and TOPSIS, ENTROPY and TOPSIS, and the equal weights approach and TOPSIS. The outcomes of this phase are (i) the importance (weight) of each AC in the assessment process, (ii) the specific SI of each eligible site for PV farm installation and their preference order and (iii) a set of highly suitable sites for PV farm siting resulting from examination of the site-suitability results from the application of three hybrid MCDM approaches. In the following sections, the stages and the phases of the proposed decision-support framework are thoroughly described and presented.

3. Stage I: Energy Roadmap for PV Deployment

3.1. Spatial Data Collection/Digitization and GIS Analysis of Portuguese Municipalities (Phase 1)

In Phase 1, a geographic information database was developed and organized into feature classes (i.e., each feature class corresponds to a GIS layer, which represents an SC). Relevant thematic data layers were developed in the GIS environment to (i) illustrate the spatial dimension of each SC and (ii) investigate the PV siting potential on multiple scales by analyzing the positive or negative spatial impact of the application of each SC on PV deployment in Portugal. The geographic information data employed for the successful implementation of Phase 1 of the proposed DSF-SS are presented in Table 1. In this table and hereafter, ‘NSC’ is used to denote the SC employed for the national-scale analysis. The geographic information data used and processed in all phases of the proposed framework are derived from international or national institutes, research centers, services and/or organizations that provide officially approved cartographic data in order to provide reliable siting results.
Table 1. NSC and data sources employed in Phase 1 of the proposed framework. Note 1: OSM, OpenStreetMap, OSM; CLMS, Copernicus Land Monitoring Service; AMA, Agência para a Modernização Administrativa. Note 2: The minimum mapping unit (MMU) of Corine land cover data provided by CLMS is 25 ha.
NSC No.NameData Source(s)Spatial
Resolution
Unsuitable Land Areas
NSC.1Global horizontal irradiance (GHI)Global Solar Atlas [29]250 m<4 kWh/m²/day
NSC.2Practical PV energy output (PVOUT)Global Solar Atlas [29]1 km<3.5 kWh/kWp/day
NSC.3Distance from protected areas (including protected landscapes)Protected Planet [30]N/A<500 m
NSC.4Distance from touristic zones and coastlineOSM, CLMS, EMODnet [31,32,33]N/A, 20 m, N/A<500 m and <1000 m
NSC.5Land availability/geographic extent of the municipalitiesAMA [34]N/A
NSC.6Distance from urban and residential areasOSM, CLMS [31,32]N/A, 20 m<1000 m
NSC.7Distance from agricultural land and croplandsOSM, CLMS [31,32]N/A, 20 m<100 m
NSC.8Distance from vineyards and other tree plantationsOSM, CLMS [31,32]N/A, 20 m<100 m
NSC.9Distance from forestsOSM, CLMS [31,32]N/A, 20 m<100 m
By finalizing all necessary thematic data layers in GIS, the Portuguese municipalities were analyzed according to their environmental (existence of protected areas), technoeconomic (global horizontal irradiance and practical PV energy potential), geographic (land availability) and social (distances from urban and residential areas, touristic zones and agriculture) characteristics. Then, additional criteria were included in the analysis by performing the required GIS observations and conducting an investigation analysis for the features with no spatial dimensions. Specifically, political (autonomous or non-self-governing regions) and other geographic (distance to the main electricity grid) characteristics were also examined. After finalizing the siting analysis on the national scale, the municipalities were classified into two main categories based on the insights and the results (Section 5.1) derived from the GIS analysis of the NSC presented Table 1, the required GIS observations and the investigation analysis. Next, the class of the most appropriate municipalities of the country (i.e., MoM; a total of 278 of 308 municipalities in Portugal) to host sustainable PV energy projects was selected for further PV siting analysis.

3.2. GIS Assessment and Prioritization Analysis of the Municipalities of the Portuguese Mainland for PV Installations (Phase 2)

In Phase 2, the SC used for the prioritization of the MoM were defined (hereafter, the abbreviation ‘MoMSC’ is used to denote the SC employed for the prioritization of the MoM). In total, 12 MoMSC were employed (Table 2), which were classified into three main categories for the efficient execution of the prioritization process:
(1)
Exclusion of low-GHI zones: The areas with a GHI lower than 4 kWh/m²/day were excluded from the analysis [35,36], and the related geographic extents (m2) were calculated in GIS for each MoM.
(2)
Mean of PVOUT: The PVOUT layer was clipped into each MoM, and its mean value was estimated for each MoM using the statistics section in GIS.
(3)
Land availability: The geographic extent of each MoM was estimated in GIS. Then, by excluding all existing infrastructure and water surfaces (Table 2) from each municipality in GIS, the final land availability in all MoM was estimated. Proper buffer zones were also applied from road and railway networks in order to prevent impacts of glare on local drivers. In addition, with the aim of enhancing the accuracy of the prioritization results, an extra filtering of the final land available zones was performed using the latest available OpenStreet base map in GIS in order to further erase areas that may contain any type of infrastructure or water surface.
Following the creation of all necessary thematic data layers in GIS and the collection of all important spatial information according to the selected MoMSC, all 278 MoM were prioritized using the GIS estimations in relation to the MoMSC (Table 2) and the TOPSIS method.
TOPSIS relies on the concept that the selected alternative solution should have the shortest distance from the positive ideal solution (PIS) and the farthest from the negative ideal solution (NIS) [37]. The final preference order of the alternatives is ranked based on the closeness index and a combination of the two referred distance functions [37]. TOPSIS was applied according to the following seven steps [38]:
  • Step 1.Establishment of a performance decision matrix: An m × n decision matrix ( m = number of alternatives and n = number of decision criteria) is generated, which contains the specific values of each alterative solution to the decision criteria. In this case, the alternatives are the MoM, and the decision criteria are the MoMSC presented in Table 2.
  • Step 2.Normalization of the decision matrix: The normalized decision matrix can be structured using Equation (1). This decision matrix sets the decision criteria on a common, dimensionless basis and permits comparisons among them.
    r i j = x i j i = 1 m x i j 2
    where x i j is the intersection of the i-th alternative ( i = 1 , , m ) and with a j -th criterion ( j = 1 , , n ).
  • Step 3.Estimation of the weighted normalized decision matrix: After determining the weight ( w j ,   j = 1 , , n ) of each decision criterion (by applying either AHP or ENTROPY or any other method), the weighted normalized decision matrix can be formulated using Equation (2). In this work, all decision criteria are considered equally important in order to prioritize all MoM according to their attributes on the selected decision criteria and to eliminate the subjectivity of the prioritization results.
    v i j = w j   r i j , i = 1 ,   ,   m ,   j = 1 ,   ,   n
  • Step 4.Determination of the PIS (A+) and the NIS (A): In this step, the function type, namely benefit or cost, of each decision criterion is identified. If the criterion represents a benefit function, the PIS receives the maximum value between the values of the alternative solutions and the NIS the minimum value, whereas if the criterion represents a cost function, the PIS receives the minimum value, and the NIS receives the maximum value. The values of the PIS ( A + ) and NIS ( A ) can be estimated using Equations (3) and (4), respectively.
    A + = { v 1 +   ,   ,   v n + } = { ( m a x v i j ,   j J ) , ( m i n v i j ,   j J ) } ,   i = 1 ,   2 ,   ,   m
    A = { v 1   ,   ,   v n } = { ( m i n v i j ,   j J ) , ( m a x v i j ,   j J ) } ,   i = 1 ,   2 ,   ,   m
    where J = { j = 1 ,   ,   n |   j benefit function criteria } and J = { j = 1 ,   ,   n |   j cost function criteria } .
  • Step 5.Calculation of the Euclidean Distance of the alternatives from the A+ and A solutions: The following equations are used in order to estimate the Euclidean distances of the alternatives.
    S i + = j = 1 n ( v i j v j + ) ,   i = 1 ,   2 ,   ,   m
    S i = j = 1 n ( v i j v j ) ,   i = 1 ,   2 ,   ,   m
  • Step 6.Calculation of the relative closeness ( C i + ) to the ideal solution: The C i + of an i -th alternative solution with respect to the ideal solution can be calculated using Equation (7).
    C i + = S i ( S i + + S i ) ,   i = 1 ,   2 ,   ,   m
  • Step 7.Determination of the preference order of the alternative solutions based on the C i + measure: The results of all steps are concentrated in a final overall matrix, and all alternative solutions are prioritized in a preference order based on the C i + measure. The alternatives with the highest scores are the most preferred. In this case, the specific SI (i.e., C i + value) was determined for all alternative solutions (MoM). Then, the MoM were prioritized on multiple spatial scales (i.e., national and regional scales) in order to determine the most and least suitable municipalities on all possible scales and contribute to a well-informed energy roadmap for PV deployment in Portugal.
The municipality with the highest C i + value was selected for a further detailed PV site-selection analysis and assessment (Stage II).

4. Stage II—PV Site-Selection Analysis and Assessment

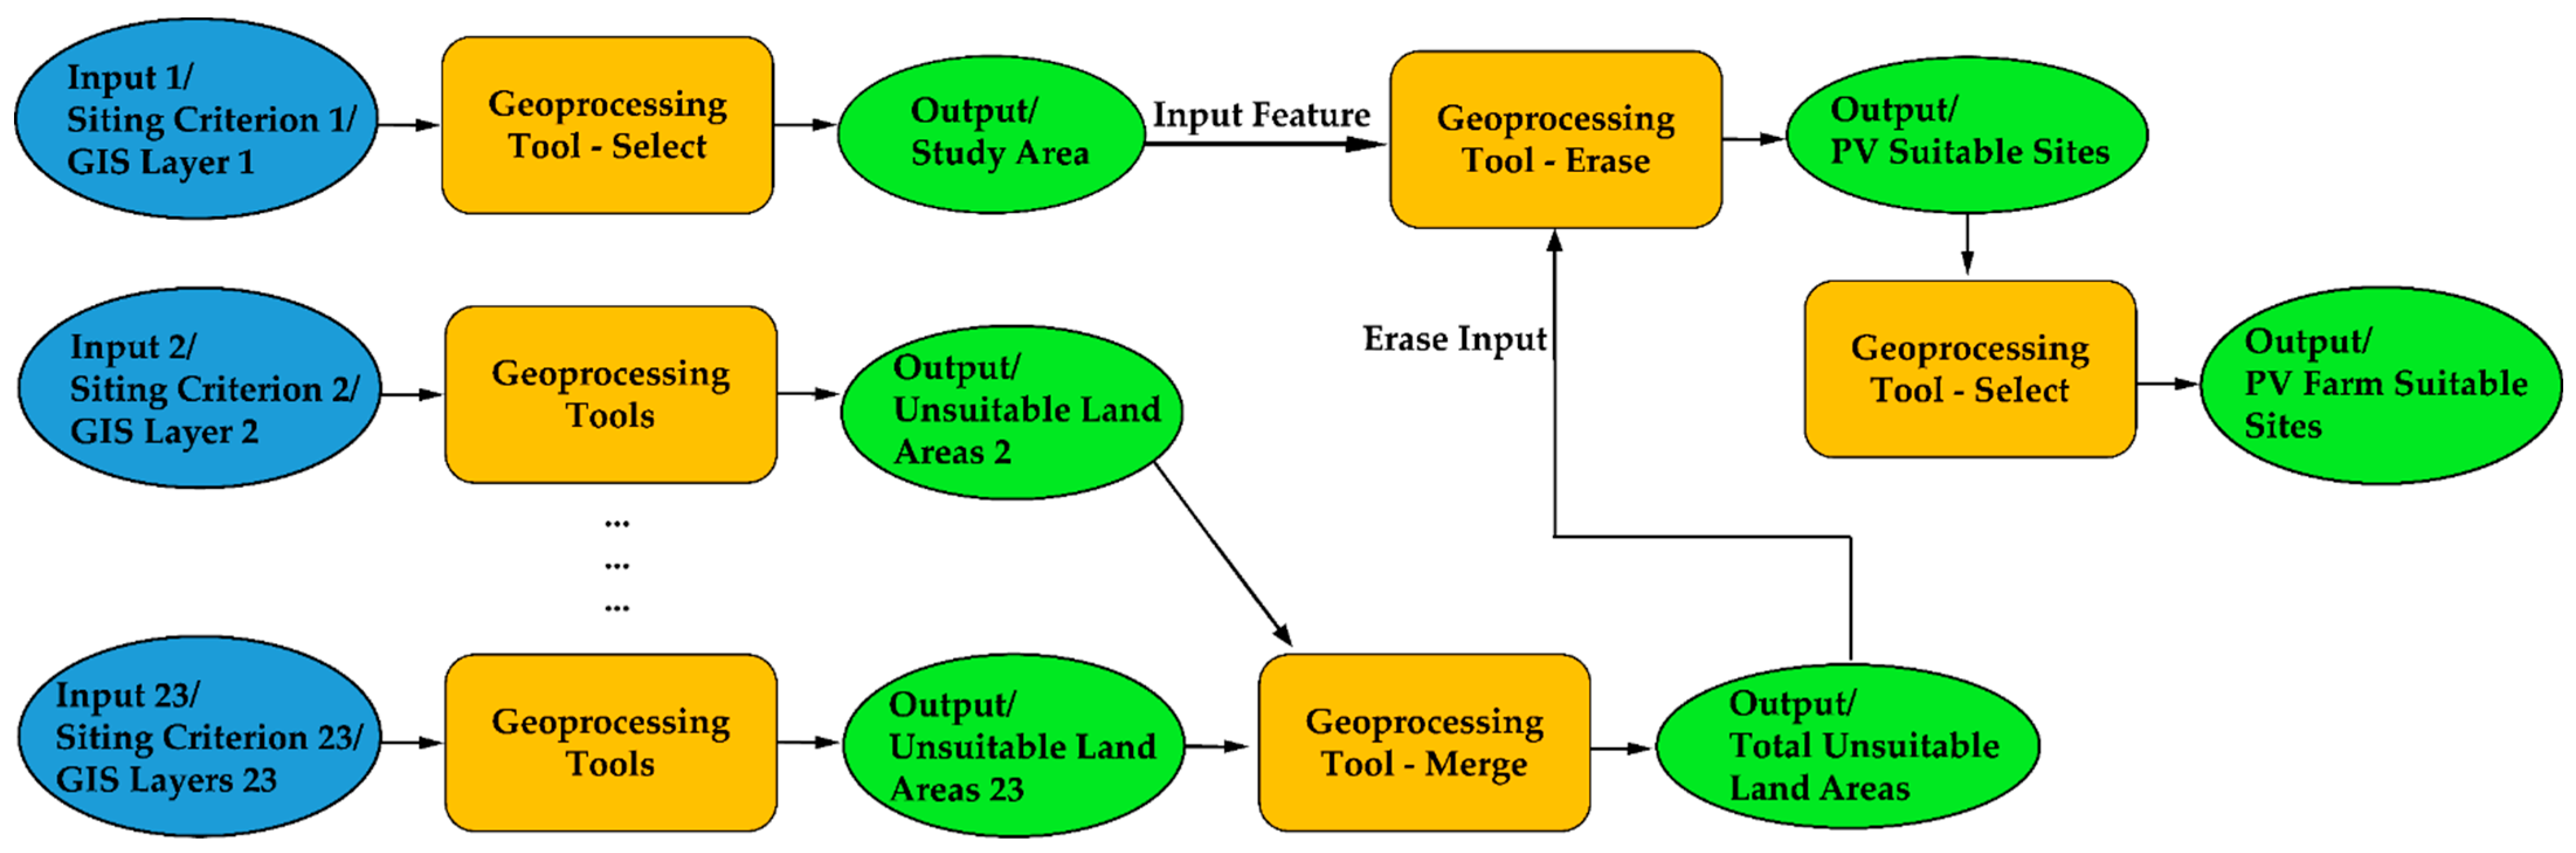
4.1. Identification of Suitable Sites for PV Installations in the Municipality with the Highest PV Suitability Index (Phase 3)

Numerous SC are defined and employed in this phase for the identification of potential sites for PV projects in the municipality with the highest PV SI in the country. Specifically, in Phase 3, areas unsuitable for the installation of PV technologies are identified and excluded from further analysis. The SC thematic data layers that have been developed on national and MoM scales are also used in the current phase by clipping the necessary geographic information data at the municipality scale and by further processing these data in GIS. Additional important SC were also applied in this phase, which are shown in Table 3, along with their exclusion limits. The following 24 SC were employed for the proper and thorough execution of the PV site-selection analysis (the abbreviation ‘PVSC’ is used to denote the SC employed for the identification of suitable PV sites):
PVSC.1: geographic boundaries: The administrative boundaries of the selected municipality were defined as the official boundaries of the study area, and any area outside of these limits was excluded from the PV site-selection analysis.
PVSC.2: global horizontal irradiance (GHI): GHI is the total amount of shortwave radiation, integrated over a time, falling on a horizontal surface of the Earth. GHI integrates direct, diffuse and reflected components of solar energy. The areas with GHI values lower than 4 kWh/m²/day were excluded from the study area due to their low energy potential [35,36].
PVSC.3: distance from protected areas: This criterion includes all 447 protected areas of the country, including protected landscapes. These areas were defined as unsuitable for PV installation [21,39] in order to preserve their environmental sustainability, and a buffer zone of 500 m was also applied from these areas.
PVSC.4: distance from important bird areas (IBAs): Appropriate distances (i.e., 500 m) from areas hosting a variety of significant and rare bird species were applied to preserving their environmental and biological importance [5,40].
PVSC.5: distance from urban and residential areas: A distance of 1000 m was applied from urban and residential areas to contribute to landscape protection, visual disturbance avoidance and social acceptance [5,41]. Solitary residences and buildings were also excluded.
PVSC.6: distance from the road network: A minimum distance of 150 m was defined from the road network for safety and aesthetic reasons [8,39], and a maximum threshold of 5000 m was set to reducing the investment costs, as well as the related environmental impacts [8,42].
PVSC.7: distance from the railway network: An appropriate buffer zone of 150 m was applied from the railway network to preventing the impact of glare on local train drivers [5,39,40], thereby contributing to the social acceptance of PV projects.
PVSC.8: average air temperature: The performance of PV modules declines under high temperatures, specifically temperatures over 25 °C [43,44,45], which was defined as an exclusion limit.
PVSC.9: slope of terrain: The slope of terrain affects PV project investment costs. Specifically, larger slopes lead to increased installation costs and to technically unfeasible projects [39,41]. Thus, areas with slope larger than 5% were excluded from the siting analysis.
PVSC.10: distance from civil/military aviation areas: Safety distances of 3000 m were applied from all aviation areas (airports, airbases or airfields) in order to prevent the impact of glare from PV panels on pilot vision, as well as the disturbance of airport radar by nearby PV installations [41,46].
PVSC.11: distance from water surfaces: All water surfaces were excluded from the analysis, and an appropriate distance of 150 m was additionally applied from water bodies, rivers, riverbanks, canals and streams in response to environmental and technical concerns [6,39,42].
PVSC.12: distance from the electricity grid: A safety distance of 150 m was defined from existing electricity substations to avoid any technical damage and ensure the sustainable operation of both PV projects and electricity substations [20,28]. An upper threshold of 25,000 m was also applied to avoid high construction and installation costs and to ensure the economic viability of the project [8,28].
PVSC.13: elevation: Sites at high altitudes (i.e., higher than 1500 m) were avoided for the installation of PV projects, as high altitudes lead to increased investment costs and, in several cases, to economically unviable projects [8,47].
PVSC.14: military zones: These zones are officially used by the National Army for training and other important purposes or as firing fields. Therefore, these areas cannot be considered for any other use [5,40].
PVSC.15: distance from agricultural land and croplands: This criterion includes complex cultivations patterns, agricultural land with significant areas of natural vegetation, annual crops associated with permanent crops, agroforestry areas, farmland and farmyards. All these areas were considered unsuitable for PV siting [28,48], and appropriate buffer zones of 100 m were applied from the aforementioned areas.
PVSC.16: vineyards and other tree plantations: Vineyards and other tree plantations, such as olive groves and fruit tree and berry plantations, were considered unsuitable areas and excluded from the siting analysis [20,21].
PVSC.17: distance from religious sites: This criterion includes all religious sites (e.g., Christian, Buddhist, Jewish and Muslim sites and many related areas) in the study area. The aforementioned sites were considered unsuitable [45,48], and an appropriate distance of 100 m was applied from these sites.
PVSC.18: distance from touristic zones: All touristic zones were considered unsuitable for PV deployment [6,20,45], and an appropriate distance of 100 m was applied from these areas.
PVSC.19: distance from existing RE installations: Land areas officially used for other RE installations were excluded, and an appropriate distance of 500 m was applied from them, with the exception of existing PV farms.
PVSC.20: mineral extraction sites: This criterion includes open-pit extraction sites of construction materials (e.g., sandpits and quarries) or other minerals (open-cast mines), as well as flooded mining pits. These sites were considered unsuitable for PV siting [21,49].
PVSC.21: industrial zones and economic activities: Land areas officially used for industrial zones or economic activities were excluded from the siting analysis [20,21].
PVSC.22: distance from archaeological, historical and cultural heritage sites: This criterion includes all archaeological sites, museums, monuments, memorials, castles, ruins, forts and other related historical and cultural heritage sites. These sites were excluded from the siting analysis, and an appropriate buffer zone of 1000 m was excluded from these areas for PV siting [48,50].
PVSC.23: distance from forests: This criterion includes all broad-leaved, coniferous and mixed forests, as well as all forestry areas. These areas were excluded from the siting analysis, and appropriate buffer zones of 100 m were applied in order to preserve their environmental importance [20,51].
PVSC.24: farm minimum required area: A minimum required area was defined in order to identify eligible sites for the siting of PV farms. This criterion was applied after synthesizing the thematic data layers related to PVSC.1-PVSC.23.
The applied PVSC, along with their siting aspect and their incompatibility zones, are shown in Table 3. Considering the above PVSC and their exclusion limits (Table 3), an appropriately designed linear geoprocessing model was built, edited and managed in GIS by deploying all required geoprocessing workflows. The form of the linear geoprocessing siting model is presented in Figure 2.
Table 3. PVSC and their incompatibility zones applied in Phase 3 of the proposed framework. Note 1: AMA, Agência para a Modernização Administrativa; SPEA, Sociedade Portuguesa para o Estudo das Aves; OSM, OpenStreetMap; CLMA, Copernicus Land Monitoring Service; EEP, endogenous energies of Portugal. Note 2: The minimum mapping unit (MMU) of Corine land cover data provided by CLMS is 25 ha.
PVSC No.NameData Source(s)Spatial
Resolution
Siting AspectUnsuitable Land Areas
PVSC.1Geographic boundariesAMA [34]N/AGeographic/legalAdministration Boundaries
PVSC.2Global horizontal irradiance (GHI)Global Solar Atlas [29]250 mEconomic<4 kWh/m2/day
PVSC.3Distance from protected areasProtected Planet [30]N/AEnvironmental<500 m
PVSC.4Distance from important bird areas (IBAs)SPEA [52]N/AEnvironmental<500 m
PVSC.5Distance from urban and residential areasOSM, CLMS [31,32]N/A, 20 m Social/cultural<1000 m
PVSC.6Distance from the road networkOSM [31]N/ATechnical/economic<150 m and >5000 m
PVSC.7Distance from the railway networkOSM [31]N/ATechnical/social<150 m
PVSC.8Average air temperatureGlobal Solar Atlas [29]1 kmTechnical/economic>25 °C
PVSC.9Slope of terrainCLMS [53]25 mTechnical/economic> 5%
PVSC.10Distance from civil/military aviation areasOSM, CLMS [31,32]N/A, 20 mPolitical/technical<3000 m
PVSC.11Distance from water surfacesOSM, CLMS [31,32]N/A, 20 mEnvironmental<150 m
PVSC.12Distance from the electricity gridEsri’s Basemaps [54]0.2 mTechnical/economic<150 m and >25,000 m
PVSC.13ElevationCLMS [53]25 mEconomic/environmental>1500 m
PVSC.14Military zonesOSM, EMODnet [31,33]N/APoliticalALL
PVSC.15Distance from agricultural land and croplandsOSM, CLMS [31,32]N/A, 20 mSocial/economic<100 m
PVSC.16Vineyards and other tree plantationsOSM, CLMS [31,32]N/A, 20 mSocial/economicALL
PVSC.17Distance from religious sitesOSM [31]N/ASocial/cultural<100 m
PVSC.18Distance from touristic zonesOSM [31]N/ASocial/economic<100 m
PVSC.19Distance from existing RE installationsEEP [55]0.2 m Technical/economic<500 m
PVSC.20Mineral extraction sitesOSM, CLMS [31,32]N/A, 20 mTechnicalALL
PVSC.21Industrial zones and economic activitiesOSM, CLMS [31,32]N/A, 20 mSocial/economicALL
PVSC.22Distance from archaeological, historical and cultural heritage sitesOSM [31]N/ASocial/cultural<1000 m
PVSC.23Distance from forestsOSM, CLMS [31,32]N/A, 20 mEnvironmental<100 m
PVSC.24Farm minimum required areaEconomic<0.15 km2

4.2. Determination of the Suitability Index of the Eligible Sites for PV Farm Installations (Phase 4)

In order to prioritize the eligible sites for PV farm installations and determine their specific SI according to all dimensions of sustainability (i.e., economic, social and environmental), 15 AC (denoted hereafter as PVAC) were defined. Specifically, the suitable sites derived from Phase 3 were assessed and prioritized according to land availability (PVAC.1, benefit criterion); existing land use (PVAC.2, benefit criterion); PVOUT (PVAC.3, benefit criterion); distance from archaeological, historical and cultural heritage sites (PVAC.4, benefit criterion); distance from protected areas (PVAC.5, benefit criterion); distance from religious sites (PVAC.6, benefit criterion); distance from agricultural land and croplands (PVAC.7, benefit criterion); distance from areas of landscape value (PVAC.8, benefit criterion); distance from urban and residential areas (PVAC.9, benefit criterion); distance from the road network (PVAC.10, cost criterion); slope of terrain (PVAC.11, cost criterion); distance from the electricity grid (PVAC.12, cost criterion); water availability (PVAC.13, cost criterion); average air temperature (PVAC.14, cost criterion); and distance from civil/military aviation areas (PVAC.15, benefit criterion). The criteria introduced for the first time in this paper as PVAC are described below.
PVAC.1: land availability: The geographic extent (m2) of each suitable site for PV farm installation.
PVAC.2: existing land use: The suitable sites were assessed based on the importance and suitability of the existing land use (e.g., grasslands or sclerophyllous vegetation).
PVAC.8: distance from areas of landscape value: The distance of each suitable site from areas of a significant landscape value.
PVAC.13: water availability: The distance of each suitable site from the available water surfaces for PV cleaning and cooling.
A summary of all PVAC employed for the PV site suitability analysis is presented in Table 4, along with their evaluation aspect and function type.
Next, accurate GIS metrics were employed to quantify the eligible sites characteristics for each PVAC. After formulating the performance decision matrix, which contains the values of each PV alternative siting solution to the decision criteria, the weights of PVAC were determined by applying the following MCDM approaches:
  • The AHP method;
  • The ENTROPY method; and
  • The equal weights approach.
In the case of the AHP, the importance of each PVAC was determined in accordance with the method’s corresponding principles. In that respect, pairwise comparisons between the PVAC were performed, and each PVAC was assessed with respect to the objective of the MCDM problem (sustainable PV siting) by deploying a fundamental nine-point scale of the AHP [56,57,58]. After structuring the judgement matrix based on the authors’ experience, knowledge and preferences, the priority vector can be estimated using the eigenvalue method [56,57,58].The robustness of the pairwise comparisons can be assessed by calculating the consistency index and the consistency ratio and by considering only a consistency ratio of 0.1 or less as an acceptable value [56,57,58]. After verifying the consistency of the results, the priority vector indicates the importance of each PVAC and determines the precise influence of a criterion on the overall objective of the problem.
In the second case, the weights of the PVAC were determined according to the principles of the ENTROPY method. The main advantage of this method is the avoidance of the interference of human opinion in the assignment of the weights and therefore the enhancement of the objectivity of the weight results [59]. In the first step of this method, the measured values are standardized. Specifically, according to the method, n indicators (i.e., decision criteria) and m samples (i.e., alternatives) are set in the evaluation, and the measured value of the j -th, j = 1 , ,   n , indicator in the i -th, i = 1 , , m , sample is defined as x i j . The standardized value of the j -th indicator in the i -th sample is denoted as p i j , and it can be estimated by using following equation [59]:
p i j = x i j i = 1 m x i j
Then, the entropy value ( E j ) of the j -th indicator can be calculated according to Equation (9) [59].
E j = i = 1 m p i j ln p i j ln m
In the assessment process of the ENTROPY method, p i j ln p i j is set to equal zero when p i j = 0 for the convenience of the calculation. The range of the entropy value ( E j ) is [0,1]. The larger the value of E j is, the greater the differentiation degree of the j -th indicator. Hence, a higher weight should be assigned to the indicator. Thus, the weights can be estimated using the following equation [59]:
w j = 1 E j j = 1 n ( 1 E j )
The weights derived from the application of the AHP and ENTROPY methods are cited in Section 5.4.
In the last case, weights were assigned directly to the PVAC, assuming that all PVAC are of equal importance. Accordingly, the weight of each PVAC was set to equal 1/15 (i.e., the inverse of the total number of PVAC).
Having quantified the weights of the PVAC, the SI of each eligible site for PV farm installation is determined. This is achieved by employing the TOPSIS method (see Section 3) with weights derived from AHP or ENTROPY or from the equal weights approach. Accordingly, the SI was determined for three different hybrid MCDM approaches (i.e., AHP and TOPSIS, ENTROPY and TOPSIS, and the equal weights approach and TOPSIS). The estimated SIs of each hybrid approach were examined, compared and analyzed, and highly suitable sites were identified. The corresponding results of each application and analysis were incorporated in GIS to illustrate the spatial suitability allocation of the eligible sites.

5. Results and Discussion

5.1. Classification of the Municipalities of Portugal and Suitability Selection

Numerous thematic data layers were created to illustrate the spatial impact of important SC in the PV site-selection process in Portugal. Figure 3a,b present the thematic maps of the PVOUT (PVSC.2) ‘distance from protected areas’ (PVSC.3) criteria, respectively.
Examining important environmental, technoeconomic, geographic, social and political characteristics of the municipalities of Portugal by creating all necessary thematic data layers in GIS or by performing an investigation analysis for the characteristics with no spatial dimension, the following insights and results were derived: (a) The MoIR have much lower PV energy potential than the MoM; (b) a considerable portion of the MoIR are designated as international or national protected areas; (c) the MoIR are autonomous regions of Portugal with distinct political and administrative status, as well as their own government [60,61,62]; (d) the land availability for a potential PV project installation is exponentially much lower in the MoIR than the MoM; (e) the installation of a potential PV project in the MoIR would exclusively benefit the local population, owing to the long distance of these regions from the mainland, therefore representing a small portion of the total Portuguese population; (f) some of the main economic sectors of the MoIR, such as agriculture and tourism [60,62], could be negatively affected by the use of land for PV projects within these regions; and (g) a significant portion of the land of the MoIR is dedicated to agriculture and to forestry areas. Considering the above factors and owing to the distinct characteristics of the MoIR with the MoM, the municipalities of the Portugal were sorted into these main categories. Then, the MoM were selected for further PV siting analysis, with the aim of promoting sustainable and efficient PV deployment in the country, as well as national energy autonomy.

5.2. Prioritization Results of the Municipalities of the Portuguese Mainland

The results of the prioritization process of the MoM are illustrated in Figure 4, whereas Table 5 presents the most and least suitable municipalities in the Portuguese mainland for PV deployment based on their specific SI (i.e., C i + value). Specifically, the MoM are presented according to their C i + value, in preference order. The Municipality of Lisbon is 263th in the preference order; however, it is excluded completely from the suitable MoM because there is currently no land available for PV installations in the geographic extent of the municipality based on the results of the current GIS analysis (Figure 4). At this level of the siting analysis, the SI values are classified into four suitability classes: low suitability (0.001–0.399), moderate suitability (0.400–0.599), high suitability (0.600–0.899) and excellent suitability (0.900–1.000). A total of 12 MoM have excellent suitability, and 262 MoM have high suitability, whereas only 3 MoM are characterized by low suitability. No MoM were classified in the moderate suitability category. The region with the most suitable municipalities (5 of 12 MoM) is the Region of Beja (south of Portugal), whereas the region with the least suitable municipalities (2 of 3 MoM) is the Region of Viana do Castelo (northwest of Portugal; Figure 4). According to the prioritization results, the municipality with the highest SI for PV deployment in the Portuguese mainland is the Municipality of Mértola (SI = 0.996; Table 5).

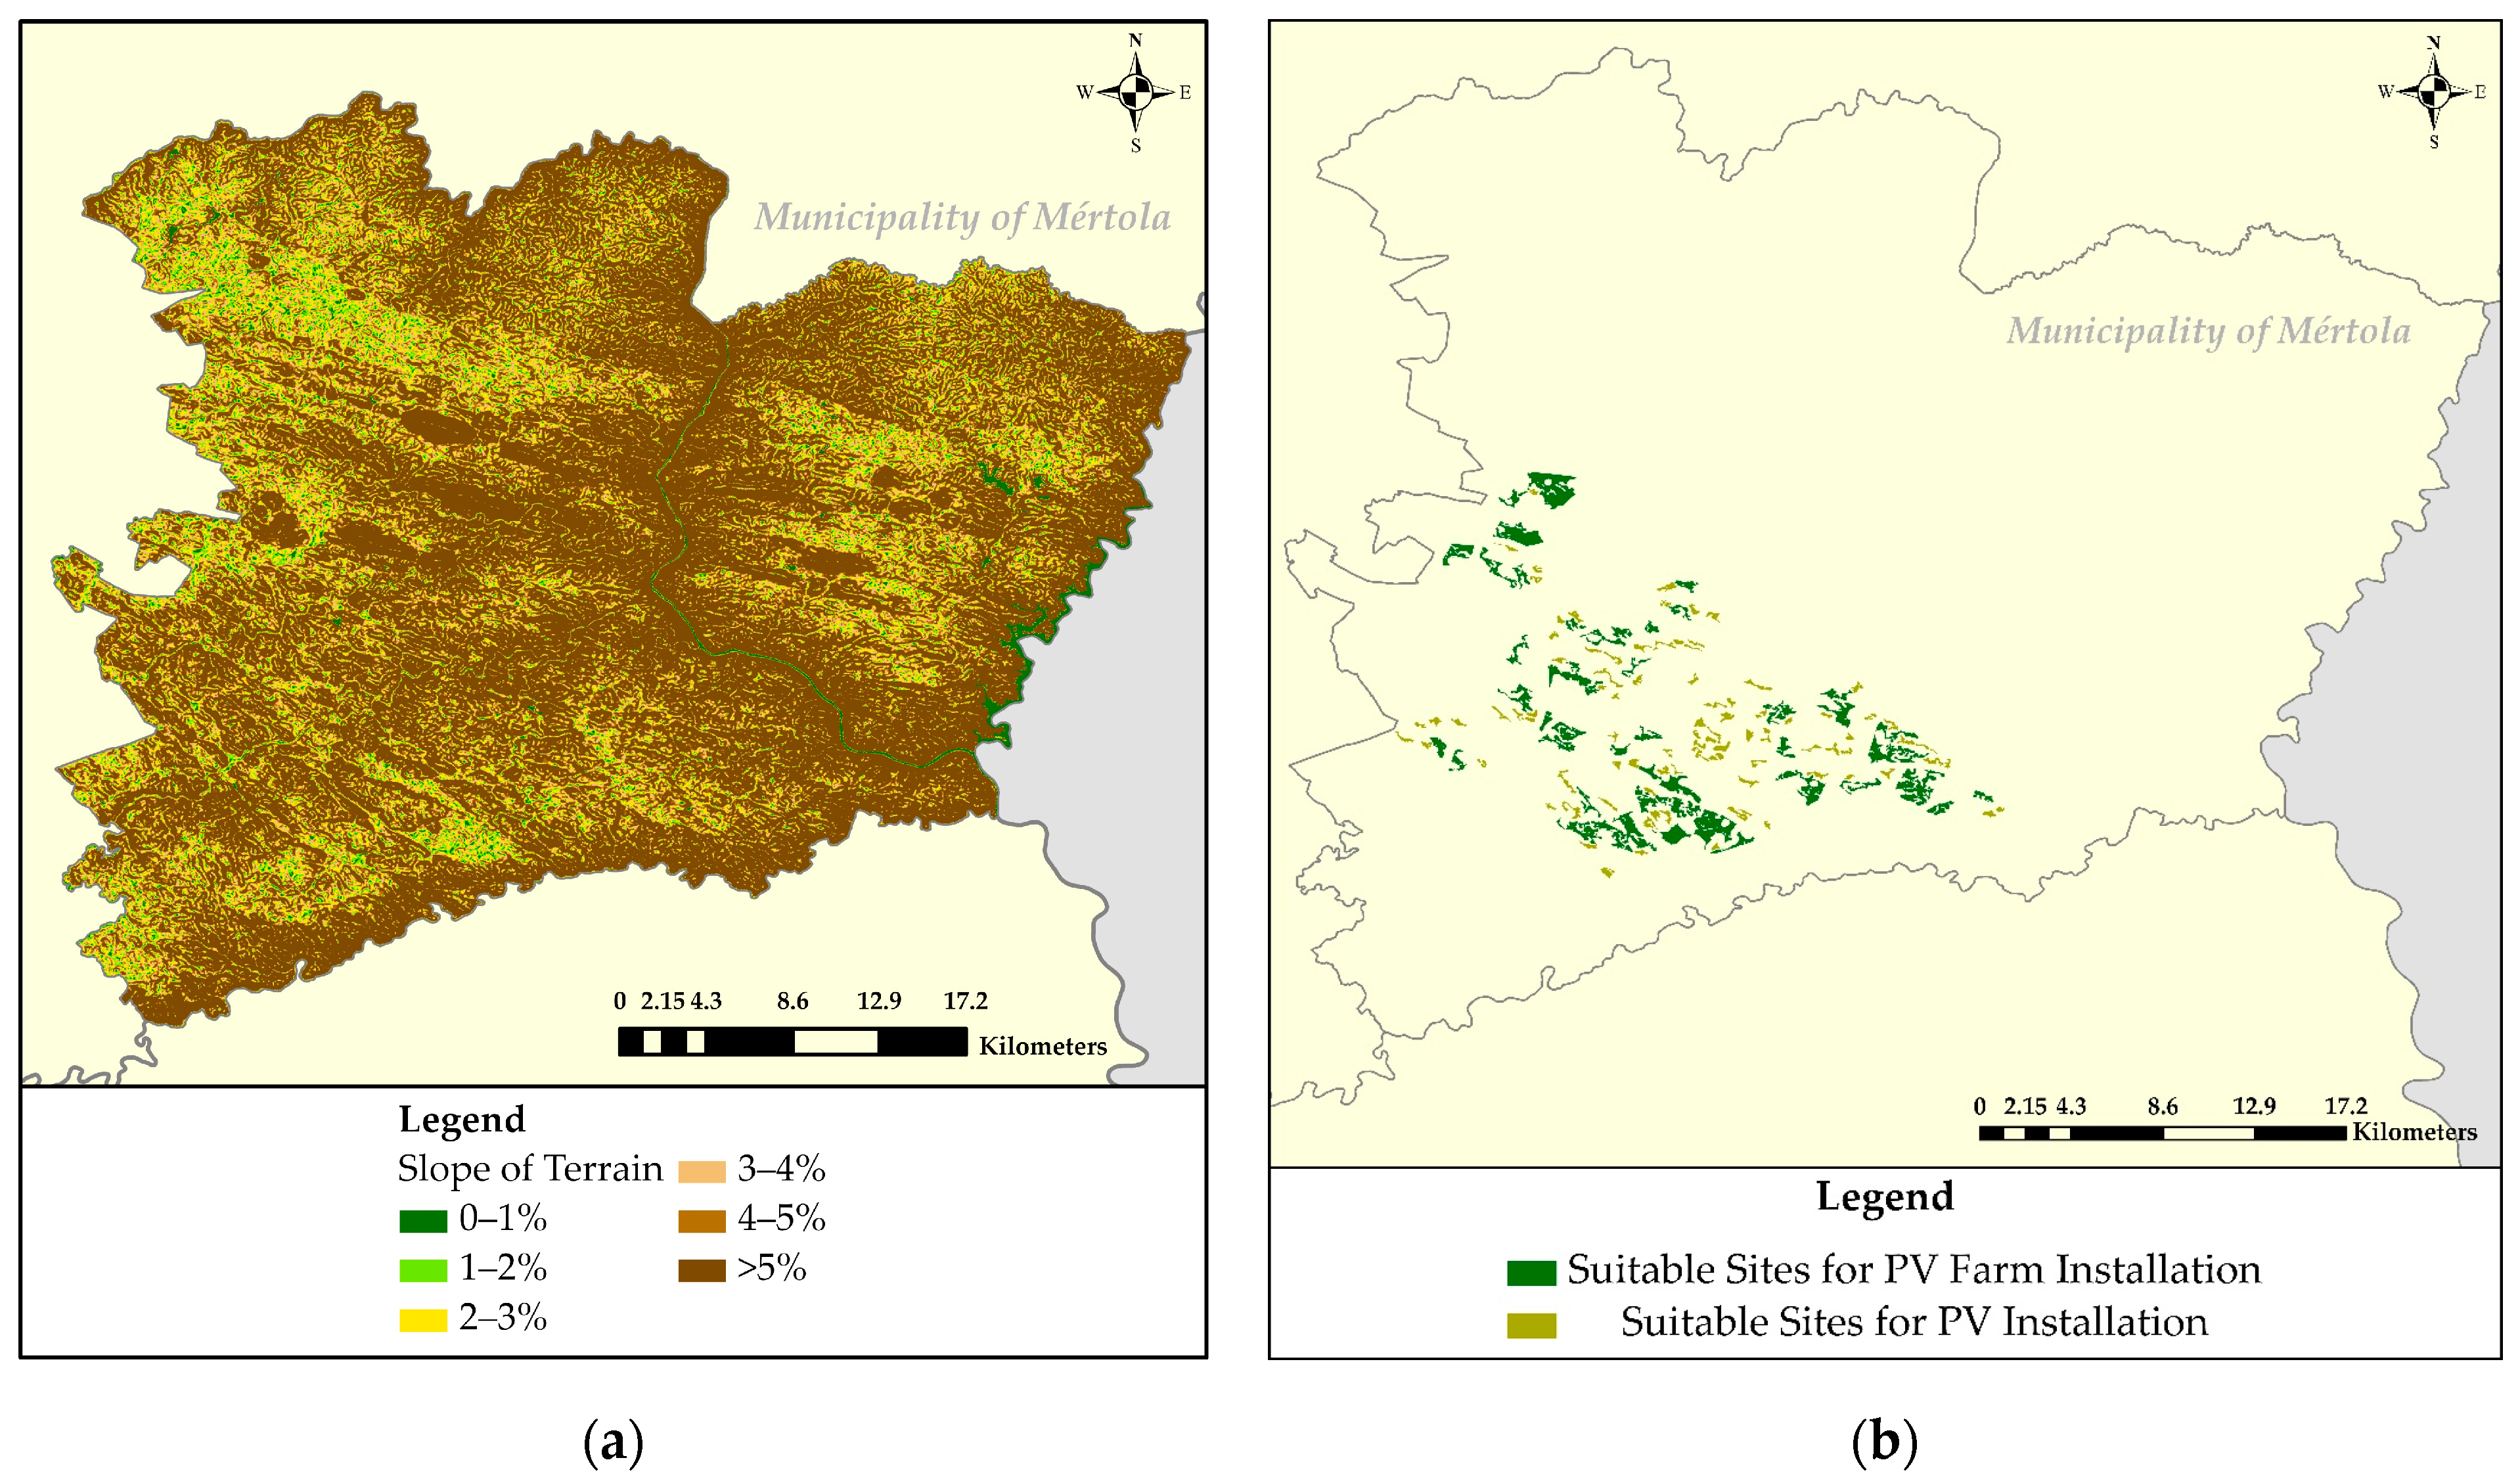
5.3. Identification of Suitable Sites for PV Installation in the Municipality of Mértola

In the Municipality of Mértola, 137 sites for PV installation were identified by synthesizing the thematic data layers related to PVSC.1–PVSC.23 (Table 3). Figure 5a shows the thematic map of PVSC.9 (slope of terrain). Sites with an area of less than 0.15 km2 were considered too small for PV farm installation by applying PVSC.24 in GIS and were further excluded from the analysis. Thus, a total of 44 sites with a total surface area of 20.5493 km2 were ultimately identified as eligible for the potential siting of PV farms. Figure 5b presents all the suitable sites for PV (PVSC.1–PVSC.23) and PV farm (PVSC.1–PVSC.24) installations in the Municipality of Mértola.

5.4. PV Site-Suitability Analysis and Assessment Results

The results from the two different MCDM methods for the estimation of the weights of the PVAC are presented in Figure 6. Based on the ENTROPY results, the most important PVAC are the distance from the road network (PVAC.10), the distance from protected areas (PVAC.5) and the availability of suitable land (PVAC.1), whereas the least important PVAC are the PVOUT (PVAC.3), the distance from aviation areas (PVAC.15), the distance from areas of landscape value (PVAC.8) and the slope of terrain (PVAC.11). Based on the AHP results (Figure 6), the most important PVAC were the distance from protected areas (PVAC.5), the distance from areas of landscape value (PVAC.8), the distance from electricity grid (PVAC.12) and existing land use (PVAC.2), whereas the least important PVAC were the availability of suitable land (PVAC.1) and the average air temperature (PVAC.14). As a result, different weights were derived from the application of the two methods, as in the case of the ENTROPY methods, the weights were estimated based on the characteristics of the eligible sites according to the examined AC, whereas in the case of the AHP, the weights were estimated according to the authors’ preferences and knowledge. Hence, the ENTROPY method is the least subjective method by definition, whereas the AHP can satisfy the requirements in a consistent manner. In the case of equal weights, all PVAC were set to be of equal importance in order to investigate the final PV site suitability results without the influence of PVAC weights.
Table 6 presents the results from the three different hybrid MCDM approaches performed in Phase 4; the SI values were classified into four classes: low suitability (0.001–0.399), moderate suitability (0.400–0.599), high suitability (0.600–0.899) and excellent suitability (0.900–1.000). The SI results reveal the precise suitability of the potential sites for PV farm installation, and their spatial allocation according to the resulting SI is presented on the final suitability maps (Figure 7 and Figure 8).
The results of the site suitability analyses (Table 6) demonstrate that the highest suitability of the potential sites is obtained by applying the ENTROPY method for the estimation of the weights (89.62% of the potential land is characterized as high or excellent suitability). The lowest suitability of the eligible sites is obtained by applying the AHP method combined with TOPSIS (only 15.96% of the potential land is characterized as high suitability, whereas 16.34% is characterized as low suitability).
Among all examined sites, PVSite.8 and PVSite.19 (southwest of Mértola) have either excellent or high suitability, regardless the weights of the PVAC (i.e., in all possible applications) (Figure 7 and Figure 8), and PVSite.1 (southwest of Mértola), PVSite.2 (west of Mértola), PVSite.3 (southwest of Mértola) and PVSite.7 (west of Mértola) have high suitability based on the application of ENTROPY or of equal weights with TOPSIS (Figure 7a and Figure 8, respectively). These sites have high or excellent suitability because their examined characteristics make them suitable for PV siting (Table 7 and Table 8). The precise locations of these highly suitable sites for PV farm installation are highlighted in Figure 7 and Figure 8. Table 7 and Table 8 show the characteristics of the aforementioned sites of high or excellent suitability according to the selected benefit and cost PVAC, respectively. Lastly, PVSite.11 (south–central of Mértola) has low suitability, regardless the weights of the PVAC (Figure 7 and Figure 8), and PVSite.14, PVSite.15 and PVSite.31 (southwest of Mértola) have low suitability based on the application of ENTROPY or of equal weights with TOPSIS (Figure 7a and Figure 8).

6. Conclusions

In the present paper, a decision-support framework is introduced to (a) classify and prioritize the municipalities of a country based on their suitability to host PV energy projects and (b) pinpoint and evaluate suitable technically and economically viable, as well as environmentally and socially sustainable, sites for PV installation in the most suitable municipalities of a country. The proposed decision-support framework was implemented in Portugal. It consists of four successive phases allocated in two distinctive stages (Stage I: Energy Roadmap for PV Deployment and Stage II: PV Site-Selection Analysis and Assessment). In the first stage, the most and least suitable Portuguese municipalities for PV deployment were identified by analyzing important environmental, technoeconomic, social and cultural PV siting criteria in GIS and applying the TOPSIS method. In the second stage, an integrated PV site-selection analysis and assessment were conducted in the municipality with the highest SI for PV installation in Portugal (Municipality of Mértola). The latter was performed by deploying a proper GIS siting model, employing numerous PVSC and PVAC (in total 39) and applying various MCDM methods, namely AHP, ENTROPY and TOPSIS.
The results illustrate the high suitability of Portugal for PV deployment in numerous municipalities of the country and verify the excellent suitability of the Municipality of Mértola for PV installation. According to the results of the proposed decision-support framework, the municipalities with excellent suitability for PV deployment in Portugal are Mértola, Alcácer do Sal, Idanha-A-Nova, Montemor-O-Novo, Coruche, Évora, Beja, Serpa, Odemira and Bragança, whereas the municipalities with low suitability are Terras de Bouro, Melgaço and Arcos de Valdevez. In the municipality with the highest PV SI (Municipality of Mértola), the highest suitability of the eligible sites was obtained by applying the ENTROPY method combined with TOPSIS, as 89.62% of the potential land was characterized by high or excellent suitability. The lowest suitability of the eligible sites was obtained by applying AHP combined with TOPSIS, as only 15.96% of the potential land was characterized by high suitability, whereas a portion of 16.34% was characterized as low-suitability land. The sites that provide high suitability for PV siting, regardless of the weights of the PVAC, are PVSite.1, PVSite.3, PVSite.8 and PVSite.19 in the southwest of Mértola, as well as PVSite.2 and PVSite.7 in the west of Mértola, whereas the sites that are characterized by low suitability are PVSite.11 in south–central Mértola, as well as PVSite.14, PVSite.15 and PVSite.31 in the southwest of Mértola.
Key concluding remarks of the present investigation can be summarized as follows: (a) The geographic information database developed in the present study can contribute to the accelerated deployment of PV technologies in Portugal; (b) an outstandingly high solar energy potential in the Portuguese mainland was highlighted; (c) numerous municipalities with excellent and high suitability exist in the Portuguese mainland for hosting PV energy projects; (d) the Region of Beja was revealed as one of the most suitable regions for PV installations, as many of its municipalities have excellent suitability for PV deployment; € the excellent suitability of the Municipality of Mértola for PV installations was verified by determining numerous (137) suitable sites for PV projects; and (f) the results and illustrations presented in the present work constitute an overall PV energy roadmap that can contribute to national energy autonomy and the sustainable and accelerated deployment of PV projects in Portugal.
Several issues can affect the final results of a PV site suitability analysis, regardless of the complexity of the evaluation model and the quality of the methodological analysis. The current study is subject to the following limitations: (a) the accuracy of the geographic information data; although we used the latest available geospatial data in the current siting analysis, the spatial accuracy of these data can affect the final results; (b) the choice of different AC and/or AC weights, which may lead to varying site suitability results and change the suitability degree of the identified eligible sites; (c) the use of different MCDM methods for the evaluation of the sites instead of TOPSIS, which could change the final prioritization results of the eligible PV farm sites; and (d) the consideration of the opinion of different local stakeholders (e.g., experts and policymakers) and/or of local citizens in the evaluation of the sites that could affect or even improve the final suitability results of PV farm sites.
The proposed methodological framework includes successive phases and interdependent research tasks and can be applied in any geographic area. It could be also further extended by performing integrated PV site-selection assessments in the remaining municipalities of Portugal with excellent and high suitability for PV projects. Finally, the participation of local citizens of each municipality in PV site-selection analyses could contribute to the identification of the most socially acceptable sites for PV siting in each municipality, enhancing the sustainability of PV deployment in the country.

Author Contributions

Conceptualization, S.S., E.L., D.G.V. and T.B.; methodology, S.S., E.L., D.G.V. and T.B.; software, S.S.; validation, S.S.; formal analysis, S.S.; investigation, S.S.; data curation, S.S.; writing—original draft preparation, S.S.; writing—review and editing, E.L. and D.G.V.; visualization, S.S.; supervision, E.L., D.G.V. and T.B. All authors have read and agreed to the published version of the manuscript.

Funding

This research was funded by the European Union’s Horizon 2020 Research and Innovation Programme under the Marie Skłodowska-Curie grant agreement No. 778039 (Project: “Planning and Engagement Arenas for Renewable Energy Landscapes” (PEARLS)).

Institutional Review Board Statement

Not applicable.

Informed Consent Statement

Not applicable.

Data Availability Statement

Not applicable.

Conflicts of Interest

The authors declare no conflict of interest. The funders had no role in the design of the study; in the collection, analyses or interpretation of data; in the writing of the manuscript; or in the decision to publish the results.

References

  1. REN21. Renewables 2022 Global Status Report; REN21 Secretariat: Paris, France, 2022. [Google Scholar]
  2. Liang, J.; Irfan, M.; Ikram, M.; Zimon, D. Evaluating Natural Resources Volatility in an Emerging Economy: The Influence of Solar Energy Development Barriers. Resour. Policy 2022, 78, 102858. [Google Scholar] [CrossRef]
  3. Statista Portugal: Renewable Energy Capacity 2021. Available online: https://www.statista.com/statistics/864765/total-renewable-capacity-in-portugal/ (accessed on 10 May 2022).
  4. IRENA. Renewable Energy Statistics 2022; The International Renewable Energy Agency: Abu Dhabi, United Arab Emirates, 2022. [Google Scholar]
  5. Sánchez-Lozano, J.M.; García-Cascales, M.S.; Lamata, M.T. Comparative TOPSIS-ELECTRE TRI Methods for Optimal Sites for Photovoltaic Solar Farms. Case Study in Spain. J. Clean. Prod. 2016, 127, 387–398. [Google Scholar] [CrossRef]
  6. Charabi, Y.; Gastli, A. PV Site Suitability Analysis Using GIS-Based Spatial Fuzzy Multi-Criteria Evaluation. Renew. Energy 2011, 36, 2554–2561. [Google Scholar] [CrossRef]
  7. Merrouni, A.A.; Elalaoui, F.E.; Mezrhab, A.; Mezrhab, A.; Ghennioui, A. Large Scale PV Sites Selection by Combining GIS and Analytical Hierarchy Process. Case Study: Eastern Morocco. Renew. Energy 2018, 119, 863–873. [Google Scholar] [CrossRef]
  8. Noorollahi, E.; Fadai, D.; Shirazi, M.A.; Ghodsipour, S.H. Land Suitability Analysis for Solar Farms Exploitation Using GIS and Fuzzy Analytic Hierarchy Process (FAHP)—A Case Study of Iran. Energies 2016, 9, 643. [Google Scholar] [CrossRef] [Green Version]
  9. Al-Shammari, S.; Ko, W.; Al Ammar, E.A.; Alotaibi, M.A.; Choi, H.-J. Optimal Decision-Making in Photovoltaic System Selection in Saudi Arabia. Energies 2021, 14, 357. [Google Scholar] [CrossRef]
  10. Spyridonidou, S.; Sismani, G.; Loukogeorgaki, E.; Vagiona, D.G.; Ulanovsky, H.; Madar, D. Sustainable Spatial Energy Planning of Large-Scale Wind and PV Farms in Israel: A Collaborative and Participatory Planning Approach. Energies 2021, 14, 551. [Google Scholar] [CrossRef]
  11. Fang, H.; Li, J.; Song, W. Sustainable Site Selection for Photovoltaic Power Plant: An Integrated Approach Based on Prospect Theory. Energy Convers. Manag. 2018, 174, 755–768. [Google Scholar] [CrossRef]
  12. Liu, J.; Xu, F.; Lin, S. Site Selection of Photovoltaic Power Plants in a Value Chain Based on Grey Cumulative Prospect Theory for Sustainability: A Case Study in Northwest China. J. Clean. Prod. 2017, 148, 386–397. [Google Scholar] [CrossRef]
  13. Sánchez-Lozano, J.M.; Antunes, C.H.; García-Cascales, M.S.; Dias, L.C. GIS-Based Photovoltaic Solar Farms Site Selection Using ELECTRE-TRI: Evaluating the Case for Torre Pacheco, Murcia, Southeast of Spain. Renew. Energy 2014, 66, 478–494. [Google Scholar] [CrossRef]
  14. Majumdar, D.; Pasqualetti, M.J. Analysis of Land Availability for Utility-Scale Power Plants and Assessment of Solar Photovoltaic Development in the State of Arizona, USA. Renew. Energy 2019, 134, 1213–1231. [Google Scholar] [CrossRef]
  15. Aghbashlo, M.; Tabatabaei, M.; Rahnama, E.; Rosen, M.A. A New Systematic Decision Support Framework Based on Solar Extended Exergy Accounting Performance to Prioritize Photovoltaic Sites. J. Clean. Prod. 2020, 256, 120356. [Google Scholar] [CrossRef]
  16. Al Garni, H.Z.; Awasthi, A. Solar PV Power Plant Site Selection Using a GIS-AHP Based Approach with Application in Saudi Arabia. Appl. Energy 2017, 206, 1225–1240. [Google Scholar] [CrossRef]
  17. Awan, A.B.; Zubair, M.; P., P.R.; Abokhalil, A.G. Solar Energy Resource Analysis and Evaluation of Photovoltaic System Performance in Various Regions of Saudi Arabia. Sustainability 2018, 10, 1129. [Google Scholar] [CrossRef] [Green Version]
  18. Arán Carrión, J.; Espín Estrella, A.; Aznar Dols, F.; Zamorano Toro, M.; Rodríguez, M.; Ramos Ridao, A. Environmental Decision-Support Systems for Evaluating the Carrying Capacity of Land Areas: Optimal Site Selection for Grid-Connected Photovoltaic Power Plants. Renew. Sustain. Energy Rev. 2008, 12, 2358–2380. [Google Scholar] [CrossRef]
  19. Charabi, Y.; Gastli, A. Integration of Temperature and Dust Effects in Siting Large PV Power Plant in Hot Arid Area. Renew. Energy 2013, 57, 635–644. [Google Scholar] [CrossRef]
  20. Dias, L.; Gouveia, J.P.; Lourenço, P.; Seixas, J. Interplay between the Potential of Photovoltaic Systems and Agricultural Land Use. Land Use Policy 2019, 81, 725–735. [Google Scholar] [CrossRef]
  21. Doljak, D.; Stanojevic, G. Evaluation of Natural Conditions for Site Selection of Ground-Mounted Photovoltaic Power Plants in Serbia. Energy 2017, 127, 291–300. [Google Scholar] [CrossRef] [Green Version]
  22. Fernandez-Jimenez, L.A.; Mendoza-Villena, M.; Zorzano-Santamaria, P.; Garcia-Garrido, E.; Lara-Santillan, P.; Zorzano-Alba, E.; Falces, A. Site Selection for New PV Power Plants Based on Their Observability. Renew. Energy 2015, 78, 7–15. [Google Scholar] [CrossRef]
  23. Gunderson, I.; Goyette, S.; Gago-Silva, A.; Quiquerez, L.; Lehmann, A. Climate and Land-Use Change Impacts on Potential Solar Photovoltaic Power Generation in the Black Sea Region. Environ. Sci. Policy 2015, 46, 70–81. [Google Scholar] [CrossRef]
  24. Ozdemir, S.; Sahin, G. Multi-Criteria Decision-Making in the Location Selection for a Solar PV Power Plant Using AHP. Measurement 2018, 129, 218–226. [Google Scholar] [CrossRef]
  25. Lee, A.H.I.; Kang, H.-Y.; Lin, C.-Y.; Shen, K.-C. An Integrated Decision-Making Model for the Location of a PV Solar Plant. Sustainability 2015, 7, 13522–13541. [Google Scholar] [CrossRef] [Green Version]
  26. Kereush, D.; Perovych, I. Determining Criteria for Optimal Site Selection for Solar Power Plants. Geomat. Landmanagement Landsc. 2017, 4, 39–54. [Google Scholar] [CrossRef]
  27. Haurant, P.; Oberti, P.; Muselli, M. Multicriteria Selection Aiding Related to Photovoltaic Plants on Farming Fields on Corsica Island: A Real Case Study Using the ELECTRE Outranking Framework. Energ. Policy 2011, 39, 676–688. [Google Scholar] [CrossRef]
  28. Habib, S.M.; Emam Suliman, A.E.-R.; Al Nahry, A.H.; El Rahman, E.N.A. Spatial Modeling for the Optimum Site Selection of Solar Photovoltaics Power Plant in the Northwest Coast of Egypt. Remote Sens. Appl. Soc. Environ. 2020, 18, 100313. [Google Scholar] [CrossRef]
  29. Global Solar Atlas 2.0: Company Solargis s.r.o. on Behalf of the World Bank Group, with Funding Provided by the Energy Sector Management Assistance Program (ESMAP). Available online: https://globalsolaratlas.info/download?c=25.482951,-3.691406,4 (accessed on 9 April 2022).
  30. UNEP-WCMC Protected Area Profile for Portugal from the World Database on Protected Areas. Available online: https://www.protectedplanet.net/country/PRT (accessed on 10 May 2022).
  31. OSM: Geofabrik Download Server—Portugal. Available online: https://download.geofabrik.de/europe/portugal.html (accessed on 9 April 2022).
  32. Copernicus Land Monitoring Service: CLC 2018. Available online: https://land.copernicus.eu/pan-european/corine-land-cover/clc2018 (accessed on 10 April 2022).
  33. EMODnet Human Activities. Available online: https://www.emodnet-humanactivities.eu/view-data.php (accessed on 10 April 2022).
  34. Municipalities of Portugal. Available online: https://data.europa.eu/data/datasets/5be9d5ac76892f1f0bf6087c?locale=en (accessed on 10 May 2022).
  35. Sabo, M.L.; Mariun, N.; Hizam, H.; Mohd Radzi, M.A.; Zakaria, A. Spatial Energy Predictions from Large Scale Photovoltaic Power Plants Located in Optimal Sites and Connected to a Smart Grid in Peninsular Malaysia. Renew. Sustain. Energy Rev. 2016, 66, 76–94. [Google Scholar] [CrossRef]
  36. NREL: Solar Resource Maps and Data. Available online: https://www.nrel.gov/gis/solar-resource-maps.html (accessed on 28 March 2022).
  37. Hwang, C.-L.; Lai, Y.-J.; Liu, T.-Y. A New Approach for Multiple Objective Decision Making. Comput. Oper. Res. 1993, 20, 889–899. [Google Scholar] [CrossRef]
  38. Hwang, C.L.; Yoon, K. Multiple Attribute Decision Making: Methods and Applications; Springer: New York, NY, USA, 1981. [Google Scholar]
  39. Merrouni, A.A.; Mezrhab, A.; Mezrhab, A. PV Sites Suitability Analysis in the Eastern Region of Morocco. Sustain. Energy Technol. Assess. 2016, 18, 6–15. [Google Scholar] [CrossRef]
  40. Sánchez-Lozano, J.M.; Teruel-Solano, J.; Soto-Elvira, P.L.; García-Cascales, M.S. Geographical Information Systems (GIS) and Multi-Criteria Decision Making (MCDM) Methods for the Evaluation of Solar Farms Locations: Case Study in South-Eastern Spain. Renew. Sustain. Energy Rev. 2013, 24, 544–556. [Google Scholar] [CrossRef]
  41. Ali, S.; Taweekun, J.; Techato, K.; Waewsak, J.; Gyawali, S. GIS Based Site Suitability Assessment for Wind and Solar Farms in Songkhla, Thailand. Renew. Energy 2019, 132, 1360–1372. [Google Scholar] [CrossRef]
  42. Georgiou, A.; Skarlatos, D. Optimal Site Selection for Sitting a Solar Park Using Multi-Criteria Decision Analysis and Geographical Information Systems. Geosci. Instrum. Meth. 2016, 5, 321–332. [Google Scholar] [CrossRef] [Green Version]
  43. Huld, T.; Amillo, A.M.G. Estimating PV Module Performance over Large Geographical Regions: The Role of Irradiance, Air Temperature, Wind Speed and Solar Spectrum. Energies 2015, 8, 5159–5181. [Google Scholar] [CrossRef] [Green Version]
  44. Yelmen, B.; Çakir, M.T. Influence of Temperature Changes in Various Regions of Turkey on Powers of Photovoltaic Solar Panels. Energy Source Part A 2016, 38, 542–550. [Google Scholar] [CrossRef]
  45. Doorga, J.R.S.; Rughooputh, S.D.D.V.; Boojhawon, R. Multi-Criteria GIS-Based Modelling Technique for Identifying Potential Solar Farm Sites: A Case Study in Mauritius. Renew. Energy 2019, 133, 1201–1219. [Google Scholar] [CrossRef]
  46. Mensour, O.N.; Ghazzani, B.E.; Hlimi, B.; Ihlal, A. A Geographical Information System-Based Multi-Criteria Method for the Evaluation of Solar Farms Locations: A Case Study in Souss-Massa Area, Southern Morocco. Energy 2019, 182, 900–919. [Google Scholar] [CrossRef]
  47. Shiraishi, K.; Shirley, R.G.; Kammen, D.M. Geospatial Multi-Criteria Analysis for Identifying High Priority Clean Energy Investment Opportunities: A Case Study on Land-Use Conflict in Bangladesh. Appl. Energy 2019, 235, 1457–1467. [Google Scholar] [CrossRef]
  48. Hafeznia, H.; Yousefi, H.; Astaraei, F.R. A Novel Framework for the Potential Assessment of Utility-Scale Photovoltaic Solar Energy, Application to Eastern Iran. Energ. Convers. Manag. 2017, 151, 240–258. [Google Scholar] [CrossRef]
  49. Sultan, H.M.; Kuznetsov, O.N.; Diab, A.A.Z. Site Selection of Large-Scale Grid-Connected Solar PV System in Egypt. In Proceedings of the 2018 IEEE Conference of Russian Young Researchers in Electrical and Electronic Engineering (EIConRus), Moscow and St. Petersburg, Russia, 29 January–1 February 2018. [Google Scholar]
  50. Watson, J.J.W.; Hudson, M.D. Regional Scale Wind Farm and Solar Farm Suitability Assessment Using GIS-Assisted Multi-Criteria Evaluation. Landsc. Urban Plan. 2015, 138, 20–31. [Google Scholar] [CrossRef]
  51. Asakereh, A.; Soleymani, M.; Sheikhdavoodi, M.J. A GIS-Based Fuzzy-AHP Method for the Evaluation of Solar Farms Locations: Case Study in Khuzestan Province, Iran. Sol. Energy 2017, 155, 342–353. [Google Scholar] [CrossRef]
  52. Sociedade Portuguesa para o Estudo das Aves (SPEA): Programa IBAs. Available online: http://ibas-terrestres.spea.pt/pt/documentos-download/ (accessed on 9 May 2022).
  53. Copernicus Land Monitoring Service: EU-DEM v1.1. Available online: https://land.copernicus.eu/imagery-in-situ/eu-dem/eu-dem-v1.1 (accessed on 10 April 2022).
  54. Esri OpenStreetMap Vector Basemap. Available online: https://www.arcgis.com/home/item.html?id=fae788aa91e54244b161b59725dcbb2a (accessed on 9 May 2022).
  55. E2p—Endogenous Energies of Portugal. Available online: http://e2p.inegi.up.pt/?Lang=EN (accessed on 9 May 2022).
  56. Saaty, T.L. The Analytic Hierarchy Process; McGraw-Hill: New York, NY, USA, 1980. [Google Scholar]
  57. Saaty, T.L. Axiomatic Foundation of the Analytic Hierarchy Process. Manag. Sci. 1986, 32, 841–855. [Google Scholar] [CrossRef]
  58. Saaty, R.W. The analytic hierarchy process—What it is and how it is used. Math. Model. 1987, 9, 161–176. [Google Scholar] [CrossRef] [Green Version]
  59. Zhu, Y.; Tian, D.; Yan, F. Effectiveness of Entropy Weight Method in Decision-Making. Math. Probl. Eng. 2020, 2020, e3564835. [Google Scholar] [CrossRef]
  60. Azevedo, F. Research for REGI Committee: The Economic, Social and Territorial Situation of the Azores (Portugal); Policy Department for Structural and Cohesion Policies, European Parliament: Strasbourg, France, 2017. [Google Scholar]
  61. Assembleia Da República. Constituição Da República Portuguesa VII Revisão Constitucional; Assembleia Da República: Lisbon, Portugal, 2005. [Google Scholar]
  62. Região Autónoma da Madeira. Proposta De Orçamento Da Região Autónoma Da Madeira; Região Autónoma da Madeira: Madeira, Portugal, 2018. [Google Scholar]
Figure 1. The proposed decision-support framework for sustainable PV site selection in Portugal.
Energies 15 08515 g001
Figure 2. The form of the linear geoprocessing siting model deployed in GIS for the PV siting analysis.
Energies 15 08515 g002
Figure 3. Thematic maps of (a) PVOUT (PVSC.2) and (b) distance from protected areas (PVSC.3).
Energies 15 08515 g003
Figure 4. Prioritization results of the municipalities of the Portuguese mainland.
Energies 15 08515 g004
Figure 5. (a) Thematic map of slope of terrain (PVSC.9) and (b) suitable sites for PV and PV farm installation in the Municipality of Mértola.
Energies 15 08515 g005
Figure 6. Importance of PVAC based on the two different MCDM methods.
Energies 15 08515 g006
Figure 7. Suitability index (SI) spatial allocation based on the application of (a) ENTROPY with TOPSIS and (b) AHP with TOPSIS.
Energies 15 08515 g007
Figure 8. Suitability index (SI) spatial allocation based on the application of equal weights with TOPSIS.
Energies 15 08515 g008
Table 2. MoMSC, classification of the MoMSC and data sources employed in Phase 2 of the proposed DSF-SS. Note 1: OSM, OpenStreetMap; CLMS, Copernicus Land Monitoring Service; AMA, Agência para a Modernização Administrativa. Note 2: The minimum mapping unit (MMU) of Corine land cover data provided by CLMS is 25 ha.
MoMSC No.NameClassification of MoMSCData Source(s)Spatial
Resolution
Unsuitable Land Areas
MoMSC.1Global horizontal irradiance (GHI)Exclusion of low-GHI zonesGlobal Solar Atlas [29]250 m<4 kWh/m2/day
MoMSC.2Practical PV energy output (PVOUT)Mean of PVOUTGlobal Solar Atlas [29]1 km
MoMSC.3Urban and residential areasLand availabilityOSM, CLMS [31,32]N/A, 20 mALL
MoMSC.4Distance from road networkOSM [31]N/A<150 m
MoMSC.5Distance from railway networkOSM [31]N/A<150 m
MoMSC.6Civil/military aviation areasOSM, CLMS [31,32]N/A, 20 mALL
MoMSC.7Water surfacesOSM, CLMS, EMODnet [31,32,33]N/A, 20 m, N/AALL
MoMSC.8Industrial zones and economic activitiesOSM, CLMS [31,32]N/A, 20 mALL
MoMSC.9Military zonesOSM, EMODnet [31,33]N/AALL
MoMSC.10Port areasOSM, CLMS [31,32]N/A, 20 mALL
MoMSC.11Solitary buildings and any infrastructureOSM [31]N/AALL
MoMSC.12Geographic extent of the municipalityAMA [34]N/A
Table 4. Summary of the PVAC applied in Phase 4 of the proposed framework.
PVAC No.NameEvaluation AspectFunction Type
PVAC.1Land availability (m2)EconomicBenefit
PVAC.2Existing land use (class)Social/economic/environmentalBenefit
PVAC.3PVOUT (kWh/kWp/day)EconomicBenefit
PVAC.4Distance from archaeological, historical and cultural heritage sites (m)Social/culturalBenefit
PVAC.5Distance from protected areas (m)EnvironmentalBenefit
PVAC.6Distance from religious sites (m)Social/culturalBenefit
PVAC.7Distance from agricultural land and croplands (m)Social/economicBenefit
PVAC.8Distance from areas of landscape value (m)Social/environmentalBenefit
PVAC.9Distance from urban and residential areas (m)Social/culturalBenefit
PVAC.10Distance from the road network (m)Technical/economicCost
PVAC.11Slope of terrain (%)Technical/economicCost
PVAC.12Distance from the electricity grid (m)Technical/economicCost
PVAC.13Water availability (m)Technical/economicCost
PVAC.14Average air temperature (°C)Technical/economicCost
PVAC.15Distance from civil/military aviation areas (m)Political/technical/socialBenefit
Table 5. The most and least suitable municipalities for PV deployment in the Portuguese mainland according to their SI.
Suitability ClassMunicipality NameRegion NamePreference
Order
Suitability Index
Excellent SuitabilityMértolaBeja10.996
Alcácer do SalSetúbal20.990
Idanha-A-NovaCastelo Branco30.989
Montemor-O-NovoÉvora40.969
CorucheSantarém50.962
ÉvoraÉvora60.960
BejaBeja70.938
SerpaBeja80.935
OdemiraBeja90.927
BragançaBragança100.926
High SuitabilityAroucaAveiro2690.741
LousãCoimbra2700.740
ValençaViana do Castelo2710.737
Vieira do MinhoBraga2720.732
Mondim de BastoVila Real2730.716
MonçãoViana do Castelo2740.668
Ponte da BarcaViana do Castelo2750.642
Low SuitabilityTerras de BouroBraga2760.376
MelgaçoViana do Castelo2770.281
Arcos de ValdevezViana do Castelo2780.066
Table 6. The final PV site suitability results based on each hybrid MCDM approach.
Hybrid MCDM ApplicationSuitability ClassNumber of SitesSuitability Degree
ENTROPY AND TOPSISExcellent Suitability213.13%
High Suitability3676.49%
Moderate Suitability22.41%
Low Suitability47.97%
AHP and TOPSISExcellent Suitability00.00%
High Suitability1015.96%
Moderate Suitability2567.7%
Low Suitability916.34%
Equal weights approach and TOPSISExcellent Suitability00.00%
High Suitability633.22%
Moderate Suitability2751.03%
Low Suitability1115.75%
Table 7. The characteristics of the proposed highly suitable sites for PV farm installation according to the benefit PVAC. Note: SV, sclerophyllous vegetation, SV; TWS, transitional woodland shrub; NG, natural grasslands; NIAL, non-irrigated arable land.
PV Suitable SiteLand Availability (m2) Existing Land Use (Land Class)PVOUT (kWh/kWp/day)Distance from
Archaeological,
Historical and
Cultural Heritage Sites (m)
Distance from Protected
Areas (m)
Distance from Religious Sites (m)Distance from Agricultural Land and Croplands (m)Distance from Areas of Landscape Value (m)Distance from Urban and Residential Areas (m)
PVSite.11,873,161SV, TWS4.5–4.82579301160205053847,5004250
PVSite.21,639,859NIAL, TWS4.5–4.82514,250500565099747,5002615
PVSite.31,315,962NG, NIAL, TWS4.5–4.82553801000416077347,5006070
PVSite.7835,495NIAL, TWS4.5–4.82513,5202500347053047,5004635
PVSite.8824,534NIAL, TWS4.5–4.82573003480427053747,5007680
PVSite.19337,425NIAL, TWS4.5–4.82512,5405670252073047,5008295
Table 8. The characteristics of the proposed highly suitable sites for PV farm installation according to the cost PVAC.
PV Suitable SiteDistance from Road Network (m)Slope of Terrain (%)Distance from Electricity Grid (m)Water Availability (m)Average Air Temperature (°C)
PVSite.11503.636950118116.5
PVSite.21803.3423,970100016.5
PVSite.31503.2011,550100016.5
PVSite.71503.4213,450114016.5
PVSite.81503.2211,075100016.5
PVSite.191503.619590100016.5
Publisher’s Note: MDPI stays neutral with regard to jurisdictional claims in published maps and institutional affiliations.

