1. Introduction
The transportation industry, acknowledged as a pillar industry of the national economy, plays an important role in regional development. Moreover, this industry drives economic development. However, the rapid expansion of the transportation industry has increased the demand for and consumption of fossil fuels such as gasoline and kerosene [
1]. As one of the industries with a high energy consumption level, the transportation industry could cause an increase in regional carbon dioxide emissions and even serious environmental pollution problems [
2].
In 2020, China formally proposed at the 75th United Nations General Assembly to achieve a carbon peak by 2030 and carbon neutrality by 2060, which is known as the “double carbon target”. The carbon peak refers to the peak of carbon emissions before 2030 and then gradually falls back. Carbon neutrality refers to enterprises, organizations, or individuals offsetting the total amount of greenhouse gas emissions directly or indirectly produced within a certain period via plant afforestation, energy conservation, and emission reduction efforts to achieve zero CO
2 emissions [
3]. This objective has forced transportation managers to more closely consider carbon reduction. In recent years, the Chinese government has committed to implementing various measures to alleviate the problem of excessive carbon emissions of the transportation industry.
The carbon emissions of the transportation industry are affected by many factors, such as the level of economic development, the level of human input, and the level of energy input. Therefore, many factors need to be considered when studying the carbon emission efficiency of the transportation industry. The TFP is the carbon emission efficiency value calculated under comprehensive consideration of multiple input factors, that is, the ratio of actual carbon emission efficiency to better carbon emission efficiency, which can measure whether carbon emissions reach the optimal state to understand the current carbon emissions status of the industry. Moreover, carbon emission efficiency of the transportation industry varies greatly among different regions due to the large economic differences among the various regions in China and the unbalanced development of transportation infrastructure. The improvement in TFP of the transportation industry plays an important role in the realization of the dual carbon goal, so it is necessary to study the total factor carbon emission efficiency of the transportation industry in all provinces of China. By elucidating the current emission efficiency of the transportation industry, clarifying regional differences, and identifying influencing factors in China, local governments can introduce targeted policies to help achieve the goal of carbon neutrality.
Recently, the carbon emission efficiency of the transportation industry has attracted extensive attention among scholars, but few scholars have comprehensively analyzed the total factor carbon emission efficiency. For example, Wang and Guo [
4] used the superefficiency SBM model to study the carbon emission efficiency of the public transport sector in Beijing, thereby selecting the number of employees, capital investment, and operating vehicles as input indicators; the passenger volume as the expected output; and transportation carbon emissions as the unexpected output. Lu et al. [
5] adopted cargo turnover, passenger turnover, and carbon dioxide emissions as outputs to analyze the environmental efficiency of the transportation industry in eastern China. Yu et al. [
6] also used cargo turnover, passenger turnover, and carbon dioxide emissions as outputs to study the carbon emission efficiency of the railway transportation industry in China.
China’s transportation industry is large in size, resource consumption is growing rapidly, and the industry is significantly affected by policies. For example, China’s low-carbon policies and subsidies for new energy vehicles have promoted the transportation industry to reduce fossil energy consumption and transform and upgrade toward the low-carbon green goal. It is precisely because of the comprehensive effect of internal and external factors that the energy structure of the transportation industry is constantly changing and adjusting, which makes carbon emission efficiency research more complex.
At present, scholars’ analysis of carbon emission efficiency is mainly divided into two categories. One is static analysis, that is, using the SBM-DEA model. This method can obtain the annual TFP value of the transportation industry, obtain the change trend, and analyze from the time dimension. The other is dynamic analysis, that is, measuring the GML index. This method can obtain the change rate of carbon emission efficiency and further obtain the factors affecting carbon emission efficiency through index decomposition to further study the internal causes of carbon emission efficiency change. Thus, by combining the two methods, we can obtain a more accurate and comprehensive analysis of carbon emission efficiency.
To accurately calculate the carbon emission efficiency of the transportation industry in China, this paper used the superefficiency slack-based model-data envelopment analysis (SBM-DEA) method and global Malmquist—Luenberger (GML) index to statically and dynamically analyze, respectively, the TFP of the Chinese transportation industry at the provincial level. As such, we divided China into four regions for comparative analysis to investigate the efficiency heterogeneity and underlying causes in different regions of China. At the same time, the technical efficiency change index (GECH) could be further decomposed into pure technical efficiency (GPECH) and scale efficiency change index (GSECH) for specific analysis to help policy makers formulate suitable management policies targeting the transportation industry.
The paper is organized as follows:
Section 2 provides a literature review.
Section 3 introduces the model and data sources used.
Section 4 analyzes the total factor carbon emission efficiency of the transportation industry in China from both static and dynamic perspectives.
Section 5 studies the influencing factors of the TFP of the transportation sector.
Section 6 provides conclusions and findings, in addition to suggestions.
2. Literature Review
The DEA model, which considers economic, technical, and other factors, has been widely used to analyze TFP and green energy efficiency [
7,
8] in specific areas, such as the manufacturing industry [
9], agricultural industry [
10,
11], and tourism industry [
12,
13] Based on the DEA model, the SBM-DEA model has been widely used in efficiency research with slack variables, and it has been verified that this model can achieve a higher calculation accuracy and smaller errors than those obtained with the traditional DEA model [
14].
The traditional DEA model has some deficiencies in measuring carbon emission efficiency. One is that it is impossible to solve the problem of ranking when multiple DMUs are valid at the same time. Second, the relaxation of multiple inputs and outputs has not been fully considered. The superefficient SBM-DEA model can solve these problems and accurately measure the total factor carbon emission efficiency. Therefore, the SBM-DEA model with undesirable outputs has been used by many scholars to study carbon emission efficiency. Yuan et al. [
15] added environmental variables and employed the SBM-DEA model to analyze the carbon emission efficiency of the transportation industry in China.
Considering that the highest efficiency value of different decision-making units (DMUs) reaches 1, the traditional DEA model cannot compare different DMUs with the same efficiency values, so the superefficiency DEA model has been applied because the efficiency value of each DMU in this model differs. Additionally, the superefficiency DEA model has been combined with the SBM model, referred to as the superefficiency SBM-DEA model. Sun et al. [
16] utilized the superefficiency SBM-DEA model to evaluate the carbon efficiency in Shandong Province. Considering that the actual input index of the transportation industry changes according to different proportions, the nonradial DEA model prevents bias due to radial selection [
17]. Therefore, through the nonradial SBM-DEA model, we could obtain more accurate TFP values, reflecting the static changes in the transportation industry.
Compared with the ML index, the
GML index not only contains the observations in all periods but also solves the problems of the ML index that cannot be accumulated by bad cycles and is not transitive, and there is no feasible solution for linear programming, thus showing a long-term growth trend [
18]. At the same time, the index decomposition of the
GML index can further study the influencing factors of the change in TFP. Therefore, scholars adopt the
GML index to reflect the dynamic changes in TFP. Oh [
19] constructed the
GML index based on the traditional Malmquist—Luenberger index. Adopting the total set of production technologies during all research periods as the reference set, he constructed a single production frontier that could be used to measure the gap between the technical efficiency and the frontier during each period for each DMU.
Moreover, in dynamic analysis, the
GML index is usually decomposed into several factors. Zhang and Wei [
20] decomposed the meta frontier nonradial Malmquist—Luenberger carbon emission performance index into efficiency, best-practice gap, and meta technology gap changes to analyze the dynamic changes in the TFP of the transportation industry in China. Zhang et al. [
21] combined a nonradial distance DEA model with a bootstrapped nonradial Malmquist carbon emission performance index and further decomposed the Malmquist index into efficiency and technology change components. Li et al. [
22] calculated Malmquist and
GML index values to study the dynamic change in the carbon emission efficiency of the Chinese transportation industry. This paper referred to the research of Zhao and Sun [
23]. The Malmquist index was decomposed into the
GECH, technological change,
GPECH change, and
GSECH change for further analysis.
Considering that the minimum value of the TFP is 0, the data were truncated. If ordinary linear regression were used, the regression results would exhibit bias [
24]. Therefore, scholars have usually selected the Tobit model to explore the influencing factors of TFP. Guo and Boa [
25] combined the unexpected output SBM model with the Tobit model to measure the impact of human capital and industrial structure on carbon emission efficiency in 30 mainland China provinces. This paper also used the Tobit model for empirical analysis.
In previous research on the transportation industry, the SBM-DEA model has been directly employed to calculate the dynamic total factor carbon emission efficiency, but few scholars have considered the static and dynamic changes in carbon emission efficiency. Therefore, the key indicators affecting the TFP of the transportation industry remain unclear, and there are only general policies and very few targeted policies in the different regions of China. Therefore, this paper combined static and dynamic models to illustrate the changes in carbon emission efficiency and investigated the carbon emission efficiency of the transportation industry in the different regions.
5. Empirical Analysis of the Total Factor Carbon Emission Performance of the Transportation Industry
5.1. Model Setting, Variable Definitions, and Descriptive Statistics
Considering that the minimum TFP value is 0, the data were truncated. If an ordinary linear regression were used, the regression results would be biased [
24]. At the same time, in regard to panel data, the estimated value obtained via a random effect Tobit model regression could be more accurate than that obtained via a fixed-effect Tobit model regression [
32]. Therefore, this paper used the random effect Tobit model to further analyze the influencing factors of the transportation industry carbon emission efficiency in the 30 provinces of China from 2003 to 2019.
We selected several factors closely related to the carbon emission performance of the transportation industry, including the population size, economic level, transportation intensity, transportation structure, energy intensity, energy structure, factor endowment, road infrastructure, and opening-up level, based on the literature [
7,
33,
34,
35]. These variables are listed in
Table 4. Data were retrieved from the National Bureau of Statistics and China Energy Statistics Yearbook. The TFP can be obtained with Equation (7):
where
i denotes the province,
t denotes the year,
TE denotes the TFP of the transportation industry,
X denotes the series of independent variables,
denotes the individual unobserved effects, and
is a random interference term.
Table 5 provides the descriptive statistical results for the variables. The minimum value of variable TE was 0.070, and the maximum value was 1.34, indicating that the TFP of the transportation industry in the various regions was inconsistent. The minimum per capita GDP reached 0.37 × 10
4 yuan per person, and the maximum per capita GDP reached 4 × 10
4 yuan per person, indicating that there were still differences in the level of economic development among the various regions. The maximum transportation intensity was attained in Tianjin in 2007, which suggests that the transportation industry is closely related to regional economic development. There was a large difference between the maximum and minimum values of the transportation structure, indicating that the transportation structure differed among the various regions. The minimum value was observed in Beijing in 2016, and the maximum value was obtained in Tianjin in 2007. Moreover, the maximum value of the energy structure was 98%, which indicates that gasoline, kerosene, diesel, and fuel oil are still the main sources of energy consumption in the energy structure of the transportation industry. The minimum and maximum factor endowment values were attained in Jilin Province in 2003 and Yunan Province in 2019, respectively. The factor endowment index comprehensively considers the level of regional economic development and the input of human factors. The change in highway mileage indicated that road infrastructure construction between the various regions was constantly improving.
5.2. Regression Results
Before basic regression, multicollinearity test results were obtained, as summarized in
Appendix C,
Table A9. The variance inflation factor (VIF) values of the variables were all less than 5, indicating that there was no multicollinearity among the variables. The Tobit model was assessed via the likelihood ratio test method, and finally, we obtained a random regression model. The regression results obtained with the random Tobit model are provided in
Table 6, including the national sample and the eastern, central, western, and northeastern areas.
Considering the national total sample, the population size attained a significant positive relationship with the TFP of the transportation industry, which suggests that an increase in the population size could improve the TFP of the transportation industry. Transportation intensity could increase the TFP of the transportation sector by 0.218 units. As a value output form of the transportation industry, the turnover of passengers and goods drives regional economic development. Additionally, the higher the utilization efficiency of highways is, the more conducive this could be to improving the carbon emission efficiency of the transportation industry. The energy intensity and energy structure both had a negative effect on TFP. The larger the scale of the transportation industry is, the more energy it consumes. The road infrastructure indicated that the scale and quantity of roads did not affect the TFP but rather the road utilization level. The opening-up level could increase the carbon emissions of the transportation industry of the host country, thus reducing the carbon emission performance.
The four regional samples of the variables varied. The per capita GDP index was significantly positive in Northeast China, significantly negative in Central China, but not significant in eastern and western China. The economic development level in Northeast China was insufficient. Expansion of the economic scale in the central region could increase energy consumption and reduce the TFP of the transportation industry. The population size was significantly positive in the eastern and central regions, and the population size in the central region was greater than that in the eastern region. The western and northeastern areas were not significant. This indicates that the dividend attributed to the increase in population size in the eastern and central regions could enhance TFP. The transportation intensity was significantly positive only in the eastern region but not in the other regions, indicating that the transportation scale in the eastern region was larger, and that the driving effect on the economy was more obvious.
The transportation structure was significantly positive in the eastern and central regions and significantly negative in the northeastern region. There are many transportation hubs and well-developed transportation networks in the eastern and central regions. The energy intensity index in the four regions was negative, which was only significant in the eastern, western, and northeastern regions. This suggests that the higher the energy consumption, the more unfavorable this was to the TFP. In the eastern and northeastern regions, the energy structure was significantly negative, but it was not significant in the central and western regions. The energy structure in the eastern and northeastern regions was significantly negative, but it was not significant in the central and western regions. The economic development level in the eastern and northeastern regions depends on the transportation industry, which consumes much fossil energy.
The factor endowment demonstrates that the capital and labor structures in the eastern region did not match. The proportions of capital and manpower investments in the central and western regions were matched. The road infrastructure showed that an increase in the highway operation mileage could not improve the TFP. The level of openness to the outside world was significantly positive in the eastern, western, and northeastern regions and significantly negative in the central region, which indicates that the higher the opening-up level in the central region, the more TFP improvement could be facilitated.
6. Conclusions and Suggestions
6.1. Research Conclusions
This paper used the superefficiency SBM model with undesirable outputs to calculate the TFP of the transportation industry in 30 provinces of China from 2003 to 2019. The SBM-DEA model with undesirable outputs and the GML index were used to statically and dynamically analyze the TFP of the transportation industry, respectively. The random Tobit model was used to explore the influencing factors of the TFP of the transportation sector. By analyzing the influencing factors of the TFP of the transportation industry in China as a whole and in these four regions, this paper carefully formulated policy suggestions to improve the TFP of the transportation industry.
First, it was found that the average TFP value in only Hebei and Anhui was greater than 1, and that in the other provinces and regions it was less than 1. The TFP in the central region was higher than that in the eastern region, while the TFP in the western region was the lowest. The average TFP of the entire transportation industry in China and the four regions was less than 1, indicating that the TFP of the overall transportation industry in China was relatively low. However, from a temporal trend perspective, the TFP exhibited an upward trend in recent years, indicating that the TFP of the transportation industry in China was gradually improving.
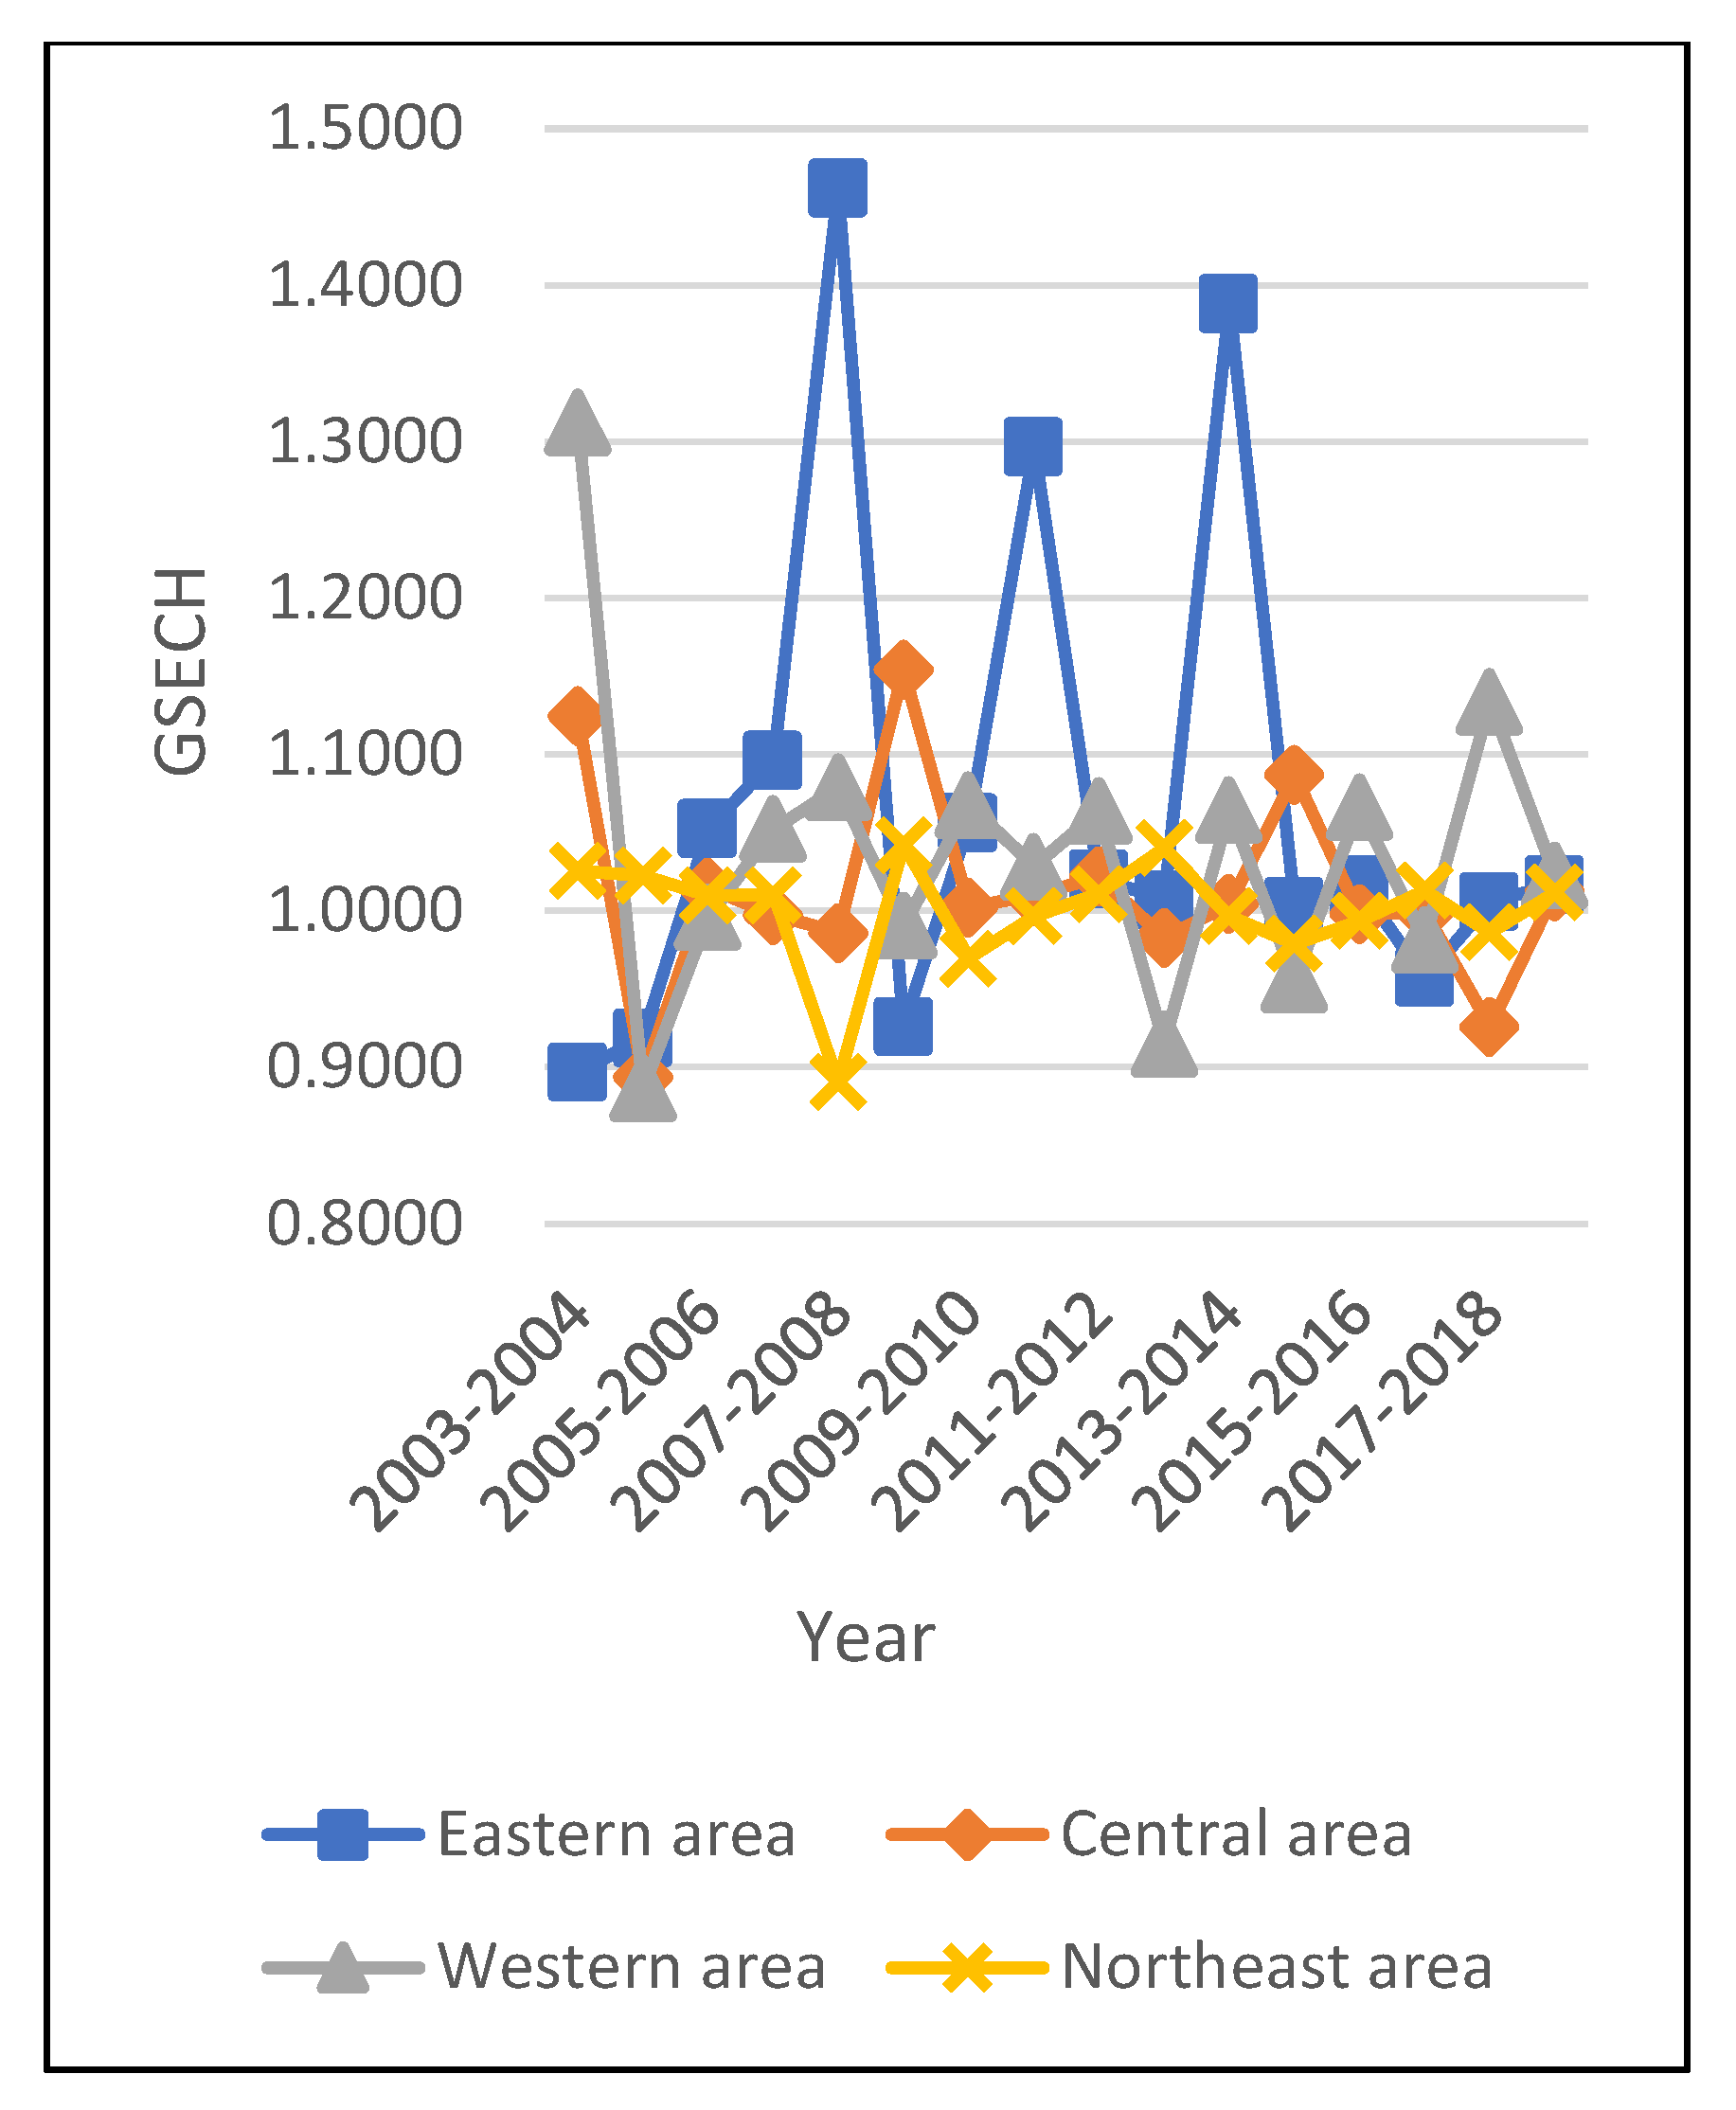
Second, the average GML values for the national and regional samples were less than 1. Only the average GML value in Shanxi, Guangxi, and Yunnan was greater than 1, indicating that the transportation industry in these areas occurred in the optimal state. The GECH value in the central, western, and northeastern regions was greater than 1, while the GTCH value was less than 1. The GECH and GTCH values in the eastern region were greater than 1. This indicates that the change in GECH was the main factor impacting the GML index of the transportation industry. Because of the high economic level and well-developed transportation network in the eastern region, GECH and GTCH reached the optimal state. In addition, the GSECH value of the transportation industry in the eastern region was greater than the GPECH value, while the GPECH value in the central, western, and northeastern regions was higher. Compared to the other three regions, the transportation industry in the eastern region was larger in scale.
Finally, the Tobit model revealed that the influencing factors causing the different carbon emission efficiencies in the four regions varied. The population size, transportation intensity, and transportation structure played a significant role in promoting the TFP for China as a whole and the eastern region. The population size, transportation structure, factor endowment, and level of openness promoted TFP in the central region. In the western region, the factor endowment played a significant role in promoting TFP. In the northeastern region, the economic level played a significant role. In addition, the economic level inhibited TFP in the central region but promoted TFP in the northeastern region. The transportation structure generated an inhibitory effect in the northeastern region and a promotion effect in the eastern region. Factor endowment inhibited the performance in the eastern region and enhanced the performance in the central and western regions. The opening-up level promoted TFP in the central region but inhibited TFP in the other regions.
6.2. Suggestions
Based on the results of this study, this paper formulated the following suggestions:
- (1)
Technical progress in the transportation sector in the various regions should be encouraged to promote TFP improvement. From a transportation industry perspective, the technological level in the transportation sector should be improved. The subsidy policy was introduced to encourage enterprises to increase investment in technological innovation and R&D to form synergy between industrial chains. We will vigorously support the research, development, and use of smart cars and energy-saving cars and introduce low-carbon emission reduction technologies; establish an intelligent transportation system, optimize the transportation layout by taking advantage of the big data Internet of Things, take multiple measures to improve the technical level of the transportation industry, and use technological progress to promote the TFP.
- (2)
The energy structure of the transportation industry should be improved, green transportation options should be developed, and green and low-carbon transformation of the transportation industry should be realized. China should continue to formulate green transportation and green travel policies to optimize the TFP of the transportation industry. Therefore, the government should increase the proportion of low-carbon and energy-saving vehicles in the urban transportation structure and ensure the sustainable development of clean energy vehicles. By improving infrastructure construction, such as charging piles and charging stations, and improving battery life technology, the TFP of the transportation industry can be improved, and the consumption structure of fossil energy in the industry can be optimized. Moreover, schools and families should strengthen the cultivation of environmental protection and energy conservation. There should be increases in the publicity of green and low-carbon travel in the community, and improved citizens’ awareness of low-carbon and environmental protection to gradually realize the green transformation of the transportation structure.
- (3)
Development of the transportation industry in the different regions varies. The differences between regions should be considered, and corresponding measures should be taken according to the level of economic development among regions and the shortcomings of our own traffic structure when formulating relevant policies. The four regions should identify the constraints and formulate measures to overcome these constraints restricting carbon emission performance improvement. The eastern and central regions should adjust the energy structure and reduce the consumption of fossil energy. For example, the use of new energy vehicles in public transport and private travel should be promoted. The western region should promote transportation infrastructure and increase the mileage of operational roads. For example, capital investment should be increased, and road infrastructure construction should be improved to optimize the traffic structure. The northeastern region should improve the opening-up level, expand the scale to improve the transportation structure, adjust the energy structure, lower the energy intensity, and improve the TFP. The opening-up level should be increased and favorable policies formulated to provide financial and technical support for transportation enterprises.


