1. Introduction
Sustainable energy development issues are crucial today for many countries around the world. The significance of such problems as energy security, energy dependence or renewable energy development has become clear not only in political documents, but also in the everyday activity of energy customers. European countries began to face a significant increase in energy prices in the second half of 2021 [
1]. The economy as a whole and the energy sector have not yet recovered from the effects caused by the COVID-19 pandemic, effects which have been proven by many scientific studies. A wide analysis of these effects can be found in review articles such as: [
2,
3,
4,
5,
6], etc. Especially large challenges face European energy consumers in 2022. The economic uncertainty due to the Russia invasion of Ukraine has driven energy prices to unprecedented heights. Although Europe reacted immediately at the entire region level with proposals for how countries can manage the energy crisis [
7], prices continue to rise. The main problem is that countries needed to prepare in advance to manage such an unprecedented situation. It can be said that, for many years, the level of European energy security was very low, and the ambitions to strengthen it too small. Some European Union (EU) countries have developed relationships and new energy grid connections for many years, despite the threat of energy dependency or the warnings of other countries, such as those of the Baltic State. Taking the example of Germany, Russia stopped their supply of gas, and the German authorities do not know whether they will be able to fully ensure heating in the winter of 2022–2023. However, it is not just supply problems that can be found in the development of the EU energy sector. A significant role is played by energy efficiency and inland energy generation. Energy generation from renewables does not require fossil fuels. Clean energy is one of the most significant cores for a country’s energy dependency; this has been well-known for many years. At the same time, the increase in energy efficiency can ensure energy affordability for energy consumers.
The war in Ukraine and the pandemic have led to energy deficits and price increases in various types of energy sources. The transport sector was one of the first to feel the consequences: prices rose sharply on the first day of the war. Globally, about a quarter of all energy consumption goes towards meeting transport needs, while in Europe, the share for transport is significantly higher and accounts for about a third. The energy sector is the biggest emitter of carbon emissions and one of the main factors contributing to climate change. Therefore, it is very important that measures regarding climate change mitigation are implemented in all energy sectors, including transport. Moreover, sustainable transport development has clear links with people’s health and quality of life, as well as the level of energy poverty. Therefore, it is very important to measure the sustainable development and progress of the sector. This study seeks to develop a framework for the sustainability assessment of road transport in EU countries and to apply it for the analysis of achievements made in the last decade. The study adheres to the provision that the developed framework should be easily applied in future to monitor the progress made. Therefore, significant attention is paid to the selection of indicators and their availability, as well as the selection of the research instrument itself. In order to compare countries’ achievements in the last decade (2010–2020), the multi-criteria decision-making (MCDM) technique TOPSIS has been applied for calculations and countries’ ranking. The selected technique is one of the most popular tools for sustainability assessment studies. Moreover, the comprehensive logic of calculations and the easy and fast computation process can contribute to the repeatability of the research. The sensitivity analysis was performed by creating four weighting scenarios. The analysis of the results of the last decade allows to identify the direction that individual countries are taking in the development of road transport. The analysis and assessment of the results can also serve as guidance for policy makers in planning measures for future sustainable transport development.
This paper consists of several sections. The
Section 2 overviews the scientific literature, which applied a multi-criteria analysis for the analysis of different sustainable transport development issues. The main directions of EU energy policy towards the sustainable transport development are analysed in the
Section 3. An overview of the latest road transport indicators in EU countries is presented in the
Section 4. The
Section 5 introduces methods and data for the assessment. The results of the achievements made during the last decade and the subsequent discussion are provided in the
Section 6. Finally, the conclusions are presented.
2. Literature Review of Multi-Criteria Analysis Application in Transport Studies
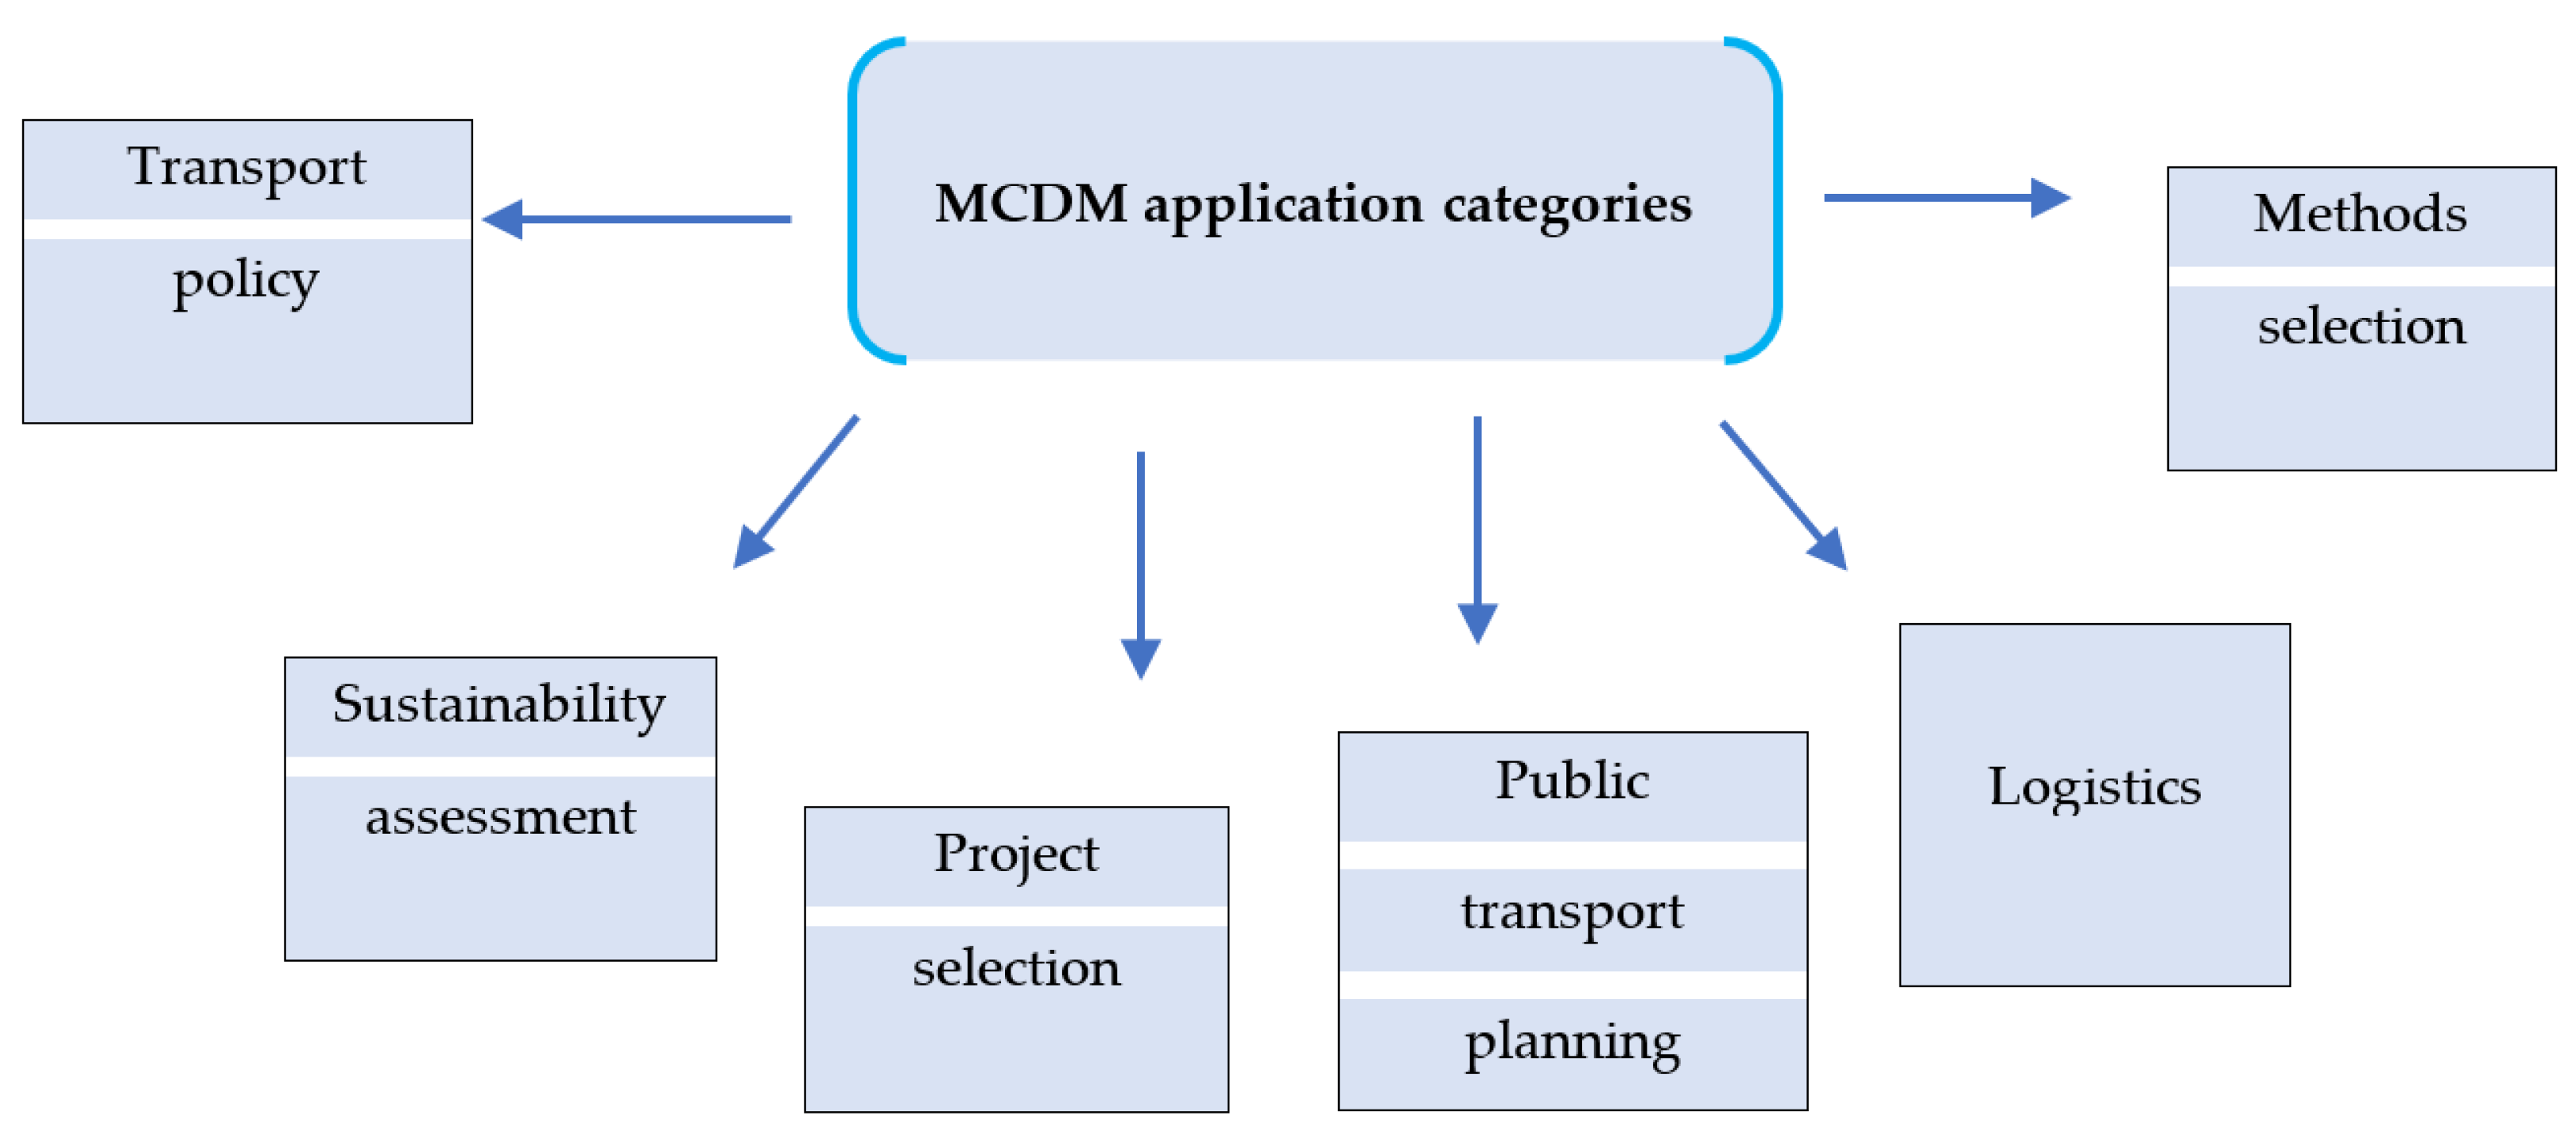
The interest in sustainable transport development has increased significantly over the last decade in both the scientific literature and political documents. Multi-criteria analysis for sustainable transport decision making is one of the most popular tools to account for all conflicting aspects of the problem. The main application areas in which different MCDM techniques have been applied in transport studies can be divided into six main categories (
Figure 1).
Transport policy studies are usually designed for policy makers and local authorities as supporting instruments for decision making. Transport policy research can be divided into two main groups: one part of the studies focuses on issues related to sustainable urban planning, while the other part focuses on the fulfilment of policy goals. The following are examples of urban transport planning studies. For transport planning in metropolitan areas, Ciesla et al. [
8] applied the MAJA technique and proposed a model that considers financial, safety, ecological and qualitative aspects. By the application of the AHP method, Kramar et al. [
9] presented a strategic urban planning approach for the implementation of sustainable policy targets. A decision-making tool for local authorities or construction planners was introduced in the study by Casanovas-Rubio et al. [
10]. The authors applied the MAUT technique to develop the model, which measures the impact of construction work on mobility in a city. Different multi-criteria techniques have been applied for the analysis and measurement of policy objectives implementation. For example, Neofytou et al. [
11] used the PROMETHEE II technique for the assessment of energy efficiency measures in the building and transport sectors. Interesting research was carried out by Sayyadi and Awasthi [
12], in which the sustainability of different transportation policy scenarios was evaluated by the application of the AHP method. Hoefer and Madlener [
13] applied the MAUT technique and performed an analysis of several energy transition scenarios. The NAIADE approach was used in the study by Corral and Hernandez [
14], in which a decision support system involving various stakeholders was proposed for transport policy planning. Keseru et al. [
15] proposed a methodology which takes into account stakeholders’ preferences for future transport planning. The proposed methodology combines several techniques, but its basis lies in the multi-criteria approach.
Studies that were developed for sustainability assessment purposes were also performed for other reasons, such as the evaluation of transport infrastructure [
16,
17,
18], sustainability assessment of transport services [
19,
20,
21], and sustainability measurement of the transport sector of a specific city or whole country. Czech et al. [
22] proposed a tool for the assessment of sustainable transport development. The authors selected thirty indicators to reflect the aspects of transport sustainability. The tool was applied in practice for the sustainability assessment of transport development in Polish voivodeships., The same indicators were used for the sustainability assessment of transport sector development in twenty-four European countries in the study by Czech et al. [
23]. The authors applied a dynamic approach and performed an assessment taking into account thirty indicators. Castillo and Pitfield [
24] introduced a methodological framework for the sustainable transport development indicators selection by applying the AHP method. An integrated urban transport and logistics sustainability index based on the AHP method was proposed by Senne et al. [
25]. Jasti and Ram [
26] used the AHP method and selected twenty-nine indicators for the sustainability assessment of the public transport system in a selected India city. The authors applied the same approach for the sustainability measurement of the metro rail system in the largest city of India, Mumbai [
27]. The authors applied the MIVES method for their calculations. In terms of smart city and sustainability aspects, Shmelev and Shmeleva [
28] analysed 57 cities by applying the ELECTRE III, NAIADE and APIS techniques; they also created the indicators system,. Wang et al. [
29] applied the integrated entropy-CoCoSo approach for the sustainability assessment of existing road transportation systems in the Organization for Economic Cooperation and Development (OECD) countries.
The range of problems analysed in the other sustainable transport categories are also vast, and many different methods have been used. For example, the questions analysed in transport project selection studies are various, such as evaluation systems for the analysis and ranking investment projects [
30,
31]; the assessment of vehicles alternatives [
32]; failure analysis of public transport systems [
33], etc. However, most studies analysed issues of transport infrastructure development and applied various MCDM techniques, such as AHP [
34,
35], ANP [
36,
37], TOPSIS [
34], PROMETHEE [
34], MULTIMOORA [
38], MACBETH [
39] and DEMATEL [
37]. Public transport planning studies have been applied using many different MCDM techniques and address different sustainable transport planning issues, such as mobility alternatives selection [
40], determination of Park and Ride locations [
41], transport infrastructure planning [
42,
43,
44], etc. A wide variety of methods are applied: TOPSIS [
45], MABAC [
46], ARAS [
43], COMET [
47], SIMUS [
48], etc. Mostly, the questions in the logistics studies are related to sustainable freight planning, while the methods selection articles propose tools for decision making, paying attention to the involvement of stakeholders.
3. EU Energy Policy towards Sustainable Transport Development
The major sustainability issues to be addressed in transport policies are linked to climate change mitigation. Therefore, transport plays an important role in the decarbonization directions of the EU [
49]. The EU is the world flagship for low-carbon energy transition. In 2019, the European Parliament issued a call for the European Commission to take into account the climate emergency and to develop policy proposals to limiting global warming, in order to address the 1.5 °C target [
50]. In 2021, the EU Climate Law was adopted by the European Parliament and introduced the legally binding greenhouse gas (GHG) emissions reduction target of 55% by 2030, with the aim of achieving climate neutrality by 2050 in the EU. This confirms the EU leadership fight against global climate change. Consequently, the European Commission issued the European Green Deal, which is the main policy document for the EU to create a climate-neutral society by 2050. In order to achieve its ambitious climate goals, the EU has initiated a revision of the linked legislation and regulations for specific sectors with a direct influence on GHG under the Fit for 55 package. The transport sector is also included. This is the only sector of the EU economy in which GHG emissions have increased by more than 25% since 1990, and in 2020 they were higher again. The transport sector is very important for GHG emission reduction policies in the EU, as it comprises more than a fifth of the total GHG emissions in the EU [
51].
The specific legal regulations that will allow the EU to implement the Green Deal are included in the Fit for 55 package, which was issued in 2021 by the European Commission. The Fit for 55 package includes the revision of existing legislation on GHG emissions reduction in energy. The package was issued, and the European Commission adopted the amendments of Renewable Energy Directive II by proposing the GHG intensity reduction target for 2030, instead of the share of renewable energy sources in transport. The Fit for 55 package adopted in 2021 consists of 13 related amended legislations and six newly recommended laws linked to energy and climate.
As civil aviation makes more than 13% of total GHG emissions from the transport sector in the EU, in 2022, the European Parliament adopted the Emissions Trading System (ETS) revision for the aviation sector, by applying the same requirements to all flights that depart from countries in the European Economic Area. The synthetic fuel—or even hydrogen—will become aviation fuel from 2025, and it is planned to reach 85% by 2050 in all EU airports. The European Commission is also planning to quicken the decarbonisation of the transport sector by outspreading the ETS to the maritime transport sector.
The European Commission adopted the Renewable Energy Directive (2009/28/EC) [
52] in 2009, setting the RES targets for EU member states to achieve 10% of renewables in all energy used in transport by 2020. The Renewable Energy Directive also provides sustainability criteria for the RES used in transport, and only biofuels have been compliant with them since 2011. The increase in the share of RES in transport and the electrification of road and rail transport were the main drivers of the growth of RES share in the transport sector [
53].
The European Commission issued the new Renewable Energy Directive in 2018 (2018/2001) [
54]. In this directive, the sustainability criteria for bioenergy were made stricter. The target for 2030 was set for RES in transport, i.e., −14%.
Cars and vans are major road transport polluters and contribute more than 15% of GHG emissions [
55]. The European Commission issued a proposal to achieve zero emissions from cars and vans by 2035 in the EU. The in-between GHG emissions reduction targets were fixed at 55% for cars and 50% for vans by 2030.
There are plans to introduce ETS II for carbon pricing in road transport and heating in the EU. It is foreseen that regular consumers would be exempted from carbon pricing via ETS II until 2029, and only businesses entities would be eligible to pay a carbon price on such fuels as heating oil.
However, it is necessary to stress that road transport electrification is likely to play a major role in transport decarbonization [
56,
57]. Even though electric and hydrogen vehicles are carbon-free vehicles, the electricity needed to charge electric vehicles or produce hydrogen is not necessarily carbon-free [
58,
59]. In many countries, except, for instance, Norway, the generation of electricity that is necessary to charge electric vehicles comes from fossil fuels. Therefore, the effectiveness of transport electrification as an emission abatement measure depends heavily on the decarbonisation of electricity sector. If fossil fuel power plants are not replaced by carbon-free options, the overall GHG emission will increase due to the electrification of road transport [
60,
61].
The main policies promoting the decarbonisation of the transport sector are fiscal initiatives, the regulation of GHG emissions and other standards, and the development of relevant infrastructure, as well as information dissemination and raising awareness [
62,
63]. The fiscal incentives allow an increase in the initial uptake of electric vehicles and achieving economies of scale in electric vehicles and battery manufacturing industries. Such policies and measures as purchase subsidies and/or vehicle purchase and registration tax rebates are popular around the world, as they allow a reduction in the price gap between electric and conventional vehicles [
64,
65].
The tightening CO
2 emissions standards for conventional vehicles are another important driver of electric vehicles penetration in the market [
66]. CO
2 emissions standards for vehicles in the EU play an important role in promoting electric car sales. Another important measure is the development of relevant infrastructure, such as convenient and affordable publicly accessible chargers, which are the main measure to scale up electric vehicles. In order to address infrastructure requirements, governments provide financial support for the development of electric vehicles’ charging infrastructure. Direct investment in the installation of publicly accessible chargers is among the most popular support measures [
60]. Further, there are building codes requiring newly constructed buildings to include charging points. The introduction of differentiated circulation fees for electric and conventional vehicles, or the establishment of preferential zero carbon areas of parking are also among popular policies to promote the decarbonisation of road transport.
Another important policy measure is the introduction of differentiated taxation of vehicles and fuels based on their environmental performance, and GHG emissions will enable the fast development of clean vehicle industries [
67,
68]. Nevertheless, more actions are necessary for light-commercial vehicles, medium- and heavy-duty trucks, and buses, as they have an increasing negative influence on energy consumption, atmospheric pollution and GHG emissions. It is necessary to highlight that medium- and heavy-duty vehicles contribute about 5% of all four-wheeled road vehicles and are responsible for more than 30% of road transport GHG emissions.
EU countries have adopted several policies and measures to overcome the main consumer barriers of electric vehicles, such as affordability, convenience, and awareness [
69,
70,
71,
72]. In terms of electric vehicles development, the key policies and measures adopted in EU member states are financial incentives aiming to address the cost gap between electric vehicles and conventional cars, the extension of electric vehicles charging stations and other necessary infrastructure. Information dissemination campaigns are also an important measure to increase public awareness about the benefits of electric vehicles [
73]
The purchase subsidies for electric vehicles and annual tax exemptions on electric vehicle registration and operation are popular measures in such countries as The Netherlands, Slovakia, the Czech Republic and Norway, where electric cars are quite popular in big cities. It is recommended to introduce all supplementary policies such as exemptions or rebates of parking fees or parking permits for electric vehicles, exemptions of road tolls, and congestion charges, which are influential instruments to provide clear cost advantages for the drivers of electric vehicles.
4. An Overview of Countries’ Achievements
This section overviews the most important and the newest available indicators of road transport in the EU member states. The indicators for the overview were selected according to their significance in reflecting the problem. These indicators are GHG emissions from fuel combustion in road transport; the share of passenger diesel cars; the share of passenger electrical cars; passenger cars by age; passenger cars per 1000 inhabitants; share of buses and trains in inland passenger transport; motor coaches, buses and trolley buses by age; the share of electrical motor coaches, buses and trolley buses; road traffic deaths rate; and investments and expenditures on road transport infrastructure.
The average GHG emissions from fuel combustion in road transport in the EU-28 was 1.54 tonnes/person in 2020 (
Figure 2). Although the values of GHG emissions range from 0.92 in Romania to 7.41 in Luxembourg, mostly, the emissions level does not significantly diverge from the EU-28 average in many countries. However, the countries with relatively high values (tonnes/person) should be individuated: Luxembourg (7.41), Austria (2.31), Slovenia (2.17), Cyprus (2.16), Lithuania (2.12), Ireland (1.95) and Denmark (1.93). The biggest influence for such results is international road traffic. Particularly high values of GHG emissions per person are in Luxembourg. The country is at the heart of the main traffic axes for Western Europe; it is a central point for international road traffic and has a high volume of road transit traffic. The transit traffic is for both passengers (tourists on an outward or return journey) and goods (freight transport). The domestic traffic is responsible for only a quarter of the fuels sold in Luxembourg for road transport.
The pollution of diesel cars is the reason for the goal of abandoning them as soon as possible in Europe, or to reduce the number of diesel cars to a minimum. The popularity of diesel cars differs among countries (
Figure 3). However, several countries can be individuated, in which diesel vehicles are very popular. In some countries, the share of passenger diesel cars accounted more than half of all passenger cars, these countries being Lithuania (67.72%), Latvia (63.34%), Bulgaria (59.1%), Ireland (58.69%), France (57.46%), Portugal (56.9%), Austria (54.53%), Croatia (54.47%), Spain (54.44%), Luxembourg (53.18%) and Slovenia (50.29%). It is also necessary to mention that in some of these countries the car park is quite old (e.g., Lithuania, Latvia, Bulgaria). The share of diesel cars stopped growing in the last few years in Lithuania and Latvia, but clear decreasing trends are yet to be seen. Bulgaria differs from other countries in that the number of diesel cars in the country continues to grow, most of which are polluting and old cars from Western Europe.
One of the measures to encourage the shift away from polluting diesel cars is through various support mechanisms for the purchase of electric cars. These mechanisms differ among countries. The development of electric cars is also significantly influenced by the development of solar energy at the household level, the level of public awareness, and according to economic factors. For these reasons, different penetration of the electric vehicles can be seen in the market (
Figure 4). Although the EU-28 average was less than half a percent (0.44%) in some countries, the share of electric cars was more than twice as large. The biggest share of passenger electric cars was observed in The Netherlands (1.98%) in 2020. Twice or more the EU-28 average were Denmark (1.17%), Sweden (1.13%), Luxembourg (1.03) and Austria (0.87%). The countries where electric cars did not make up more than 0.1% can be individuated: Cyprus (0.04%), Poland (0.04%), Croatia (0.08%) and Romania (0.08%). Many countries were significantly below the EU-28 average, e.g., Italy (0.13%), Czech Republic (0.13%), Latvia (0.16%), Lithuania (0.16%), Estonia (0.22%) and Spain (0.23%).
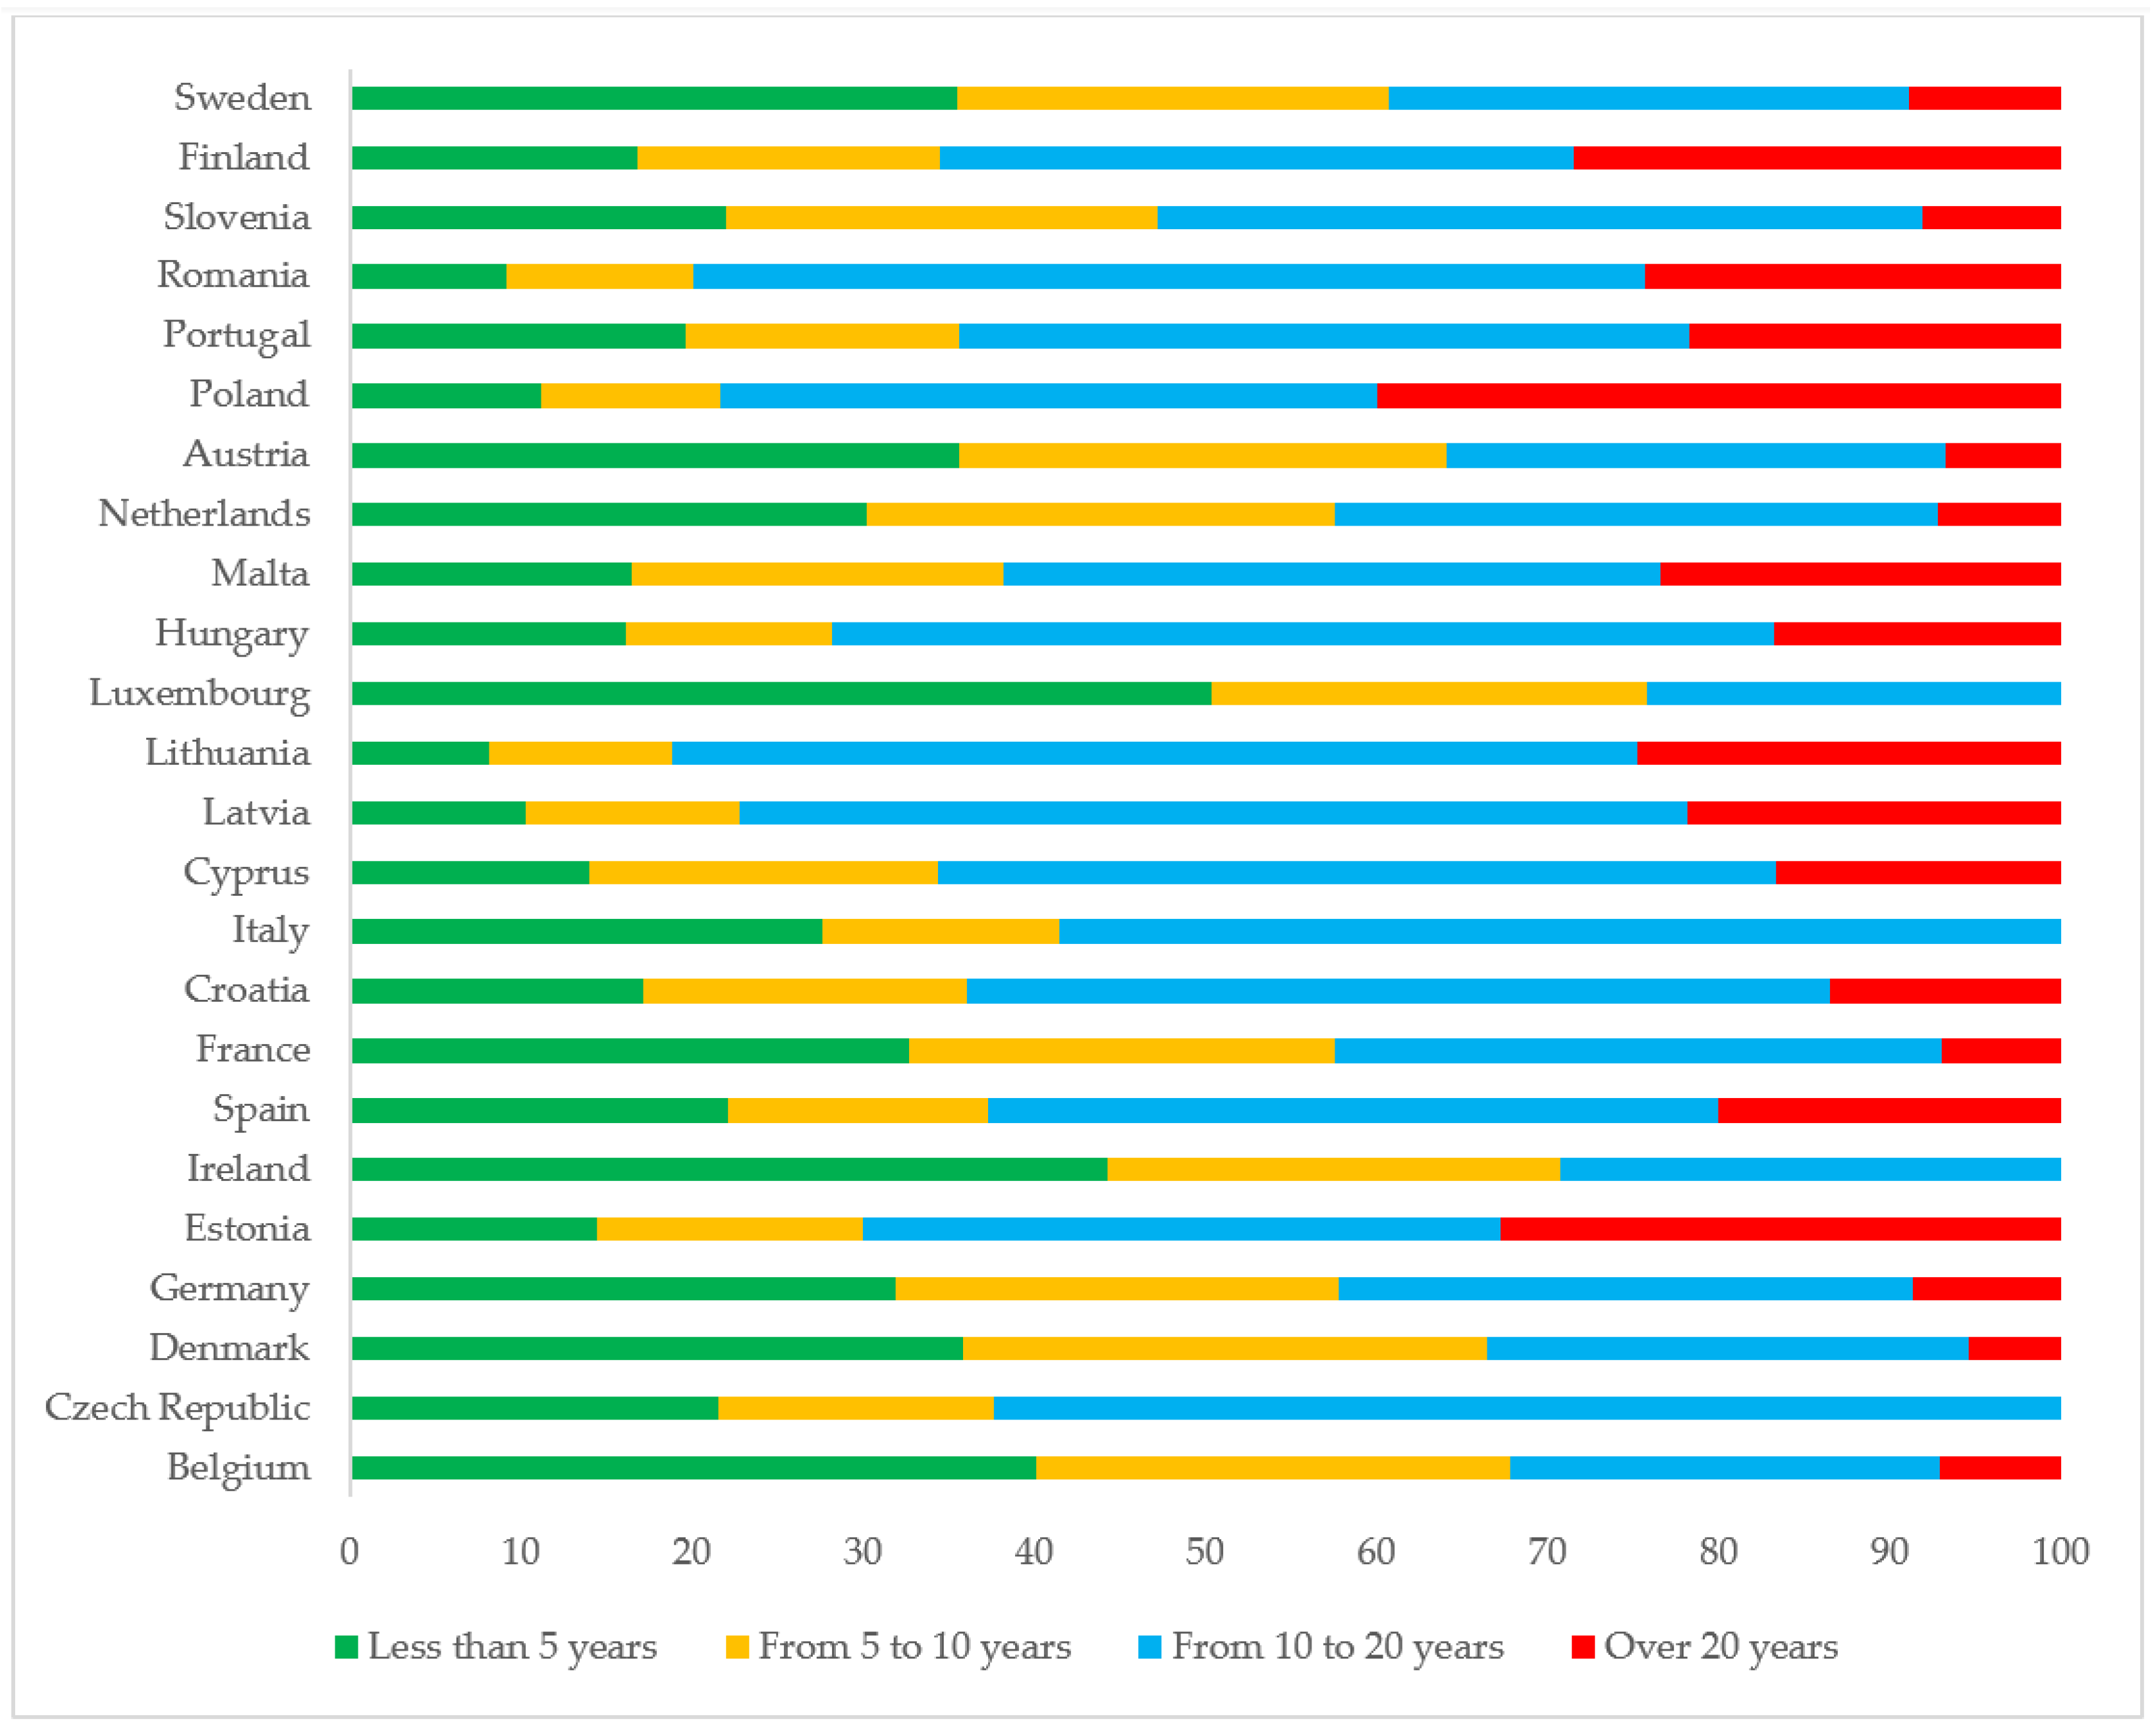
The environmental footprint from the transport sector can be decreased by the development of clean technologies and improvements in energy efficiency. The old polluting and energy inefficient cars should be replaced in order to implement climate change and energy policy goals.
Figure 5 presents the share of passenger cars by age in EU countries in 2020.
Figure 5 shows that the differences among countries are significant. Four countries can be identified as having no passenger cars older than twenty years: Luxembourg, Italy, Ireland and the Czech Republic. In contrast, a significant percent of all passenger car parks is older than twenty years in Poland (40%), Estonia (32.7%), Finland (28.45%), Lithuania (24.76%) and Romania (24.28%). Citizens in Luxembourg have the newest cars, where more than half of the cars are less than five years old, and the share of cars aged less than ten years accounts for 76% of all passenger cars in the country. Countries with the highest indicators include Belgium, Denmark and Austria, where the share of cars less than ten years old accounts for more than 60%.
The number of passenger cars per 1000 inhabitants differs significantly among countries from 379 in Romania to 682 in Luxembourg (
Figure 6). These differences are influenced by many factors, such as geographical aspects, distribution of the population, the tax policy of a country, affordability and other economic aspects, the development of public transport infrastructure, etc. The well-developed public transport infrastructure is one of the essential cores for sustainable transport development.
A well-developed public transport infrastructure that meets people’s needs can significantly reduce environmental pollution, ensure smooth transportation services, reduce city noise, contribute to safe traffic, and ensure the quality of people’s lives. The share of buses and trains in inland passenger transport differs significantly among EU countries (
Figure 7). The lowest value was observed in Lithuania, where the share of buses and trains in inland passenger transport only reached 5.8%. Public transport services are not popular in the country. People have a preference for private cars not only for long travel, but also for travel in the city. Such preferences can be determined by many factors, but the most significant is convenience in terms of transport services. Thus, the low usage of public transport services is strongly determined by transport infrastructure planning issues (e.g., availability, travel time, comfort level, affordability, etc.).
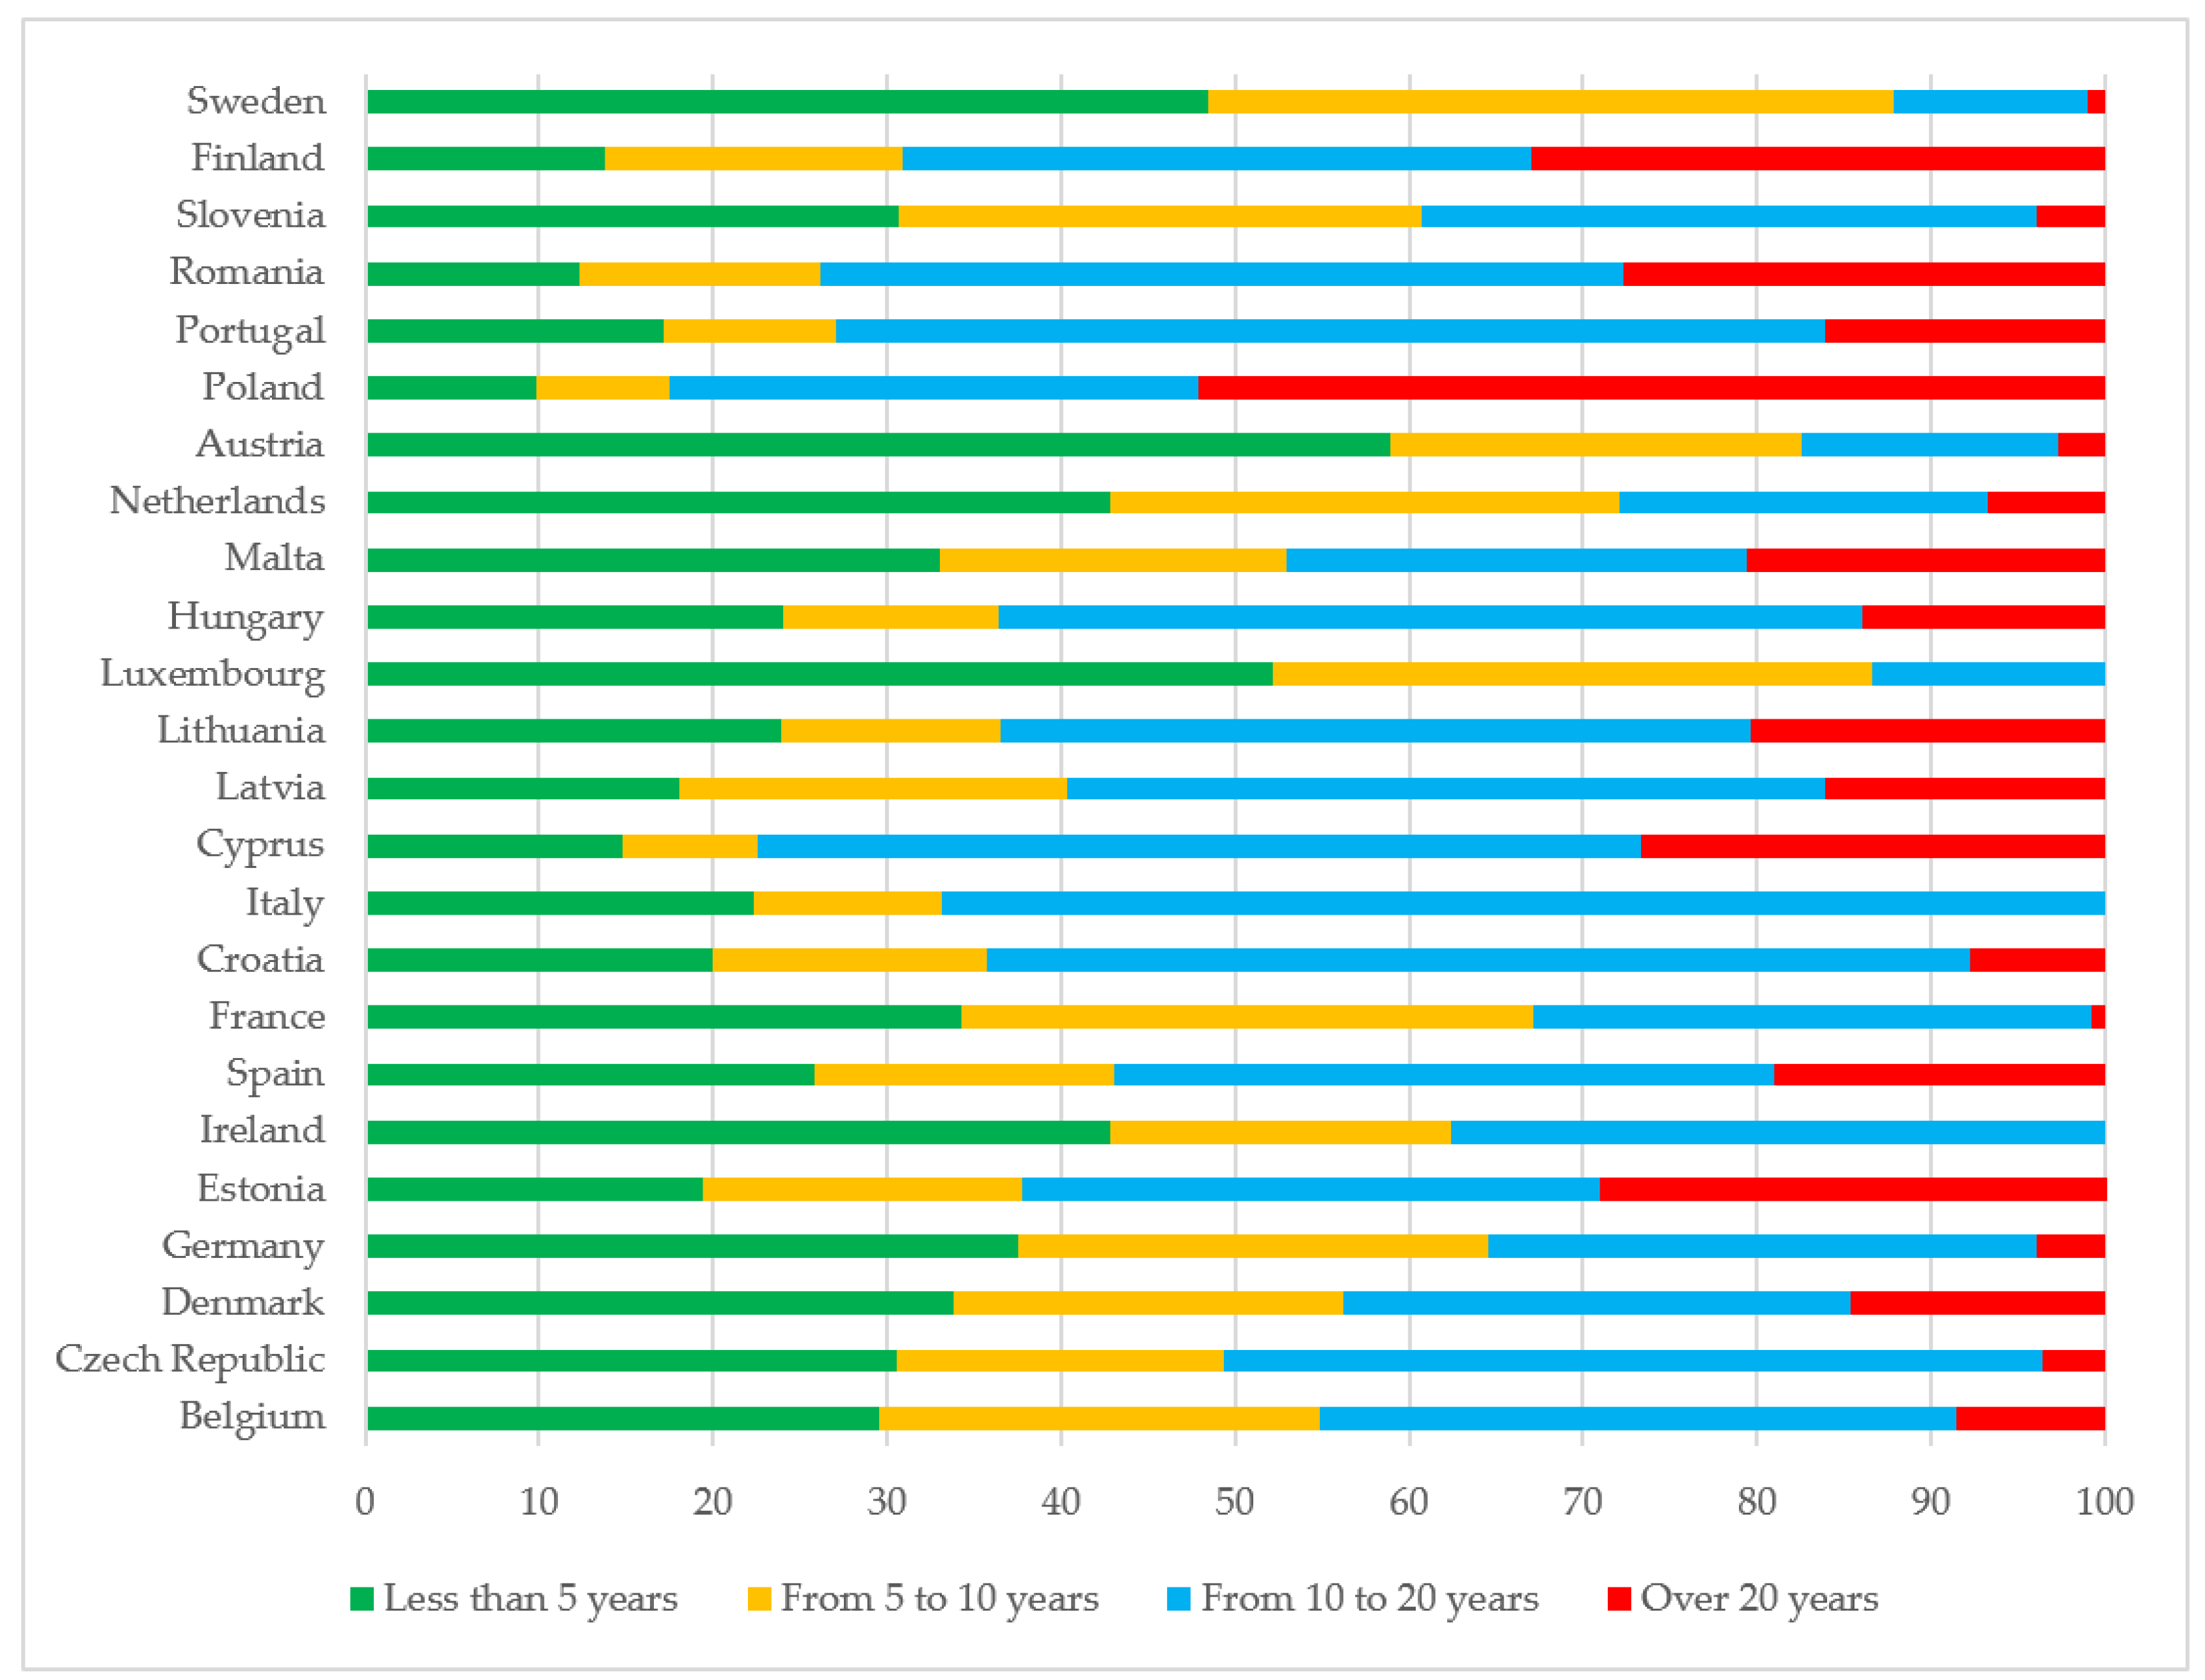
The huge gap between countries can be observed when analysing the age of public transport infrastructure between countries (
Figure 8). For example, more than half (52%) of motor coaches, buses and trolley buses in Poland are older than twenty years. In comparison, 52% of motor coaches, buses and trolley buses in Luxembourg are less than five years old. Countries with the newest road public transport infrastructure are Sweden, Austria, The Netherlands, France and Germany, while the oldest motor coaches, buses and trolley buses are in Poland, Cyprus, Estonia, Finland and Romania.
The share of electric motor coaches, buses and trolley buses is quite low in many countries and mostly do not reach more than 1% (
Figure 9), but several countries have impressive results. The highest achievements were in The Netherlands, where electric buses accounted for almost 13% in 2020. Good results were also obtained in Luxembourg (6.71%), Latvia (6.53%) and Lithuania (5.5%).
Sweden has impressive results regarding the share of RES in the transport sector (
Figure 10). Almost one third (31.9%) of energy consumed in transport comes from RES. In most other countries, the share of RES ranges between 9 and 12%. However, in countries such as Greece, Lithuania, Croatia, Cyprus, Latvia and Poland, the portion of RES is low and accounts for only 5–7%. The urgent measures should be implemented in order to achieve the EU transport policy goals, especially in these countries which are falling behind.
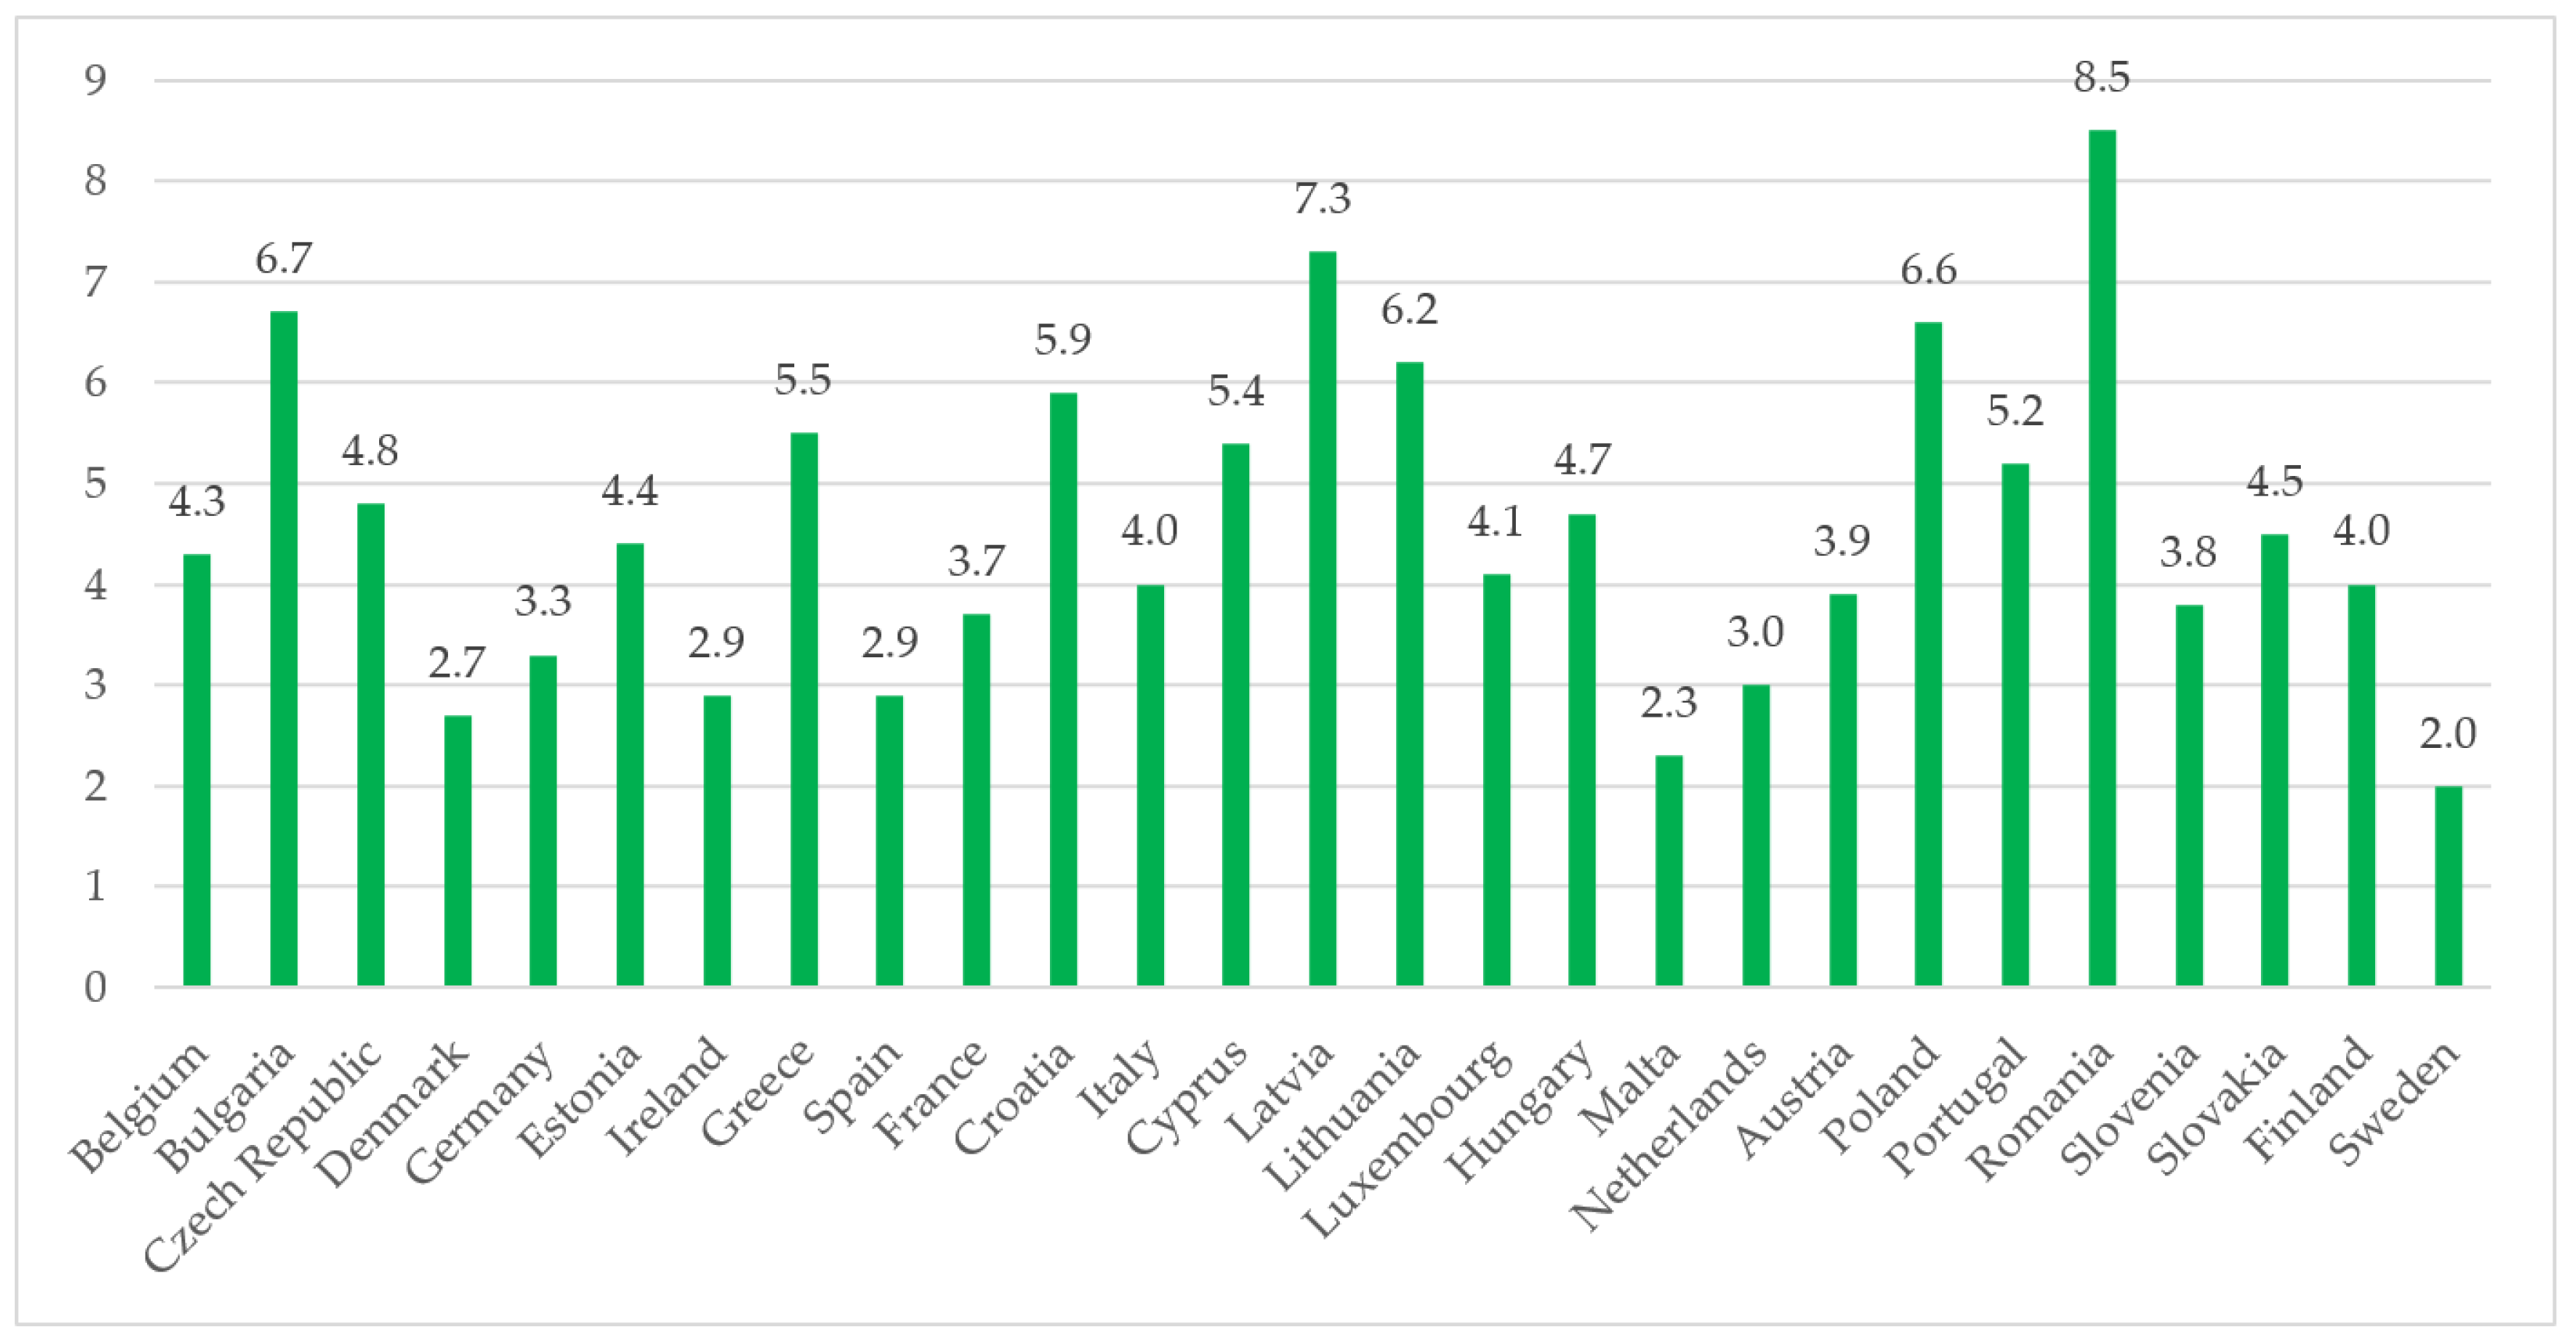
The road traffic deaths show the rate of persons killed in road accidents per the average number of people in the country. Surprisingly, the rate differs between some countries by more than four times. Specific examples are Sweden with the value of 2, and Romania, with the value of 8.5 (
Figure 11). The lowest number of road fatalities was in 2020 (18,800). This significant decrease was influenced by the COVID-19 lockdowns [
75]. In 2021, the number increased, but it was much lower than before the pandemic and reached 19,800. The EU target for 2030 is to decrease the number of road deaths by 11,400 or less [
76]. Road safety depends on many factors, such as: the compliance of transport infrastructure with people’s needs; level of public awareness; regulatory system, etc.
Appropriate and timely targeted investments and road maintenance that ensure high safety requirements can reduce the number of road traffic accidents to a minimum. The highest investments in road infrastructure in 2020 per person were in Sweden (EUR 284), Lithuania (EUR 230) and Malta (EUR 230) (
Figure 12). The biggest expenditures on road infrastructure per person were in Sweden (EUR 393) and Lithuania (EUR 303). In 2020, Romania and Slovenia made no new investment in road transport, while the expenditures were quite high in these countries.
Transport, especially road transport, plays an important role in terms of the sustainable development of a country [
77], as it has a direct impact on the increase in GHG emissions and atmospheric pollution. The increase in the use of public transport and the decrease in passenger cars per capita, as well as passenger diesel cars share, allows a reduction in the climate change burden of transport and GHG emissions from the transport sector [
66]. Another important driver is the increase in the share of renewables in transport and the fast penetration of electric and hybrid vehicles. The decrease in road traffic deaths is an important social aspect of transport sustainability, as in some EU countries such as Bulgaria, Romania, Latvia and Poland, this indicator continues to show illustrate a terrifying situation though a clear decrease in trends since 2010, which can be noticed in all EU member states.
As can be seen from the presented transport data, the results and achievements of the EU countries differ significantly in terms of road transport development. Therefore, it is important to monitor the countries’ achievements and to implement the sustainable transport development policy in the whole region. Looking at historical data, many countries have achieved significant results. However, this is not enough to combat climate change, and the energy transition must be accelerated.
5. Methods and Data
The study intends for the developed road transport sustainability assessment system to be easily applied in the future to monitor the progress. To ensure this, significant attention is paid to the selection of indicators and their availability. Only then can the full picture be seen of the entire region and the impact of the applied policy on the countries’ achievements. Six indicators have been selected for the assessment and ranking of countries’ achievements in the last decade. These indicators can be grouped into three categories, which reflect mobility (passenger cars per 1000 inhabitants, number; share of buses and trains in inland passenger transport, %); environmental (RES in transport, %; passenger diesel cars, %); and health aspects (GHG emissions from fuel combustion in road transport, tonnes/person; road traffic deaths, rate). A well-developed public transport system is essential for sustainable city development and people’s well-being. The mobility options developed significantly affect air quality and people’s health [
78]. Two indicators to reflect the mobility situation have been selected, one of which reflects the development level of the public transport system, the other reflecting the usage of private cars in inland passenger transport. The share of RES and reduction in polluting cars are among the objectives of the EU’s transport policy. These objectives are also a part of the measures to combat climate change [
53,
55]. Therefore, indicators such as the share of RES and the share of diesel cars are included in the assessment. The reduction in GHG emissions and the decrease in road traffic deaths are also a part of the EU’s objectives [
51,
76].
The multi-criteria decision-making (MCDM) technique TOPSIS has been applied for calculations and countries’ ranking in the period of 2010–2020. Calculation with the TOPSIS method takes into account the distance from the positive and negative ideal solution [
79]. The best alternative is that which is closest to the positive ideal solution and the greatest distance from the negative ideal solution. The TOPSIS approach has a fairly simple calculation process and quickly obtained the assessment results. The logic of computation is rational and expressed in a simple mathematical form, and the evaluation process is fast compared with other techniques. From the decision-makers’ perspective, it is easy to interpret the results obtained and to understand the importance of the criteria selected for the final results [
80,
81,
82]. The TOPSIS technique has been widely applied in sustainability assessment studies. The selected method is a suitable and logical tool for this type of research and has been applied for the comparison of achievements made in EU countries [
83]. The selected countries are evaluated and ranked in accordance with the following seven steps:
Step 1. Decision matrix formation with
m alternatives and
n criteria:
Step 2. The normalised matrix is obtained by the equation presented below:
Step 3. The weighted normalised matrix is computed by Equation (3):
Step 4. Determination of the positive A
+ ideal solution and negative A
− ideal solution:
Step 5. The relative distance of each solution from the positive A
+ ideal solution and negative A
− ideal solution is calculated:
Step 6. Calculations of the relative distance of each alternative from the ideal solution are calculated by Equation (8):
Step 7. Selection of the best alternative, i.e., that which is closest to 1. The best alternative has the highest Ci value. Based on the values of Ci, a ranking of countries is created.
For the measurement of countries’ achievements made during the period under analysis, equal weights of all indicators selected were assumed (basic scenario). In order to perform a sensitivity analysis and validate the results, the three additional scenarios were created, and rankings for 2010 and 2020 were calculated. Each of the scenarios focuses on one of the dimensions, with the remaining two assigned with lower weights. The scenarios’ weighting schemes are presented in
Table 1:
Road transport indicators of EU member states in 2010 and 2020 are provided in
Appendix A.
6. Results
The results of the assessment and countries’ ranking (basic scenario) in the last decade are provided in
Table 2. As can be seen from the results, the best performing country in the region in 2020 was Sweden, with the score of relative distance to the ideal solution 0.842. The results of the countries ranked in the other positions do not differ to a significant extent. However, one country had an especially different result from the others: the final result of Luxembourg was very low, and the country took last place with the score of 0.257 in the ranking. This was caused by a significant deviation of one of the indicators selected for the assessment from the results of the other countries. As already mentioned in
Section 4, Luxembourg is unique from the other European countries because it is a central point for international road traffic in Europe.
The results of the conducted study show that, in 2010, the best performing countries in terms of sustainable transport in the EU were new EU member states such as Slovakia, Hungary, the Czech Republic, Poland and Sweden. The situation changed in 2020, and The Netherlands, Malta and Finland appeared among the leading countries.
The main reasons for the high ranking of Slovakia, Hungary, Denmark and the Czech Republic in terms of transport sustainability in 2010 are linked to the high share of public transport (the leaders are Hungary, the Czech Republic and Slovakia); low number of passenger cars per 1000 inhabitants (leaders: Hungary, Slovakia and Romania); low GHG emissions from fuel combustion in transport (leaders: the Czech Republic, Hungary, Romania, etc.); and low share of passenger diesel cars (leaders: Slovakia, Greece etc.). At the same time, Sweden and The Netherlands had very low road traffic death rates. The highest share of RES in the transport sector was in Austria and Sweden.
In 2020, the main reasons for the high ranking of Sweden, Hungary, The Netherlands, Malta, and Finland were the decrease in GHG emissions from fuel combustion in transport due to an increase in the share of renewable energy in transport; fast penetration of electric and hybrid vehicles; and stricter standards adopted for road vehicles, including financial incentives such as purchase subsidies for electric vehicles and annual tax exemptions on electric vehicle registration and operation. The low road traffic deaths rate in Sweden, Malta, Denmark and The Netherlands in 2020 was another important contributor to the high ranking of these countries in terms of sustainability. Hungary’s high position was determined not only by a large share of RES, but also by a low number of cars per 1000 inhabitants and share of buses and trains in inland passenger transport.
Therefore, Eastern and Central European countries performed better in terms of high shares of public transport and a lower number of passenger cars per 1000 inhabitants, and Nordic countries led in terms of low road traffic deaths and a lower share of passenger diesel cars during all investigated periods.
The lowest performing country among the other analysed EU member states remained Luxembourg, with the highest GHG emissions from fuel combustion among other EU member states during all investigated periods. Luxembourg also had the highest rate of passenger cars per 1000 inhabitants during the 2010–2020 period among EU countries. Moreover, the country had the highest share of passenger diesel cars in 2010 among EU member states, and, although the situation improved slightly in 2020, the country is among the leaders according to this indicator.
In order to validate the results, different weighting schemes were assigned. The results and comparison of different weighting scenarios based on the TOPSIS technique are provided in
Appendix B. The correlation coefficients for the utility scores among different weighting schemes demonstrate that the correlation is high (
Table 3 and
Table 4). The lowest correlation coefficient is 0.85 for the Health- and Environment-oriented scenarios in 2010. In 2020, the lowest correlation coefficient is 0.77 for the same scenarios. Despite this, the correlation is significantly high.
The results of the conducted research can be compared with other studies analysing the transport sector development trends and policies in the EU. For example, Baran and Gorecka [
84] applied a data envelopment analysis (DEA) for the efficiency measurement of road and rail freight transport in old and new EU countries. The results revealed that there are no significant inland transport efficiency differences between old and new EU countries. Moreover, no statistical correlation between a country’s economic condition and road transport efficiency was found. The current research revealed that some differences between old and new members in terms of road transport sustainability can be identified. Mainly, these differences are related to the investments in new technologies for the reduction in GHG emissions and enlargement of RES in transport. Differences between old and new EU member states were also found in the study by Stefaniec et al. [
85] in terms of social sustainability. The authors applied a DEA analysis for the assessment by analysing mobility, safety, accessibility, health, employment, and equity aspects in the regional transportation of old and new EU members. It was found that the new EU member states perform better in terms of social sustainability. This may be associated with a lower rate of motorization and a higher share of public transport. The current research also stressed that the share of public transport and lower number of passenger cars are specific for Eastern and Central European countries, and that these countries are stronger compared to the old EU members in this aspect. Persyn et al. [
86] performed an analysis of road transport costs between and within EU regions. The authors evaluated the impact on transport expenditures of an increase in fuel prices. A high impact on transport costs was found in Eastern Europe countries. Moreover, the investments in transport infrastructure made by the European Cohesion Policy program 2014–2020 were analysed. The authors compared the economic cost of upgrading the roads to the economic benefit. The performed analysis showed that the biggest effect can be identified in Eastern European countries, with the smallest effect in Western Europe.
7. Conclusions
The transport sector plays an important role in the decarbonization of the EU energy sector. Almost one third of energy consumed in the EU goes towards meeting transport needs. The transport sector is the only sector in the whole EU economy in which GHG emissions have increased by more than a quarter since 1990; therefore, it is very important to measure its sustainable development and progress.
This paper presented a framework for the sustainability assessment of road transport in EU countries and applied it for the analysis of achievements made in the last decade (2010–2020). The developed framework can be easily applied in the future to monitor the progress made. The proposed multi-criteria technique for countries’ ranking can be easily applied in future studies and does not require sophisticated calculations. The results of the ranking can serve to identify leading countries, in order to follow the best measures implemented.
The proposed framework takes into account the essential indicators reflecting road transport sustainability issues and is a suitable tool for sustainability measurement and monitoring. The calculations can be carried out for the ranking and comparison of all EU members, and the framework can be applied to assess and monitor the annual achievements made by a selected country or countries, or country groups.
The multi-criteria assessment of EU countries in terms of transport sustainability during 2010 and 2020 allowed us to determine the most advanced and lagging countries and to assess the trends. Moreover, the sensitivity analysis was carried out by creating four weighting scenarios. However, certain quantitative variations across the scenarios exist, and qualitative conclusions persist. The best results regarding sustainable road transport development were achieved in Sweden, Hungary, The Netherlands, Malta and Finland. Sweden ranked first in the period under assessment. The country had impressive results in the share of RES in transport, where almost one third (31.9%) of energy consumed in transport comes from RES. The lowest ranking country was Luxembourg, due to the high share of GHG emissions and high popularity of passenger diesel cars for road transport.
As the RES enlargement is crucial for the future transport sector, the analysis of best practices and the most efficient measures to promote renewable technologies should be followed in EU member states, especially in those that are lagging behind. These urgent measures are necessary to boost the share of RES in transport for Greece, Lithuania, Poland, Latvia, Croatia and Cyprus. These countries should follow the example of Sweden. Although economic benefits are a very important issue for people, financial incentives for the purchase of electric cars are an ineffective measure in many countries today. First, the required and convenient for the users’ infrastructure should be developed.
The conducted study has limitations, as not all important sustainability indicators linked to transport were used in the multi-criteria assessment and the ranking of countries due to data limits. Moreover, it is important to extend the analysis of transport sector sustainability by distinguishing the impact of the COVID-19 pandemic and the Russian invasion of Ukraine on transport sector sustainability in the EU member states. More in-depth discussions about each country’s energy and transport policies are also necessary for future research, in order to better capture the impact of the implemented policies and measures on the sustainability of transport sector development in these countries and transfer good case practices to other EU countries. Moreover, the other MCDM techniques can be applied for calculations and countries’ ranking in future studies.


