Review

Review of Energy Consumption by the Fish Farming and Processing Industry in Croatia and the Potential for Zero-Emissions Aquaculture

1
Faculty of Mechanical Engineering and Naval Architecture, University of Zagreb, Ivana Lučića 5, 10002 Zagreb, Croatia
2
School of Transportation and Logistics Engineering, Wuhan University of Technology, Wuhan 430081, China
*
Author to whom correspondence should be addressed.
Energies 2022, 15(21), 8197; https://doi.org/10.3390/en15218197
Submission received: 15 September 2022 / Revised: 1 November 2022 / Accepted: 2 November 2022 / Published: 3 November 2022

Abstract

:
Higher energy efficiency and lower environmental impact have become very important aspects in the evaluation of the design and operation of technical systems. The same goes for the fish farming sector, which continuously aims to reduce its environmental footprint as well as its operating costs. This paper reviews the energy needs of the fish farming sector and their impact on the environment, and discusses the possibilities of improving the environmental friendliness of this sector by employing a higher share of renewable energy sources. The fish farming process is divided into its constitutive phases: fish breeding with associated activities, transportation, and handling of grown fish, together with relevant processes; and final processing and distribution to the customers. For these phases, the energy consumption and associated emissions, depending on the energy source, have been assessed. The parts of the process with the highest potential for the integration of alternative powering options and consequent environmental improvements are identified. The case study deals with the fish farming process in Croatia, for which a set of alternative powering options has been proposed, considering the existing energy supply, i.e., import of fossil fuels and current Croatian electricity mix, as well as renewable energy potential, which is reviewed in the paper.

1. Introduction

Aquaculture is one of the fastest-growing food industries and represents a very important part of the human food supply. With population growth, demand for more food is present. Aquaculture can be divided according to different criteria; the basic division is into seawater and freshwater aquaculture, depending on the salinity of the habitat. Then, there is a division into land-based, water-based, recirculating, and integrated farming systems [1]. Typical mariculture systems consist of cages, fishing vessels, and an onshore energy network [1], while one production cycle lasts for approximately two years [2]. According to FAO [3], world aquaculture production and capture of fish, crustaceans, and molluscs reached 117.8 million tonnes in 2019. China is one of the largest consumers and producers of fish products [1]. As the country with the highest CO2 emissions, it is developing a low-carbon economy and controlling carbon emissions [4]. Aquaculture is extremely diversified, with the FAO FishStat database identifying over 500 species cultivated globally [5]. It has greater first-sale value levels than capture fisheries on average, but its high investment costs and profitability are also highly sensitive to changes in fuel and energy costs [5]. Global mariculture production is now ca. 40% of total aquaculture production, and in recent years, about 75% of mariculture has been shellfish production; the remainder is finfish, including high-value marine and brackish water species (e.g., salmon, bream) in intensive farming systems in cages and net pens [3]. Intensive aquaculture is usually carried out in tanks, ponds, or open-water cages with a high stocking density, high water exchange and/or oxygen management, and complete feed [5]. In general, higher-value carnivorous species such as salmon, sea bass, groupers, eel, turbot, and cod are intensively farmed. The capture sector needs to optimize operations, improve profit, increase fishing capacity, or improve management of operating expenses to keep up with competitors [5]. The fishing sector may differ in energy consumption, due to activities at sea, breeding, food preparation, or processing. Different types of vessels are used in the fishing sector, like purse seiners, trawlers, longliners, gillnetters, crabbers, and others, depending on the activity and the purpose [5]. Based on that, the energy consumption is also different. Fuel is a substantial expense for most fishing operations at all output levels. Its significance is determined by the distance to the fishing grounds, fishing activity, and type, as well as vessel and management considerations [5]. For example, in the aquaculture sector, it is lower than in capture production due to the longer period fishermen spend at sea. Keeping in mind inflation, aquaculture has to cope with higher maintenance and operational costs, so finding economically acceptable and environmentally friendly methods is a priority [6]. Sometimes capital costs might be higher, but in the long term, considering changes in price over the year, some alternative methods are more acceptable [1]. Another factor to consider is where the demand for aquaculture products is concentrated. Aquaculture seafood supply is more focused on markets and supermarkets. For instance, 9 out of 10 Greek customers are aware of cultured fish and 8 out of 10 have tasted such goods, with a predilection for sea bass and sea bream, both of which are well known [6]. According to Iandoli and Cozzolino [6], residents of major urban areas are systematic consumers of aquaculture fish. For example, in Italy, a national socioeconomic study on employment and the level of reliance on fishing reveals that the poor performance of wholesale auction markets and excessive fragmentation of distribution channels are the main weaknesses in the distribution of fishery products [6]. Developing countries have a greater water/energy intensity (water/energy consumption per unit of aquaculture production), which is most likely related to inefficient farming methods, a low feed conversion ratio, and resource-intensive farmed species [7]. Northern countries have a high demand for frozen and processed fish. Processed seafood products are consumed by specific consumers in a specific context where seafood demand is solely based on tradition. In Mediterranean countries, demand for seafood is increasing, particularly for frozen seafood, despite the fact that fresh seafood accounts for the majority of consumption [6]. Mariculture is a prominent and rapidly growing sector that has the potential to supply relatively low-impact, high-quality nutrition to millions more people, but can also have lasting impacts on marine and coastal environments and socio-ecological systems [8].

1.1. Environmental Impact of Fisheries

Sustainability is an important factor for aquaculture systems, with the goal of producing seafood with a lower environmental impact and higher profitability. Progress in the development of sustainable aquaculture leads to a reduction in dependency on wild fisheries and a diversification of aquatic species [9]. To tackle the simultaneous challenges of feed and energy demands, land and water requirements and consumer preferences will be involved in rethinking aquaculture production with an integrated mindset [10]. Sustainability studies are presented in [9,10,11], but these investigations were mostly focused on general sustainability models, leaving out the importance of knowing the total energy consumption of an aquaculture system. In Figure 1, different amounts of energy consumption in the fishing sector types can be seen [5].
Troell et al. [12] analysed energy use in aquaculture farms, with a focus on industrial energy, such as fossil fuels. Aquaculture fuel and energy inputs are more diverse than in capture fisheries, where diesel fuel dominates the energy demand. This is especially relevant to the production phase and the feeding process, which needs the greatest energy, water supply, and water quality. Additional energy inputs to aquaculture operations relate to either hatchery-produced juveniles or wild-caught juveniles [13]. Even if the energy needs of an offshore aquaculture plant in terms of power or fuel for electricity production are relatively low in comparison to other industries, they are critical for smooth and continuous operations [12]. The majority of the power for land-based farms is likely to be supplied from the central grid, for which the original energy source and transmission efficiency can also be key factors in total energy accounting. In Figure 2, an example is given from the FAO database [5], showing the ratio between fossil fuel and solar energy in aquaculture production for the Scandinavian region. Simple mussel culture systems use far fewer inputs and rely far more on solar/renewable energy inputs, principally through photosynthetic inputs driving food chains.
Cage-based and other immersed/floating farm systems are powered by diesel or other fossil fuels. A number of rational but sometimes subjective characteristics such as the distance from the shore (for grid-connected systems) and the initial cost of equipment and installation of small generators (for standalone systems) direct the power source choice [12]. Environmental studies like [2,14] considered the environmental impact, but also energy usage in the mariculture production process before the factory process. Furthermore, a literature survey on the energy consumption and environmental impact areas indicates a focus on GHG emissions from the fish metabolites, and energy used for food consumption. The energy consumption index (kWh/kg fish) is a relevant parameter for Recirculating Aquaculture Systems (RAS). It varies by species and RAS, since it is affected by elements such as location and production volume, and, according to Badiola et al. [15], the energy consumption index varies from 2.9 to 81.48 kWh/kg. Moreover, energy consumption, with an emphasis on water usage, in the fish industry was analysed by Murali et al. [16]. Most of the researchers analysed GHG emissions for trawlers, purse seiners, or other fishing vessels that are hard to compare with aquacultural working boats because of the different operative profiles and technical properties. Sustainable food production has been characterized as the sustainable management of resources and ecosystems in order to meet evolving human requirements, protect natural resources, and maintain or improve environmental quality [17]. Hancock et al. [18] illustrated a three-pillar model (environmental, economic, and social) in an effort to consider issues of ‘health’ alongside sustainable communities.
Aquaculture has several direct effects on the environment, such as the negative effect of fish farm waste and potential effects on endemic species due to introducing non-native species or propagating diseases, and indirect effects related to the production of fish feed, all of which have an impact on the environment [10]. In Figure 3, risks for environmental damage at sea are presented. Greenhouse gas (GHG) emissions from the vessel engine are various and in different amounts. For instance, marine energy demand results in NOx emissions of 14–31%, SOx emissions of 4–9%, and global CO2 emissions of 2–6% [19]. According to Parker et al. [20], a major environmental problem in the fish industry is fossil fuel combustion, leading to the harmful emissions generated by the vessels. Life cycle analysis is usually used to analyse GHG emissions, but Pringle et al. [21] identified various flaws in aquaculture LCA interpretation, including a lack of sensitivity analysis of significant parameters and a lack of statistical analysis of results. Such studies are critical given the usage of data of varying provenance and quality, as well as the growing use of modelling throughout the inventory stage. The possible impact of fish farms on the marine environment, especially on the seabed, comes from the organic load caused by the intake of fish metabolites (faeces, urine, and gill secretions) and, to a much lesser extent, from uneaten food from the farm during the breeding cycle [14]. Early detection and identification of areas exposed to ecological changes, and chronology of events (frequency/seasonality, intensity, duration), are crucial for taking timely action to avoid or reduce the adverse effects on the environment, farms, and the health of consumers [22]. The largest share in the emission of solutes has CO2 emissions, but around marine cage farms and in the cages themselves, there have been no cases of a significant drop in pH, nor cases of hypercapnia in farmed fish [2]. The carbon footprint is getting higher, and due to new regulations, by 2050 it must be significantly reduced [23]. From an ecological standpoint, most aquaculture production includes the redirection and concentration of energy and resource flow from natural ecosystems to the cultural environment [13]. As a result, relatively few systems rely only on the sun’s radiation impacting the manufacturing site because of the limited surface area of many high-density culture systems that are exposed to sunlight [13]. In the study of Koričan et al. [1], energy consumption was analysed for the ship and feeding process, including an analysis of using renewable energy sources (RESs) in an alternative mariculture farm configuration. Through the example of a mariculture system in Croatia, it is shown that integration of RESs is comparable to conventional solutions over a lifetime. However, the remit of this study is rather narrow, considering only the basic energy needs of the fish cultivation process.

1.2. Technology Improvement

Technology in aquaculture production can greatly impact production in the long term. It can result in more precise data, control, and economic growth. Most of the technologies using artificial intelligence (AI), and Internet-of-Things (IoT) are based on measuring water parameters, like pH, water depth, temperature, ammonia, dissolved oxygen, salinity, etc. [24]. Oxygen depletion is characterized by a low level of Dissolved Oxygen (DO), which may cause fish deaths [24]. Another consideration is the pH of the water, which should be in the range from 6.5 to 9.0 [25]. The other criterion is the temperature of the water body, which varies depending on the fish species. Utilizing Internet of Things (IoT)-based devices to monitor aquaculture’s basic demands and assist in providing items required for fisheries can help maintain an ecofriendly environment for the fish [25]. In Table 1, the advantages and drawbacks of technology like AI, IoT, and blockchain are shown.

1.3. The Aim of the Paper

There are a number of recent publications dealing with sustainability and reducing the environmental impact of aquaculture farms, as well as those considering renewable energy from the sun, wind, and sea. However, all these references make the analysis boundaries rather too narrow, considering only one or two segments of the complete fish farming and fish processing pathway. To the best of the authors’ knowledge, there has been no study that reviews the energy needs throughout all fish farming, processing, and delivery stages, together with an analysis of alternative energy sources to reduce environmental impact and keep operating costs as low as possible.
The novelty of this review is a complete analysis of energy consumption for the whole aquaculture production cycle. Therefore, the overall process is logically structured into key phases, and for each phase, specific energy needs are determined. Then, the energy alternatives are considered, together with the potential environmental benefits.
The aim of this paper is to give a review of energy consumption in mariculture production, including the whole process. Nevertheless, the possibility of GHG emissions reduction in a sustainable way, with an increase in RES use, is given. Thereby, as an illustrative scheme, a conventional mariculture farm in Croatia is considered. The given model, with the relevant data, applies to other case studies, regardless of the country, type of production, and species.

2. Methodology

2.1. Structure of Fish Farming and Processing

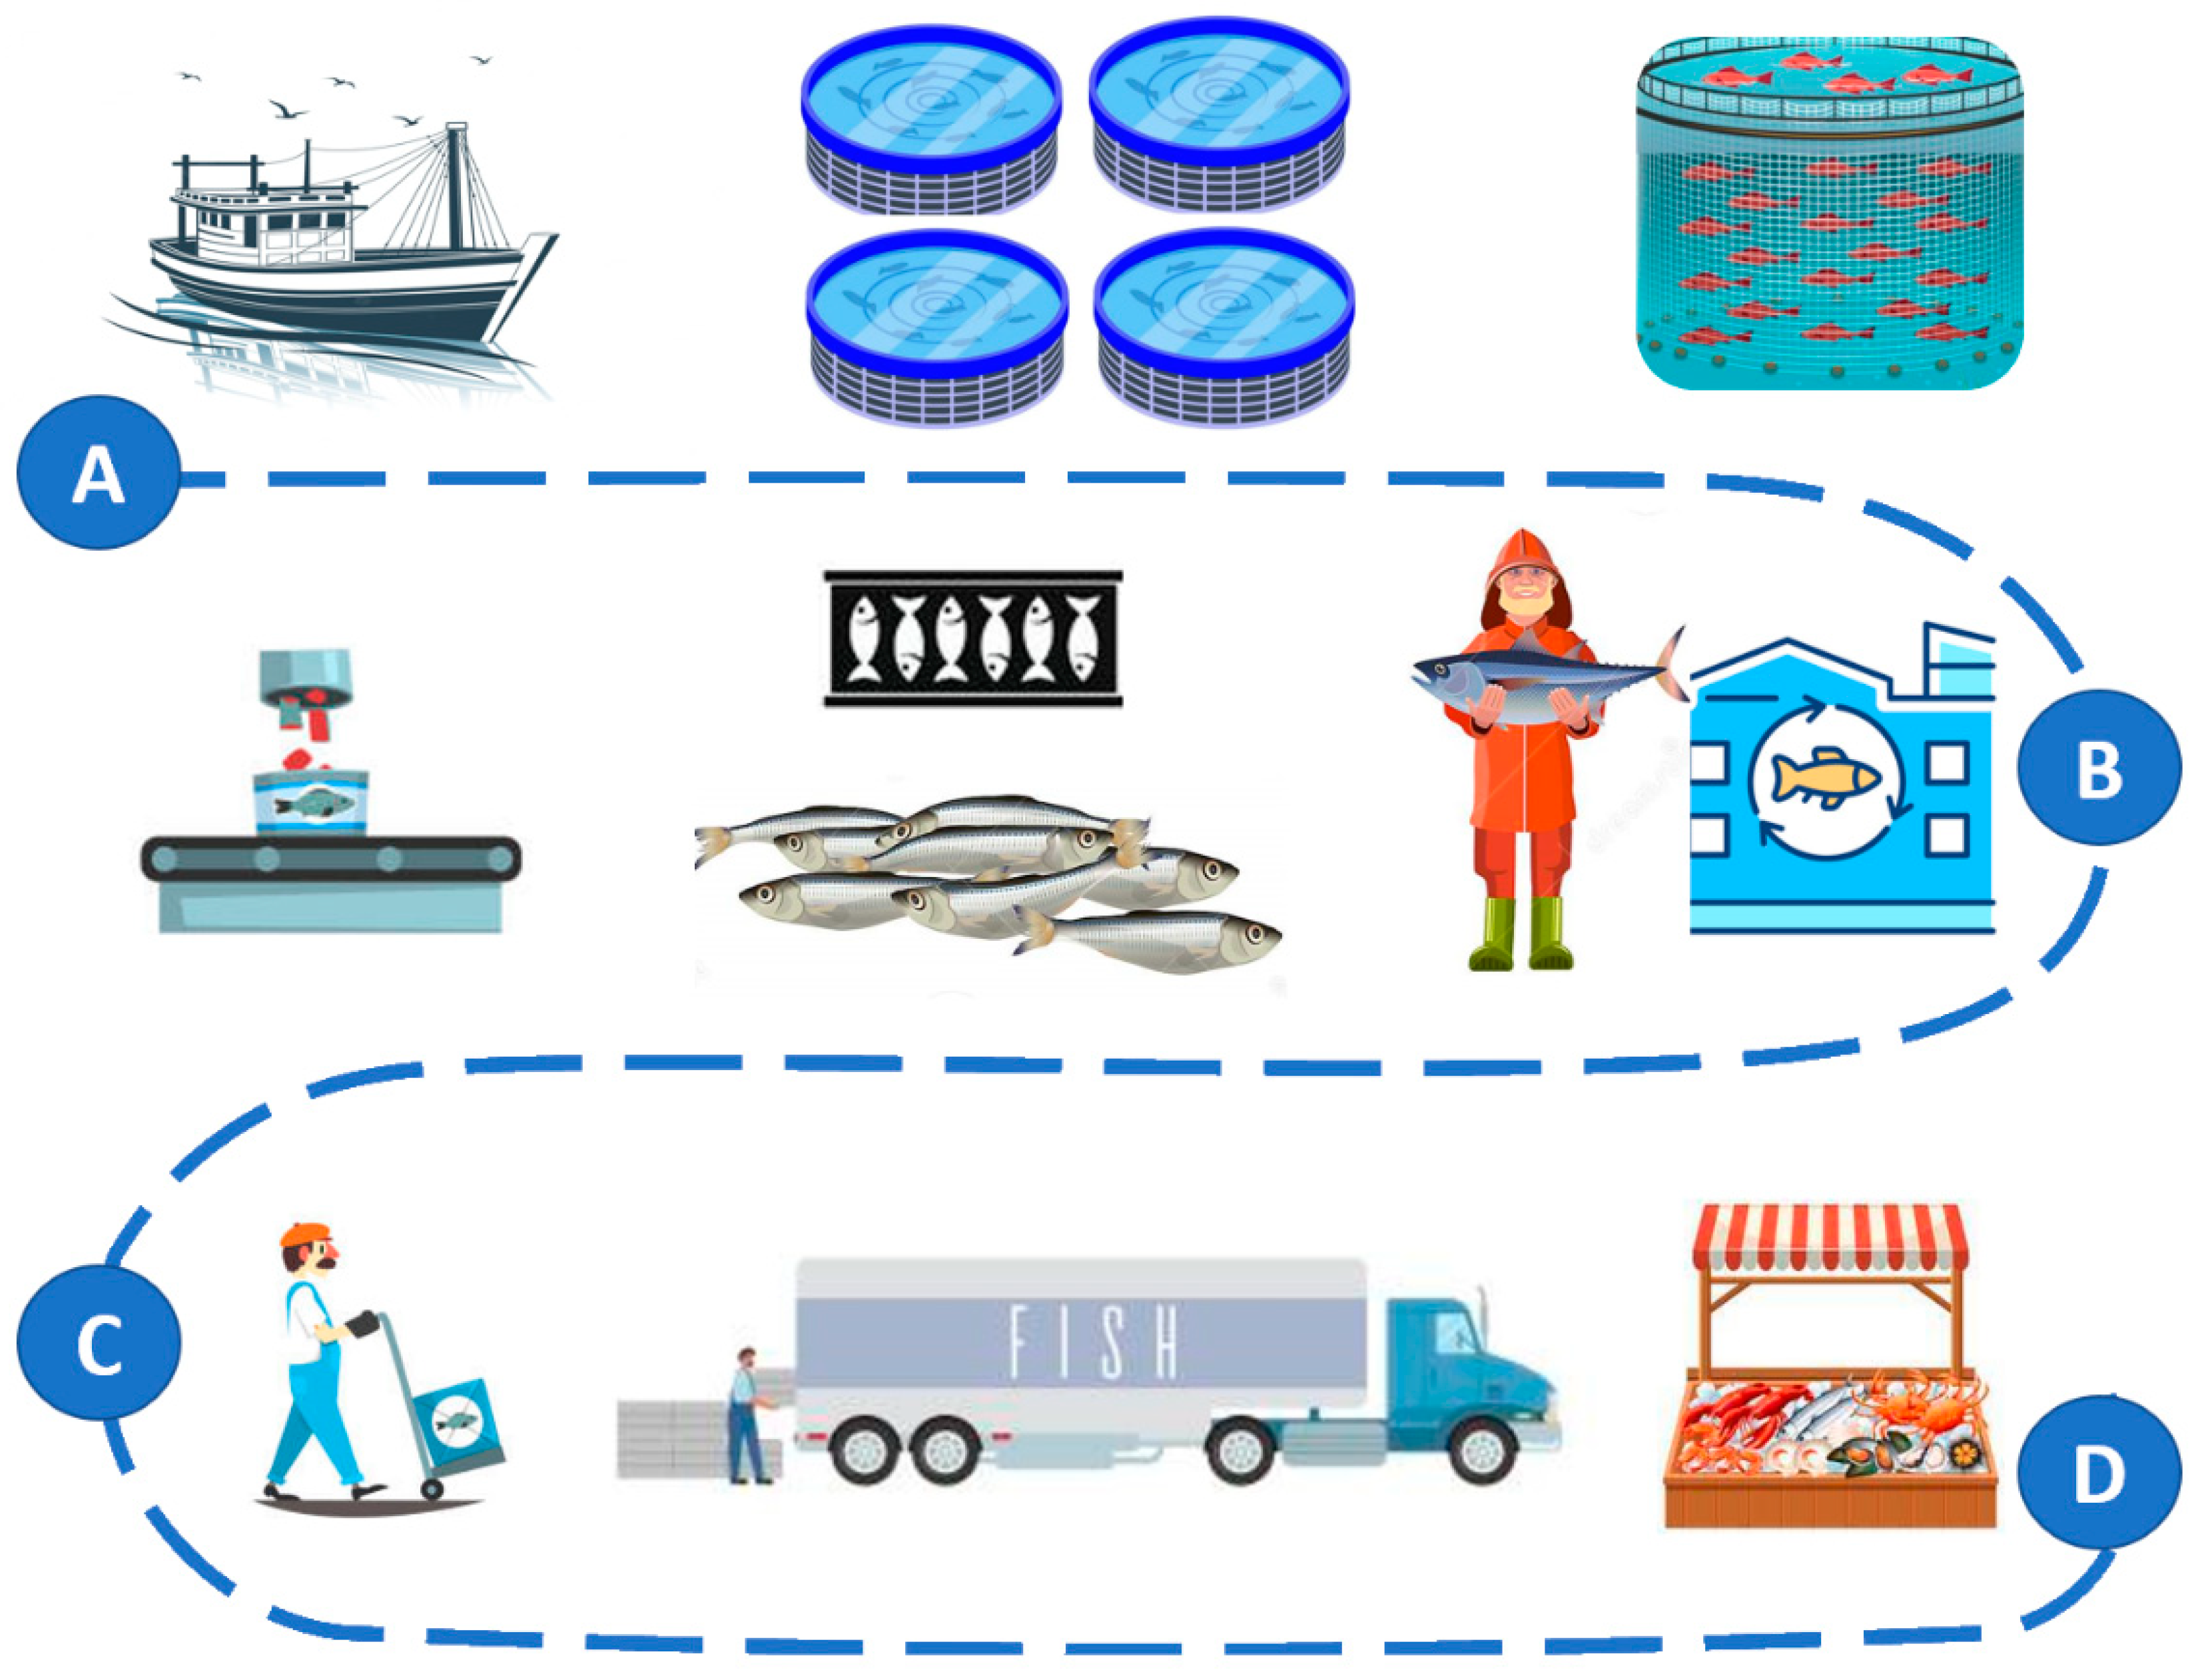
The production process of a typical aquaculture farm is divided into three phases, as can be seen in Figure 4, where a simplified scheme of a production process is shown. The first phase, between A and B, considers processes from the harbour to the cage. The second phase continues in the factory with fish processing, from B to C, and the third phase, from C to D, involves the distribution of the final product.
According to Troell et al. [13], direct energy consumption comes along with a range of processes such as harvesting, transport, collection or production of juveniles, and general production operations. Energy requirements in mariculture take place in water pumps, aeration systems, light, ice production, fridges, transport to the farm, feeder machines, freezers, air-conditioning, etc. [31]. In Figure 5, the energy used in aquaculture production is presented, showing that nowadays fossil fuels are needed for the working vessel and the distribution of the final product. However, electric energy is used for the automatic feeding machine and in the whole industry where fish is being processed and prepared for the market.
The first part of the energy consumption is related to the vessels, transport from the harbour to the cages, and the feeding machine. At sea, in the cages, energy is used for feeding machines, which are mostly positioned on a floating deck. Afterward, fish are transported to the factory, where the majority of the energy is used. In the factory, processes include sorting, washing, chilling, skinning, gilling, gutting, filleting, shucking, salting, drying, preserving, or canning (this step varies depending on which species of seafood is being processed and if it is sold fresh or frozen), storing, and dispatching [32]. The production process is finalized with transport from the factory to the marketplace, and in this phase, regular fossil fuel is used.
The usage of quality fish feed is one of the crucial factors in the whole fish farming process. Even though fish feed is the biggest aquaculture cost, every farm has a feeding system installed. Feeding machines use mostly granular food like seeds, cereals, pellets, etc., while feeding with fresh or frozen small fish is usually done manually. If the fish are being fed other smaller fish, it is usually done manually. Besides the vessel’s energy, the automatic feeding machine is also consuming some of the total energy. Fish feed production is the most expensive part of aquaculture production and also the largest contributor to GHG emissions in the sector [33]. Fish convert part of the eaten food into their biomass, and part is excreted as waste products of metabolism into the environment. The emission of a substance from a fish farm into the environment can be twofold, i.e., in particles (solid) or dissolved [34]. The consequence of the operation of the farm is increased emissions of organic matter, whose source is the faeces of cultivated organisms and uneaten food.
The production process continues in the factory. It begins with fish sorting, then cleaning and cutting. After that, depending on the fish species, the fish are prepared with machines that use electric energy. Some of the machines used in the factory are precookers, heat exchangers, fridges, freezers like IQF (Individual Quick Freezing), autoclaves, conveyor belts, etc. [35].
Fish transportation can be conducted by road, air, or sea. Railroads do not have a common means for seafood transport, so this is not an option in most countries [36]. Fresh fish is stored at low temperatures, from 0 to 4 °C. Distribution is carried out by a closed means of transport. Frozen fish, packed in cardboard boxes, are placed on pallets and stored in chambers at a temperature of –18 °C [37]. There are two main tasks when cooling fresh fish: rapid temperature reduction, to the desired low temperature of around –1 °C; and temperature maintenance during storage and transport [37].
Packaging plays an important role in maintaining the desired product temperature, especially if ambient temperature fluctuations are frequent [37]. Developed countries transport fish in temperature-controlled vehicles [36].

2.2. Energy Consumption in the Considered Phases

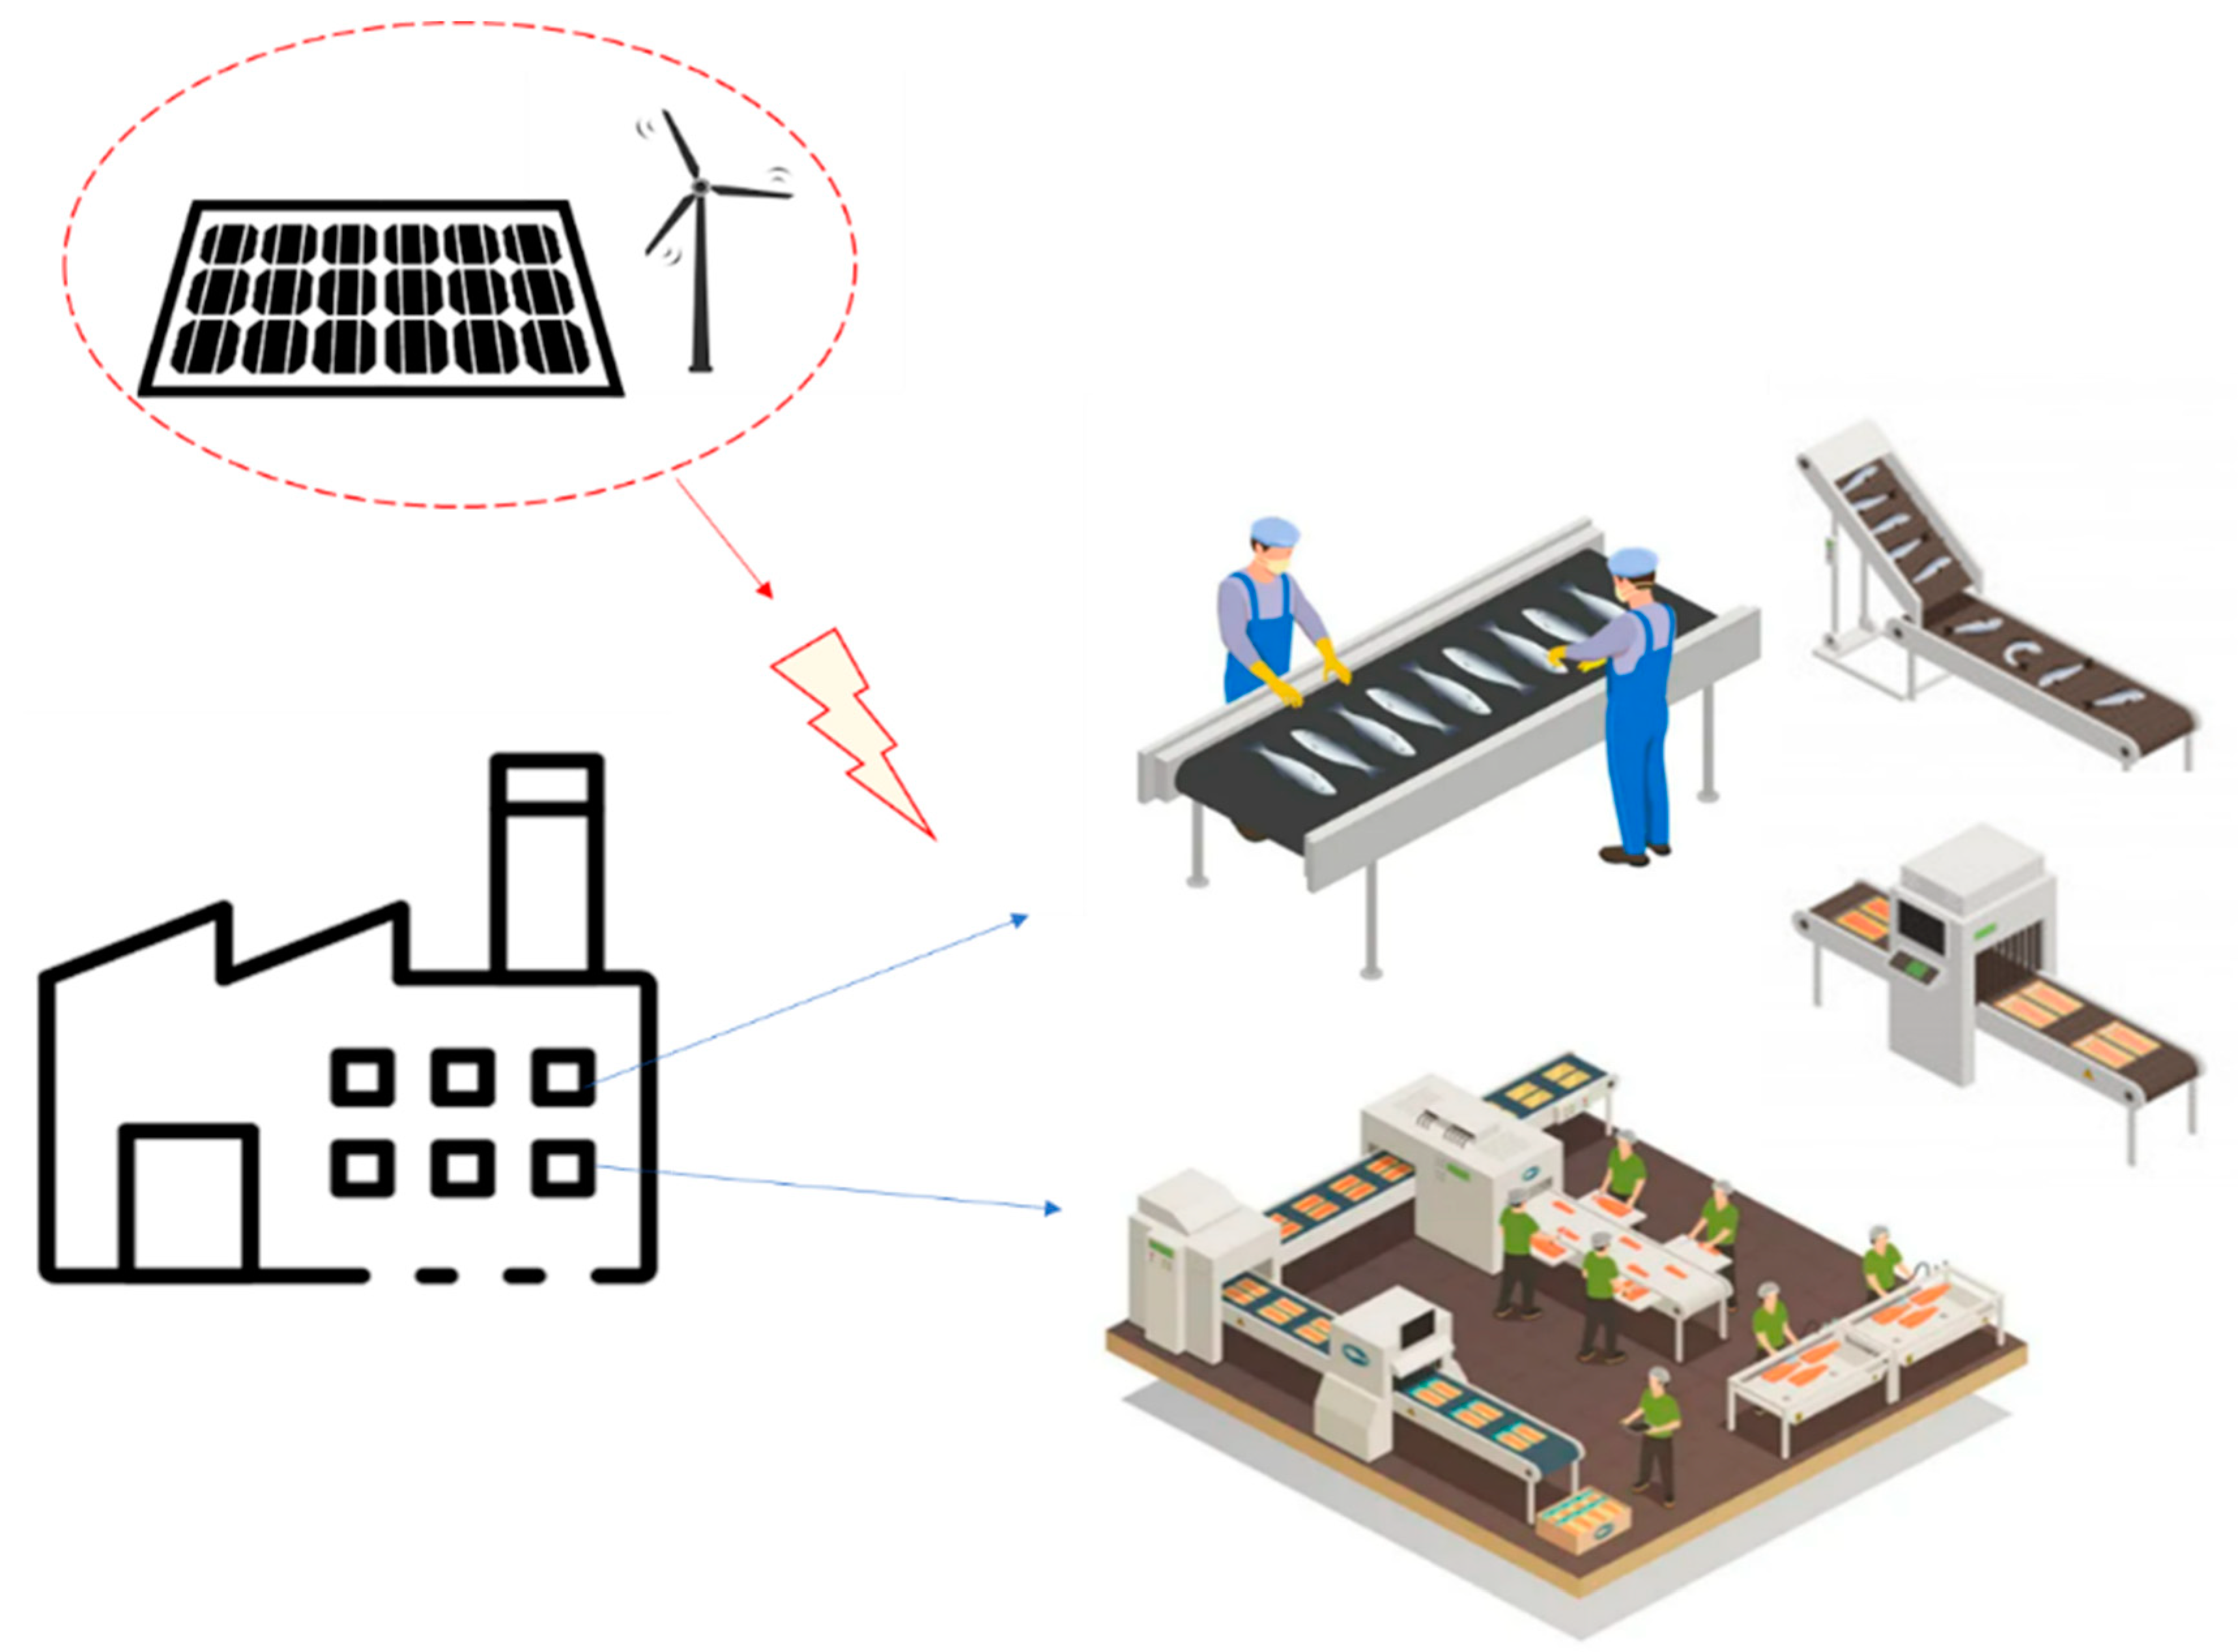
To assess the total energy consumption, it is necessary to determine the energy used in each part of the production process, as presented in Figure 6. Figure 7 shows alternative aquaculture.
Depending on the technical and operating characteristics of the working vessels, the energy needs, and consequently the fuel consumption, can vary significantly [38]. Generally, the power needs include propulsion (main needs) and some auxiliary needs that are regularly considered as a share of the main power needs. So, the energy needs should be determined for each aquaculture system separately, due to possible scattering in characteristics of different vessels to fuel different aquaculture systems. The feeding process is operated by the feeding machine, which is supplied by electric energy. During one fish production cycle, which lasts for 24 months, 10,554 tonnes of feed are needed for the production of 5030 tonnes of fish, i.e., for the total farming process during one cycle [2], indicating that about 2.1 kg of feed is required per 1 kg of fish. According to the data for the feeder machine [39], the feeder consumes 4 kWh of energy to emit 150 kg of food in an hour. In 2 h, for all cages at the farm, the feeder releases 300 kg of food and consumes 8 kWh of energy. The energy consumption for 1 kg of discarded food is calculated according to Equation (1):
E C F k g = E C F p f D F p f ,
where ECFkg (kWh/kg) is for the energy consumption of the feeding machine per kilogram of dispensed food, ECFpf is the total energy consumption per feeding machine in a day, and DFpf is the total weight of dispensed food per feeding machine in a day. According to that, the total energy consumption of the daily amount of thrown food per day is calculated by Equation (2):
E C t o t a l = D F t o t a l *   E C F k g ,
where ECtotal (kWh) is the total energy consumption of all feeding machines in one day, and DFtotal is the total food dispensed by all feeding machines in a day.
The EC in onshore facilities depends on the activities that take place during the production; for this case study, the overall EC was obtained directly from the fish farm owner. The total energy used in the production process in the factory was examined. The energy consumption of different machines is important to know for further fish processing, which can be seen in Figure 8, and depends on the factory, equipment, and processes used. In the case where both salted and smoked fish are processed, the plant also uses other energy sources such as wood and heating oil [40]. According to Thrane et al. [32], some of the companies use smaller pumps, automatic door openers, reduction of idling of production equipment, more efficient machines, etc. The indicators for energy consumption are more complex and require the use of a Life Cycle Assessment (LCA).
Transportation of the final product is regularly performed by road vehicles like trucks that regularly use diesel as fuel. Energy consumption depends on the distance from the factory to the marketplace. The total amount of fish produced in one year is calculated from the data from [2] over two years, and further calculated per one day. According to Andersen [41], the energy use per product unit in transportation is 0.2 kWh/kg; by multiplying the energy use by the number of fish produced per day, the total energy consumption in the transport phase was calculated. The total energy consumption (Etotal) was calculated by adding up the energy needs in all production phases, where E1 is the energy used for powering the working vessel and for the feeding process, E2 in the industry part, and E3 for the transportation, as shown in Equation (3):
E t o t a l = E 1 + E 2 + E 3 .

2.3. Implementation of Alternative Power Options

2.3.1. Alternative Power Options for the Vessel

In the first phase of production, for the working vessel, alternative fuels can be considered, such as electricity, LNG (liquefied natural gas), biodiesel, ammonia, methanol, etc. [42]. For a better understanding of the economically acceptable options, the total costs of these fuels were analysed by a Life Cycle Cost Assessment (LCCA) [42,43]. The environmental effect of alternative power options was assessed by LCA, as can be seen in [1,42,43], where electrification regularly appears as the most environmentally friendly option. However, LCCA provides additional information on the economic pillar of sustainability and should be conducted in order to identify economically viable solutions. Complete information on the feasibility of different alternatives is therefore derived from LCA (which is considered in detail in [1] for the first phase of the production process) and the LCCA presented in this paper, which tackles the complete aquaculture production process. LCCA considers the total cost of a power system design over the 10 cycles of a production process. One production cycle lasts for 2 years, and the total ship lifetime is about 20 years, so in total, there are 10 production cycles when analysing the whole life cycle of a product, including the lifetime of a ship. Investment costs are capital expenses incurred at the start of production, maintenance costs are associated with equipment and its replacement, and fuel costs examine the fuel used for the vessel’s operations.
  • LCCA of diesel-powered ship
The cost of a new diesel engine for each ship considered is estimated by multiplying the ship’s average power by the expected conversion factor of EUR 250/kW [43]. The diesel price (PRD) is obtained from [44]. The life cycle fuel costs (LCFCD) are calculated using Equation (4) [43]:
L C F C D = L T * F C D * P R D ,
where LT is the lifetime (the production process lasts for 2 years and the ship’s lifetime is 20 years, so there are 10 production cycles) and FCD is the fuel consumption of a diesel-powered system. According to Christos [45], the maintenance cost of a diesel-powered ship is expected to be EUR 0.014/kWh. EC stands for the energy consumption of the ship. Maintenance costs are calculated by Equation (5) [43]:
L C M C D = L T   *   E C   *   0.014 .
  • LCCA of an electric-powered ship
The high capital cost of Li-ion batteries is one of the barriers preventing their widespread adoption. The cost of retrofitting a ship with a battery is 45% of the battery price, with the remainder representing installation, electric engine, and additional equipment expenditures [45]. Battery capacity, BC (kWh), is calculated by Equation (6) [1]:
B C = 1.5   *   E C .
When the safety regulations of the battery are taken into account, the required capacities increase by 50% [1]. Investment costs (IC) are calculated via Equation (7) [1]:
I C = B C * B P 0.45 ,
where BP is the battery price, which, according to Perčić et al. [43], is EUR 200/kWh; 45% is battery replacement costs, and the rest is other equipment. The life cycle fuel consumption of electric-powered system, LCFCE, is calculated using Equation (8) [43]:
L C F C E = L T   *   E C   *   P R E ,
where PRE is the price of electric energy [46]. Life cycle maintenance costs, LCMCE, are calculated using Equation (9) [43]:
L C M C E = ( B C   *   B P 2030 ) + L C ,
where BC is the battery capacity and BP2030 is the battery price in 2030, which is assumed to be EUR 169/kWh according to Ioannis et al. [47]; LC is landfill costs and is considered to be part of the maintenance costs. According to Lima et al. [48], the total cost to recycle lithium batteries is approximately EUR 26.79/kWh.
  • LCCA of an LNG-powered ship
Natural gas can now be utilized in a monofuel gas engine (Otto cycle) or mixed with a diesel engine in dual-fuel engine, which is more efficient than a monofuel engine [49]. This engine provides a smooth transition from one fuel (diesel) to another (natural gas) during the ship’s operation with no loss of power or speed [43]. To calculate the life cycle cost assessment of the LNG-powered ship, the fuel consumption must be calculated first. In Equation (10) [43], the fuel consumption for natural gas is calculated, and for the pilot fuel in Equation (11) [43].
F C N G = X N G   *   E C   * S F C N G
F C P N G = X P N G *   E C   *   S F C P N G
FCNG stands for fuel consumption of natural gas; XNG is 99% natural gas and 1% pilot fuel, which is diesel (XP−NG). SFCNG stands for the specific fuel consumption for natural gas, which is 154.4 g/kWh, and SFCP−NG for the specific fuel consumption of pilot fuel, which is 1.8 g/kWh [43]. The conversion rate for a freshly constructed LNG system is roughly EUR 1160/kW, which includes the engine and any other equipment such as the storage tank [50]. The price of 1 kg of LNG in Europe ranges from EUR 0.95 to EUR 1.1 [43]. The life cycle fuel consumption L C F C L N G for the LNG is calculated based on Equation (12) [43]:
L C F C L N G = L T *   ( F C N G * P R L N G + F C P N G * P R D ) ,
where LT means the lifetime, FCNG and FCP−NG denote natural gas (LNG) and pilot fuel use, respectively, and PRD denotes the diesel price. The cost of LNG technology maintenance is EUR 0.015/kWh [51]. Equation (13) [43] calculates the life-cycle maintenance cost of an LNG-powered ship (LCMCLNG):
L C M C L N G = L T * E C * 0.015 .
  • LCCA of a B20-powered ship
The use of biodiesel does not necessitate the upgrading of diesel infrastructure. As a result, the maintenance and investment costs of a B20-powered ship are identical to those of a diesel-powered ship. Because there are no longer incentives for using biodiesel as a fuel in Croatia, the price of pure diesel is considered to be the same as the standard price of Croatian diesel, which is EUR 1.64/kg [44]. The life-cycle fuel cost (LCFCB20) is then computed by taking into account the diesel price (PRD), biodiesel price (PRBD), lifetime (LT), fuel consumption of a B20-powered ship (FCB20), and proportions of different fuels in the mix (XD and XBD) in Equation (14) [43]:
L C F C B 20 = L T *   F C B 20 *   ( X D * P R D + X B D * P R B D ) .
Besides these alternative fuels, there are also other possibilities that are worth mentioning, like ammonia, methanol, hydrogen, CNG (natural gas), etc.

2.3.2. Alternative Power Options for the Fish Processing

For the second phase of the production, electric energy is used for operating the plant. Assuming that most of the electric energy comes from a diesel generator, modifications are needed to achieve a more environmentally friendly power system. The use of RESs has high importance in aquaculture production. The application of new energy technologies in aquaculture has been studied, with encouraging results [8]. Solar irradiation and photovoltaic technology are well known in the Mediterranean [17].
Using solar panels, photovoltaics (PV) or wind turbines can have a positive impact on sustainability. The costs of PV and wind turbines are analysed and compared with today’s electric energy price. Considering that the area and factory with all equipment are standard, without any changes, the influence of the energy consumption is taken into account. The PV-cell power system layout is heavily influenced by weather conditions and available installation space. Ančić et al. [52] used Equation (15) to compute the total yearly energy production, EPV (MJ):
E P V = η P V * E R A D * A ,
where ηPV is the efficiency of the system, ERAD stands for average solar irradiance, and A denotes the area in m2.
The power output of a PV system PPV (kWh) is calculated by dividing the calculated EPV by the number of daily solar hours ts (h).
Using the energy from wind turbines depends on the location and wind density. Wind power is calculated by Equation (16) [1]:
P W = 1 2   * ρ * A W * v 3 ,
where ρ in kg/m3 is the air density, AW is the area of a turbine, and v is the wind speed (m/s). With Equation (17) [1], the area of the turbine can be calculated, where D stands for diameter of the turbine [1]:
A W = D 2 * π 4 .
The LCCA of a wind and PV-cell-powered system configuration comprises the PV system investment costs, which are calculated by multiplying the PV cell investment cost (€/kW) by the total power of the PV system (kW), as well as the cost of a wind turbine [1]. The wind turbine, according to Hadžić et al. [53], is EUR 3000/kW, and the PV system EUR 1116/kW, according to Koričan et al. [1]. A PV system’s maintenance cost is considered to be 20% of its investment cost, whereas a wind turbine’s maintenance cost is estimated to be 10% of its investment cost.

2.3.3. Alternative Power Options for the Fish Distribution Process

The last phase of the production is transportation. Most delivery trucks operate on diesel-powered systems. To have environmentally friendly delivery, fully electric and hybrid system are analysed and compared to the costs of a diesel engine. Further on, for the distribution, a truck with a refrigerator is used. The trucks are still powered by diesel engines, but the use of electricity presents a more environmentally friendly powering method. For life cycle costs of the truck powered by a diesel engine, the price of the diesel (PD), power of the engine, diesel engine power (PDE), and maintenance costs are calculated. In Croatia, the current price of the diesel is EUR 1.63/L. According to Klanfar et al. [54], specific fuel consumption is considered to be 0.22 kg/kWh, which, multiplied by the energy consumption, gives us the fuel consumption (FC). According to Equation (18) [43]:
L C F C D = F C   *   P D   *   L T ,
the life cycle fuel costs for diesel-powered engine, L C F C D , were calculated for a specific number of km that a vehicle travels in a day, for 20 years, which is 10 cycles. In one year, it is concluded that delivery happens only on weekdays, an estimate of around 260 days [55], so to calculate the lifetime, one year is considered to be the 260 days on which delivery is operating.
Investment costs consider the price of the diesel engine power and price of the engine. The maintenance costs for this kind of engine are set at EUR 0.088/kWh, according to Zhao et al. [56]. The life cycle maintenance costs are calculated by Equation (19):
L C M C D = ( E C   *   0.088   *   L T ) + L C ,
where EC denotes the energy consumption and LC landfill costs, which are EUR 26.79/kWh [48]. Investment in electric delivery trucks may still be challenging because of the growing industry but, considering the costs of replacing the old engine powered system with only electrified, as previously mentioned, it is assumed that costs are reduced by 45% because of the equipment already in place. Investment costs are calculated by Equation (7). The maximum capacity for distribution trucks is 240 kWh [57]. According to Zhou et al. [58], the battery price is EUR 354/kWh, and the replacement of the battery after 10 years with an assumption of lower battery price of EUR 247/kWh. the electricity price in Croatia for non-household use is EUR 0.078/kWh [46]. Maintenance costs include the replacement of the battery, which, according to Zhou et al. [58], is EUR 246.50/kWh. The life cycle fuel costs are calculated by Equation (20):
L C F C E = E C   *   P E   *   L T ,
where EC is energy consumption, PE the price of the electricity, and LT the lifetime.
Some of the new technologies that are being integrated in production are recirculating aquaculture systems (RAS) and integrated aquaculture [59]. RAS are indoor fish farms with rearing systems where purifying water and removing toxic metabolites and waste are carried out with biofiltration [60]. It is one of the solutions for ecologically sustainable and economically profitable production, and can take place in either urban or rural environments [61]. Although this method can have high costs, it is good for the environment, productive, and profitable in the long term. In such controlled systems, better feed conversion is achieved, which means that less waste generated by feeding goes into the environment [62]. Bohnes et al. [63] used the methodology for sustainable aquaculture, first identifying important laws and regulations, and then using economic equilibrium modelling to create realistic future-oriented scenarios for the aquaculture sector, which are then coupled with life cycle assessment concepts. Fish behaviour can be monitored using machine vision and sonar technologies, which are successful according to Shainee et al. [64]. Offshore farming, with depths of 15–40 m, has good water exchange with water currents and higher output [65], but also some disadvantages given changeable weather conditions, as in Norway [64]. A fishing machine, whose task is primarily to solve the problem of how to elevate the target of manufacturing objects without injuring them in the offshore farming, and to reduce human work, should utilize classification equipment, machine vision, and other technologies to automatically filter the finished fish based on monitoring system data, fish growth model, fish volume, and so on [65]. The use of mollusc production to increase carbon sequestration and seaweed culture in coastal locations to reduce aquatic nutrient loadings are also important examples of how aquaculture methods can be environmentally friendly while also contributing to socioeconomic development [66]. Antonucci and Costa [67] stated that some technologies, such as acoustic and optical sensing technology, which provide feeding control and sizing system solutions, are still ready to be adopted or commercialized for precision aquaculture. Quijera et al. [35] analysed the integration of a solar thermal system with a heat pump in a tuna factory. The energy potential of this integration for a production process operating at medium or low temperatures has shown good potential for reducing total energy consumption. According to Kassem et al. [68], a smart and sustainable farm is built on the hybrid aquaculture idea, which combines the benefits of recirculating aquaculture systems, zero-water discharge, and smart technology. Antonucci and Costa [67] stated that some technologies, such as acoustic and optical sensing technology that provides feeding control and sizing system solutions, are ready to be adopted or commercialized for precision aquaculture.

3. Case Study

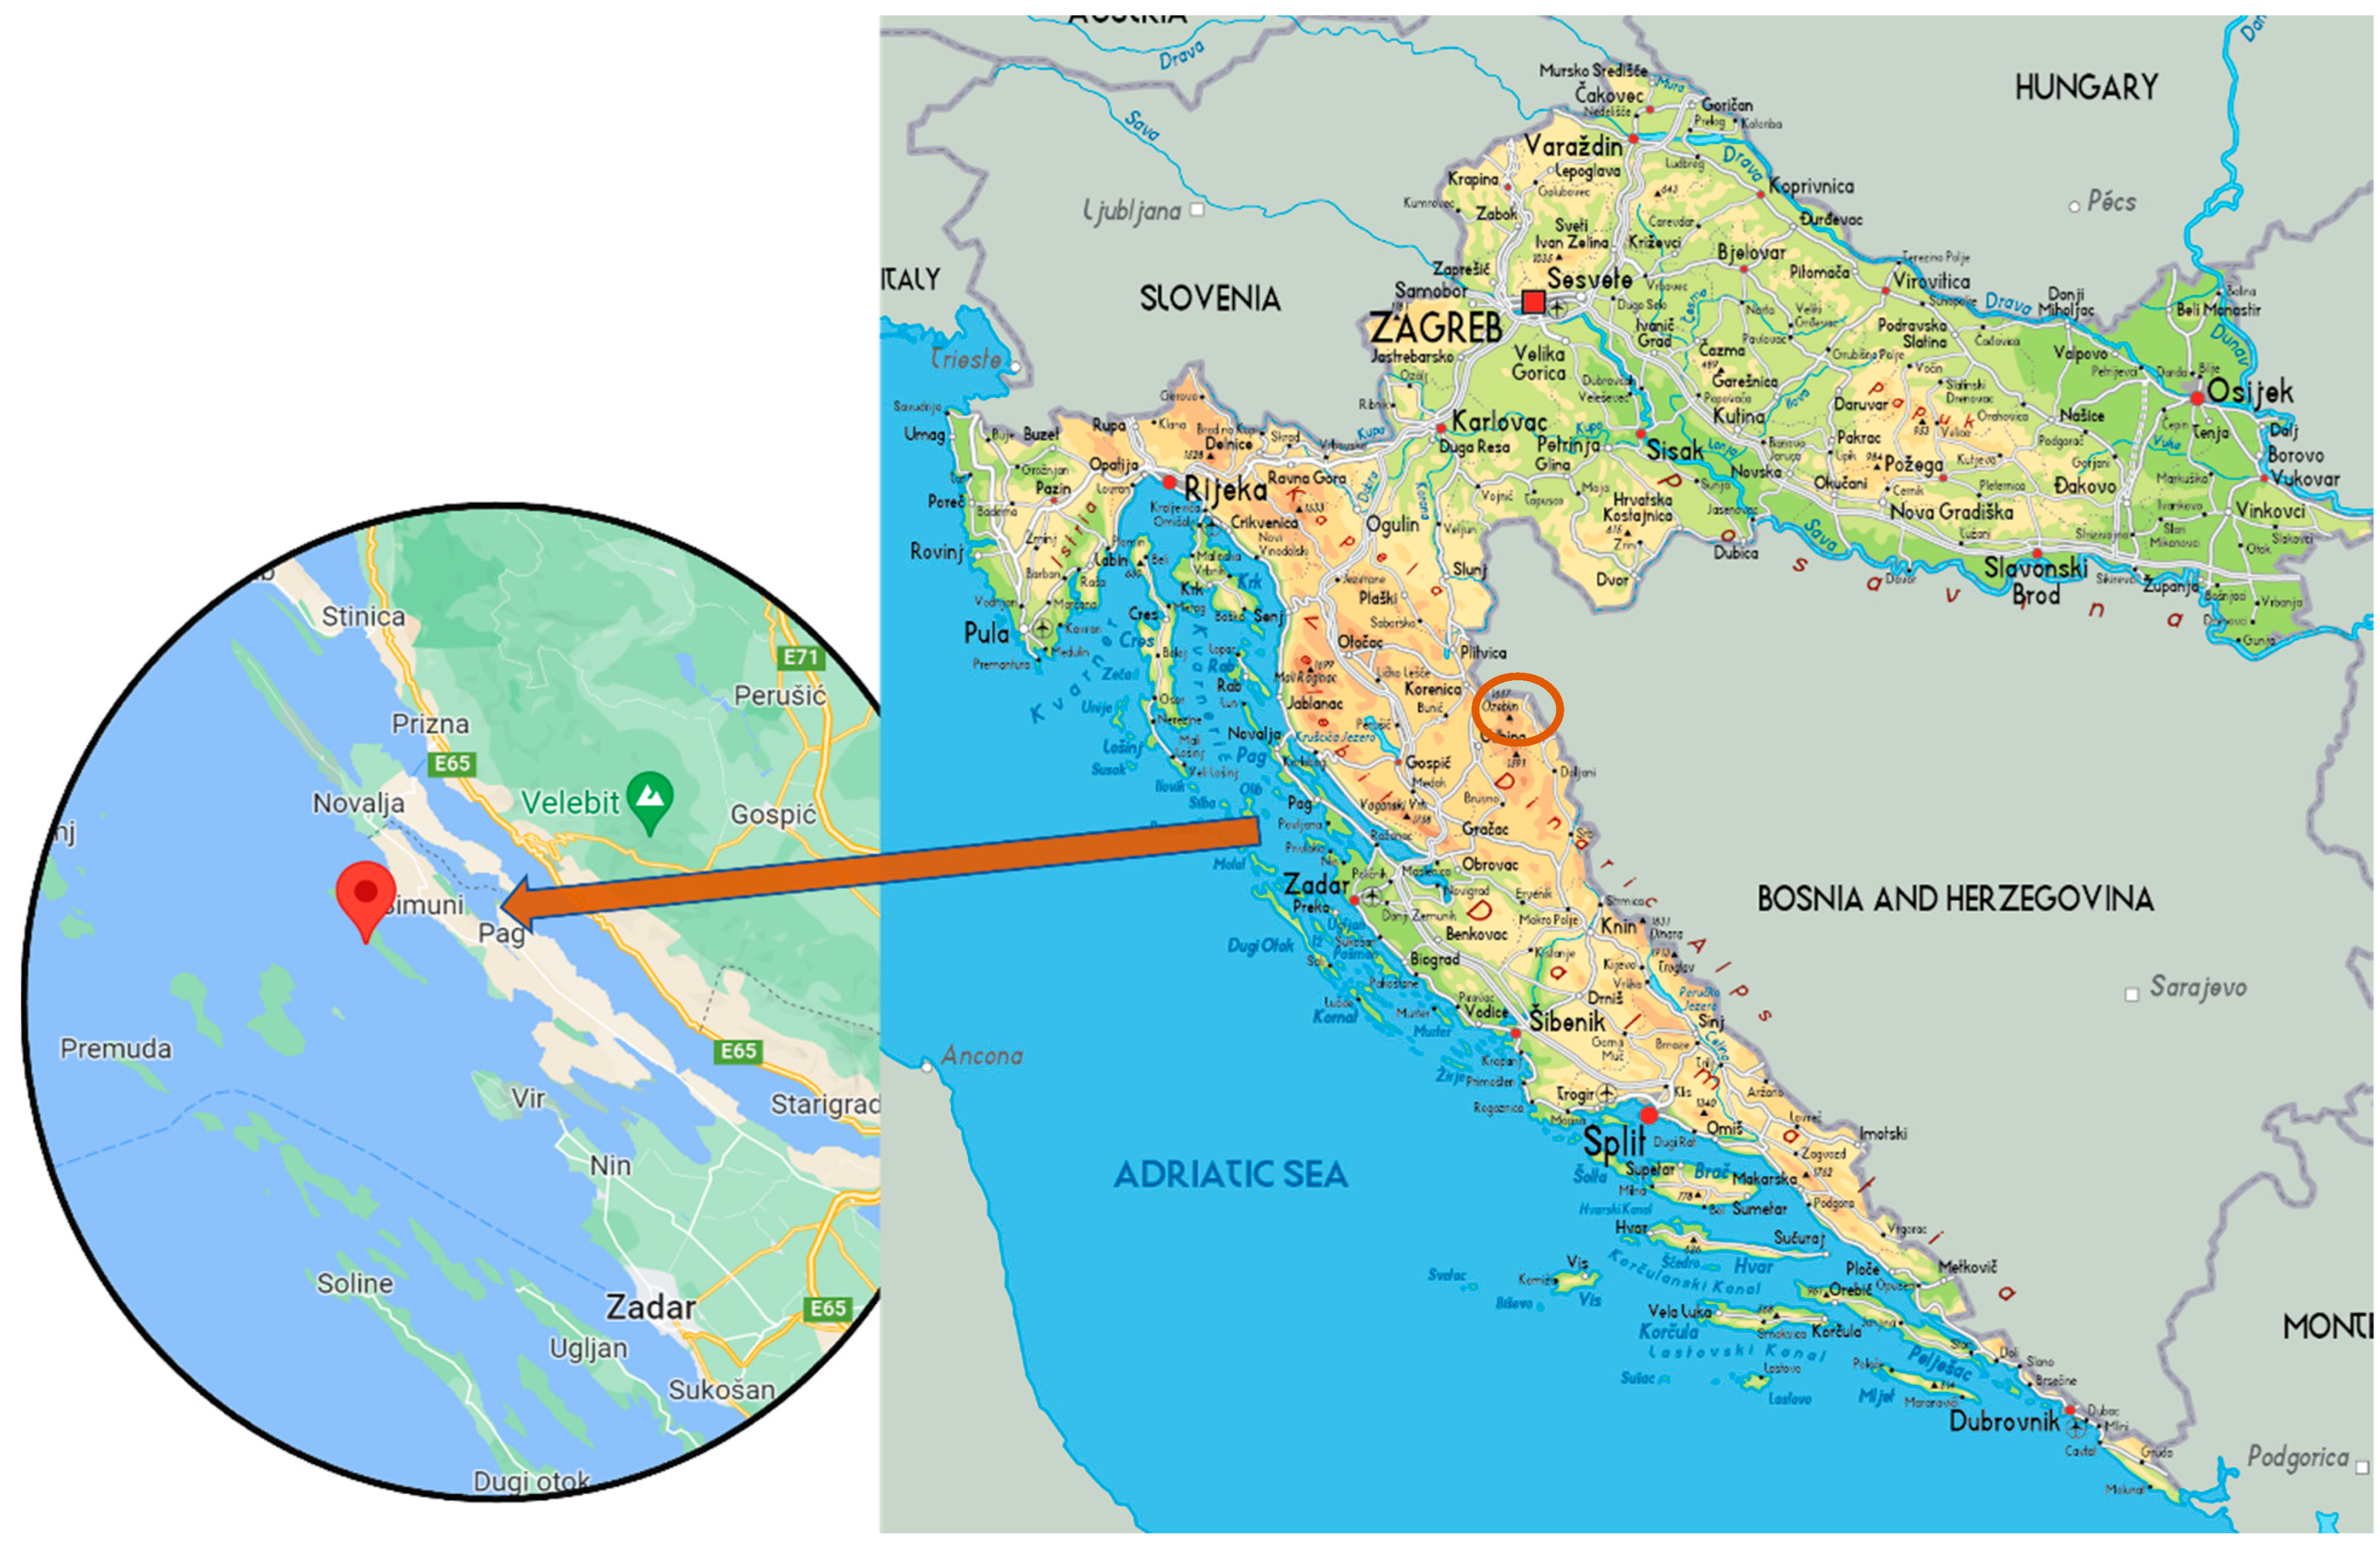
In the Republic of Croatia, mariculture includes the breeding of white fish, blue fish (tuna), and shellfish. According to the Ministry of Agriculture, Republic of Croatia [69], the total mariculture production in 2020 was 18,992 tonnes. Sea bass (Dicentrarchus labrax), sea bream (Sparus aurata), tuna (Thunnus thynnus), and mussels (Mytilus galloprovincialis) are the most important breeding species in Croatian mariculture, which is developing intensively and recording a constant increase in productivity and employment. Zadar county is known for the largest farms of white fish and tuna [70]. The investigated farm, whose location can be seen in Figure 9, has a volume of 25,000 m3 per cage, with a total of 48 floating feeding machines and round shape cages with a diameter of 50 m. According to Haramina [2], the total amount of produced fish after two years was 5,030,000 kg.
Cages are placed at least 300 m from shore [71]. Feeding the fish can be performed manually or by machine, depending on the fish size, temperature, and biomass of the food [2]. Feeding machines are placed on a floating platform, and release the food on a timer, or in connection to pipes, and spread the pellets in a homogeneous way [72]. Fingerlings (weighing from 2 to 10 g) are most often placed in cages in spring and early summer. Already during the summer of the first breeding year, it is necessary to transfer the fingerlings to a bigger cage, in which they remain until they weigh about 150 g, at the beginning of the summer of the second breeding year [2]. Then, they are transferred to cages with a diameter of 50 mm, where they remain until caught for sale. The fish reach consumption size (300–400 g) in the second growing year, but the final product for the sale, because of continuity in the market, determines the growth cycle of three calendar years [2]. Food consumption for breeding of one generation, which lasts 83–110 weeks, is 10,500 t, and the conversion index is 2.1 kg of food per kg of fish [2]. The number of meals can vary from one to six meals a day, depending on the size of the fish and the season (summer or winter) [33]. Vessels are used for transporting the workers to the farm and back. According to Koričan et al. [1], 250 kg is the daily fuel consumption for the vessel used for the transport from the harbour to the aquaculture farm. The most common fuel used for vessels in Croatia is “Eurodiesel Blue,” which is a combination of diesel and 0.5% sulphur [1]. According to Koričan et al. [1], this fuel is diesel coloured with blue dye. The crude oil used for production is imported from the Middle East to Croatia via tankers and pipelines [73]. The price of the “Eurodiesel Blue” is EUR 1.13/L [44], but because that cost is rising, alternatives need to be considered. According to Koričan et al. [1], for these vessels, the fuel consumption is 400 kg/t of the total weight (ice, fish, feed, etc.).
Nowadays, most feeders are automated and the estimated energy consumption was obtained from [39]. The price of electric energy is EUR 245.58/MWh in Croatia in 2022 [46]. In the plant for processing part of the caught fish, sorting, labelling, and packaging are done, but there may also be a process by which smoked and marinated fish products are produced [74]. Fish processing can be divided into the primary processing of raw fish, and the production of fishery products—secondary fish processing [37]. Geographically, this area of Croatia has good potential for renewable energy sources because of the abundance of sunny hours (ts), especially on the Adriatic coast, where this farm is located: horizontal irradiation is 5471 MJ/m2 a year [75]. Wind also represents potential energy, and makes a significant contribution to the total energy in Croatia. The most important wind types are “Jugo”, which blows from the south, and “Bura”, which blows from the northeast [76]. According to Ančić et al. [52], there is an average wind velocity of 6.5 m/s, used in this paper, a wind density of 1.2 kg/m3, and a temperature of 20 °C n. According to For Fish [77], anything over 1000 m2 is considered a large fish factory. For the purposes of this paper, an area of 1000 m2 was assumed for PV cells next to the factory wind turbines. According to Koričan et al. [1], the module area is 1.64 m2 with a power of 0.24 kW. According to wind-turbine models [78], a 20-kW powered turbine has been selected, with a diameter of 10 m and swept area of 78.5 m2.
Packaged fresh fish are further stored or frozen and ready for the market. For the purposes of this paper, a route from Zadar to Zagreb, and back to Zadar, was considered. For energy consumption, a value of 1 kWh/km [58], the total energy for one day, there and back, is 576 kWh/day. According to Klanfar et al. [54], for delivery trucks, the diesel engine power is 164 kW for a load capacity of 4410 kg [79], and the price of the diesel engine considered is EUR 16,560.64 [80]. For the more than 16 t of produced and delivered fish per day, four distribution trucks are needed.

4. Results and Discussion

The results of the analysis of the total energy consumption in the mariculture process are shown in Table 2 [1]. According to Prussi et al. [81], CO2 emissions are expected to rise to 270% by 2050. The specific fuel consumption is constant for the diesel-powered system, 0.215 kg/kWh [82]; dividing fuel consumption from specific fuel consumption, the energy consumption used only for the fuel in the vessel was 1162 kWh. Reducing the EC and fish production to a daily level, an energy consumption of 0.072 kWh/kg of fish per day was calculated.
Taking into account a daily feed consumption of 14,457 kg, the EC for 48 cages was calculated at 0.0242 kWh/kg fish per day. Furthermore, the energy consumption for the fish processing was 0.0379 kWh/kg fish. For 16,121.80 kg of fish per day, approximately four delivery trucks are needed, and thus, the energy consumption is 0.1428 kWh/kg of fish in a day. The total energy used for the whole mariculture production process of 24 months is given in Table 3.
In Figure 10, the main energy sources for Croatian electricity are shown, except nuclear energy, which is produced in Slovenia [83]. Most of the energy used in the mariculture process is electric. The environmental impact depends on what kind of electric energy is used, from which sources.
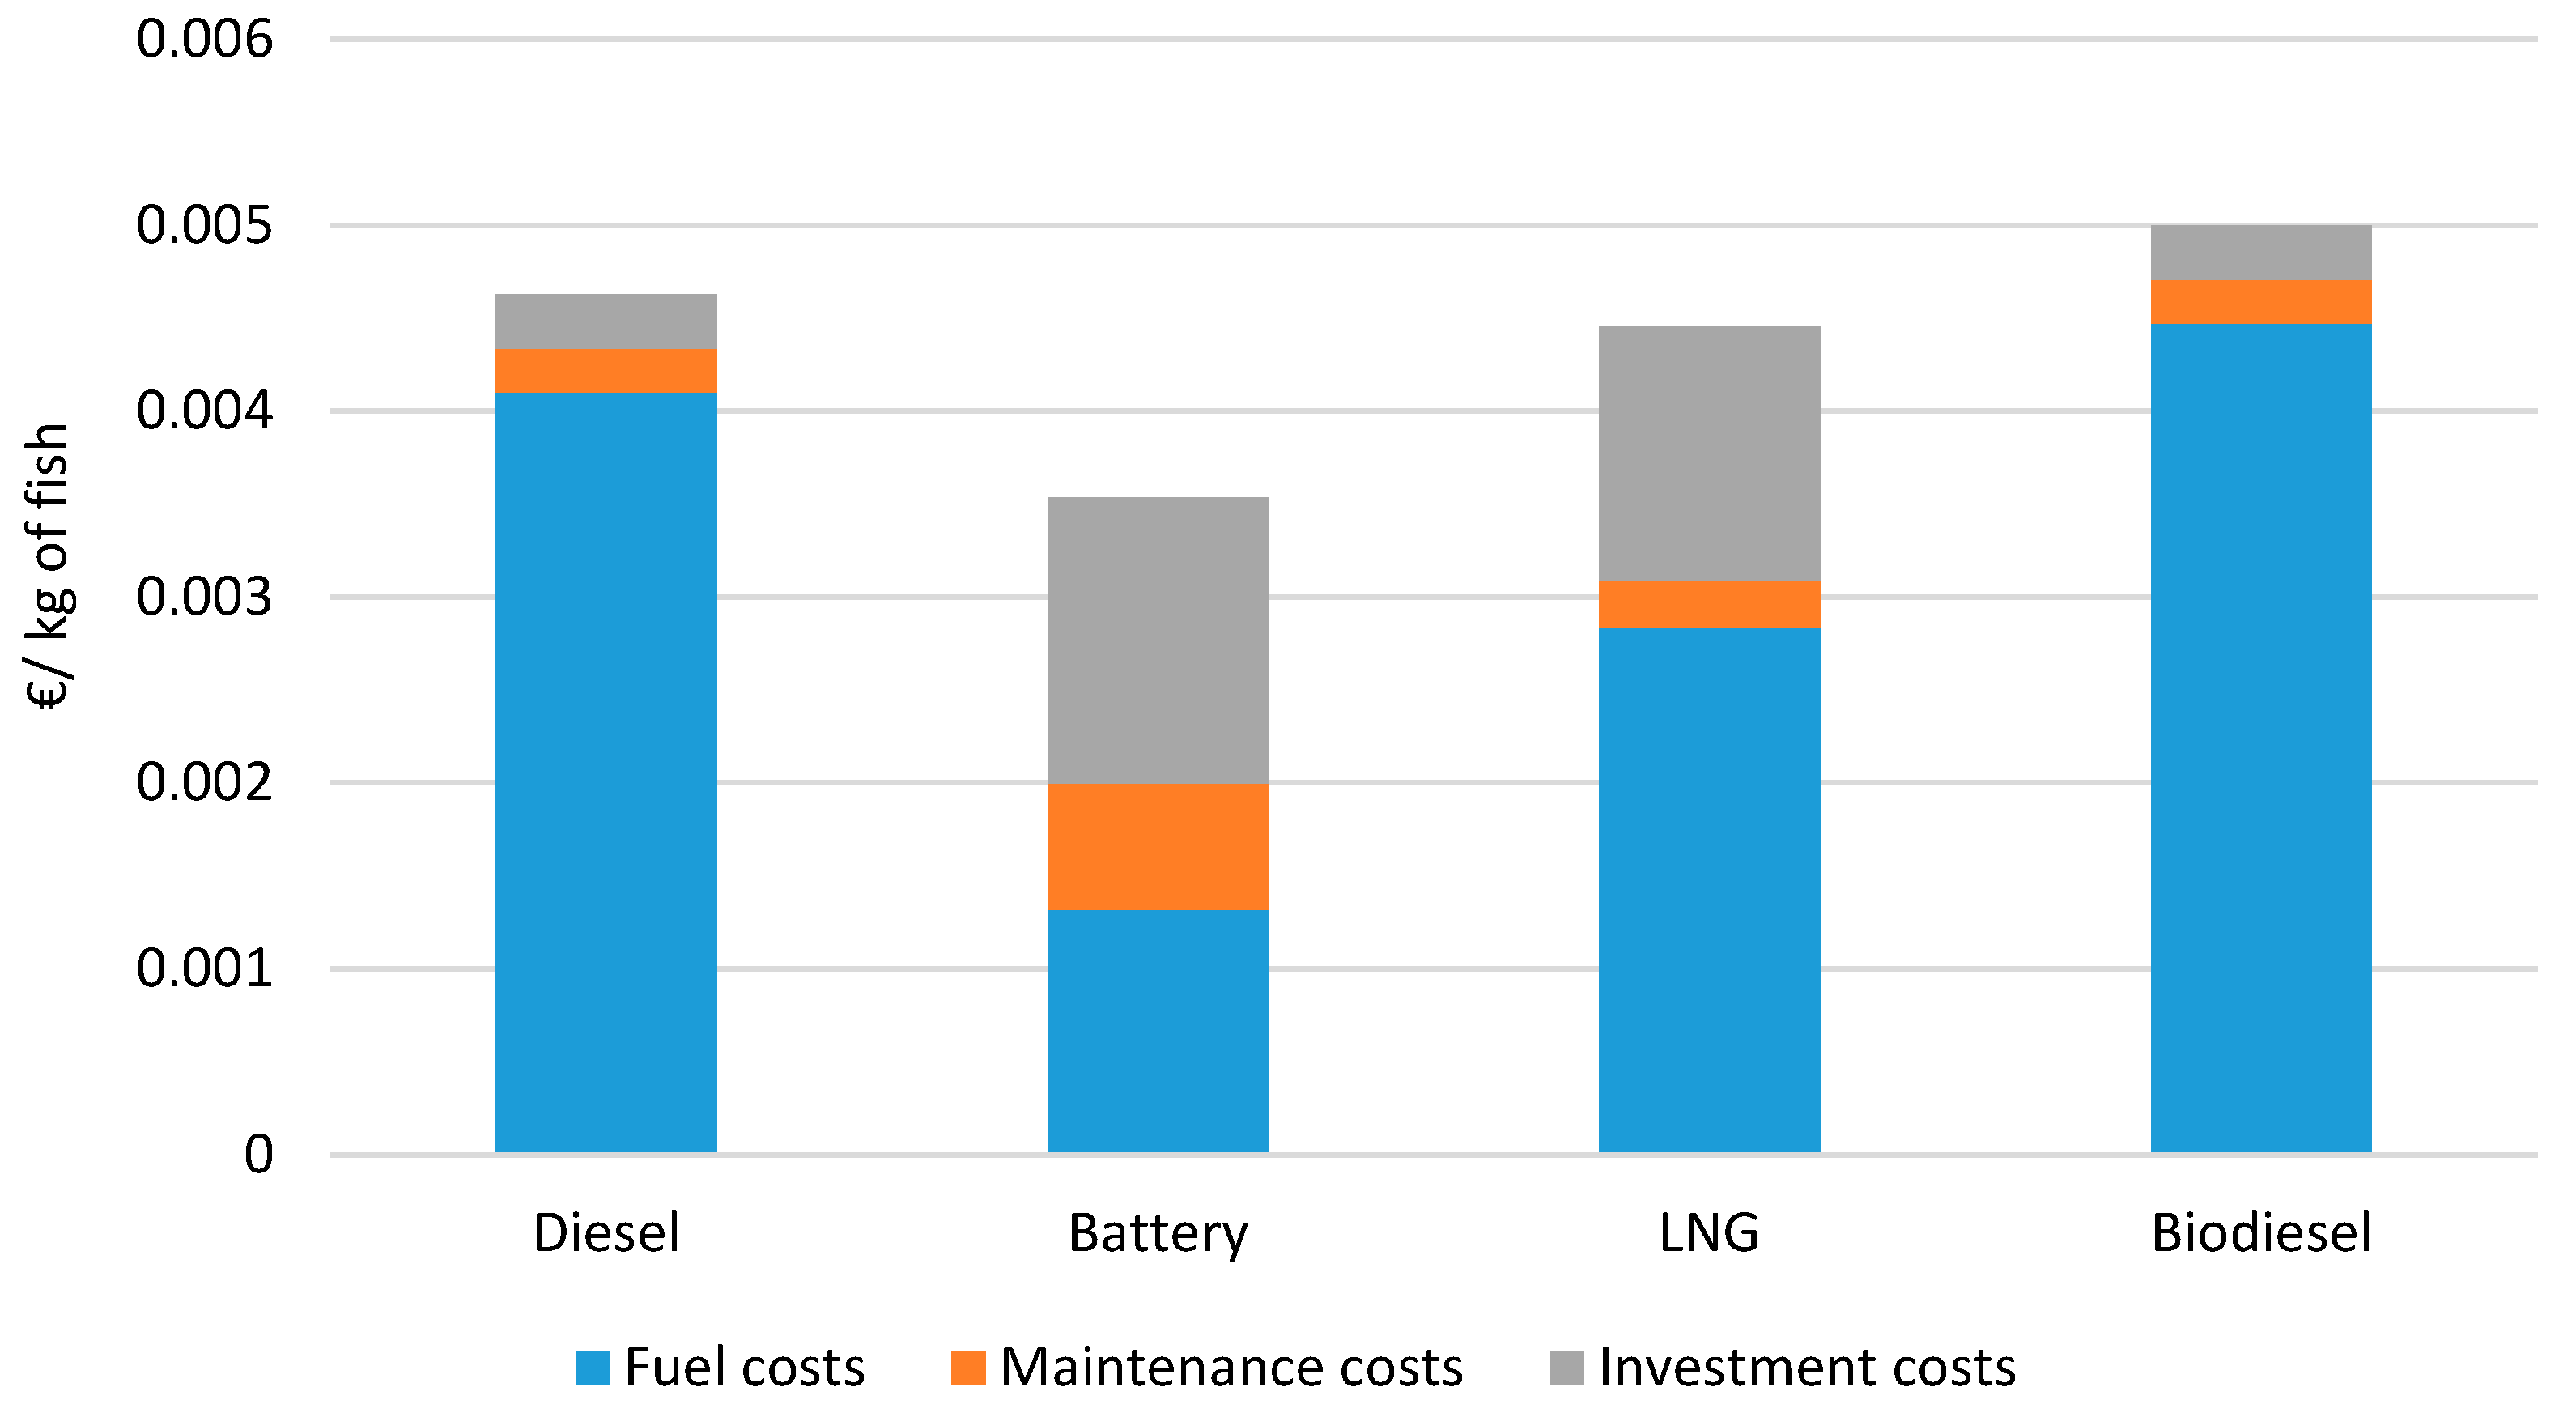
Calculating the investment, maintenance, and fuel costs per kg of fish, for vessels, a life cycle cost analysis has been performed, and the results are presented in Figure 11.
The results indicate that fuel costs are highest with diesel and biodiesel-powered systems; from an environmental perspective, biodiesel is the better option. An electric-powered system has lower fuel costs, but requires high investment because of the price of the battery. Looking at the long term, it is a better option in terms of fuel costs than diesel- or biodiesel-powered systems. Due to the needed replacement of the battery after 10 years, maintenance costs are high. The landfill costs of battery disposal after 10 years are also included in the life cycle cost analysis. Natural gas has higher fuel costs, but is still more environmentally friendly than diesel. Lithium-ion battery landfill includes costs like waste treatment, auxiliary equipment, electricity, labour work, maintenance, taxes, and depreciation [49]. The costs of the recycling process also include the recycling plant’s area and location, whether manufacturing scrap and rejected cells will be reused, the materials and energy flow associated with the recycling process, the equipment used for the procedure, the unit prices for chemicals and utilities consumed, the unit prices for materials recovered, and information about the plant operation, all of which are cost parameters. The investment cost is high, as with battery-powered systems. Maintenance costs with diesel, biodiesel, and natural gas are not high in the sensitivity analysis of specific costs with respect to fuel price variations, as shown in Figure 12.
The sensitivity analysis indicates that the price changes in an electric-powered system will not have a significant effect on the total fuel costs compared to other powering options. Furthermore, changes in LNG prices can have a slightly bigger impact, but still not as high as the changes in price of diesel and biodiesel. The price of the biodiesel is the highest, the same as the price of pure diesel in Croatia, so it may have the biggest impact on the total fuel cost.
Moving to the next phase of the production, which is industry, the use of RESs was analysed. In Table 4, the main particulars of the PV cells and wind turbines are presented.
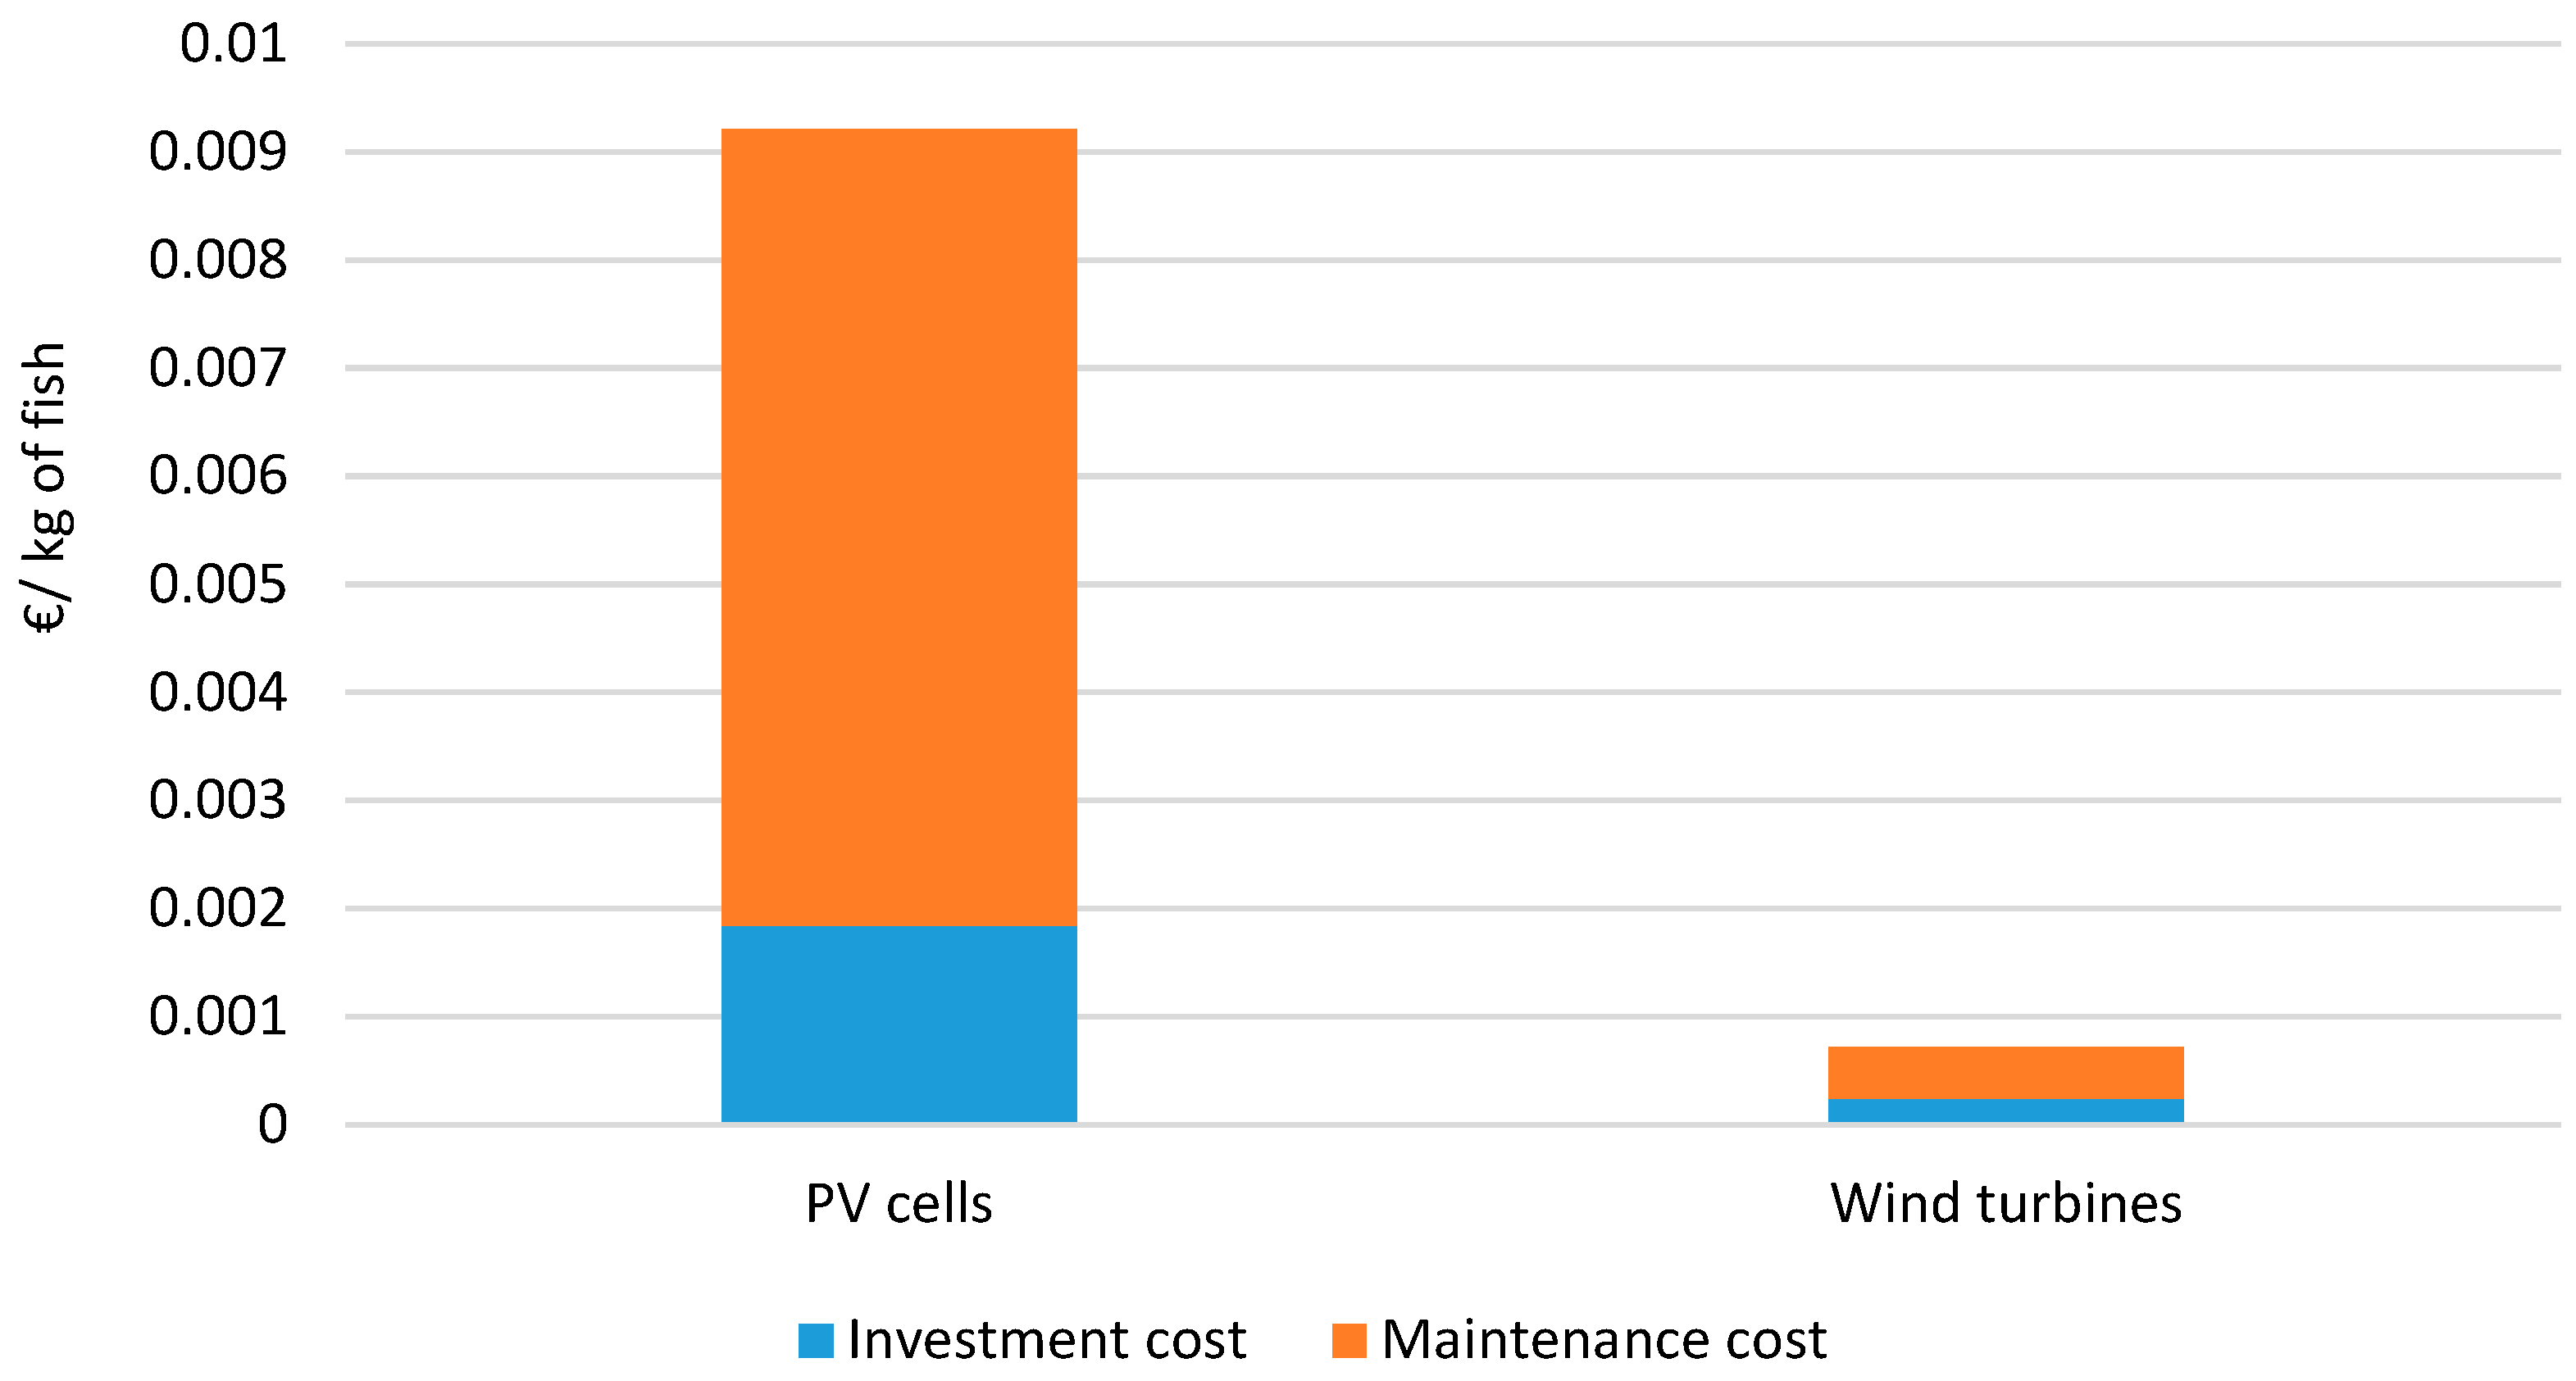
For the annual amount of energy consumption in the factory, two wind turbines are needed for an output of 226,458 kWh. PV cells cover 1000 m2 in this case study, but to fully replace energy consumption in the industry process, 3460 PV cells are needed, to cover an area of 5674 m2. If a combination of wind and solar energy is used, then one wind turbine and 1702 PV cells are needed to cover the total amount of energy used in the factory. The summarized investment and maintenance costs of the PV cells and wind turbines are shown in Figure 13, used to cover the total energy needs in the second phase.
The results indicate that it is more profitable to invest in wind turbines, but PV cells are more reliable. Depending on the strength of the wind, it is not the best way to fully replace electric energy. On the contrary, there are much more sunny days than windy, but even with solar models, there is still the possibility of low efficiency, especially in the winter. In Figure 14, the influence on total cost of electric energy, in one production cycle, in the industry process is shown. Data were calculated for the one wind turbine and PV cells for 1000 m2 because of the available surface for the RESs. The highest energy price was achieved by using only electric energy from the different sources, but with use of solar energy, that price is already reduced, and the most viable option is using solar and wind energy.
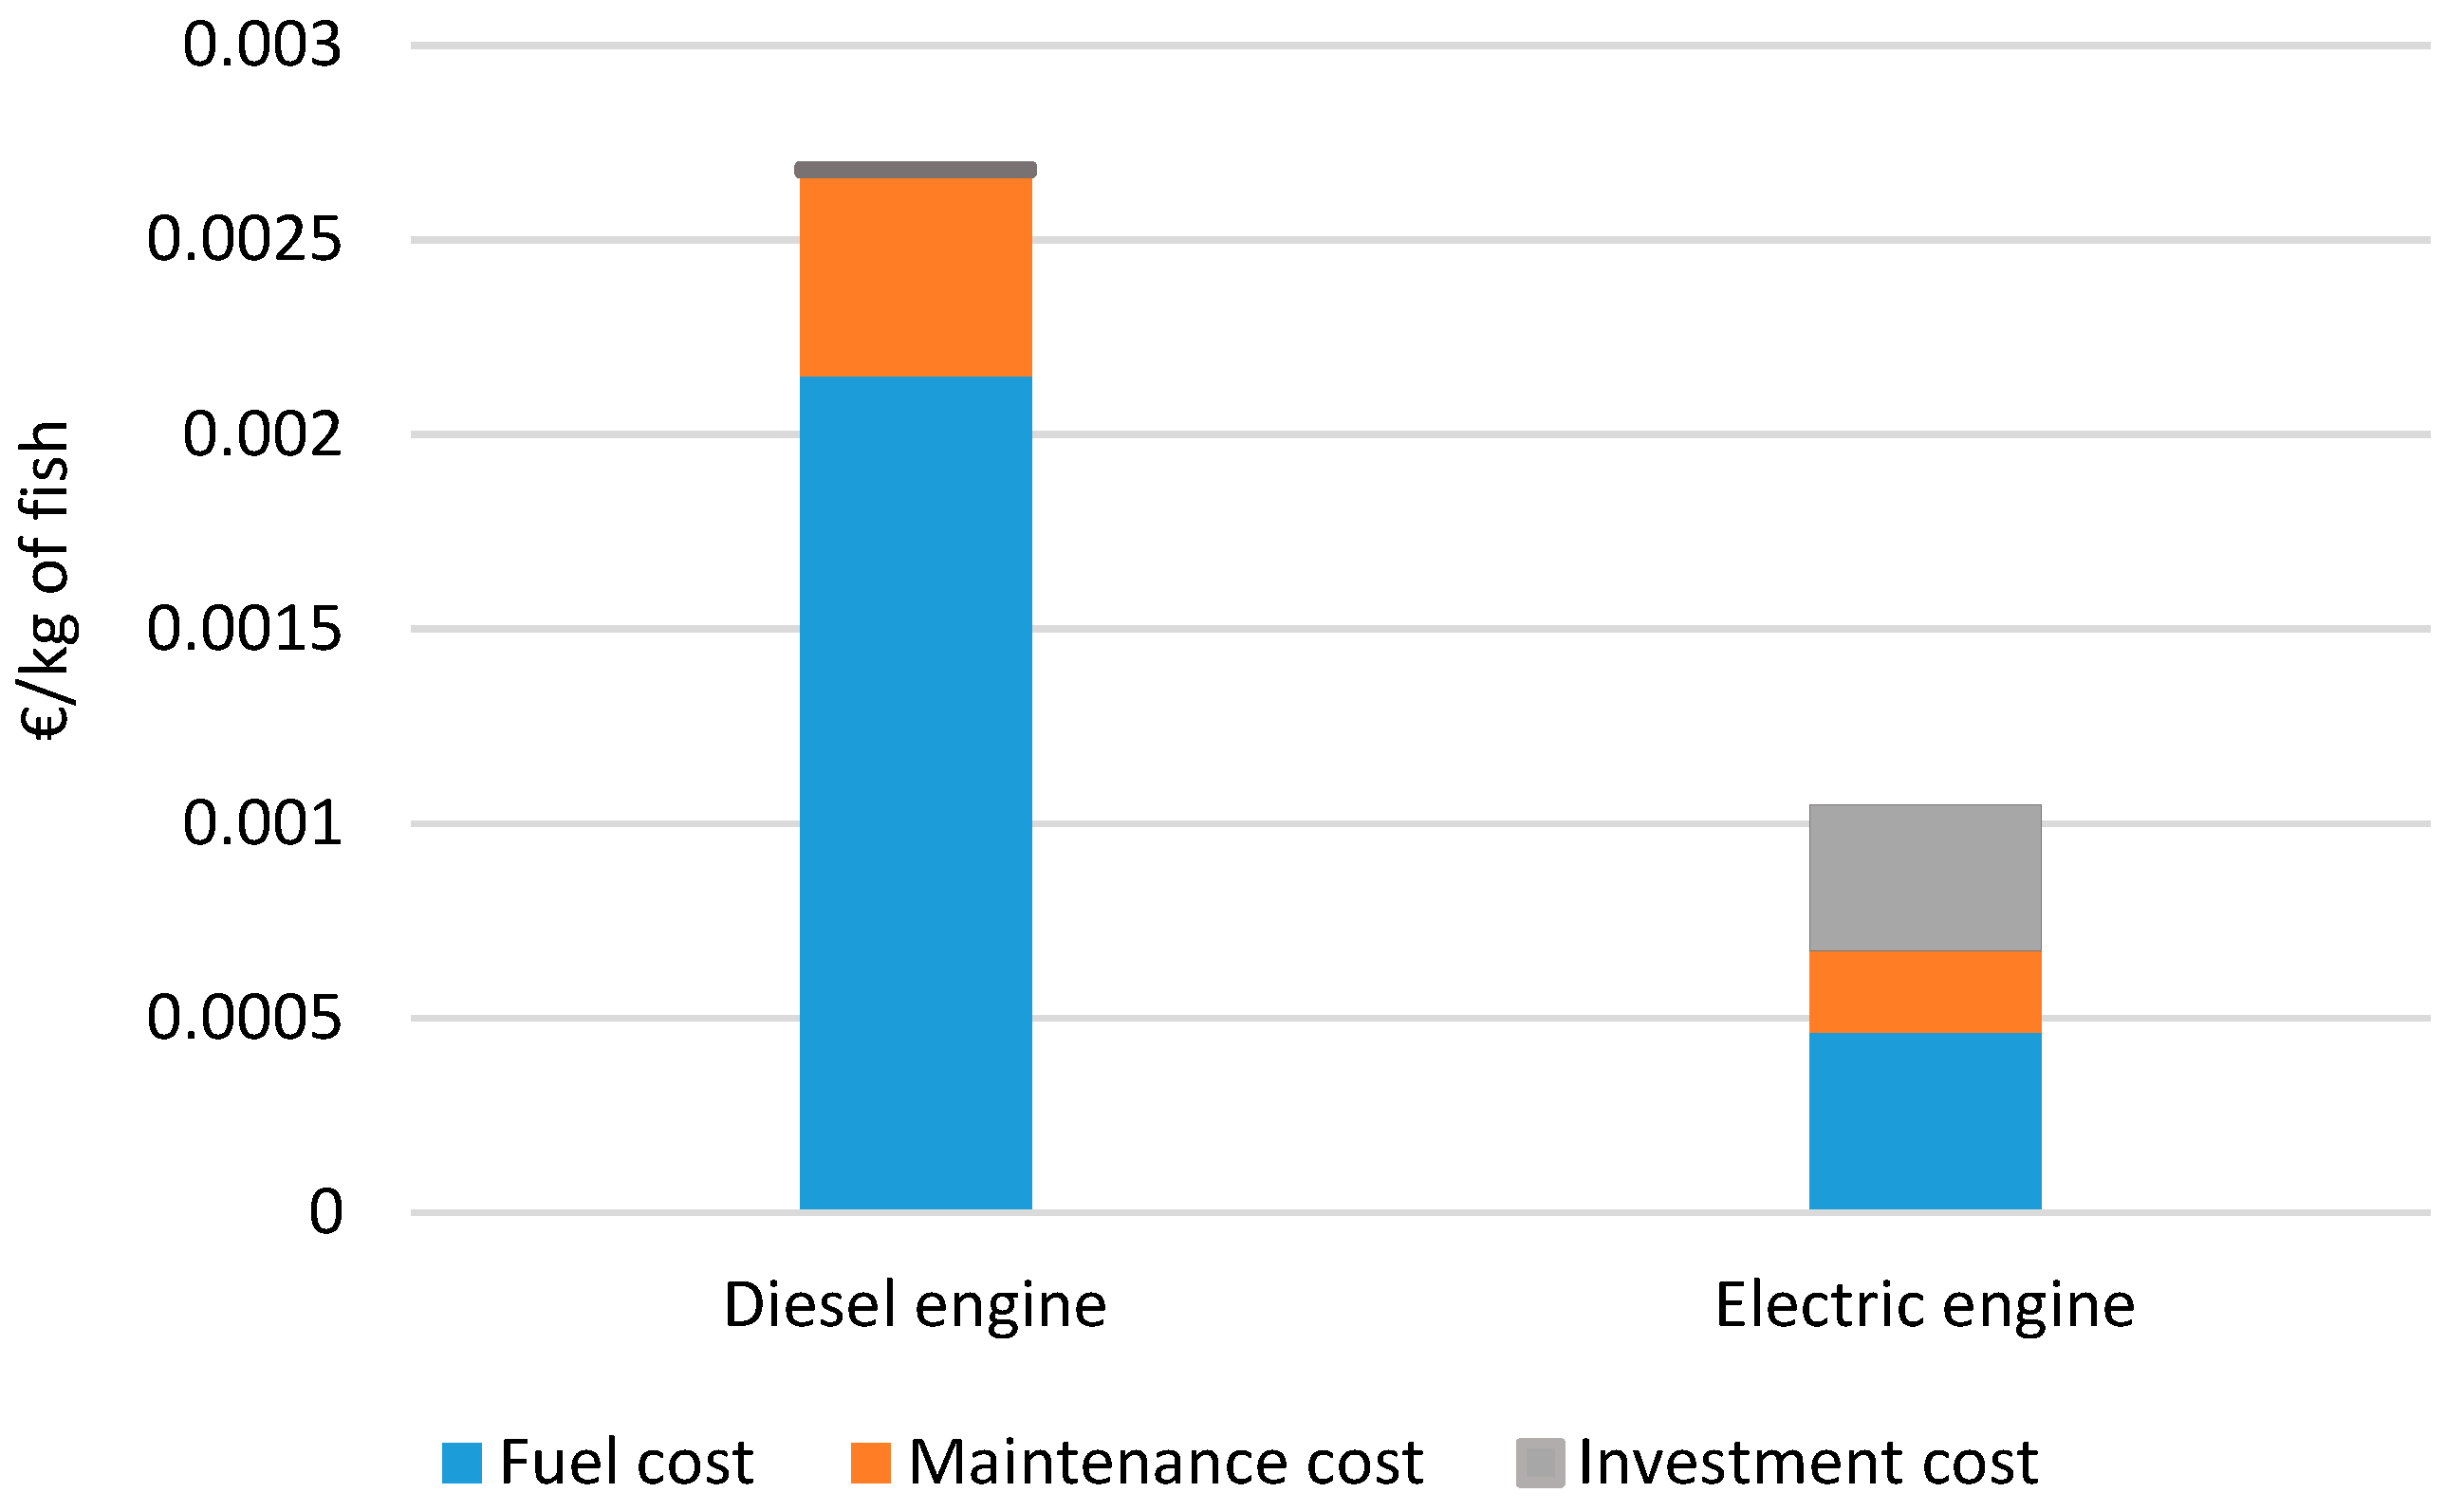
In the last part of the production process, delivery by electric truck or a diesel-powered vehicle were compared. The results of the LCCA can be seen in Figure 15. According to these results, the fuel costs for the next 20 years, driving 260 days in a year, are higher than for the electric-powered one. The investment cost is negligible compared to the electric engine, but maintenance costs are higher than with the battery-powered system. As for the electric-powered system in the vessel, for the maintenance costs, landfill costs are included in the life cycle cost analysis. It is important to emphasize the issues regarding a fully electric truck. The characteristics of an electric-powered vehicle are shown in Table 5. According to Liimatainen et al. [84], the electric truck with battery engine power and consumption used in this paper has a range of 300 km. After that, it takes more than 6 h to charge fully. For the delivery of food, this can represent a major problem. These kinds of vehicles are still at the beginning of their development, and in some countries like Norway, the USA, or Canada, they can be used for some purposes, but in Croatia it will take time for adequately efficient vehicles to come onto the market. A lack of charging stations can also present an obstacle to the use of fully electric vehicles for transportation. The combination of a diesel-powered and battery-powered system can potentially be a better solution until the development of acceptable conditions for fully electric trucks. A hybrid system uses a battery for starting an engine and goes further on the fuel energy. This solution is better for the environment, but also in terms of costs.
It is clear that fuel consumption still has a significant influence on the total energy consumption in production. An analysis of alternative fuels showed that electric-powered vessels and LNG-powered vessels are most profitable. Similar results were presented in the analysis of alternative fuel of three different ro-ro ships by [43], where the most cost-effective and environmentally friendly system was an electric engine as a replacement for diesel-powered ships. Pyrometallurgy (smelting), hydrometallurgy (leaching), and direct recycling are the three fundamental process types (physical processes) of lithium-ion battery recycling. Depending on parameters such as the quantity and characteristics of the material supplied, and the quantity and value of the materials that may be recovered, process components can be combined in a variety of ways [85]. Regardless of the technology used, a recycling plant operates 320 days a year, 20 h a day [48]. Due to greater use of these batteries in electric vehicles or vessels and other applications, the recycling process will become more financially appealing. Renewable energy can be used in the first phase of production for installing PV cells and wind turbines, as in [1], where the use of these RES turned out to be more environmentally friendly and economically acceptable than a conventional farm system. According to Hadžić et al. [86], solar panels are regarded as the most appropriate renewable technology. In the whole process, electric energy has many applications in terms of total energy consumption, but it is important to consider where the energy comes from. Using RESs in some part of the process could be a significant environmental improvement. For example, in industrial processes, a large-area installation of PV cells and wind turbines reduces the costs of electric energy by 48%, the installation of only PV cells by 18%, and the installation of only wind turbines by 24%. Additionally, Folke and Kautsky [17] stated that the use of solar energy systems for fish rearing units may decrease the total energy consumption from 14.25 to 2.31 e−03 kWh/kg fish. In the study by Quijera et al. [35], after the incorporation of solar thermal energy in a canned fish factory, the energy consumption represented a 24% reduction in the use of fossil fuel resources. In the study [86], Hadžić et al. analysed the installation of horizontal-axis tidal turbines for an annual production of 20 GWh and it did not appear to be a viable option, especially when the installation cost of about 4450 turbines is considered. For this case study, the wind turbine power is 310 kWh per kg fish per day. The amount of energy from [86], 20 GWh, can be generated by five wind turbines with an installed power of 5 MW. For the last phase, distribution trucks usually use diesel fuel. An alternative would be the use of an electric or hybrid vehicle. According to Elangovan et al. [87], diesel trucks for food distribution in the Gowanus district utilize 300% more energy than electric trucks and emit 40% more greenhouse emissions. In Croatia, the use of electric trucks is still not convenient, but in the future, to start with, a hybrid model could reduce the impact on the environment.
The weaknesses and limitations of this study are as follows:
  • The results were obtained by combining the input data taken from the relevant literature and some real data obtained from the producer, which require further justification (e.g., energy consumption in the fish factory). Therefore, sensitivity analyses of the results with respect to the selected input data are provided in the Appendix A.
  • Only one aquacultural farm is taken into account, and therefore, additional test cases are desirable to determine the application of the presented model. The necessity of testing relevant mathematical models for assessment of aquaculture sustainability is also indicated in [1,10].

5. Conclusions

Aquaculture production is becoming more popular in the food industry. With high fuel prices, capture production is more challenging due to higher costs. Considering the whole production process, energy consumption is still high in the first phase of production. Fossil fuels have a much bigger impact on the environment, but also on economic performance. For short distances such as are seen in aquaculture, usually from the harbour to the cage, because scenarios of spending a few days at sea like in fisheries are not common, RESs can be used for the vessel. Thus, in the first phase of production, the potential for zero-emissions production is high, especially in the Croatian electricity mix, where hydro energy accounts for almost 50% of the electric power. Combining conventional energy sources with RESs makes production more sustainable and environmentally friendly. Additionally, alternative fuels were analysed in this study, and, due to the sensitivity of the fuel price differences, it is clear that an electric-powered system would experience the least change if the electricity varies. A life cycle cost analysis has also been conducted with alternative fuels like biodiesel, LNG, and electric vessel, with the assumption of diesel fuel as a pilot fuel. Costs like investment, maintenance, and fuel were analysed and, looking at only the economical aspect, the electric-powered system showed the lowest costs. For the energy used in the cage, an automated machine was taken as the feeding system. In this work, the feeding machine is powered by electric energy; however, a lot of feeding machines are still powered on diesel, and thus, can also have a negative environmental impact. It is preferable to use electric feeding machines. Processes in the factory are powered only by electric energy, but it is important to know the source of the energy supplied. Croatia has a good potential for using RESs in mariculture production. PV cells proved to be more accessible. The best option would be a combination of other RESs like wind, water, or other, but some of this depends on the weather more than other sources. Wind turbines would be, theoretically, the easiest and fastest option for electric energy production, but they depend a lot on the weather conditions, so in practice, for a fish factory, they could not be the only energy source. For zero-emissions production, in the second phase, the potential is also great. Hydro energy, solar, and wind energy can make a significant contribution to more sustainable production. With the combination of RESs and electric energy from the mix, it would have a greater impact on the environment; also, over a longer period, the costs would be less. Further research is needed to better understand the needs of mariculture and how to make it sustainable. In the last phase, there are still problems with making the whole production zero-emissions. Most of the distribution methods, especially trucks, are powered by diesel engines. The possibility for battery-powered systems is not that high because of a few disadvantages. Hybrid models can replace fully diesel-powered systems for a start, but that is still not zero-emissions, so therefore, further investigations are needed.

Author Contributions

Conceptualization, T.B., M.K., M.V., V.S., N.V. and A.F.; methodology, T.B., M.K. and N.V.; software, T.B., M.K. and M.V.; validation, V.S., N.V. and A.F.; formal analysis, T.B., M.K. and M.V.; investigation, T.B., M.K. and M.V.; resources, M.K. and N.V.; data curation, T.B., M.K. and M.V.; writing—original draft preparation, T.B.; writing—review and editing, M.K., M.V., V.S., N.V. and A.F.; visualization, T.B. and M.K.; supervision, N.V.; project administration, M.K.; funding acquisition, N.V. All authors have read and agreed to the published version of the manuscript.

Funding

This investigation has been co-funded by the European Maritime and Fisheries Fund of the European Union within the project “INTEL-MARIC,” granted by the Ministry of Agriculture, Directorate of Fisheries, Republic of Croatia (Award No. UP/I-324-01/21-01/385).

Conflicts of Interest

The authors declare no conflict of interest.

Appendix A

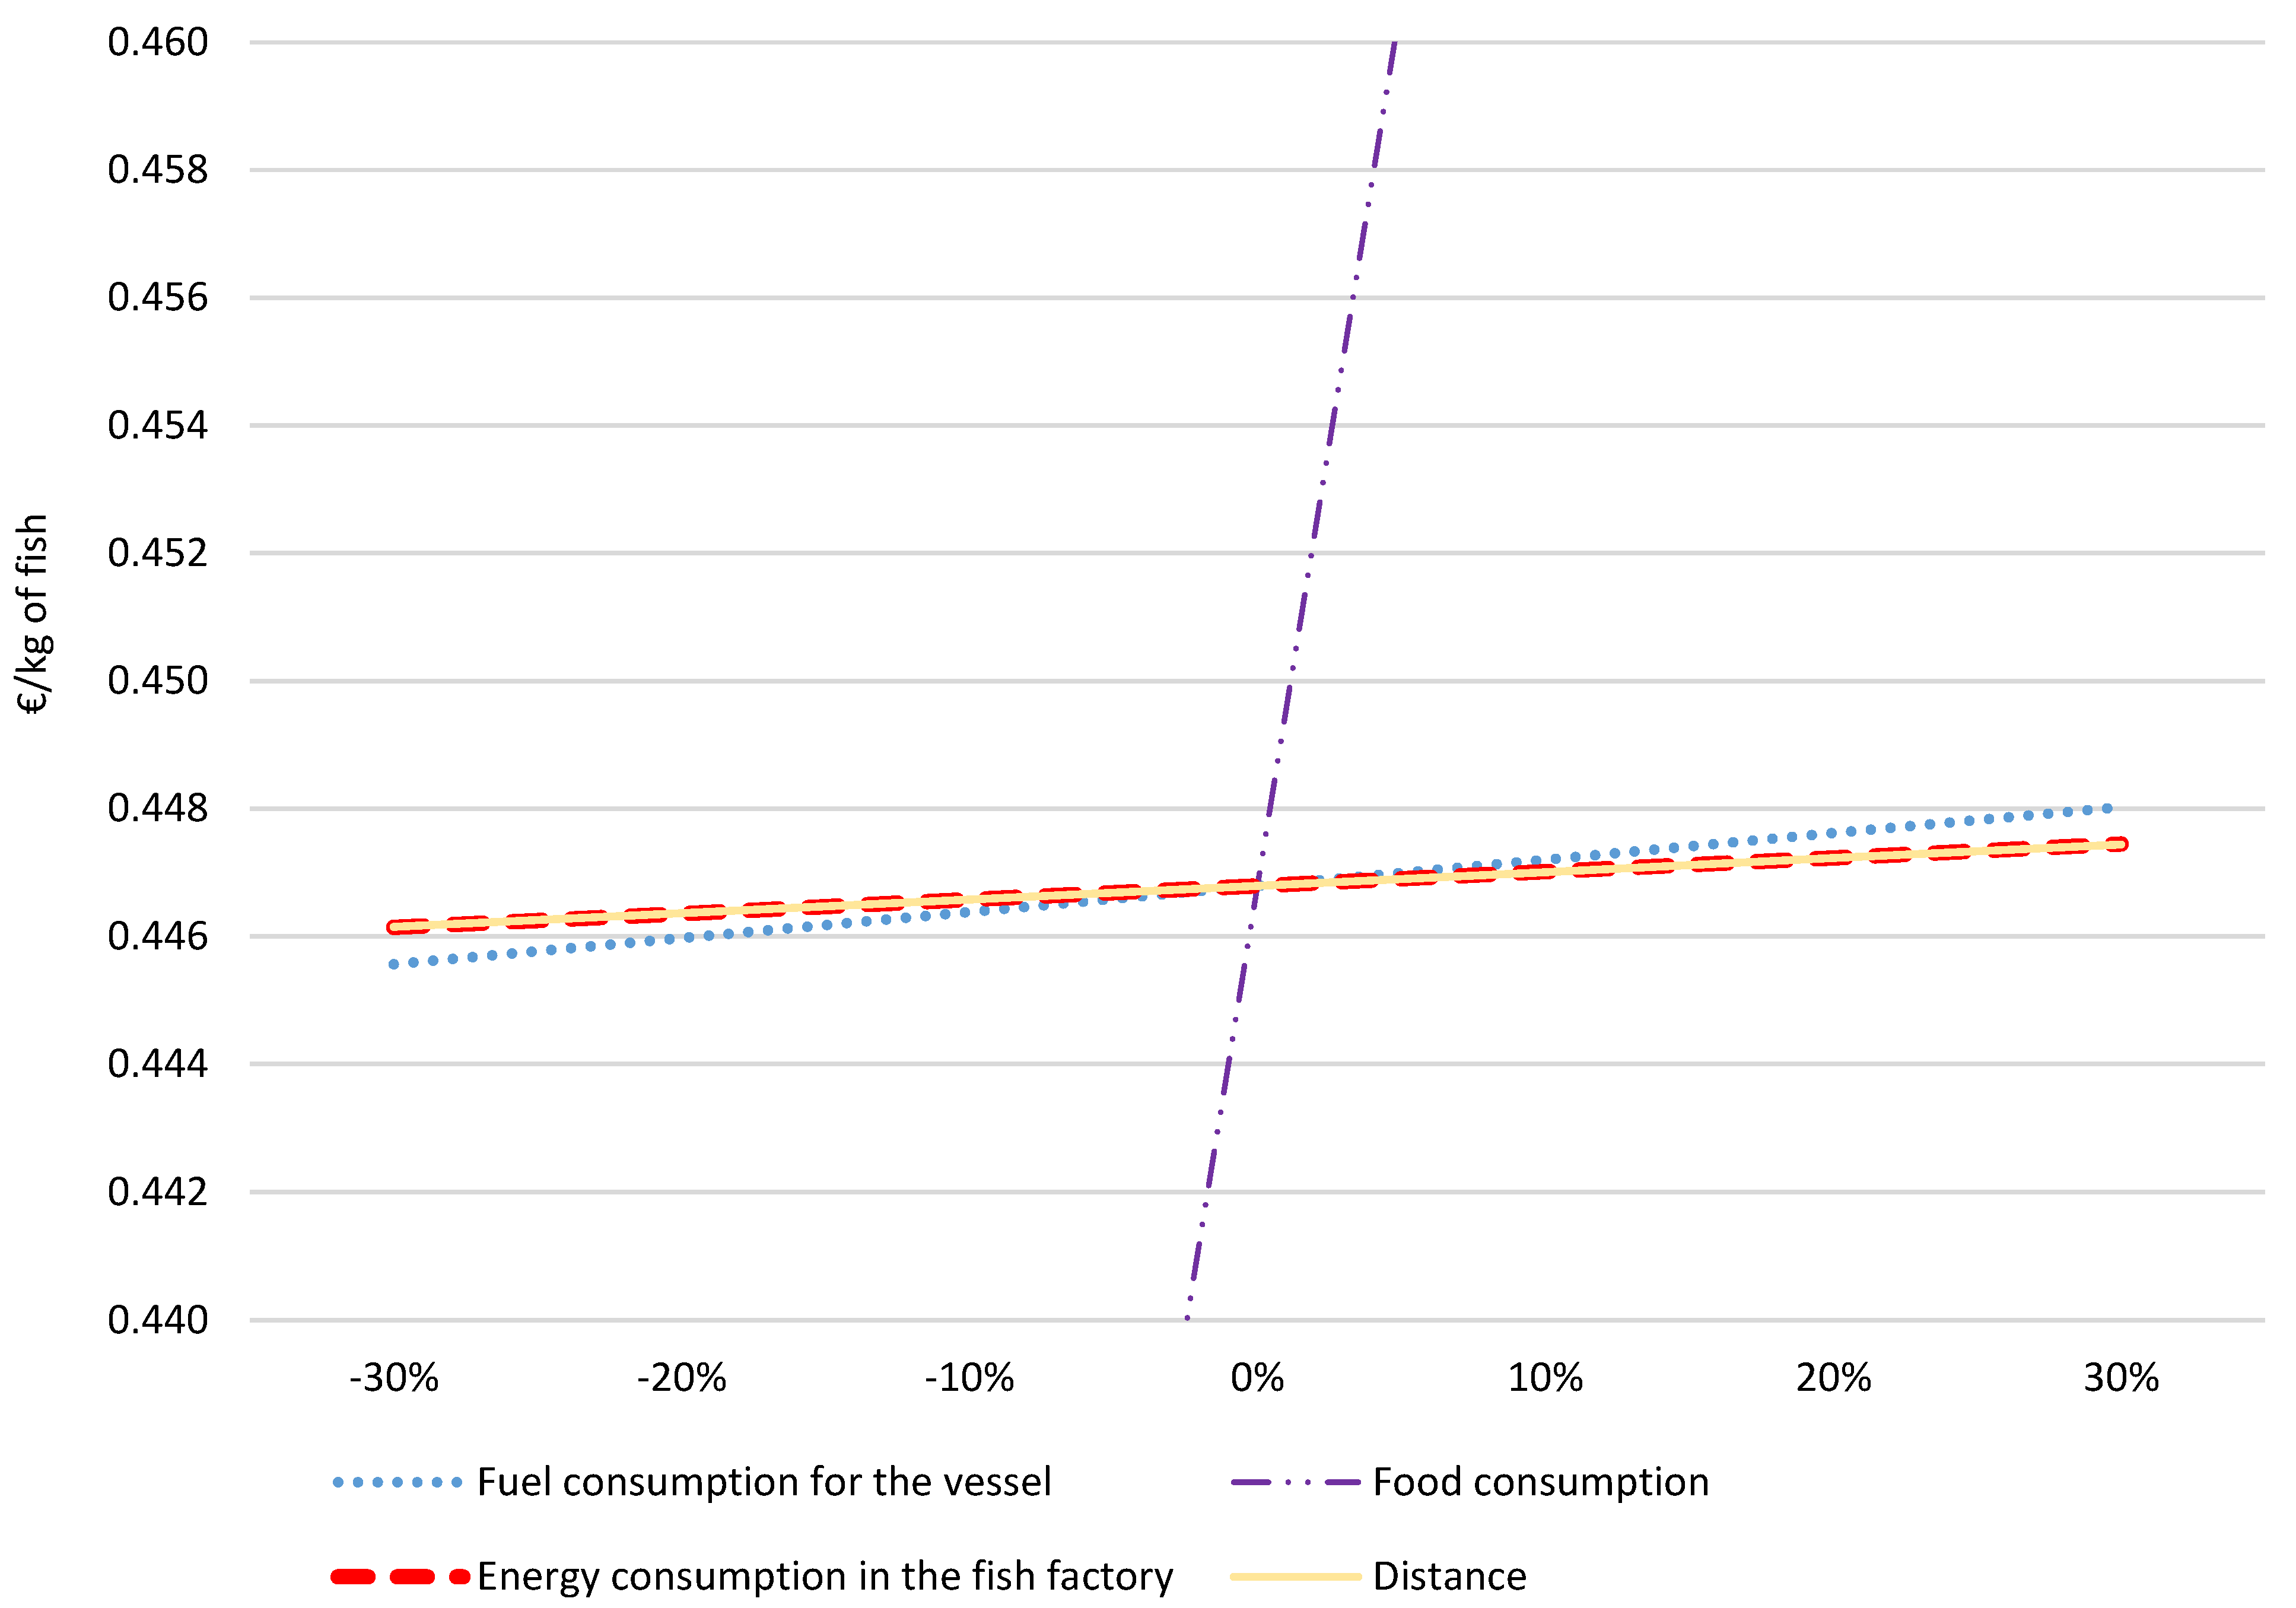
A major issue in the assessment of lifetime costs in aquaculture relates to collecting reliable input data. In this study, all the input data were taken from the relevant literature, while the energy consumption in the fish factory was obtained by direct contact with the selected factory. Therefore, a sensitivity analysis of the specific production costs with respect to energy consumption in the factory as well as some other quantities is shown in Figure A1.
Figure A1. Sensitivity analysis of significant particulars and impact on total cost.
Energies 15 08197 g0a1
The sensitivity analysis shows that food consumption has the highest impact on the production costs, while the effect of the fuel consumption of a working vessel, its operating distance, and energy consumption in the factory have nearly the same impact.

References

  1. Koričan, M.; Perčić, M.; Vladimir, N.; Soldo, V.; Jovanović, I. Environmental and Economic Assessment of Mariculture Systems Using a High Share of Renewable Energy Sources. J. Clean. Prod. 2022, 333, 130072. [Google Scholar] [CrossRef]
  2. Haramina, T. Studija o Utjecaju na Okoliš za Uzgajalište Bijele Morske ribe na Lokaciji Kraj Otoka Maun, Dvokut ECRO d.o.o. 2020. Available online: https://mingor.gov.hr/UserDocsImages/UPRAVA-ZA-PROCJENU-UTJECAJA-NA-OKOLIS-ODRZIVO-GOSPODARENJE-OTPADOM/Puo/07_12_2020_Studija_Uzgajaliste_bijele_ribe_Maun.pdf (accessed on 10 September 2022).
  3. Food and Agriculture Organization (FAO). FAO Yearbook. Fishery and Aquaculture Statistics 2019/FAO Annuaire. Statistiques des Pêches et de ’’Aquaculture 2019/FAO Anuario. Estadísticas de Pesca y Acuicultura 2019. Rome/Roma. 2021. Available online: https://www.fao.org/fishery/en/publications/287024 (accessed on 25 June 2022).
  4. Zhang, Y.Y.; Zhang, J.H.; Liang, Y.T.; Li, H.M.; Li, G.; Chen, X.; Zhao, P.; Jiang, Z.J.; Zou, D.H.; Liu, X.Y.; et al. Carbon Sequestration Processes and Mechanisms in Coastal Mariculture Environments in China. Sci. China Earth Sci. 2017, 60, 2097–2107. [Google Scholar] [CrossRef]
  5. Food and Agriculture Organization (FAO). Fisheries and Aquaculture Circular, Fuel and Energy Use in the Fisheries Sector—Approaches, Inventories and Strategic Implications, by J.F. Muir. FAO Fisheries and Aquaculture Circular No. 1080. Rome, Italy. 2015. Available online: https://www.fao.org/publications/card/en/c/89457227-b55f-4ac6-95ad-cccd53a3dcb0/ (accessed on 7 October 2022).
  6. Iandoli, C.; Cozzolino, M. Overview on Aquaculture Product Differentiation. 2010. Available online: https://om.ciheam.org/om/pdf/c59/02600084.pdf (accessed on 22 July 2022).
  7. Jiang, Q.; Bhattarai, N.; Pahlow, M.; Xu, Z. Environmental Sustainability and Footprints of Global Aquaculture. Resour. Conserv. Recycl. 2022, 180, 106183. [Google Scholar] [CrossRef]
  8. Clawson, G. Spatial Distribution of Global Mariculture Production, Global Seafood. 2022. Available online: https://www.globalseafood.org/advocate/spatial-distribution-of-global-mariculture-production/ (accessed on 25 June 2022).
  9. Fiorella, K.J.; Okronipa, H.; Baker, K.; Heilpern, S. Contemporary Aquaculture: Implications for Human Nutrition. Curr. Opin. Biotechnol. 2021, 70, 83–90. [Google Scholar] [CrossRef] [PubMed]
  10. Le Féon, S.; Dubois, T.; Jaeger, C.; Wilfart, A.; Akkal-Corfini, N.; Bacenetti, J.; Costantini, M.; Aubin, J. Dexiaqua, a Model to Assess the Sustainability of Aquaculture Systems: Methodological Development and Application to a French Salmon Farm. Sustainability 2021, 13, 7779. [Google Scholar] [CrossRef]
  11. Klinger, D.; Naylor, R. Searching for Solutions in Aquaculture: Charting a Sustainable Course. Annu. Rev. Environ. Resour. 2012, 37, 247–276. [Google Scholar] [CrossRef] [Green Version]
  12. Menicou, M.; Vassiliou, V. Prospective Energy Needs in Mediterranean Offshore Aquaculture: Renewable and Sustainable Energy Solutions. Renew. Sustain. Energy Rev. 2010, 14, 3084–3091. [Google Scholar] [CrossRef]
  13. Troell, M.; Tyedmers, P.; Kautsky, N.; Rönnbäck, P. Aquaculture and Energy Use. Encycl. Energy 2004, 1, 97–108. [Google Scholar] [CrossRef]
  14. Vresnik, F. Povećanje kapaciteta uzgajališta bijele ribe do 700 T/god na lokaciji Plavnik, Zelena infrastruktura d.o.o. 2019. Available online: https://mingor.gov.hr/UserDocsImages//UPRAVA-ZA-PROCJENU-UTJECAJA-NA-OKOLIS-ODRZIVO-GOSPODARENJE-OTPADOM/Opuo//03_09_2019_Elaborat_Uzgajaliste_Plavnik.pdf (accessed on 10 September 2022.).
  15. Badiola, M.; Basurko, O.C.; Piedrahita, R.; Hundley, P.; Mendiola, D. Energy Use in Recirculating Aquaculture Systems (RAS): A Review. Aquac. Eng. 2018, 81, 57–70. [Google Scholar] [CrossRef]
  16. Murali, S.; Krishnan, V.S.; Amulya, P.R.; Alfiya, P.V.; Delfiya, D.S.A.; Samuel, M.P. Energy and Water Consumption Pattern in Seafood Processing Industries and Its Optimization Methodologies. Clean. Eng. Technol. 2021, 4, 100242. [Google Scholar] [CrossRef]
  17. Folke, C.; Kautsky, N. Aquaculture with its environment: Prospects for sustainability. Ocean Coast. Manag. 1992, 17, 5–24. [Google Scholar] [CrossRef]
  18. Hancock, T. Health, Human Development and the Community Ecosystem: Three Ecological Models. Health Promot. Int. 1993, 8, 41–47. [Google Scholar] [CrossRef]
  19. Vladimir, N.; Koričan, M.; Perčić, M.; Alujević, N.; Hadžić, N. Analysis of Environmental Footprint of a Fishing Trawler with Overview of Emission Reduction Technologies. In Proceedings of the International Conference on Applied Energy, Bangkok, Thailand, 29 November–2 December 2021; Volume 24, pp. 1–6. [Google Scholar]
  20. Parker, R.W.R.; Hartmann, K.; Green, B.S.; Gardner, C.; Watson, R.A. Environmental and Economic Dimensions of Fuel Use in Australian Fisheries. J. Clean. Prod. 2015, 87, 78–86. [Google Scholar] [CrossRef]
  21. Pringle, A.M.; Handler, R.M.; Pearce, J.M. Aquavoltaics: Synergies for Dual Use of Water Area for Solar Photovoltaic Electricity Generation and Aquaculture. Renew. Sustain. Energy Rev. 2017, 80, 572–584. [Google Scholar] [CrossRef] [Green Version]
  22. Krnjak, V. Utjecaj Marikulture na Okoliš. Ph.D. Dissertation, University of Zagreb, Faculty of Science, Department of Biology, Zagreb, Croatia, 2010. [Google Scholar]
  23. United Nations Framework Convention Climate Change (UNFCCC). Paris Agreement. Available online: https://unfccc.int/process-and-meetings/the-paris-agreement/the-paris-agreement (accessed on 27 August 2022).
  24. Kiruthika, S.U.; Raja, S.K.S.; Jaichandran, R. IOT based automation of fish farming. J. Adv Res. Dyn. Control. Syst. 2017, 9, 50–57. [Google Scholar]
  25. Khan, M.; Masud, M.; Akowuah, B. Development of IoT Based Fish Monitoring System for Aquaculture. Intell. Autom. Soft Comput. 2021, 32, 55–71. [Google Scholar] [CrossRef]
  26. Yang, X.; Cao, D.; Chen, J.; Xiao, Z.; Daowd, A. AI and IoT-based collaborative business ecosystem: A case in Chinese fish farming industry. Int. J. Technol. Manag. 2020, 82, 151–171. [Google Scholar] [CrossRef]
  27. Mustafa, F.H.; Bagul, A.H.B.P.; Senoo, S.S.; Shapawi, R. A review of smart fish farming systems. J. Aquac. Eng. Fish. Res. 2016, 2, 193–200. [Google Scholar] [CrossRef]
  28. Wang, C.; Li, Z.; Wang, T.; Xu, X.; Zhang, X.; Li, D. Intelligent fish farm—the future of aquaculture. Aquac. Int. 2021, 29, 2681–2711. [Google Scholar] [CrossRef]
  29. Agossou, B.E.; Toshiro, T. IoT & AI Based System for Fish Farming: Case study of Benin. In Proceedings of the Conference on Information Technology for Social Good, Roma, Italy, 9–11 September 2021; Association for Computing Machinery: New York, NY, USA, 2021; pp. 259–264. [Google Scholar]
  30. Hang, L.; Ullah, I.; Kim, D.-H. A secure fish farm platform based on blockchain for agriculture data integrity. Comput. Electron. Agric. 2020, 170, 105251. [Google Scholar] [CrossRef]
  31. Vo, T.T.E.; Ko, H.; Huh, J.H.; Park, N. Overview of Solar Energy for Aquaculture: The Potential and Future Trends. Energies 2021, 14, 6923. [Google Scholar] [CrossRef]
  32. Thrane, M.; Nielsen, E.H.; Christensen, P. Cleaner Production in Danish Fish Processing—Experiences, Status and Possible Future Strategies. J. Clean. Prod. 2009, 17, 380–390. [Google Scholar] [CrossRef]
  33. Budiša, M. Povećanje Kapaciteta Uzgajališta Bijele Ribe uz Otok Galičnjak u Općini Mljet—Do 640 tona/god, ECOINA d.o.o. 2019. Available online: https://mingor.gov.hr/UserDocsImages/UPRAVA-ZA-PROCJENU-UTJECAJA-NA-OKOLIS-ODRZIVO-GOSPODARENJE-OTPADOM/Puo/09_04_2019_Studija_Galicnjak.pdf (accessed on 10 September 2022).
  34. Vresnik, F. Uzgajalište Tune Ciljanog Kapaciteta Do 1500 t/god na Lokaciji Kod Otoka Balabra u Šibensko-Kninskoj Županiji, Oikon d.o.o. 2017. Available online: https://mingor.gov.hr/UserDocsImages/ARHIVA%20DOKUMENATA/ARHIVA%20---%20PUO/2017/studija_o_utjecaju_na_okolis_38.pdf (accessed on 10 September 2022).
  35. Quijera, J.A.; Alriols, M.G.; Labidi, J. Integration of a Solar Thermal System in Canned Fish Factory. Appl. Therm. Eng. 2014, 70, 1062–1072. [Google Scholar] [CrossRef]
  36. Alasalvar, C.; Quantick, P.C. Temperature Modelling and Relationships in Fish Transportation. In Fish Processing Technology; Springer: Boston, MA, USA, 1997; pp. 249–288. [Google Scholar] [CrossRef]
  37. Karahmet, E.; Toroman, A. Poznavanje i Prerada Mesa Ribe; Federal ministry of environment and tourism of Bosnia and Hercegovina: Sarajevo, Bosnia and Herzegovina, 2020; ISBN 9789926475079. [Google Scholar]
  38. Fan, A.; Yang, Y.; Yang, L.; Wu, D.; Vladimir, N. A review of ship fuel consumption models. Ocean Eng. 2022, 264C, 1213727. [Google Scholar] [CrossRef]
  39. Alibaba.com Feeding Machine. Available online: https://www.alibaba.com/product-detail/ow-power-consumption-floating-fish-food_1600484885876.html (accessed on 9 September 2022).
  40. Federal ministry of environment and tourism of Bosnia and Hercegovina, Tehničke upute, Prehrambena industrija, Sektor: Prerada ribe. 2008. Available online: https://www.fmoit.gov.ba/upload/file/okolisne-dozvole/Prerada_ribe.pdf (accessed on 1 September 2022).
  41. Andersen, O. Transport of Fish from Norway: Energy Analysis Using Industrial Ecology as the Framework. J. Clean. Prod. 2002, 10, 581–588. [Google Scholar] [CrossRef]
  42. Perčić, M.; Vladimir, N.; Fan, A. Techno-Economic Assessment of Alternative Marine Fuels for Inland Shipping in Croatia. Renew. Sustain. Energy Rev. 2021, 148, 111363. [Google Scholar] [CrossRef]
  43. Perčić, M.; Vladimir, N.; Fan, A. Life-Cycle Cost Assessment of Alternative Marine Fuels to Reduce the Carbon Footprint in Short-Sea Shipping: A Case Study of Croatia. Appl. Energy 2020, 279, 115848. [Google Scholar] [CrossRef]
  44. INA Fuel Prices. Available online: https://www.ina.hr/kupci/veleprodaja-i-narucivanje/privatni-korisnici/pregled-cijena/ (accessed on 11 July 2022).
  45. Christos, B. Techno—Economical Feasibility Study on the Retrofit of Double—Ended Ro/Pax Ferries into Battery—Powered Ones. Master’s Thesis, National Technical University of Athens, Athens, Greece, 2017. [Google Scholar]
  46. Eurostat. Available online: https://ec.europa.eu/eurostat/databrowser/view/NRG_PC_205__custom_2568728/default/table?lang=en (accessed on 1 September 2022).
  47. Ioannis, T.; Dalius, T.; Natalia, L. Li-ion batteries for mobility and stationary storage applications, Publications Office of the European Union. 2018. Available online: https://policycommons.net/artifacts/2163207/li-ion-batteries-for-mobility-and-stationary-storage-applications/2918854/ (accessed on 7 September 2022).
  48. Lima, M.C.C.; Pontes, L.P.; Vasconcelos, A.S.M.; de Araujo Silva Junior, W.; Wu, K. Economic Aspects for Recycling of Used Lithium-Ion Batteries from Electric Vehicles. Energies 2022, 15, 2203. [Google Scholar] [CrossRef]
  49. Ammar, N.R.; Seddiek, I.S. Eco-Environmental Analysis of Ship Emission Control Methods: Case Study RO-RO Cargo Vessel. Ocean Eng. 2017, 137, 166–173. [Google Scholar] [CrossRef]
  50. Ellis, J.; Tanneberger, K. Study on the Use of Ethyl and Methyl Alcohol as Alternative Fuels in Shipping. Eur. Marit. Saf. Agency 2015, 46, 1–38. [Google Scholar]
  51. Iannaccone, T.; Landucci, G.; Tugnoli, A.; Salzano, E.; Cozzani, V. Sustainability of Cruise Ship Fuel Systems: Comparison among LNG and Diesel Technologies. J. Clean. Prod. 2020, 260, 121069. [Google Scholar] [CrossRef]
  52. Ančić, I.; Perčić, M.; Vladimir, N. Alternative Power Options to Reduce Carbon Footprint of Ro-Ro Passenger Fleet: A Case Study of Croatia. J. Clean. Prod. 2020, 271, 122638. [Google Scholar] [CrossRef]
  53. Hadžić, N.; Kozmar, H.; Tomić, M. Offshore Renewable Energy in the Adriatic Sea with Respect to the Croatian 2020 Energy Strategy. Renew. Sustain. Energy Rev. 2014, 40, 597–607. [Google Scholar] [CrossRef]
  54. Klanfar, M.; Korman, T.; Kujundžić, T. Potrošnja Goriva i Koeficijenti Opterećenja Pogonskih Motora Mehanizacije Pri Eksploataciji Tehničko-Građevnog Kamena. Teh. Vjesn. 2016, 23, 163–169. [Google Scholar] [CrossRef] [Green Version]
  55. Omni calculator, Business Days Calculator. Available online: https://www.omnicalculator.com/everyday-life/business-days (accessed on 10 September 2022).
  56. Zhao, Y.; Ercan, T.; Tatari, O. Life Cycle Based Multi-Criteria Optimization for Optimal Allocation of Commercial Delivery Truck Fleet in the United States. Sustain. Prod. Consum. 2016, 8, 18–31. [Google Scholar] [CrossRef]
  57. Hovi, I.B.; Pinchasik, D.R.; Figenbaum, E.; Thorne, R.J. Experiences from Battery-Electric Truck Users in Norway. World Electr. Veh. J. 2019, 11, 5. [Google Scholar] [CrossRef] [Green Version]
  58. Zhou, T.; Roorda, M.J.; MacLean, H.L.; Luk, J. Life Cycle GHG Emissions and Lifetime Costs of Medium-Duty Diesel and Battery Electric Trucks in Toronto, Canada. Transp. Res. Part D Transp. Environ. 2017, 55, 91–98. [Google Scholar] [CrossRef]
  59. Ahmed, N.; Thompson, S.; Glaser, M. Global Aquaculture Productivity, Environmental Sustainability, and Climate Change Adaptability. Environ. Manag. 2019, 63, 159–172. [Google Scholar] [CrossRef]
  60. Bostock, J.; McAndrew, B.; Richards, R.; Jauncey, K.; Telfer, T.; Lorenzen, K.; Little, D.; Ross, L.; Handisyde, N.; Gatward, I.; et al. Aquaculture: Global Status and Trends. Philos. Trans. R. Soc. B Biol. Sci. 2010, 365, 2897–2912. [Google Scholar] [CrossRef] [Green Version]
  61. Goldburg, R.J.; Elliott, M.S.; Naylor, R.L. Marine Aquaculture in the United States: Environmental Impacts and Policy Options; Pew Oceans Commission: Arlington, VA, USA, 2001. [Google Scholar]
  62. Losordo, T.M.; Masser, M.P.; Rakocy, J. Recirculating Aquaculture Tank Production Systems: An Overview of Critical Considerations. SRAC No. 451. 1998, pp. 18–31. Available online: https://shellfish.ifas.ufl.edu/wp-content/uploads/Handout-1_SRAC_0451_Overview-of-criticial-considerations_Recirculating-Aquaculture-Systems.pdf (accessed on 10 September 2022).
  63. Bohnes, F.A.; Hauschild, M.Z.; Schlundt, J.; Nielsen, M.; Laurent, A. Environmental Sustainability of Future Aquaculture Production: Analysis of Singaporean and Norwegian Policies. Aquaculture 2022, 549, 737717. [Google Scholar] [CrossRef]
  64. Shainee, M.; Ellingsen, H.; Leira, B.J.; Fredheim, A. Design Theory in Offshore Fish Cage Designing. Aquaculture 2013, 392–395, 134–141. [Google Scholar] [CrossRef]
  65. Wei, Y.; Wei, Q.; An, D. Intelligent Monitoring and Control Technologies of Open Sea Cage Culture: A Review. Comput. Electron. Agric. 2020, 169, 105119. [Google Scholar] [CrossRef]
  66. Subasinghe, R.; Soto, D.; Jia, J. Global Aquaculture and Its Role in Sustainable Development. Rev. Aquac. 2009, 1, 2–9. [Google Scholar] [CrossRef]
  67. Antonucci, F.; Costa, C. Precision Aquaculture: A Short Review on Engineering Innovations. Aquac. Int. 2020, 28, 41–57. [Google Scholar] [CrossRef]
  68. Kassem, T.; Shahrour, I.; El Khatabi, J.; Raslan, A. Smart and Sustainable Aquaculture Farms. Sustainability 2021, 13, 10685. [Google Scholar] [CrossRef]
  69. Ministry of Agriculture, Republic of Croatia, Fisheries. Available online: https://ribarstvo.mps.hr/default.aspx?id=79 (accessed on 20 June 2022).
  70. Eurofish. Available online: https://eurofish.dk/member-countries/croatia/ (accessed on 20 July 2022).
  71. Ćurić, I.; Grubišić, L.; Matanović, K. Uzgoj tune (Thunnus thynnus Linnaeus, 1758.): Biologija, prirodno mriješćenje i uzgoj zasnovan na ulovu mlađi. Veterinar 2020, 58, 7–13. [Google Scholar]
  72. Fish Farm Feeder. Available online: https://www.fishfarmfeeder.com/en/ (accessed on 25 July 2022).
  73. Perčić, M.; Ančić, I.; Vladimir, N. Life-Cycle Cost Assessments of Different Power System Configurations to Reduce the Carbon Footprint in the Croatian Short-Sea Shipping Sector. Renew. Sustain. Energy Rev. 2020, 131, 110028. [Google Scholar] [CrossRef]
  74. Segarić, R. Poslovanje Tvrtke Cromaris dd Zadar. Ph.D. Dissertation, The University of Applied Sciences Baltazar Zaprešić, Zaprešić, Croatia, 2020. [Google Scholar]
  75. Global Solar Atlas. Map. 2021. Available online: https://globalsolaratlas.info/map (accessed on 11 July 2022).
  76. Farkas, A.; Degiuli, N.; Martić, I. Assessment of Offshore Wave Energy Potential in the Croatian Part of the Adriatic Sea and Comparison with Wind Energy Potential. Energies 2019, 12, 2357. [Google Scholar] [CrossRef] [Green Version]
  77. For fish. Available online: https://forfish.eu/en/fish-processing-plants/ (accessed on 25 July 2022).
  78. Wind-Turbine-Models. Available online: https://en.wind-turbine-models.com/turbines/1863-aeolos-aeolos-h-20kw (accessed on 25 July 2022).
  79. BAS World. Available online: https://www.basworld.com/vehicles/used/truck-iveco-eurocargo-2022-4x2-70046142 (accessed on 2 September 2022).
  80. Diesel Sales. Available online: https://dieselsales.com/search/Engine/MERCEDES/?category=Reman+Truck+VS (accessed on 5 September 2022).
  81. Prussi, M.; Scarlat, N.; Acciaro, M.; Kosmas, V. Potential and Limiting Factors in the Use of Alternative Fuels in the European Maritime Sector. J. Clean. Prod. 2021, 291, 125849. [Google Scholar] [CrossRef]
  82. Ančić, I.; Vladimir, N.; Cho, D.S. Determining Environmental Pollution from Ships Using Index of Energy Efficiency and Environmental Eligibility (I4E). Mar. Policy 2018, 95, 1–7. [Google Scholar] [CrossRef]
  83. Croatian Energy Regulatory Agency. Available online: https://www.hera.hr/en/html/annual_reports.html (accessed on 25 July 2022).
  84. Liimatainen, H.; van Vliet, O.; Aplyn, D. The Potential of Electric Trucks—An International Commodity-Level Analysis. Appl. Energy 2019, 236, 804–814. [Google Scholar] [CrossRef]
  85. Gaines, L. Lithium-ion battery recycling processes: Research towards a sustainable course. Sustain. Mater. Technol. 2018, 17, e00068. [Google Scholar] [CrossRef]
  86. Hadžić, N.; Kozmar, H.; Tomić, M. Feasibility of Investment in Renewable Energy Systems for Shipyards. Brodogradnja 2018, 69, 190811. [Google Scholar] [CrossRef]
  87. Elangovan, R.; Kanwhen, O.; Dong, Z.; Mohamed, A.; Rojas-Cessa, R. Comparative Analysis of Energy Use and Greenhouse Gas Emission of Diesel and Electric Trucks for Food Distribution in Gowanus District of New York City. Front. Big Data 2021, 4, 693820. [Google Scholar] [CrossRef] [PubMed]
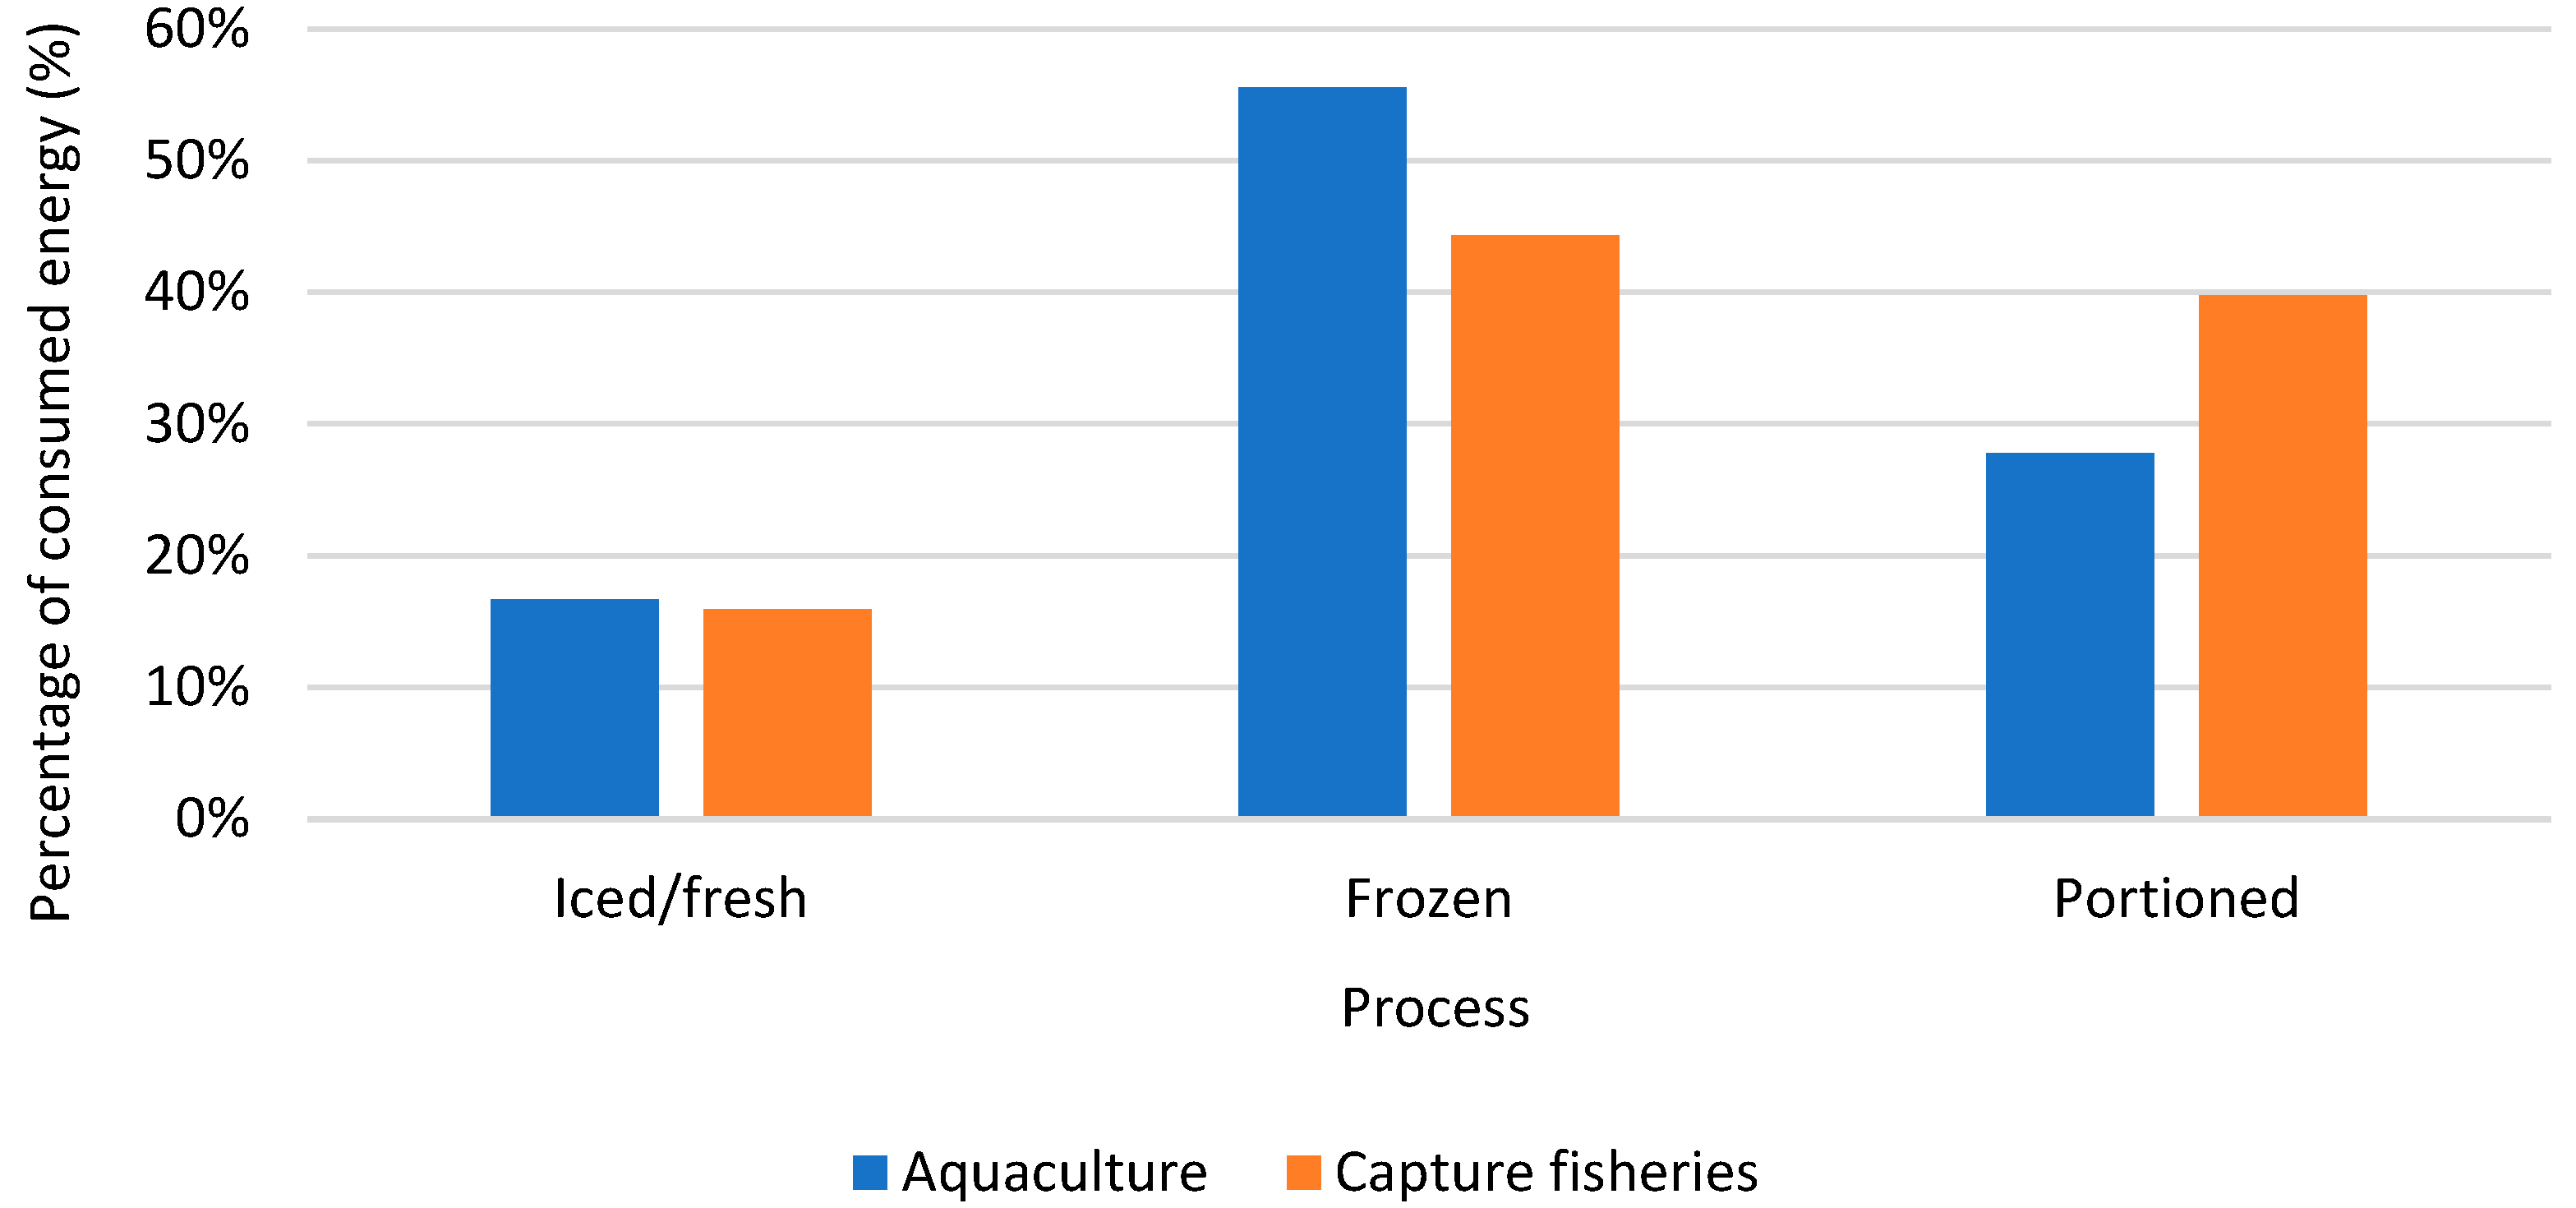
Figure 1. Energy consumption in aquaculture and capture fisheries.
Energies 15 08197 g001
Figure 2. Ratio between fossil fuels and renewable energy sources in aquaculture.
Energies 15 08197 g002
Figure 3. Environmental risks from aquaculture production.
Energies 15 08197 g003
Figure 4. Simplified scheme of a fish production process.
Energies 15 08197 g004
Figure 5. Energy used in aquaculture production, by phases.
Energies 15 08197 g005
Figure 6. Energy consumption by phase.
Energies 15 08197 g006
Figure 7. Model of an alternative aquaculture system.
Energies 15 08197 g007
Figure 8. Energy consumption at the factory.
Energies 15 08197 g008
Figure 9. Investigated mariculture farm in Zadar County, Croatia.
Energies 15 08197 g009
Figure 10. Generated electricity in Croatia in 2020.
Energies 15 08197 g010
Figure 11. LCCA results.
Energies 15 08197 g011
Figure 12. The sensitivity of specific costs with respect to fuel price.
Energies 15 08197 g012
Figure 13. Investment and maintenance costs of RES system.
Energies 15 08197 g013
Figure 14. Costs of electric energy combined with RES system.
Energies 15 08197 g014
Figure 15. LCCA results in distribution phase.
Energies 15 08197 g015
Table 1. Advantages and drawbacks of using technology in the fishing sector.
SensorParametersAndroid ApplicationWeb ApplicationAdvantagesDrawbacks
Celefish [26]Weather,
Fishpond information, Disease,
Price fluctuation
n/aYesAI platform, which includes suppliers, fish market, catering enterprises, banks, and insurance companiesSingle case study, new areas to explore, how users interact and contribute to sustainability, what are the challenges and obstacles regarding sustainable development, disruption of traditional industries
IoT-based aquaculture system [24]Temperature, pH, Dissolve oxygen, AmmoniaYesNoImprove and monitor the quality of water, and aquatic environment more profitable, sustainable, and productiveMore parameters for the future, lack of the necessary equipment to maintain proper health for fish, lack of sharing knowledge and informing the fish farmers
Artificial Neural Network (ANN) [27]Salinity, Dissolved oxygen, pH, TemperatureYesYesA convenient and easily accessible tool to
manage aquatic farming
Limitations for specific applications, the lack of a webcam be linked to an image detector in a computer
Intelligent fish farm [28]pH, Dissolved oxygen, EC, Temperature, Ammonia, Nitrite, automatic equipmentYesYesMeasurement and control, feeding, inspection, and harvesting
Equipment for an intelligent fish farm is introduced in detail
Education of the farmers, lack of government support, installation and procurement of the equipment
Fish Farm Data (eFish Benin, eAquaculture) [29]For fish diseases classification: Convolutional Neural Network, water quality monitoring, issues detection, alerting, remote pumps controls, and fish diseases detectionYesn/aArduino Mega, ESP32, wi-fi, and MQTT protocol to collect
data from fish farms and send them in real time to smartphones, a digital community for fish farmers to improve their activities
Dependency on wi-fi connectivity and low accuracy in fish diseases classification, improvement of the classification accuracies, deploying the model on ESP32, and integration connectivity media such as SIM Card Router, etc.
Blockchain-based fish farm platform [30]Data integrity for aquaculture Providing secure storage for large data files and minimizing duplication, approachable interface to provide interaction between the legacy system and the blockchain network, highly secure data and deleting historyThe threat of data transmission, lack of authentication, the connection of peer nodes to Local Area Network (LAN), not Wide-Area-Network (WAN)
Table 2. Vessel particulars [1].
Power SystemDiesel Engine Powered
FC daily, kg250
EC daily, kWh1162.79
Equipment consumption daily, kWh0.8159
Table 3. Specific energy consumption per kg of produced fish in the whole mariculture production process.
Energy
Consumption
Vessel + Feeding MachineIndustry ProcessDistribution
kWhdaily0.0960.03790.1428
kWh production process70.8027.67104.24
Total consumption in cycle, kWh/kg of fish201.91
Table 4. Particulars of RES system.
PV System Wind Turbine
A (m2)1000Rated capacity (kW)20
η (%)17D (m)10
ts (h)7Swept area (m2)78.5
Erad (MJ/m2)5825Power output–daily (kWh)310.4
Power output–daily (kWh)107.64
Total power output = 418.04 kWh/day
Table 5. Electric vehicle characteristics [84].
ManufacturerCommercial NameMaximum WeightBattery Capacity (kWh)Range (km)Energy Consumption (kWh/km)
VolvoFl Electric16 t 100–300100–3001.00
Publisher’s Note: MDPI stays neutral with regard to jurisdictional claims in published maps and institutional affiliations.