Article

Experimental and Numerical Investigation on the Dynamics of Impacting Droplet Spreading at Small Weber Numbers

1
School of Mechanical Engineering, Beijing Institute of Technology, Beijing 100081, China
2
China International Engineering Consulting Corporation, Beijing 100048, China
*
Author to whom correspondence should be addressed.
Energies 2022, 15(21), 8181; https://doi.org/10.3390/en15218181
Submission received: 20 September 2022 / Revised: 21 October 2022 / Accepted: 27 October 2022 / Published: 2 November 2022
(This article belongs to the Topic Computational Fluid Dynamics (CFD) and Its Applications)

Abstract

:
The dynamic of droplet spreading on a free-slip surface was studied experimentally and numerically, with particularly interest in the impacts under relatively small droplet inertias ( W e 30 ). Our experimental results and numerical predictions of dimensionless droplet maximum spreading diameter β m a x agree well with those of Wildeman et al.’s widely-used model at W e > 30 . The “1/2 rule” (i.e., approximately one half of the initial kinetic energy E k 0 finally transferred into surface energy) was found to break down at small Weber numbers ( W e 30 ) and droplet height is non-negligible when the energy conservation approach is employed to estimate β m a x . As We increases, surface energy and kinetic energy alternately dominates the energy budget. When the initial kinetic energy is comparable to the initial surface energy, competition between surface energy and kinetic energy finally results in the non-monotonic energy budget. In this case, gas viscous dissipation contributes the majority of the dissipated energy under relatively large Reynolds numbers. A practical model for estimating β m a x under small Weber numbers ( W e 30 ) was proposed by accounting for the influence of impact parameters on the energy budget and the droplet height. Good agreement was found between our model predictions and previous experiments.

Graphical Abstract

1. Introduction

Droplet impact on a solid surface is regularly observed in many nature and industrial process, such as raindrops hitting soil [1,2], petrochemical processes [3,4], ice resisting [2,5], painting [6], fog harvesting [7] and spray combustion in various engines [8,9,10]. As for port-injection gasoline engines, hydrocarbon fuel droplet impacts on the intake port and intake valves tend to form an oil film and therefore facilitate fuel evaporation; while for direct-ignition engines, liquid fuel is more likely to impact the combustion chamber due to the increasingly high fuel injection pressure [11]. It has been recognized that spray/wall interaction characteristics substantially influence mixture formation and subsequent combustion, and therefore influences engine efficiency and emission. One of the most important issues of spray/wall interaction is the dynamic of a droplet impacting a solid surface, which is usually adopted to estimate the wall film performance [12,13,14,15].
As a fundamental phenomenon in the investigation of spray/wall interactions, the dynamic of a droplet impacting a solid surface has been studied for decades. Previous investigations indicate that the impacting dynamic is controlled by the impact Weber number W e = ρ l D 0 U 0 2 / σ l , and the Reynolds number R e = ρ l D 0 U 0 / μ l . In some cases, the Reynolds number can be replaced by the Ohnesorge number O h = μ l / ρ l σ l D 0 , since O h = W e / R e . Where D 0 is the droplet initial diameter, U 0 is the impact velocity, and ρ l , μ l , and σ l , are the droplet density, viscosity and surface tension, respectively.
By employing dimensionless parameters, transitions between different impacting outcomes such as spreading, bouncing and splashing can be quantified. For droplet spreading, one of the most important factors is the dimensionless droplet maximum spreading diameter β m a x , which is defined as the ratio of droplet maximum spreading diameter D m over its initial diameter D 0 , and which yields β m a x = D m a x / D 0 . Quantifying β m a x is useful in many practical applications, such as estimating oil film characteristics [12].
A considerable number of models have been proposed for β m a x quantifying, which have been reviewed in some excellent literature [16,17,18]. Normally, the existing models for predicting β m a x possess three different categories, namely, scaling law [11,16,19,20,21,22,23,24,25,26,27,28,29] momentum conservation [30,31,32,33] and energy conservation [17,34,35,36,37,38,39,40,41]. For viscous fluid such as liquid hydrocarbon fuel, the contribution of viscous dissipation on energy conservation is non-negligible therefore an energy conservation approach tends to predict more accurate β m a x . In this case, accurately predicting the viscous dissipation rate, and hence the dissipated kinetic energy, is essential for predicting droplet dynamic characteristics.
To account for viscous dissipation during spreading, Wildeman et al. proposed the “1/2 rule” which indicates that around one half of the kinetic energy finally transforms into surface energy for droplet spreading on an ideal free-slip surface under relatively large Weber numbers ( W e > 30 ) and Reynolds numbers. The “1/2 rule” allows a complete theoretical solution for β m a x prediction. The uniform droplet deformation under relatively large W e may be the main reason for uniform kinetic energy dissipation and the asymptotically accurate “pizza-shaped” deformation for W e > 30 indicates droplet inertia dominates droplet internal flow, almost regardless of R e . In this case, liquid viscosity slightly influences droplet spreading dynamic. In spite of these advances in understanding droplet spreading dynamic under large Weber numbers ( W e > 30 ), it is surprising to find that only a few works have been conducted for small Weber numbers ( W e 30 ).
It is recognized that, in the combustion chamber of modern energy conversion devices such as an internal combustion engine, the increasingly higher ambient pressure together with the complex air motion, substantially reduces the inertia of the fuel droplets and implies that droplets are more likely to impact the chamber edge at small Weber numbers [42]. To investigate droplet spreading under relatively small W e , Qin et al. [43] experimentally studied the dynamic of a glycerol-water blend droplet impact on a near-smooth stainless steel surface. They observed the non-monotonic effect of liquid viscosity on β m a x at W e = 13 and 30. Specifically, an increase of liquid viscosity promotes energy dissipation under relatively small R e cases, however, viscosity plays an opposite role under relatively large R e conditions. Subsequently, Zhang and Zhang [44] numerically simulated Qin et al.’s experiments, numerically confirmed the non-monotonic tendency of β m a x and attributed it to the dual role of liquid viscosity under small Weber numbers ( W e 30 ), where droplet deformation is non-uniform.
It has been recognized that droplet shapes at maximum deformation instant τ m a x will change from “puddle-shaped” to “pizza-shaped” when droplet inertia increases from W e = 3 to W e = 30 . Most of the previous studies have focused on modeling β m a x under large W e , where droplet deformation appears as uniform “pizza-shaped” styles and hence energy dissipation is W e -independent. In terms of the complex droplet deformation and energy dissipation characteristics, modeling β m a x under relatively small We has been investigated insufficiently [45,46].
Based on the discussion stated above, the present study aims to experimentally and numerically investigate the impacting dynamics and model β m a x under relatively small Weber numbers ( W e 30 ). Following our previous numerical works [44,47,48], a well-validated front tracking method (referred to as FTM hereinafter) was employed to conduct the numerical simulations associated with our experiments. In the following text, we shall first introduce our experimental and numerical approach in Section 2, followed by the discussion of spreading dynamic, particularly for small Weber numbers. Subsequently, the correlation between impact parameter and β m a x will be discussed. Finally, the conclusion will be presented in the last section.

2. Experimental Setup and Numerical Methodology

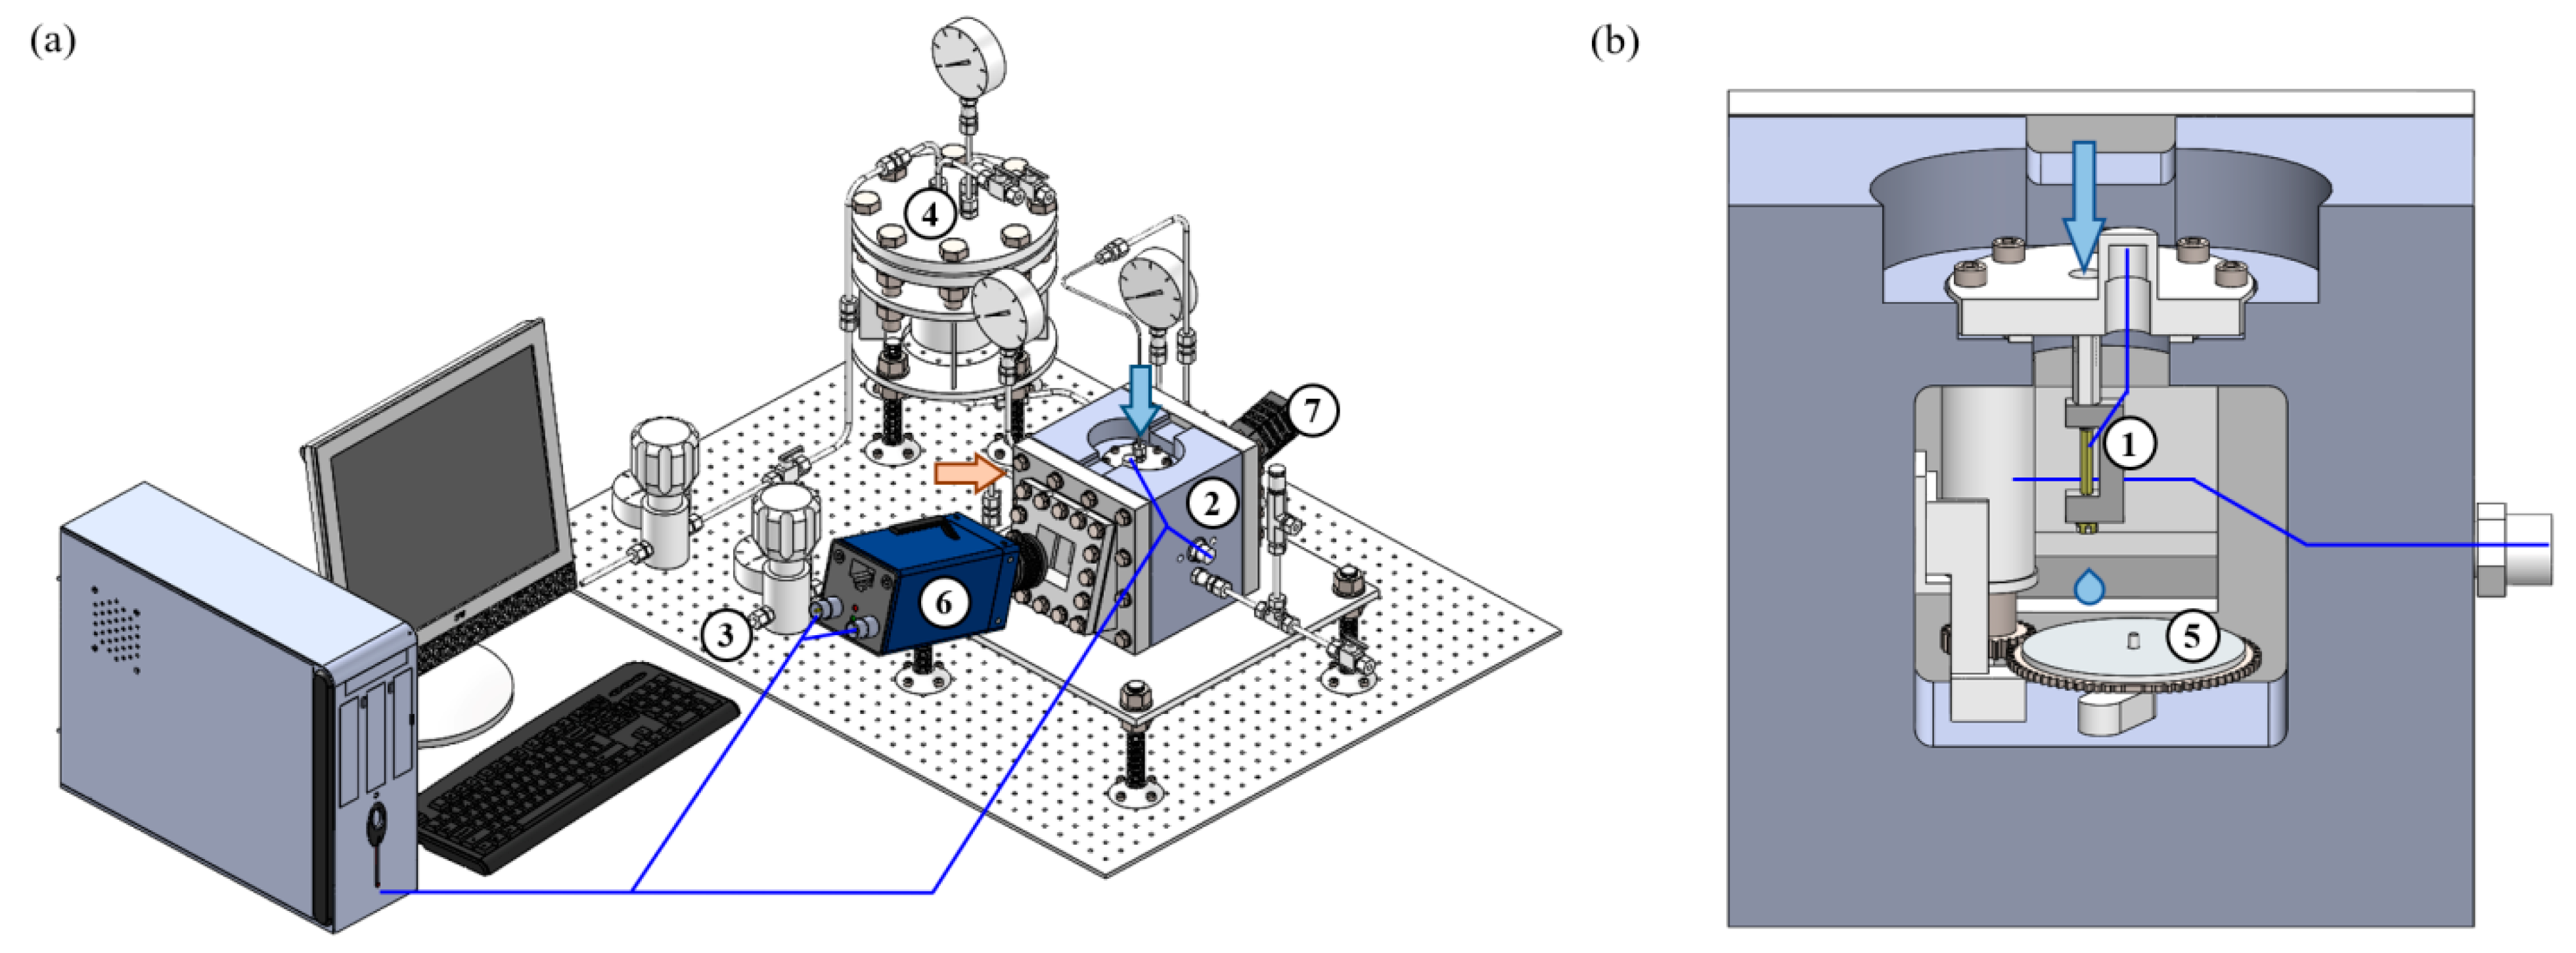
2.1. Experimental Setup

Figure 1 shows the schematic of our experimental apparatus. A Gyger Smld 300 G droplet generator (1) was mounted on the top side of the constant volume chamber (2), which was filled with atmospheric pressure nitrogen. Nitrogen was initially stored in the cylinder and entered into the chamber through the regulating valve (3). Liquid fluid was deposited in the liquid tank (4) and driven by high pressure nitrogen to form the droplet. The droplet impact on the solid surface (5) process was recorded by a Photron Fastcam Nova S12 high-speed camera (6) with 100,000 fps, and an LED lamp (7) was used for backlight. Specifically, the angle between camera and the solid surface was set as 15 ° to better display the result and all measured quantities in the vertical direction, such as height and speed, were conducted with a cosine correction of 15°. For the repeatability of the experiments, the sphericity of the droplet can be quantified by S = m i n ( D H / D V , D V / D H ) , where D H and D V are the droplet sizes measured in the horizontal and vertical directions respectively ( D H is the value after a cosine correction of 15°). S is 1.0 ± 0.05 , indicating a satisfactory and reproducible droplet sphericity. Meanwhile, a typical droplet initial diameter is 2.75 × 10 4 m and the typical O h is around 0.007. As for uncertainty estimation, the maximum error in the estimated droplet diameter is approximately 1 pixel (equivalent to 6.16 μ m ). Therefore, the uncertainty in D 0 and U 0 is less than 2.5%. As a result, the relative error of the Weber number Δ W e / W e = Δ D 0 / D 0 + 2 Δ U 0 / U 0 is less than 7.5%. The distance between the outlet of the droplet generator to the solid surface is around 50 mm and this distance can vary to avoid droplet vibration. The droplet has a non-zero and variable initial velocity at the outlet of the droplet generator. A self-developed program based on video-image processing has been used to realize droplet recognition, droplet diameter, velocity extraction and the impact parameters calculation during the spreading dynamics. Before each experiment, a smooth stainless-steel surface was cleaned carefully three times with anhydrous ethanol until the surface was free of any stains and of any scratches on the surface. When performing the experiment, the surface was placed directly below the outlet of the droplet generator, high-speed camera trigger mode was set to end and droplet generator ‘peak-hold’ related parameters were set at the same time. The high-speed camera was triggered manually to start recording images and the droplet generator was triggered to produce droplets. The recording image was stopped as soon as any droplets impacted the surface. The surface can be rotated to move the area that has not been impacted by droplets underneath the outlet for the next experiment. When the surface was full of water stains, the clean surface was replaced and the experiment was repeated.

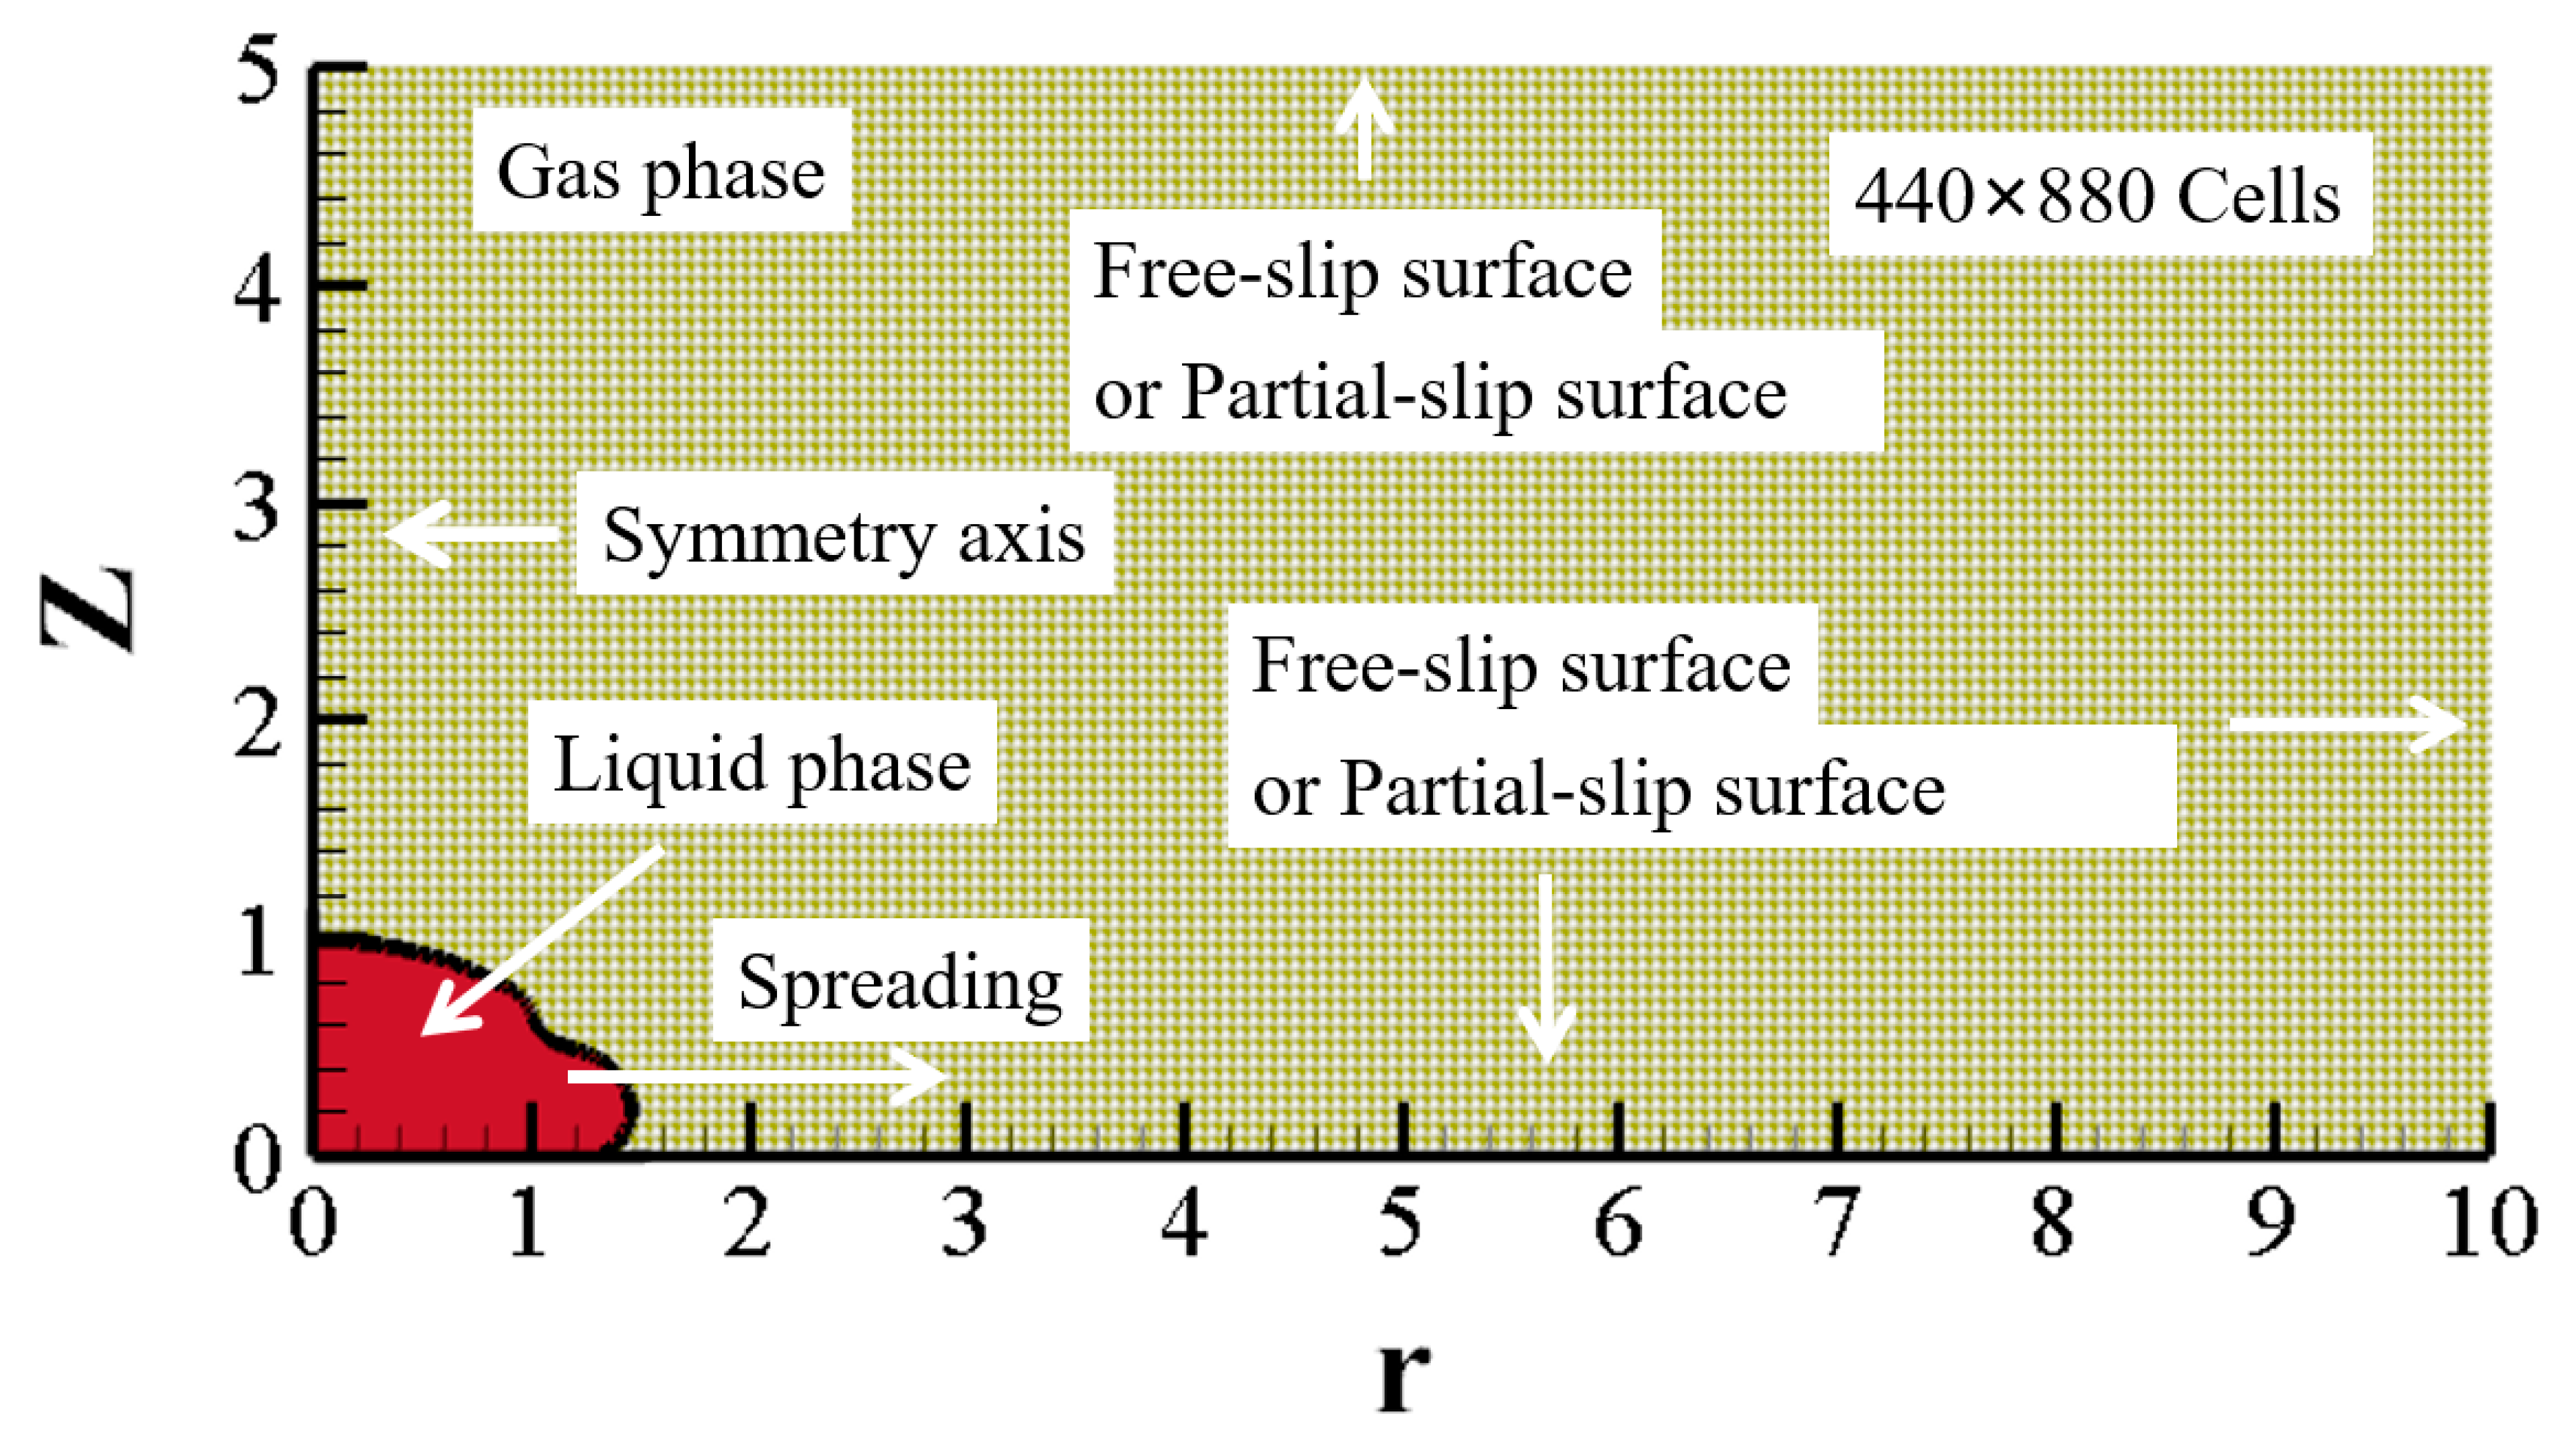
2.2. Numerical Methodology

The present numerical study was conducted by adopting the FTM, which was originally developed by Unverdi et al. [49] and Tryggvason et al. [50] to simulate droplet impacts on a free-slip surface for incompressible two-phase flow. A second-order centered difference scheme for the spatial variables and an explicit first order time integration method was employed to solve the governing equations of both liquid and gas phases, given by
· U = 0
( ρ U ) t + · ( ρ U U ) = p + · μ [ U + ( U ) T ] σ   κ n δ ( x x f ) d A
where U is the velocity vector, ρ is the density, p is the pressure, μ is the viscosity, σ is the surface tension coefficient, κ is twice the mean curvature of local field, n is the unit vector outwardly normal to the local front. The term δ is the constructed three-dimensional δ function which represents the singular force, surface tension, over the phase interface, x is the point at which the equation is evaluated, and x f is a point on the front.
The FTM solves a single set of conservation equations with appropriate interface terms in the whole field with a Eulerian coordinate grid and tracks liquid–gas interfaces using a Lagrangian approach. Figure 2 shows the computational domain of the current numerical simulation. In the cylindrical coordinate, z-axis is structured by the droplet initial velocity normal to the surface, while the r -axis is perpendicular to the droplet initial velocity. Axisymmetric boundary condition is specified for the z -axis, while free-slip boundary conditions are specified to all of the other boundaries including the impacting solid surface.
The computational domain of width 10 R 0 and height 5 R 0 is discretized by a uniform orthogonal mesh with 440 × 880 cells, which means each unit length contains 88 grid points. Grid-dependence of the present numerical approach has been fully checked in many previous works in which FTM is not sensitive to the grid size because the liquid–gas interface is tracked by the Lagrangian particles rather than computational cell. Additionally, the present cell size has been validated in one of the author’s previous publications, where simulations with the same cell size have been proved to successfully and accurately solve the droplet problems. It should be noted that the droplet impact problem is always involved in complex gas film problems. In order to simplify the present simulation, we only focus on the limiting condition of droplet spread with a gas film throughout the whole process.
Governing equations are nondimensionalized by the droplet radius R 0 = D 0 / 2 , initial velocity U 0 , and droplet density ρ l . Time is normalized by using τ = t · U 0 / D 0 , where t is the real time. In addition, several previous studies [44,47,48] have confirmed that gas-liquid density ratio ρ g / ρ l and viscosity ratio μ g / μ l are two or three orders of magnitude smaller than unity. Therefore, their effects on droplet deformation and viscous dissipation can be neglected, where ρ g and μ g are gas density and viscosity, respectively. Meanwhile the droplet initial kinetic energy is E k 0 = π ρ V 0 2 D 0 3 / 12 and the droplet initial surface energy is E s 0 = σ π D 0 2 .

3. Results and Discussion

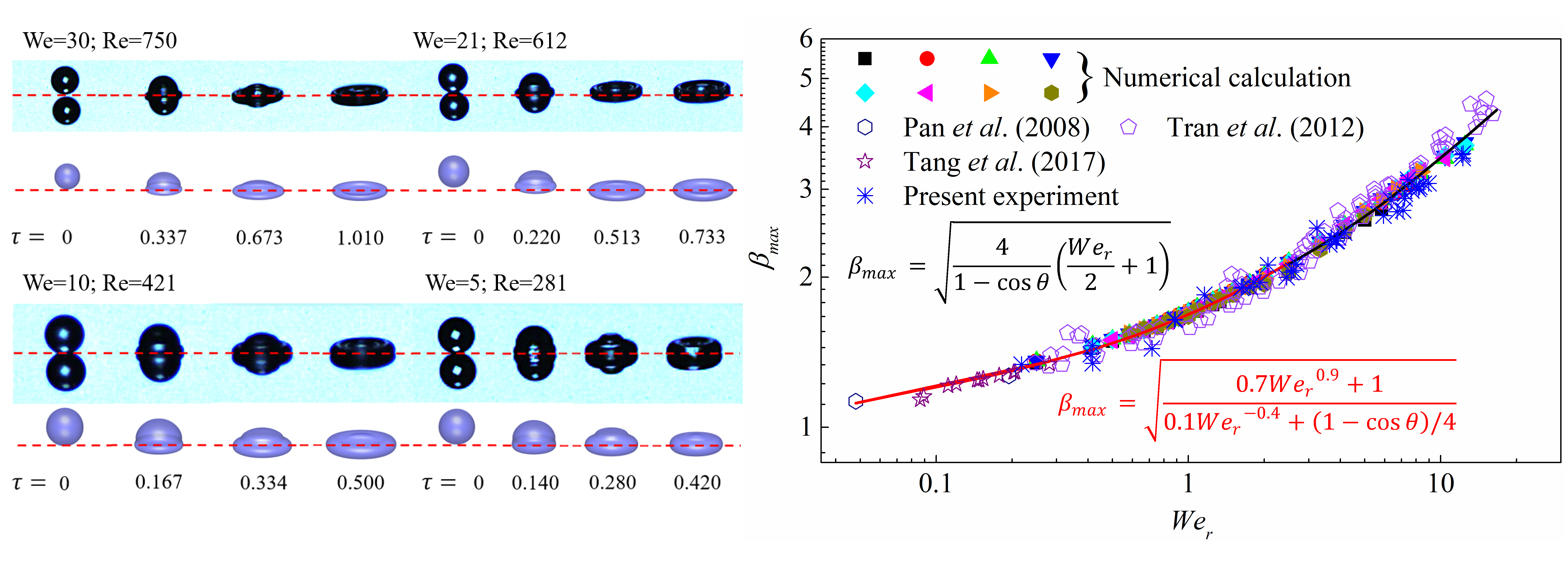
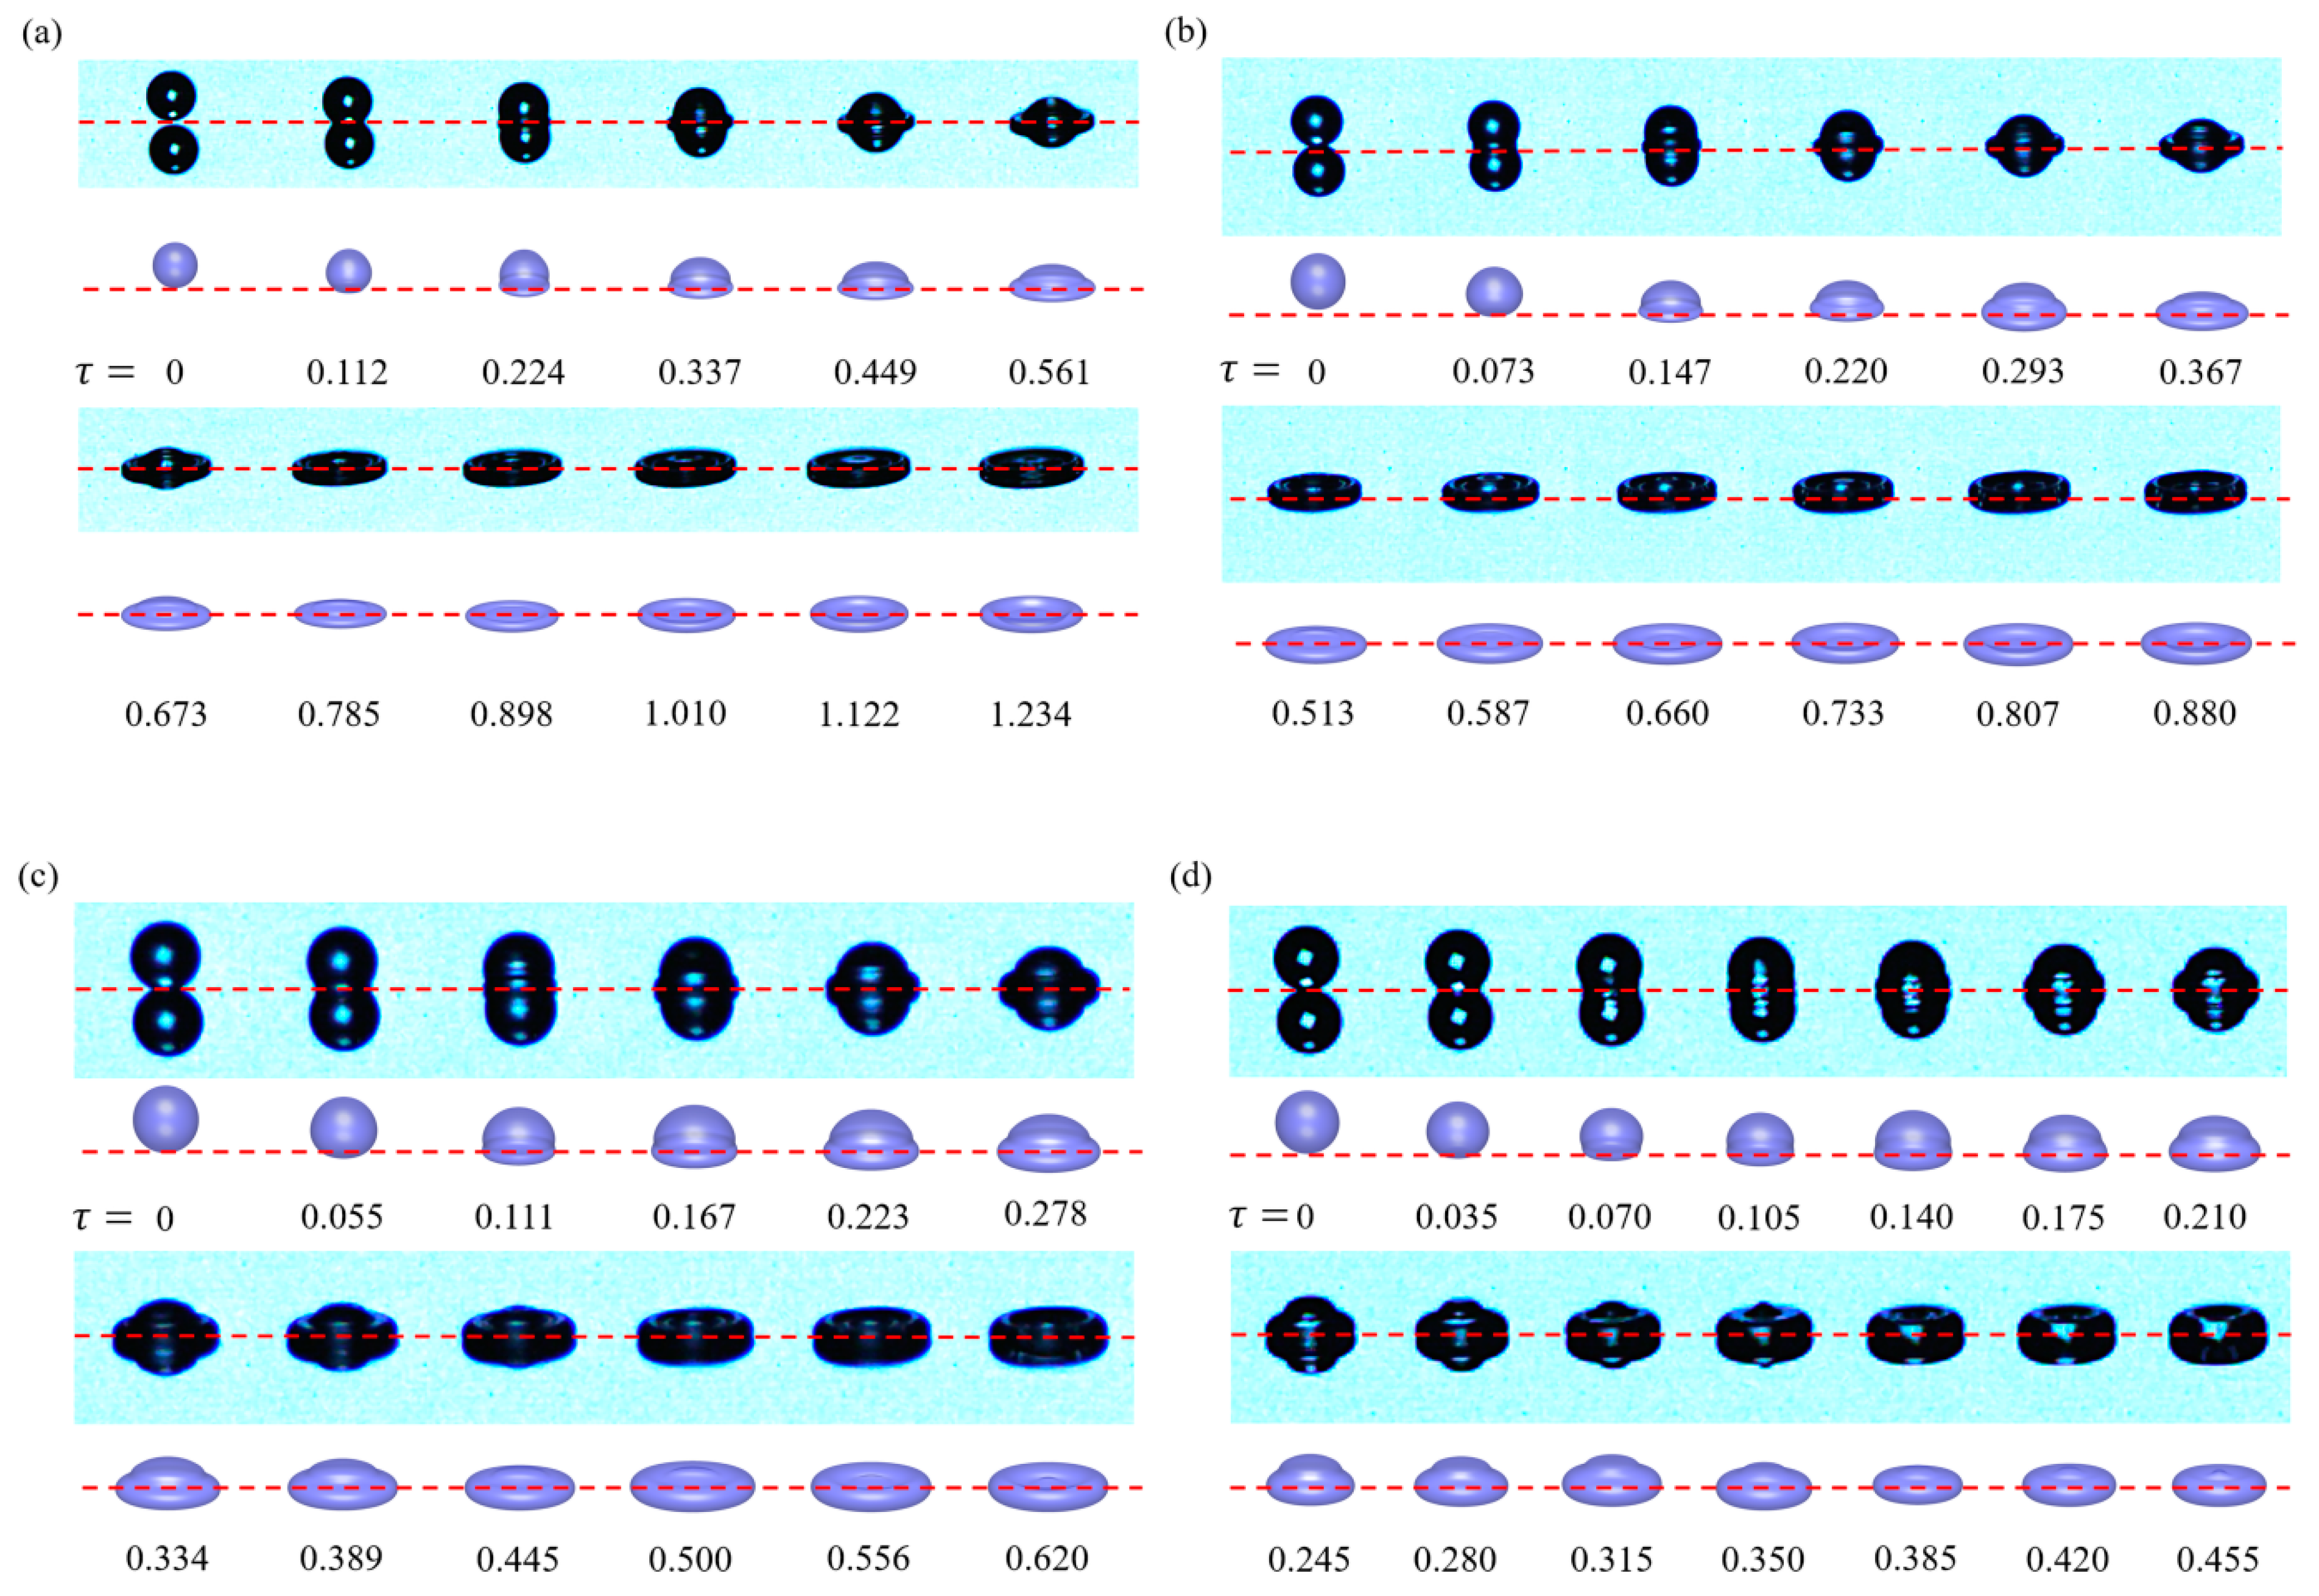
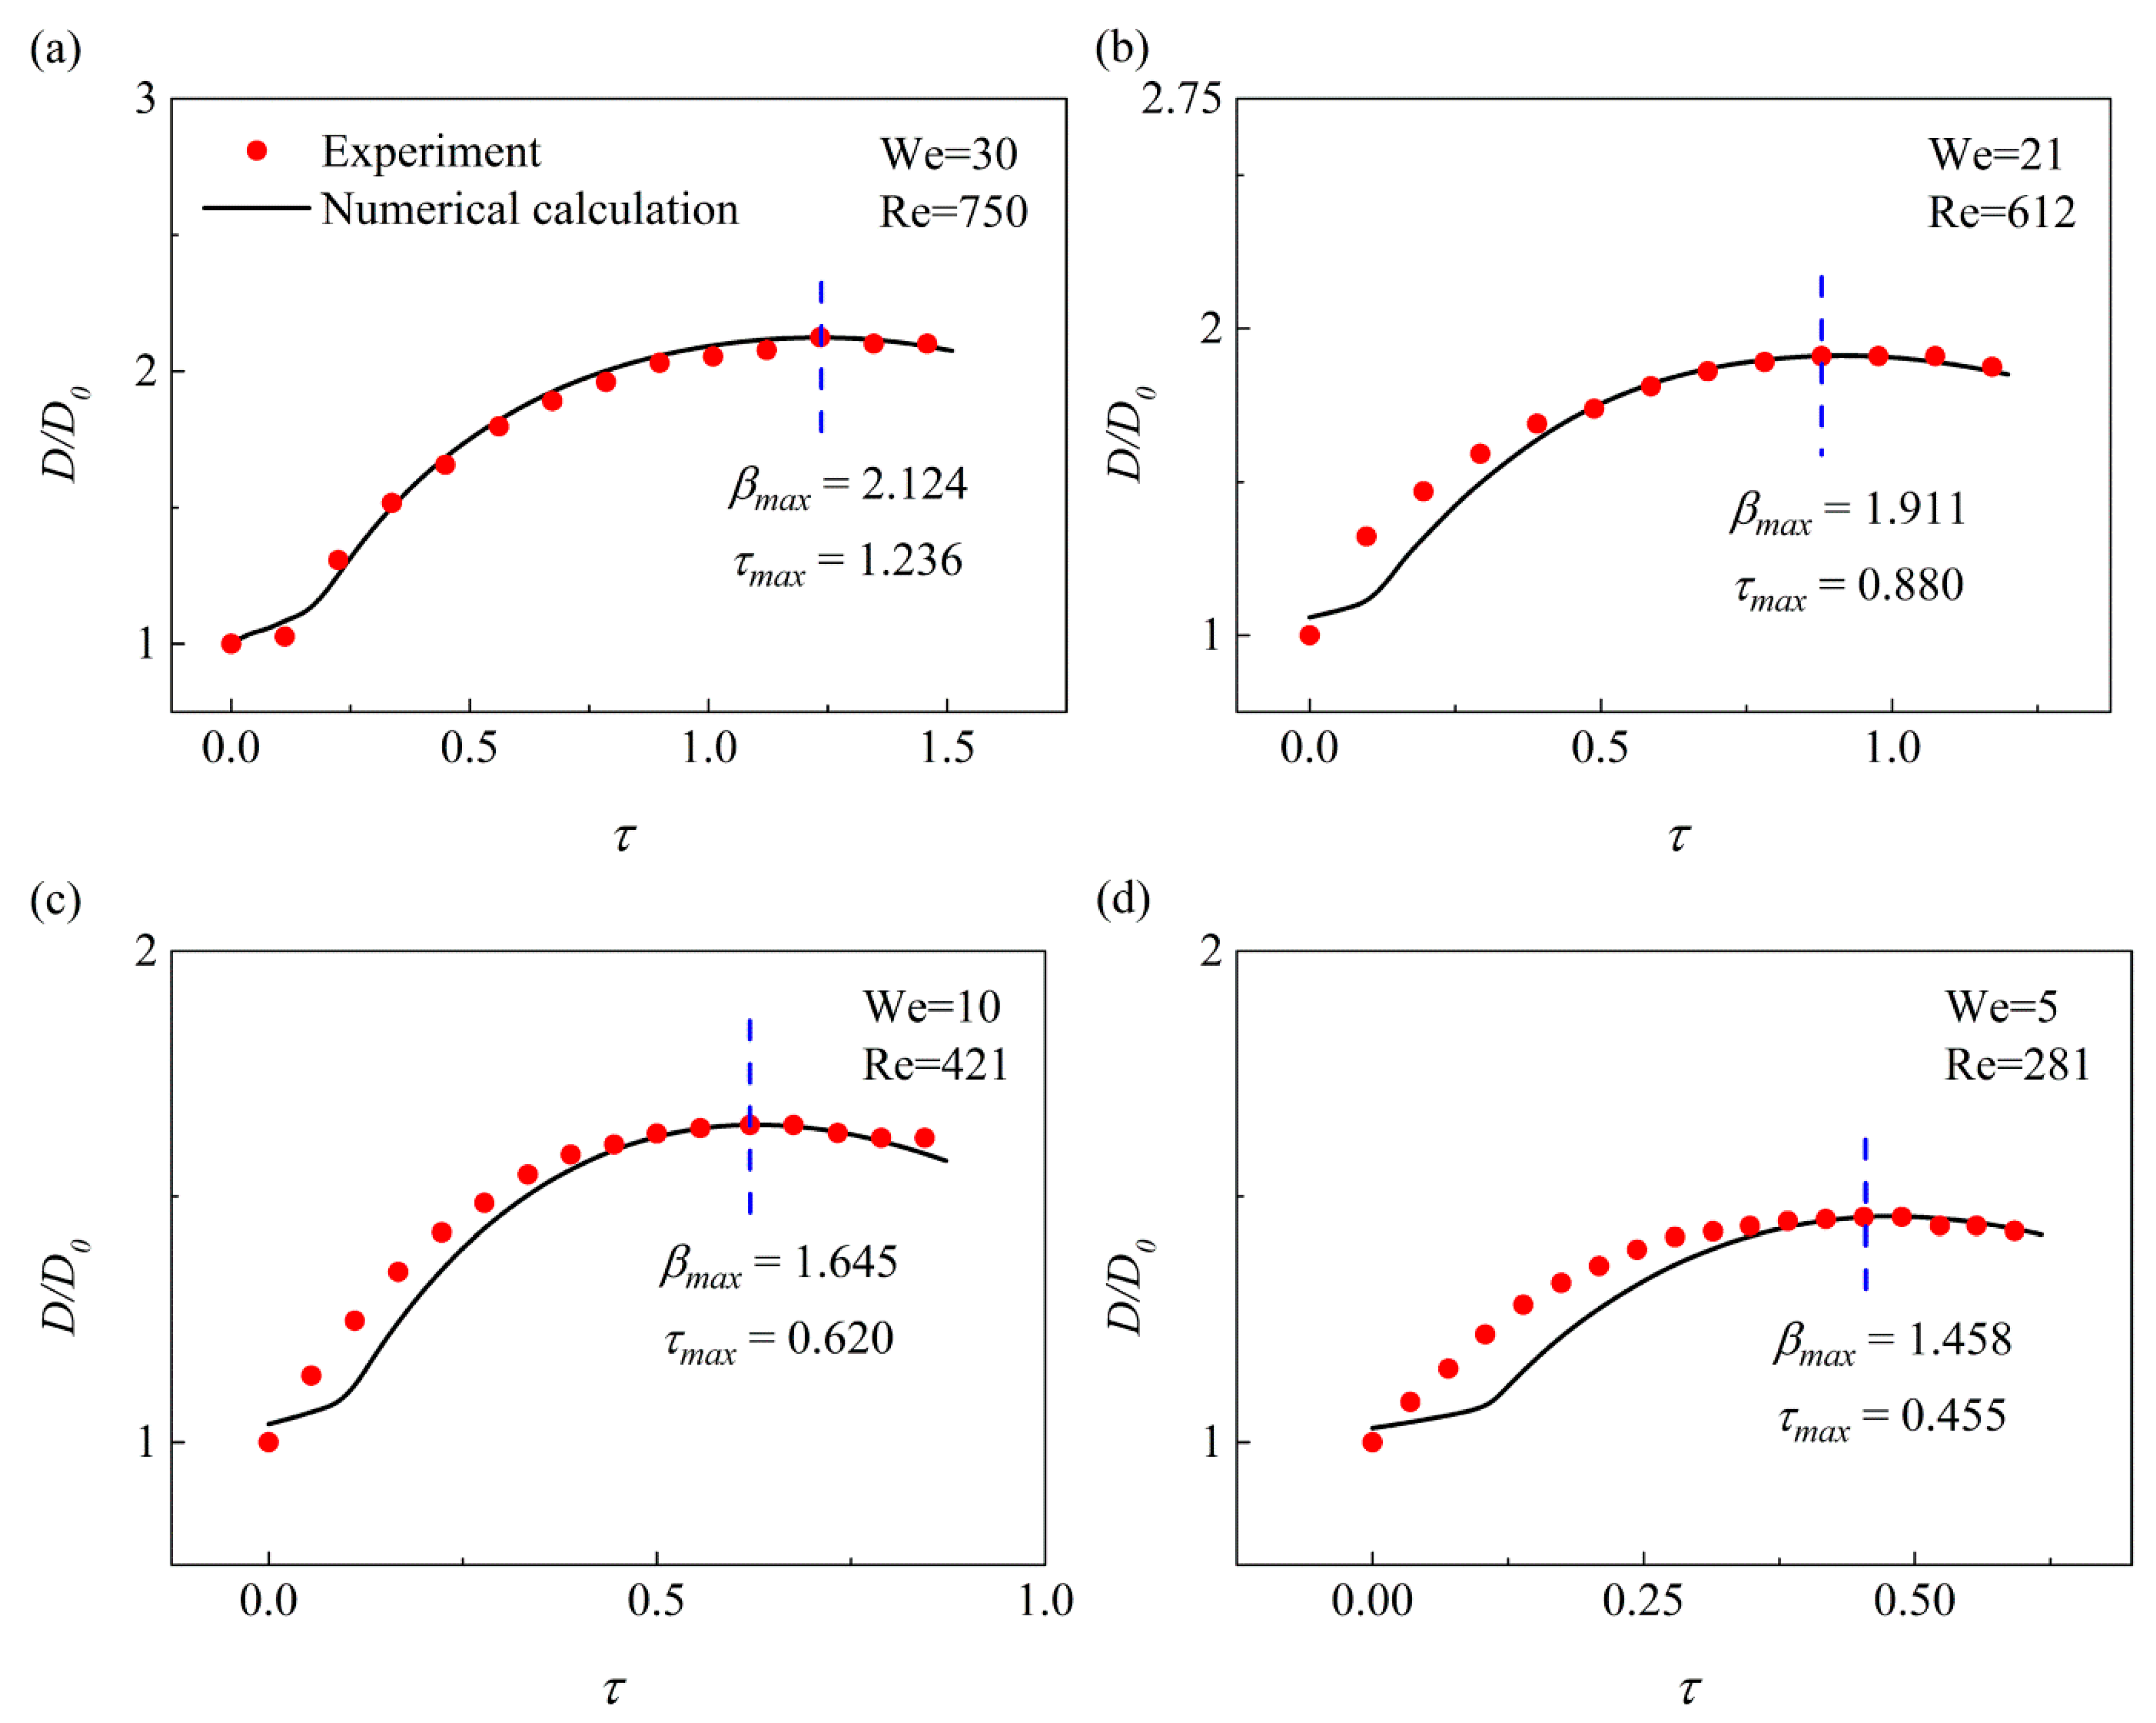
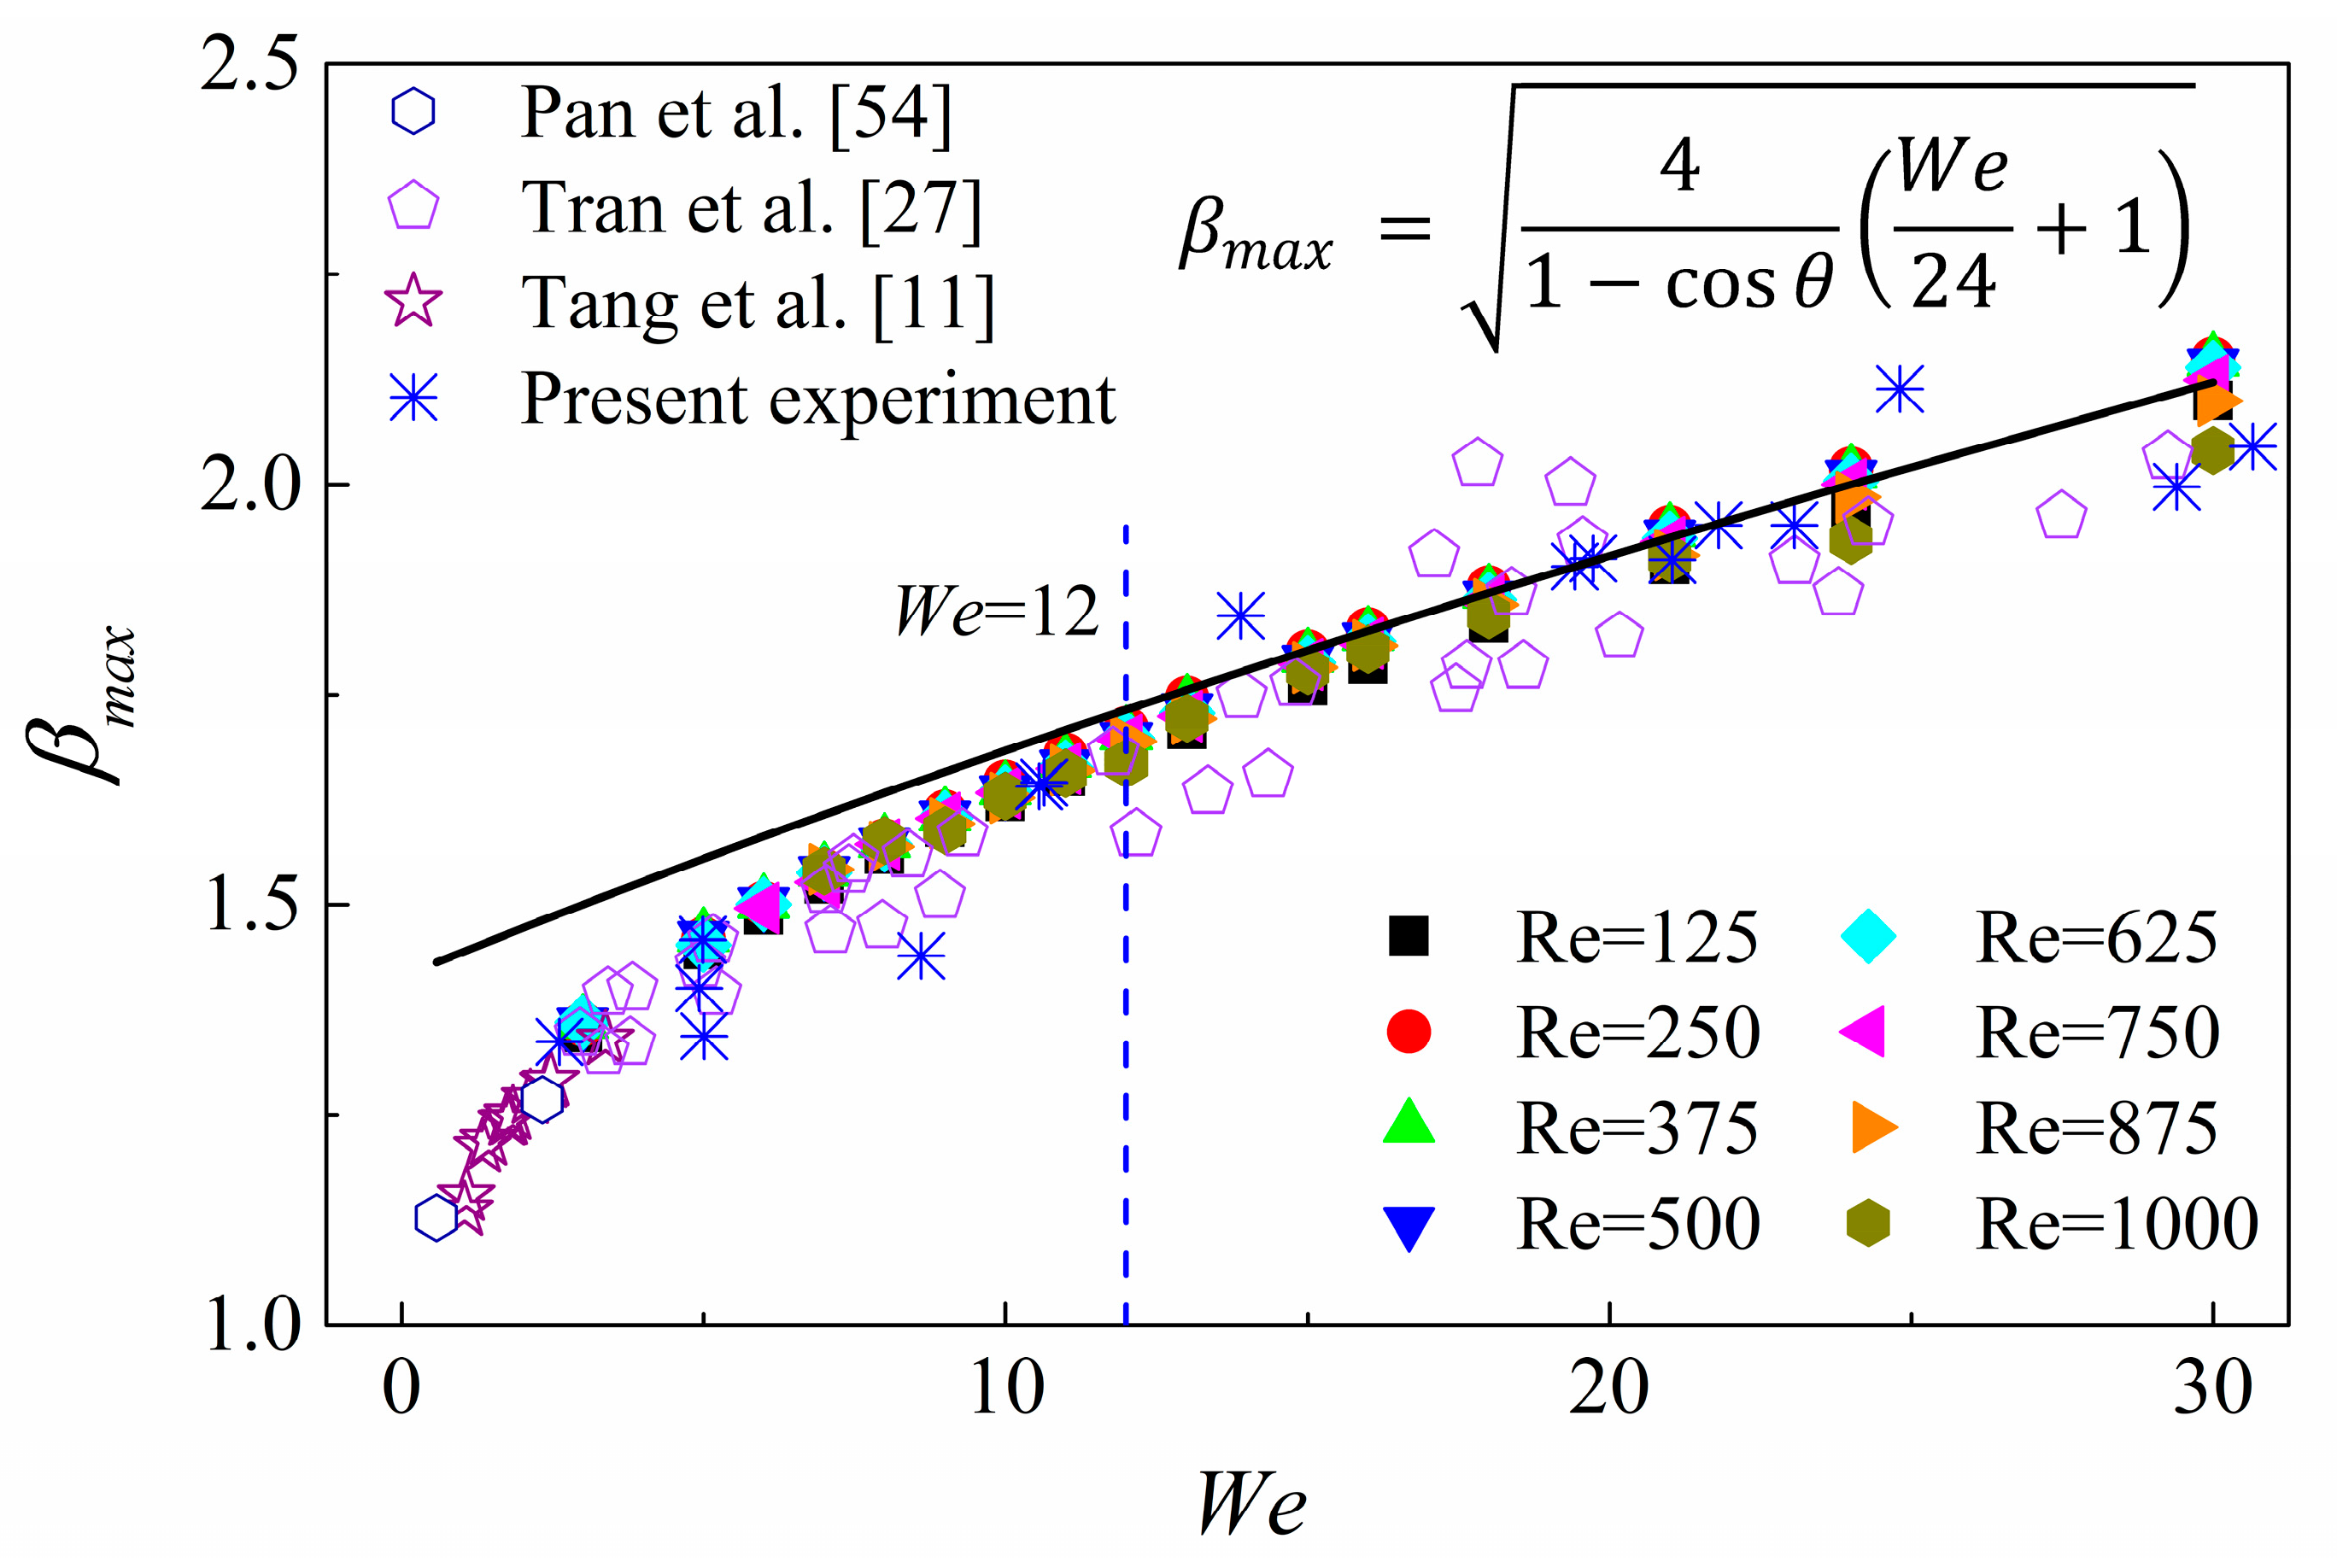
3.1. Comparison between Experimental Results and Numerical Predictions

The FTM adopted in the present study has been sufficiently applied and validated in many previous studies [44,47,48,51,52,53,54,55,56,57,58] on droplet dynamic problems. For a brief summary, Pan et al. [54] and Zhang and Zhang [48] numerically simulated the binary droplet collision dynamics using FTM, numerical predictions show good agreement with experimental results. Subsequently, one of the authors compared their numerical result of droplet spreading on a free-slip surface to Pan et al.’s experiment and very good agreement in terms of instantaneous droplet shape was observed, which again demonstrates that the present numerical method can be used to accurately predict the evolution of droplet deformation during impacting. Additionally, the present numerical approach successfully reproduced, albeit qualitatively, the experimental observation of Qin et al. [43] where β m a x varies non-monotonically with the liquid viscosity (characterized by the O h ).
To further validate the numerical calculation, ultra-pure water droplet impacts on a smooth surface were achieved by our experimental system and numerical calculation, respectively. For the mentioned characteristics of the surface used in the current experiment in Table 1, the droplet corresponds to spreading on a partial slip boundary surface and with an advancing contact angle between 90° and 180°. For our current experimental work, our numerical calculation employs a simplified boundary condition where partial slip boundary and a fixed contact angle 180° are used instead of advancing contact angles between 90° and 180° as in the experiments.
Figure 3 shows the time sequences of droplet spreading process for both experimental and numerical results under four different conditions. For spreading at W e = 30 and R e = 750 , as shown in Figure 3a, τ = 0 indicates the time instant when the droplet just contacts the surface. As time develops to τ = 0.224 , a rim-shaped bulge is squeezed out due to sufficiently large initial kinetic energy, which is 2.5-times the initial surface energy. Subsequently, spreading begins and the rim moves outwardly then reaches its maximum spreading at τ = 1.234 , when the droplet deforms to a thin liquid film with a thicker annular rim with a pizza-like shape. A similar phenomenon also can be seen for W e = 21 and R e = 612 , where the initial kinetic energy is 1.75-times the initial surface energy, as shown in Figure 3b. However, the rim thickness seems higher than that of the W e = 30 case. With impact, inertia degenerates to W e = 10 , where initial kinetic energy is weaker than that of surface energy. Droplet at the maximum spread time instant of τ = 0.62 hardly keeps its pizza-like shape, but tends to transfer into a donut-like shape, as shown in Figure 3c. The donut-like shape droplet becomes more prominent in the case of the relatively smaller Weber number, as shown in Figure 3d. When compared to the numerical predictions, regardless of some discrepancies to be discussed later, good agreement can be observed for the geometric features in which the spherical droplet turns concave and the rim is squeezed out.
More supporting evidence for validation is illustrated in Figure 4 where droplet non-dimensional diameter D / D 0 varied with non-dimensional time τ . Our numerical predictions agree very well with the experimental results under the condition of W e = 30 and R e = 750 , as shown in Figure 4a, but some discrepancies in the earlier stage of our numerical simulation tends to underestimate the non-dimensional diameter. The moderate difference of the droplet shape in Figure 3b–d can be understood by recognizing that the simplified boundary conditions for the numerical calculation cause the slight deviations corresponding to the real physics for droplet spreading. Beyond this, numerical predictions again coincide with the experimental results. Consequently, it is confirmed that the present numerical approach can accurately predict the evolution of droplet spreading during impacting a free-slip surface.

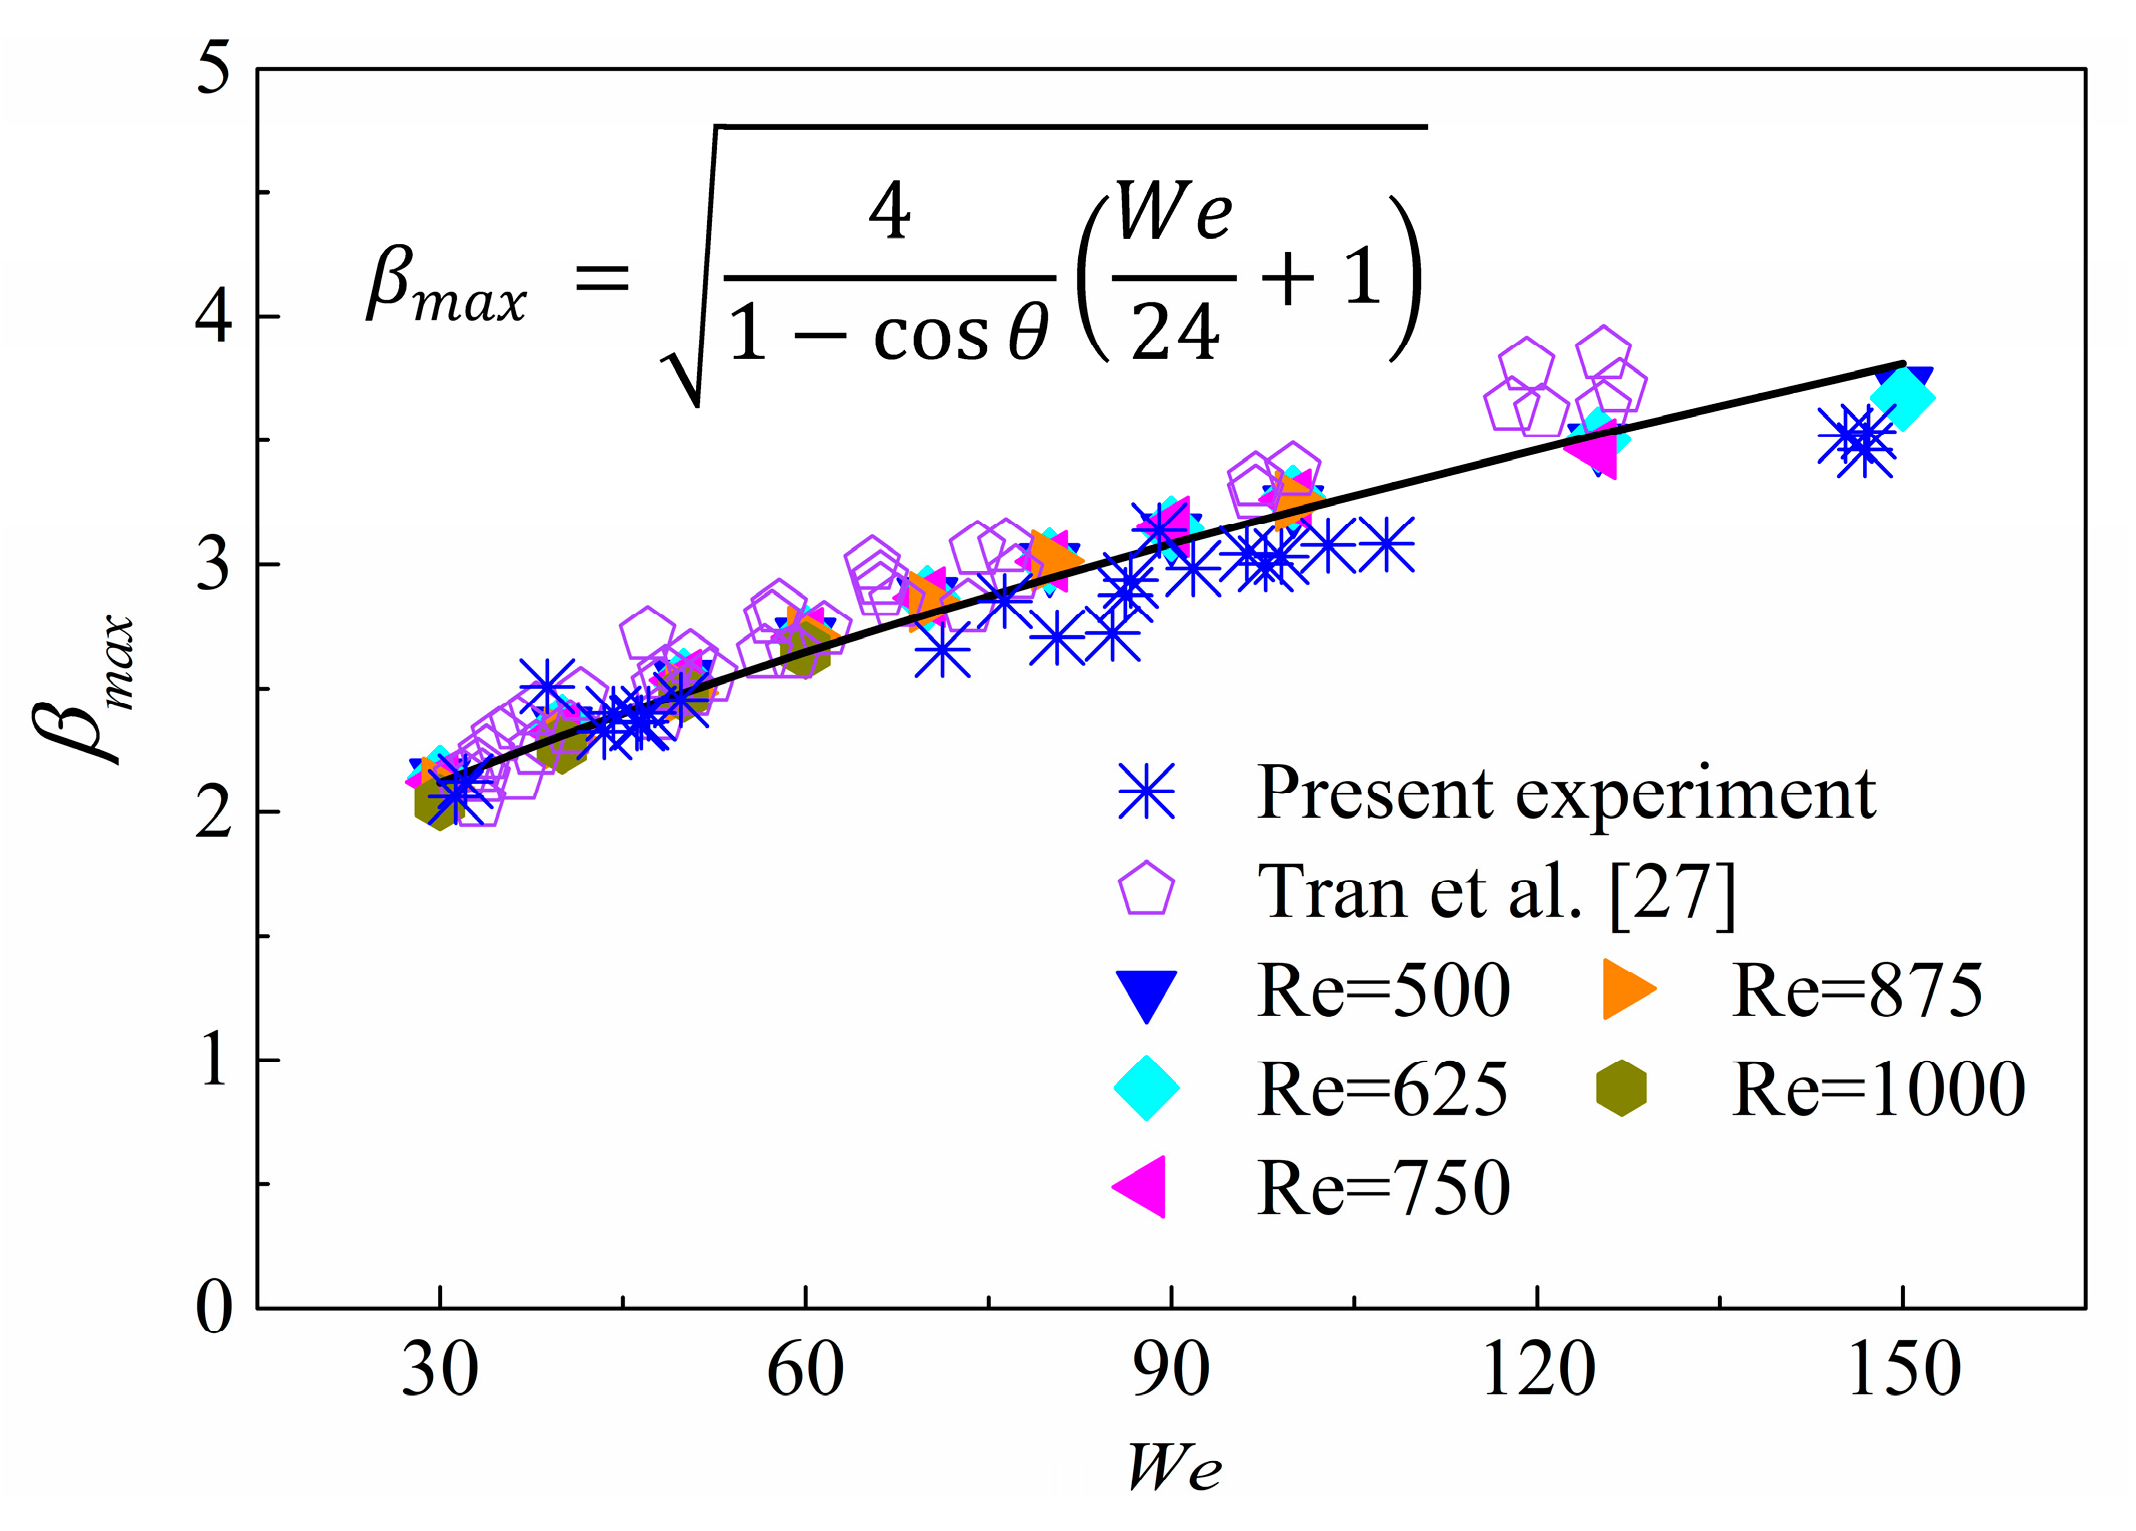
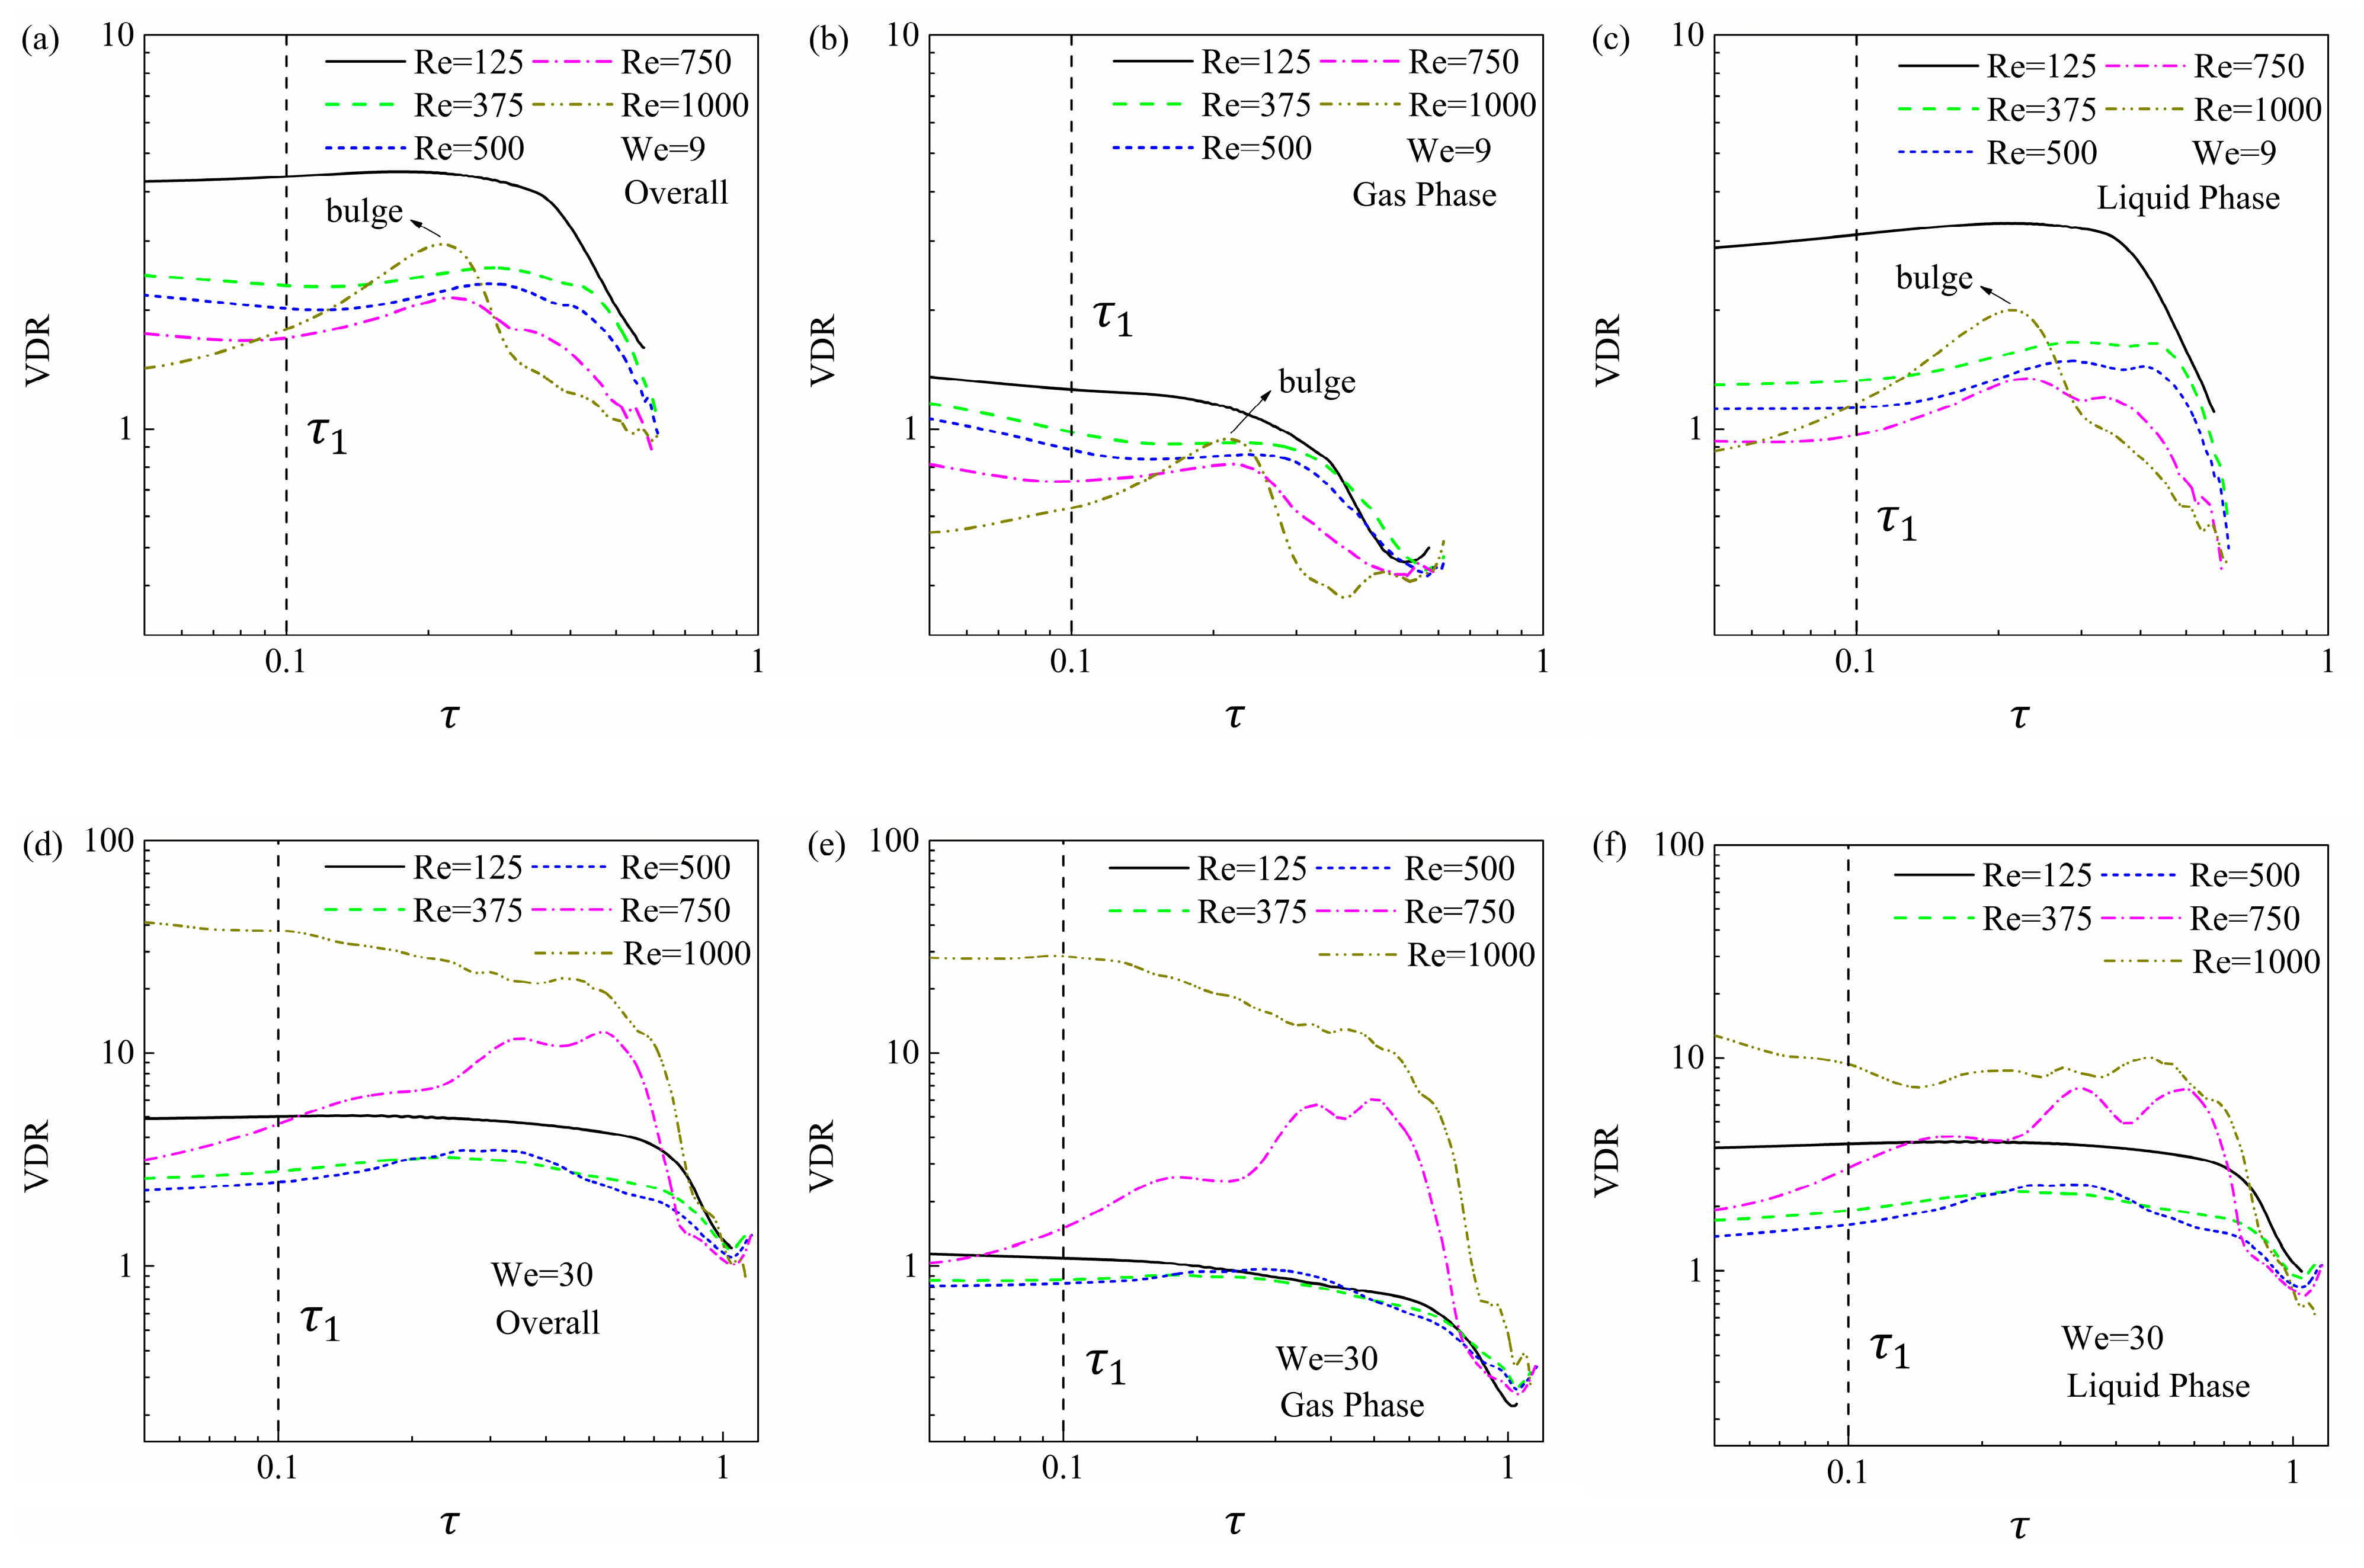
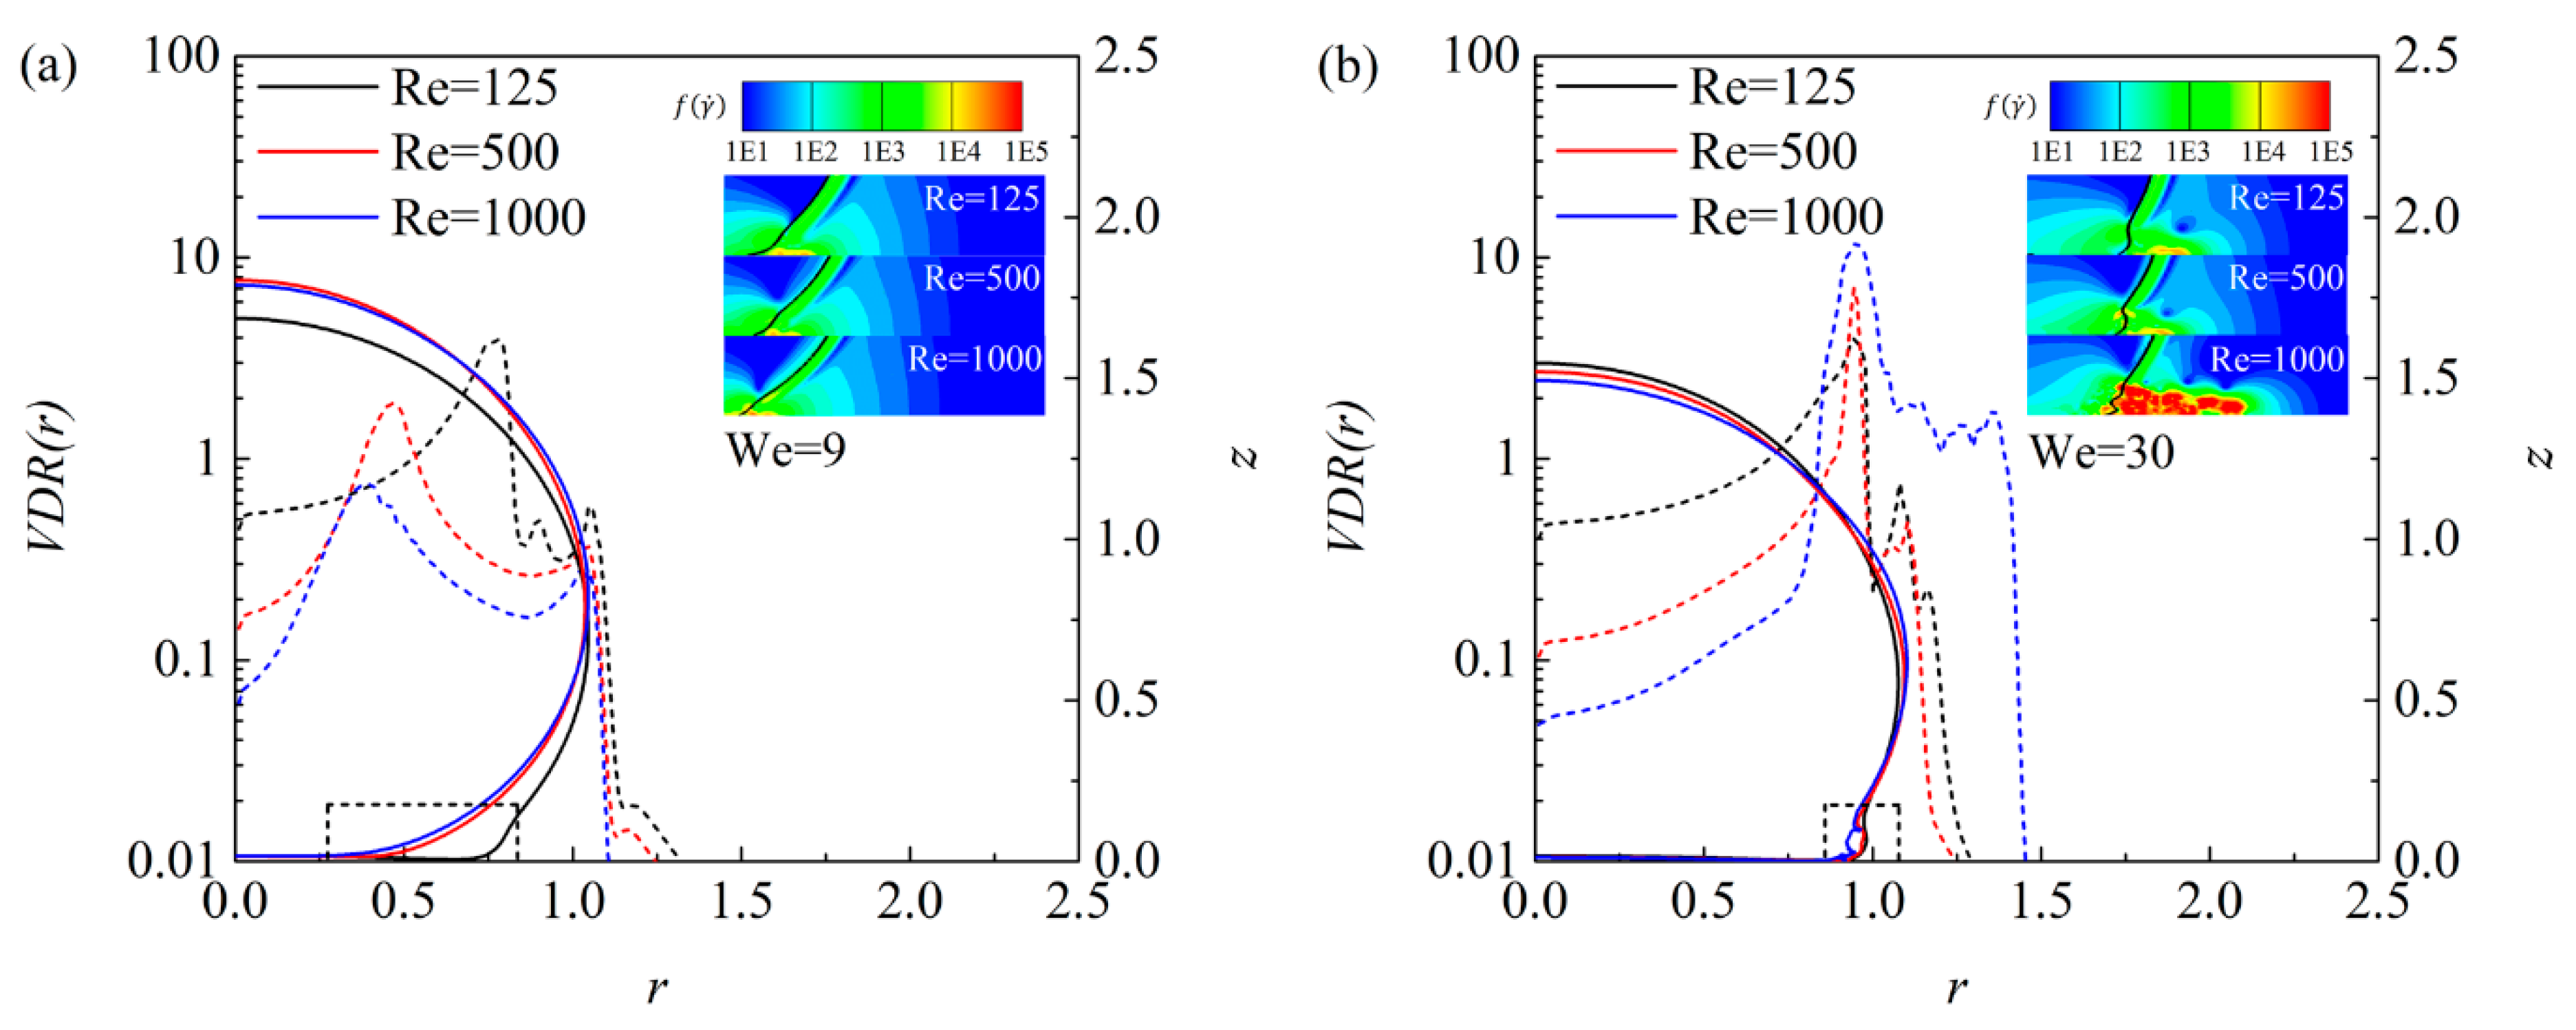
3.2. Droplet Spreading under Relatively Large Weber Numbers ( W e > 30 )

To further validate our numerical simulation, we first simulated droplet spread on the free-slip surface under relatively large Weber numbers, the results were compared to the widely-used model of Wildeman et al. [40] model, given by
β m a x = 4 1 cos θ ( W e 24 + 1 )
which is estimated based on the energy conservation approach where the initial kinetic energy E k 0 ( E k 0 = π ρ V 0 2 D 0 3 / 12 ) is equal to the sum of dissipation energy E d , left-over kinetic energy E k and surface energy increment Δ E s at max deformation instant τ m a x , yields
E k 0 = E d + E k + Δ E s
Our numerical simulation considers the limiting condition to be droplet spread with a gas film, which is progressively close to the contact angle θ = 180 ° . Therefore, Figure 5 shows the comparison between our present experiments (denoted by the stars), numerical simulations (denoted by the dots) and the prediction of Wildeman et al.’s model (denoted by the solid lines) for β m a x under relatively large Weber numbers ( W e 30 ). Moreover, the experimental results of Tran et al. [27] are also plotted in this figure for a comparison. In addition, the experimental data in current work and cited in predecessors are summarized in Table 1.
Table 1. Summary of cited and current experiment data.
Cited fromImpact ParameterExperimental DetailSurface Property and
Contact Angle θ
Tran et al. [27] W e = 4.95 ~ 29.2 Milli-Q water (1 atm air)
D 0 = 1.7   and   2.2   mm (typically)
Leidenfrost droplet
(Gentle film boiling)
θ = 180 °
Pan et al. [54] W e = 2.25   and   2.27 Tetradecane (1 atm air)
D 0 = 107.2   and   170.6   μ m
head-on equivalent binary droplet collision
θ = 180 °
Tang et al. [11] W e = 1.04 ~ 3.37 Tetradecane (1 atm air)
D 0 = 120   μ m (typically)
head-on equivalent binary droplet collision
θ = 180 °
Current experiment W e = 5 ,   R e = 281
W e = 10 ,   R e = 421
W e = 21 ,   R e = 612
W e = 30 ,   R e = 750
Ultra-pure water (1 atm air)
density ρ l = 998   k g / m 3
viscosity μ l = 1.005   m P a · s surface tension σ = 71.99   m N / m
D 0 = 275   μ m (typically)
Stainless-steel
Surface roughness R a = 0.1   μ m
Static contact angle
θ s = 50 °
Very good agreement again appears between our numerical results and the predictions of Wildeman et al. Our predictions show that β m a x is generally Re-independent for relatively large Reynolds numbers ( R e 500 ), once again, consistent with the tendencies of previous investigations [40,42].
Since Wildeman et al.’s model is estimated according to the energy conservation approach associated with the “1/2 rule”, we subsequently show the energy budget in Figure 6, in which all the energies were normalized by the initial kinetic energy E k 0 and therefore the sum of E k , E d and Δ E s is the unity. To further investigate the viscous dissipation characteristics, we counted the energy dissipation in both liquid phase (denoted by E d l ) and gas phase (denoted by E d g ), and therefore E d = E d l + E d g . The “1/2 rule” is also indicated in each graph.
Figure 6a shows the evolution of four different energies during the droplet spreading process, while Figure 6b shows the energy budget at τ m a x for various droplet inertias and Reynolds numbers. In this case we defined τ = 0 as the time instant when the droplet just contracts the surface. The initially non-zero E d at τ = 0 , shown in Figure 6a, can be attributed to the slight deformation together with the droplet moving-induced gas motion, and results in the viscous dissipation in either liquid or gas phases before droplet-wall contracting. The pre-dissipated energy is around 3% of the initial kinetic energy E k 0 and slightly influences the energy budget, so that it can therefore be ignored in the present study. For energy budget shown in Figure 6b, all the predictions generally follow the “1/2 rule”. Although viscous dissipation in the liquid phase contributes more to E d , viscous dissipation in the gas phase, i.e., E d g still cannot be ignored.
It is recognized that energy dissipation originates from the viscous dissipation during droplet deformation, therefore droplet spread time scale plays a relatively considerable role in influencing β m a x . Wildeman et al. assumed that τ m a x is proportional to the β m a x and suggested τ m a x = β m a x 1 for droplet spread on both free- and no-slip surfaces. Consequently, the correlation between β m a x and τ m for our predictions under large Weber numbers is shown in Figure 7. It is obvious that τ m a x and β m a x meet the quantitative relationship ( τ m a x = β m a x 1 ) quite well, and hence confirms the accuracy of our numerical simulation.

3.3. Droplet Spreading under Relatively Small Weber Numbers ( W e 30 )

Figure 8 shows the prediction of β m a x under small Weber numbers ( W e 30 ). Again, the solid line indicates Wildeman et al.’s model, while the experimental results of Pan et al., Tang et al., Tran et al. [27] and the present case are also shown in the figure for a comparison.
It is seen for both experimental results and the numerical predictions that β m a x slightly deviates from Wildeman et al.’s model as droplet inertia decreases from W e = 30 to around W e = 12 , below which the predicted β m a x substantially deviates from the model of Wildeman et al. This deflection can be attributed to the breakdown of the “1/2 rule” and the dominant factor of energy budget transfer from kinetic energy to the surface energy, to be elucidated in the following text. It should be noted that β m a x is determined by the energy conversion during droplet spreading. For Wildeman et al.’s model, there are two important hypotheses i.e., around one half of the initial kinetic energy transfers into surface energy and droplet shape at τ m can be regarded as a “pizza-shaped” disk, whose thickness can be ignored when compared to the spreading diameter.
To investigate the reason why droplet spreading under small Weber numbers deviates from the model of Wildeman et al., we show the energy budget for W e 30 in Figure 9. It is clearly seen that the “1/2 rule” breaks down and Δ E s increases with Weber number decreasing, indicating an W e -dependent energy budget. Normally, dissipation energy (sum of E d g and E d l ) moderately decreases as W e decreases. Δ E s that is generally larger than 1/2 indicates that surface energy may play a dominant role in droplet deformation during droplet spreading [44].
An interesting observation for different W e cases is that Δ E s decreases monotonically as R e increases when the W e < 12 ; however, it changes non-monotonically when the 12 W e 30 . This observation corresponds to the previous experimental observation of Qin et al. and the numerical simulation of our previous investigation [44], in which they attributed the non-monotonic trend as the dual role of liquid viscosity under intermediate droplet inertias, however, the underlying physics have not been fully explained.
To further explore the dual role of liquid viscosity, we first counted the energy dissipation in both liquid (denoted by E d l ) and gas phase (denoted by E d g ). In case of the droplet spreading under intermediate Weber numbers, such as W e = 30 , E d l first decreases then moderately increases as R e increases. However, E d g tends to keep steady under relatively large Reynolds numbers then increases substantially as R e further increases.
To unravel the underlying physics responsible for the observation state above, we respectively calculated the local viscous dissipation rate in liquid and gas phases as
Φ = μ f ( γ ˙ ) = 2 μ [ ( u r ) 2 + ( u r ) 2 + ( w z ) 2 ] + μ ( u z + w r ) 2 2 μ 3 [ 1 r ( r u ) r + w z ] 2
where, γ ˙ is the strain rate tensor, u is the velocity component in the r –direction, w the velocity component in z–direction. Subsequently, the overall viscous dissipation rate (VDR) was obtained by integrating the local viscous dissipation rate Φ over the computational domain, while VDR in liquid phase and gas phase were calculated by integrating Φ over the droplet and the ambient gas.
Figure 10 shows the time-dependent viscous dissipation rate (VDR) for droplet impacts under two different Weber numbers. For spreading with relatively small inertia ( W e = 9 ), as shown in Figure 10a–c, the lowest Reynolds number ( R e = 125 ) generally produces highest overall VDR, most of which is contributed by the liquid viscous dissipation. As the Reynolds number increases to R e = 750 , overall VDR monotonically decreases because the increase of R e actually decreases liquid viscosity (characterized by the Ohnesorge number O h = W e / R e ). As Reynolds number further increases to R e = 1000 , VDR in the earlier stage decreases, however, it produces a substantial “bulge” as time develops, which results in the VDR in turn being larger than smaller R e cases ( R e = 375 750 ) in an appropriate time period. However, this reversion is insufficiently strong to influence the energy dissipation tendency. The “bulge” can be attributed to the dual role of liquid viscosity, which has been primarily discussed in the previous investigations [42,44]. Although the majority of the VDR is contributed by the liquid phase, the “bulge” can also be seen in the gas phases, indicating that the dual role of liquid viscosity influences energy dissipation in both liquid and gas phase.
Figure 10d,e accounts for W e = 30 that overall VDR decreases as Reynolds number increases from R e = 125 to 500 because a decrease in liquid viscosity reduces viscous dissipation. In this case viscous dissipation in the liquid phase contributes the majority of the overall VDR. However, as R e continually increases to 750 and finally 1000, the dual role of liquid viscosity is sufficiently strong to influence an energy dissipation tendency in which overall VDR substantially increases. The contribution of gas viscous dissipation gradually increases and in turn dominates the energy dissipation at R e = 1000 , and therefore produces a non-monotonic energy budget, as shown in Figure 9.
To further show the flow motion and viscous dissipation characteristics in both liquid and gas phases, we integrated the local viscous dissipation rate Φ as
V D R ( r ) = 0 h Φ d z
where h is the computational domain height (as shown in Figure 2). Figure 11 compares the V D R ( r ) (on the left Y-axis) and droplet shape (denoted by interface on the right Y-axis) for W e = 9 and 30 cases at the characteristic time instant τ 1 (indicated in Figure 10).
For spreading at W e = 9 , shown in Figure 11a, all three V D R ( r ) curves increase rapidly from droplet center to rim (with r increasing), the peak value, which decreases as R e increases, appears around the droplet rim where a large stain rate can be found. This can be attributed to the fact that, in the very earlier stage when the droplet just contacts the surface, a rim is just squeezed out and therefore induces a relatively high strain rate. Consequently, we show the local strain rate f ( γ ˙ ) distribution in the near-rim area in each graph for a better understanding. It seems that increasing the R e slightly influences the f ( γ ˙ ) in both liquid and gas phases, because in this case surface energy dominates the energy budget and therefore produces a similar strain rate. Increasing peak V D R ( r ) results from the increase of liquid viscosity, which dominates the viscous dissipation under relatively small droplet inertia ( W e = 9 ). As Weber number increases to W e = 30 , shown in Figure 11b, R e again slightly influences the f ( γ ˙ ) in the liquid phase, therefore V D R ( r ) increases as R e increases. However, relatively large R e produces substantially higher f ( γ ˙ ) in the gas phase near the rim, which in turn dominates viscous dissipation and results in a substantially high gas viscous dissipation. Consequently, the dissipation energy is mainly powered by the viscous dissipation in the gas phase under high R e condictions. These can be attributed to the reason that, for droplet spread under intermediate inertia ( 12 W e 30 ), the unconsumed kinetic energy transfer from liquid phase to the gas therefore induced substantially high strain rate in the gas phase, hence substantial gas viscous dissipation and E d g .
To understand the observation stated above, we first recognized that W e = 12 indicates that droplet initial kinetic energy ( E k 0 = π ρ V 0 2 D 0 3 / 12 ) is equal to the initial surface energy ( E s 0 = σ π D 0 2 ), therefore droplet surface energy dominates the energy budget for W e < 12 and produces similar strain rate Φ in both liquid and gas phases, and hence viscosity dominates the energy dissipation, which decreases as R e increases (a.k.a., liquid viscosity decreasing).
For 12 W e 30 the energy transfer could be more complex. When R e is relatively small, most of the droplet kinetic energy can be consumed in the very earlier stage and therefore surface energy dominates the energy budget. In this case, surface force suppresses droplet deformation and viscous dissipation is controlled by the liquid viscosity, so that dissipated energy decreases as R e increases. However, for relatively large R e , initial kinetic energy is unable to be consumed in a timely manner, which results in the kinetic energy still dominating the energy budget and droplet deformation being improved as R e increases. Therefore, energy dissipation is controlled by the strain rate which is promoted by increasing R e , hence results in the increasing energy dissipation. Consequently, a non-monotonic tendency can be observed under intermediate Weber numbers.

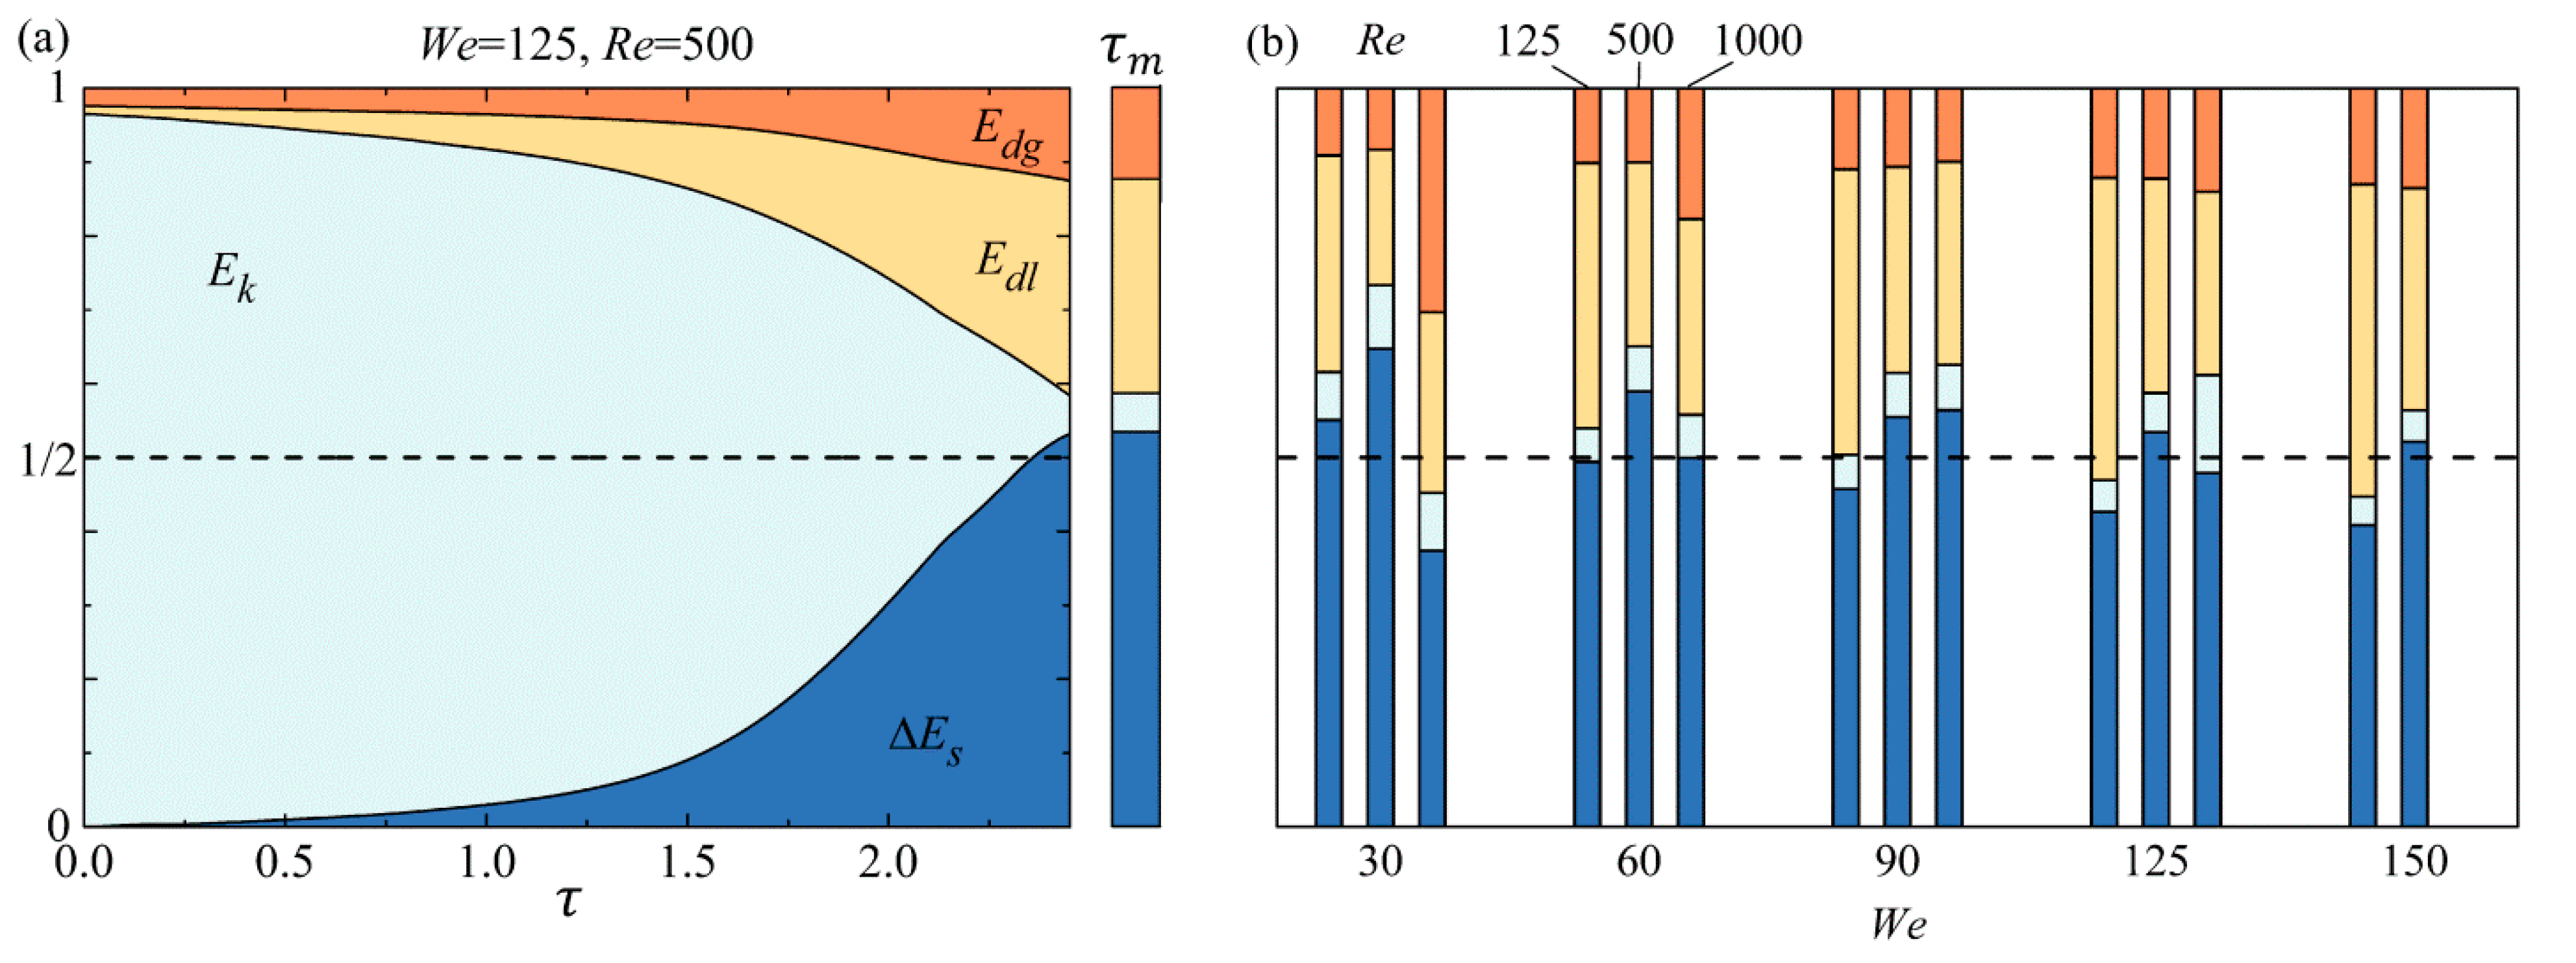
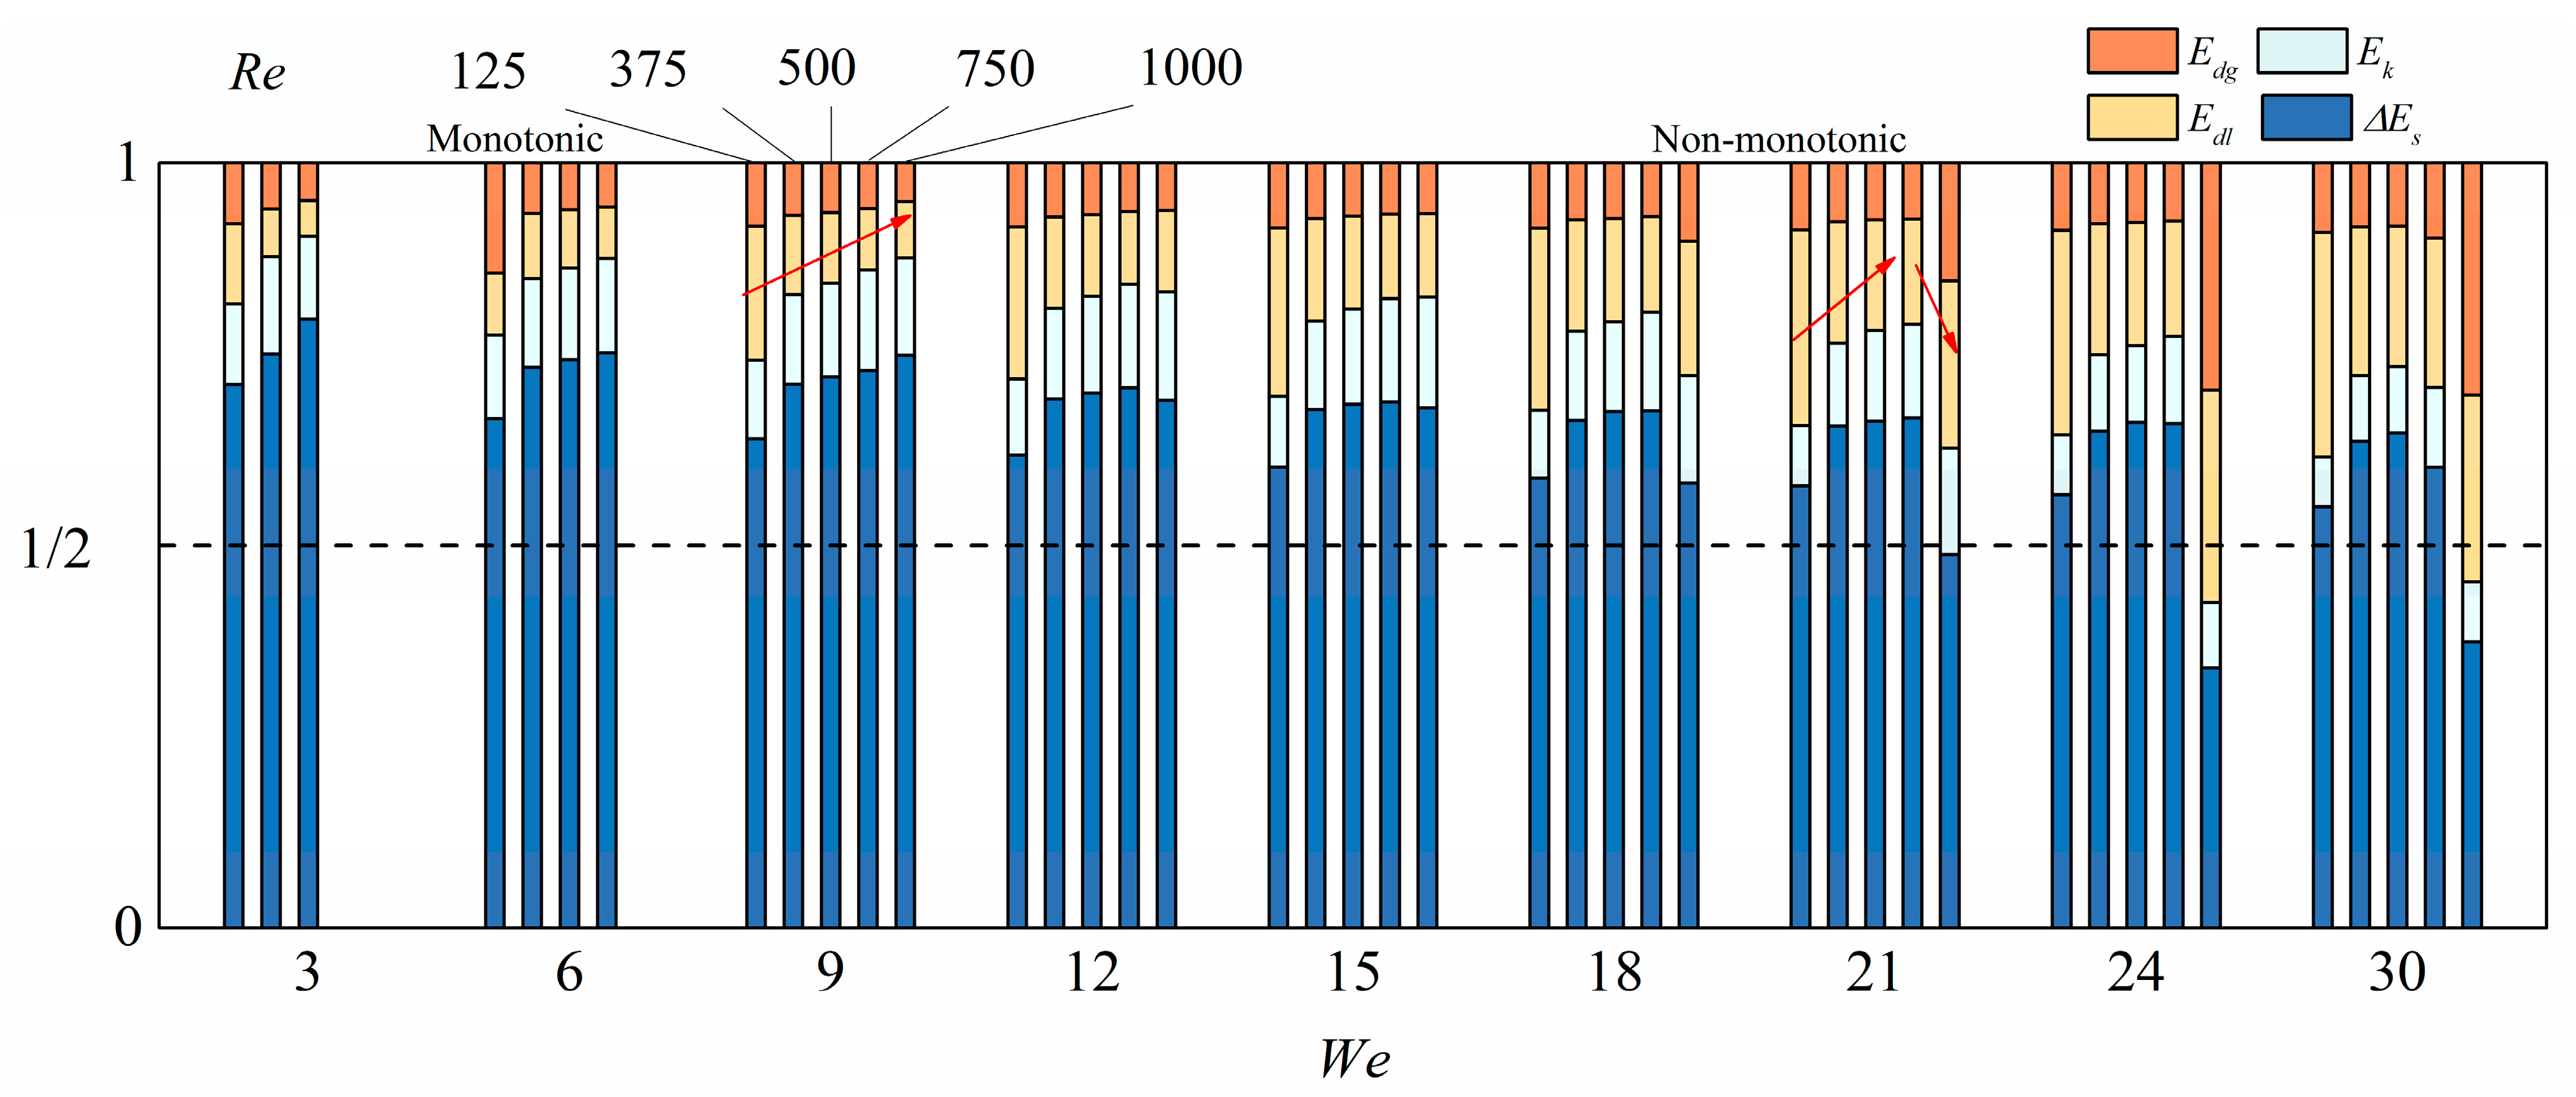
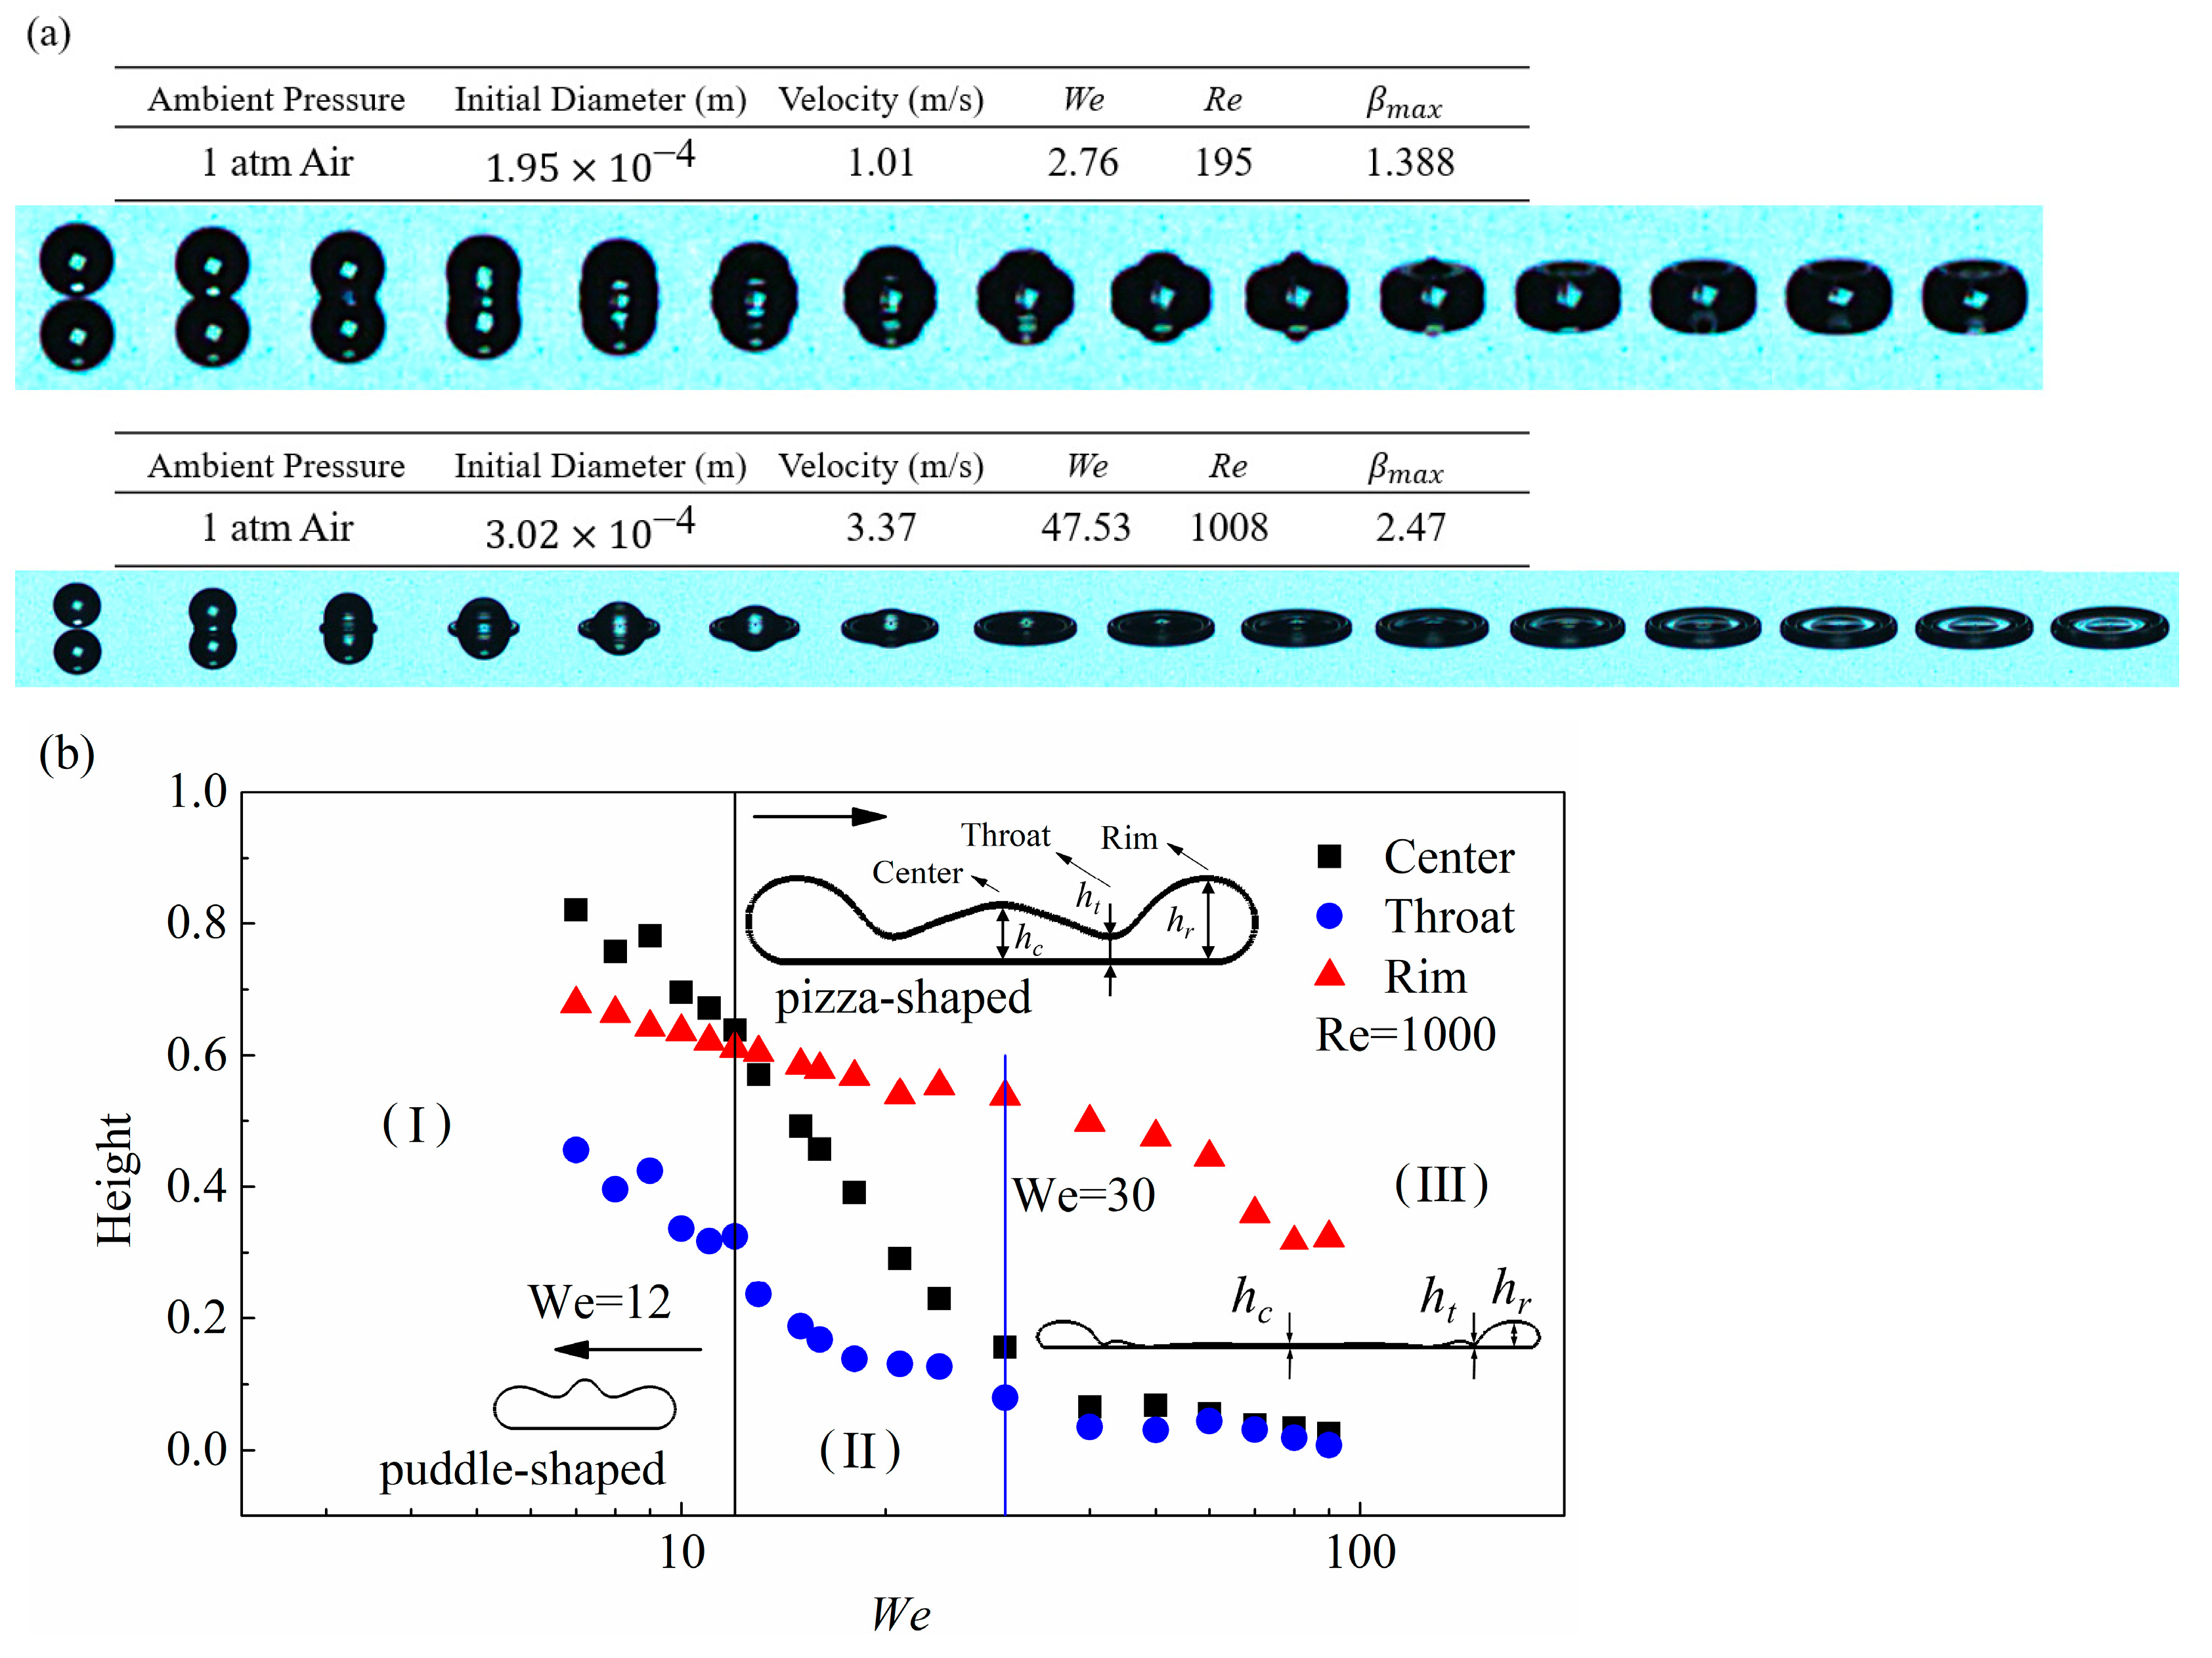
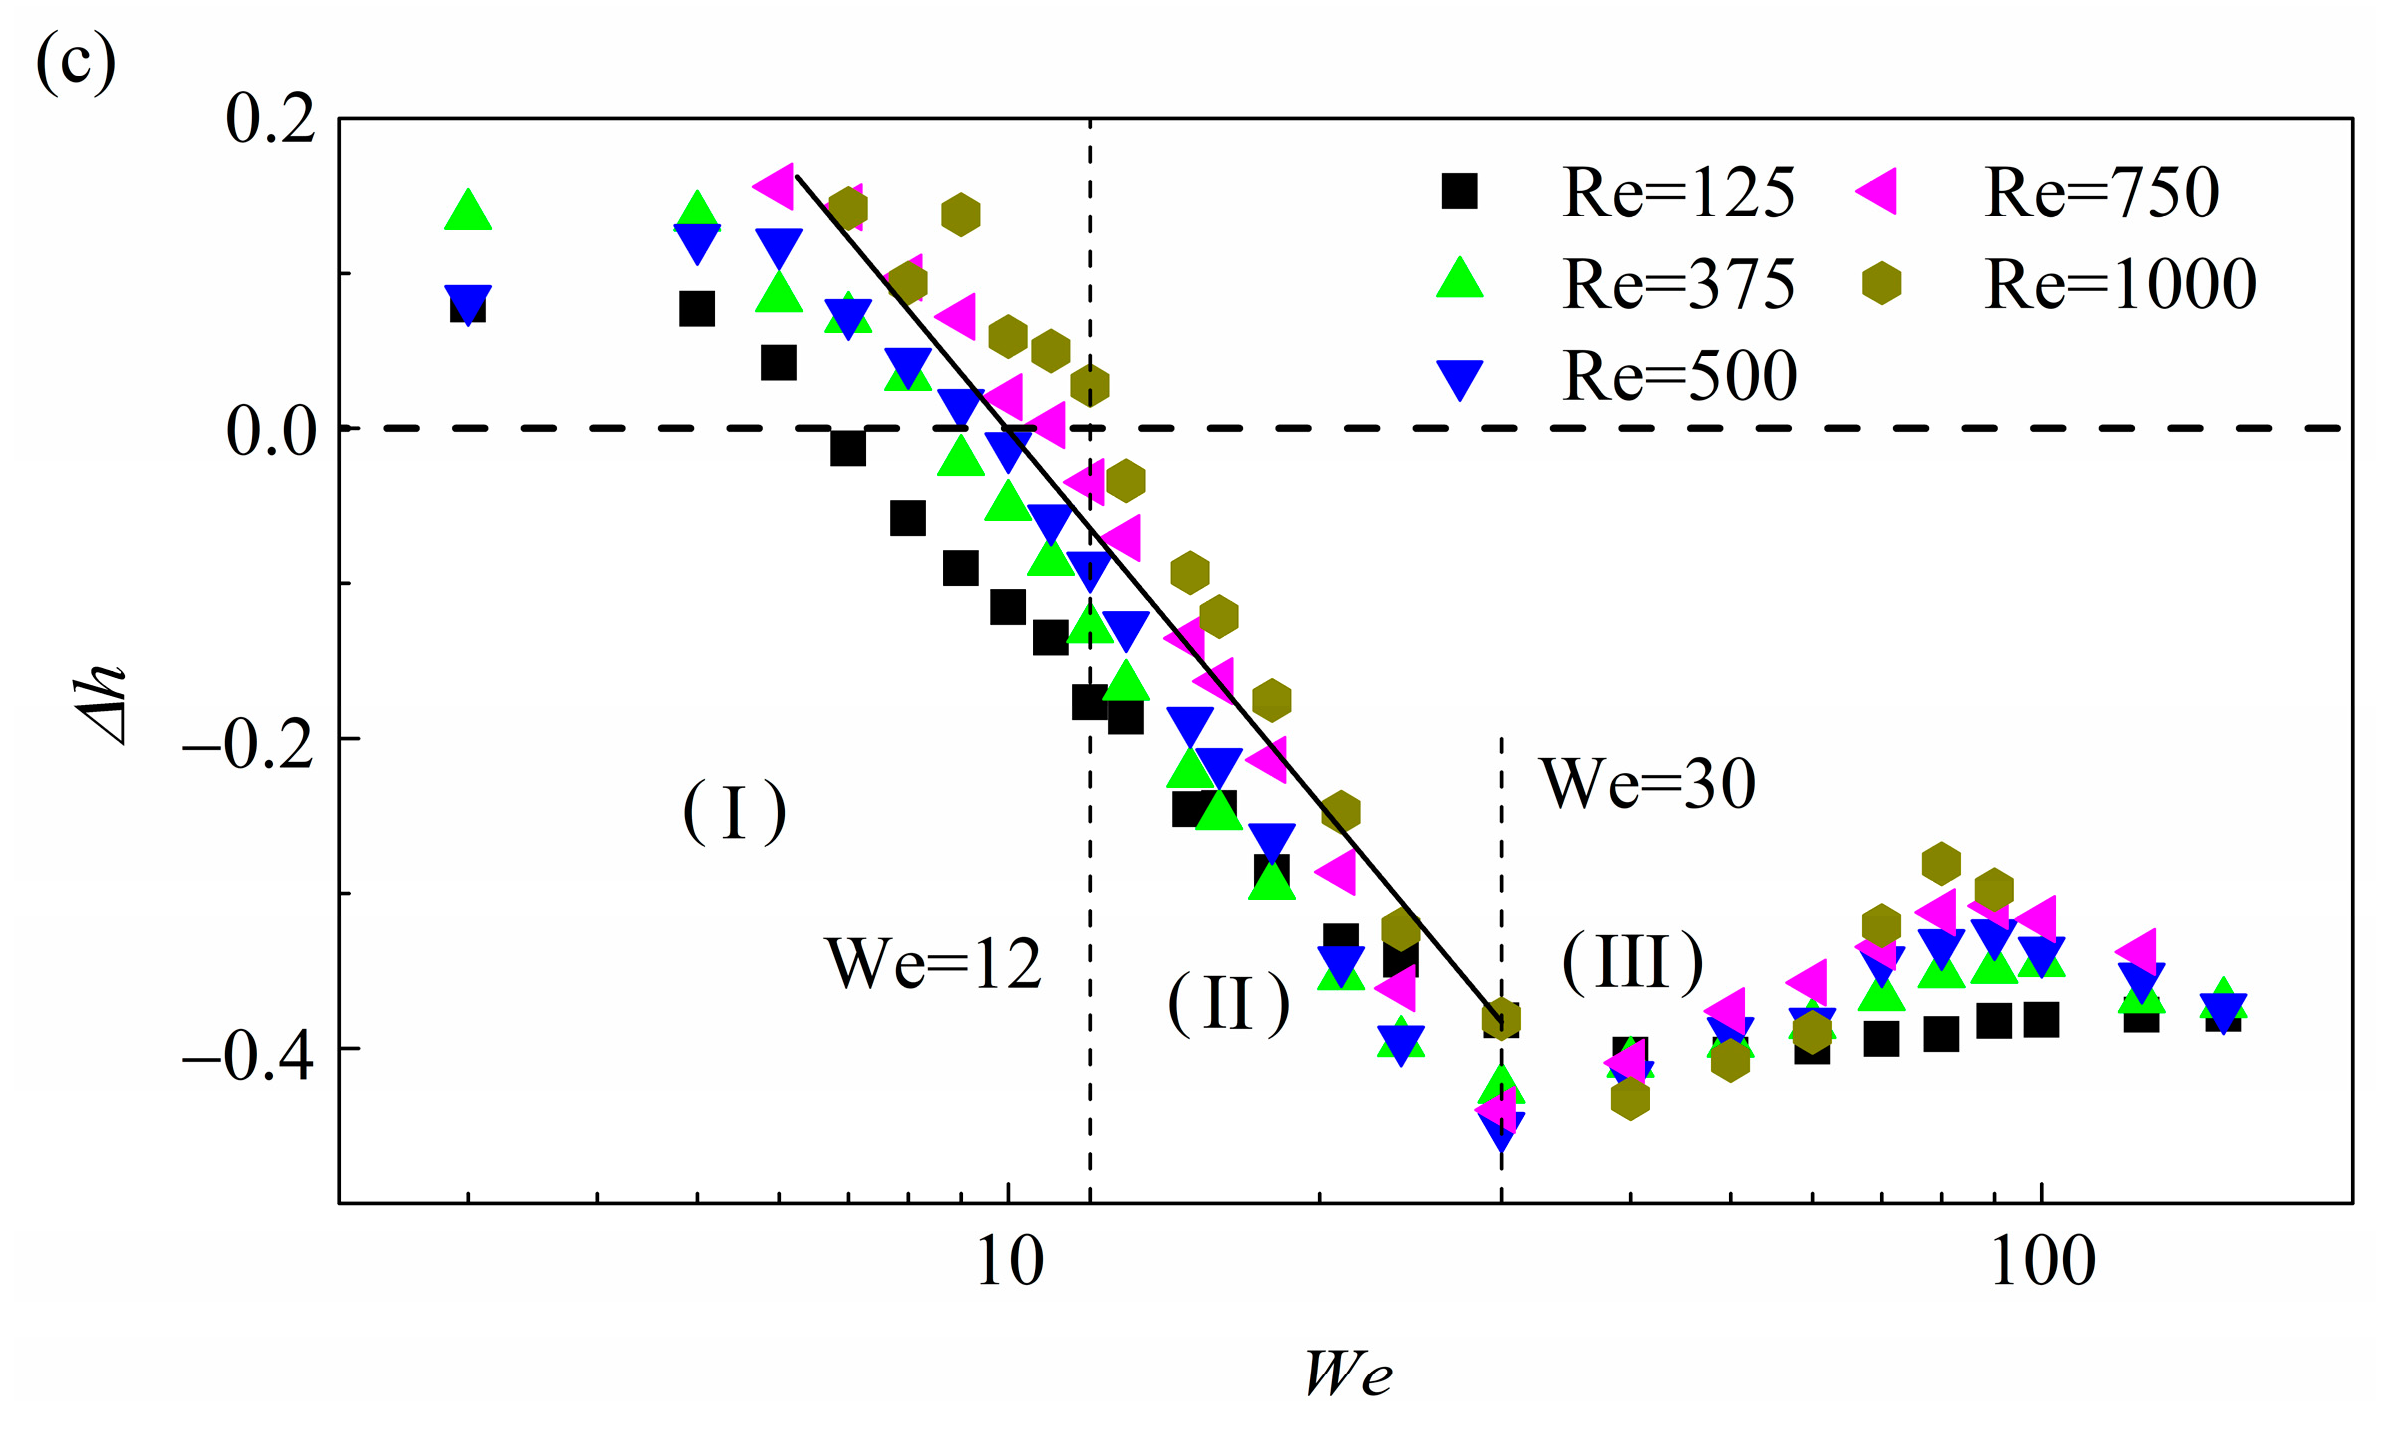
3.4. Droplet Deformation Transitions
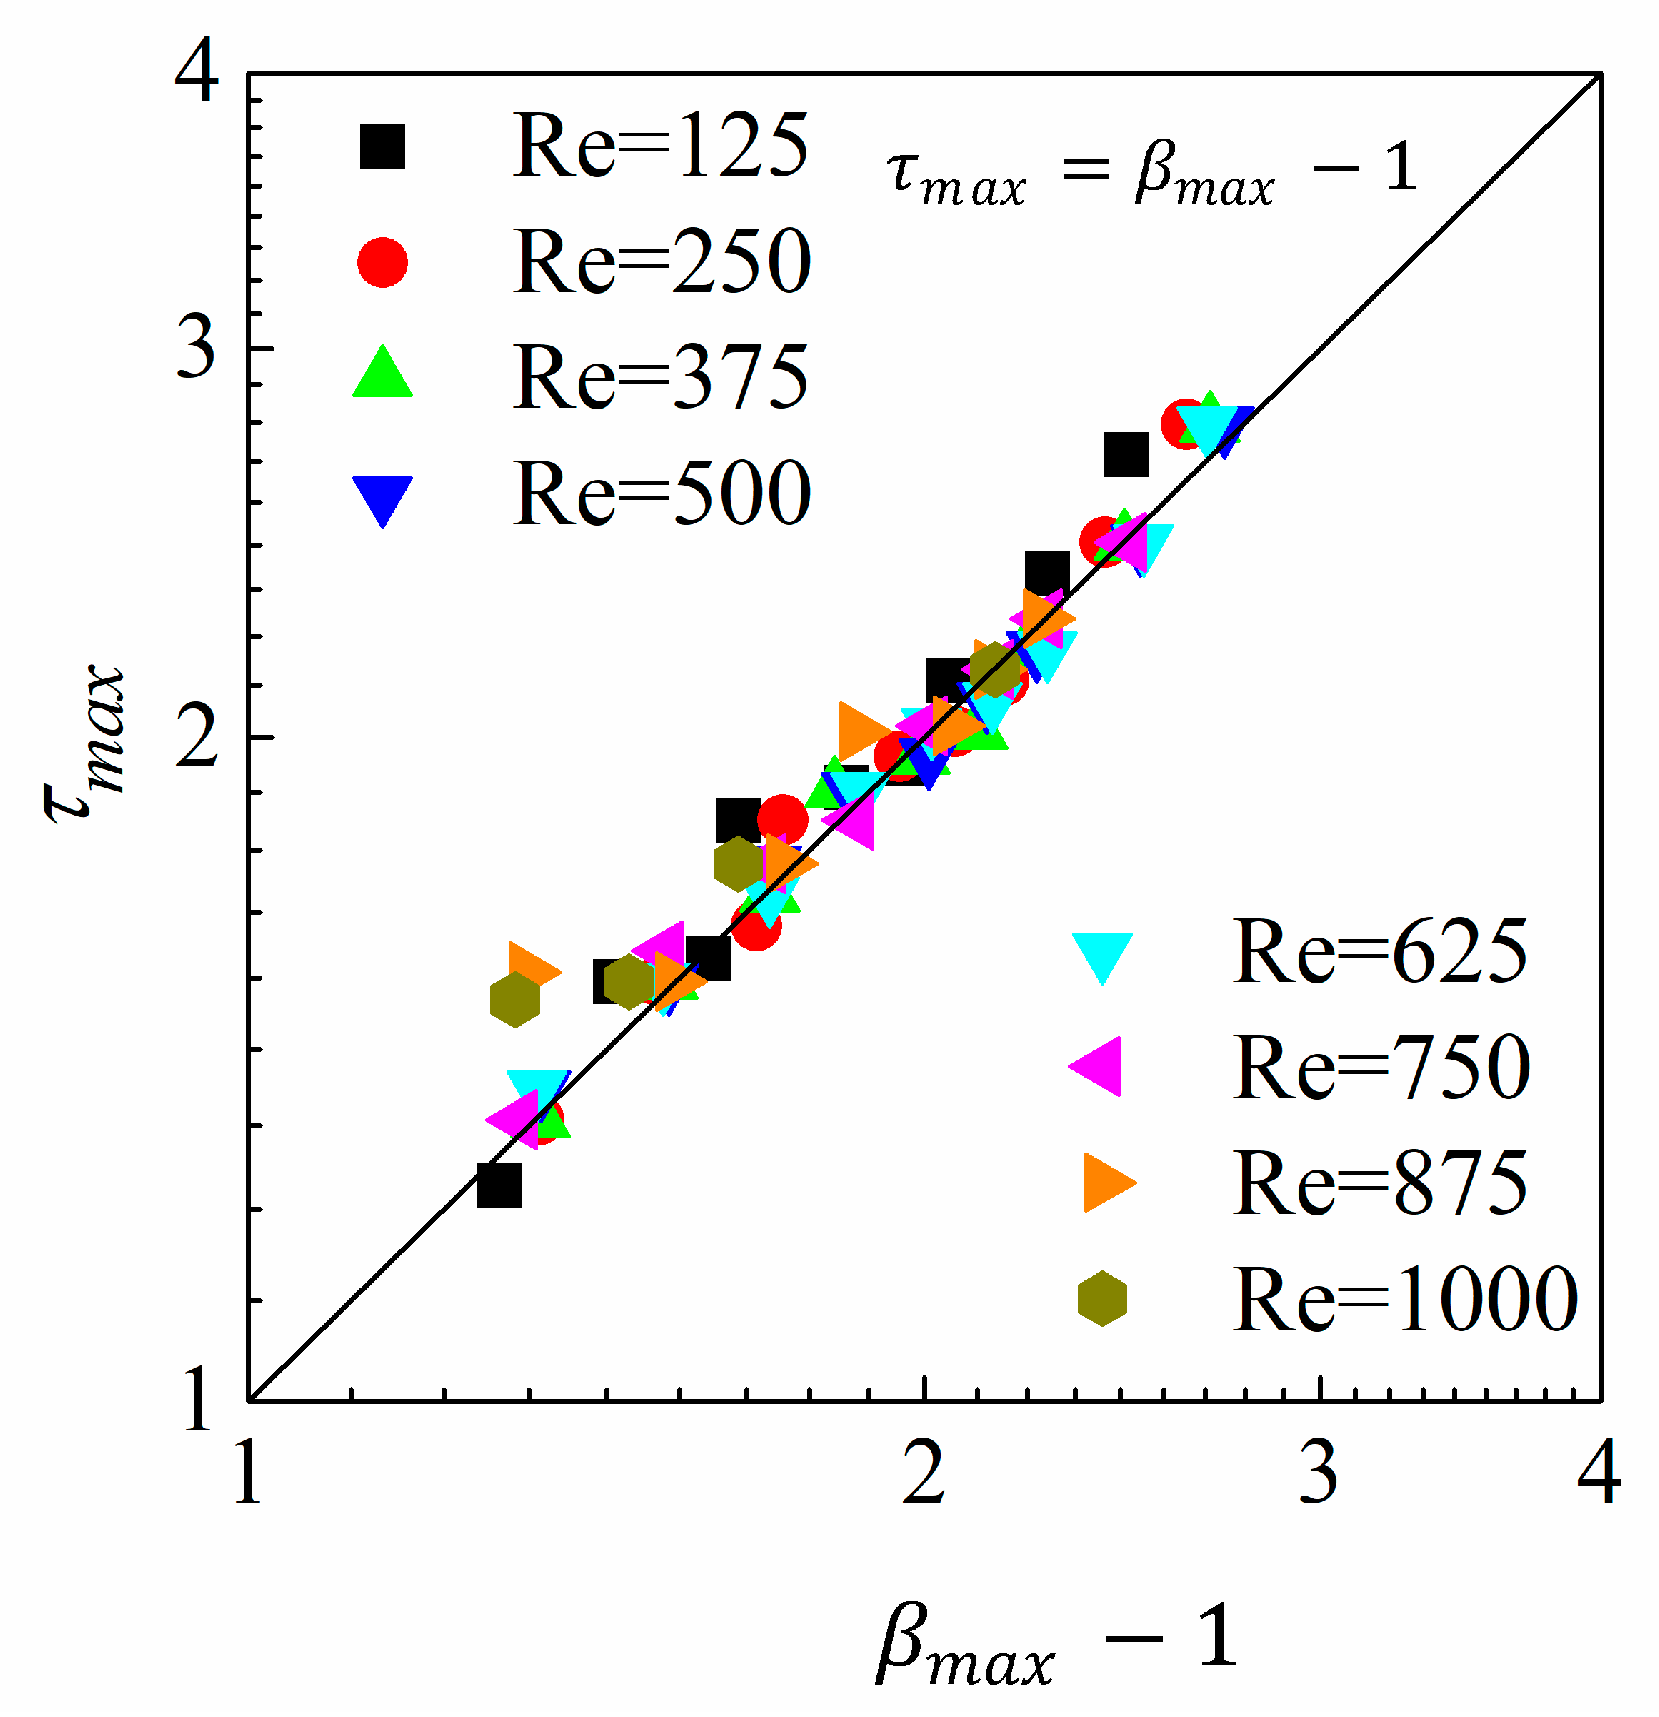
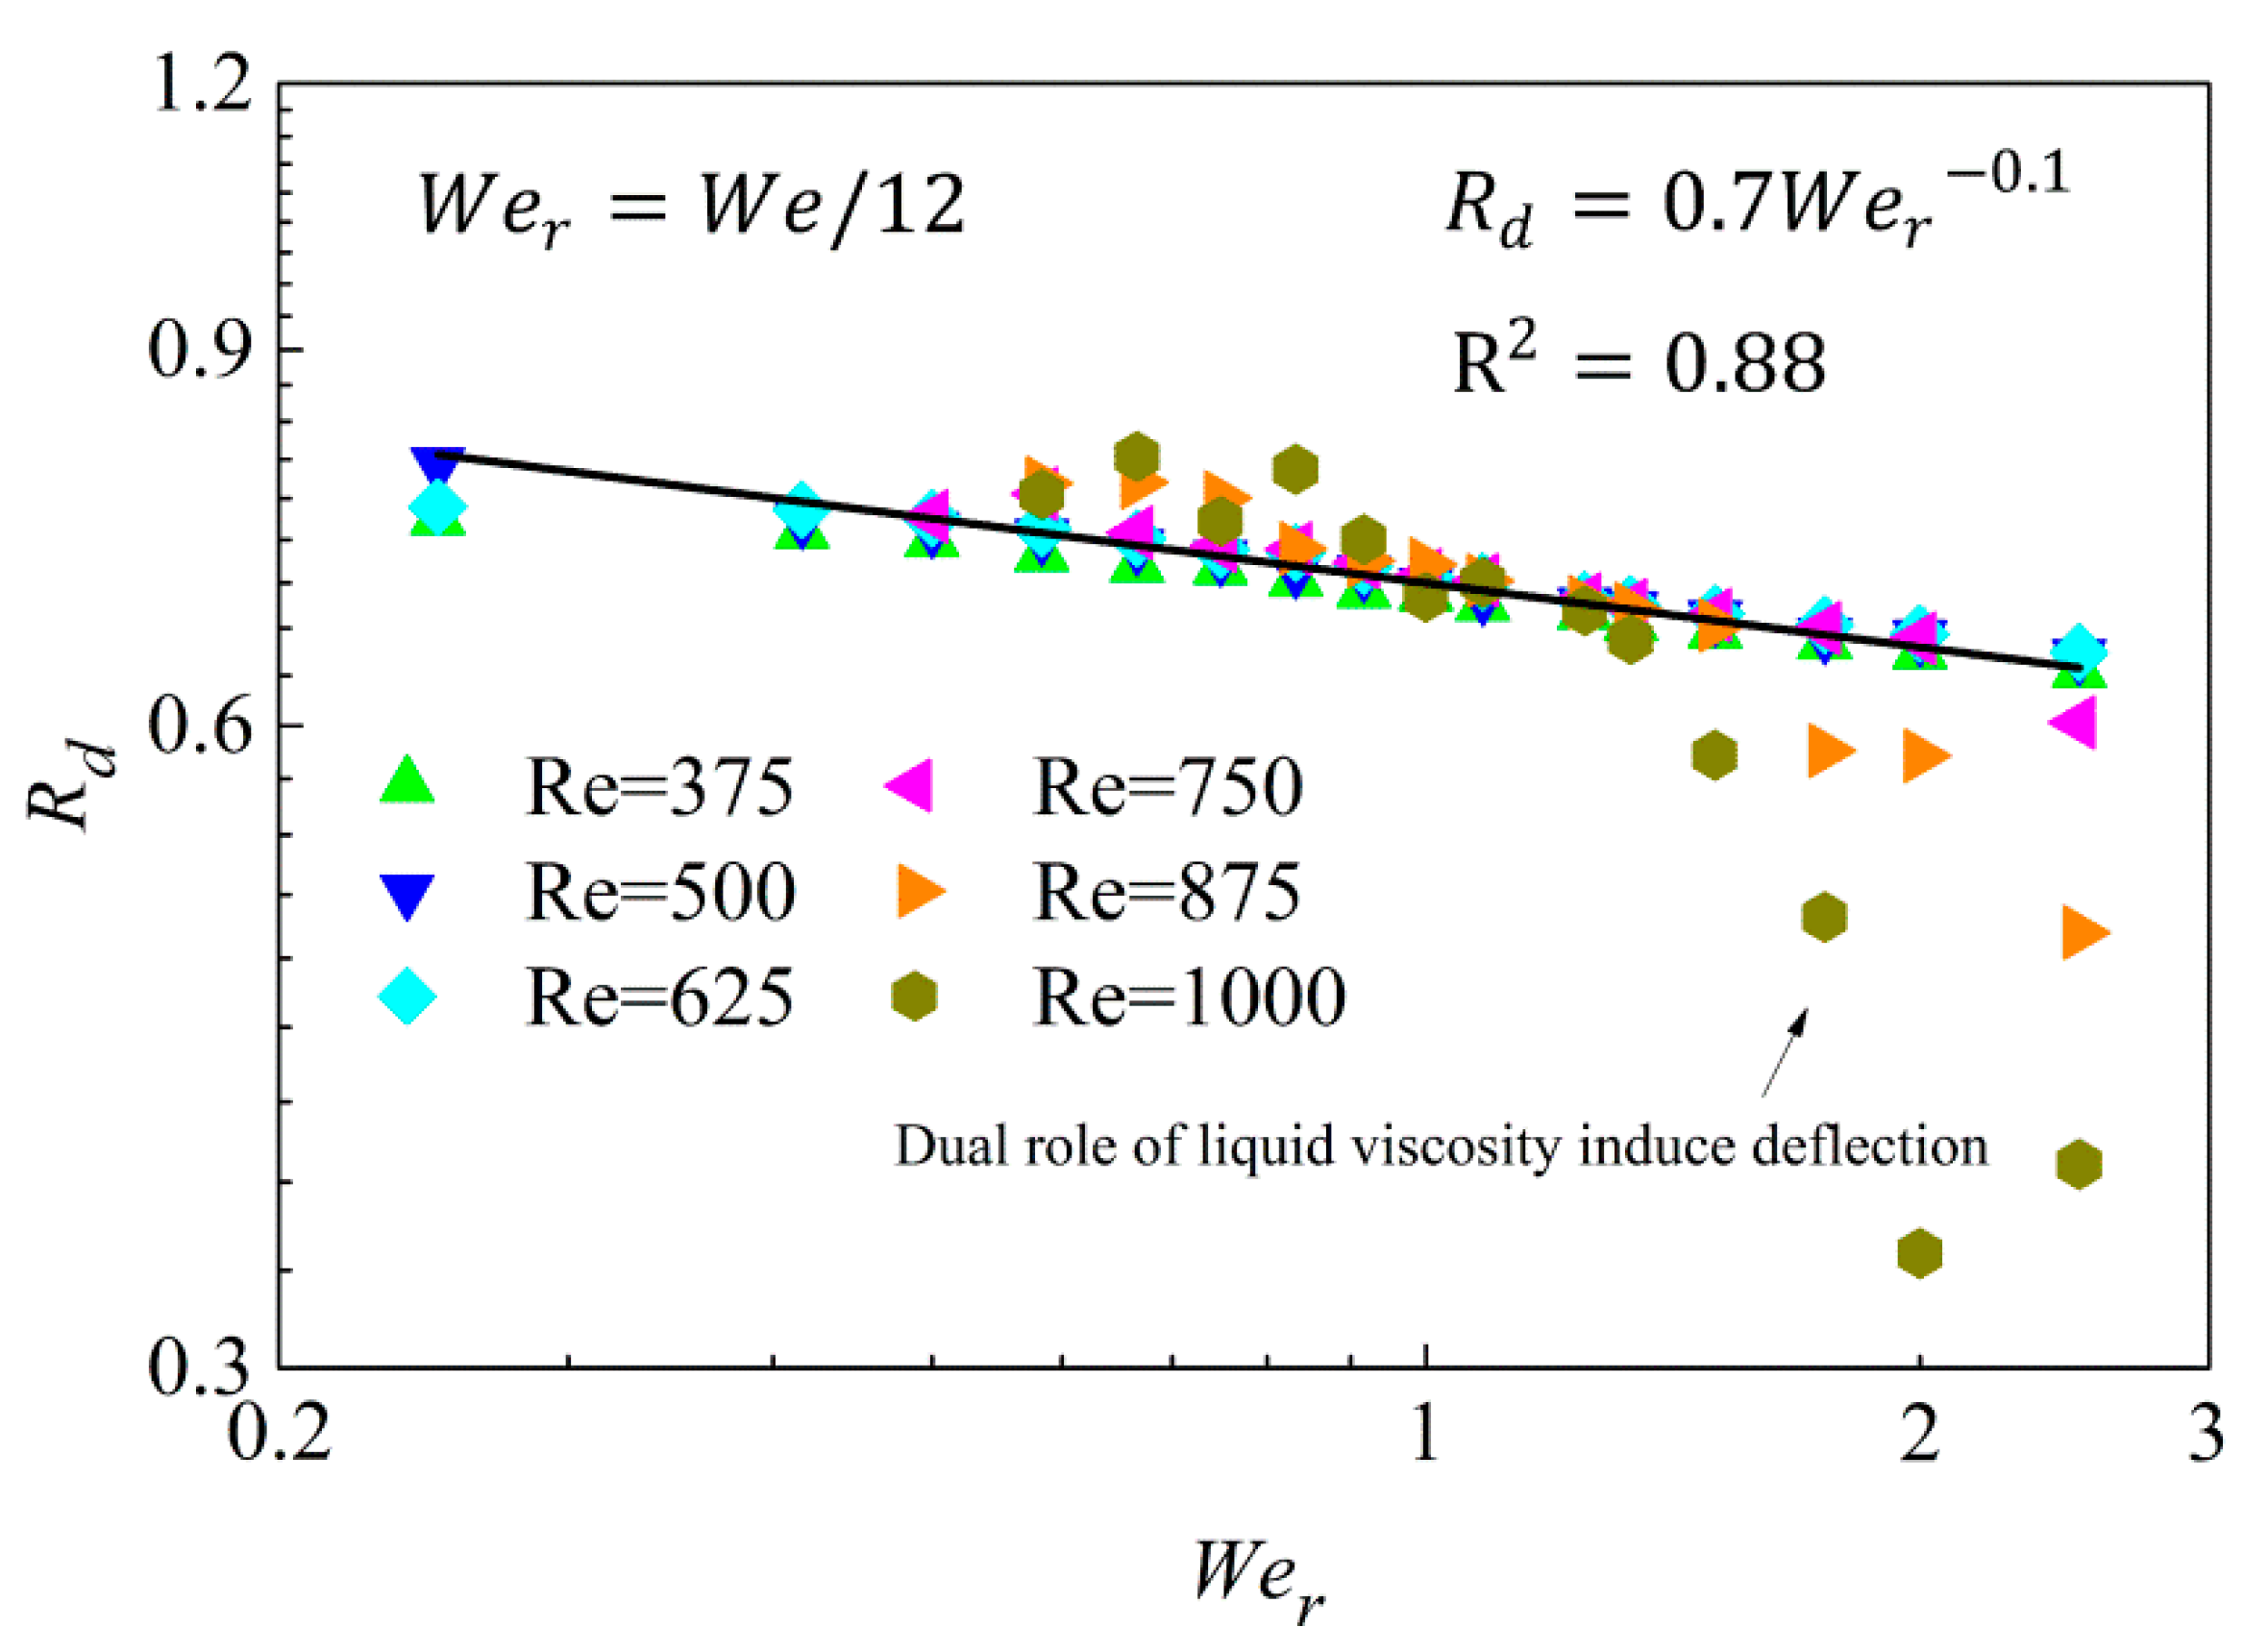
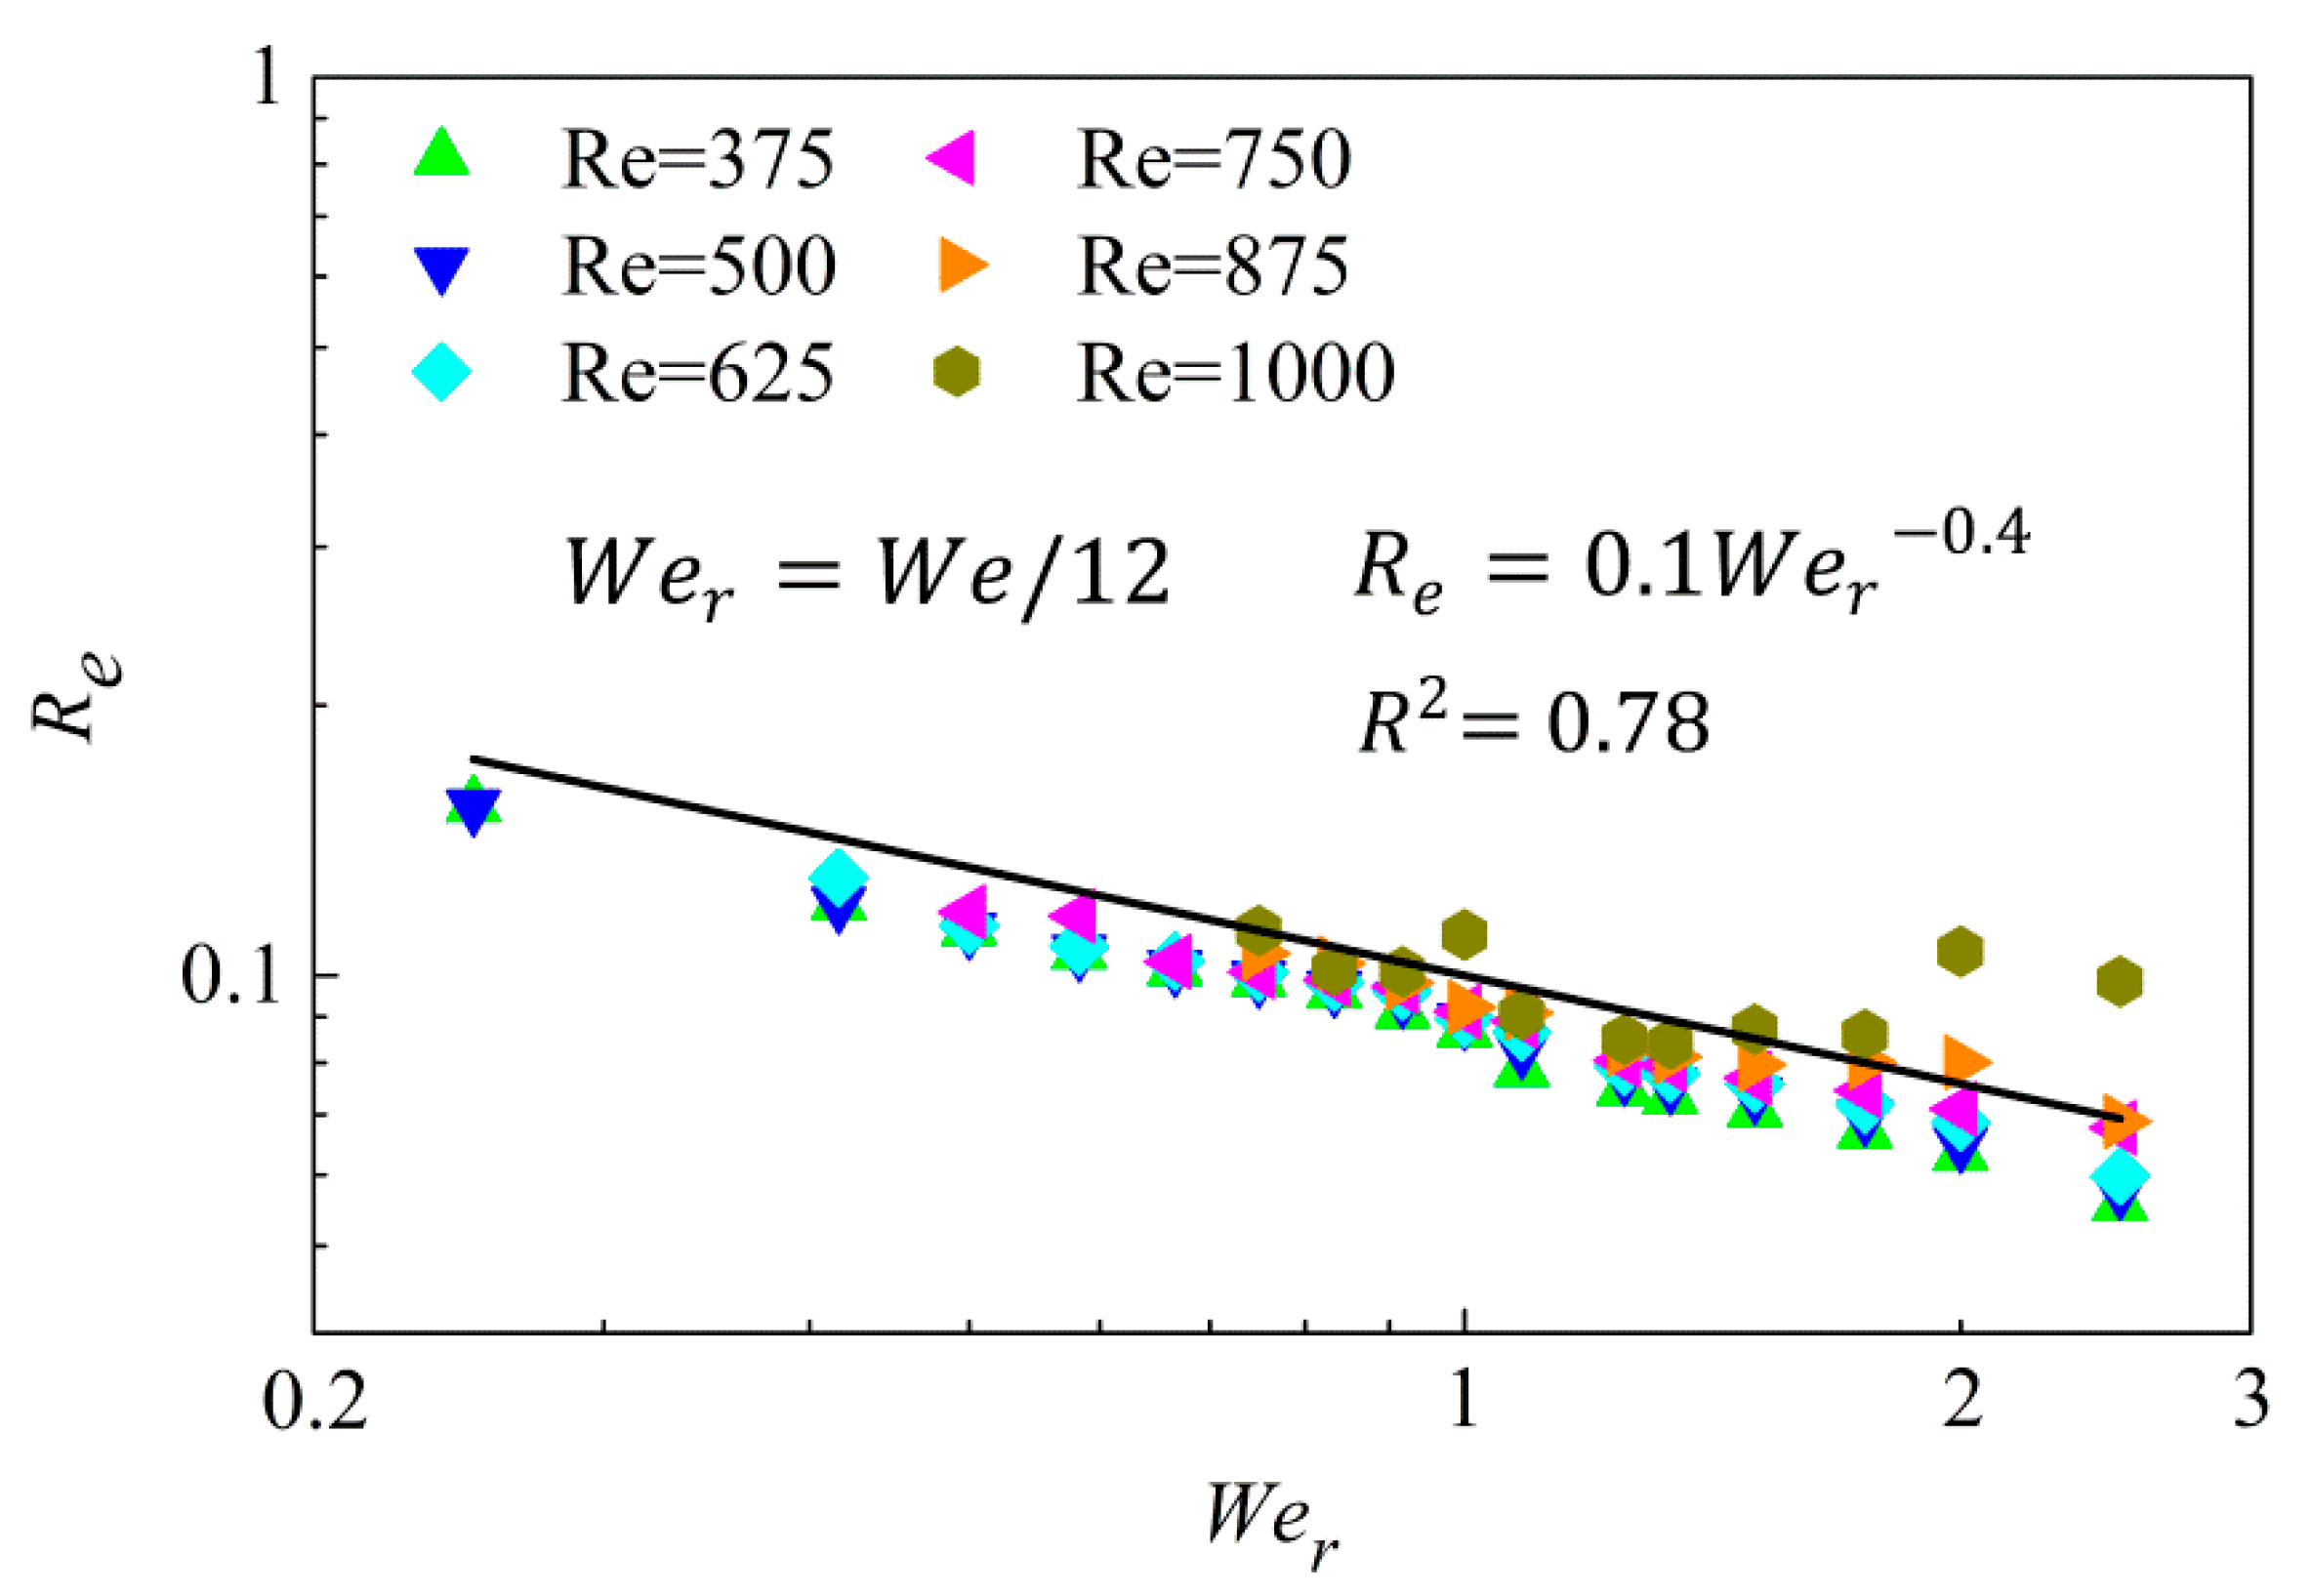
Another significant factor that should be considered is the non-negligible droplet height under small Weber numbers ( W e 30 ). In this study we employed three different heights to characterize droplet shape, namely, droplet center height h c , throat height h t and rim height h r . Figure 12a illustrates the comparison of two impact morphologies during droplet spreading for cases under large and small W e with puddle- and pizza-shaped droplet, respectively. Figure 12b shows the evolution of three heights with increasing impact Weber number and the Reynolds number fixed at R e = 1000 . Overall, all three heights decrease as Weber number increases because increasing impact inertia promotes droplet spreading outwardly and therefore results in an increasingly thinner liquid film. However, droplet deformation shows a complex tendency and can be divided into three distinct regimes as impact Weber number increases, namely, puddle-shaped regime (I), transition regime (II) and pizza-shaped regime (III).
For relatively smaller Weber number ( W e < 12 ) in regime (I), it seems h c shows the highest value among three heights while h t shows the lowest, indicating that a relatively small impact inertia results in a droplet that appears like a puddle with a flattened top and a rounded edge. As droplet inertia increases to regime (II), the initial kinetic energy gradually dominates the energy transfer so that a rim can be squeezed out from the bottom part of the droplet and a narrow neck throat is formed to connect the rim and the central part of the droplet; the droplet shape is close to a pizza but with a thick height. As droplet impact inertia continually increases and finally reaches beyond W e = 30 , i.e., regime (III), we found h c approaches h t and its evolution becomes steady, indicating that the droplet deformation has become more pronounced so that a thin lamella is bordered by a rim; the droplet height can then be ignored when estimating the surface energy.
To further show the transition of droplet deformation, we quantitatively compared the relationship between droplet center height h c and the rim height h r denoted as Δ h = h c h r , as shown in Figure 12c. When the droplet spreading is in regime (I), i.e., W e < 12 , initial kinetic energy is insufficiently strong to overcome the constraints of surface tension, hence Δ h is generally larger than zero where cases under smaller R e are not taken into consideration. As droplet inertia increases into regime (II), Δ h decreases linearly by W e = 30 , beyond which droplet spread in the regime (III) and Δ h tends to become steady, indicating a uniform droplet deformation. These again suggest why the model of Wildeman et al. works well under W e > 30 in regime (III), where droplet height is negligible when compared to the spreading diameter and is associated with the “1/2 rule”, β m a x can be accurately estimated according to energy conservation. However, as W e decreases to regime (II) ( 12 W e 30 ) although the “1/2 rule” breaks down, the pizza-shaped droplet is precariously maintained, therefore β m a x only slightly deviates from Wildeman et al.’s model. As W e further decreases to W e < 12 , droplet deformation transitions into puddle-shape regime (I), where droplet height is non-negligible when estimating β m a x , and therefore produces substantial deflection.

3.5. Modeling β m a x under Small Weber Numbers

It has been recognized in the previous section that the “1/2 rule” breaks down when the droplet impact inertia decreases to W e 30 , therefore β m a x gradually deviates from the model of Wildeman et al. The deviation could be more prominent when the W e < 12 , where surface energy rather than kinetic energy dominates the energy budget, results in the non-negligible height. Therefore, in this section, we first adopted a revised Weber number W e r , which is defined as the droplet initial kinetic energy ( E k 0 = π ρ V 0 2 D 0 3 / 12 ) over its initial surface energy ( E s 0 = σ π D 0 2 ) hence W e r = W e / 12 . The W e r has been employed by Zhang and Zhang [44] to precisely measure the relative importance between droplet initial kinetic energy and surface energy.
To estimate β m a x using an energy conservation approach, we first introduced the droplet deformation ratio R d as the rate of surface energy increment Δ E s to initial kinetic energy E k 0 , given by R d = Δ E s / E k 0 . Figure 13 is used to show the relationship between R d and droplet revised Weber number W e r . Regardless of droplet spreading under relatively large R e cases for W e r > 1.0 , to be discussed later, R d seems independent of the R e and the simulation results agree well with the fitted formula, given by
R d = 0.7 W e r 0.1
Moderate deviation under W e r > 1.0 for relatively large R e cases can be attributed to the dual role of liquid viscosity in producing additional viscous dissipation which as discussed in the previous Section 3.2. In this case, surface energy increment can be express as Δ E s = R d Δ E k 0 . Meanwhile, cases under smaller R e are not the emphasis of the analysis in the current work and these data points are not used in the fitting for energy ratio R d in order to obtain a matching and suitable fitting result for the majority of cases.
Since droplet height is non-negligible when estimating surface energy under small Weber numbers ( W e 30 ), we safely move on to the investigation of the correlation between droplet height and the surface area. As discussed in Figure 12, droplet deformation and its transition can be characterized by three distinct heights, namely, the center height h c , the throat height h t and the rim height h r . To simplify the quantification on surface energy, droplet at τ m a x can be equivalent to a “column-shaped” cylinder with the identical droplet maximum spreading diameter D m a x and surface energy. Therefore, droplet height characterization can be simplified by using an equivalent surface energy height h e , in this case surface energy can be expressed as
E s ( τ m ) = σ π [ D m h e + D m 2 ( 1 cos θ ) 4 ]
where θ is the contract angle and can be determined as 180 ° in our simulations, as discussed in Section 3.1. h e can be further normalized by the D m a x as R e = h e / D m a x , which measures the relative importance of droplet height when compared to the droplet spreading diameter, and we found that R e is related to droplet impact inertia, as shown in Figure 14 that,
R e = 0.1 W e r 0.4
Consequently, β m a x can be estimated by accounting for droplet surface energy increment at τ m a x , yields
β m a x = 0.7 W e r 0.9 + 0.1 0.1 W e r 0.4 + ( 1 cos θ ) / 4   ( Free - slip , W e 30 )
Figure 15 shows the comparison among the present model (i.e., equation 10, denoted by the red line), the available numerical predictions and various experimental results. Following Lastakowski et al. [59], the droplet spreading on the free-slip surface with a gas film that existed throughout the whole spreading process can be regarded as a result of the impacts of Leidenfrost droplet. We therefore employed Pan et al.’s experimental results [54] of equal droplet collision, Tang et al.’s [11] experimental results of equal droplet collision and Tran et al.’s experimental results of Leidenfrost droplet in this comparison to validate the proposed model. Serval observations can be made in this figure as follows. Firstly, our numerical predictions agree well with these experimental data, which again confirms the accuracy of the present simulation. Secondly, the derived model for estimating β m a x under small Weber numbers ( W e 30 ) shows good agreement with both these experimental results and our numerical predictions. Finally, the present model and Wildeman et al.’s model shows fine continuity at W e = 30 . It is worth noting that the model proposed in the current work is based on a contact angle of 180° for droplet spreading and there is also a good agreement with the results of our experimental results with variable advancing contact angle around 180°.

4. Conclusions

A comprehensive experimental and numerical study on droplet impacts on a free-slip surface is presented in this study, with particular emphasis on the dynamics under small Weber numbers ( W e 30 ) and different impacting parameters.
Our experimental and numerical results for large Weber numbers ( W e > 30 ) show good agreement with the prediction of the widely-used model of Wildeman et al. wherein the simulation successfully predicted the “1/2 rule” for the reliable dimensionless droplet maximum spreading diameter β m a x . Moreover, our numerical prediction of a relationship between β m a x and spreading time τ m a x agrees well with the previous investigation [40]. In terms of the spreading under relatively small Weber numbers ( W e 30 ), we found β m a x deviates from Wildeman et al.’s [40] model for the following two reasons. Firstly, as droplet impact inertia decreases to W e 30 , where a W e -dependent energy budget can be found, the “1/2 rule” breaks down. Secondly, droplet progressively lost its thin pizza-like shape and finally degenerated into puddle-like shape whose height is non-negligible when estimating the surface energy.
Droplet spreading can be divided into three distinct regimes. The first regime (I) is characterized by the puddle-shaped droplet at τ m a x , in this case initial kinetic energy is insufficiently strong to overcome the surface tension force, hence droplet surface energy dominates energy budget, restricts droplet deformation, and therefore produces a similar strain rate. Consequently, viscous dissipation in regime (I) is controlled by the liquid viscosity (denoted by R e ) and decreases as R e increases. The second regime (II) is regarded as the transition regime. In this case, initial kinetic energy is comparable to the surface energy so that surface energy dominates the energy budget when the initial kinetic energy can be consumed in a timely manner at the earlier stage, probably under relatively small R e cases; while kinetic energy in turn dominates the energy budget under the condition of relatively large R e cases, because the unconsumed kinetic energy is sufficiently strong to overcome the surface tension force. The competition between surface energy and kinetic energy finally results in the dual role of liquid viscosity and therefore a non-monotonic energy budget. The third regime (III) is characterized by the uniform droplet deformation (thin pizza-shaped), where initial kinetic energy is far stronger than the surface energy so that it dominates the energy budget, resulting in the “1/2 rule” being validated and droplet height being negligible when compared to the spreading diameter.
Based on the understanding of droplet spreading under small Weber numbers ( W e 30 ), the energy conservation approach was again employed to model the dimensionless droplet maximum spreading diameter β m a x by accounting for the influence of impact parameters (such as W e and R e ) on the energy budget and the droplet height at τ m a x . A revised Weber number W e r , which correctly reflects the orders of magnitude of various energies, was adopted to replace the W e in our modeling works. The proposed model was found to correlate well with the numerical results and the experimental results of Pan et al. [54], Tang et al., Tran et al. and our present experiment, it can therefore be expressed as a practical model to estimate β m a x under smaller Weber numbers ( W e 30 ).

Author Contributions

Conceptualization, Z.Z.; methodology, N.W.; software, Z.Z.; validation, N.W.; formal analysis, N.W.; investigation, N.W.; resources, J.Z.; data curation, N.W.; writing—original draft preparation, N.W.; writing—review and editing, Z.Z.; visualization, N.W.; supervision, Z.Z.; project administration, J.Z.; funding acquisition, J.Z. All authors have read and agreed to the published version of the manuscript.

Funding

This research was funded by National Natural Science Foundation of China grant number 51806013, Foundation research funds of Ministry of Industry and Information Technology grant number JCKY2019602D018 and Beijing Institute of Technology Research Fund Program for Young Scholars grant number 2020CX04047. The APC was funded by National Natural Science Foundation of China grant number 51806013.

Data Availability Statement

The dataset used and/or analyzed during the current study is available from the corresponding author.

Acknowledgments

The authors would like to thank the reviewers for their valuable comments and the administrative staff.

Conflicts of Interest

The authors declare no conflict of interest.

References

  1. Yarin, A.L. DROP IMPACT DYNAMICS: Splashing, Spreading, Receding, Bouncing…. Annu. Rev. Fluid Mech. 2006, 38, 159–192. [Google Scholar] [CrossRef]
  2. Ezzatneshan, E.; Khosroabadi, A. Droplet spreading dynamics on hydrophobic textured surfaces: A lattice Boltzmann study. Comput. Fluids 2021, 231, 105063. [Google Scholar] [CrossRef]
  3. Banitabaei, S.A.; Amirfazli, A. Droplet impact onto a solid sphere in mid-air: Effect of viscosity, gas density, and diameter ratio on impact outcomes. Phys. Fluids 2020, 32, 037102. [Google Scholar] [CrossRef]
  4. Sun, T.P.; Alvarez-Novoa, F.; Andrade, K.; Gutierrez, P.; Gordillo, L.; Cheng, X. Stress distribution and surface shock wave of drop impact. Nat. Commun. 2022, 13, 1703. [Google Scholar] [CrossRef] [PubMed]
  5. Ju, J.; Yang, Z.; Yi, X.; Jin, Z. Experimental investigation of the impact and freezing processes of a hot water droplet on an ice surface. Phys. Fluids 2019, 31, 057107. [Google Scholar] [CrossRef]
  6. Zhang, J.T.; Liu, H.R.; Ding, H. Head-on collision of two immiscible droplets of different components. Phys. Fluids 2020, 32, 082106. [Google Scholar] [CrossRef]
  7. Ezzatneshan, E.; Goharimehr, R. Study of spontaneous mobility and imbibition of a liquid droplet in contact with fibrous porous media considering wettability effects. Phys. Fluids 2020, 32, 113303. [Google Scholar] [CrossRef]
  8. Wu, H.; Zhang, F.; Zhang, Z. Droplet breakup and coalescence of an internal-mixing twin-fluid spray. Phys. Fluids 2021, 33, 013317. [Google Scholar] [CrossRef]
  9. Liu, X.; Zhang, X.; Min, J. Maximum spreading of droplets impacting spherical surfaces. Phys. Fluids 2019, 31, 092102. [Google Scholar] [CrossRef]
  10. Lamanna, G.; Geppert, A.; Bernard, R.; Weigand, B. Drop impact onto wetted walls: An unsteady analytical solution for modelling crown spreading. J. Fluid Mech. 2022, 938, A34. [Google Scholar] [CrossRef]
  11. Tang, C.; Qin, M.; Weng, X.; Zhang, X.; Zhang, P.; Li, J.; Huang, Z. Dynamics of droplet impact on solid surface with different roughness. Int. J. Multiphase Flow 2017, 96, 56–69. [Google Scholar] [CrossRef]
  12. Moreira, A.L.N.; Moita, A.S.; Panão, M.R. Advances and challenges in explaining fuel spray impingement: How much of single droplet impact research is useful? Prog. Energy Combust. Sci. 2010, 36, 554–580. [Google Scholar] [CrossRef]
  13. De Goede, T.; de Bruin, K.; Shahidzadeh, N.; Bonn, D. Droplet splashing on rough surfaces. Phys. Rev. Fluids 2021, 6, 043604. [Google Scholar] [CrossRef]
  14. Bouillant, A.; Lafoux, B.; Clanet, C.; Quere, D. Thermophobic Leidenfrost. Soft Matter 2021, 17, 8805–8809. [Google Scholar] [CrossRef] [PubMed]
  15. García-Geijo, P.; Quintero, E.S.; Riboux, G.; Gordillo, J.M. Spreading and splashing of drops impacting rough substrates. J. Fluid Mech. 2021, 917, A50. [Google Scholar] [CrossRef]
  16. Bennett, T.; Poulikakos, D. Splat-quench solidification-estimating the maximum spreading of a droplet impacting a solid surface. J. Mater. Sci. 1993, 28, 963–970. [Google Scholar] [CrossRef]
  17. German, G.; Bertola, V. Review of drop impact models and validation with high-viscosity Newtonian fluids. Atom. Sprays 2009, 19, 787–807. [Google Scholar] [CrossRef]
  18. Marengo, M.; Antonini, C.; Roisman, I.V.; Tropea, C. Drop collisions with simple and complex surfaces. Curr. Opin. Colloid Interface Sci. 2011, 16, 292–302. [Google Scholar] [CrossRef]
  19. Scheller, B.L.; Bousfield, D.W. Newtonian drop impact with a solid surface. AlChE J. 1995, 41, 1357–1367. [Google Scholar] [CrossRef]
  20. Marmanis, H.; Thoroddsen, S.T. Scaling of the fingering pattern of an impacting drop. Phys. Fluids 1996, 8, 1344–1346. [Google Scholar] [CrossRef]
  21. Weiss, D.A.; Yarin, A.L. Single drop impact onto liquid films- Neck distortion, jetting, tiny bubble entrainment, and crown formation. J. Fluid Mech. 1999, 385, 229–254. [Google Scholar] [CrossRef]
  22. Rioboo, R.; Marengo, M.; Tropea, C. Outcomes from a drop impact on solid surface. Atom. Sprays 2001, 11, 155–166. [Google Scholar] [CrossRef]
  23. Clanet, C.; BÉGuin, C.; Richard, D.; QuÉRÉ, D. Maximal deformation of an impacting drop. J. Fluid Mech. 2004, 517, 199–208. [Google Scholar] [CrossRef]
  24. Bayer, I.S.; Megaridis, C.M. Contact angle dynamics in droplets impacting on flat surfaces with different wetting characteristics. J. Fluid Mech. 2006, 558, 415–449. [Google Scholar] [CrossRef]
  25. Bejan, A.; Gobin, D. Constructal theory of droplet impact geometry. Int. J. Heat Mass Transfer 2006, 49, 2412–2419. [Google Scholar] [CrossRef]
  26. Eggers, J.; Fontelos, M.A.; Josserand, C.; Zaleski, S. Drop dynamics after impact on a solid wall: Theory and simulations. Phys. Fluids 2010, 22, 062101. [Google Scholar] [CrossRef] [Green Version]
  27. Tran, T.; Staat, H.J.J.; Prosperetti, A.; Sun, C.; Lohse, D. Drop Impact on Superheated Surfaces. Phys. Rev. Lett. 2012, 108, 036101. [Google Scholar] [CrossRef] [Green Version]
  28. Laan, N.; de Bruin, K.G.; Bartolo, D.; Josserand, C.; Bonn, D. Maximum Diameter of Impacting Liquid Droplets. Phys. Rev. Appl. 2014, 2, 044018. [Google Scholar] [CrossRef] [Green Version]
  29. Seo, J.; Lee, J.S.; Kim, H.Y.; Yoon, S.S. Empirical model for the maximum spreading diameter of low-viscosity droplets on a dry wall. Exp. Therm. Fluid Sci. 2015, 61, 121–129. [Google Scholar] [CrossRef]
  30. Davidson, M.R. Spreading of an inviscid drop impacting on a liquid film. Chem. Eng. Sci. 2002, 57, 3639–3647. [Google Scholar] [CrossRef]
  31. Roisman, I.V.; Rioboo, R.; Tropea, C. Normal Impact of a Liquid Drop on a Dry Surface- Model for Spreading and Receding. Proc. R. Soc. A-Math. Phys. Eng. Sci. 2002, 458, 1411–1430. [Google Scholar] [CrossRef]
  32. Roisman, I.V.; Berberović, E.; Tropea, C. Inertia dominated drop collisions. I. On the universal flow in the lamella. Phys. Fluids 2009, 21, 052103. [Google Scholar] [CrossRef]
  33. Roisman, I.V. Inertia dominated drop collisions. II. An analytical solution of the Navier–Stokes equations for a spreading viscous film. Phys. Fluids 2009, 21, 052104. [Google Scholar] [CrossRef]
  34. Chandra, S.; Avedisian, C.T. On the Collision of a Droplet with a Solid Surface. Proc. R. Soc. A-Math. Phys. Eng. Sci. 1998, 432, 13–41. [Google Scholar] [CrossRef]
  35. Fukai, J.; Shiiba, Y.; Yamamoto, T.; Miyatake, O.; Poulikakos, D.; Megaridis, C.M.; Zhao, Z. Wetting effects on the spreading of a liquid droplet colliding with a flat surface: Experiment and modeling. Phys. Fluids 1995, 7, 236–247. [Google Scholar] [CrossRef]
  36. Pasandideh-Fard, M.; Qiao, Y.M.; Chandra, S.; Mostaghimi, J. Capillary effects during droplet impact on a solid surface. Phys. Fluids 1996, 8, 650–659. [Google Scholar] [CrossRef]
  37. Fukai, J.; Tanaka, M.; Miyatake, O. Maximum Spreading of Liquid Droplets Colliding with Flat Surfaces. J. Chem. Eng. Jpn. 2004, 31, 456–461. [Google Scholar] [CrossRef]
  38. Attané, P.; Girard, F.; Morin, V. An energy balance approach of the dynamics of drop impact on a solid surface. Phys. Fluids 2007, 19, 012101. [Google Scholar] [CrossRef]
  39. An, S.M.; Lee, S.Y. Maximum spreading of a shear-thinning liquid drop impacting on dry solid surfaces. Exp. Therm Fluid Sci. 2012, 38, 140–148. [Google Scholar] [CrossRef]
  40. Wildeman, S.; Visser, C.W.; Sun, C.; Lohse, D. On the spreading of impacting drops. J. Fluid Mech. 2016, 805, 636–655. [Google Scholar] [CrossRef]
  41. Gao, S.; Liao, Q.; Liu, W.; Liu, Z. Nanodroplets Impact on Rough Surfaces: A Simulation and Theoretical Study. Langmuir 2018, 34, 5910–5917. [Google Scholar] [CrossRef] [PubMed]
  42. Park, S.W.; Lee, C.S. Macroscopic and microscopic characteristics of a fuel spray impinged on the wall. Exp. Fluids 2004, 37, 745–762. [Google Scholar] [CrossRef]
  43. Qin, M.; Tang, C.; Tong, S.; Zhang, P.; Huang, Z. On the role of liquid viscosity in affecting droplet spreading on a smooth solid surface. Int. J. Multiph. Flow 2019, 117, 53–63. [Google Scholar] [CrossRef]
  44. Zhang, Z.; Zhang, P. Numerical Interpretation to the Roles of Liquid Viscosity in Droplet Spreading at Small Weber Numbers. Langmuir 2019, 35, 16164–16171. [Google Scholar] [CrossRef] [PubMed]
  45. Huang, H.-M.; Chen, X.-P. Energetic analysis of drop’s maximum spreading on solid surface with low impact speed. Phys. Fluids 2018, 30, 022106. [Google Scholar] [CrossRef]
  46. Wang, F.; Yang, L.; Wang, L.; Zhu, Y.; Fang, T. Maximum Spread of Droplet Impacting onto Solid Surfaces with Different Wettabilities: Adopting a Rim-Lamella Shape. Langmuir 2019, 35, 3204–3214. [Google Scholar] [CrossRef]
  47. Zhang, Z.; Zhang, P. Kinetic energy recovery and interface hysteresis of bouncing droplets after inelastic head-on collision. Phys. Fluids 2017, 29, 103306. [Google Scholar] [CrossRef]
  48. Zhang, Z.; Zhang, P. Modeling Kinetic Energy Dissipation of Bouncing Droplets for Lagrangian Simulation of Impinging Sprays Under High Ambient Pressures. Atom. Sprays 2018, 28, 673–694. [Google Scholar] [CrossRef]
  49. Unverdi, S.O.; Tryggvason, G. A front-tracking method for viscous, incompressible, multi-fluid flows. J. Comput. Phys. 1992, 100, 25–37. [Google Scholar] [CrossRef] [Green Version]
  50. Tryggvason, G.; Bunner, B.; Esmaeeli, A.; Juric, D.; Al-Rawahi, N.; Tauber, W.; Han, J.; Nas, S.; Jan, Y.J. A Front-Tracking Method for the Computations of Multiphase Flow. J. Comput. Phys. 2001, 169, 708–759. [Google Scholar] [CrossRef]
  51. Nobari, M.R.H.; Jan, Y.J.; Tryggvason, G. Head-on collision of drops—A numerical investigation. Phys. Fluids 1993, 8, 29–42. [Google Scholar] [CrossRef] [Green Version]
  52. Qian, J.; Law, C.K. Regimes of coalescence and separation in droplet collision. J. Fluid Mech. 1997, 331, 59–80. [Google Scholar] [CrossRef]
  53. Singh, R.; Shyy, W. Three-dimensional adaptive Cartesian grid method with conservative interface restructuring and reconstruction. J. Comput. Phys. 2007, 224, 150–167. [Google Scholar] [CrossRef]
  54. Pan, K.L.; Law, C.K.; Zhou, B. Experimental and mechanistic description of merging and bouncing in head-on binary droplet collision. J. Appl. Phys. 2008, 103, 064901. [Google Scholar] [CrossRef] [Green Version]
  55. Pan, K.L.; Yin, G.C. Parallel strategies of front-tracking method for simulation of multiphase flows. Compute. Fluids 2012, 67, 123–129. [Google Scholar] [CrossRef]
  56. Kuan, C.K.; Pan, K.L.; Shyy, W. Study on high-Weber-number droplet collision by a parallel, adaptive interface-tracking method. J. Fluid Mech. 2014, 759, 104–133. [Google Scholar] [CrossRef]
  57. Zhang, P.; Law, C.K. An analysis of head-on droplet collision with large deformation in gaseous medium. Phys. Fluids 2011, 23, 042102. [Google Scholar] [CrossRef]
  58. Pan, K.L.; Chou, P.C.; Tseng, Y.J. Binary droplet collision at high Weber number. Phys. Rev. E Stat. Nonlin. Soft Matter Phys. 2009, 80, 036301. [Google Scholar] [CrossRef]
  59. Lastakowski, H. Drop Impacts on air Cushions: Super-Hydrophobic, Hot or Moving Surfaces. Ph.D. Thesis, Institut Lumière Matière, Villeurbanne, France, 2013. [Google Scholar]
Figure 1. (a) Schematic diagram of the experimental setup for the droplet impact at elevated ambient pressures and (b) sectional view of the pressure vessel where the experimental equipment or pipeline corresponded to the serial number. (1) Droplet generator, (2) constant volume chamber, (3) regulating valve, (4) liquid tank, (5) solid surface, (6) high-speed camera, and (7) LED lamp. In (a), the orange arrow represents the injection of high-pressure compressed nitrogen into the chamber and the blue arrow represents the liquid supply into droplet generator respectively. The blue solid line represents the path for electrical signals and data.
Energies 15 08181 g001
Figure 2. Axisymmetric computational domain with uniform structured grids. Each unit length contains 88 cells. The boundary conditions can be set to a free-slip or partial-slip surface as illustrating in the graph.
Energies 15 08181 g002
Figure 3. Time sequences of ultra-pure water droplet impact a stainless-steel smooth surface arrayed in non-dimensional time τ under (a) W e = 30 and R e = 750 , (b) W e = 21 and R e = 612 , (c) W e = 10 and R e = 421 , (d) W e = 5 and R e = 281 under atmospheric pressure for experimental and numerical results. The red dash line denotes the impact horizontal line.
Energies 15 08181 g003
Figure 4. Comparison between the numerical calculation (denoted by the black solid line) and the experiment results (denoted by the red solid point) for the droplet non-dimensional diameter D / D 0 varied with non-dimensional time τ under 4 groups of impact parameters. (a) W e = 30 and R e = 750 , (b) W e = 21 and R e = 612 , (c) W e = 10 and R e = 421 , (d) W e = 5 and R e = 281 .
Energies 15 08181 g004
Figure 5. Comparison between the present experimental results (denoted by the stars), Tran et al.’s experimental results (denoted by the pentagon symbols) [27] and numerical predictions (denoted by the solid symbols) and the Wildeman et al.’s model (denoted by the solid line) for dimensionless droplet maximum spreading diameter β m a x under large Weber numbers ( W e 30 ).
Energies 15 08181 g005
Figure 6. Energy budget of droplet spread on the free-slip surface under We ≥ 30. The dash line indicates the “1/2 rule”. (a) the evolution of four different energies during droplet spreading process and (b) shows the energy budget at τ m a x for various droplet inertias and Reynolds numbers.
Energies 15 08181 g006
Figure 7. Spreading time τ m a x versus maximum spreading diameter β m a x for simulations with W e 30 .
Energies 15 08181 g007
Figure 8. Comparison between the present experimental results (denoted by the stars), Tang et al.’s experimental results (denoted by the pentagram symbols) [11], Tran et al.’s experimental results (denoted by the pentagon symbols) [27], Pan et al.’s experimental results (denoted by the hexagon symbols) [54], numerical predictions (denoted by the solid symbols) and the Wildeman et al.’s model [40] (denoted by the solid line) for dimensionless droplet maximum spreading diameter β m a x under small Weber numbers ( W e 30 ).
Energies 15 08181 g008
Figure 9. Energy budget under small Weber numbers for different Reynolds numbers.
Energies 15 08181 g009
Figure 10. Figure 10. Viscous dissipation rate for droplet spread under different R e cases at (ac) W e = 9 and (ef) W e = 30 .
Energies 15 08181 g010
Figure 11. Comparison of V D R ( r ) for droplet spreading under three different Reynolds numbers for (a) W e = 9 and (b) W e = 30 .
Energies 15 08181 g011
Figure 12. Schematic of droplet deformation transition characterized by different heights. (a) Comparison of droplet morphology at τ m a x between droplet impact under small We  ( W e = 2.76 ) and large We  ( W e = 47.53 ) , (b) three different heights h c , h t and h r varying with W e and (c) the difference between h c and h r i.e., Δ h varying with W e .
Energies 15 08181 g012aEnergies 15 08181 g012b
Figure 13. Correlation between R d = Δ E s / E k 0 and revised Weber number with R 2 = 0.88 .
Energies 15 08181 g013
Figure 14. Correlation between the normalized droplet equivalent height R e = h e / D m a x and revised Weber number W e r with R 2 = 0.78 .
Energies 15 08181 g014
Figure 15. Comparison between the derived spreading models (black solid line indicates Wildeman et al.’s model [40], while the red line denotes the present proposed model) and data points (Tang et al.’s experimental results (denoted by the pentagram symbols) [11], Tran et al.’s experimental results (denoted by the pentagon symbols) [27], Pan et al.’s experimental results (denoted by the hexagon symbols) [54], present experiment and numerical predictions).
Energies 15 08181 g015
Publisher’s Note: MDPI stays neutral with regard to jurisdictional claims in published maps and institutional affiliations.

