Abstract
The equilibrium concentration space of the Ag–In–Te system in the part AgInTe2–Te–In2Te3 was studied through the modified solid-state electromotive force (EMF) method by dividing In2Te3–In2Te5–Ag3In97Te147 (I), In2Te5–Te–Ag3In97Te147 (II), Ag3In97Te147–Te–AgIn5Te8 (III), AgIn5Te8–Te–AgIn3Te5 (IV), and AgIn3Te5–Te–AgInTe2 (V), into separate phase regions at T ≤ 500 K. The formation of a thermodynamically stable combination of the binary and ternary phases in the (I)–(V) phase regions from a metastable phase mixture of substances was carried out at T ≤ 500 K in the R(Ag+) part of the positive electrode (PE) of the galvanic cells (GCs) of the structure: (−) C |∙| Ag |∙| SE |∙| R(Ag+) |∙| PE |∙| C (+), where C is the graphite (inert electrode), SE is the solid-state electrolyte (Ag3GeS3Br glass), and Ag is the left (negative) electrode. The Ag+ ions in the R(Ag+) region functioned as small nucleation centers for the formation of the stable phases. The spatial position of the (I)–(V) phase regions in the concentration space of the Ag–In–Te system relative to the position of silver was used to express the overall potential-forming reactions with the participation of the substances Ag, Te, In2Te5, Ag3In97Te147, AgIn5Te8, AgIn3Te5, and AgInTe2. The subsequent EMF measurements were carried out by applying the same GCs. The temperature dependences of the EMF of GCs with PE of the (I)–(V) phase regions were here used to determine, for the first time, the values of standard thermodynamic functions of the binary and ternary compounds. The determined values of the Gibbs energies of the formation of compounds are equal: , , , , and The correctness of the division of the equilibrium phase space of the Ag–In–Te system in the part AgInTe2–Te–In2Te3 involving the AgInTe2, AgIn3Te5, AgIn5Te8, and Ag3In97Te147 compounds was confirmed by the agreement of the calculated and literature-based thermodynamic data for In2Te5 compound. Compositions of pairs of the ternary compounds for their subsequent practical application were proposed.
1. Introduction
The move towards a decarbonized energy future demands the discovery of new energy materials with unique properties, such as wider chemical and thermal stability ranges. Recent attempts in the search for advanced energy materials have shown progress in identifying promising materials for high-performance energy applications [1,2]. The search for new energy materials involves the determination of phase transformations, melting, phase equilibria with coexisting phases, and other application-based thermodynamic properties [3]. Recently, a novel approach for discovering new energy materials, called phase boundary mapping, has also been applied [4]. The latest thermal performance investigation of nanofluids for thermal management applications has also shown promising results for medium-temperature waste-heat recovery applications [5]. The availability of these data helps to optimize materials processing and the selection of high-performance and cost-effective materials [6]. The roles of materials design, experimental techniques, and computational tools in the discovery of new inorganic materials with unique properties are illustrated in Figure 1 [7].
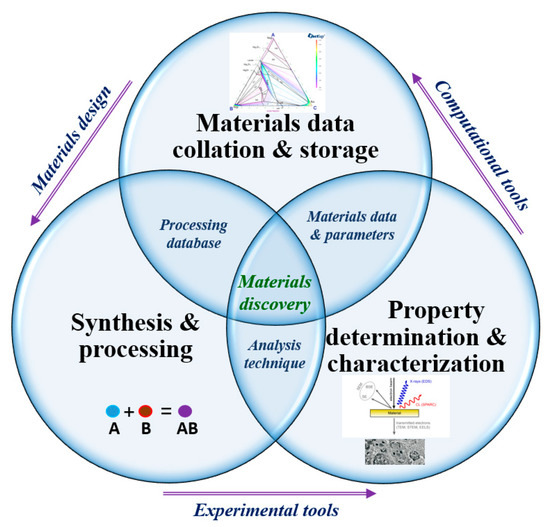
Figure 1.
A diagram showing the relationship between materials design, experimentation, and modeling in a framework for the discovery of new inorganic materials.
The semiconductor compounds of the systems A I–B III–C VI (A I–Ag, Cu; B III–In, Al, Ga; C VI–Te, Se, S) with the chalcopyrite A IB IIIC VI2 and defect-containing chalcopyrite A IB III2n+1C VI3n+2 (n = 1, 2) crystal structures are considered to be promising materials for various practical applications in non-linear optical devices, power generation, and converters of light and waste heat energy into electricity at moderate temperatures [8,9,10,11]. For example, the thermoelectric (TE) process, the conversion of waste heat energy into electricity by exploiting the temperature gradient, produces clean energy and reduces fossil fuel consumption [12,13,14]. Some, TE materials, such as these Ag–Se–Te-based materials, have the best TE performance, even at low temperatures [3].
A TE system is considered to be one of the preferred clean energy techniques because of its qualities, such as being small in size, having no moving parts, and having temperature control capacities [15]. TE technology provides the possibility to overcome the ever-growing energy demand and environmental crisis [16].
One of the most effective ways of using a temperature gradient for TE generation is to assemble numerous pairs of p/n elements made in the form of contact of two compounds from the same family. For this purpose, Fujii et al. [17] investigated and compared the electrical properties and electronic structure of the AgInTe2 and AgIn5Te8 compounds separated in the T–x space of the Ag2Te–In2Te3 cross-section at T < 680 K by a two-phase region [18,19,20,21]. Calculations of the electronic structure by applying Korringa–Kohn–Rostoker–Green’s method showed that these compounds have valence bands of the same shape and conduction bands of different shapes. It has been noted that the defect-containing chalcopyrite AgIn5Te8 can be a functioning n-type TE material due to its band structure [17].
The choice of the p-AgInTe2 and n-AgIn5Te8 compounds for the creation of numerous pairs of the p/n components to obtain the high voltage may not be realized in practice due to thermodynamic reasons. The reason for this may be the intermediate compound AgIn3Te5, which is predicted for the equilibrium T–x space of the Ag2Te–In2Te3 cross-section at moderate temperatures [22,23]. The lack of information about the AgIn3Te5 compound in [18,19,20,21] is probably related to the metastable state (for kinetic reasons) of the mixture of the AgInTe2 and AgIn5Te8 compounds below 680 K. The possibility of overcoming kinetic obstacles to the formation of a thermodynamically stable set of chalcogenide and chalcohalide phases from a metastable phase mixture of compounds in the galvanic cells (GCs) with the participation of the Ag+ ions was reported in [24,25,26,27]. Nevertheless, there is a lack of information on the thermal stabilities and thermodynamic properties of the ternary compounds in the Ag–In–Te system.
The purpose of this work was to establish the phase composition of the equilibrium T–x space of the Ag–In–Te system in the AgInTe2–Te–In2Te3 phase region below 500 K and to determine the standard thermodynamic quantities of the compounds. The established thermodynamic properties of the equilibrium phases in the Ag–In–Te system have a great fundamental and practical interest in materials science. For example, the obtained results can be applied for the scientifically based strategy of selected pairs of the p/n elements of the Ag–In–Te system for the TE applications.
2. Materials and Methods
The high-purity substances Ag, In, and Te (>99.99 wt.%, Alfa Aesar, Karlsruhe, Germany) were used for the synthesis of the binary and ternary compounds. The appropriately weighed and mixed pure substances were melted in an inert atmosphere. Melts of the mixtures were homogenized for 20 min, followed by cooling to room temperature at a rate of 5 K·min−1. Polycrystalline powder samples from the crystallized melt were crushed to a particle size of ~5 μm and analyzed with the XRD technique before the preparation of the positive electrodes of the GCs. A diffractometer STOE STADI P, equipped with a linear position-sensitive detector PSD in a geometry of Guinier (transmission mode, CuKα1 radiation, a bent Ge(111) monochromator, and a scan mode of 2θ/ω), was applied for the phase composition characterization of the samples. The following program modules, STOE WinXPOW [28], PowderCell [29], and FullProf [30], as well as databases [31,32], were used for the X-ray powder diffraction (XRPD) analysis.
Synthesis of the thermodynamically stable set of phases below 500 K from the metastable mixtures of silver, tellurium, and multicomponent compounds, and the subsequent electromotive force (EMF, E) measurements were performed with GCs of type (A): (−) C |∙| Ag |∙| SE |∙| R(Ag+) |∙| PE |∙| C (+), where C is the graphite (inert electrode), SE is the solid-state electrolyte (Ag3GeS3Br glass [33]), Ag is the left (negative) electrode, R(Ag+) is the buffer region of PE that contacts with the SE, and PE is the right (positive) electrode. The ratios of the initial components of the PE of GCs were determined from the potential-forming reactions in the phase region of the respective reactions. The components of the GCs were pressed through a 2 mm diameter hole, at 108 Pa, which was arranged in a fluoroplastic matrix, up to a density of ρ = (0.93 ± 0.02)∙ρ0, where ρ0 is the density of the cast samples determined experimentally [34,35]. The process of forming the thermodynamically stable set of phases from the metastable phase mixture of finely dispersed substances was conducted in the R(Ag+) region. The Ag+ ions served as the small nucleation centers of formation of the stable phases [25,26,27]. After completion of the synthesis process, the GCs (A) were used for E vs. T measurements.
The experiments were conducted in a resistance furnace oriented horizontally, which is similar to those described in our previous work [36]. A flow of (10–5 m3⋅min–1) highly purified (99.99 vol.%) Ar (g) at P = 1.2⋅105 Pa was utilized as a protective atmosphere, flowing from the left to the right electrodes of GCs. The uncertainty for the temperature was ± 0.5 K. The EMF values of the cells were measured using the high-resistance (input impedance of more than 1012 Ω) Picotest M3500A universal digital multimeter. The equilibrium in GCs at each temperature was attained in <2 h. At equilibrium, the EMF records were stable, with negligible variations not exceeding ±0.2 mV [37]. The EMF vs. T dependences of GCs were analyzed by the methodology described in [38,39,40].
3. Results and Discussion
The phase equilibria of the Ag–In–Te system in the part AgInTe2–Te–In2Te3 are shown in Figure 2.
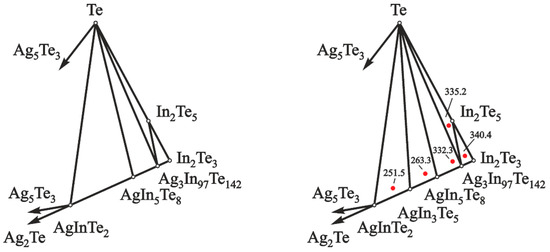
Figure 2.
Division of the concentration space in the Ag–In–Te system, in the part AgInTe2–Te–In2Te3, below 500 K, according to data of [18,19,20] (left) and the present study (right). Red dots indicate EMF values (mV) of the GCs and compositions of the positive electrodes at 460 K.
The presence of five phase regions in this area was established using the EMF method. These five phase regions are: In2Te3–In2Te5–Ag3In97Te147 (I), In2Te5–Te–Ag3In97Te147 (II), Ag3In97Te147–Te–AgIn5Te8 (III), AgIn5Te8–Te–AgIn3Te5 (IV), and AgIn3Te5–Te–AgInTe2 (V). The following principles confirmed the validity of the presented division of the concentration space:
- the GCs with PE of the mentioned phase regions are characterized by different EMF values at the same temperature, Figure 2 (right);
- as the phase region approaches the position of silver composition, the EMF values of cells decrease [41]; and
- subsequent determination of thermodynamic data of the In2Te5 compound.
Following Figure 2, the phase regions (I)–(V) position relative to silver can be applied to determine the thermodynamic properties of the constituent compounds by the EMF method [42,43,44]. The formation reaction of the compound Ag3In97Te147 from pure element Ag and binary compounds In2Te3 and In2Te5 in the phase region (I) can be expressed as:
12Ag = 12Ag + + 12e − – left electrode,
12Ag + + 12e – + 191In2Te3 + 3In2Te5 = 4Ag3In97Te147 − right electrode,
12Ag + 191In2Te3 + 3In2Te5 = 4Ag3In97Te147 − overall cell reaction.
The overall potential-forming cell reactions in the PE of GCs for the phase regions (II)–(V) can be written as:
12Ag + 194In2Te5 = 4Ag3In97Te147 + 382Te,
82Ag + 5Ag3In97Te147 + 41Te = 97AgIn5Te8,
2Ag + 3AgIn5Te8 + Te = 5AgIn3Te5,
2Ag + AgIn3Te5 + Te = 3AgInTe2.
Based on the reactions (R1)–(R5), compositions of powder mixtures of silver, tellurium along with binary and ternary compounds in the PE of GCs of the phase regions (I)–(V) were determined.
Part of the cooled melts of the compounds specified in reactions (R1)–(R5) is metastable. According to the X-ray diffraction results (Figure 3), the cooled melt of the formula composition Ag3In97Te147 consists of characteristic peaks for the AgxIn0.67Te (space group F-43m) and InTe (space group I4/mcm) phases. The diffraction pattern (Figure 4) of an aliquot of the as-synthesized compound AgIn5Te8 mainly identifies AgIn5Te8 as the primary phase and In2Te5 as a minor impurity. Solid-state vacuum annealing at 600 K for homogenization did not modify the phase composition of the specified cooled melts. Samples of the formula compositions In2Te3, In2Te5, and AgInTe2 were crystallized as single-phase compounds. The process of forming the thermodynamically stable set of phases from the metastable mixture of components in the PE of GCs for the participation of Ag+ ions ended within 48 h at 500 K. The criterion for phase equilibria attainment in the PE’s R(Ag+) region is the reproducibility of the E vs. T dependencies of GCs during the thermal cycles.
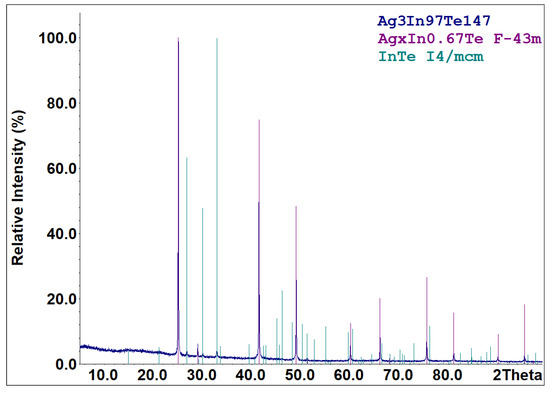
Figure 3.
XRPD pattern of the sample with the nominal composition Ag3In97Te147. Compositions of the sample and identified phases (with space group indicated) are shown in the upper-right corner.
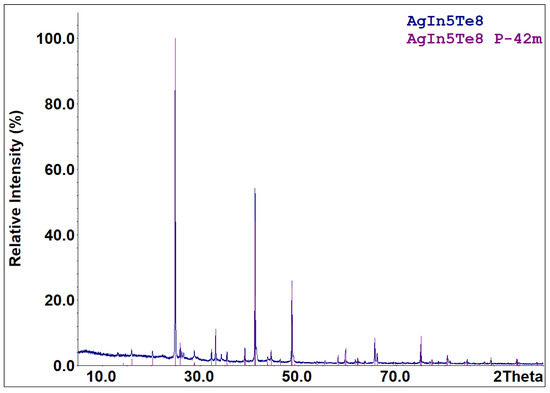
Figure 4.
XRPD pattern of the sample with the nominal composition AgIn5Te8. Compositions of the sample and identified phase (with space group indicated) are shown in the upper-right corner.

Table 1.
A summary of the measured EMF values and temperatures of the GCs in different phase regions of the Ag–In–Te system.
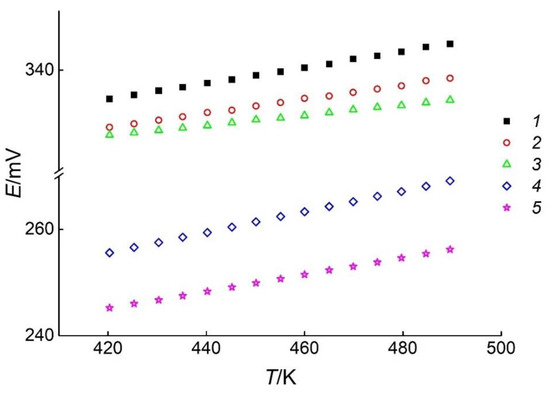
Figure 5.
The E vs. T dependences of the GCs with positive electrodes of different phase assemblages. Sets of symbols numbered from 1 to 5 correspond to the phase regions In2Te3–In2Te5–Ag3In97Te147 (I), In2Te5–Te–Ag3In97Te147 (II), Ag3In97Te147–Te–AgIn5Te8 (III), AgIn5Te8–Te–AgIn3Te5 (IV), and AgIn3Te5–Te–AgInTe2 (V), respectively.
The analysis of the E vs. T dependences for the reactions (R1)–(R5) between 420 and 489 K was performed by the least-squares method [41,45] using Equation (1):
where , ( is the EMF of the GC at temperature , and is the number of experimental pairs and ).
The and coefficients were calculated by applying Equations (2) and (3):
The statistical dispersions of the uncertainties in the measurement consisted of the calculation variances in values of the EMF (), coefficients () and (), and the dispersions of the EMF values () calculated with Equation (1) are equal:
Uncertainties () of the relative quantities can be calculated by the Equation (8):
where is the Student’s coefficient, and is the standard deviation. At a confidence level of 95% and , the Student’s coefficient is [45].
The final equation of the E vs. T dependences together with the statistical dispersions can be express as [43,44]:
As listed in Table 1, the values of the temperature and EMF were used to calculate the dispersions and coefficients of Equation (9) for the phase regions (I)–(V). The results of the calculations are presented in Table 2.
Table 2.
The E vs. T dependences for the type (A) GCs in the (I)–(V) phase regions of the Ag–In–Te system in the range between 420 and 489 K.
The Gibbs energies (), enthalpies (), and entropies () of the reactions (R1)–(R5) can be calculated by the thermodynamic Equations (10)–(12):
where is the number of electrons involved in the reactions (R1)–(R5), F is the Faraday constant, and E is the EMF of the GC.
The thermodynamic equations of the reactions (R1)–(R5) at 298 K were calculated using Equations (10)–(12) in the approximation and [46,47]. The results of the calculations are presented in Table 3.
Table 3.
The values of standard thermodynamic functions of the reactions (R1)–(R5).
The standard Gibbs energies of the reactions (R1) and (R2) are related to the Gibbs energies of the compounds by Equations (13) and (14):
Subtracting term-by-term, the left and right parts of Equations (13) and (14) can be written as follows:
In an analogous way, the equations to calculate the formation enthalpy and entropy of the In2Te5 compound can be expressed:
The corresponding reactions to determine standard thermodynamic properties , , and of the Ag3In97Te147, AgIn5Te8, AgIn3Te5, and AgInTe2 compounds can be written in a similar way using reactions (R2)–(R5) with their appropriate stoichiometric numbers.
For the first time, the standard thermodynamic quantities for selected compounds of the Ag–In–Te system were calculated using Equations (15)–(17) and the thermodynamic data of the pure substances Ag, In, Te, and In2Te3 [48]. A comparative list of the determined quantities and the literature data is included in Table 4.
Table 4.
The standard thermodynamic quantities of elements and compounds in the Ag–In–Te system.
The temperature-reliant formations of the Gibbs energies of the selected compounds of the Ag–In–Te system are described by Equations (18)–(22):
The agreement between the enthalpy of the formation of In2Te5 determined in the present study and those reported in [49,50] confirms the correctness of the division of the concentration space of the Ag–In–Te system in the part AgInTe2–Te–In2Te3 and validates the accuracy of the determined thermodynamic values of the ternary compounds.
4. Conclusions
The following thermodynamically stable compounds of the AgInTe2–Te–In2Te3 phase region were proven to exist below 500 K by means of the modified EMF method: In2Te5, Ag3In97Te147, AgIn5Te8, AgIn3Te5, and AgInTe2. It has been shown that the literature data on the phase equilibrium of AgInTe2 and AgIn5Te8 compounds of the Ag2Te–In2Te3 system below 500 K are unreliable for kinetic reasons. The equilibrium state of the phases in the AgInTe2–AgIn5Te8 section was achieved by the reaction AgInTe2 + AgIn5Te8 = 2AgIn3Te5, carried out with the participation of the Ag+ catalyst, as a small center for the nucleation of the AgIn3Te5 equilibrium phase. The Gibbs energy equations as a function of temperature, as well as the standard thermodynamic quantities of the binary and ternary compounds, were determined for the first time. From the thermodynamic perspective, the effective use of the temperature gradient for thermoelectric generation can be realized by using numerous pairs of the p/n components made in the form of contact of the following compounds: AgInTe2/AgIn3Te5, AgIn3Te5/AgIn5Te8, and AgIn5Te8/Ag3In97Te147.
Author Contributions
Conceptualization, M.M., F.T., P.D. and O.R.; methodology, M.M., F.T., D.L. and O.R.; investigation, M.M. and P.D.; data curation, M.M., P.D. and O.M.; writing—original draft, M.M., F.T., P.D., E.M., O.M., M.P., S.P. and O.R.; writing—review and editing, M.M., F.T., P.D., E.M., O.M., M.P., S.P., D.L., O.R. and L.H.; formal analysis, M.M., P.D., O.M., M.P. and S.P.; funding acquisition, F.T., P.D., D.L., L.H. and O.R.; resources, E.M. and L.H.; validation, E.M., D.L. and L.H. All authors have read and agreed to the published version of the manuscript.
Funding
This research was supported by the national projects of the Ministry of Education and Science of Ukraine: “Scientific and experimental basis for the production of composite oxide, chalcogenide materials with extended service life” (No. 0121U109620) and “Synthesis, physicochemical and thermodynamic properties of nanosized and nanostructured materials for electrochemical systems” (No. 0120U102184). This work was partly funded by Svenska kulturfonden (Swedish Cultural Foundation in Finland) under the project “Innovative e-waste recycling processes for greener and more efficient recoveries of critical metals and energy” at Åbo Akademi University.
Data Availability Statement
All the data is included within the article.
Conflicts of Interest
The authors declare that they have no conflict of interest.
References
- Liu, H.-T.; Sun, Q.; Zhong, Y.; Deng, Q.; Gan, L.; Lv, F.-L.; Shi, X.-L.; Chen, Z.-G.; Ang, R. High-performance in n-type PbTe-based thermoelectric materials achieved by synergistically dynamic doping and energy filtering. Nano Energy 2022, 91, 106706. [Google Scholar] [CrossRef]
- Zazakowny, K.; Kosonowski, A.; Lis, A.; Cherniushok, O.; Parashchuk, T.; Tobola, J.; Wojciechowski, K.T. Phase Analysis and Thermoelectric Properties of Cu-Rich Tetrahedrite Prepared by Solvothermal Synthesis. Materials 2022, 15, 849. [Google Scholar] [CrossRef] [PubMed]
- Zhang, X.; Chen, Z.; Lin, S.; Zhou, B.; Gao, B.; Pei, Y. Promising Thermoelectric Ag5−δTe3 with Intrinsic Low Lattice Thermal Conductivity. ACS Energy Lett. 2017, 2, 2470–2477. [Google Scholar] [CrossRef]
- Cherniushok, O.; Cardoso-Gil, R.; Parashchuk, T.; Grin, Y.; Wojciechowski, K.T. Phase Equilibria and Thermoelectric Properties in the Pb–Ga–Te System in the Vicinity of the PbGa6Te10 Phase. Inorg. Chem. 2021, 60, 2771–2782. [Google Scholar] [CrossRef] [PubMed]
- Irshad, K.; Islam, N.; Zahir, H.; Pasha, A.A.; AbdelGawad, A.F. Thermal performance investigation of Therminol55/MWCNT+CuO nanofluid flow in a heat exchanger from an exergy and entropy approach. Case Stud. Therm. Eng. 2022, 34, 102010. [Google Scholar] [CrossRef]
- Cherniushok, O.; Parashchuk, T.; Tobola, J.; Luu, S.D.N.; Pogodin, A.; Kokhan, O.; Studenyak, I.; Barchiy, I.; Piasecki, M.; Wojciechowski, K.T. Entropy-Induced Multivalley Band Structures Improve Thermoelectric Performance in p-Cu7P(SxSe1–x)6 Argyrodites. ACS Appl. Mater. Interfaces 2021, 13, 39606–39620. [Google Scholar] [CrossRef]
- Tesfaye, F.; Iloeje, C.O. Thermodynamic Considerations for Improved Renewable Energy Production. JOM 2021, 73, 1484–1486. [Google Scholar] [CrossRef]
- Ravi, V.; Firdosy, S.; Caillat, T.; Brandon, E.; Van Der Walde, K.; Maricic, L.; Sayir, A. Thermal Expansion Studies of Selected High-Temperature Thermoelectric Materials. J. Electron. Mater. 2009, 38, 1433–1442. [Google Scholar] [CrossRef]
- Verma, A. Bond-stretching force constant of AIBIIIC2V I and AIIBIVC2V chalcopyrite semiconductors. Solid State Commun. 2009, 149, 1236–1239. [Google Scholar] [CrossRef]
- Skomedal, G.; Holmgren, L.; Middleton, H.; Eremin, I.; Isachenko, G.; Jaegle, M.; Tarantik, K.; Vlachos, N.; Manoli, M.; Kyratsi, T.; et al. Design, assembly and characterization of silicide-based thermoelectric modules. Energy Convers. Manag. 2016, 110, 13–21. [Google Scholar] [CrossRef]
- Mouacher, R.; Seddik, T.; Rezini, B.; Haq, B.U.; Batouche, M.; Uğur, G.; Uğur, S.; Belfedal, A. First-principles calculations of electronic and optical properties of AgGa1-xTlxS2 alloys: Analyses and design for solar cell applications. J. Solid State Chem. 2022, 309, 122996. [Google Scholar] [CrossRef]
- Ando Junior, O.H.; Maran, A.L.O.; Henao, N.C. A review of the development and applications of thermoelectric microgenerators for energy harvesting. Renew. Sustain. Energy Rev. 2018, 91, 376–393. [Google Scholar] [CrossRef]
- Zaferani, S.H.; Jafarian, M.; Vashaee, D.; Ghomashchi, R. Thermal Management Systems and Waste Heat Recycling by Thermoelectric Generators—An Overview. Energies 2021, 14, 5646. [Google Scholar] [CrossRef]
- Ochieng, A.O.; Megahed, T.F.; Ookawara, S.; Hassan, H. Comprehensive review in waste heat recovery in different thermal energy-consuming processes using thermoelectric generators for electrical power generation. Process Saf. Environ. Prot. 2022, 162, 134–154. [Google Scholar] [CrossRef]
- Bakthavatchalam, B.; Habib, K.; Saidur, R.; Saha, B.B.; Irshad, K. Comprehensive study on nanofluid and ionanofluid for heat transfer enhancement: A review on current and future perspective. J. Mol. Liq. 2020, 305, 112787. [Google Scholar] [CrossRef]
- Zhang, Z.; Zhao, K.; Chen, H.; Ren, Q.; Yue, Z.; Wei, T.-R.; Qiu, P.; Chen, L.; Shi, X. Entropy engineering induced exceptional thermoelectric and mechanical performances in Cu2-Ag Te1-2S Se. Acta Mater. 2021, 224, 117512. [Google Scholar] [CrossRef]
- Fujii, Y.; Tanaka, K.; Kosuga, A. Relationship between electrical properties and electronic structure of the thermoelectric Ag–In–Te system with chalcopyrite structure and its related defect-containing structure. Scr. Mater. 2019, 162, 272–276. [Google Scholar] [CrossRef]
- Bahari, Z.; Rivet, J.; Dugué, J. Diagramme de phases du système Ag2Te-In2Te3. Comptes Rendus L’académie Des. Sci. Ser. IIC Chem. 1998, 1, 411–415. [Google Scholar] [CrossRef]
- Bahari, Z.; Rivet, J.; Legendre, B.; Dugué, J. Study of the Ag–In–Te ternary system: I. Description of the triangle Ag2Te–In2Te3–Te. J. Alloys Compd. 1999, 282, 164–174. [Google Scholar] [CrossRef]
- Bahari, Z.; Rivet, J.; Legendre, B.; Dugué, J. Study of the Ag–In–Te ternary system: II. Description of the quadrilateral Ag–Ag2Te–In2Te3–In. J. Alloys Compd. 1999, 289, 99–115. [Google Scholar] [CrossRef]
- Charoenphakdee, A.; Kurosaki, K.; Muta, H.; Uno, M.; Yamanaka, S. Thermal Conductivity of the Ternary Compounds: AgMTe2 and AgM5Te8 (M = Ga or In). Mater. Trans. 2009, 50, 1603–1606. [Google Scholar] [CrossRef]
- Rangasami, C.; Malar, P.; Osipowicz, T.; Jain, M.K.; Kasiviswanathan, S. Structure of melt-quenched AgIn3Te5. Powder Diffr. 2011, 26, 248–255. [Google Scholar] [CrossRef]
- Rangasami, C. Vibrational modes of AgIn3Te5 and effect of laser irradiation. Vib. Spectrosc. 2018, 94, 66–73. [Google Scholar] [CrossRef]
- Moroz, M.; Tesfaye, F.; Demchenko, P.; Prokhorenko, M.; Kogut, Y.; Pereviznyk, O.; Prokhorenko, S.; Reshetnyak, O. Solid-state electrochemical synthesis and thermodynamic properties of selected compounds in the Ag–Fe–Pb–Se system. Solid State Sci. 2020, 107, 106344. [Google Scholar] [CrossRef]
- Moroz, M.; Tesfaye, F.; Demchenko, P.; Prokhorenko, M.; Prokhorenko, S.; Reshetnyak, O. Non-activation synthesis and thermodynamic properties of ternary compounds of the Ag–Te–Br system. Thermochim. Acta 2021, 698, 178862. [Google Scholar] [CrossRef]
- Moroz, M.; Tesfaye, F.; Demchenko, P.; Prokhorenko, M.; Yarema, N.; Lindberg, D.; Reshetnyak, O.; Hupa, L. The Equilibrium Phase Formation and Thermodynamic Properties of Functional Tellurides in the Ag–Fe–Ge–Te System. Energies 2021, 14, 1314. [Google Scholar] [CrossRef]
- Moroz, M.; Tesfaye, F.; Demchenko, P.; Prokhorenko, M.; Prokhorenko, S.; Lindberg, D.; Reshetnyak, O.; Hupa, L. Synthesis and Thermodynamic Investigation of Energy Materials in the Ag-Te-Cl System by the Solid-State Galvanic Cells. JOM 2021, 73, 1487–1494. [Google Scholar] [CrossRef]
- Diffractometer Stoe WinXPOW, version 3.03; Stoe & Cie Gmb: Darmstadt, Germany, 2010.
- Kraus, W.; Nolze, G. POWDER CELL—A program for the representation and manipulation of crystal structures and calculation of the resulting X-ray powder patterns. J. Appl. Crystallogr. 1996, 29, 301–303. [Google Scholar] [CrossRef]
- Rodriguez-Carvajal, J. Recent Developments of the Program FULLPROF, in Commission on Powder Diffraction (IUCr). Newsletter 2001, 26, 12–19. [Google Scholar]
- Rajan, H.; Uchida, H.; Bryan, D.L.; Swaminathan, R.; Downs, R.T.; Hall-Wallace, M. The American mineralogist crystal structure database. Am. Miner. 2003, 88, 247–250. [Google Scholar]
- Villars, P.; Cenzual, K. (Eds.) Pearson’s Crystal Data: Crystal Structure Database for Inorganic Compounds, Release 2014/15; ASM International: Materials Park, OH, USA, 2014. [Google Scholar]
- Moroz, M.V.; Prokhorenko, M. Determination of thermodynamic properties of Ag3SBr superionic phase using EMF technique. Russ. J. Electrochem. 2015, 51, 886–889. [Google Scholar] [CrossRef]
- Prokhorenko, M.; Moroz, M.V.; Demchenko, P.Y. Measuring the thermodynamic properties of saturated solid solutions in the Ag2Te-Bi-Bi2Te3 system by the electromotive force method. Russ. J. Phys. Chem. A 2015, 89, 1330–1334. [Google Scholar] [CrossRef]
- Moroz, M.V.; Demchenko, P.Y.; Prokhorenko, M.V.; Reshetnyak, O.V. Thermodynamic Properties of Saturated Solid Solutions of the Phases Ag2PbGeS4, Ag0.5Pb1.75GeS4 and Ag6.72Pb0.16Ge0.84S5.20 of the Ag-Pb-Ge-S System Determined by EMF Method. J. Phase Equilib. Diffus. 2017, 38, 426–433. [Google Scholar] [CrossRef]
- Tesfaye, F.; Taskinen, P. Electrochemical study of the thermodynamic properties of matildite (β-AgBiS2) in different temperature and compositional ranges. J. Solid State Electrochem. 2014, 18, 1683–1694. [Google Scholar] [CrossRef]
- Moroz, M.; Tesfaye, F.; Demchenko, P.; Prokhorenko, M.; Lindberg, D.; Reshetnyak, O.; Hupa, L. Phase Equilibria and Thermodynamics of Selected Compounds in the Ag–Fe–Sn–S System. J. Electron. Mater. 2018, 47, 5433–5442. [Google Scholar] [CrossRef]
- Osadchii, E.G.; Rappo, O.A. Determination of standard thermodynamic properties of sulfides in the Ag-Au-S system by means of a solid-state galvanic cell. Am. Miner. 2004, 89, 1405–1410. [Google Scholar] [CrossRef]
- Hasanova, G.S.; Aghazade, A.I.; Imamaliyeva, S.Z.; Yusibov, Y.A.; Babanly, M.B. Refinement of the Phase Diagram of the Bi-Te System and the Thermodynamic Properties of Lower Bismuth Tellurides. JOM 2021, 73, 1511–1521. [Google Scholar] [CrossRef]
- Hasanova, G.S.; Aghazade, A.I.; Babanly, D.M.; Imamaliyeva, S.Z.; Yusibov, Y.A.; Babanly, M.B. Experimental study of the phase relations and thermodynamic properties of Bi-Se system. J. Therm. Anal. 2021, 147, 6403–6414. [Google Scholar] [CrossRef]
- Babanly, M.; Yusibov, Y.; Babanly, N. The EMF Method with Solid-State Electrolyte in the Thermodynamic Investigation of Ternary Copper and Silver Chalcogenides. In Electromotive Force and Measurement in Several Systems; Kara, S., Ed.; InTech: Houston, TX, USA, 2011; pp. 57–78. ISBN 978-953-307-728-4. [Google Scholar]
- Vassiliev, V.; Lysenko, V.; Bros, J. Thermodynamic study of the Ag-In-Sn system by the EMF method. J. Alloys Compd. 2019, 790, 370–376. [Google Scholar] [CrossRef]
- Babanly, N.; Orujlu, E.; Imamaliyeva, S.; Yusibov, Y. Thermodynamic investigation of silver-thallium tellurides by EMF method with solid electrolyte Ag4RbI5. J. Chem. Thermodyn. 2018, 128, 78–86. [Google Scholar] [CrossRef]
- Imamaliyeva, S.Z.; Musayeva, S.S.; Babanly, D.M.; Jafarov, Y.I.; Taghiyev, D.B.; Babanly, M.B. Determination of the thermodynamic functions of bismuth chalcoiodides by EMF method with morpholinium formate as electrolyte. Thermochim. Acta 2019, 679, 178319. [Google Scholar] [CrossRef]
- Gravetter, F.J.; Wallnau, L.B. Statistics for the Behavioral Sciences, 10th ed.; Cengage Learning: Boston, MA, USA, 2017; ISBN 978-1-305-50491-2. [Google Scholar]
- Voronin, M.V.; Osadchii, E.G. Thermodynamic Properties of Silver and Bismuth Sulfosalt Minerals, Pavonite (AgBi3S5) and Matildite (AgBiS2) and Implications for Ore Deposits. Econ. Geol. 2013, 108, 1203–1210. [Google Scholar] [CrossRef]
- Voronin, M.V.; Osadchii, E.G.; Brichkina, E.A. Thermochemical properties of silver tellurides including empressite (AgTe) and phase diagrams for Ag–Te and Ag–Te–O. Phys. Chem. Miner. 2017, 44, 639–653. [Google Scholar] [CrossRef]
- Barin, I. Thermochemical Data of Pure Substance; VCH: Weinheim, Germany, 1995. [Google Scholar]
- Mills, K.C. Thermodynamic Data for Inorganic Sulphides, Selenides, Tellurides; Butterworths: London, UK, 1974. [Google Scholar]
- Zlomanov, V.P.; Sheiman, M.S.; Legendre, B. Phase diagram and thermodynamic properties of phases in the In-Te system. J. Phase Equilibria Diffus. 2001, 22, 339–344. [Google Scholar] [CrossRef]


Publisher’s Note: MDPI stays neutral with regard to jurisdictional claims in published maps and institutional affiliations. |
© 2022 by the authors. Licensee MDPI, Basel, Switzerland. This article is an open access article distributed under the terms and conditions of the Creative Commons Attribution (CC BY) license (https://creativecommons.org/licenses/by/4.0/).