Article

Thermo-Economic Performance Analysis of a Novel Organic Flash Rankine Cycle Using R600/R245fa Mixtures

1
School of Architecture and Urban Planning, Yunnan University, Kunming 650504, China
2
Faculty of Metallurgical and Mining, Kunming Metallurgy College, Kunming 650033, China
3
School of Mechanical Engineering, Beijing Institute of Technology, Beijing 100081, China
4
College of Civil Engineering and Architecture, Jiaxing University, Jiaxing 314001, China
*
Authors to whom correspondence should be addressed.
These authors contributed equally to this work.
Energies 2022, 15(21), 8055; https://doi.org/10.3390/en15218055
Submission received: 18 September 2022 / Revised: 11 October 2022 / Accepted: 24 October 2022 / Published: 29 October 2022
(This article belongs to the Special Issue Recent Advances in Organic Rankine Cycle)

Abstract

:
The organic flash cycle (OFC) is a novel power cycle with small exergy loss in the endothermic process. However, the low-pressure throttle valve in the cycle has a large throttling loss. Aiming to reduce the cycle exergy loss and improve the system performance, this study constructs a new configuration named the organic flash Rankine cycle (OFRC). Using the R600/R245fa mixture as the circulating working fluid and 200 °C geothermal water as the heat source, the effects of the change in working fluid composition on the thermal properties of the OFRC were studied based on the first and second laws of thermodynamics. Then, the economic performance of the proposed OFRC was investigated and then compared with that of the conventional OFC. The results show that the OFRC system has a significant improvement in thermal performance and economy compared with the OFC system. When the mole composition of the R600/R245fa mixture is 0.5/0.5, the net output work, thermal efficiency, and exergy efficiency of the OFRC system can reach a maximum at 146.39 kW, 21.51%, and 80.94%, respectively, which are 98.2 kW, 14.43%, and 54.3% higher than those of the OFC system. The dual heaters in the OFRC system can effectively reduce loss in the endothermic process. When the R600 mole composition is 0.5 in the OFRC system, the exergy loss of the heater is only 7.42%, and the power generation cost (0.3267 $·kW−1·h−1 only) is lower than that in the OFC system.

1. Introduction

Energy is an important material basis for human survival and development, and it plays an important role in ensuring and promoting economic growth and social development. However, the extensive use of fossil energy has led to increasingly serious problems, such as environmental pollution and energy shortages [1,2]. Under the background of “dual carbon” the development of efficient utilization technologies for renewable energy is one of the effective ways of ensuring sustainable development [3]. Medium- and low-temperature thermal energy is a typical renewable energy, and its utilization is mainly realized using the thermodynamic cycle [4,5,6].
The organic flash cycle (OFC) has attracted much attention owing to its broad application prospects in the utilization of low-grade energy, such as solar energy and geothermal energy [7,8]. The circulating working fluid of the OFC system adopts low-boiling organic substances. This working fluid does not undergo a phase change during the heat absorption process of the evaporator, and the cycle matches well with the heat source. In addition, it offers the advantages of simple structure, high operation reliability, and a wide heat source temperature range [9,10]. Ho et al. [11] used ten different aromatic hydrocarbons and siloxanes as working fluids to study the utilization efficiency of medium- and low-temperature thermal energy in the OFC system. They found that aromatic hydrocarbon-based OFC systems are more efficient than siloxane-based OFC systems for the use of medium- and low-temperature heat. Varma et al. [12] compared the thermal performance of OFC and ORC by using R214 as the circulating working medium and found that the OFC could effectively utilize medium- and low-temperature heat energy. When the heat source temperature range was between 124 °C and 160 °C, the power and exergy efficiency of the OFC system were higher than those of the ORC system. Liu et al. [13] used nine kinds of working fluids as the circulating working fluid to determine the thermodynamic characteristics of the OFC system driven by low-grade thermal energy. The evaporation temperature optimized the thermodynamic performance of the circulation system, and the increase in flash evaporation temperature improved the thermal efficiency and second-law efficiency of the circulation system. R601, whose critical temperature was the largest in their study, was optimally used as a circulating working fluid in the OFC system. In summary, the OFC system can effectively utilize medium- and low-temperature thermal energy.
At present, most studies about OFC systems are based on pure working fluid, but the isothermal phase transition characteristics of pure working fluid are difficult to match with the temperature of the cold source during the condensation process, resulting in the poor performance of circulating systems [14,15,16]. Compared with the isothermal phase transition of the pure working fluid, the temperature-changing phase transition characteristics of the non-azeotropic working fluid are easier to match with the temperature of the cooling source in the condensation process, consequently reducing the heat transfer loss of the cycle and improving the cycle performance [17,18]. Heberle et al. [19] used the mixed R227ea/R245fa working fluid as the circulating working fluid and analyzed the utilization rate of the low-enthalpy geothermal source in the ORC system. Given the same working conditions for the mixed R227ea/R245fa working fluid and the corresponding pure working fluid, the exergy efficiency of the system with R227ea/R245fa was higher than that with pure working fluid (i.e., an increase of 27.7%). Mondal and De [10] selected the R245fa/R600 mixture as the circulating working medium to investigate the influence of mole components on cycling performance. They found that the output power of the OFC system with the R245fa/R600 mixture could be significantly increased, subsequently reducing the total cost. When the mole component ratio of the OFC system with the R245fa/R600 mixture was (0.4/0.6), the output power was the highest; by contrast, when the corresponding mole component ratio was (0.37/0.63), the total cost was the lowest. Ge et al. [20] studied a two-stage ORC system using mixed working fluids with non-azeotropic working fluids (cyclopentane/cyclohexane and benzene/toluene) in the high-temperature cycle range and non-azeotropic working fluid (R600/R601a) in the low-temperature cycle range. According to their results, the exergy loss of the mixed working fluid was smaller, and the net output power was higher. Furthermore, the thermal efficiency of the multi-stage ORC was higher than that of the single-stage ORC. In summary, mixed working fluids can effectively improve system performance.
When the thermodynamic cycle structure of the OFC system changes, the thermodynamic process of the cycle system and the parameters of the operating state point are also altered [21,22,23]. Kim et al. [24] investigated a modified OFC system (OFCM) using a two-phase expander and reheat technology and performed thermodynamic comparison and optimization analysis with the basic OFC. Six pure working fluids were selected to study the effects of flash temperature, heat source temperature, and working fluid on system performance. The OFCM was better than the OFC in terms of thermal efficiency and second-law efficiency. Huang et al. [25] studied the utilization of medium- and low-temperature thermal energy in an OFC system using an internal heat exchanger. When R227ea was used as the working fluid, the net output power of the OFC system based on the internal heat exchanger was 5.62% higher than that of the traditional OFC system. Therefore, optimizing the thermodynamic cycle structure of the OFC system is important in improving the thermodynamic performance of the system. The exergy loss of the low-pressure throttle valve in the OFC system is relatively large. Mondal et al. [26] used R600 as the circulating working fluid to study the exergy loss ratio of each component of the OFC, and they found that the low-pressure throttle valve accounted for 21.7% of the total cycle exergy loss. They also studied the effect of the mixed R245fa/R600 working fluid on the performance of the OFC system for the utilization of industrial waste heat. Their results showed that the irreversible loss of the low-pressure throttle valve accounted for 22%.
This study proposes a new cycle configuration in which the system does not require a low-pressure throttle valve, and the organic Rankine cycle is used in the condensation process. After the liquid flashing process, the separated liquid directly enters the working fluid pump for pressurization and then returns to heater I. Meanwhile, the separated gas enters the expander and starts to work, and the spent gas after operation is condensed and pressurized, and then enters heater II to form the organic flash Rankine cycle (OFRC). In addition, a non-azeotropic working fluid is introduced into the OFRC, and the effect of working fluid composition on cycle performance is determined. Therefore, by using Matlab2018b as the carrier, this study combines non-azeotropic working fluid and OFRC, establishes the ideal thermodynamic model of the system with non-azeotropic working fluid OFRC, and optimizes the parameters of each thermodynamic state point, with the net output power used as the objective function. The effects of the change in working fluid composition on the thermal performance and economic performance of the OFC and OFRC are also studied.

2. System Description

2.1. OFC System Description

Figure 1 and Figure 2 show the system diagram and T-S diagram of the OFC, respectively. In the figure: 2s is the isentropic state point of the outlet of the working fluid pump, 1–9, 5′, 8′ are the thermodynamic state points of each component, respectively. The thermal process is as follows: the working fluid enters the evaporator to absorb heat from the heat source (2–3), and throttles through the high-pressure throttle valve to flash pressure (3–4); enters the gas–liquid separator for gas–liquid separation (4–5,8). In the flash distillation solution, due to the change of the non-azeotropic working medium, the saturated gas component increases compared with the original component, and the saturated gas phase line changes from the original component saturation state point 5′ to 5. The saturated liquid phase is smaller than the original component, and the saturated liquidus changes from the state point of the original component 8′ to 8. The gas working medium flows from the upper part of the gas–liquid separator into the turbine to do work (5–6), while the liquid working medium enters the low-pressure throttle valve to throttle (8–9) and mixes with the exhaust gas discharged from the turbine in the mixer (6,9–7). The mixed working fluid enters the condenser to condense and dissipate heat (7–1) and returns to the evaporator by pressurizing the working fluid pump (1–2) to complete a cycle.

2.2. OFRC System Description

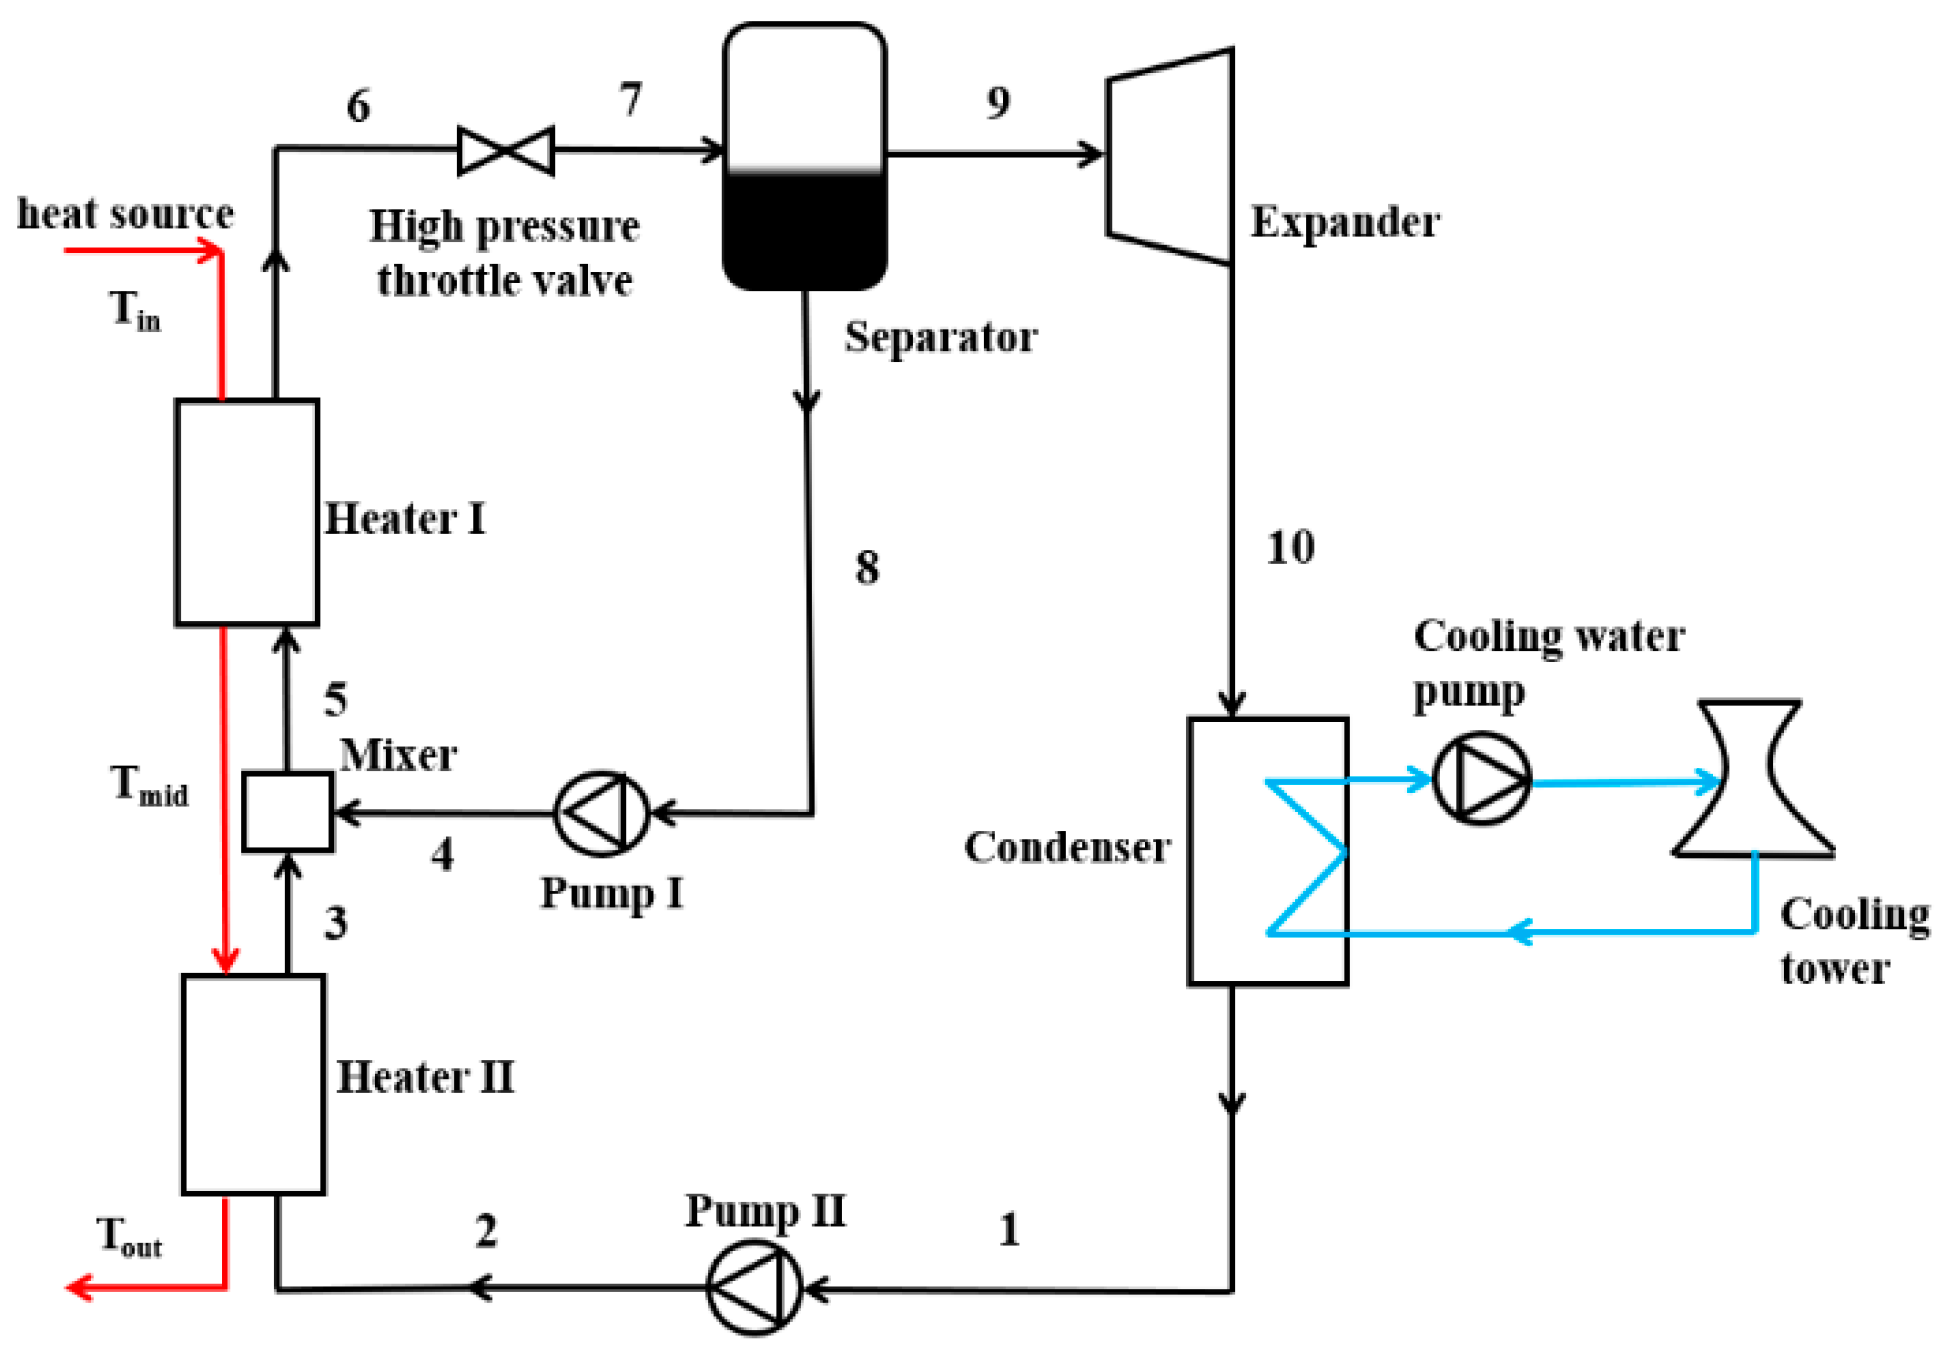
Figure 3 and Figure 4 show the system diagram and T-S diagram of the OFRC, respectively. The system components include heaters, high-pressure throttle valves, gas–liquid separators, working fluid pumps, expanders, condensers, and mixers. The thermodynamic process can be summarized as follows. The working fluid initially enters heater I to absorb heat from the heat source and heat it to a saturated liquid (5–6), and then it is throttled to the flash pressure (6–7) by the high-pressure throttle valve to form a gas–liquid two-phase state, finally entering the gas–liquid separator for liquid separation (7–8 and 9). At this time, the saturated gas composition is larger than the original composition, and the saturated gas phase line changes from the original composition saturation state point 9′ to 9; meanwhile, the saturated liquid is lower than the original composition, and the saturated liquid line changes from the original composition state point 8′ to 8. Subsequently, the gas-phase working medium enters the turbine and starts to work (9–10). The spent gas after the work enters the condenser to condense and release heat to a saturated liquid (10–1), and it is pressurized by working-fluid pump II prior to entering heater II (1–2–3). Finally, the liquid-phase working fluid enters working-fluid pump I for pressurization (8–4), and it mixes with the working fluid from heater II in the mixer (3 and 4–5) and enters heater I for heating to form a cycle.
In view of simplifying the analysis of OFRC, the following assumptions about the loop were considered:
(1)
The OFRC system is in steady operation.
(2)
Each component and each connecting pipeline do not encounter heat dissipation and pressure loss.
(3)
The isentropic efficiency of the working fluid pump and turbine is constant.
(4)
The pinch point temperature is different between the heater and condenser.
(5)
The geothermal fluid and cooling water in this paper are approximately pure water.

3. Working Fluid Selection

According to the relevant literature [27,28,29], the thermal and physical properties, safety, and environmental friendliness of non-azeotropic mass should be taken into account in working fluid selection. Given the high thermal stability and zero ozone depletion potential of R600 and R245fa, their mixture was selected as the circulating working fluid in this study. The main thermal properties and environmental parameters of the R600/R245fa mixture are shown in Table 1.

4. Mathematical Model

The mathematical models of OFC and OFRC systems have many similarities, and OFC systems are relatively common in related literature [30], so this paper focuses on the analysis of OFRC mathematical models.

4.1. Thermodynamic Analysis

The heat absorbed by the circulating working fluid from the heat source through heater I and heater II in the OFRC system is:
Q sys = m H ( h in h out )
The working fluid mass flow, gas phase mass flow, and liquid phase mass flow of the OFRC system are:
m f = m H ( h in h mid ) / ( h 6 h 5 )
m g = x m f
m l = ( 1 x ) m f
where x is the steam dryness of the system when the system is flashed and separated, and its calculation formula is:
x = h 7 h 8 h 9 h 8
In this study, the condensation stage of the OFRC system is divided into 20 subsections for optimization analysis, and the temperature difference of each subsection is calculated based on the law of energy conservation. The formula for calculating the mass flow of cooling water is:
m cool = m f ( h 10 h 1 ) h cool , out h cool , in
The constant specific heat capacity of cooling water is 4180 J/kg·K.
The power output of the expander is:
W T = m g ( h 9 h 10 )
The power consumption of the working fluid pump is:
W P = m l ( h 4 h 8 ) + m g ( h 2 h 1 )
The power consumption of the cooling water pump is:
W cool = m cool g H η cool , p
The net output work and thermal efficiency of the OFRC system are:
W net = W T W P W cool
η sys = W net / Q sys
This study used the second law of thermodynamics to reveal the loss of energy “grade” inside the system, allowing us to further analyze the thermodynamic performance of the system. The second law of thermodynamics is given by:
η ex = W net / E in
where Ein is the exergy input by the thermal fluid to the circulation system, and the subscript 0 indicates the value at an ambient temperature of 20 °C, its calculation formula is:
E in = m H [ ( h in h 0 ) T 0 ( s in s 0 ) ]
The exergy loss of heater I is:
E H 1 = m H [ ( h in h h 2 ) T 0 ( s in s h 2 ) ] m f [ ( h 6 h 5 ) T 0 ( s 6 s 5 ) ]
The exergy loss of heater II is:
E H 2 = m H [ ( h h 2 h out ) T 0 ( s h 2 s out ) ] m g [ ( h 3 h 2 ) T 0 ( s 3 s 2 ) ]
The heat rejection loss is:
E h , out = m H [ ( h out h 0 ) T 0 ( s out s 0 ) ]
The flash exergy loss is:
E flash = T 0 S gen _ flash
The exergy loss of the expander is:
E T = m g T 0 ( s 10 s 9 )
The exergy loss of the condenser is:
E c = m g [ ( h 10 h 1 ) T 0 ( s 10 s 1 ) ]
The exergy loss of the working fluid pump is:
E P = m l T 0 ( s 4 s 8 ) + m g T 0 ( s 2 s 1 )
The exergy loss of the mixer is:
E mix = T 0 S gen _ mix
The total exergy loss is:
E tot = E H 1 + E H 2 + E h , out + E flash + E T + E c + E P + E mix

4.2. Economic Analysis

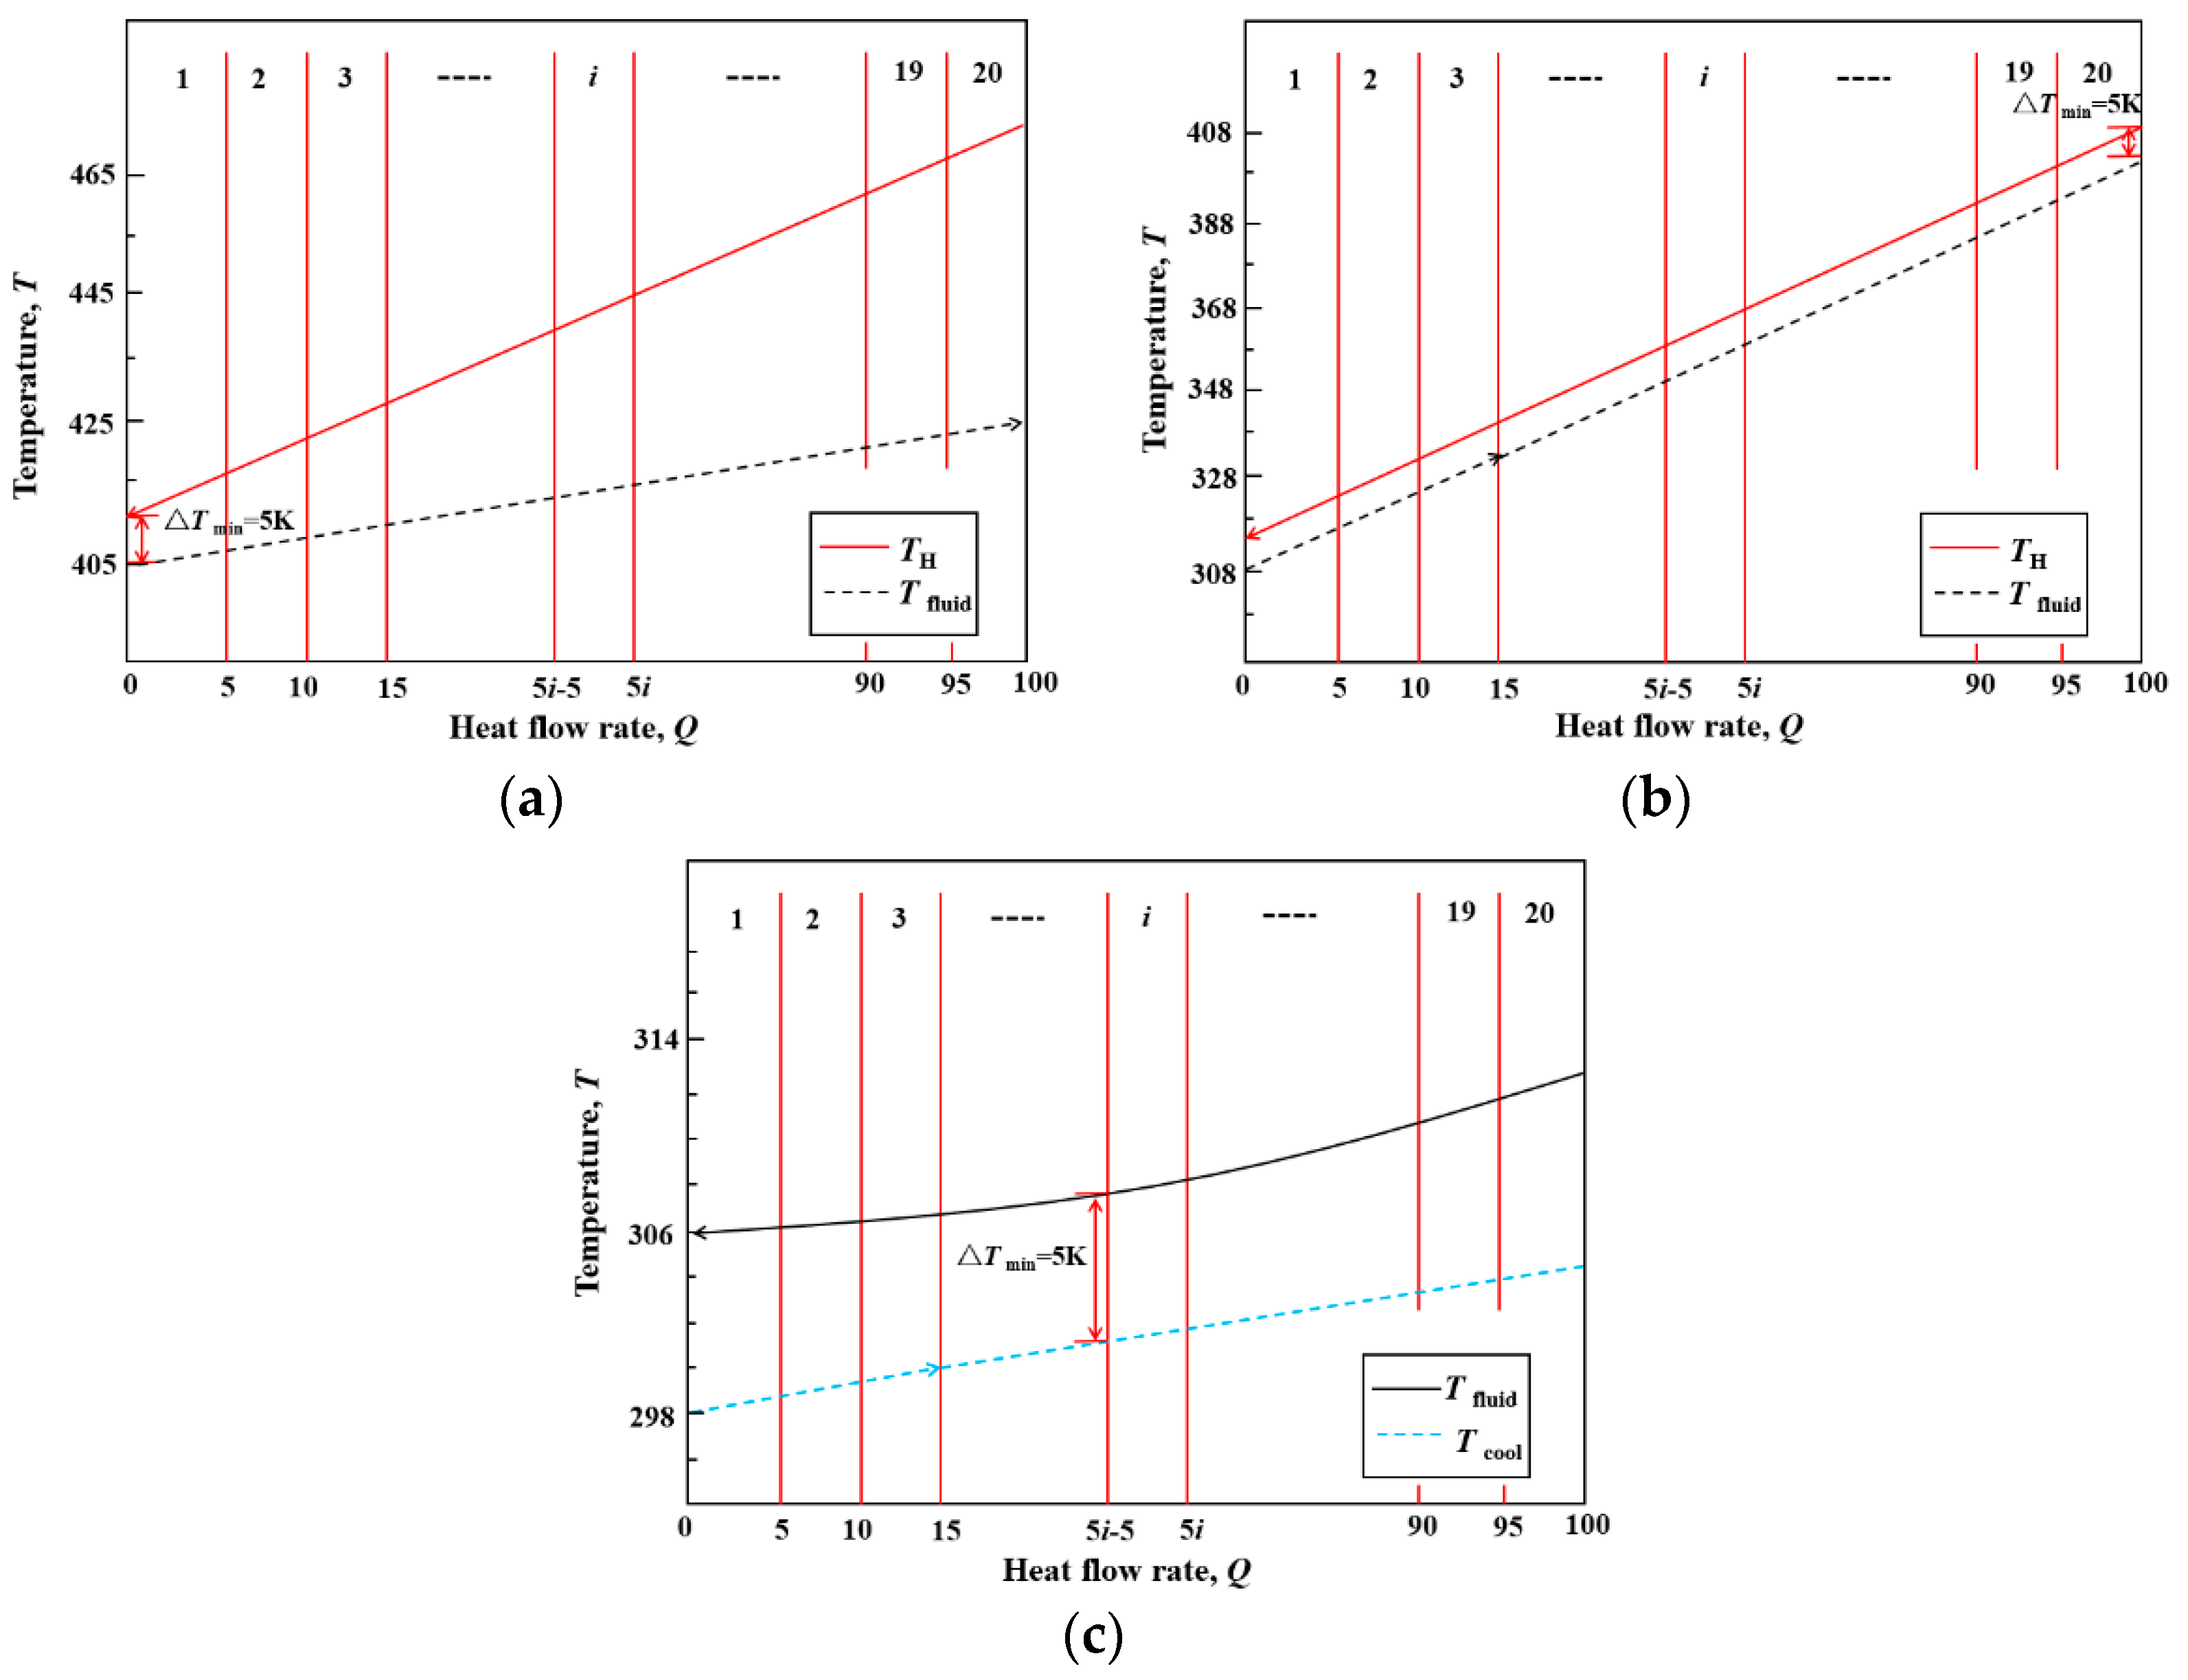
In this study, the type of heat exchanger used is a fixed tube and plate heat ex-changer with a carbon steel shell and copper inner tubes, a centrifugal pump for the working mass and an axial flow expander for the expander [31]. For each heat exchange process, the isothermal energy is divided into 20 subsections. As shown in Figure 5. The temperatures and thermodynamic properties of fluids were determined from the state of each section. The working fluid temperature and thermophysical parameters can be calculated and determined by each subsection. Then, the total heat exchange area A is obtained as follows:
A = i 20 A i = i 20 Q i U i Δ T m , i
where Ai is the heat exchange area of the i-th section; Qi is the heat-exchange amount of the i-th section; Ui is the total heat transfer coefficient of the i-th section; and △Tm,i is the logarithmic average temperature difference of the i-th section [30,32]:
1 U i = 1 α i d o d i + R i d o d i + R o + δ wall λ wall d o d m + 1 α o
where αi and αo are the convective heat transfer coefficients inside and outside the heat exchanger tube, respectively; di, do, and dm are the inner, outer, and average diameters of the heat exchanger, respectively; δwall is the thickness of the tube wall; Ri and Ro are the fouling resistance inside and outside the heat exchanger tube; and λwall is the thermal conductivity of the tube wall, which is 380 W·m−1·K−1.
Δ T m , i = Δ T max , i Δ T min , i ln ( Δ T max , i / Δ T min , i )
where △Tmax,i and △Tmin,i are the maximum and minimum heat exchange temperature differences of the ith section. The log-average temperature difference in section i, which is determined by the maximum and minimum temperature difference in section i, and the calculation results are used to calculate the heat transfer area in section i.
The base purchase cost of the heater, condenser, expander, and working fluid pump is:
P E C = 10 [ K 1 + K 2 log 10 Y + K 3 ( log 10 Y ) 2 ] F BM = 10 [ K 1 + K 2 log 10 Y + K 3 ( log 10 Y ) 2 ] ( B 1 + B 2 F M F P )
F p = 10 [ C 1 + C 2 log 10 ( 10 p 1 ) + C 3 ( log 10 ( 10 p 1 ) ) 2 ]
where Y is the heat transfer area of the heater and condenser, or the power of the expander and work pump, FM is the material factor, and other parameters are listed in Table 2.
The equipment purchase cost of the high-pressure throttle valve is:
P E C HPTV = 114.5 m f
Considering inflation, the purchased equipment cost (PEC) of component will be amended as
P E C 2021 = P E C 2001 C E P C I 2021 C E P C I 2001
where CEPCI2021 is 708, and CEPCI2001 is 397.
Considering other additional costs, the system investment cost is:
P E C sys = 1.18 P E C total
The annual cost of capital is calculated as:
A C C = 6.32 k P E C k [ i ( 1 + i ) n ( 1 + i ) n 1 ]
where i is the annual interest rate valued at 5%, and n is the lifespan valued at 20 years.
The annual operating and maintenance costs are calculated as:
A O C = 0.2 k P E C k
The power generation cost of the system is calculated as:
E G C = A C C + A O C W net τ OH
where τOH is the annual operating time and is taken as 7500 h.

5. Model Validation

After the system was modeled, as a means of ensuring accurate verification, the calculation results of the OFRC system obtained in this study were compared with those in the literature [22]. The boundary conditions and circulating working fluid were consistent between the two datasets. Boundary conditions include ambient temperature, pressure, hot fluid temperature, cold fluid temperature, pinch point temperature difference between heater and condenser, expander efficiency, working medium pump efficiency, etc. The circulating working medium uses pentane. The results are shown in Table 3. In this study, the maximum relative error of thermal efficiency is 1.19%, and the maximum relative error of exergy efficiency is 1.32%. As the values are within the allowable relative error range, the modeling approach used in this study is proven feasible.

6. Results and Discussion

The programming was conducted in Matlab2018b. The REFPROP9.0 [33] physical property database was used to control the pinch point temperature difference in the heat transfer process as a means of establishing the cycle configuration. Then, a thermodynamic and economic analysis of the cycle performance was conducted. The boundary conditions of the system model are shown in Table 4.
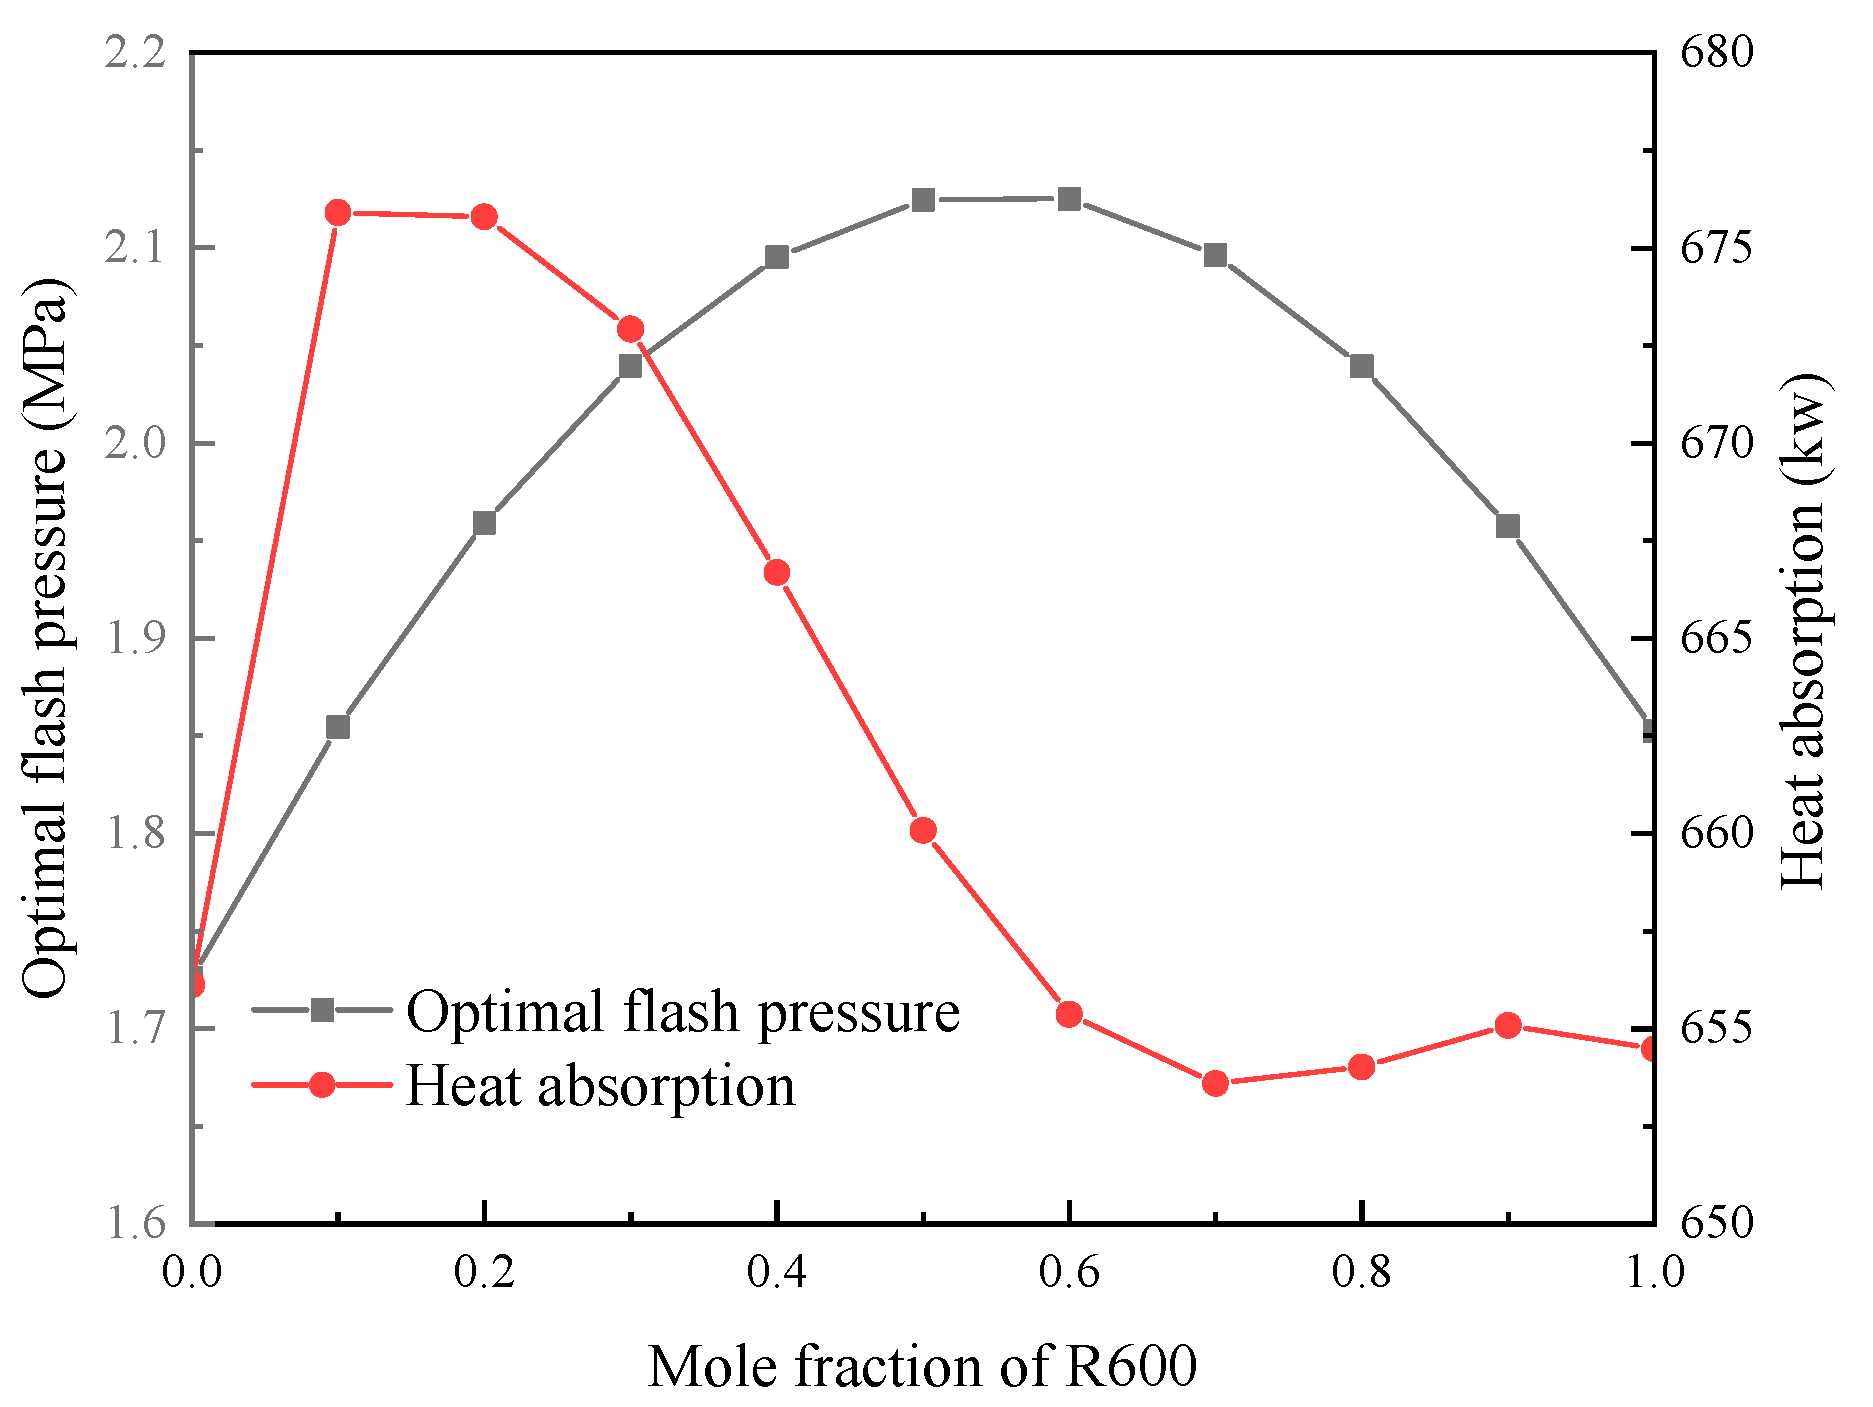
Figure 6 shows the optimal flash pressure of the OFRC system and its heat absorption as functions of the R600 mole composition under optimized operating conditions (optimizing with net output power as the objective function). The optimal flash pressure of the system initially increases and then decreases with the increase in R600 mole components. When the R600 mole component is 0.5, the maximum flash pressure of the system is 2.12 MPa. When the R600 mole component is gradually increased from 0.1 to 0.3, the optimal flash pressure increases greatly. When the R600 mole component exceeds 0.6, the optimal flash pressure gradually decreases. The decreasing amplitude increases gradually and finally decreases to 1.85 MPa. Moreover, as the R600 mole component is increased, the heat absorption of the OFRC system first increases and decreases and then increases and decreases again, depicting two peaks and a single valley. When the R600 mole composition is 0.1, the heat absorption of the system reaches the maximum value of 675.9 kW. When the R600 mole composition is 0.7, the heat absorption is reduced to the minimum at 653.6 kW. In this study, the heat source temperature is a fixed value, the specific enthalpy value of the heat source inlet is unchanged, and the heat absorption of the system is mainly affected by the specific enthalpy of the heat source outlet. The specific enthalpy of the heat source outlet of the OFRC system first decreases and increases and then decreases and increases again, from 1.96 × 10⁵ kJ/kg to 1.77 × 10⁵ kJ/kg, and then to 1.99 × 10⁵ kJ/kg, and then to 1.97 × 10⁵ kJ/kg. Finally, it was increased to 1.98 × 10⁵ kJ/kg, hence the changing trend of heat absorption in the figure.
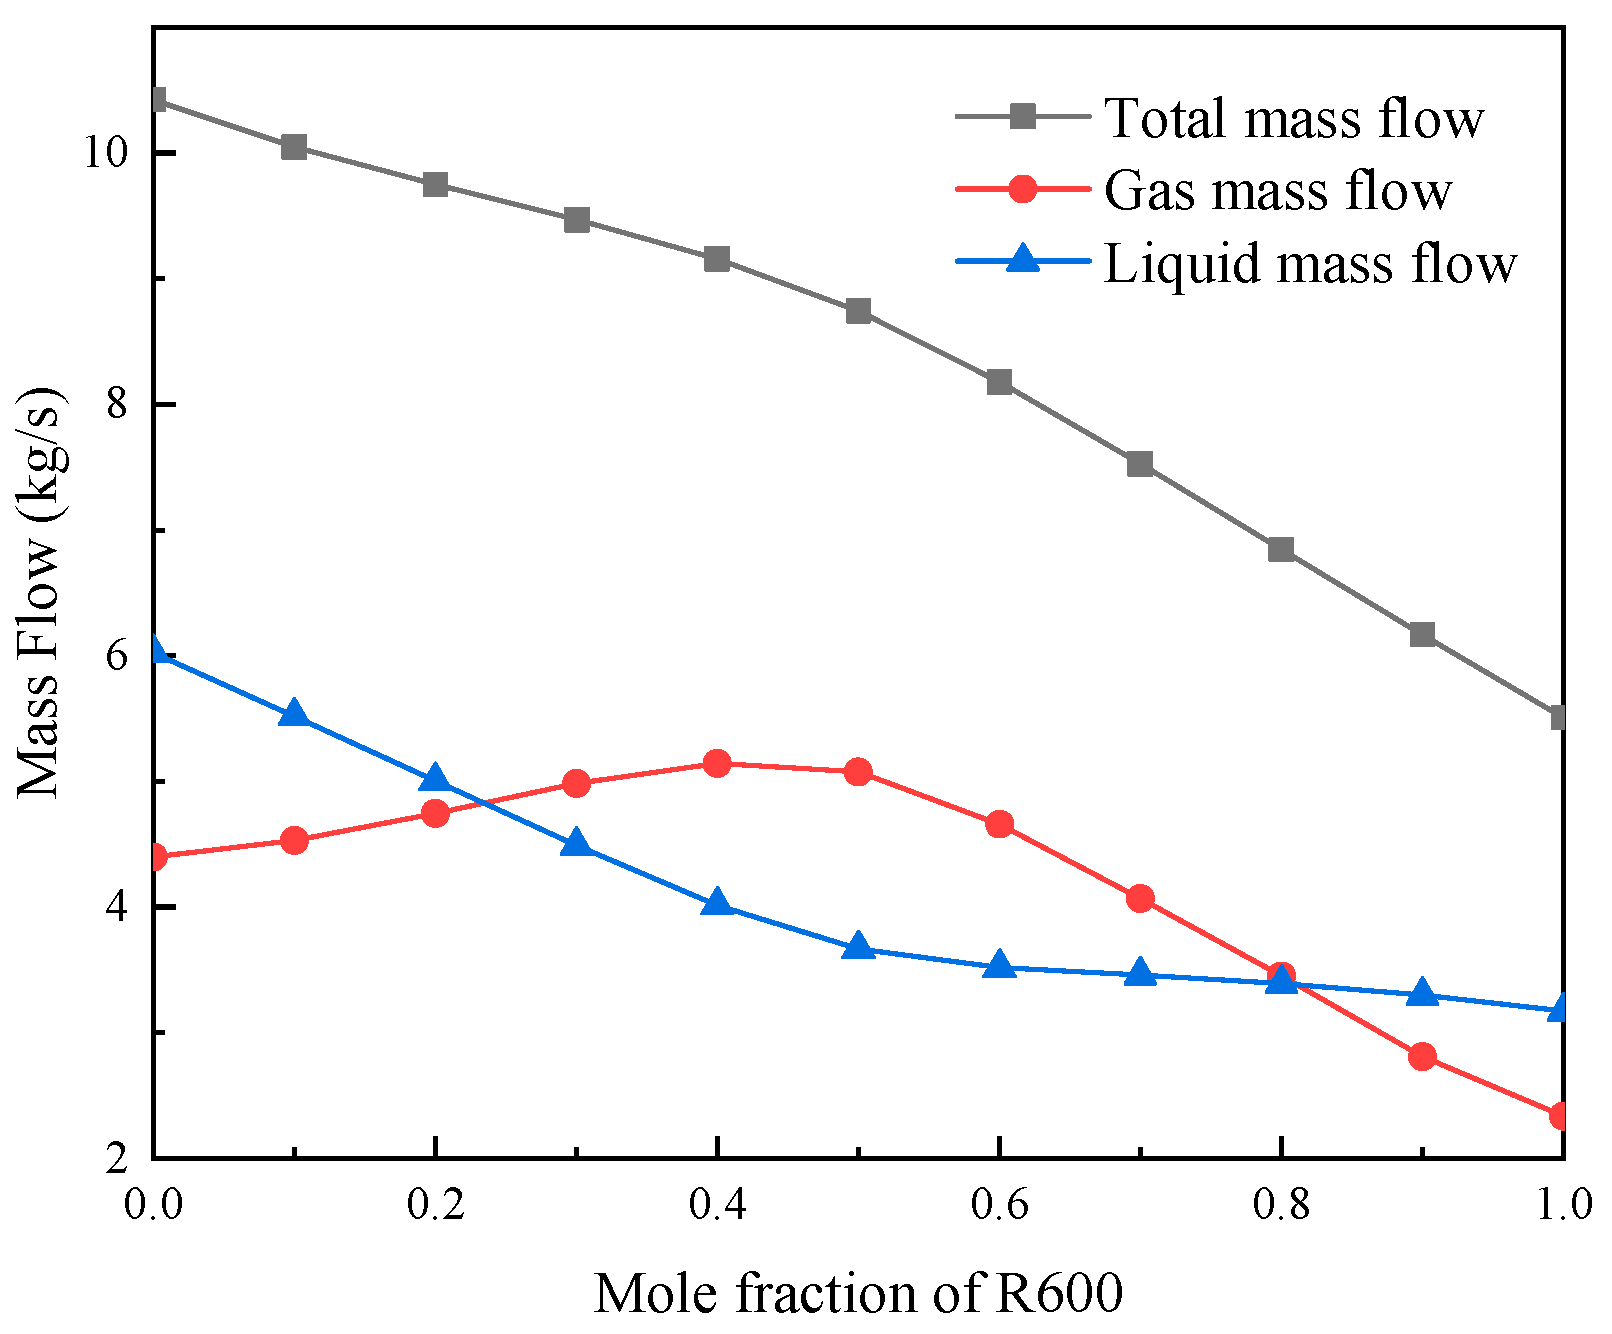
Figure 7 shows the varying trends of the total mass flow rate of the working medium, the gas phase mass flow rate, and the liquid phase mass flow rate of the OFRC system with the change in R600 mole components. The total mass flow of the working medium decreases with the increase in R600 mole components, which can be attributed to the specific enthalpy difference between the inlet and outlet of the heat source fluid and the specific enthalpy difference between the inlet and outlet of the heater. However, the specific enthalpy difference of the heat source fluid does not vary significantly when the R600 mole composition is changed. Thus, the change in the total mass flow of the working medium is mainly affected by the latter. Furthermore, the specific enthalpy difference of the working medium at the inlet and outlet of the heater gradually increases, causing the total working medium and the mass flow to be gradually reduced. When the R600 mole component is increased from 0 to 1, the mass flow rate of the OFRC system is reduced from 10.42 to 5.55 kg/s. With the increase in R600 mole components, the gas mass flow rate initially increases and then decreases. When the R600 mole composition increases from 0 to 0.4, the optimal flash pressure gradually increases, which causes the steam dryness in the OFRC system to gradually increase; subsequently, the gas phase mass flow also gradually increases from 4.39 to 5.14 kg/s. The liquid mass flow rate represents the difference between the total mass flow rate of the working medium and the gas phase mass flow rate. Therefore, with the increase in R600 mole components, the liquid phase mass flow rate shows a decreasing trend. When the R600 mole component increases from 0 to 0.4, the liquid phase mass flow rate decreases significantly from 6.02 to 4.01 kg/s. When the R600 mole component is 1, the liquid phase mass flow rate is reduced to the minimum at 3.17 kg/s.
The cycle net output power as a function of R600 mole composition under optimized operating conditions is shown in Figure 8. The net output power values of both OFC and OFRC systems first increase and then decrease with the increase in R600 mole composition, i.e., as the R600 mole composition increases, the exergy absorbed by the working fluid from the heat source in the heater first increases and then decreases. When the R600 mole composition is 0.5, the net output power of the OFRC system is the largest (146.39 kW); when the R600 mole composition is 0.4, the net output power of the OFC system is the largest (48.92 kW). Meanwhile, when the mole component of R600 is between 0.1 and 0.9, the net output power of the OFRC system using the mixed R600/R245fa working fluid is larger than the systems using the pure R600 or R245fa working fluid. When the R600 mole composition is 0.1 to 0.7, the net output power of the OFC system with mixed R600/R245fa working fluid is greater than the systems using pure R600 or R245fa working fluid. In the condenser, the variable temperature phase transformation characteristics of the mixed working medium can improve the temperature matching between the cycle and the cold source. Furthermore, the net output power of the OFRC system is always greater than that of the OFC system, which can be attributed to the OFRC system directly pressurizing the flashed saturated liquid by working-fluid pump I, and then returning to heater I through the mixer, which increases the temperature of the working fluid at the heater inlet and reduces the exergy of the heater. At the same time, the energy loss of saturated liquid entering the condenser is avoided. Furthermore, the OFRC does not have a low-pressure throttle valve.
Figure 9 shows the cycle thermal efficiency and exergy efficiency as functions of R600 mole composition under optimized operating conditions. The thermal efficiency of the system is affected by the net output power and heat absorption (i.e., the ratio of these two parameters). As previously presented in Figure 5, the net output power initially increases and then decreases with the increase in R600 mole components, and the net output power of the OFRC system is greater than that of the OFC system. As the OFRC system increases the temperature of the working fluid at the inlet of the evaporator, the specific enthalpy value of the heat source fluid outlet is also increased. Furthermore, the heat absorption of the OFRC system is smaller than that of the OFC system, and the thermal efficiency of the OFRC system is higher than that of the OFC system. When the R600 mole composition is 0.5, the thermal efficiency of the OFRC system can reach the maximum value of 21.51%. When the R600 mole composition is 0.4, the thermal efficiency of the OFC system can reach the maximum value of 7.12%.
Here, the exergy efficiency of the two-cycle system initially increases and then decreases with the increase in R600 mole components. The exergy efficiency of the OFRC system is greater than that of the OFC system. As exergy efficiency is mainly affected by the heat source input exergy and the net output power, the boundary conditions of the two-cycle system are the same, the heat source input exergy is equal, and the net output power of the OFRC system is greater than that of the OFC system; this exergy efficiency trend appears in the graph. When the R600 mole composition is 0.4, the exergy efficiency of the OFC system can reach the maximum value of 27.05%. When the R600 mole composition is 0.5, the exergy efficiency of the OFRC system can also reach the maximum value of 80.94%. At this time, the exergy efficiency difference between the two circulation systems is the largest at 54.3%.
Figure 10 shows the change in exergy loss ratio of each component of the OFRC system with the R600 mole component under the optimized operating conditions. The proportion of the condenser exergy loss is always the largest. With the increase in R600 mole components, the trend manifests as an initial decrease followed by an increase, and finally, another decrease. When the R600 mole component is 0.6, the condenser exergy loss proportion can reach the maximum value of 44.19%. The proportion of exergy loss in the expander is between 20% and 23.11%, and the proportion of exergy loss in the flash evaporation process is between 16.27% and 18.18%; both ranges show a trend of initial increase followed by a decrease with the increase in R600 mole components. The proportion of exothermic loss in the endothermic process shows a trend of an initial decrease followed by an increase with the increase in R600 mole composition. When the R600 mole composition is 0.5, the exergy loss ratio of the OFRC system is only 7.42%, which is much smaller than those of the conventional ORC system and the OFC system. This finding indicates that the characteristics of the non-azeotropic working fluid and the dual heaters can effectively reduce the exothermic loss in the endothermic process. Moreover, the exergy loss of the working fluid pump and mixer and the heat removal process accounts for a relatively small proportion (below 5%) and tends to be stable. The minimum proportion of exergy loss of the working fluid pump is 3.21%, the minimum proportion of exergy loss of the mixer is 1.97%, and the minimum proportion of exergy loss of the heat removal process is 2.12%.
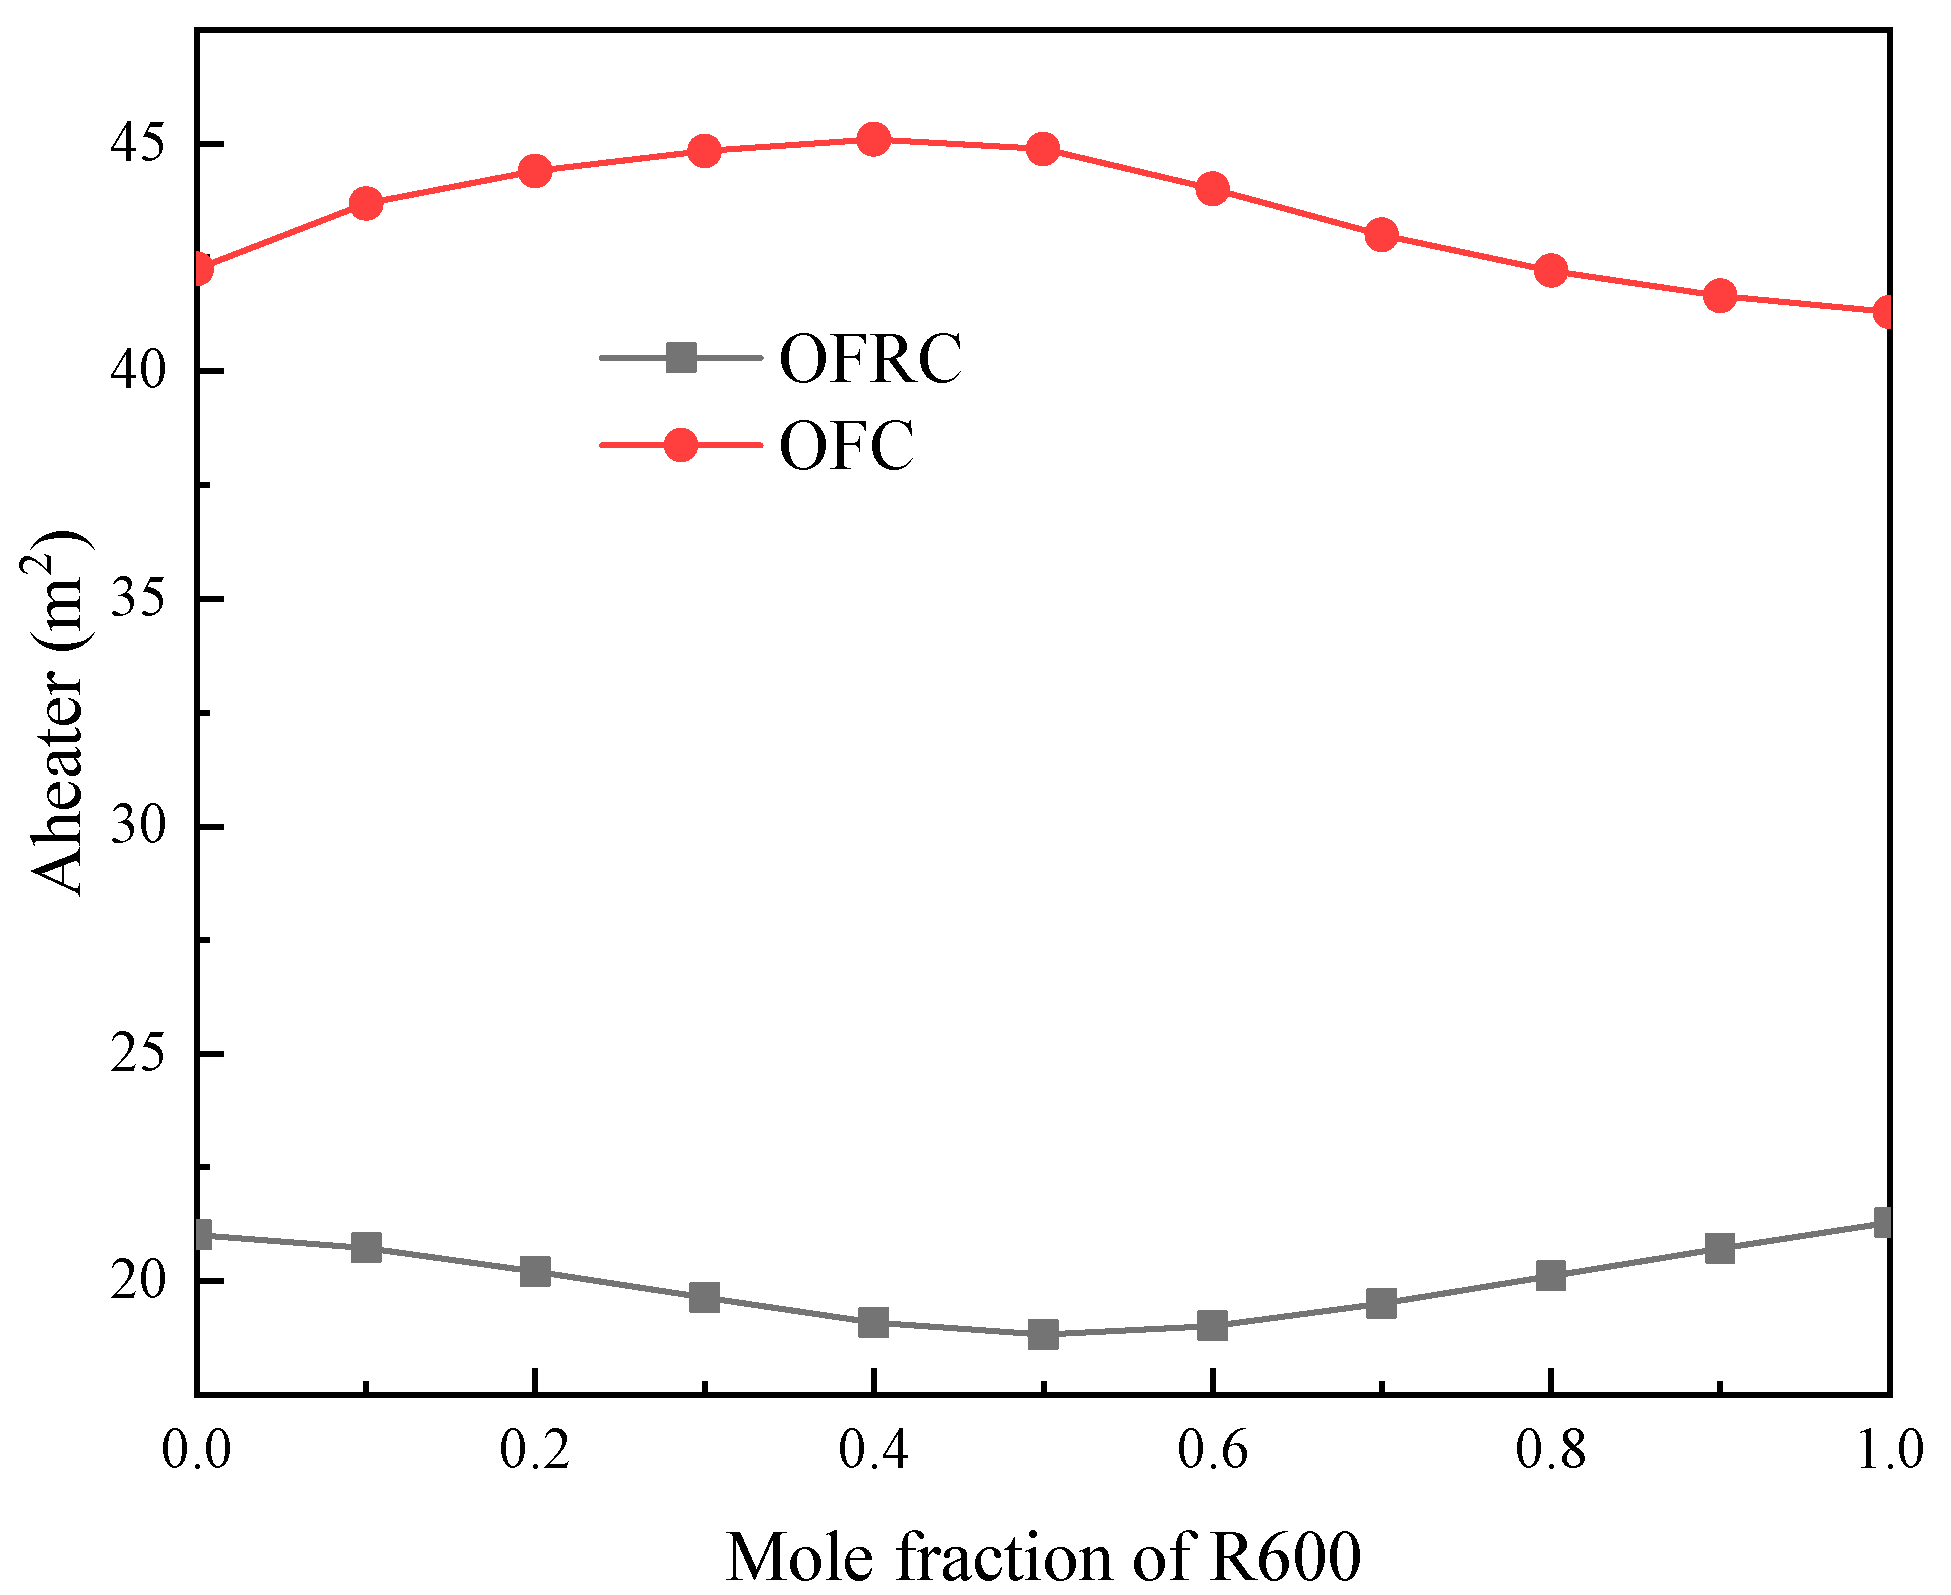
Figure 11 shows the change in the heat exchange area of the system heater with the R600 mole composition utilized under optimized operating conditions. With the increase in R600 mole components, the heater of the OFRC system showed a trend of initial decrease followed by an increase, whereas the heater of the OFC system showed an opposite trend. The trend for the OFRC system can be attributed to the change in thermophysical properties of the mixture in the heat transfer process, which causes the heat transfer coefficient of the mixture and the logarithmic average temperature difference of the system heater to initially increase and then decrease. The logarithmic average temperature difference and heat transfer coefficient of the OFC system heater decreases first and then increases with the increase of R600 molar component, and there is heat transfer resistance phenomenon in the heat transfer process of the mixture, so its heat transfer area increases first and then decreases. When the R600 mole composition is 0.5, the minimum heater of the OFRC system is 18.82 m2. When the R600 mole composition is 0.4, the maximum heater of the OFC system is 45.09 m2. The overall heater of the OFRC system is smaller than that of the OFC system. This finding can be attributed to the OFRC system increasing the temperature of the working fluid at the heater inlet, thereby reducing the heat absorbed by the system from the heat source. In addition, the heater of the OFRC system can reach the maximum value of 21.28 m2 with the pure R600. When R600/R245fa is 0.5/0.5, the heater of the OFRC system is reduced by 11.53% with respect to that with pure R600. The heater of the OFC system can reach the minimum value of 41.31 m2 compared with the pure R600. When the R600/R245fa is 0.4/0.6, the heater of the OFC system increases by 9.17% compared with pure R600.
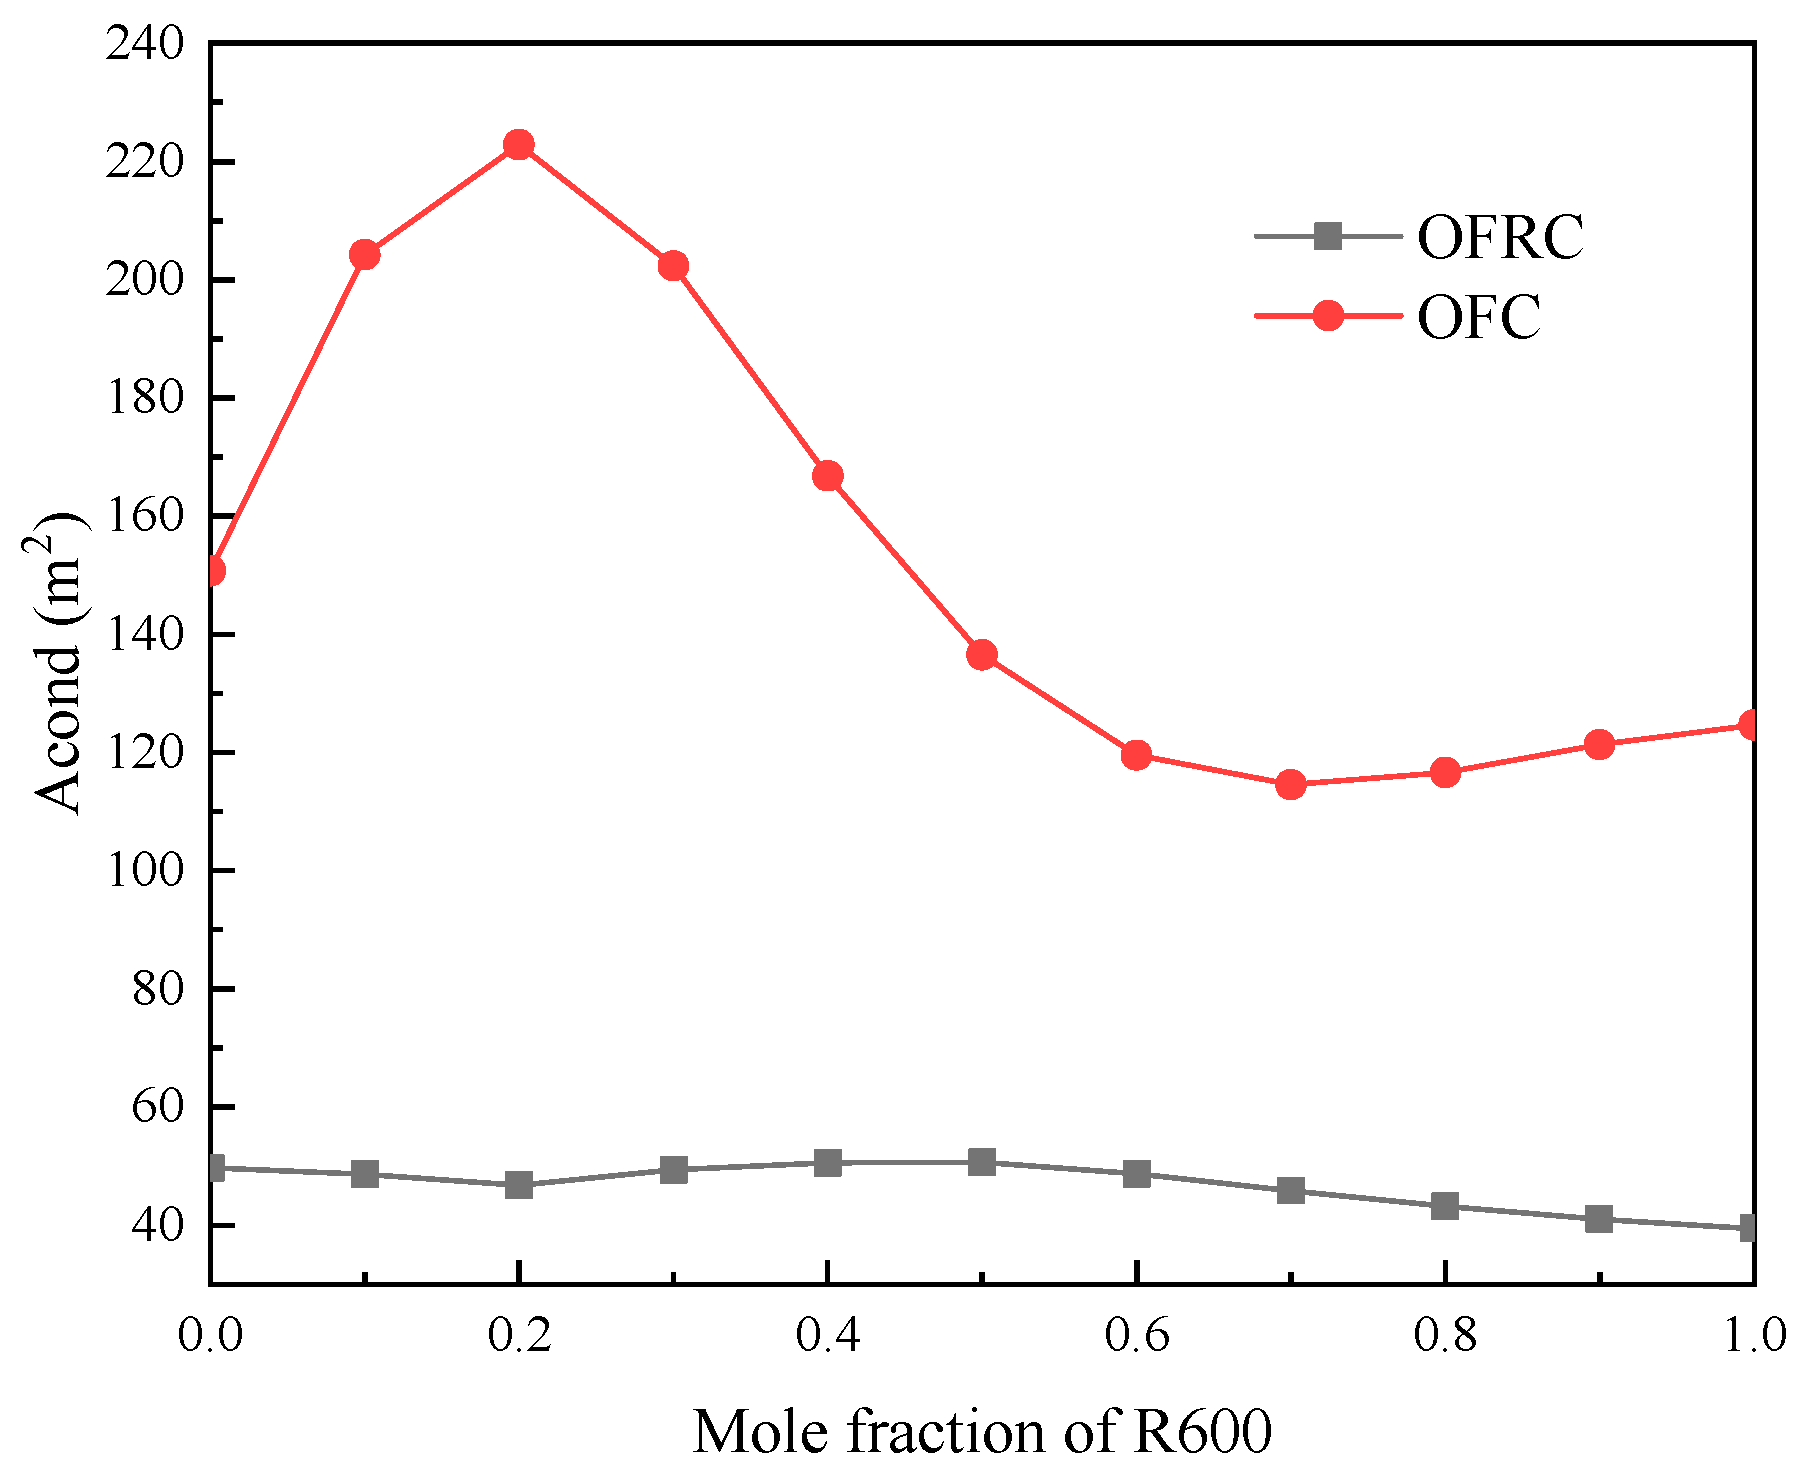
Figure 12 shows the change in the heat exchange area of the system condenser with the R600 mole composition under the optimized operating conditions. With the increase in R600 mole component, the condenser of the OFRC system initially decreases, then increases, and finally decreases, whereas the condenser of the OFC system showed an opposite trend. When the R600 mole component is 0.5, the maximum condenser of the OFRC system is 50.66 m2. When the R600 mole component is 1, the condenser of the OFRC system is the smallest at 39.49 m2, and the relative reduction rate is 20.67% compared with the system with pure R245fa. When the R600 mole component is 0.2, the maximum condenser of the OFC system is 222.83 m2. When the R600 mole component is 0.7, the minimum condenser of the OFC system is 114.56 m2, when the R600 mole component is 1, the condenser of the OFC system is 124.65 m2, when the R600 mole component is 0, the condenser of the OFC system is 150.76 m2, compared with the systems with pure R600 system and pure R245fa, compared with the systems with pure R600 system and pure R245fa, the relative reduction rates are 8.09% and 24.01%, respectively. Furthermore, the condenser of the OFRC system is smaller than that of the OFC system. When the R600 mole component is 0.2, the maximum relative reduction rate of the condenser of the OFRC system is 79.02% compared with that of the OFC system.
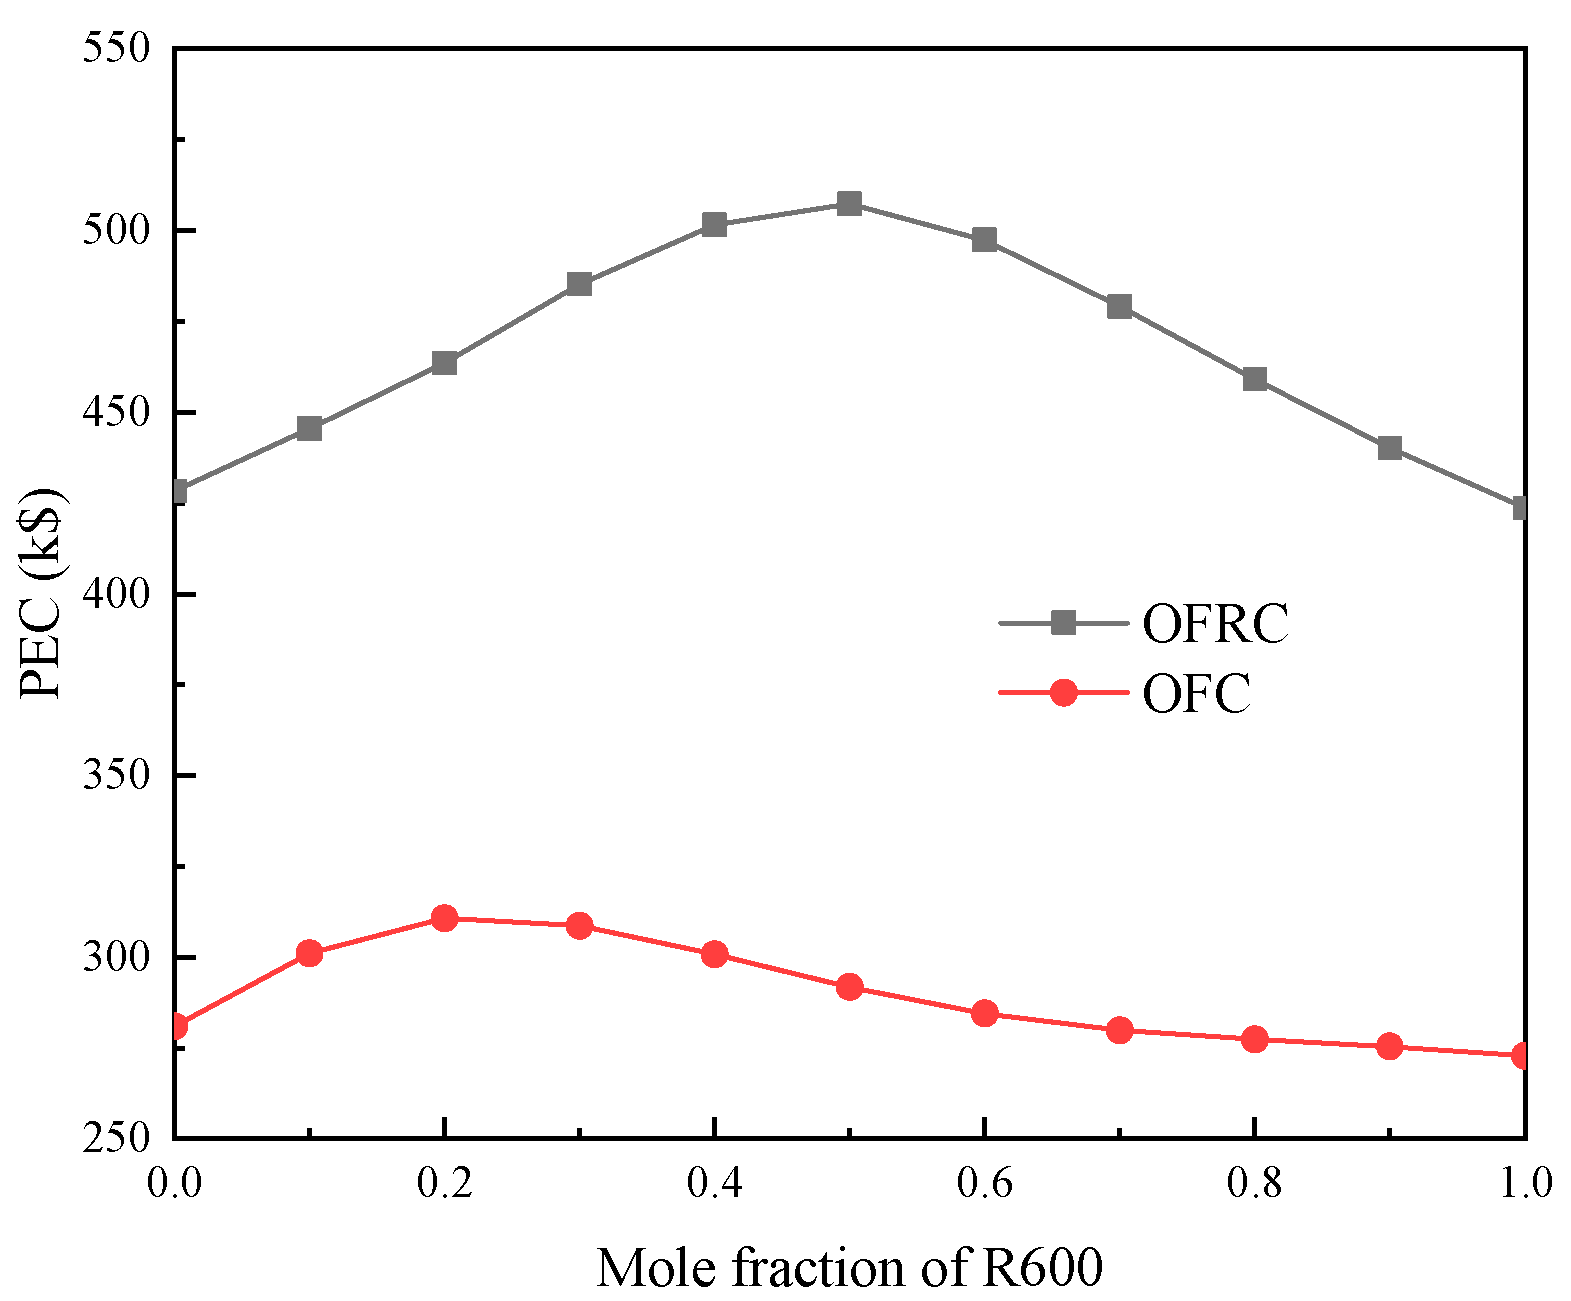
Figure 13 shows the purchased equipment costs as a function of the R600 mole component under optimized operating conditions. The PEC of both OFRC and OFC systems showed a trend of initial increase followed by a decrease with the increase in R600 mole component. This finding can be explained by the mixed working fluid having mass transfer resistance and steam sensible heat in the condensation stage of the system, which leads to the reduction of its condensation heat transfer coefficient. Therefore, the PEC of the system with mixed R600/R245fa working fluid is larger than those of the systems with pure R600 and pure R245fa. When the R600 mole component is 0.5, the PEC of the OFRC system can reach the maximum value of 507.31 k$. When the R600 mole component is 0.2, the PEC of the OFC system can reach the maximum value of 310.66 k$. Furthermore, the PEC of the OFRC system is larger than that of the OFC system. This finding can be attributed to the PEC that is mainly affected by the heat transfer area and mass flow. Although the heat exchanger area of the OFRC system is less than that of the OFC system, the cost of the OFRC system is less than that of the OFC system in this respect. However, according to Equation (26), the cost is also affected by the mass flow rate, and the mass flow rate of the OFRC system is much greater than that of the OFC system, so the cost of the OFRC system is greater than that of the OFC system in this respect. Additionally, the decrease in the former is insufficient in offsetting the increased cost due to the increase in the latter. When the R600 mole component is 0.5, the PEC difference between the two systems is the largest at 215.56 k$.
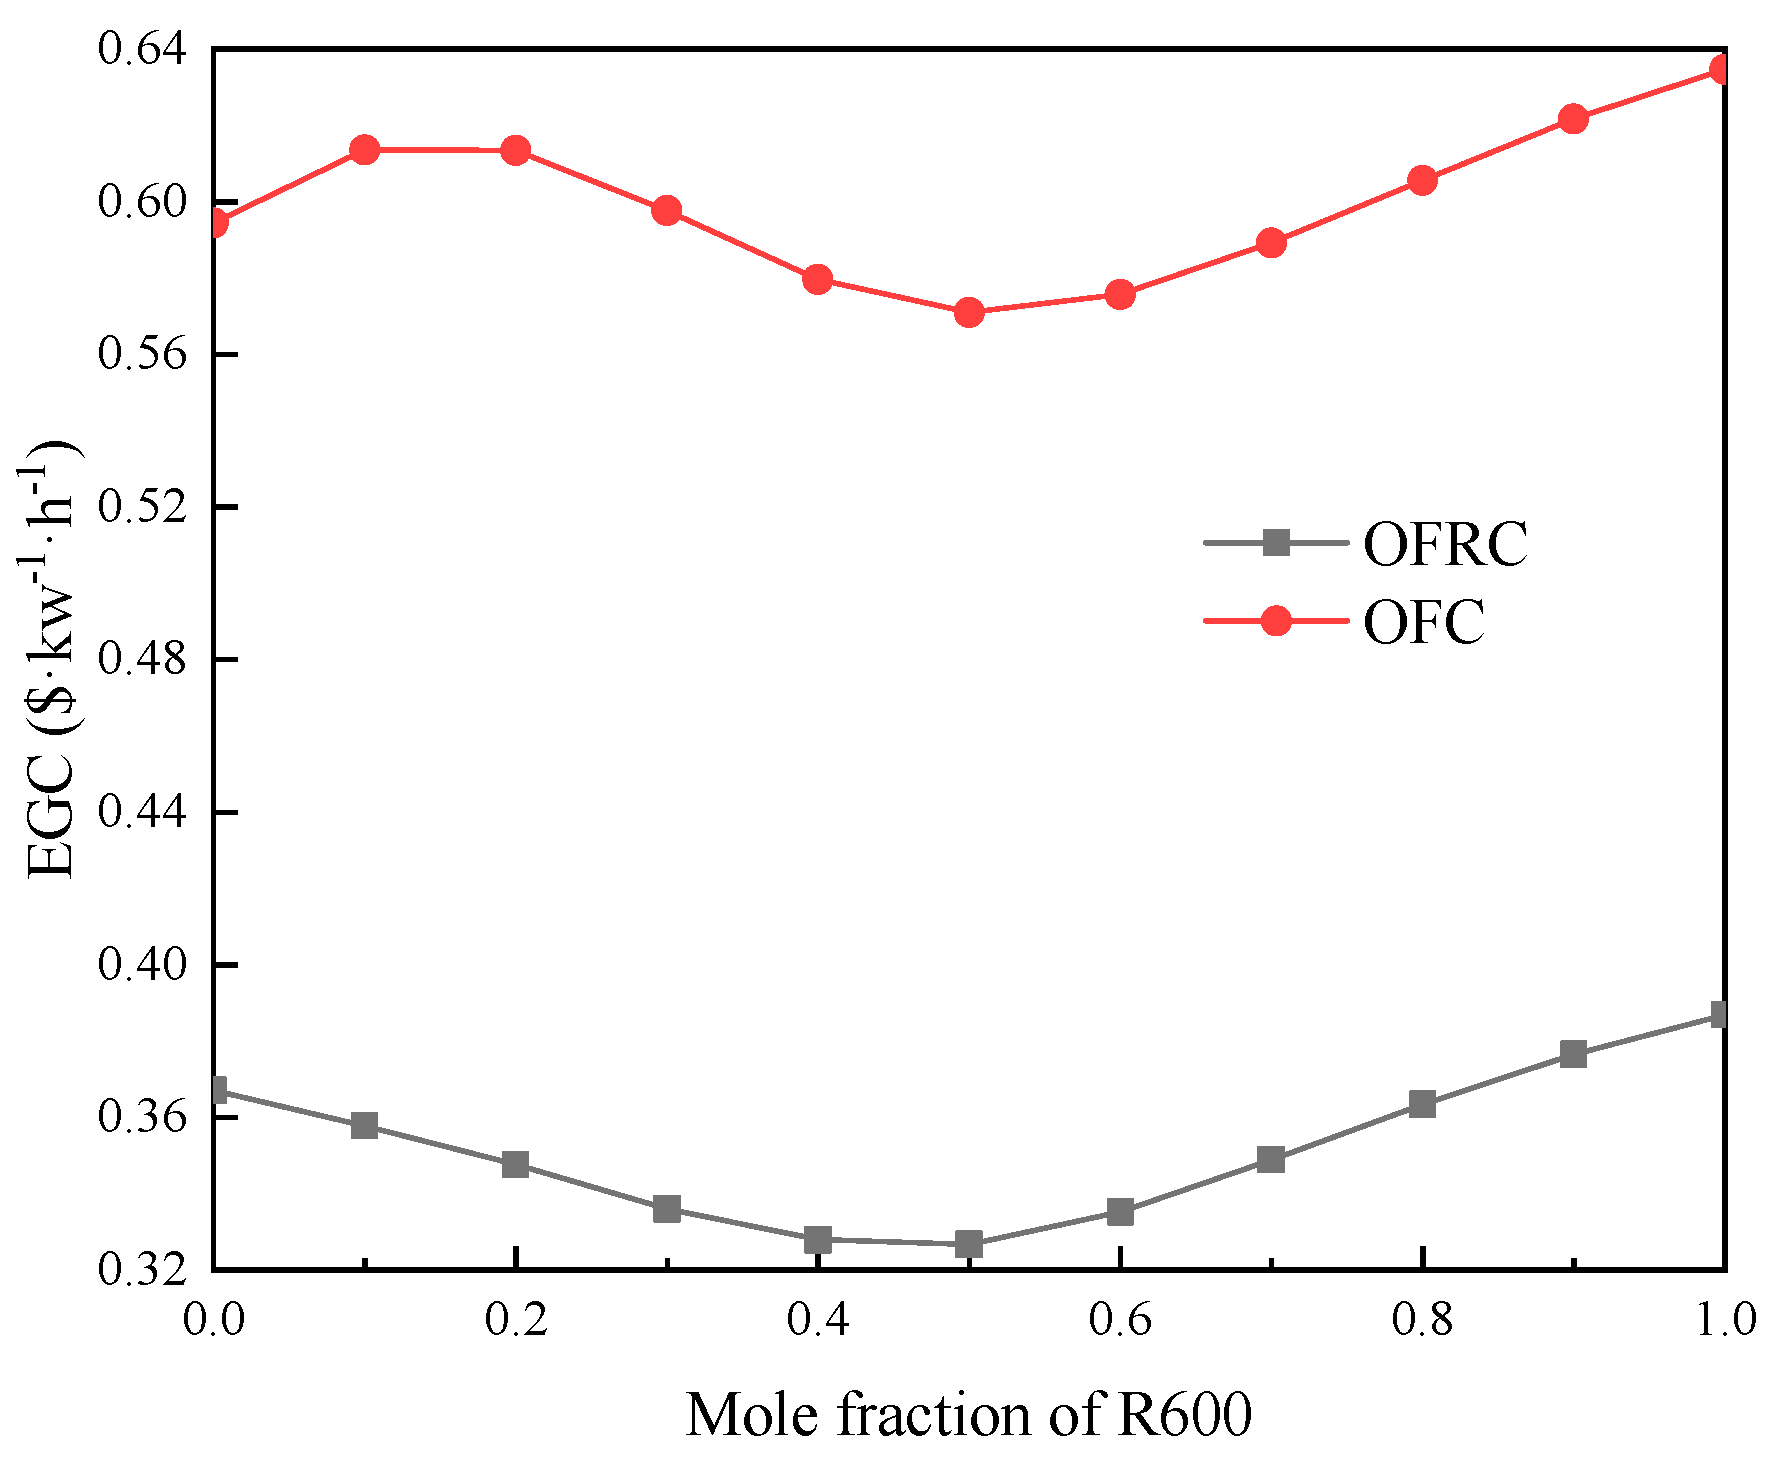
Figure 14 shows the variation in the electricity generation cost of the system with the R600 mole composition under optimized conditions. According to Equation (30) and some references, the annual operating hours are assumed to be 7500 h. The manufacturing cost of the liquid-separated unit as well as the operational and maintenance costs are relatively low, and they are neglected in the manuscript. The net output power in the denominator increases first and then decreases, while the other parameters remain the same or have little variation. With the increase in R600 mole components, the EGC of the OFRC system showed a trend of initial decrease and then an increase, whereas the EGC of the OFC system showed a trend of initial increase, followed by a decrease, and finally another increase. When the mole fraction of R600 is 1, the EGCs of both OFRC and OFC systems can reach the maximum values of 0.3869 and 0.6437 $·kW−1·h−1, respectively. Moreover, the EGC of the OFRC system is smaller than that of the OFC system, which can be explained by the PEC of the former being slightly larger than that of the latter. However, the net output work of the OFRC system is larger than that of the OFC, resulting in a smaller EGC. When the R600 mole fraction is 0.5, the EGCs of both OFRC and OFC systems are the smallest at 0.3627 and 0.5709 $·kW−1·h−1, respectively. For the OFRC system, when the mixed R600/R245fa working fluid is 0.5/0.5, its relative reduction rates are 15.6% and 11.1% compared with the systems with pure R600 and pure R245fa, respectively.

7. Conclusions

In this study, geothermal water at 200 °C as the heat source and R600/R245fa mixture as the circulating working fluid were used to investigate the influence of changing the non-azeotropic working fluid composition on the thermal performance and economic performance of OFC and OFRC systems. The main conclusions are as follows:
(1)
When the R600 mole composition is between 0 and 1, the maximum net output power, thermal efficiency, and exergy efficiency of the OFRC system are all larger than those of the OFC system. When the R600 mole component is 0.5, the maximum net output power is 146.39 kW, the thermal efficiency is 21.51%, and the exergy efficiency is 80.94% in the OFRC system. By contrast, when the R600 mole component is 0.4, the maximum net output power is 48.91 kW, the thermal efficiency is 7.12%, and the exergy efficiency is 27.05% in the OFC system.
(2)
Dual heaters can effectively reduce exergy destruction in the endothermic process. When the R600 mole component is 0.5, the exergy loss of the heater in the OFRC system is only 7.42% of the total exergetic loss. Among the circulating components, the exergy loss of the condenser accounts for the largest proportion. When the R600 mole component is 0.6, the exergy loss of the condenser in the OFRC system accounts for 44.19%.
(3)
The OFRC system has a slightly larger PEC than the OFC system owing to its larger mass flow of working fluid. Furthermore, the electricity generation cost of the OFRC system is much lower than that of the OFC system. When the R600 mole composition is 0.5, the EGCs of the OFRC and OFC systems are the smallest at 0.3267 and 0.5709 $·kW−1·h−1, respectively.

Author Contributions

G.F.: Conceptualization, methodology, software, validation, formal analysis, writing—original draft, visualization. S.Z. (Songyuan Zhang): resources, project administration. Z.G.: conceptualization, writing—review and editing, project administration, funding acquisition. J.L.: methodology, resources, supervision. J.X. (Jian Xu): resources, project administration. J.X. (Jianbin Xie): conceptualization. Z.X.: methodology, funding acquisition. D.Y.: methodology, funding acquisition. T.Z.: resources, funding acquisition. Z.W.: methodology, supervision. S.Y.: methodology, resources. S.Z. (Siyu Zhao): supervision, resources. Q.J.: methodology, funding acquisition. F.L.: Supervision, resources. All authors have read and agreed to the published version of the manuscript.

Funding

This work was supported by the Research Fund of Yunnan Province (Grant No. 202001BB050070), National Natural Science Foundation of China (Grant Nos. 52106017, 51878591, 11862024), Beijing Natural Science Foundation (Grant No. 3222031), Talent Project of Yunnan University (Grant No. C176220200), Yunnan Provincial Department of Education Science Research Fund Project (Grant No. 2018JS551), Scientific Research Foundation of Kunming Metallurgy College (Grant No. Xxrcxm201802), The Postgraduate Research and Innovation Foundation of Yunnan University (Grant No. 2021Y284), Jiaxing Science and Technology Plan Project (Grant No. 2021AD10018), Innovation and Entrepreneurship Training Program for College Students of Yunnan University (Grant No. 202104080).

Conflicts of Interest

The authors declare no conflict of interest.

Nomenclature

EExergy loss, kW
gGravitational acceleration, 9.8 m·s−2
HCooling water pump head, m
hSpecific enthalpy, kJ·kg−1
mMass Flow, kg·s−1
PPressure, MPa
QHeat absorption, kW
sSpecific entropy, kJ/(kg·K)−1
TTemperature, °C
ΔTTemperature difference, °C
WPower, kW
xSteam dryness
ηEfficiency, %
A Area, m2
subscripts
cCondenser
coolCooling water
exExergy
fWorking fluid
HHeater
HPTV High-pressure throttle valve
mid Middle
inImport
outExport
gGas-phase components
lLiquid components
netNet output power
totTotal value
PWorking fluid pump
TExpander
mix Mixer
sys System
0–10 Status point

References

  1. Helen, T. The geopolitics of fossil fuels and renewables reshape the world. Nature 2022, 603, 364. [Google Scholar]
  2. Ge, Z.; Wang, H.; Wang, H.T.; Wang, J.J.; Li, M.; Wu, F.Z.; Zhang, S.Y. Main parameters optimization of regenerative organic Rankine cycle driven by low-temperature flue gas waste heat. Energy 2015, 93, 1886–1895. [Google Scholar] [CrossRef]
  3. Zhukovskiy, Y.L.; Batueva, D.E.; Buldysko, A.D.; Gil, B.; Starshaia, V.V. Fossil Energy in the Framework of Sustainable Development: Analysis of Prospects and Development of Forecast Scenarios. Energies 2021, 14, 5268. [Google Scholar] [CrossRef]
  4. Yan, J.; Yang, X. Thermal energy storage: An overview of papers published in Applied Energy 2009–2018. Appl. Energy 2021, 285, 116397. [Google Scholar] [CrossRef]
  5. Kuamr, A. The brief review on the various thermodynamic cycles. ACADEMICIA Int. Multidiscip. Res. J. 2021, 11, 2228–2233. [Google Scholar]
  6. Wang, Y.; Qin, G.; Zhang, Y.; Yang, S.; Liu, C.; Jia, C.; Cui, Q. Conventional and advanced exergy analyses of an organic Rankine cycle by using the thermodynamic cycle approach. Energy Sci. Eng. 2021, 9, 2474–2492. [Google Scholar] [CrossRef]
  7. Daniarta, S.; Kolasiński, P.; Imre, A.R. Thermodynamic efficiency of trilateral flash cycle, organic Rankine cycle and partially evaporated organic Rankine cycle. Energy Convers. Manag. 2021, 249, 114731. [Google Scholar] [CrossRef]
  8. Wang, Q.; Wu, W.; Li, D.; Wang, J.; He, Z. Thermodynamic analysis and optimization of four organic flash cycle systems for waste heat recovery. Energy Convers. Manag. 2020, 221, 113171. [Google Scholar] [CrossRef]
  9. Kim, K.H.; Ko, H.J.; Han, C.H. Exergy Analysis of Kalina and Kalina Flash Cycles Driven by Renewable Energy. Appl. Sci. 2020, 10, 1813. [Google Scholar] [CrossRef] [Green Version]
  10. Mondal, S.; De, S. Waste heat recovery through organic flash cycle (OFC) using R245fa–R600 mixture as the working fluid. Clean Technol. Environ. Policy 2019, 21, 1575–1586. [Google Scholar] [CrossRef]
  11. Ho, T.; Mao, S.S.; Greif, R. Comparison of the Organic Flash Cycle (OFC) to other advanced vapor cycles for intermediate and high temperature waste heat reclamation and solar thermal energy. Energy 2012, 42, 213–223. [Google Scholar] [CrossRef]
  12. Varma, G.V.P.; Srinivas, T. Power Generation from Low Temperature Heat Recovery. Renew. Sustain. Energy Rev. 2016, 75, 402–412. [Google Scholar] [CrossRef]
  13. Liu, X.; Li, H.; Bu, X.; Wang, L.; Xie, N.; Zeng, J. Performance characteristics and working fluid selection for low-temperature binary-flashing cycle. Appl. Therm. Eng. 2018, 141, 51–60. [Google Scholar] [CrossRef]
  14. Xu, W.; Zhao, R.; Deng, S.; Mao, S.S.; Zhao, L. Understanding the 3D construction method of thermodynamic cycle: Insights from limiting performance of pure working fluid. Energy Convers. Manag. 2020, 224, 113364. [Google Scholar] [CrossRef]
  15. Györke, G.; Deiters, U.K.; Groniewsky, A.; Lassu, I.; Imre, A.R. Novel classification of pure working fluids for Organic Rankine Cycle. Energy 2018, 145, 288–300. [Google Scholar] [CrossRef]
  16. Herath, H.M.D.P.; Wijewardane, M.A.; Ranasinghe, R.A.C.P.; Jayasekera, J.G.A.S. Working fluid selection of Organic Rankine Cycles. Energy Rep. 2020, 6, 680–686. [Google Scholar] [CrossRef]
  17. Abadi, G.B.; Kim, K.C. Investigation of organic Rankine cycles with zeotropic mixtures as a working fluid: Advantages and issues. Renew. Sustain. Energy Rev. 2017, 73, 1000–1013. [Google Scholar] [CrossRef]
  18. Andreasen, J.G.; Kærn, M.R.; Pierobon, L.; Larsen, U.; Haglind, F. Multi-Objective Optimization of Organic Rankine Cycle Power Plants Using Pure and Mixed Working Fluids. Energies 2016, 9, 322. [Google Scholar] [CrossRef] [Green Version]
  19. Heberle, F.; Preißinger, M.; Brüggemann, D. Zeotropic mixtures as working fluids in Organic Rankine Cycles for low-enthalpy geothermal resources. Renew. Energy 2011, 37, 364–370. [Google Scholar] [CrossRef]
  20. Ge, Z.; Li, J.; Liu, Q.; Duan, Y.; Yang, Z. Thermodynamic analysis of dual-loop organic Rankine cycle using zeotropic mixtures for internal combustion engine waste heat recovery. Energy Convers. Manag. 2018, 166, 201–214. [Google Scholar] [CrossRef]
  21. Huang, G.; Zhang, S.; Ge, Z.; Xie, Z.; Yuan, Z.; Tang, C.; Xie, J.; Xu, J. Thermal performance analysis of organic flash cycle using r600a/r601a mixtures with internal heat exchanger. Therm. Sci. 2021, 25, 767–779. [Google Scholar] [CrossRef]
  22. de Campos, G.B.; Bringhenti, C.; Traverso, A.; Tomita, J.T. Thermoeconomic comparison between the organic flash cycle and the novel organic Rankine flash cycle (ORFC). Energy Convers. Manag. 2020, 215, 112926. [Google Scholar] [CrossRef]
  23. Li, J.; Ge, Z.; Duan, Y.; Yang, Z. Effects of heat source temperature and mixture composition on the combined superiority of dual-pressure evaporation organic Rankine cycle and zeotropic mixtures. Energy 2019, 174, 436–449. [Google Scholar] [CrossRef]
  24. Kim, K.H. Thermodynamic Performance and Optimization Analysis of a Modified Organic Flash Cycle for the Recovery of Low-Grade Heat. Energies 2019, 12, 442. [Google Scholar] [CrossRef] [Green Version]
  25. Guidong, H.; Yongyuan, Z.; Zhong, G.; Zhiyong, X.; Huajiang, X.; Yinlian, Y.; Zhipeng, Y. Thermal performance study based on organic flash cycle of internal heat exchanger. Chin. J. Chem. Ind. 2020, 71, 3080–3090. [Google Scholar]
  26. Mondal, S.; Alam, S.; De, S. Performance assessment of a lowgrade waste heat driven organic flash cycle (OFC) with ejector. Energy 2018, 163, 849–862. [Google Scholar] [CrossRef]
  27. Das, D.; Kazim, M.; Sadr, R.; Pate, M. Optimal hydrocarbon based working fluid selection for a simple supercritical Organic Rankine Cycle. Energy Convers. Manag. 2021, 243, 114424. [Google Scholar] [CrossRef]
  28. Yang, J.; Gao, L.; Ye, Z.; Hwang, Y.; Chen, J. Binary-objective optimization of latest low-GWP alternatives to R245fa for organic Rankine cycle application. Energy 2021, 217, 119336. [Google Scholar] [CrossRef]
  29. Li, J.; Liu, Q.; Duan, Y.; Yang, Z. Performance analysis of organic Rankine cycles using R600/R601a mixtures with liquid-separated condensation. Applied Energy 2017, 190, 376–389. [Google Scholar] [CrossRef]
  30. Meng, D.; Liu, Q.; Ji, Z. Performance analyses of regenerative organic flash cycles for geothermal power generation. Energy Convers. Manag. 2020, 224, 113396. [Google Scholar] [CrossRef]
  31. Li, J.; Yang, Z.; Hu, S.; Duan, Y. Influences of fluid corrosivity and heat exchanger materials on design and thermo-economic performance of organic Rankine cycle systems. Energy 2021, 228, 120589. [Google Scholar] [CrossRef]
  32. Hadelu, L.M.; Boyaghchi, F.A. Exergoeconomic and exergoenvironmental analyses and optimization of different ejector based two stage expander-organic flash cycles fuelled by solar energy. Energy Convers. Manag. 2020, 216, 112943. [Google Scholar] [CrossRef]
  33. Lemmon, E.W.; Huber, M.L.; Mclinden, M.O. NIST Reference Fluid Thermodynamic and Transports Properties-REFPROP, Version 9.0; National Institute of Technology, Standard Reference Date Program: Gaithersburg, MD, USA, 2013.
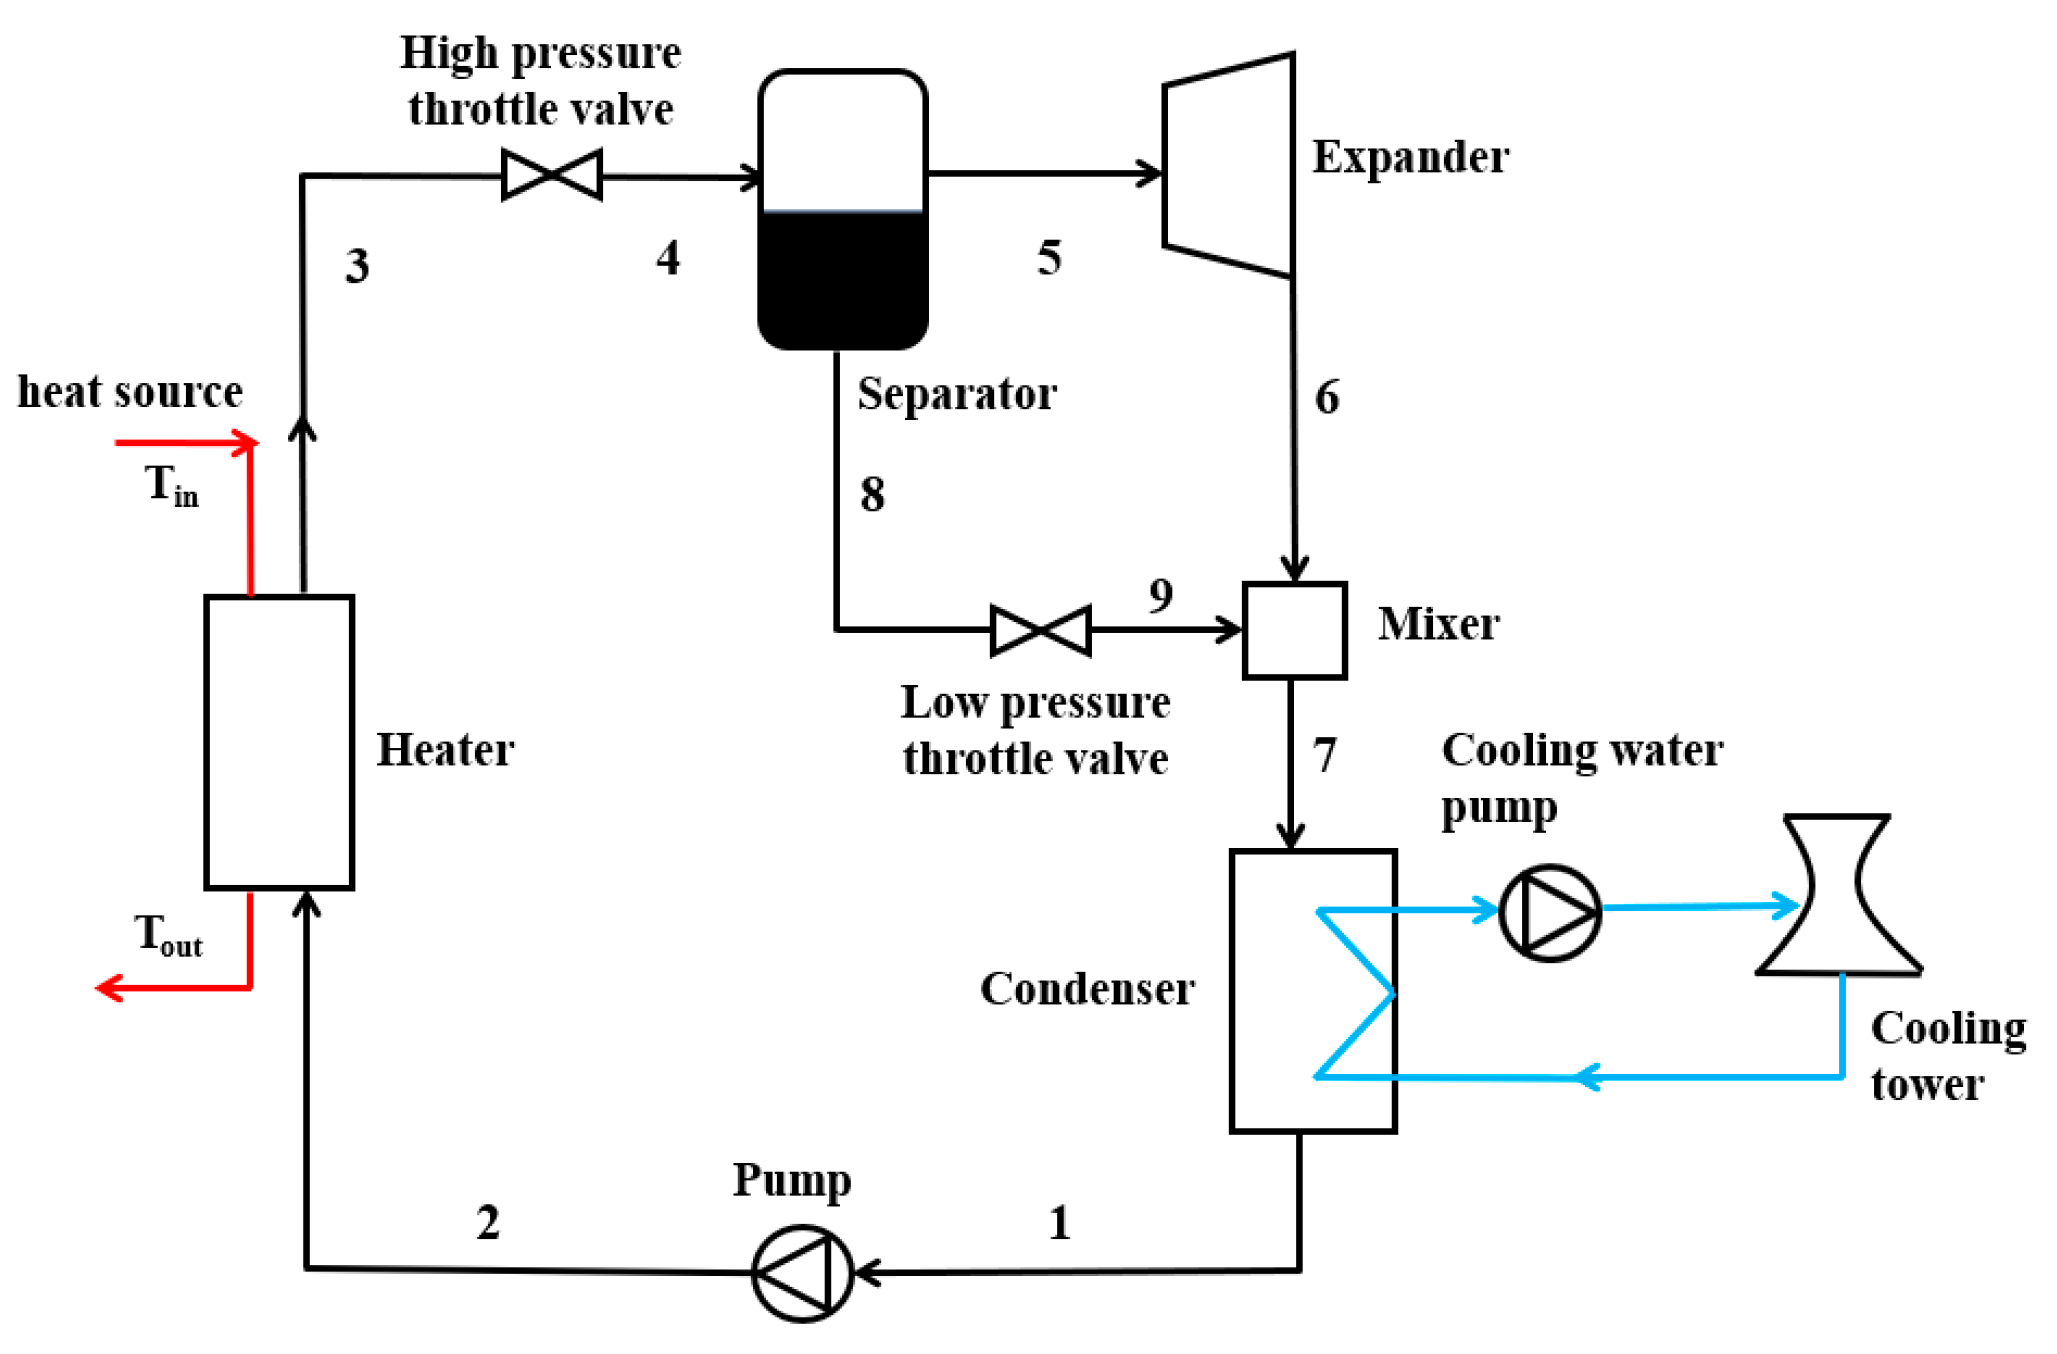
Figure 1. The OFC system diagram.
Energies 15 08055 g001
Figure 2. The T-S diagram of mixtures in the OFC system.
Energies 15 08055 g002
Figure 3. The OFRC system diagram.
Energies 15 08055 g003
Figure 4. The T-S diagram of mixtures of the OFRC system.
Energies 15 08055 g004
Figure 5. The T-Q diagram of the heat exchanger for the OFRC system:(a) the heater I; (b) the heater II; (c) the condenser.
Energies 15 08055 g005
Figure 6. Variation of the optimal flash pressure and heat absorption with the R600 mole fraction.
Energies 15 08055 g006
Figure 7. Variation of the total mass flow rate of the working fluid and the mass flow rate of the gas phase and liquid phase with the R600 mole fraction.
Energies 15 08055 g007
Figure 8. Variation of the net output power with the R600 mole fraction.
Energies 15 08055 g008
Figure 9. Variation of the thermal efficiency and exergy efficiency with the R600 mole fraction.
Energies 15 08055 g009
Figure 10. Variation of the exergy loss ratio of circulating components with the R600 mole fraction.
Energies 15 08055 g010
Figure 11. Variation of the heat exchange area of the system heater with the R600 mole fraction.
Energies 15 08055 g011
Figure 12. Variation of the heat exchange area of the system condenser with the R600 mole fraction.
Energies 15 08055 g012
Figure 13. Variation of the total system cost with the R600 mole fraction.
Energies 15 08055 g013
Figure 14. Variation of the electricity generation cost with the R600 mole fraction.
Energies 15 08055 g014
Table 1. Main thermophysical properties and environmental protection parameters of working fluid.
Working FluidType of Working FluidCritical Temperature (K)Critical Pressure (MPa)Normal Boiling Point (K)Latent Heat of Vaporization (kJ/kg)SecurityOzone Depletion PotentialGlobal Warming Potential
R600HCs425.133.7960272.66177.08A3020
R245faHFCs427.166.6511288.29336.82B101030
Table 2. Parameters in Equations (26) and (27).
ComponentYK1K2K3FBMB1B2FMp/MPaC1C2C3
Heater/CondenserArea (m2)4.3247−0.3030.1634-1.631.661.35<0.6000
0.6–14.1−0.00164−0.006270.0123
ExpanderPower (kW)2.70511.4398−0.17763.5-------
PumpPower (kW)3.38920.05360.1538-1.891.351.55<1.1000
1.1–10.10.39350.3957−0.00226
Table 3. Comparison between the results of this paper and the results of the literature.
Heat Source Temperature/(K)Thermal Efficiency/(%)Exergy Efficiency/(%)
Present StudyReference [22]Relative ErrorPresent StudyReference [22]Relative Error
423.1515.4915.600.7157.9858.761.32
448.1517.1517.300.8659.9360.521.14
473.1518.9719.201.1959.2960.041.24
Table 4. Boundary conditions of the system.
ParameterValueParameterValue
heat source temperature/K473.15working fluid pump isentropic efficiency/%75
thermal fluid flow/(kg/s)1cooling pump efficiency/%85
heat source fluid pressure/MPa1.6cooling water temperature/K298.15
evaporator pinch temperature difference/K5cooling water temperature rise/K5
condenser pinch point temperature difference/K5cooling water pump head/m10
expander isentropic efficiency/%85ambient temperature/K293.15
ambient atmospheric pressure/KPa101
Publisher’s Note: MDPI stays neutral with regard to jurisdictional claims in published maps and institutional affiliations.