Abstract
The aim of this work is the combustion of emulsions in two internal combustion diesel engines, instead of residual fuel oil, to reduce pollutant emissions into the atmosphere and fuel consumption for a cleaner energy transition. A methodology was designed that include the planification and implementation of several experiments in a thermoelectric power plant in Madeira Island, that is part of an isolated electricity production system. In the first place, the planification of experiences was developed and the reference points were created. In this case study, three different operating regimes at the nominal speed of 500 rpm were studied: 7.5 MW, 8.5 MW and 9.5 MW, with a gradual increase of the incorporation of water into the emulsions. A comparative analysis of the potential emulsions in diesel engines, instead of fuel oil, were carried out and two process solutions were created in the 8.5 MW regime with 15% v/v of water and 18% v/v of water. The impact on process parameters and the savings obtained were measured. The best result obtained was the reduction of 56.5% of CO, 96.7% of NO2 and 4.2% of NOx emissions. The specific fuel consumption savings obtained were 2.7%. In conclusion, the experiments and research developed contributed to a more in-depth knowledge about the potential of emulsions in combustion systems; pollutant emissions were reduced; and we designed a new operation regime for the internal combustion engine that are part of an isolated electricity production system.
1. Introduction
The combustion of water emulsions in internal combustion engines has been the subject of study as a smooth pathway to improve fuel efficiency and reduce exhaust gas emissions. The technology has several competitive advantages: it does not introduce changes in operational diesel engines; it improves fuel atomization by incorporating water droplets into fuel; and it reduces environmental impact by reducing the emission of nitrogen oxides, carbon monoxide and unburned gaseous hydrocarbons, into the atmosphere.
The commitment to reduce environmental impact is essential in optimizing the process, because the determination of an optimal regime of operation and combustion will consequently increase the percentage of fuel burning and reduce consumption. Additionally, by reducing the emissions of polluting exhaust gases such as carbon monoxide, oxide and nitrogen dioxide, contributes to the Paris agreement [1] with the reduction of environmental impact regarding the exhaust gases emissions into the atmosphere, benefiting the whole of society. According to Baskar and Kumar [2], the application of water in fuel emulsions in diesel engines is important for controlling air polluting components coming out of the engine exhaust. The research considered the effects of increasing oxygen concentration in the performance characteristics of a diesel engine; results are described when the intake air is enriched to 27% of oxygen and fueled by 10% of water diesel emulsion in the laboratory. According to Hasannuddin et al. [3], emulsion fuel is an alternative fuel for diesel engines and the durability of the cylinder diesel engine with emulsion fuel and a surfactant ratio were carried out with less carbon deposit, but with a higher viscosity of the lubricant. Qian et al. [4] studied poultry litter and natural gas co-combustion in a lab-scale biomass conversion system, regarding electricity generation and emission characteristic with excess air ratios between 0.79 and 1.08, and a secondary air/total air with reductions in CO and NOx. Lin et al. [5] studied engine performance and the emission characteristic of water in oil emulsions from an ultrasonic emulsificator, which produced lower NO emissions, soot concentration and lower black smoke opacity, while a larger CO emissions and specific fuel consumption. Badran et al. [6] has studied the impact of water in diesel emulsions with the incorporation of 10% to 30% of water, with a decrease in NOx and particulate matter, and no developments on CO emissions and hydrocarbons. Nadeem et al. [7] has incorporated from 5% to 15% of water in diesel emulsions with a surfactant, which decreased NOx emissions and 24% of CO emissions with 15% of water incorporation. According to Yang et al. [8], emulsion fuel with nano-organic additives were studied in diesel engines indicating that nano-sized water droplets in the emulsion fuel can accelerate fuel evaporation with 30.6% decrease in NOx emissions with 10% emulsion fuel. Cook et al. studied water in oil emulsions and the effects of water emulsification on particulate emissions with the fuel-air ratio ranging from 0.02 to 0.07 [9]. Alan et al. studied the effect of water emulsion in diesel engines with the reduction of NOx emissions with the installation of larger fuel injectors [10]. The combustion and emissions of glycerol-biodiesel emulsion fuel was compared with ultra-low-sulphur diesel and heavy fuel oil in Eaton et al. [11], as load increased to 25% of peak output reductions of carbon monoxide and particulate matter were observed with lower energy density. According to Selim et al. [12], an emulsion with 30% water in diesel is stable for up to one week and with 20% water in diesel has the density, viscosity, and surface tension parameters stable for four weeks. Attia et al. [13] has studied the effect of castor oil methyl ester blending ratio up to 40% on diesel engine combustion and achieved with 20% blending ratio the lowest NOx, CO emission and unburned hydrocarbon. Heywood et al. [14] demonstrated the fundamentals for engine combustion and it was considered when researching the combustion performance in diesel engines. Experimental investigation on cylinder variable compression ratio in CI engine was done in Maji et al. [15], to investigate performance and emissions with diesel and 10% water content in water emulsified diesel was prepared in the laboratory. A considerable amount of NOx was reduced with emulsions from ultrasonic technology with an increase in hydrocarbons emissions. Mondal et al. [16], demonstrated that most of results are in favor of emulsified diesel, due to lower calorific value of emulsified fuel the brake specific fuel consumption decreases, and the combustion efficiency increases with no reduction of CO emissions.
Topal et al. [17], determined the emissions of poultry waste co-combustion with coal with measure of pollutant emissions NOx, CO and CH4 concentrations in flue gas where it was verified an effect on CO and CH4 with an excess air ratio range of 1.14–1.50. Armesto et al. [18], research about the combustion of agro-industrial wastes such as rice husk fuel for fluidized bed combustors with an increase of potassium content. Varol et al. [19] research study about emission characteristics of co-combustion of woodchips with high sulphur lignite coal concluded that CO emissions increased, and NO emissions were reduced. These previous studies demonstrate different possibilities for co-combustion of raw materials in different combustion engines.
According to Jiang et al. [20], combustion of glycerol co-fired with methane or without methane were studied with investigation of glycerol flame demonstrating flexibility and air to liquid mass ratio effect was verified considering variations of the atomizing air flow rate. Fu et al. [21], introduced that there is micro-explosion with diameters > 250 µm and Ivanov et al. [22], research about the characteristics of combustion of natural and emulsified liquids fuels with analysis of droplets. Lindstad et al. [23] research study about the environmental regulation for shipping have shown the need for the reduction of emissions in this sector regarding sulphur content from burning fuels. Ithnin et al. [24] study about water in diesel emulsions with 31.66% NOx, 16.33% particulate matter contents reduced when testing the engine without surfactant and 3.89% specific fuel consumption.
According to Remigious et al. [25], effect of mixing water with diesel was studied and the emissions characteristic were compared with diesel fuel with reductions of NOx emissions, smoke opacity and the study could be improved with additives.
Emulsions could be a valid solution for combustion engines and shipping, the possibility to be introduced for electricity production regarding the reduction of emissions in Islands was studied in this work. Although Warmburg et al. [26] has studied the possibility of increasing renewable energy in Islands and Cross-Call et al. [27] has studied a case study of the Azores the incorporation of emulsions was not studied on these research. The performance of combustion engines considering an improvement in energy efficiency could be integrated in national plans studies such as Magueijo et al. [28] and could be evaluated according to Soares et al. [29]. The equipment properties were analyzed in combustion processes according to Walas et al. [30] and Perry et al. [31]. Turton et al. [32] was analyzed when considering the study, analysis and synthesis of emulsions.
1.1. Water Emulsion Technology in Fuel Oil
An emulsion is a mixture of immiscible liquids, in this case, water and fuel oil. During the emulsification process, the dispersion phase (water) is introduced into the liquid phase (fuel oil). By applying shear stresses, the particle size (drop size) of the dispersion phase is reduced, the smaller the size of the water droplets the more stable the emulsion.
Water in fuel emulsions form a compound fuel, a mixture of water emulsified into hydrocarbons. Although emulsion technology has previously required the addition of an emulsifier that ensures greater emulsion stability without the occurrence of phase separation (water has a density of 999.1 kg/m3 at 15 °C [31], that is higher than the density of the fuel oil of 981.9 kg/m3 at 15 °C [33], leading to the deposition of water at the bottom of the pipelines and tanks), the combination of this with the effect of cavitation allows for the development of compact equipment, installed directly in the fuel intake circuit in the operational internal combustion engines, ensuring the synthesis of stable emulsions and reducing technology costs. Fu et al. [34] have been studying the stabilization of water in fuel emulsion and the addition of different surfactants that could be stored for more than 26 days at 25 °C without phase separation. Vigneswaran et al. [35] has studied the formulation of water in diesel emulsion fuel with 1,4-dioxane, a hygroscopic substance, as an additive to the emulsion with 44 days stability. In this case study, the characterization of emulsion formulated without surfactant were conducted and experiments were performed in a Power Plant in two combustion diesel engines.
Three systems created separately, hereinafter described as S, P, and N, to produce emulsions by the cavitation effect by three technology licensors to ensure stability within a maximum period of six months, without the need of the addition of a tensioactive material.
In this research, a methodology was designed that included the evaluation, safety, and optimization of combustion parameters.
Cavitation is a phenomenon of formation of vapor bubbles (cavities) in a liquid phase when the pressure of the liquid is lower than its vapor pressure, inducing the collapse of bubbles. The collapse of the bubbles causes sharp increases in temperature and sharp changes in pressure with a shock wave effect [36]. According to the literature [37], the treatment of liquid hydrocarbons such as petroleum, fuel oil, bitumen and biofuels by cavitation has as its main advantages the reduction of viscosity, depolymerization and the reduction of the fraction of asphaltenes in the process, making the fuel more efficient and cleaner. Water in fuel emulsion does not involve the direct exposure of water; it has a low risk of corrosion. The spray atomization [38] through the micro-explosion phenomenon, and the decrease of combustion temperature as a result of the latent heat of water evaporation, is the reason for the reduction of NOx and particulate matter [39]. In the micro-explosion, the boiling point between fuel and water when the fuel is injected inside the combustion chamber results in the evaporation of water droplets [40], contributing to a better combustion and more splitting of fuel droplets [41]. The concept designed for the combustion of emulsions was demonstrated through the theory and experiments.
Characteristics of water in diesel fuel prepared from ultrasonic technology has been studied in Kojima et al. [42], Li et al. [43]. Karim et al. [44] research about the characteristics of water in biodiesel emulsions from ultrasonic and the possibility of combustion of biodiesel emulsions and Leng et al. [45] research about the characterization of glycerol in diesel microemulsion fuel. Kee et al. [46], research about the kinetics for the analysis of gas phase. Jiang et al. [47] research study has a comparison of diesel micro-emulsion properties with surfactant ultrasonic methods while Uson et al. [48] studied the formation of water in oil nanoemulsions mixed in non-ionic surfactant.
The mechanism of the water in fuel emulsion in the combustion process involved:
- -
- Micro explosion
When emulsion fuel is injected into an engine or combustion chamber as a liquid, it is exposed to a high temperature. Water, which has a lower boiling point, will then vaporize, and expand in volume, thereby dispersing the surrounding liquid oil [31]. Due to the micronization of the oil, the contact surface area with oxygen (air) increases, which improves the combustion efficiency and fuel consumption [34]. As a result of the more complete combustion, particulate matter and smoke are also reduced greatly, which leads to a reduction in emission gases. It has an effect of reduction in fuel consumption and CO2 emissions.
- -
- Cooling
Furthermore, due to the latent heat capacity of water, the internal cylinder temperature of the engine is lowered. This suppresses the oxidation of nitrogen in the air and causes the generation of NOx to drop. In the combustion chamber, the carbon reacts with the oxygen in the water, in what is known as a water-gas reaction, which reduces the amount of air required from the outside [4]. NOx is generated when the air is exposed to high temperatures. Water vapor dilutes the region and air is thereby cooled, with the effect of reducing NOx emissions, according to Le Châtelier Principle, and is demonstrated in Equation (1):
- -
- Increased fuel spray momentum
Water has a higher density than fuel and for this reason the overall mass increases by adding water, which increases the momentum and improves the mixture with air, with the effect of reduction in fuel consumption and CO2 emissions.
- -
- Water-Gas reaction
The generation of CO and CO2 emissions when fuel contacts with air and non-reacted carbons reacts with water, according to Equations (2) and (3):
In theory, emulsion fuel is therefore effective in reducing emission gases and fuel consumption. For this reason, the theory was tested by direct application in the thermoelectric power plant. The asphaltenes content was measured in the emulsion samples collected during the tests. The forces of the collapse of the bubbles produced by the cavitation effect cause the reduction of the size of the water droplets, the smaller the size of the water droplets the better the incorporation of water in hydrocarbons and the more stable is the emulsion formed. According to the experiments undertaken, it is recommended to work in a production range of water droplets with a diameter of 5–15 μm [30] to ensure the efficiency of the technology and the safety of downstream equipment in the fuel circuit of diesel engines. Previous studies [6] have revealed that due to fuel micronization, the emissions of polluting gases and soot are reduced; this potential impact was measured in the tests performed. According to Figure 1, when the water emulsion in fuel oil is burned, the water droplets in the fuel vaporize, expanding and increasing the atomization of the surrounding fuel into diffuse particles, contributing to the increase of the contact surface area between the fuel particles and the air thus leading to a more efficient combustion.
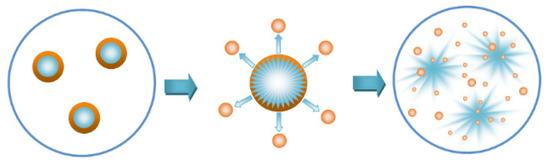
Figure 1.
Emulsions in diesel engines [10].
Nevertheless, large water clusters increase the corrosion rate in diesel engines in the long term, and therefore it is crucial to maintain a compromise between the maximum percentage of water addition and its influence on the corrosion rate of the engines, and the better maintenance of the engines to reduce metal deposition in the fuel injection circuit and no equipment is damaged. It should be noted that the proposed technology is not a water mixer with fuel because the simple mixing of these two phases implies the synthesis of emulsions with poor stability, increasing the risk, in a short time, of water separation from the fuel and the deposition of water at the bottom of the pipelines.
1.2. Determination of the Diameter of the Water Droplets Incorporated into the Fuel
In the synthesis of emulsions, the incorporation of water and dispersion in the fuel occurs, according to Figure 2. The smaller the diameter of the water drop, the better the emulsion stability, and the residues fractions characterized by asphaltenes and resins that are unburned and affect the combustion efficiency. These emulsions properties are visible by optical microscopy, where asphaltenes and resin are seen as a bold accumulator, which can be homogenized in the emulsions and are more advantageous with the reduction of asphaltene content, which improves the combustion efficiency.
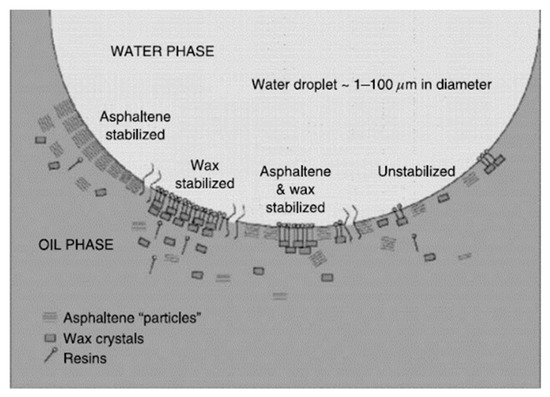
Figure 2.
Water in fuel oil phase with asphaltenes and resins of the fuel in the water drop [30].
Isolated electricity production systems, such as islands, have a high contribution of fossil fuels that are imported for electricity generation. The incorporation of sustainable solutions, such as water in fuel oil emulsions, in existing and new investments, should be considered as a valid energy transition. For this reason, we analyzed a research gap considering the characterization of water in fuel oil emulsion and the combustion of water in fuel oil emulsion at thermoelectric power plants. The hypothesis of reducing NOx emissions by a lower flame temperature in theory was demonstrated. The reduction of carbon dioxide emissions and the improvement of combustion performance were also research questions studied. Measurements of the parameters of emulsions were created and developed, including the design and implementation of new process solutions.
Furthermore, considering the IMO 2020 regulations already in effect on 1 January 2020, emulsions could be a valid solution in order to reduce emissions in the shipment sector that uses the dominant bunker fuel, shifting from heavy fuel oil (HFO) to the new 0.5% very low sulphur fuel oil (VLSFO).
The scope of this research work is the characterization, performance and combustion of emulsions for the reduction of NOx, CO emissions and specific fuel oil consumption in two internal combustion engines.
After the recovery of the heat of the exhaust gases in the respective boiler, it was possible to collect a sample of gaseous effluent from each stream to determine the percentage of unburned gaseous hydrocarbons, and we measured the individual emissions into the atmosphere.
2. Materials and Methods
2.1. Case Study
Experiments were carried out on two internal combustion diesel engines and the combustion performance of water in fuel oil emulsions were analyzed.
The strategic objectives of the experimental were as follows:
- The reduction of specific fuel consumption.
- The reduction of CO, NOx emissions and soot into the atmosphere.
- The optimization of process efficiency.
The behavior of the engines, components and auxiliary equipment has been thoroughly verified, ensuring the safety of the process, facilities and people. Figure 3 demonstrates the diagram created with a macro characterization of the system involved and the analytical procedure developed to evaluate each operational system, ensure safety and define an optimal process model solution.
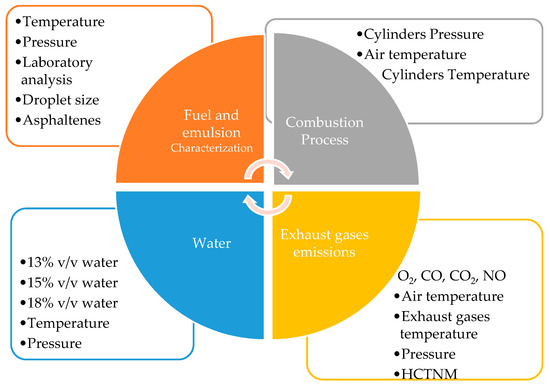
Figure 3.
Diagram of the monitoring and control system designed for this research study including the variation of cylinders and exhaust gases emissions temperature (∆T), total hydrocarbons (HC) and total hydrocarbons unburned without methane (HCTNM).
2.1.1. Characterization of the Fuel Load
The heavy fuel oil is supplied by pipeline to the fuel oil storage tanks represented in Figure 4. The fuel oil product without treatment is stored in the fixed ceiling tank with a capacity of 1000 m3 (Ø = 10.35 m, h = 12 m) and heated (45–60 °C), and then sent to the fuel treatment room.
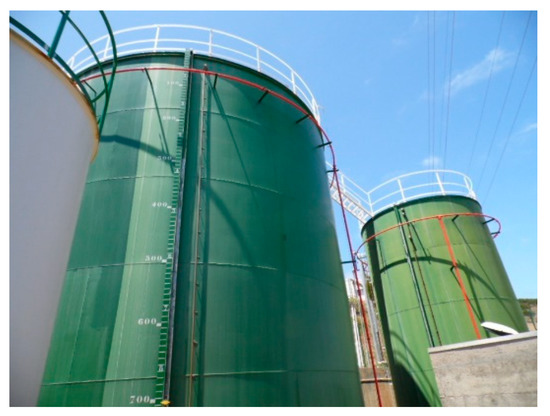
Figure 4.
Fuel storage tanks.
The fuel oil is homogenized in the S-CD-SR equipment to reduce the deposition of waste, by the action of centrifugal force the separation of water and impurities from the fuel oil is carried out in alfa laval equipment [49] and fuel oil is reused through the reconversion of the smudges resulting from the centrifugation and pumping [50] of the fuel. The resulting treated product is sent to the daily tank of 200 m3. Figure 5 represents the fuel oil treatment.
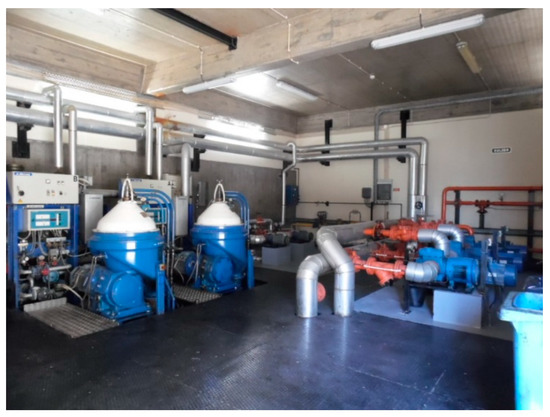
Figure 5.
Fuel oil treatment including centrifugal separators and fuel pumps.
The fuel oil has a kinematic viscosity at 50 °C of 377.4 mm2/s requiring greater energy in the transport, storage and processing of the fluid [49]. Therefore, the treated fuel storage tank is heated to a temperature of approximately 60–80 °C and the system pipes are steamed to ensure fuel flow. Fuel oil tanks are also equipped with a fire-fighting system and in order to prevent the possible spread of fuel spills it is surrounded by a retention basin with capacity to retain the volume of the largest tank.
The thermoelectric power plant has three horizontal centrifugal pumps to supply fuel into the engines of the plant of 23 m3/h and 600 kPa each. Before the admission of fuel to the engines the fuel is homogenized and emulsified with water in the equipment S-CD-WIDE inline. This is the point of inclusion of the cavitators systems P, N and the site of the experimental tests.
The emulsified product, at a temperature of 70 °C and at a pressure of 5 bar, is sent to the mixing tank and then pressurized up to approximately 10 bar in the engine pump, heated to the temperature of 130 °C in the vertical heater, after passing through the filter is fed into the respective engine. The system described is shown in Figure 6.
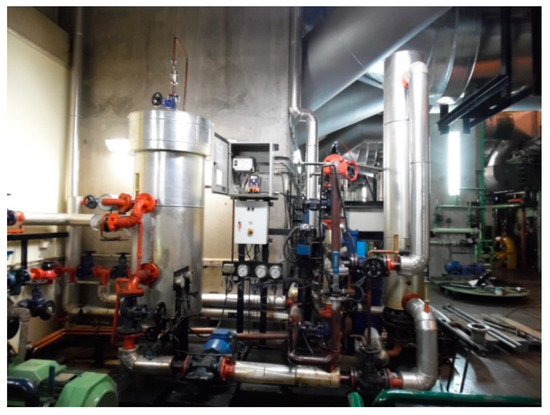
Figure 6.
Fuel intake circuit including mixing tank, fuel pump, vertical heater and filter.
The fuel of the four-stroke diesel engines in the thermoelectric power plant is fuel oil with 1% sulphur. The specifications of the fuel are described in Table 1.

Table 1.
Fuel load specifications.
2.1.2. Water Characterization
In the synthesis of emulsions, it is essential to guarantee water specifications. According to Wartsila engines, Table 2 demonstrates the parameters for water characterization recommended in the addition to internal combustion engines.
Table 2.
Water specifications.
We also considered wastewater in the production of emulsions in the cavitator installed in the fuel circuit. The monitorization of parameters was made in thermoelectric power plant regarding the importance of maintaining the control of metals percentage in order to prevent the increase of fouling and the formation of corrosion in the fuel injection circuit.
Calculations were made with an emulsion flow of 2000 L/h with 15% v/v of water, there were savings due to the reintegration of wastewater into process waters of 1.8% that corresponds to a cost of EUR 3361.50.
2.1.3. Internal Combustion Engines
The experiments were conducted in four-stroke diesel engines Sulzer 16ZAV40S series [51]:
- cylinder diameter 400 mm,
- stroke: 560 mm,
- speed 500 RPM,
- fuel: heavy fuel oil (HFO) and diesel,
- power output: 660 and 720 kW/cyl,
- 16 cylinders and 6 engines,
- 50 Hz.
The total annual electricity emission of the thermoelectric power plant in Figure 7 is 192 GWh/year. The steam produced using the exhaust gases from the engines is supplied to seven manufacturing facilities totalizing 22.000 tons.
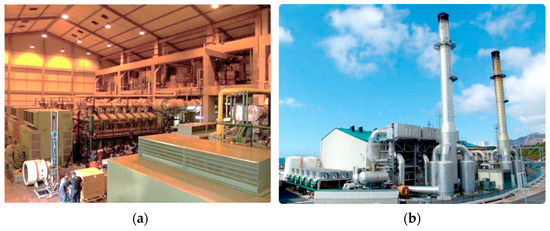
Figure 7.
Thermoelectric power plant. (a) Sulzer combustion engines 16ZAV40S [16]; (b) Exhaust gases system and chimneys [52].
The average HFO consumption in accordance with annual power generation was 208.91 g/kWh at 7.5 MW.
Experiments were made in two engines and the specific fuel oil consumption curves were determined. Figure 7 demonstrates the thermoelectric plant, the combustion engines and exhaust gases system.
2.1.4. S System
The S WIDE (water in diesel/fuel emulsification) system has these main advantages:
- The reduction of NOx emissions and particles (1% v/v water is equivalent to 1% NOx reduction, with reductions up to 20% NOx in 4-stroke diesel engines).
- Improved combustion quality without increasing fuel consumption.
- The reduction of carbon waste deposition in turbos, pistons, cylinders and valves.
- The reduction/elimination of asphaltenes after fuel treatment.
The technology results in the production of stable emulsions of water in fuel oil by the direct injection of water up to 20% v/v. The principle is based on the acceleration and stretching of the drops by applying a cutting voltage and reducing the size of the same by the action of sonic frequencies in each passage. A drop of heavy oil fuel has an average diameter of 70 μm and system S reduces a fuel drop by more than 12,000 drops of 3 μm, improving the quality and homogenization of the fuel; residual particles remain unchanged facilitating their separation. Table 3 represents the specifications of the S CD92-WIDE and Figure 8 demonstrates the components of S system. Experiments were made regarding the operating regime, percentage of water addition in two internal combustion engines.
Table 3.
Specification of S CD92-Wide system [53].
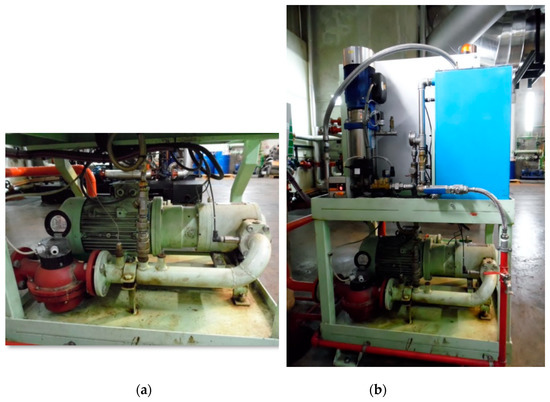
Figure 8.
System S. (a) CD92-WIDE mycronizer with magnetic drive; (b) Water tank, water pump, fuel and water flow meter.
The diagram of the S system is represented in Figure 9.
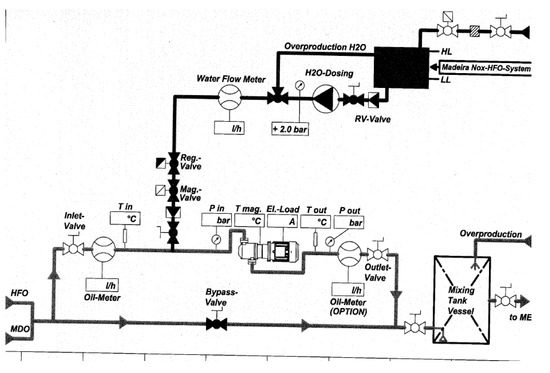
Figure 9.
Diagram of S system [53].
2.1.5. P system
The prototype equipment of the P system, referred to as cavitator, was tested in engines IV and VI in order to verify its production capacity of stable emulsions, without adding any emulsifier and with the reduction of water droplets in micro drops, in order to achieve the uniform dispersion of fuel oil droplets by the rotation of multiple gears.
The cavitator represented in Figure 10 is effective in the combustion of heavy fuel oils of high viscosity, containing a large amount of resins and asphalthenes that in the combustion process are not burned, characterizing black smoke from chimneys. The cavitator is used to increase the quality of heavy fuels. By the effect of cavitation it produces water and fuel emulsions used in fuel preparation systems for internal combustion engines, ensuring fuel consumption savings (initial value: 10%) due to more efficient combustion and reduced emissions of pollutants into the atmosphere.
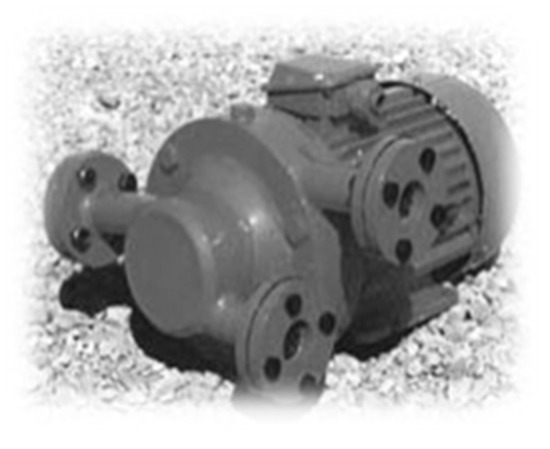
Figure 10.
P cavitator.
Subsequently, in the tests in engines VI the prototype was improved and the tests were performed with an inline cavitator, sized to the flow of the 2 m3/h.
The pressure control, up to the maximum value of 6 bar, was a constant challenge in both engines in order to reduce the pump effect caused by the cavitators, and consequently avoid increasing the fuel pressure up to 10 bar in the upstream line of the mixing tank.
2.1.6. N System
N system technology is based on the formulation of emulsions with percentages greater than 20% v/v of water in a system of 3 to 4 compact cavitators inline, in series without moving parts. Figure 11 exemplifies the installation point of the cavitators in the fuel intake circuit, in this case in engine VI.
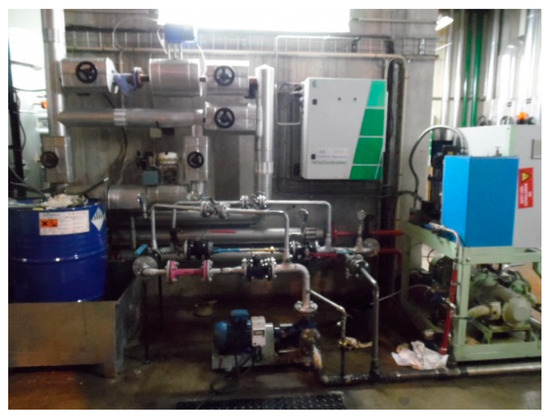
Figure 11.
Cavitator system in the fuel circuit.
2.2. Research Methods
The behavior of each emulsion system varies from regime to regime depending on the percentage of load and the percentage of water added in the cavitator, thus, to ensure equal opportunity of existing technologies, a common analysis methodology has been created comprising the performance of experiments.
In the first place, the percentage of water addition was fixed at different power operation, then, in the same power regime, it was gradually increased the percentage of water added into fuel.
The interventions in the two internal combustion engines comprised the following five steps:
- Design of the reference case at different engine operation systems: 7.5 MW, 8.5 MW, 9.5 MW, 500 rpm, fuel oil.
- The addition of water until process model I: 8.5 MW emulsion with 15% v/v water.
Process model I with 15% v/v water is described in Table 4 and corresponds to scenario 1 at 8.5 MW; in this scenario the savings are calculated by comparing the results obtained in the synthesis of emulsions with the result of the combustion of standard fuel oil.
Table 4.
Process Model I.
- 3.
- The addition of water until process model II: 8.5 MW emulsion with 18% v/v water.
Process model II with 18% v/v water is described in Table 5 and corresponds to scenario 2 at 8.5 MW.
Table 5.
Process model II.
- 4.
- Run the test program and adjustment of process parameters.
- 5.
- Monitoring and controlling all the parameters selected.
First, references were created corresponding to the regime of 7.5MW, 8.5 MW and 9.5 MW with the percentage of addition of 15% v/v water. Then, in the 8.5 MW (SP) regime we modified water percentage between 13%, 15% and 18% v/v. For each test, a rigorous and methodical control of the process was carried out by: controlling the engine process variables, including cylinder pressures and temperatures; exhaust gas temperature; turbo speed; control of the entire engine fuel intake system; measurements of exhaust gas emissions; and total hydrocarbons unburned without methane (HCTNM) released into the atmosphere.
Emulsion samples were collected according to ASTM and asphaltenes content, kinematic viscosity, density and the calorific value of the new emulsions were analyzed.
A protocol for the collection, storage, identification and transport of emulsion samples (Category 3) was elaborated considering safety measures. Figure 12 demonstrates the samples created. Each sample is numbered according to the designation AxEy, where x represents the sequential number of sample A and y the percentage of water incorporation into the fuel of the Emulsion E.
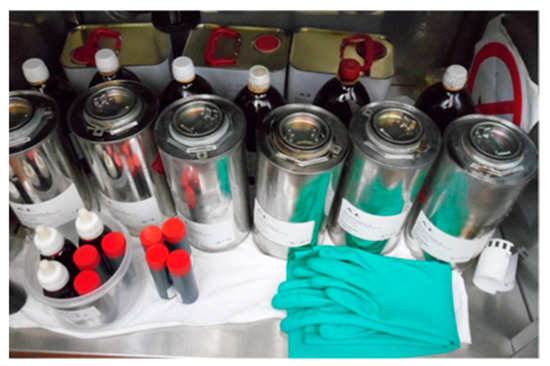
Figure 12.
Emulsion samples.
It was possible to determine by optical microscopy, and using a micrometric scale, the diameter of the water droplets incorporated in the fuel and results were compared.
The determination of these parameters was a challenge requiring the performance of several experiments to ensure the reproducibility of the results. In addition, the oscillations of the frequency of the network and their inverse proportionality with the power have clear repercussions on the percentage of fuel load and consumption.
Exhaust gas emissions were measured using the Tempest 100 gas analyzer; the Testo 340 gas analyzer with similar performance and a better accuracy and range was used when the Tempest 100 gas analyzer was sent to calibration. Figure 13 shows the properties of Tempest 100 analyzer and Testo 340 analyzer. The graphs carried out reflect the trends of CO, CO2, NO, NO2 and NOX emissions into the atmosphere, thus the concentrations of measured pollutants should be specified using the same oxygen reference value (15%) to be compared with each other, demonstrating the correlation between these parameters in the various operating regimes, and the required limit value.
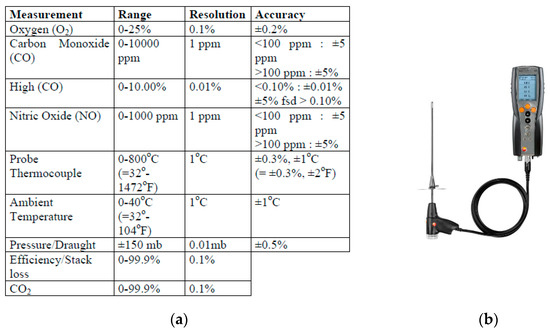
Figure 13.
Properties of Tempest 100 gas analyzer [54] (a); Testo 340 gas analyzer (b) [55].
The calculated carbon aromaticity index (CCAI) is the fuel ignition quality index, and it was calculated according to Equation (4):
where D is the density at 15 °C (kg/m3), V is the viscosity (cST) and T is the temperature at which the viscosity of the sample is measured.
According to CIMAC [56], the ignition delay of a fuel is correlated with the carbon aromaticity of the fuel and this is correlated with the viscosity and density.
The normal values are in the range of 800–880 and the lower the CCAI index the better the fuel quality. An analysis of combustion profile, peak pressures and exhaust gas temperatures in a case of high CCAI is recommended and could be solved when working with the engine above 50% load [57].
3. Results and Discussion
Following the methodology described, the quadratic function of specific fuel consumption was studied in two engines and it was determined that the minimum fuel consumption was 205.08 g/kWh, corresponding to the 85% load regime with a correlation R2 > 0.98. These experiments were conducted in order to create the reference points of each engine before emulsions. Figure 14 shows the correlation obtained with R2 > 0.98, indicating the high impact of crossing these variables and a good determination of the optimal process regime. According to Figure 15 the engine operation exceeding 76% of load will improve the fuel economy and efficiency of the combustion process.
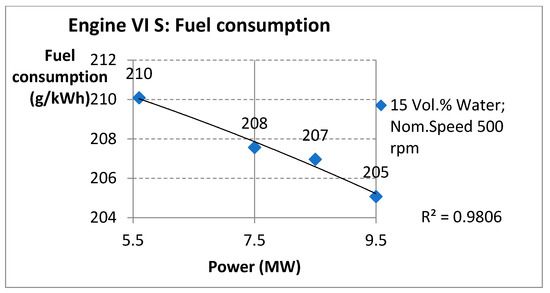
Figure 14.
Evolution of specific fuel consumption with power at a constant rotation speed of 500 rpm.
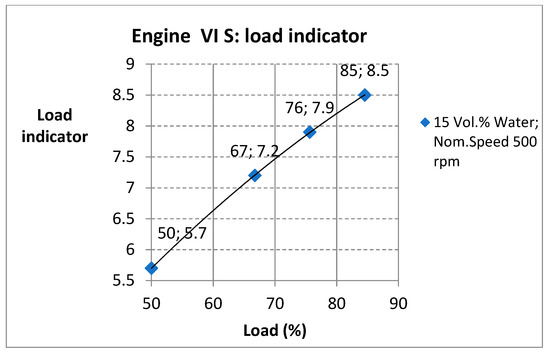
Figure 15.
Evolution of the load indicator at a constant rotation speed of 500 rpm.
According to the methodology created, measures of cylinders temperature and pressure were made at different power in order to characterize the performance of these engines and maintenance routines. Figure 16 and Figure 17 are related to the pressures and temperatures of the cylinders obtained in the experimental tests with emulsions and it is possible to conclude that cylinder 2 and cylinder 6 on side A have a pressure profile higher than the other cylinders, but within normal limits; there was also a decrease of approximately 10 bar in cylinder 4 on side B in regimes greater than 7.5 MW.
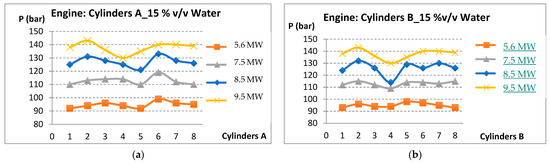
Figure 16.
Variation of cylinder pressures in the operational regimes evaluated: (a) cylinders on side A; (b) cylinders on side B.
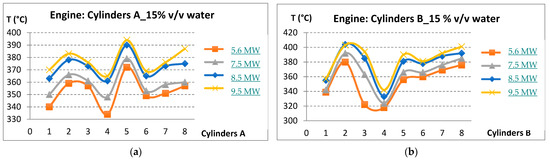
Figure 17.
Variation in cylinders temperature in the rated operating regimes: (a) cylinders on side A; (b) cylinders on side B.
The investigation of temperatures reached in the cylinders was demonstrated in Figure 17. The trend of the temperature profile of cylinder 5 on side A is higher than the profile of the remaining cylinders and a lower temperature profile in cylinder 4 was obtained, indicating a better maintenance of these cylinders. Moreover, the methodology was applied in engine IV.
Regarding the B-side of the cylinders, represented Figure 17, it was found that the trend of the temperature profile [58] in cylinder 2 is higher than the profiles of the remaining cylinders being cylinder 4 with a lower temperature profile, indicating the need for attention and subsequent maintenance. Regarding the reduction of temperature in the exhaust gases, it was verified a ΔTmax = 70 °C on side A before and after turbos and on side B the ∆tmax = 74 °C due to the incorporation of water in the process. Figure 18 and Figure 19 characterize these conclusions.
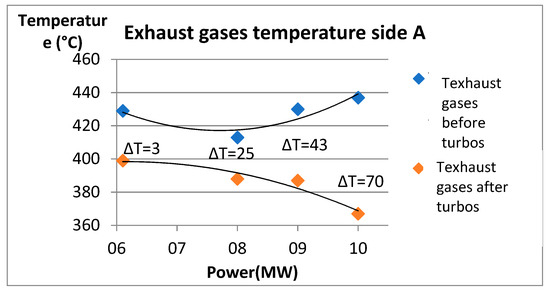
Figure 18.
Analysis of the temperature of the exhaust gases on Side A before and after turbos as a function of the power set point.
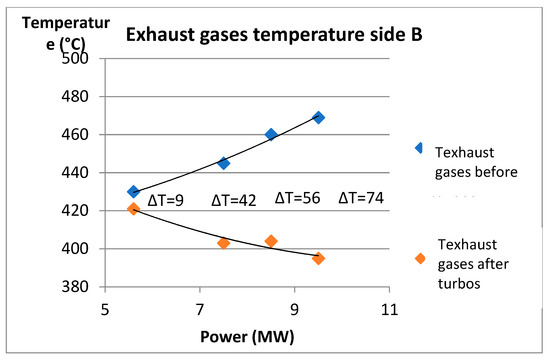
Figure 19.
Analysis of the temperature of the exhaust gases of Side B before and after turbos as a function of the power set point.
The exhaust gases emissions to the atmosphere were analyzed [58], the diameter of the water droplets incorporated in the fuel oil was determined and an inventory of the quality parameters of the emulsions was carried out during the tests.
The determination of these parameters was a challenge, requiring the performance of several test batteries in order to ensure the reproducibility of the results, the oscillations of the frequency of the network and its inverse proportionality with the power have clear repercussions on the percentage of fuel load and consumption, requiring long term experiments. Furthermore, the methodology was also applied on engine IV.
3.1. Comparative Analysis of Systems S, P, N
The results of specific fuel consumption are compared with the results obtained in the S system and thus the savings are determined.
Crossing the results of the emissions of polluting gases into the atmosphere in Table 6, it was possible to conclude that in scenario 8.5 MW with an addition of 15% v/v of water, the equipment of the P system reduced by 3.2% the emissions of CO, and by 38.3% the emissions of NOx into the atmosphere, being the most advantageous from the environmental and economic point of view compared to S. The research of the individual behavior of exhaust gas emissions without the system S present interesting results in the reduction of 46.8% of CO emissions and 23.8% of NO2 emissions in the N system, and the reduction of 31.8% of CO emissions and 38.3% of NO2 emissions achieved in the P system.
Table 6.
Results of exhaust gas emissions into the atmosphere.
The experiments carried out in engine VI in the operating regimes of 5.6 MW, 7.5 MW, 8.5 MW and 9.5 MW in the percentage of addition of 15% v/v of water, and in the 8.5 MW regime with the gradual increase in the percentage of water, is represented in Table 7.
Table 7.
Comparison of specific fuel oil consumption in the reference and on S, P, N system.
The best result obtained was in P system, according to Table 7, with savings of 2.7% of specific fuel consumption. The N system revealed its best result of 1.4% in the addition of 18% v/v of water, getting very close to the savings acquired in the S system in the 15% v/v water addition test. Figure 20 shows the specific fuel oil consumption obtained and corroborate the above conclusions.
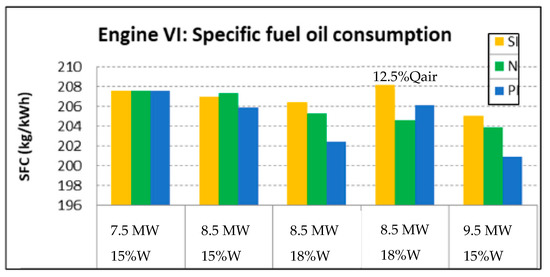
Figure 20.
Determination of specific fuel oil consumption in systems S, P, N.
In all experiments, the optimal engine operating regime verified in engine IV is 85% load, this was the minimum point of specific consumption in the curves of the three systems under study.
3.2. Process Model I: Addition of 15% v/v Water
Process model I with 15% v/v water corresponds to scenario 1 at 8.5 MW the results obtained in the synthesis of emulsions are compared in Table 8 with the result of the combustion of standard fuel oil.
Table 8.
Process model I.
The droplet size of emulsion was measured by the combination of optic microscopy with a digital droplet measurement tool. Samples were taken regarding pressure, temperature and kinematic viscosity of emulsions in the stream, according to fuel oil ASTM.
There were several experiments in the laboratory; Figure 21 demonstrated that sample S with 15% v/v water added had an average diameter of 12.5 μm .
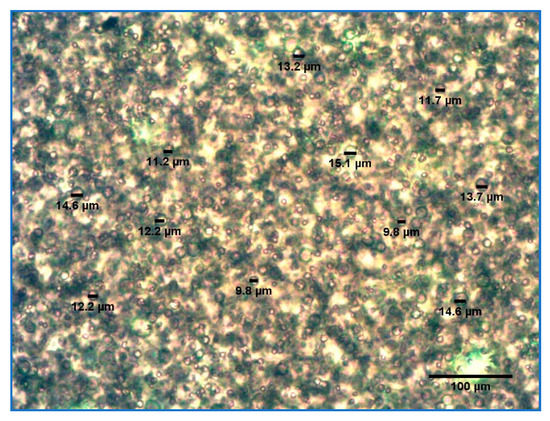
Figure 21.
Sample S with 15% (v/v) water added. Dg average = 12.5 μm .
The emulsions were compared with emulsions from P system and the droplet size was measured. Figure 22 demonstrated that sample P had an average diameter of 14 μm .
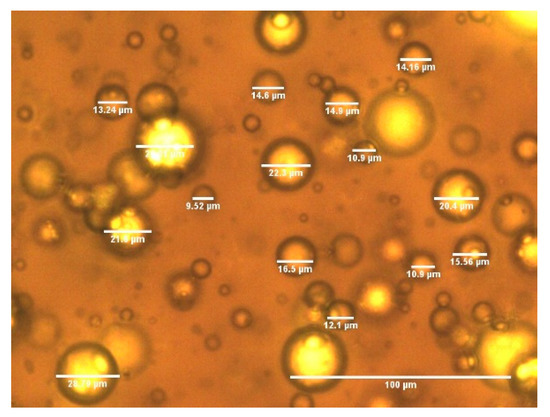
Figure 22.
Sample P with 15% (v/v) water added. Dg average = 14 µm .
The droplet size of emulsions was compared with samples of N system, an average of diameter of 7.9 μm ± 0.01 was obtained and it is demonstrated in Figure 23.
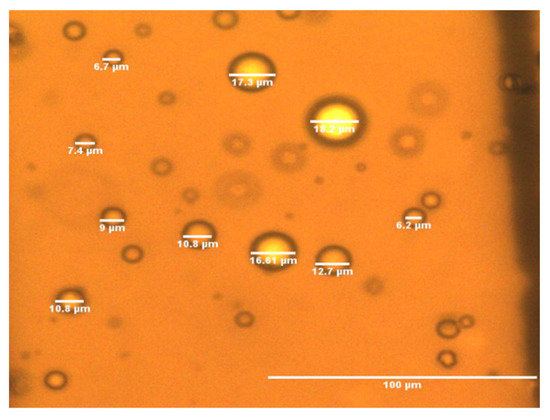
Figure 23.
Sample N with 15% (v/v) water added. Dg average = 7.9 µm .
The results obtained showed that system N has the smallest droplet size, guaranteeing a better atomization in the combustion chamber.
Process model solution I with 15% v/v water added showed a better reduction by system P in the NO2 and CO emissions.
3.3. Process Model II: Addition of 18% v/v Water
Process model II with 18% v/v water corresponds to scenario 2 at 8.5 MW; in this scenario the savings are calculated in Table 9 by comparing the results of each system with the result of the combustion of standard fuel oil.
Table 9.
Process model II.
Due to an increase in the water incorporation, there was an increase in the kinematic viscosity of the emulsions. Several samples were analyzed by microscopy with a digital droplet measurement tool.
Results obtained, in Figure 24, show an average droplet diameter of 9.9 μm for the N sample with 18% v/v water added.
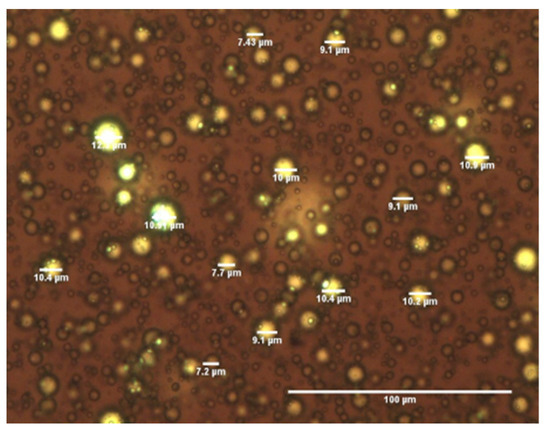
Figure 24.
Sample N with 18% (v/v) water added. Dg average = 9.9 µm ± 0.01.
The droplet size of emulsions was compared with samples of P system and an average of diameter of 16.6 μm ± 0.01 was obtained and it is demonstrated in Figure 25.
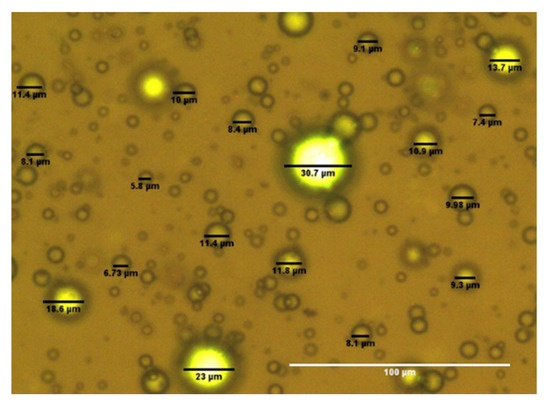
Figure 25.
Sample P with 18% (v/v) water added. Dg average = 16.6 µm ± 0.01.
Analyzing the results, the N system presents the best results with 7–9.9 μm ± 0.01.
The results indicate that the P system achieved the greater CO emissions (54.4% reduction) and savings in specific fuel oil consumption of 1% in process model scenario I (8.5 MW. 15% v/v water) and 56.7% of CO emission reduction and 2.7% of specific fuel consumption savings in process model II (8.5 MW. 18% v/v water).
The N system proved to be promising in both models regarding NOx and NO emissions, with a best result in process model scenario II by reducing 18.5% of NOx emissions and 11.3% of NO emissions.
The reduction of CO emissions was 26.3% and the total hydrocarbons without methane released into the atmosphere was 29.5%.
The dew point of the measured exhaust gas stream was approximately 39 °C in the experiments and it reduced 1 °C when increasing the water percentage from 15% v/v to 18% v/v. The exhaust gas outlet current temperature is in the range of 300 °C with a reduction of 100 °C in the 18% v/v water regime.
These emulsions were tested for more than a year in these engines, with analysis of samples, cylinders and oil including maintenance to compare results.
Fuel oil properties were according to [59].
3.4. Laboratory Analysis of Emulsion Samples
The emulsion samples and fuel oil sample in Table 10 were numbered according to the designation AxEy, where x represents the sequential number of sample that was analyzed A, and y the percentage of water incorporation into the fuel of the emulsion E. Parameters for fuel oil are according to ASTM methods [60].
Table 10.
Samples of emulsion in several experiments and parameters measured.
The calculated carbon aromaticity index, CCAI, is the fuel ignition quality index in internal combustion engines. It was calculated for the emulsions samples and values obtained were in the range of 800–880, which indicates a normal fuel ignition.
Regarding the results obtained, it was possible to verify the increase in kinematic viscosity with the increase in the incorporation of water in the synthesis of emulsions.
The low heat value (LHV) of the emulsified fuel is lower than the LHV of the fuel oil [25] and it decreased by 4.86 MJ/kg in the emulsion produced by the S system, 4.85 MJ/kg in the emulsion produced in the N system and 3.69 MJ/kg in the emulsion of the P system, both cases adding 15% v/v of water. Table 11 demonstrates the values obtained.
Table 11.
Evolution of the low heat value of the various fuels in the addition 15% v/v of water.
Asphaltenes content (ASF) value was calculated for the systems. It achieved 10.1%m/m of ASF in the oil fuel scenario and the content was reduced in the emulsion systems: 6.4%m/m ASF N < 7.9%m/m ASF S < 9.4%m/m ASF P.
The analysis of the cylinder heads and injector nozzles was also carried out and Figure 26 shows that results obtained have the potential for improvement in the case of long-lasting operation without interruptions in the emulsion system.
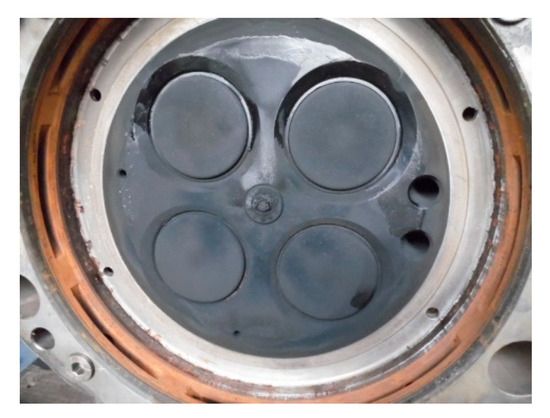
Figure 26.
Cylinder head and injector nozzles.
3.5. Performance Indicators
Considering the savings achieved in the two process models, several environmental and technical indicators were created for each system in order to evaluate the improvement achieved and the best solution.
Indicators in process model I, represented in Figure 27, have shown a better performance of P system regarding the combination of different criteria. These indicators changed regarding the number of cavitators installed; if they are in series or, for instance, use a technology of sonic frequencies or only mechanical forces with a tank for preparation of emulsions and adjustment of properties, such as viscosity, temperature, droplet diameter and water content.
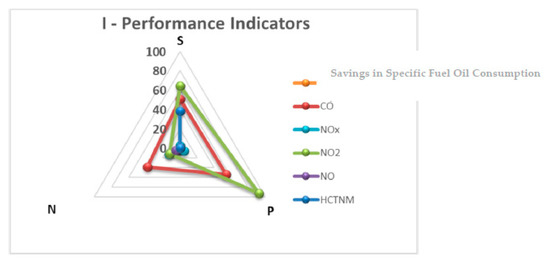
Figure 27.
Indicators in process model I.
It was verified in Figure 28 that P system also achieved an improvement in the variables analyzed, with the greatest economic impact in process model II.
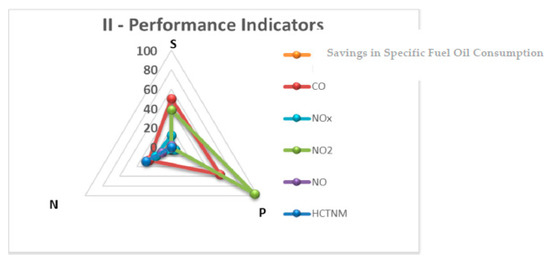
Figure 28.
Indicators in process model II.
Although there is no reduction in HCTNM, this fact has an impact on the efficiency of the system and could be explained by the high number of operation hours of the engine, contributing to a greater deposit and drag of carbon residues in these tests.
The System P has the most significant reduction in CO emissions and NO2.
Experiments and the investigation of combustion and performance of emulsions was also conducted on engine IV.
Results considering CO emissions and NOx emissions are shown in Figure 29.
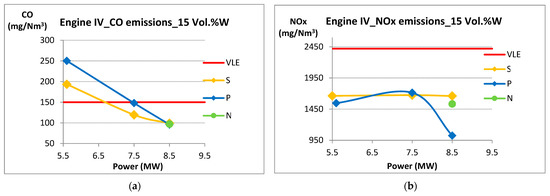
Figure 29.
Engine IV: emissions measured with a water addition percentage of 15% v/v. (a) CO emissions on engine IV; (b) NOx emissions on engine IV.
Results obtained have shown a reduction of CO and NOX emissions when the power increases with better values at 8.5 MW and 9.5 MW. VLE represents the required limit value according to legislation. For this reason, in Figure 29 and Figure 30, the operating regime of engines should be from 7.5 MW until 9.5 MW so that CO emissions are lower than the required limit value of 150 mg/Nm3. The minimum CO emissions corresponded to 96 mg/Nm3 in the P system. CO emissions are lower in system P on engine VI and NOx emissions are lower in engine IV system P.
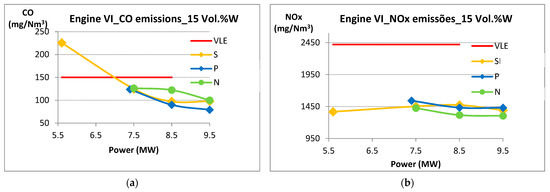
Figure 30.
Engine VI: emissions measured with a water addition percentage of 15% v/v. (a) CO emissions; (b) NOx emissions.
CO2 emissions had the tendency to increase from 50% load to 76% load and CO emissions decrease in the same passage improving combustion. The results obtained on both engines are similar.
Figure 31 shows that CO and NOx emissions have been decreasing on engine IV according to the increasing percentage in volume of water until 13% v/v water.
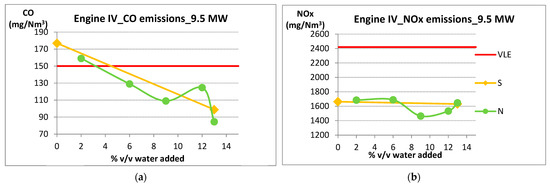
Figure 31.
Engine IV: emissions measured at 8.5 MW SP power with variable % W/F emulsions. (a) CO emissions; (b) NOx emissions.
According to Figure 32, there is a decrease in the CO emissions on system P. At 18% v/v several experiments were made in order to determine the profile of the engine at the power set point. There was an increase in the CO emissions when operating from 16% v/v to 18% v/v and for this reason more experiments were made, and it was possible to conclude that system S, P, N also reduced CO emissions and NOx on engine VI when operating at 18% v/v water. System N has a beneficial reduction in NOx emissions in comparison with system S an P.
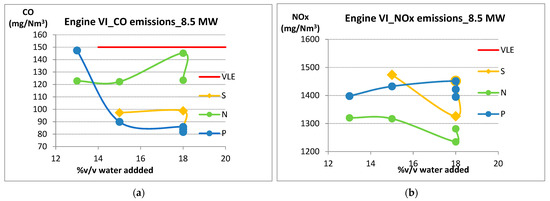
Figure 32.
Engine VI: emissions measured at 8.5 MW SP power with variable % W/F emulsions. (a) CO emissions; (b) NOx emissions.
4. Conclusions
Water emulsions in the fuel oil formulated reduce the specific consumption of fuel oil and the emissions of exhaust gases into the atmosphere.
The measurement of the impact on the variable specific consumption of fuel oil is the most beneficial and critical effect under research. The maximum savings acquired was in in the P system with 2.7% savings, then in the N system with savings of 1.4% and finally the existing S system, with less significant savings of only 0.8%.
It was observed in the investigation made that the addition of water in fuel oil and the formulation of emulsions increase the density and viscosity, whereas cetane number and heating value decrease. The adiabatic flame temperature also decreases due to the addition of water in fuel oil emulsions, and for this reason it decreases the reactions for production of NOx emissions according to Le Châtelier Principle [24].
Asphaltenes content also decrease in the emulsions in comparison with heavy fuel oil (HFO), improving the performance of combustion process. The effects of these changes on diesel engines and the performance of combustion were investigated with the design of two process model solutions. In the combustion process, the micro explosion of water droplets in the emulsified fuel increases the fuel jet momentum and the area of contact with the sprayed air increases with higher density of emulsions, which improves air-fuel mixing and engine efficiency. Viscosity also increased in the emulsions and this parameter is the measure of pumping flow and lubricating characteristics of fuel so for emulsions the viscosity depends on temperature and water content. It was necessary to increase temperature in the fuel circuit to have a better pumping flow to the diesel engines to prevent any damage in the fuel oil system. These viscosity variations were based of the experimental results obtained in the emulsions samples. The addition of water in fuel oil emulsions lowers the heating value more than the fuel oil value. Although the heating value decrease in the emulsions, the break thermal efficiency is higher than when using fuel oil and for this reason emulsions improve the combustion process due to micro explosion effect.
It was a challenge to measure and analyze all the results obtained in the different regimes and the integration of the knowledge acquired in the treatment of results to compare the three systems under study. It was effectively verified that each system should be adapted until it reaches its optimal operating regime, ensuring the commitment of safety and reliability in obtaining the percentage of optimum water incorporation in the admission to the diesel engine.
In both engines, the experiments reduced the environmental impact with promising values, in line with the objectives initially set. The results obtained in another diesel engine were better from the environmental point of view, not presenting significant values of savings in specific fuel consumption.
The best scenario refers to the process model II created (8.5 MW, 18% v/v of water) with the reduction of 56.5% of CO emissions, 96.5% of NO emissions and 4.2% of NOx emissions. These results were obtained from the P system, although without any improvement in the reduction of HCTNM.
The results of the N system were promising in process model II, although it is recommended to study the potential impact of engine operation with 18% v/v of water from the point of view of corrosion rate and metal deposition/fouling in the fuel injection circuit.
Therefore, we selected and calculated the variation of the combustion process variables with the addition of 15% v/v of water in fuel oil, defined as process model I.
Furthermore, the best result obtained was in the P system with a reduction of 54.4% of CO, 92.8% of NO2 and 5.4% of NOx emissions. Specific fuel consumption savings obtained were 1%, but without improvements in HCTNM reduction.
In conclusion, with the characterization and combustion of emulsions in internal combustion engines, we obtained an optimization of combustion process efficiency in load regimes greater than 67%. NOx emissions, CO emissions and NO2 emissions were reduced resulting in an operational improvement, a reduction of operating costs and exhaust gas emissions into the atmosphere, in the electricity production system.
Author Contributions
F.P. wrote the manuscript, design the methodology, conducted the calculation and experiments. C.S. performed the revision and editing. All authors have read and agreed to the published version of the manuscript.
Funding
This research was funded by Fundação para a Ciência e a Tecnologia (FCT) UIDP/50009/2020-FCT and UIDB/50009/2020-FCT.
Data Availability Statement
The dataset used and/or analyzed during the current study is available from the corresponding author.
Acknowledgments
The authors would like to thank the reviewers for their valuable comments, the support of AIE, the administrative staff and operators from experiments done.
Conflicts of Interest
The authors declare no conflict of interest.
References
- United Nations Framework Convention on Climate Change, Conference of Parties, Adoption of the Paris Agreement, Twenty-First session, Paris, 30 November to 11 December 2015. Available online: https://www.natureaustralia.org.au/what-we-do/our-priorities/climate-change/climate-change-stories/take-climate-action-cop26/?gclid=Cj0KCQjw--2aBhD5ARIsALiRlwAWgHuntdpngsdK38XBzhmbDp4-1CIxXSSJY1cSn25OLIPSJZrDGW4aAm0fEALw_wcB (accessed on 19 May 2022).
- Baskar, P.; Kumar, A.S. Experimental investigation on performance characteristics of a diesel engine using diesel-water emulsion with oxygen enriched air. Alex. Eng. J. 2017, 56, 137–146. [Google Scholar] [CrossRef]
- Hasannuddin, A.K.; Wira, J.Y.; Sarah, S.; Ahmad, M.I.; Aizam, S.A.; Aiman, M.A.B.; Watanabe, S.; Hirofumi, N.; Azrin, M.A. Durability studies of single cylinder diesel engine running on emulsion fuel. Energy 2016, 94, 557–568. [Google Scholar] [CrossRef]
- Qian, X.; Lee, S.; Chandrasekaran, R.; Yang, Y.; Caballes, M.; Alamu, O.; Chen, G. Electricity Evaluation and Emission Characteristics of Poultry Litter Co-Combustion Process. Appl. Sci. 2019, 9, 4116. [Google Scholar] [CrossRef]
- Lin, C.Y.; Chen, L.W. Engine performance and emission characteristics of three-phase diesel emulsions prepared by an ultrasonic emulsification method. Fuel 2006, 85, 593–600. [Google Scholar] [CrossRef]
- Badran, O.; Emeish, S.; Abu-Zaid, M.; Abu-Rahma, T.; Al-Hasan, M.; Al-Ragheb, M. Impact of emulsified Water/Diesel Mixture on Engine Perfomance and Environment. Int. J. Therm. Environ. Eng. 2011, 3, 1–7. [Google Scholar] [CrossRef]
- Nadeem, M.; Rangkuti, C.; Anuar, K.; Haq, M.R.U.; Tan, I.B.; Shah, S.S. Diesel engine performance and emission evaluation using emulsified fuels stabilized by conventional and gemini surfactants. Fuel 2006, 85, 2111–2119. [Google Scholar] [CrossRef]
- Yang, W.M.; An, H.; Chou, S.K.; Vedharaji, S.; Vallinagam, R.; Balaji, M.; Mohammad, F.E.A.; Chua, K.J.E. Emulsion fuel with novel nano-organic additives for diesel engine application. Fuel 2013, 104, 726–731. [Google Scholar] [CrossRef]
- Cook, D.H.; Law, C.K. A preliminary study on the utilization of water-in oil emulsions in diesel engines. Combust. Sci. Technol. 1978, 18, 217–221. [Google Scholar] [CrossRef]
- Alan Canfield, C. Effects of Diesel-Water Emulsion Combustion on Diesel Engine NOx Emission. Master’s Thesis, University of Florida, Gainesville, FL, USA, 1999. [Google Scholar]
- Eaton, S.J.; Wallace, T.T.; Sarnacki, B.G.; Adams, T.L.; Kimball, R.W.; Henry, J.A.; Harakas, G.N. Combustion and emissions of a glycerol-biodiesel emulsion fuel in a medium-speed engine. J. Mar. Eng. Technol. 2019, 18, 102–111. [Google Scholar] [CrossRef]
- Selim, M. Ghannam, Combustion Study of Stabilized Water-in-Diesel Fuel Emulsion. Energy Sources Part A Recovery Util. Environ. Eff. 2009, 32, 256–274. [Google Scholar] [CrossRef]
- Attia, A.M.; Nour, M.; El-Seesy, A.I.; Nada, S.A. The effect of castor oil methyl ester blending ratio on the environmental and the combustion characteristics of diesel engine under standard testing conditions. Sustain. Energy Technol. Assess. 2020, 42, 100843. [Google Scholar] [CrossRef]
- Heywood, J.B. International Combustion Engine Fundamentals, McGraw-Hill, New York, Johnson. T., 2016, Vehicular emissions in review. SAE Int. J. Engines 1988, 9, 1258–1275. [Google Scholar]
- Maji, D.; Mondal, P.K.; Mandal, B.K. Experimental investigation on the use of water emulsified diesel in a single cylinder compression ignition engine. IOP Conf. Ser. Mater. Sci. Eng. 2018, 377, 012123. [Google Scholar] [CrossRef]
- Mondal, P.K.; Mandal, B.K. A comprehensive review on the feasibility of using water emulsified diesel as CI engine fuel. Fuel 2019, 237, 937–960. [Google Scholar] [CrossRef]
- Topal, H.; Amirabedin, E. Determination of some important emissions of poultry waste co-combustion. Sci. J. Riga Tech. Univ. Environ. Clim. Technol. 2012, 8, 12–17. [Google Scholar] [CrossRef]
- Armesto, L.; Bahillo, A.; Veijonen, K.; Cabanillas, A.; Otero, J. Combustion behaviour of rice husk in a bubbling fluidised bed. Biomass Bioenerg. 2002, 23, 171–179. [Google Scholar] [CrossRef]
- Varol, M.; Atimtay, A.T.; Olgun, H.; Atakül, H. Emission characteristics of co-combustion of a low calorie and high sulfur–lignite coal and woodchips in a circulating fluidized bed combustor: Part 1. Effect of excess air ratio. Fuel 2014, 117, 792–800. [Google Scholar] [CrossRef]
- Jiang, L.; Agrawal, A.K. Combustion of straight glycerol with/without methane using a fuel-flexible, low-emissions burner. Fuel 2014, 136, 177–184. [Google Scholar] [CrossRef]
- Fu, W.; Gong, J.; Hou, L. There is no micro-explosion in the diesel engines fueled with emulsified fuel. Chin. Sci. Bull. 2006, 51, 1261–1265. [Google Scholar] [CrossRef]
- Ivanov, V.M.; Nevedov, P.I. Experimental Investigation of the Combustion Process of Natural and Emulsified Liquid Fuels; National Aeronautics and Space Administration, and the National Science Foundation: Washington, DC, USA, 1965. [Google Scholar]
- Lindstad, H.; Eskeland, G.; Psaraftis, H.; Sandaas, I.; Stromman, A. Maritime shipping and emissions: A three-layered, damage-based approach. Ocean Eng. 2015, 110, 94–101. [Google Scholar] [CrossRef]
- Ithnin, A.M.; Yahya, W.J.; Ahmad, M.A.; Ramlan, N.A.; Kadir, H.A.; Sidik NA, C.; Koga, T. Emulsifier-free water-in-diesel emulsion fuel, its stability, engine performance and exhaust emission. Fuel 2018, 215, 454–462. [Google Scholar] [CrossRef]
- Remigious, P.; Kandasamy, A.; Rajaram, P. An Experimental Investigation into Chosen Parameters of Diesel-Water Emulsion on Combustion Processes; Hindawi Publishing Corporation: London, UK, 2013; Volume 3. [Google Scholar]
- Warmburg, B.M. Sustainable Energy for Islands: Opportunities Versus Constraints of a 100% Renewable Electricity Systems. El hierro (Canary Islands) and Flores (Azores) Case Studies. Master’s Thesis, Lund University, Lund, Sweden, 2006. [Google Scholar]
- Cross-Call, D.F. Matching Energy Storage to Small Island Electricity Systems: A Case Study of the Azores. Master’s Thesis, Massachusetts Institute, Cambridge, UK, 2013. [Google Scholar]
- Magueijo, V.; Fernandes, M.; Matos, H.A.; Nunes, C.P.; Calau, J.P. Medidas de Eficiência Energética Aplicáveis à Indústria Portuguesa: Um Enquadramento Tecnológico Sucinto, Plano Nacional de Acção para a Eficiência Energética Grupo 5–Grupo de Trabalho Indústria, 24 September 2008, Portugal. Available online: https://www.expofig.com/noticias/9/medidas-de-eficiencia-energetica-aplicaveis-a-industria-de-iluminacao (accessed on 19 May 2022).
- Soares, J.O.; Fernandes, A.V.; Março, A.A.; Marques, J.P. Avaliação de Projectos de Investimento na Óptica Empresarial; Edições Sílabo: Lisboa, Portugal, 1999. [Google Scholar]
- Walas, S.M. Chemical Process Equipment Selection and Design; Butterworth Heinemann: Oxford, UK, 1990. [Google Scholar]
- Perry, J.H. Chemical Engineers’ Handbook/Prepared by a Staff of Specialists; McGraw-Hill: New York, NY, USA, 1950. [Google Scholar]
- Turton, R.; Bailie, R.C.; Whiting, W.B.; Shaeiwitz, J.A. Analysis, Synthesis and Design of Chemical Processes; Prentice Hall: Hoboken, NJ, USA, 1998. [Google Scholar]
- ASTM D975-20a; Standard Specification for Diesel Fuel Oils. ASTM International: West Conshohocken, PA, USA, 2020.
- Fu, Z.S.; Liu, M.; Xu, J.T.; Wang, Q.; Fan, Z.Q. Stabilization of water-inoctane nano-emulsion. Part I: Stabilized by mixed surfactant systems. Fuel 2010, 89, 2838–2843. [Google Scholar] [CrossRef]
- Vigneswaran, R.; Annamalai, K.; Dhinesh, B.; Krishnamoorthy, R. Experimental investigation of unmodified diesel engine performance, combustion and emission with multipurpose additive along with water-in-diesel emulsion fuel. Energy Convers. Manag. 2018, 172, 370–380. [Google Scholar] [CrossRef]
- Ishida, H.; Tachibana, K. A mechanical emulsification technology of petroleum fuels without surface active agent. Nagaoka Natl. Coll. Technol. 2009, 45, 47–54. [Google Scholar]
- Mondal, P.K.; Mandal, B.K. Water emulsified diesel, stability and physical property analysis and its feasibility as alternative fuel for diesel engine. Eng. Sci. Int. Res. J. 2016, 4, 122–126. [Google Scholar]
- Kim, H.; Kim, Y.; Lee, K. An experimental study on the spray, combustion, and emission characteristics of two types of biodiesel fuel. Energy Fuels 2013, 27, 5182–5191. [Google Scholar] [CrossRef]
- Kim, H.; Won, J.; Baek, S.W. Evaporation of a single emulsion fuel droplet in elevated temperature and pressure conditions. Fuel 2018, 226, 172–180. [Google Scholar] [CrossRef]
- Mondal, P.K.; Mandal, B.K. Experimental investigation on the combustion, performance and emission characteristics of a diesel engine using water emulsified diesel prepared by ultrasonication. J. Braz. Soc. Mech. Sci. Eng. 2018, 40, 510. [Google Scholar] [CrossRef]
- Mondal, P.K.; Mandal, B.K. Combustion and Performance Characteristics of a Diesel Engine using Emulsified Diesel Prepared by Ultrasonicator. In Proceedings of the 2017 International Conference on Advances in Mechanical, Industrial, Automation and Management Systems (AMIAMS), Allahabad, India, 3–5 February 2017. [Google Scholar] [CrossRef]
- Kojima, Y.; Imazu, H.; Nishida, K. Physical and chemical characteristics of ultrasonically-prepared water-in-diesel fuel, effects of ultrasonic horn position and water content. Ultrason, Sonochem. 2014, 21, 722–728. [Google Scholar] [CrossRef]
- Li, J.; Sanderson, R.D.; Jacobs, E.P. Ultrasonic cleaning of nylon microfiltration membranes fouled by kraft paper mill effluent. J. Membr. Sci. 2002, 205, 247–257. [Google Scholar] [CrossRef]
- Karim, Z.A.A.; Kaur, E.; Masharuddin, S.M.S.; Khan, M.Y.; Hagos, F.Y. The characteristics of water-in-biodiesel emulsions produced using ultrasonic homogenizer. Alex. Eng. J. 2020, 59, 227–237. [Google Scholar] [CrossRef]
- Leng, L.; Yuan, X.; Zeng, G.; Chen, X.; Wang, H.; Li, H.; Fu, L.; Xiao, Z.; Jiang, L.; Lai, C. Rhamnolipid based glycerol-in-diesel microemulsion fuel: Formation and characterization. Fuel 2015, 147, 76–81. [Google Scholar] [CrossRef]
- Kee, R.J.; Rupley, F.M.; Miller, J.A. CHEMKIN-II: A FORTRAN Chemical Kinetics Package for the Analysis of Gas Phase Chemical Kinetics; Sandia National Laboratories: Livermore, CA, USA, 1989. [Google Scholar]
- Jiang, H.; Xu, S.; Cai, X.; Weng, H. Comparisons of diesel micro-emulsion properties using spontaneous emulsifying and ultrasonic dispersing methods. Pet. Sci. Technol. 2014, 32, 1763–1770. [Google Scholar] [CrossRef]
- Uson, N.; Garcia, M.J.; Solans, C. Formation of water-in-oil (w/o) nanoemulsions in water/mixed non-ionic surfactant/oil systems prepared by a low-energy emulsification method. Colloids Surf. A 2004, 250, 415–421. [Google Scholar] [CrossRef]
- DNV Petroleum Services and Alfa Laval, Fuel Oil Quality and Fuel Oil Treatment, DNV. April 2014. Available online: https://maritimeexpert.files.wordpress.com/2016/08/manual-dnvps-alfalaval-fuel-oil-quality-treatment.pdf (accessed on 19 May 2022).
- U.S. Department of Energy Pumping Systems. Match Pumps to System Requirements. 2005. Available online: https://www.energy.gov/sites/prod/files/2014/05/f16/match_pumps_to_system.pdf (accessed on 19 May 2022).
- Sulzer. Test Bed Report in New Sulzer Diesel. 1994. Available online: https://www.sulzer.com/en/campaign/enhancing-high-voltage-manufacturing-capabilities (accessed on 19 May 2022).
- Central Termoelétrica do Caniçal, AIE, Madeira Island, Portugal. Available online: https://www.ibc-madeira.com/pt/noticias/noticias/203-central-termica-da-zfi-recebeu-certificacao.html (accessed on 19 May 2022).
- CD92-WIDE-Water-in-Diesel/Fuel-Emulsification System, Shiffs & Industrie Technik GmbH, Hamburg. Available online: http://www.sit-hamburg.com/cd-wide.html (accessed on 19 May 2022).
- Flue Gas Analyser. Available online: http://www.keison.co.uk/products/crowcon/Tempest100.pdf (accessed on 20 October 2021).
- Testo 340. Available online: https://static-int.testo.com/media/9d/be/99a5fa7d9840/Manual_testo_340.pdf (accessed on 20 October 2021).
- CIMAC. Fuel Quality Guide Ignition and Combustion, International Council on Combustion Engines. 2011. Available online: https://www.cimac.com/cms/upload/Publication_Press/WG_Publications/CIMAC_WG07_2011_Guideline_Fuel_Quality_Ignition_Combustion.pdf (accessed on 19 May 2022).
- Martins, J. Motores de Combustão Interna; Publindústria: Porto, Portugal, 2005. [Google Scholar]
- SCADA. Ferramenta de controlo e monitorização de dados a tempo real, AIE, Madeira Island, Portugal. Available online: https://www.aiemadeira.com/ (accessed on 19 May 2022).
- API Technical Data Book-Petroleum Refining, 6th ed.; American Petroleum Institute (API): Washington, DC, USA, 1997.
- ASTM D341-20; Standard Practice for Viscosity-Temperature Equations and Charts for Liquid Petroleum or Hydrocarbon Products. ASTM International: West Conshohocken, PA, USA, 2020.


Publisher’s Note: MDPI stays neutral with regard to jurisdictional claims in published maps and institutional affiliations. |
© 2022 by the authors. Licensee MDPI, Basel, Switzerland. This article is an open access article distributed under the terms and conditions of the Creative Commons Attribution (CC BY) license (https://creativecommons.org/licenses/by/4.0/).