Article

Optimal Annual Operational Cost of a Hybrid Renewable-Based Microgrid to Increase the Power Resilience of a Critical Facility

by
Mohammed Alruwaili
1,2,* and
Liana Cipcigan
1
1
School of Engineering, Cardiff University, Cardiff CF24 3AA, UK
2
Faculty of Engineering, Northern Border University, P.O. Box 1321, Arar 91431, Saudi Arabia
*
Author to whom correspondence should be addressed.
Energies 2022, 15(21), 8040; https://doi.org/10.3390/en15218040
Submission received: 4 October 2022 / Revised: 20 October 2022 / Accepted: 26 October 2022 / Published: 28 October 2022
(This article belongs to the Section A1: Smart Grids and Microgrids)

Abstract

:
With the rapid increment of power outages related to extreme natural disasters such as wildfires and severe storms, microgrids have the potential to enhance resilience locally. Traditionally, grid-connected microgrids are investigated from an economic perspective only, without focusing on resilience solutions benefits during grid interruptions. Hence, the presented work proposes a technical and economic evaluation of an airport grid-connected microgrid consisting of solar photovoltaic (PV), energy storage system, and diesel generator to enhance airport power resilience under different power interruption scenarios. A modified mixed-integer linear programming scheme was introduced to minimize the total annual operating cost of the proposed resilient system. The optimal resilient microgrid components sizing and dispatching were investigated with and without a monetary assigned value for resilience as a service. Moreover, the microgrid survivability during solar performance change was investigated. The possible load increment from electric ground support equipment deployment was considered. The results show that the proposed microgrid can achieve an annual operational cost reduction while ensuring a continuous power supply for all considered outage scenarios. The operational cost saving varies between 20% and 22%. The duration of the outage and critical load level have a higher impact on microgrid sizing and dispatching.

Graphical Abstract

1. Introduction

1.1. Background

Recently, the world has seen an increase in power blackouts due to catastrophic natural disasters and cyber-attacks, which brought to attention the importance of power network resilience [1,2]. The extent of intense and frequent extreme events caused by climate change increased weather-related power interruption over recent years, reinforcing the need for resilient electric infrastructure [3]. Traditionally, these extreme weather-related events are known as low-probability, high-impact events. Between 2003 and 2012, the weather was responsible for 80% of major outages in the U.S., which cost the U.S. between USD 20 and USD 55 billion annually [4]. In addition, in 2017, five major weather-related power blackouts caused power interruption to over one million consumers per event globally [5].
The ability of an electrical system to respond to extreme events is known as resilience, and it focuses on how quickly and effectively the power system can restore the electricity supply to its pre-event operation state [6,7]. However, harmful environmentally diesel and gas generators are widely used to provide power during outages. Microgrids have the potential to replace conventional standby sources [8,9,10]. The microgrid is an autonomous power system that functions as a localized power grid consisting of distributed energy resources (DERs), various loads, and energy storage systems that can be operated isolated or connected to utility grids [11]. The ability of microgrids to operate under both grid-connected and off-grid conditions has the advantage of providing energy during normal operation and in the case of grid outage over traditional backup generators, which only operate during emergencies [12,13]. Moreover, the use of only fossil fuel generators as backup systems to supply critical loads is unreliable for long outages due to fuel supply and storage and long turn-off periods, which negatively impact generators’ lifespans [14].
Ensuring continuous power delivery during normal and abnormal conditions is a major challenging aspect, especially in critical loads. Hospitals, military bases, airports, and data centers are among the most important critical loads that require uninterrupted power [15]. Airports are crucial hubs that support continuous supply chains of goods and air transport [16]. Electricity is the main mover of airports operation and the consequences of energy interruption, for example, flight delays, long layovers, cargo operations retardation, economic losses, and a limited ability to provide emergency support [17]. In 2017, a nearly 11 h power outage at the world’s busiest airport, Atlanta’s Hartsfield–Jackson International Airport, caused more than 1000 flight cancellations and about USD 50 million in revenue losses [17,18]. Moreover, in 2016, a failure of power delivery lasted for about 5 h at Delta airline facility, causing more than 1500 flight cancellations and a total loss of around USD 150 million [19,20]. The need for a robust, resilient power system within airports is essential to minimize the economic losses associated with grid outages. The goal of this study was to identify the economic and resilient benefits that microgrids can provide to such critical infrastructure. The study can be beneficial from an initial planning perspective as it gives a wider overview of microgrids to enhance airport costs associated with electricity operational and power interruptions. Moreover, various advantages of using numerical optimization may be useful for airports microgrids energy design and dispatch modeling, for example, open choices to pre-select different types and sizes of energy generating and storing technologies, analyzing the effect of different grid interruptions situations, and testing various load management controls.

1.2. Literature Survey

Various studies were conducted to boost the resiliency of the power grid against extreme events, including resilience analysis [5,21,22], catastrophic events modeling [23,24], and resilience planning [25,26]. In this context, it is important to expand the role of autonomous microgrids widely used to build a resilient electric network. During a grid outage, microgrids play a critical role in delivering uninterrupted backup power. In normal operating conditions, the microgrid and main grid exchange power transfer in both directions. While during a power outage, the microgrid operates in island mode by being disconnected from the grid, for example, in the event of faults in the utility grid. Microgrid critical loads are supplied by DER. Moreover, microgrids can be used to provide a black start to support grid restoration after a major blackout [27].
At present, catastrophic natural disasters cause long-lasting outages and lead to power cuts that critical infrastructures, including airports, cannot sustain. Microgrids, as a resilience source supporting critical loads, have superior advantages over traditional backup systems, which include only conventional generators that are good for short outages. In most cases, microgrids offer both economic and resilience values rather than only resiliency in the case of diesel and gas generators [28]. Hybrid renewable energy microgrids can be operated under different combinations of energy sources, including solar photovoltaic PV systems, wind turbines, energy storage systems, fossil fuel generators, and fuel cells. In addition, renewable-based microgrids can increase the amount of available backup energy by extending DER to provide power to additional non-critical loads [28]. However, during a power interruption, according to specific site criteria time-frame, the microgrid’s DER must be dispatched and optimized to maximize resiliency benefits [29]. Moreover, in most countries, current regulations require solar PV systems to be off during power outages. Such regulations are adopted from a pure safety point of view, protecting workers during maintenance [30]. However, if a solar system is built for resiliency, it can continue to operate and provide power during grid outages by pairing solar systems with energy storage or fossil fuel generators [30]. Princeton University’s microgrid is a real example that was successfully isolated by the master controller and operated for days supplying university critical loads during Hurricane Sandy [30,31]. Another inspiring example was in Japan during an extreme earthquake in 2011, where the Tohoku Fukushi University microgrid successfully supplied energy to a number of critical loads, including a hospital, for two days [2].
The importance of grid-connected microgrids in enhancing the resilience of power systems has been paid little attention in earlier studies. Moreover, the microgrids’ techno-economic assessment, sizing and dispatching, and resilience benefit of off-grid DER systems have been widely studied in many studies [32,33,34,35,36]. The work in [5] proposed a three-step analysis to elaborate on the microgrid’s role in enhancing power system resilience. Resilience analysis method, disaster modeling, and global effort to enhance system resilience were conducted in the first stage. In the second step, the microgrid was implemented as a resilience resource. At the final stage, the strategies employed during large outages to enhance microgrid resilience were analyzed. Authors in [14] evaluated the economic resilience of solar plus energy storage systems located in three different buildings by adding a cost to avoid outages. The value of avoiding outages was added based on the network configuration, whether radial or mesh configuration. The results show an added value to resilience; the net present value (NPV) of solar generation plus energy storage system was improved for radial connected customers compared to conventional backup system diesel generators. Moreover, the simulated outage time and date have impacted the level of resilience of solar and storage systems. In [37], a statistical framework to assess the resilience of grid-connected microgrids during outages was introduced. The study discussed the microgrid survivability to supply a critical load of military bases. A hybrid microgrid consisting of 16.4 MW solar PV, 3.5 MW/13.8 MWh storage, and 2.2 MW diesel generators replaced 5.2 MW backup diesel generators. The results conclude that the hybrid microgrid system provided almost 100% survivability for 7 days compared to 95% for a generator-only microgrid. Moreover, the need for fossil fuel decreased by about 48%. Another military application of microgrids to enhance military base resilience is presented in [38]. The study introduced a design method to ensure a continuous operation of a military microgrid for two weeks. The value of resilience usually outweighs the cost due to the nature of survivability in such military projects. In [29], the resiliency of an airport microgrid was evaluated under different outage scenarios. The study compared the life cycle cost (LCC) of different resilience configurations with business as usual and evaluated the added benefits of a microgrid during power outages. The results showed that over the project’s lifetime, the proposed solar PV, lithium-ion batteries, and diesel generator system provided on average more than USD 70,000 in cost-saving and survivability of around 700 h. Microgrid resilience control approach during a cyber-attack event was introduced in [39]. The proposed cross-layer control strategy was implemented to enhance microgrid resilience against false data injection and denial of service attacks. However, the monetary value of added resilience was not considered.

1.3. Aim and Contributions

Traditionally, airports’ safety and resilience metrics focus on the assessment of air service recovery and transportation system operational performance [40,41,42], while few studies consider power resilience in such infrastructure such as [29]. As mentioned earlier, the economic loss due to power outages within airports is significant, which emphasizes the need for a robust backup power system. This work builds upon the available studies in the literature to evaluate the ability of airports to secure electric power supply during grid disconnection. Particularly, this study evaluates the operational resiliency of a grid-connected microgrid to supply energy to a critical transportation infrastructure during grid outages at a minimum total annual cost of operation. Even though this study focuses on a specified airport, it can be translated to other airports. This study’s contribution is the following: (i) economic and resiliency assessment of an airport microgrid consisting of solar PV, storage, and diesel generator with the presence of airport electric ground handling equipment; (ii) assessment of solar PV power output change during weather-related outages; (iii) evaluation of different system configurations based on different load management strategies for different outages.

1.4. Paper Organization

The rest of the paper is organized as follows. A discussion of the study framework, including the case study, key model inputs, and optimization approach, is discussed in Section 2. Section 3 presents the model performance of various simulated power interruption scenarios and the main discussion. Finally, the study conclusions are presented in Section 4.

2. Methodology and Optimization Formulation

2.1. Case Study

Airports, as critical infrastructures in societies, require an uninterrupted power supply to maintain operations during any circumstance. Moreover, various technologies within airports are being transitioned to electrification to reduce airport emissions, such as electrifying fossil fuel-based ground support equipment (GSE). Consequently, the use of renewable energy-based microgrids is a key factor in enhancing airport resilience and even designing sustainable airports. Aviation is a large power-consuming sector that heavily relies on electricity. In 2019, Spanish airports consumed about 0.4% of the total country electricity consumption [43,44]. While in the U.S., over 2% of critical infrastructures’ energy consumption is related to airports [29]. Seve Ballesteros–Santander (SDR) airport facility is selected as a case study to emphasize the resilience enhancement of airports. The SDR airport is located in the city of Santander, Spain, over two million square meters, where it serves over one million passengers per year [45].

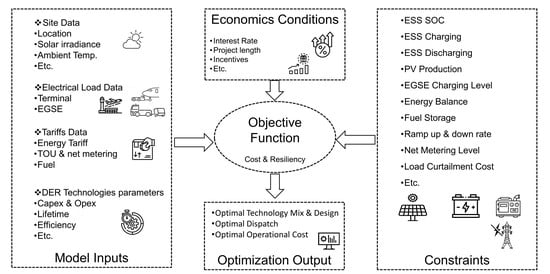
2.2. Optimization Formulation

The optimization problem was modeled using a modified mixed-integer linear programming based on the XENDEE platform [46]. The state-of-the-art XENDEE optimization engine optimally selects, sizes, and dispatches microgrid DERs considering economic and physical constraints over a defined project length. The XENDEE platform is used to manage over USD 3 billion in microgrid projects in various critical and non-critical projects, such as army bases, companies, universities, and rural areas, which ensures its validity [47,48].
The objective function aimed to minimize the total operational cost of the microgrid and can be written as [49].
min C = C g r i d + C D E R + C f u e l + C r e s i r s a l e s
where C g r i d indicates the purchased energy and demand cost, C D E R represents purchasing and operating costs of DERs, C f u e l refers to fuel costs, and r s a l e s donates energy-exporting income. Equations (2)–(6) represent the objective function components in terms of decision variables. Whereas the first part of Equation (2) represents electricity purchasing cost, the second part represents demand cost, and the third part represents electricity generating costs. Equation (3) indicates the annualized purchasing, operating, and variable plus fixed maintenance cost of DER technologies. In addition, Equation (6) describes the cost of curtailed electrical load during power outages.
C g r i d = m M   U f i x m + m M , d D , h H V u t i l m , d , h · U m , d , h · N D m , d + p P max U p · C d e m p + m M g G P u r c h N u m g · C a p G e n g + k K C a p C o n t k · S C m
C D E R = g G P u r N u m g · C a p G e n g · F O M g + k K C a p C o n t k · F O M k + m M , d D , h H , t T P m , d , h , t · N D m , d + g P u r N u m g · I c a p g · A N N g + k P u r B k · I f i x k + C a p C o n t k · I v a r k · A N N k
C f u e l = m M , d D , h H F P m , d , h · N D m , d · V f u e l m , d , h
r s a l e s = m M , d D , h H t T S m , d , h , t · P x m , d , h
C r e s i = m M , d D , h H , p r P R D C m , d , h , p r · V o l l p r  
A N N t = I n t R a t e 1 1 1 + I n t R a t e l i f e t i m e t
The DERs upfront purchase cost was converted to an annual equivalent cost to be compared with other operational costs by amortization rate A N N . The objective function was subjected to the following constraints:
L m , d , h + t T S m , d , h , t + K m , d , h , t = t T P m , d , h , t + U m , d , h
U m , d , h U ¯ m , d , h * A m , d , h
E P V m , d , h = P V C a p   · P V n o r m m , d , h
Equation (8) manages microgrid energy balance for each time step to ensure the total load, including energy demand L m , d , h , energy export S m , d , h , t , and energy consumed by the energy storage system (ESS) K m , d , h , t is supplied by the utility grid U m , d , h , and DERs P m , d , h , t . In addition, Equation (9) forces energy purchases from the utility during outages to be zero. Solar PV-produced electricity is calculated in Equation (10), where location, temperature, panels type, and orientation control the solar PV normalized performance P V n o r m m , d , h .
The storage system constraints include state of charge SOC, charging, and discharging demonstrated in Equations (11)–(15).
S O C h = S O C h 1 + E S S h i n E S S h o u t E S S h l o s s
S O C m i n S O C h S O C m a x
E S S h i n = E h E S S i n * η c h E S S c a p * c h r
E S S h o u t = E h E S S o u t * η d i s E S S c a p * d i s
E S S h l o s s = S O C h 1 * θ E S S
The full optimization model constraints were described in [50,51,52], where only related constraints to this study are included. The resilience impact was analyzed based on outage characterization, including starting time, date, and duration, as well as critical load information, including critical load percentage.

2.3. Model Inputs

Appendix A shows in detail the economic assumptions and inputs of the used model. In addition, the further relevant information is explained in the following subsections.

2.3.1. Load Profile

The SDR airport is a medium-sized airport that has one terminal building with 3 GWh annual energy consumption [53]. The airport’s average hourly consumption per month in 2015 is illustrated in Figure 1 [53]. The SDR energy demand pattern is strongly correlated to the season of the year. The highest energy consumption is seen during winter and summer, especially in January, February, and July. The maximum, minimum, and yearly average loads are 637 kW, 155 kW, and 342 kW, respectively. The maximum load is during February at 7 a.m., while the minimum load is during September at 5 a.m. In addition, all months have a similar load curve shape, which is due to the airport operating hour. The airport has various critical loads such as data center processing, radio navigation, metrological data, control tower, and others that could not afford a power outage. Thus, the projected load, including critical loads, ranges from 50% to 100%, depending on the simulated outage scenario. The optimum rate tariff from Endesa electric utility company was applied [54], and it is shown in Figure 2. Note that the energy and demand rates are categorized into six levels, where P6 is the lowest rate and P1 is the highest rate. As seen in Figure 2, the highest energy and demand rate (P1) is seen during the winter months of December, January, and February between hours 9:00 and 13:59 and 18:00 and 21:59. The cheapest energy and demand rate (P6) is applied between 00:00 and 7:59 for all months and weekends. In addition, the months of April, May, and October have the lowest daily energy and demand rate levels. The energy sellback is assumed to be constant at a price of 0.05 USD/kWh.

2.3.2. Solar Photovoltaic System

Airports usually have large free-shade areas that provide sufficient land for solar PV installation. The used solar PV system consists of standard panels that have 15% efficiency and 14% total system losses [55]. The solar PV panel total losses take into consideration soiling, mismatch, wiring, shading, light-induced degradation, connections, availability, and nameplate rating [55]. The solar PV system performance is generated by the PVWatts platform based on the location of the microgrid creating a 24 h daily profile as shown in Figure 3, which is expressed as the PV output (kW) per installed (kWdc). Based on the performance data, the solar PV system can generate each hour a fraction of its installed electrical power capacity. The performance data are calculated using various data such as irradiance profile, system losses, inverter and PV technology efficiencies, available space, and array specification (fixed or tracking, roof or ground mounted, tilt angle, and direction).

2.3.3. Battery Energy Storage System

The battery energy storage system (BSS) was utilized to secure the energy supply during power outages and solar PV fluctuation. BSS behaves as an added load while it is charging and as a power generator while discharging. Thus, BSS dispatch strategies are an important factor, especially during power outages. Two different dispatch strategies during outages can be simulated by XENDEE [49]. Multi-day discharge, which is suitable for long-duration outages (usually 24 h and over), is used to ensure that battery discharge has sufficient energy over multiple days. Whereas a conservative dispatch strategy, called the end-of-day recharge, is considered during less than 24 h outages. The battery recharge to pre-outage level by the end of the day to avoid battery oversizing. It is assumed that the BSS can be charged by all power supply technologies, including the utility grid.

2.3.4. Electric Ground Handling Equipment

At the airport apron where airplanes are parked, the ground handling operations are performed to load, unload, refuel, airplanes towing, de-icing airplanes, and passenger and crew transportation [56]. The specially designed ground support equipment (GSE) used to perform the ground handling operation is traditionally powered by fossil fuel. More fully electric GSEs are deploying in airports worldwide, which adds additional load to the existing airport load. In 2013, about 10% of the total GSE globally were electric, and more are expected to deploy in the near future [57]. Thus, the consideration of such load is essential when assessing the economy and resilience of microgrids. In this study, the electric GSE load was modeled based on the average daily required energy to perform tasks [58,59]. The availability of electric GSE to charge was modeled based on the average daily flight schedule [60], where electric GSE has a higher charging probability during the low number of flights. Figure 4 illustrates the charging availability schedule.

3. Simulation Results

3.1. Scenario 1: Normal Operation (No Outages)

Regardless of the value of resilience, the microgrid was sized and dispatched from an economic perspective only. This scenario served as the optimal financial system base to be compared with further scenarios. The optimal size of the system consists of 2724 kWdc solar PV and 3766 kWh storage batteries, where the annual operational cost (AOC) is reduced by 23.3%. In the current situation where the airport only relies on the utility grid, also called business as usual (BAU), the AOC was USD 1.3833 million. The integration of solar PV system decreased AOC to USD 1.0611 million. The optimal power dispatch during normal operation is shown in Figure 5. As can be seen from Figure 5, the solar PV system was prioritized to serve electrical load almost entirely during the daytime since PV production and high utility tariffs were matched. However, in February, the storage system provided energy along with PV between 8:00 and 10:00 and 16:00 and 17:00 when the microgrid load was higher than the PV power output compared to May, where the load was lower than the PV power output. Moreover, the storage system was charging via the grid in February during the first 7 h, which was not the same case in May, where the storage system was mainly charged during the daytime. Note that the system sizing and dispatching would vary under different tariff structures and rates, as well as the net-metering scheme; however, this is out of scope in this study.

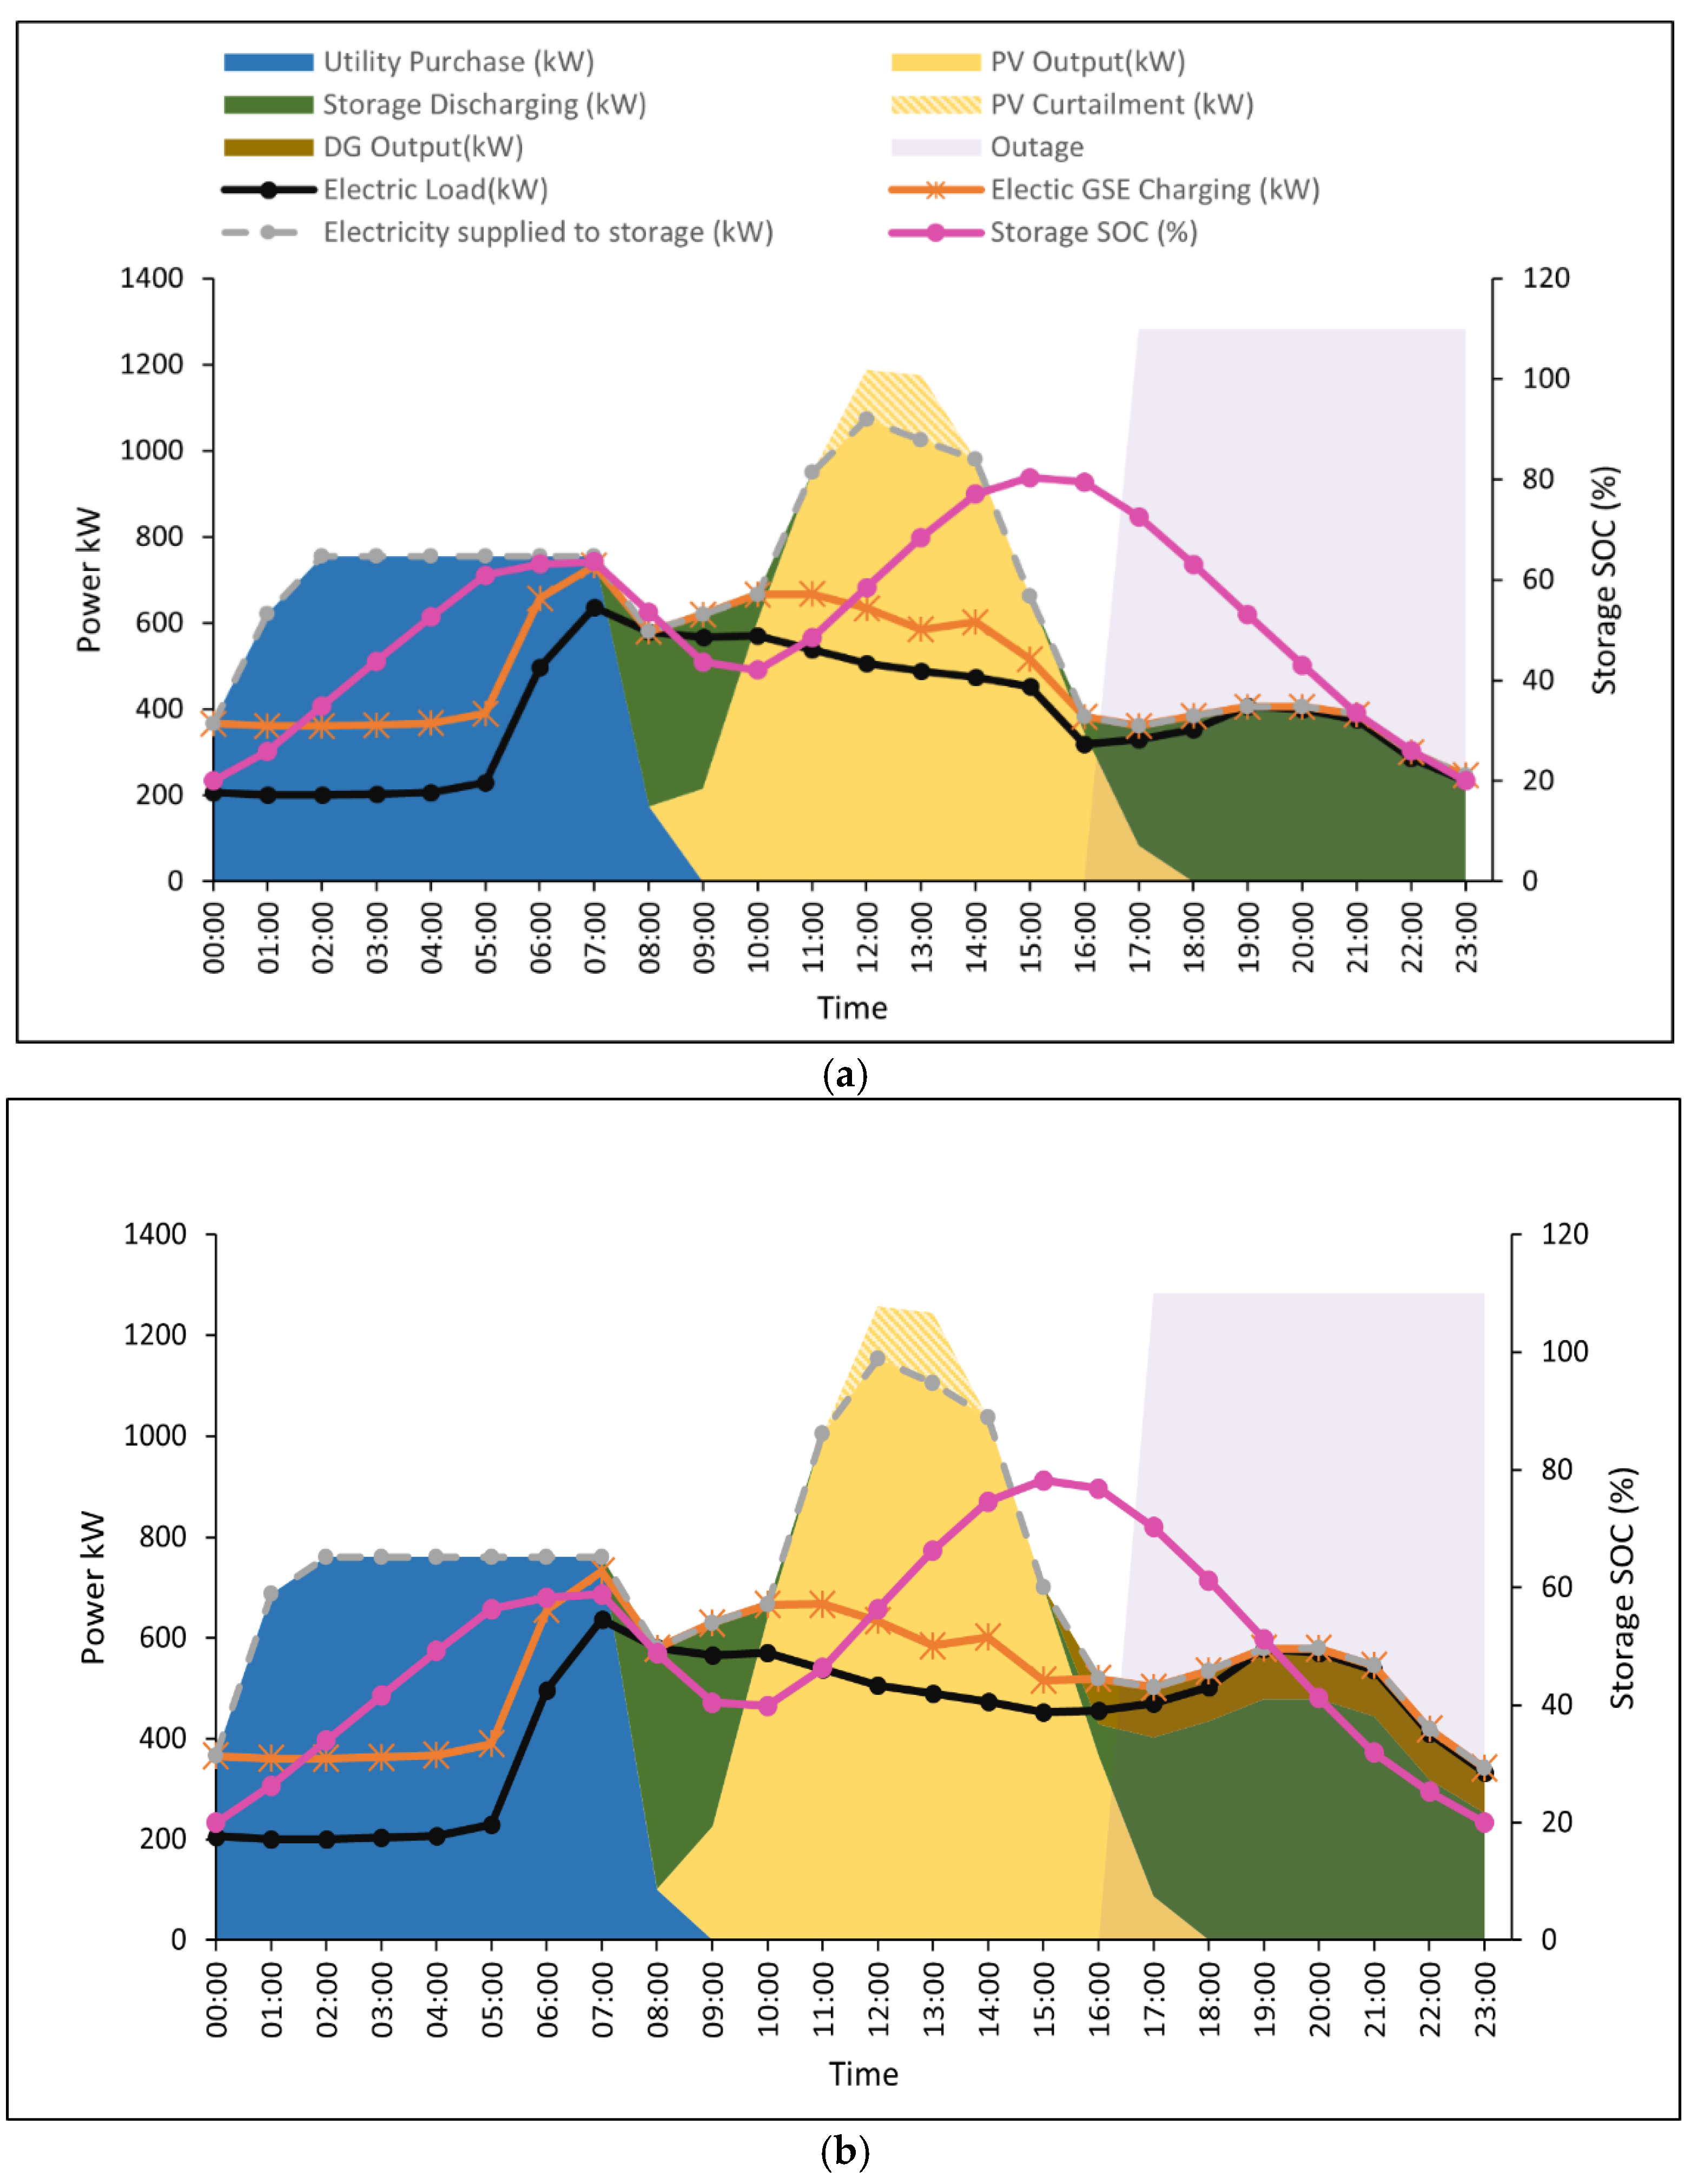
3.2. Scenario 2: Various Outages Criteria

Resilience consideration in microgrid design is affected by several factors, such as outage starting time, duration, date, and critical load level. In this particular case study, it was observed that the load has the same shape but changed in magnitude based on airport operating hours and season. Thus, two days representing peak and off-peak load seasons in February and May were used with three different outage starting times and three critical load levels, each with two outage duration. Twenty-four possible outage combinations were analyzed, and only significant results were discussed to avoid redundancy in the results. The key results of the full modeled outages are presented in Table 1. Note that each considered outage was treated separately and happened once in life, even on the same day.

3.2.1. Outages Starting Time

Exploring microgrids’ ability to withstand outages that start at various times is crucial, especially during high load plus low solar irradiance (HLLI) and low load plus high irradiance (LLHI) conditions. Airport load and solar data show that in February, the airport sees HLLI condition, while in May, LLHI condition is seen. During February, the microgrid provides both resilience benefits, and the annual operational cost (AOC) reduction varies from about 20% to 12% compared to BAU, as indicated in Table 1. Outage starting time slightly affects PV and storage system size in February under the same critical load level and duration. Whereas in May, the system size does not change. Figure 6 shows the power dispatch of different starting time outages occurring in February under 50% critical load requirement. In the cases when a power outage starts at 00:00–7:59 and 16:00–23:59, the critical load is primarily supplied by batteries. In contrast, the batteries supply load for 1 h at 8:00 before the presence of sunlight, and then the PV provides energy for both critical load and battery to charge in case of 8:00–15:59 outage time. In addition, the storage SOC in the case of 00:00–7:59 (Figure 6a) grid interruption is around 75% to provide enough power to the electrical load before reaching minimum SOC at the end of 8 h interruption. In the case of 8:00–15:59 and 16:00–23:59 (Figure 6b,c), the batteries’ SOC at the beginning of the day is at a minimum, which leaves an empty capacity to be charged using solar PV. The PV output curtailment level is variable based on outage and operation conditions, which need a proper management scheme. However, this study focused on enhancing resilience from an economic perspective only.

3.2.2. Critical Load Level

The critical load variation is another important factor that may change the microgrid characteristics during outages. The level of critical load may vary from time to time for several reasons, such as airport operation expansion, passenger number growth, etc. The microgrid resilience was tested under three critical load levels, which are 50%, 70%, and 100%. Please note that 100% critical load is unrealistic in real conditions; however, this study case was considered to show the relation between critical load level and microgrid resilience configuration and performance. As presented in Table 1, both PV and energy storage system sizes vary specifically during outages in February under different critical load levels for the same outage start time and duration. The PV size varies by about 400 kW, while the storage system difference is up to 1000 kWh. Moreover, a diesel generator would be required in the case of a 100% critical level to ensure continuous energy supply under the simulated outages. Integration of diesel generators results in lower AOC savings.
The system power dispatch under 70% and 100% critical load conditions of outage starting at 16:00 in February are depicted in Figure 7. Figure 6c presents a 50% critical load level. Figure 7 clearly indicates that the battery system fed the majority of the system load during an outage. A diesel generator operates at a near-full rated power of 100 kW over the whole outage period in case of a 100% critical load level. Batteries show the same charging and discharging behavior under the three modeled levels. The storage system starts the day at a minimum SOC level, and charges about 40% during the utility cheapest tariff to supply airport peak load at 8:00. The storage system’s maximum SOC in case of 50%, 70%, and 100% critical load levels reaches about 80% of rated capacity to ensure the storage system discharge enough energy to return to pre-outage SOC level because the end of day recharge dispatch strategy is applied. In addition, during daytime and prior to grid outage, the total load, including airport electrical load, electric ground support equipment, and batteries, is entirely supplied by solar PV. Thus, more cost saving is added by avoiding electricity purchase during high tariff hours. The diesel generator is only needed during unrealistic 100% critical load levels, which implies the benefits of using renewable energy resources to save cost and increase resiliency.

3.2.3. Outage Duration

In the real world, weather-related outages vary in duration and cannot be precisely predicted. This sub-scenario investigated the microgrid resilience enhancement cost to sustain different outage duration. The duration of a 24 h outage was considered alongside the earlier-discussed 8 h outages. The main observation was that the optimal resilience system configuration consists of a diesel generator under 24 h of a power outage for all different situations. Moreover, the PV and battery sizes change slightly in February and May when the outage duration changes. The change in outage duration reduces the airport AOC saving slightly. Figure 8 depicts power dispatch for 24 h outages and 50% critical load in February and May. In February, energy storage and diesel generator fed microgrid load until PV production started around 9:00. Due to the battery model’s maximum charging characteristic, the diesel generator supplies extra power with PV to keep constantly charging, as seen in hours 10:00 and 15:00–16:00. Whereas in May, PV and storage are capable of supplying energy through the day of outages. Batteries show the same charging and discharging cycle behavior.

3.3. Scenario 3: Solar PV Performance Changes

Renewable energy resources, including solar PV, have intermittent behavior related to weather conditions, which most likely match with weather-related outages. This scenario was introduced to investigate how the resilient microgrid is sized and dispatched during solar PV power output drop. A full-day outage for 50% critical load in February and May was examined under different solar fluctuation conditions. The solar PV power output was assumed to be dropping by 30, 50%, 80%, and 100% of the original levels. The extreme drop in solar level by 80% and 100% was introduced to represent high-impact rare events that can be simulated in different site locations. Table 2 summarizes the results of modeled PV performance changes.
Microgrid PV and storage sizes slightly decrease with the increase in solar irradiance drop. The integration of a diesel generator to support critical load increases when the PV drop level also increases. The system shows a positive annual cost saving in all simulated outages. The resilient system power dispatch under 50% and 80% of PV performance drooping levels is presented in Figure 9. In February and May, the diesel generator ran over the whole outage period. The generator serves microgrid load during the night, while during the daytime, it also provides power to support battery charging requirements. The battery provides more energy during the night with a lower solar drop level (Figure 9a,c), while less energy is supplied with a high drop level (Figure 9b,d). This indicates that receiving more power during an outage from a generator is more profitable than a battery system under a high level of PV output drop.

3.4. Scenario 4: Load Management Is Included

Microgrid resilience enhancement to avoid load curtailment during microgrid islanding usually increases the microgrid AOC compared to the optimal economic situation. Serving critical and non-critical loads economically via demand response (DR) during power outages were evaluated in this scenario. Unlike the previous scenarios where the load must be met regardless of the economic value, a value was assigned to each kWh based on the load criticality level. The monetary value of each unserved kWh in each level represents the value of losing demand in each level. The airport load was divided into three levels 30%, 20%, and 50%, presenting high critical, low critical, and non-critical loads, respectively. The values of curtailed load are presented in Appendix A [61,62]. The demand management impact was assessed in February for 24 h blackout. The optimal microgrid sizing according to monetary resilience valuation consists of 2639 kW PV and 4167 kWh energy storage. The total AOC is USD 1.0823 million, which results in a 21.8% reduction compared to BAU AOC of USD 1.383 million. The optimal microgrid dispatch is demonstrated in Figure 10.
The total curtailed load is 3481 kWh over 13 h, incurring a total curtailment cost of USD 4526. The shaded load is only a non-critical load where the cost of the unserved load is low. Moreover, the optimal dispatch considering DR has notable differences. As seen in Figure 10, between 11:00 and 15:00, the load was 100% supplied without curtailment due to high PV output. Moreover, between 00:00 and 5:00, the load was completely supplied by batteries where no curtailment was activated. After sunset, the load was supplied by batteries, where the greater part of the non-critical load is curtailed, which guarantees continuous supply for high and low critical loads. It is worth mentioning that the total curtailed load between hours 17 and 23 is much higher than curtailed load between hours 00:00 and 8:59. In addition, batteries have around 100% SOC before the blackout and continue to discharge power until solar starts producing power. Between 11:00 and 15:00, batteries charge again where SOC reaches around 65% to supply critical loads after sunset.

3.5. Analysis of the Results

The results obtained in the above-simulated outages clearly show that a hybrid renewable-based microgrid is capable of sustaining different outage situations for all scenarios. The system’s optimal sizing and dispatching are more related to outage duration and critical load level. The outage starting time implies a small variation in terms of system component sizing. Moreover, system component sizes remain unchanged in low-load conditions. It was observed that the same system that can sustain an outage from 00:00 to 7:59 for 50% critical load in February is able to withstand 8 h blackout in May, no matter outage starting time or critical load level. When comparing scenarios 3.2.1, 3.2.2, and 3.2.3, it was found that all systems ended AOC saving that mainly decreased when the critical load level increased, and the outage duration was long due to the diesel generator purchase and fuel cost. Diesel generator integration with PV and batteries is necessary only during long period outages where PV plus batteries only can provide energy during short time outages (8 h).
In normal operation, energy storages provide demand saving when utility tariff is high (Figure 6b,c) and contribute during grid interruption, especially at night, to meet critical load levels (Figure 6a and Figure 8b). This results in a less or zero capacity of diesel generator, which increases the size of PV even if it has a higher purchase cost than a diesel generator. In contrast, when the PV output level drops (scenario 3), the system compensates for the deficiency by integrating a larger diesel generator size. Consequently, the system AOC is increasing, which implies lower savings during a high solar performance drop. In all scenarios, PV generates power larger than the critical demand level except when the PV output drop is high, entirely in February (Figure 9b) and partially in May (Figure 9d).
Adding an economic value to resilience improves the system in terms of energy dispatch; the system’s critical and non-critical loads are served when PV output is high rather than curtailed. When comparing scenario 4 and scenario 2, the resilient system with consideration of DR can sustain the 24 h outage without integration of the diesel generator, which results in higher AOC savings. In scenario 2, the system has a higher outage survivability chance thanks to the diesel generator since it is designed to meet a specified load while providing any premium cost compared to economic resilience in scenario 4.

4. Conclusions

In this work, a techno–economic hybrid optimization approach was used to optimize a grid-connected critical infrastructure microgrid considering resilience to grid interruptions. The proposed model was solved by using a MILP model that aims to minimize the operation cost of microgrids subjected to various constraints. Seve Ballesteros–Santander airport was considered as a case study with a microgrid consisting of solar PV, batteries, and diesel generators. Airport electric ground support equipment was also considered an additional load. Different outage situations were modeled to study the ability of microgrids to supply critical loads in the event of grid outages. All systems configurations provided an annual operation cost saving and resilience benefits. The obtained savings vary based on outage characteristics, which can be up to 22%. From the research that was carried out, it is possible to conclude that the PV plus batteries could support the critical load without the need for a diesel generator for short outages. However, for longer outages in this study’s 24 h blackout, the implementation of a backup diesel generator was crucial to guarantee continuous power supply. The proposed procedure can be employed by decision-makers, airport owners, and operators considering microgrids in their sustainability plans in terms of energy resilience enhancement. Since microgrid sizing and dispatching are related to outage duration and level of critical load, as shown in this study, it is recommended to carry out the analysis with actual critical load data to obtain results aligned with real data. Moreover, considering non-electrical loads such as thermal loads and additional electrical loads, for example, EVs charged in airport parking spaces or bus shuttles, may reduce microgrid AOC saving. Finally, future work could also be extended to include various operational constraints and power flow analysis and to look at the economic benefits of using resilient microgrids to provide various ancillary services.

Author Contributions

Conceptualization, M.A. and L.C.; methodology, M.A.; software, M.A.; validation, M.A.; formal analysis, M.A.; investigation, M.A. and L.C.; resources, M.A.; data curation, M.A.; writing—original draft preparation, M.A.; writing—review and editing, L.C.; visualization, M.A.; supervision, L.C.; project administration, L.C. All authors have read and agreed to the published version of the manuscript.

Funding

The Open Access (OA) charges of this work have been funded by the Cardiff University Institutional OA Fund: 2022-OA-0773.

Data Availability Statement

The data presented in this study are available in Appendix A.

Acknowledgments

We are grateful for support from the Decarbonising Transport through Electrification (DTE) Network+ funded by the Engineering and Physical Sciences Research Council (EPSRC), grant reference EP/S032053/1. The corresponding author would like to thank Northern Border University, Saudi Arabia, for sponsoring his postgraduate study at Cardiff University, UK. The authors would like to thank XENDEE supporting team for giving them the opportunity to access the simulation platform.

Conflicts of Interest

The authors declare no conflict of interest.

Nomenclature

Indices and Sets
m M Set of months
d D Set of day type, D = {peak, week, weekend}
h H Set of hours
p P Set of tariff demand period
g G Set of diesel generators
k K Set of renewable, K = {PV, Batteries}
t T Set of all technologies, T = G K
p r P R Set of demand priority, PR = {high critical, low critical, non-critical}
Decision Variables
U m , d , h Grid purchased energy
P u r c h N u m g Number of purchased diesel generators
C a p C o n t k Capacity of purchased technologies of type k
P m , d , h , t Energy provided by technology t
F P m , d , h Purchased fuel
S m , d , h , t Exported energy by technology t
D C m , d , h , p r Curtailed demand of level p r
L m , d , h Energy demand
K m , d , h , t Supplied energy to batteries
Parameters
U f i x m Utility fixed monthly cost
V u t i l m , d , h Utility energy tariff
N D m , d Number of days in month m
C d e m p Demand price
C a p G e n g Capacity of diesel generator
S C m Utility standby charge
F O M g Annual O & M cost of generator
F O M k Annual O & M cost of PV & ESS
I c a p g Capital cost per unit
A N N t Annualized investment rate
V f u e l m , d , h Fuel price
P x m , d , h Energy sellback price
V o l l p r   Price of curtailed energy
I n t R a t e Investment interest rate
l i f e t i m e t Technology lifetime
A m , d , h Grid availability 0 , 1
P V n o r m m , d , h PV normalized performance
P V C a p PV capacity
E S S c a p Storage capacity
c h r   a n d   d i s Charging and discharging rate
E S S i n Storage electricity input
E S S o u t Storage electricity output

Appendix A. Simulated Model Inputs and Assumptions

Site Characteristics
Airport locationSantander, Cantabria, Spain
Latitude43.42283
Longitude−3.81866
End-use profileElectricity-Only, borrowed from [53]
Annual Usage3 GWh
Financial Parameters
Interest Rate6%
Reporting Years25
Incentives (storage and generators)N/A
Electric GSE Charging Station Parameters
Load shapesimulated
Rating154 kW
Efficiency96%
Total Available Charging Energy2536 kWh
Daily energy need2000 kWh
Solar PV System
Purchase cost1600 USD/kWdc
O & M cost16 USD/kWdc/year
Lifetime25 years
Available space90,000 m2
Panel Technology Typestandard
Array TypeFixed ground-mounted
MACRS Incentives5
Amount Depreciable100%
Efficiency15%
System Losses14%
Inverter Efficiency96%
Tilt Angle10 degrees
PointingSouth
source data5.2 km away (43.47, −3.81)
Energy Storage
Purchase cost420 USD/kWh
Inverter cost840 USD/kW
O & M cost10 USD/kWh/year
Lifetime10 years
Max SOC100%
Min SOC20%
Emergency min SOC20%
Charging Efficiency96%
Continuous charging rate0.1
Discharge Efficiency96%
Continuous discharging rate0.1
Charge From Utilityallowed
MACRS Incentives7 years
Amount Depreciable100%
Diesel Generator
Purchase cost500 USD/kW
O & M10 USD/kW/year
Lifetime15
Efficiency30%
Fuel price0.8 USD/L
Fuel annual limit2500 L
Ramp up rate0.5 %/min
Ramp down rate0.5 %/min
Curtailment Cost—Scenario 4
High critical (30%)39.7 USD/kWh
Low critical (20%)12.7 USD/kWh
Non-critical (50%)1.3 USD/kWh

References

  1. Moreno, R.; Trakas, D.N.; Jamieson, M.; Panteli, M.; Mancarella, P.; Strbac, G.; Marnay, C.; Hatziargyriou, N. Microgrids against Wildfires: Distributed Energy Resources Enhance System Resilience. IEEE Power Energy Mag. 2022, 20, 78–89. [Google Scholar] [CrossRef]
  2. Gholami, A.; Aminifar, F.; Shahidehpour, M. Front Lines Against the Darkness: Enhancing the Resilience of the Electricity Grid Through Microgrid Facilities. IEEE Electrif. Mag. 2016, 4, 18–24. [Google Scholar] [CrossRef]
  3. NREL. Distributed Solar PV for Electricity System Resiliency: Policy and Regulatory Considerations. Available online: https://www.nrel.gov/docs/fy15osti/62631.pdf (accessed on 16 January 2022).
  4. Kenward, A.; Raja, U. Blackout: Extreme Weather, Climate Change and Power Outages. Available online: http://assets.climatecentral.org/pdfs/PowerOutages.pdf (accessed on 21 February 2022).
  5. Hussain, A.; Bui, V.-H.; Kim, H.-M. Microgrids as a resilience resource and strategies used by microgrids for enhancing resilience. Appl. Energy 2019, 240, 56–72. [Google Scholar] [CrossRef]
  6. Amirioun, M.H.; Aminifar, F.; Lesani, H.; Shahidehpour, M. Metrics and quantitative framework for assessing microgrid resilience against windstorms. Int. J. Electr. Power Energy Syst. 2019, 104, 716–723. [Google Scholar] [CrossRef]
  7. Li, Z.; Shahidehpour, M.; Aminifar, F.; Alabdulwahab, A.; Al-Turki, Y. Networked Microgrids for Enhancing the Power System Resilience. Proc. IEEE 2017, 105, 1289–1310. [Google Scholar] [CrossRef]
  8. Kosai, S.; Cravioto, J. Resilience of standalone hybrid renewable energy systems: The role of storage capacity. Energy 2020, 196, 117133. [Google Scholar] [CrossRef]
  9. Hussain, A.; Bui, V.-H.; Kim, H.-M. Resilience-Oriented Optimal Operation of Networked Hybrid Microgrids. IEEE Trans. Smart Grid 2019, 10, 204–215. [Google Scholar] [CrossRef]
  10. Bie, Z.; Lin, Y.; Li, G.; Li, F. Battling the Extreme: A Study on the Power System Resilience. Proc. IEEE 2017, 105, 1253–1266. [Google Scholar] [CrossRef]
  11. Tan, S.; Wu, Y.; Xie, P.; Guerrero, J.M.; Vasquez, J.C.; Abusorrah, A. New Challenges in the Design of Microgrid Systems: Communication Networks, Cyberattacks, and Resilience. IEEE Electrif. Mag. 2020, 8, 98–106. [Google Scholar] [CrossRef]
  12. Anderson, K.H.; DiOrio, N.A.; Cutler, D.S.; Butt, R.S. Increasing Resiliency Through Renewable Energy Microgrids. Available online: https://www.osti.gov/biblio/1389210 (accessed on 16 January 2022).
  13. Younesi, A.; Shayeghi, H.; Siano, P.; Safari, A.; Alhelou, H.H. Enhancing the Resilience of Operational Microgrids Through a Two-Stage Scheduling Strategy Considering the Impact of Uncertainties. IEEE Access 2021, 9, 18454–18464. [Google Scholar] [CrossRef]
  14. Rosales-Asensio, E.; Simón-Martín, M.; Rosales, A.-E.; Colmenar-Santos, A. Solar-plus-storage benefits for end-users placed at radial and meshed grids: An economic and resiliency analysis. Int. J. Electr. Power Energy Syst. 2021, 128, 106675. [Google Scholar] [CrossRef]
  15. Kandaperumal, G.; Srivastava, A.K. Resilience of the electric distribution systems: Concepts, classification, assessment, challenges, and research needs. IET Smart Grid 2020, 3, 133–143. [Google Scholar] [CrossRef]
  16. Große, C. Airports as Critical Infrastructure: The Role of the Transportation-by-Air System for Regional Development and Crisis Management. In Proceedings of the 2019 IEEE International Conference on Industrial Engineering and Engineering Management (IEEM), Macao, China, 15–18 December 2019; pp. 440–444. [Google Scholar] [CrossRef]
  17. Ganji, M. Airport Microgrids: Transportation Energy as a Service. IEEE Electrif. Mag. 2020, 8, 121–124. [Google Scholar] [CrossRef]
  18. CNN. Atlanta’s Hartsfield-Jackson Airport Restores Power after Crippling Outage. Available online: https://edition.cnn.com/2017/12/17/us/atlanta-airport-power-outage/index (accessed on 11 January 2022).
  19. CNN Money. Delta’s Big Headache-Day 2. Available online: https://money.cnn.com/2016/08/09/news/companies/delta-flights-system-outage-delays-cancellations/index.html?iid=EL (accessed on 11 January 2022).
  20. CNN Money. Delta: 5-Hour Computer Outage Cost Us $150 Million. Available online: https://money.cnn.com/2016/09/07/technology/delta-computer-outage-cost (accessed on 11 January 2022).
  21. Panteli, M.; Mancarella, P.; Trakas, D.N.; Kyriakides, E.; Hatziargyriou, N.D. Metrics and Quantification of Operational and Infrastructure Resilience in Power Systems. IEEE Trans. Power Syst. 2017, 32, 4732–4742. [Google Scholar] [CrossRef] [Green Version]
  22. Mousavizadeh, S.; Haghifam, M.-R.; Shariatkhah, M.-H. A linear two-stage method for resiliency analysis in distribution systems considering renewable energy and demand response resources. Appl. Energy 2018, 211, 443–460. [Google Scholar] [CrossRef]
  23. Panteli, M.; Pickering, C.; Wilkinson, S.; Dawson, R.; Mancarella, P. Power System Resilience to Extreme Weather: Fragility Modeling, Probabilistic Impact Assessment, and Adaptation Measures. IEEE Trans. Power Syst. 2017, 32, 3747–3757. [Google Scholar] [CrossRef] [Green Version]
  24. Wang, Y.; Chen, C.; Wang, J.; Baldick, R. Research on Resilience of Power Systems Under Natural Disasters—A Review. IEEE Trans. Power Syst. 2016, 31, 1604–1613. [Google Scholar] [CrossRef]
  25. Sellberg, M.M.; Ryan, P.; Borgström, S.T.; Norström, A.V.; Peterson, G.D. From resilience thinking to Resilience Planning: Lessons from practice. J. Environ. Manage. 2018, 217, 906–918. [Google Scholar] [CrossRef]
  26. Najafi, J.; Peiravi, A.; Guerrero, J.M. Power distribution system improvement planning under hurricanes based on a new resilience index. Sustain. Cities Soc. 2018, 39, 592–604. [Google Scholar] [CrossRef]
  27. Zhao, Y.; Lin, Z.; Ding, Y.; Liu, Y.; Sun, L. Yan, Y. A Model Predictive Control Based Generator Start-Up Optimization Strategy for Restoration With Microgrids as Black-Start Resources. IEEE Trans. Power Syst. 2018, 33, 7189–7203. [Google Scholar] [CrossRef]
  28. Anderson, K.; Laws, N.D.; Marr, S.; Lisell, L.; Jimenez, T.; Case, T.; Li, X.; Lohmann, D.; Cutler, D. Quantifying and Monetizing Renewable Energy Resiliency. Sustainability 2018, 10, 933. [Google Scholar] [CrossRef] [Green Version]
  29. Masrur, H.; Sharifi, A.; Islam, M.R.; Hossain, M.A.; Senjyu, T. Optimal and economic operation of microgrids to leverage resilience benefits during grid outages. Int. J. Electr. Power Energy Syst. 2021, 132, 107137. [Google Scholar] [CrossRef]
  30. NY Solar Smart. Resilient Solar Photovoltaics (PV) Systems. Available online: https://nysolarmap.com/media/1451/dechardwarefactsheet.pdf (accessed on 12 January 2022).
  31. Princeton University. Microgrid|Facilities. Available online: https://facilities.princeton.edu/node/1486 (accessed on 12 January 2022).
  32. Elkadeem, M.R.; Wang, S.; Azmy, A.M.; Atiya, E.G.; Ullah, Z.; Sharshir, S.W. A systematic decision-making approach for planning and assessment of hybrid renewable energy-based microgrid with techno-economic optimization: A case study on an urban community in Egypt. Sustain. Cities Soc. 2020, 54, 102013. [Google Scholar] [CrossRef]
  33. Veilleux, G.; Potisat, T.; Pezim, D.; Ribback, C.; Ling, J.; Krysztofiński, A.; Ahmed, A.; Papenheim, J.; Pineda, A.M.; Sembian, S.; et al. Techno-economic analysis of microgrid projects for rural electrification: A systematic approach to the redesign of Koh Jik off-grid case study. Energy Sustain. Dev. 2020, 54, 1–13. [Google Scholar] [CrossRef]
  34. Nazemi, S.D.; Mahani, K.; Ghofrani, A.; Amini, M.; Kose, B.E.; Jafari, M.A. Techno-Economic Analysis and Optimization of a Microgrid Considering Demand-Side Management. In Proceedings of the 2020 IEEE Texas Power and Energy Conference (TPEC), College Station, TX, USA, 6–7 February 2020; pp. 1–6. [Google Scholar] [CrossRef] [Green Version]
  35. Nwulu, N.I.; Xia, X. Optimal dispatch for a microgrid incorporating renewables and demand response. Renew. Energy 2017, 101, 16–28. [Google Scholar] [CrossRef]
  36. Gamarra, C.; Guerrero, J.M. Computational optimization techniques applied to microgrids planning: A review. Renew. Sustain. Energy Rev. 2015, 48, 413–424. [Google Scholar] [CrossRef] [Green Version]
  37. Nelson, J.; Johnson, N.G.; Fahy, K.; Hansen, T.A. Statistical development of microgrid resilience during islanding operations. Appl. Energy 2020, 279, 115724. [Google Scholar] [CrossRef]
  38. Peterson, C.J.; Van Bossuyt, D.L.; Giachetti, R.E.; Oriti, G. Analyzing mission impact of military installations microgrid for resilience. Systems 2021, 9, 69. [Google Scholar] [CrossRef]
  39. Zhou, Q.; Shahidehpour, M.; Alabdulwahab, A.; Abusorrah, A.; Che, L.; Liu, X. Cross-Layer Distributed Control Strategy for Cyber Resilient Microgrids. IEEE Trans. Smart Grid 2021, 12, 3705–3717. [Google Scholar] [CrossRef]
  40. Zhou, L.; Chen, Z. Measuring the performance of airport resilience to severe weather events. Transp. Res. D Transp. Environ. 2020, 83, 102362. [Google Scholar] [CrossRef]
  41. Chan, R.; Schofer, J.L. Measuring Transportation System Resilience: Response of Rail Transit to Weather Disruptions. Nat. Hazards Rev. 2016, 17, 05015004. [Google Scholar] [CrossRef]
  42. Faturechi, R.; Levenberg, E.; Miller-Hooks, E. Evaluating and optimizing resilience of airport pavement networks. Comput. Oper. Res. 2014, 43, 335–348. [Google Scholar] [CrossRef] [Green Version]
  43. IEA. Spain-Countries & Regions-IEA. Available online: https://www.iea.org/countries/spain (accessed on 2 November 2021).
  44. Aena. Environmental Sustainability Report 2019. Available online: https://portal.aena.es/es/corporativa/informe-sostenibilidad-ambiental.html (accessed on 22 February 2022).
  45. Aena. Air Traffic Statistics. Available online: https://www.aena.es/es/estadisticas/inicio.html?_ga=2.196932394.721520391.1642376084-995102931.1629985337 (accessed on 16 January 2022).
  46. XENDEE. Microgrid Design and Decision Support Platform. Available online: https://xendee.com (accessed on 16 January 2022).
  47. XENDEE. US Army Garrison Bavaria Selects XENDEE for Design of Resilient Microgrids in Garmisch - XENDEE Microgrid Operating System Software. Available online: https://xendee.com/2019/12/18/us-army-garrison-bavaria/ (accessed on 16 January 2022).
  48. XENDEE. Recent Project Portfolio-XENDEE Microgrid Operating System Software. Available online: https://xendee.com/projects/ (accessed on 16 January 2022).
  49. Pecenak, Z.K.; Stadler, M.; Mathiesen, P.; Fahy, K.; Kleissl, J. Robust design of microgrids using a hybrid minimum investment optimization. Appl. Energy 2020, 276, 115400. [Google Scholar] [CrossRef]
  50. Pecenak, Z.K.; Stadler, M.; Fahy, K. Efficient multi-year economic energy planning in microgrids. Appl. Energy 2019, 255, 113771. [Google Scholar] [CrossRef]
  51. Schittekatte, T.; Stadler, M.; Cardoso, G.; Mashayekh, S.; Sankar, N. The impact of short-term stochastic variability in solar irradiance on optimal microgrid design. IEEE Trans. Smart Grid 2018, 9, 1647–1656. [Google Scholar] [CrossRef] [Green Version]
  52. Mashayekh, S.; Stadler, M.; Cardoso, G.; Heleno, M. A mixed integer linear programming approach for optimal DER portfolio, sizing, and placement in multi-energy microgrids. Appl. Energy 2017, 187, 154–168. [Google Scholar] [CrossRef] [Green Version]
  53. Ortega Alba, S.; Manana, M. Characterization and Analysis of Energy Demand Patterns in Airports. Energies 2017, 10, 119. [Google Scholar] [CrossRef] [Green Version]
  54. Endesa. Óptima Rate for Companies. Available online: https://www.endesa.com/en/companies/electricity/optimum-rate (accessed on 17 January 2022).
  55. Dobos, A.P. PVWatts Version 5 Manual. Available online: https://www.osti.gov/biblio/1158421 (accessed on 19 January 2022). [CrossRef]
  56. Tao, Y.-J.; Lee, H.-S.; Tu, C.-S. Analytic Hierarchy Process-Based Airport Ground Handling Equipment Purchase Decision Model. Sustainability 2021, 13, 2540. [Google Scholar] [CrossRef]
  57. NREL. Electric Ground Support Equipment at Airports. Available online: https://afdc.energy.gov/files/u/publication/egse_airports.pdf (accessed on 25 January 2022).
  58. EPRI & Southern Company. Electrification of an Airport Lower Deck Container Loader. Available online: https://www.epri.com/research/products/000000000001020484 (accessed on 19 January 2022).
  59. Trepel. Manufacturer of Cargo High Loaders and Aircraft Tractors. Available online: https://trepel.com/ (accessed on 19 January 2022).
  60. Aena. Seve Ballesteros-Santander. Available online: https://www.aena.es/en/seve-ballesteros-santander.html (accessed on 19 January 2022).
  61. Sullivan, M.; Collins, M.T.; Schellenberg, J.; Larsen, P.H. Estimating Power System Interruption Costs: A Guidebook for Electric Utilities. Available online: https://www.osti.gov/biblio/1462980 (accessed on 25 February 2022). [CrossRef] [Green Version]
  62. Baik, S.; Sanstad, A.H.; Hanus, N.; Eto, J.H.; Larsen, P.H. A hybrid approach to estimating the economic value of power system resilience. Electr. J. 2021, 34, 107013. [Google Scholar] [CrossRef]
Figure 1. Airport average monthly load demand.
Energies 15 08040 g001
Figure 2. Utility Tariff. P1–P6 represent the energy and demand time-of-use tariff rates.
Energies 15 08040 g002
Figure 3. Average solar PV performance per month.
Energies 15 08040 g003
Figure 4. Electric GSE charging probability.
Energies 15 08040 g004
Figure 5. Microgrid energy dispatch during normal operation. (a) February month; (b) May month.
Energies 15 08040 g005
Figure 6. Power dispatch of microgrid DERs under 50% critical load level in February for 8 h starting at (a) 00:00–7:59, (b) 8:00–15:59, and (c) 16:00–23:59.
Energies 15 08040 g006aEnergies 15 08040 g006b
Figure 7. Energy dispatch of DERs during 8 h outage starting at 16:00 in February under (a) 70% and (b) 100% critical load levels.
Energies 15 08040 g007
Figure 8. Power dispatch during 24 h outage under 50% criticality level in (a) February and (b) May.
Energies 15 08040 g008
Figure 9. Optimal power dispatch strategies during power outage in February with (a) 50%, (b) 80%, and in May with (c) 50% and (d) 80% solar performance drop levels.
Energies 15 08040 g009aEnergies 15 08040 g009b
Figure 10. Energy dispatch of microgrid considering economic value of resilience.
Energies 15 08040 g010
Table 1. Key results of scenario 2: optimal system configuration to meet resilience needs.
February
Critical Load Level50%70%100%
DurationShortLongShortLongShortLong
Starting TimeT1T2T3T4T1T2T3T4T1T2T3T4
PV (kW)248325022488265427322649264926812829283428032739
Batteries (kWh)360436753625424646454219422243475073509349904520
Diesel generators000120000200160100100320
BAU AOC (USD thousand)1383.3
Optimized AOC (USD thousand)1080.91079.41079.11085.91083.31079.91079.81091.61094.91089.71089.21100.4
Reduction (%)21.922.02221.521.721.921.921.120.821.221.320.4
May
Critical Load Level50%70%100%
DurationShortLongShortLongShortLong
Starting TimeT1T2T3T4T1T2T3T4T1T2T3T4
PV (kW)248324832483257724832483248325742483248325792700
Batteries (kWh)360436043604388536043604360438853604360439484383
Diesel generators000000040000100
BAU AOC (USD thousand)1383.3
Optimized AOC (USD thousand)1080.91080.41080.41082.210811080.61080.61086.21081.31080.91081.11092.60
Reduction (%)21.921.921.921.821.921.921.921.521.821.921.821
T1 = 00:00–7:59; T2 = 8:00–15:59; T3 = 16:00–23:59; T4 = 00:00–23:59; Short = 8 h; Long = 24 h.
Table 2. Microgrid sizing and economic results for scenario 3.
FebruaryMay
Drop level30%50%80%100%30%50%80%100%
PV (kW)27262655248324772576277024802469
Batteries (kWh)44754241360435863937460635963554
Diesel generators1401802603202060180240
BAU AOC (USD thousand)1383.3
Optimized AOC (USD thousand)1088.21090.21094.91098.901080.81085.71091.41095.5
Reduction (%)21.321.220.920.621.921.521.120.8
Publisher’s Note: MDPI stays neutral with regard to jurisdictional claims in published maps and institutional affiliations.

