Abstract
This work aims to investigate the effect of process temperature and catalyst content by pyrolysis and thermal catalytic cracking of (organic matter + paper) fraction from municipal household solid waste (MHSW) on the yields of reaction products (bio-oil, bio-char, H2O, and gas), acid value, chemical composition of bio-oils, and characterization of bio-chars in laboratory scale. The collecting sectors of MHSW in the municipality of Belém-Pará-Brazil were chosen based on geographic and socio-economic database. The MHSW collected and transported to the segregation area. The gravimetric analysis of MHSW was carried out and the fractions (Paper, Cardboard, Tetra Pack, Hard Plastic, Soft Plastic, Metal, Glass, Organic Matter, and Inert) were separated. The selected organic matter and paper were submitted to pre-treatment of crushing, drying, and sieving. The experiments carried out at 400, 450, and 475 °C and 1.0 atmosphere, and at 475 °C and 1.0 atmosphere, using 5.0, 10.0, and 15.0% (wt.) Ca(OH)2, in batch mode. The bio-oil was characterized for acid value. The chemical functions present in bio-oil were identified by FT-IR and the composition was identified by GC-MS. The bio-char was characterized by SEM, FT-IR, and XRD. The variance in mass (wt.%) for organic fractions of municipal household solid waste (OFMHSW), between 56.21 and 67.45% (wt.), lies with the interval of 56% (wt.) and 64% (wt.) of OFMHSW for middle- and low-income countries. The pyrolysis of MHSW fraction (organic matter + paper) shows bio-oil yields between 2.63 and 9.41% (wt.), aqueous phase yields between 28.58 and 35.08% (wt.), solid phase yields between 35.29 and 45.75% (wt.), and gas yields between 16.54 and 26.72% (wt.). The bio-oil yield increases with pyrolysis temperature. For the catalytic cracking, the bio-oil and gas yields increase slightly with CaO content, while that of bio-char decreases, and the H2O phase remains constant. The GC-MS of liquid reaction products identified the presence of hydrocarbons (alkanes, alkenes, alkynes, cycloalkanes, and aromatics) and oxygenates (carboxylic acids, ketones, esters, alcohols, phenols, and aldehydes), as well as compounds containing nitrogen, including amides and amines. The acidity of bio-oil decreases with increasing process temperature and with aid Ca(OH)2 as a catalyst. The concentration of hydrocarbons in bio-oil increases with increasing Ca(OH)2-to-OFMHSW fraction ratio due to the catalytic deoxygenation of fatty acid molecules, by means of decarboxylation/decarbonylation, producing aliphatic and aromatic hydrocarbons.
1. Introduction
In a global consumer society, while the production of household solid wastes has been increasing in recent years [1], the disposal of municipal household solid wastes (MHSW) poses a global challenge for medium and large cities as it involves complex logistics, safety, environment, and energetic aspects for its adequate management [2], not only for high-income countries but particularly for medium- and low-income countries [3,4,5].
Among the technologies available for proper treatment and transformation of municipal household solid wastes (MHSW), including biological, physicochemical, and thermal treatment [6,7], pyrolysis has great potential not only for the thermochemical transformation of MHSW fractions such as residual biomass [8], thermoplastic polymers [9], plastics (hard, soft) [10,11], cardboard [12,13], recycled paper [14], non-recycled paper [15], and organic matter [16,17], but also for MSW [18,19,20,21,22,23,24,25,26,27,28,29], and the literature reports numerous studies on the subject [6,7,8,9,10,11,12,13,14,15,16,17,18,19,20,21,22,23,24,25,26,27,28,29]. The advantages of pyrolysis over bioprocess and other thermochemical processes include the production of liquid-like and charcoal-like fuels, a solid phase with adsorbent properties, generation of non-condensable gases with combustion properties, and the process operating at moderate temperature ambient pressure [8,9,21,22,26,27].
Among the catalysts applied by the pyrolysis of MHSW fractions (residual biomass, thermoplastic polymers, plastics (hard, soft), cardboard, recycled paper, non-recycled paper, organic matter. Etc.) and MSHW, the most used were zeolite [18,22], Kaolin [21,22], HZSM-5 [10,26,27], FCC [26,27], Y-zeolite [26,27], β-zeolite [26,27], Al(OH)3 [26,27], Ni-Mo [26,27], MoO3 [26,27], ZSM-5 [10], NH4ZSM-5 [10], CaO [24,28], ZnO [30], Fe2O3 [30], CuO [30], Al2O3 [30], calcined calcite (CaO) [31], and calcined dolomite (MgO.CaO) [18,31].
The state of art, progress, new trends, and tendencies on pyrolysis and catalytic cracking of OFMHSW and MHSW were described in detail in the excellent reviews of Hasan et al. [25], Chen et al. [32], Sipra et al. [33], and Lu et al. [34]. In addition, the studies/investigations focused on the yields of reaction products [5,12,13,17,18,19], bio-char characterization [5,15,16,17,27,31], bio-oil properties and composition [11,12,17,19,21,22,23,24,25,26,27,28], composition of the gaseous phase [12,13,18,20,23,24,26,28,31], reaction kinetics [10,12,13,14,15,16,19,30,31], as well as the reaction mechanism/pathway [17]. The techno-economic and life cycle assessment of MHSW pyrolysis has been also investigated in recent years [35,36,37,38,39,40,41,42].
The pyrolysis and catalytic cracking of OFMHSW and MHSW have been carried out by flash pyrolysis [10,16,28,31], as well as by vacuum pyrolysis [19], fixed bed reactors [5,12,13,14,15,17,18,19,21,22,23,24,26,27], and fluidized bed reactors [20], and the experiments were performed on micro [15], laboratory [10,12,13,14,16,17,18,19,20,21,22,23,24,26,27,28,30,31], and pilot scales [5,8]. The processes operated in batch [5,10,12,13,14,15,16,17,18,19,21,22,23,24,26,27,28,30,31] and continuous modes [20,23], and only one study operated as a two-stage reactor [31].
The reaction products by pyrolysis and thermal catalytic cracking of MHSW fractions (residual biomass, thermoplastic polymers, plastics (hard, soft), cardboard, recycled paper, non-recycled paper, and organic matter) [8,9,10,11,12,13,14,15,16,17], and MSHW [18,19,20,21,22,23,24,25,26,27,28,29,31], includes a bio-oil, an aqueous acid phase, a gaseous phase, and a solid phase (bio-char) [8,9,11,12,13,16,17,18,19,20,21,22,23,24,26,27,28,29,31].
The pyrolysis bio-oils from MHSW fractions and MHSW were physicochemically characterized for density [8,9,19,21,22], kinematic viscosity [8,9,19,21,22], flash point [19,21,22], pour point [19,22], water content [19,21,22], oil content [19,21,22], solids content [21,22], ash content [19], sulfur content [19], nitrogen content [19], cetane/octane number [21,22], HHV [19], acid value [8,19], refractive index [9], and pH [19].
The bio-oil obtained by pyrolysis and catalytic cracking of MHSW fractions and MSHW were composed by alkanes, alkenes, ring-containing alkanes, ring-containing alkenes, cycle-alkanes, cycle-alkenes, aromatics, and oxygenates, including phenols, aldehydes, ketones, sugars, amines, amides, ethers, esters, and alcohols [8,11,12,17,19,21,22,23,24,25,26,27,28].
Beyond the operating mode (batch, continuous), type of pyrolysis process (flash and slow pyrolysis, and vacuum pyrolysis), type of reactors (fixed bed reactors and fluidized bed reactors), as well as process schema (two-stage reactor), other process parameters/variables that may affect the yields and quality of bio-oil by pyrolysis, and catalytic cracking of MHSW fractions and MSHW are temperature [12,13,14,15,16,18,19,23,24,26,27,30,31], catalyst-to-MHSW [28], and characteristics of feed material [5,12,13,14,15,28].
Despite some studies focusing the effect of temperature and catalyst-to-MHSW ratio on the yield and chemical composition of bio-oil produced by pyrolysis and catalytic cracking of MHSW fractions and MSHW performed in micro [15], laboratory [10,12,13,14,16,17,18,19,20,21,22,23,24,26,27,28,30,31], and pilot scales [5,8], until the moment, no systematic study has investigated the effect of temperature and catalyst-to-MHSW/fraction ratio on the bio-char morphology and crystalline structure, as well as on the yield of reaction products, chemical composition, and acidity of bio-oils obtained by pyrolysis and catalytic cracking of (organic matter + paper) fractions from MHSW fractions in a laboratory scale with Ca(OH)2 as a catalyst.
The objective of this work was to systematically investigate the effect of temperature and catalyst-to-MHSW/fraction ratio (0.05, 0.10, 0.15) by pyrolysis and catalytic cracking of (organic matter + paper) fraction of MHSW at 400, 450, and 475 °C and 1.0 atmosphere, and at 475 °C and 1.0 atmosphere, using 5.0, 10.0, and 15.0% (wt.) Ca(OH)2, in batch mode, laboratory scale, on the yields of reaction products (bio-oil, bio-char, H2O, and gas), acid value and chemical composition of hydrocarbons (alkanes, alkenes, alkynes, ring containing alkanes, and aromatics) and oxygenates (carboxylic acids, alcohols, amines, amides, aldehydes, esters, ketones, phenols, nitrogenous compounds, chlorinated compounds) present within the bio-oils, as well as on the bio-char morphology and crystalline structure. The novelty of this work remains the innovative way of choosing a statistical significant route, the composition of the organic fraction of MHSW, in this case a blend or mixture of the organic fraction and paper, and the behavior of hydrocarbons and oxygenates in bio-oil as a function of temperature and catalyst content.
2. Materials and Methods
2.1. Strategy and Methodology
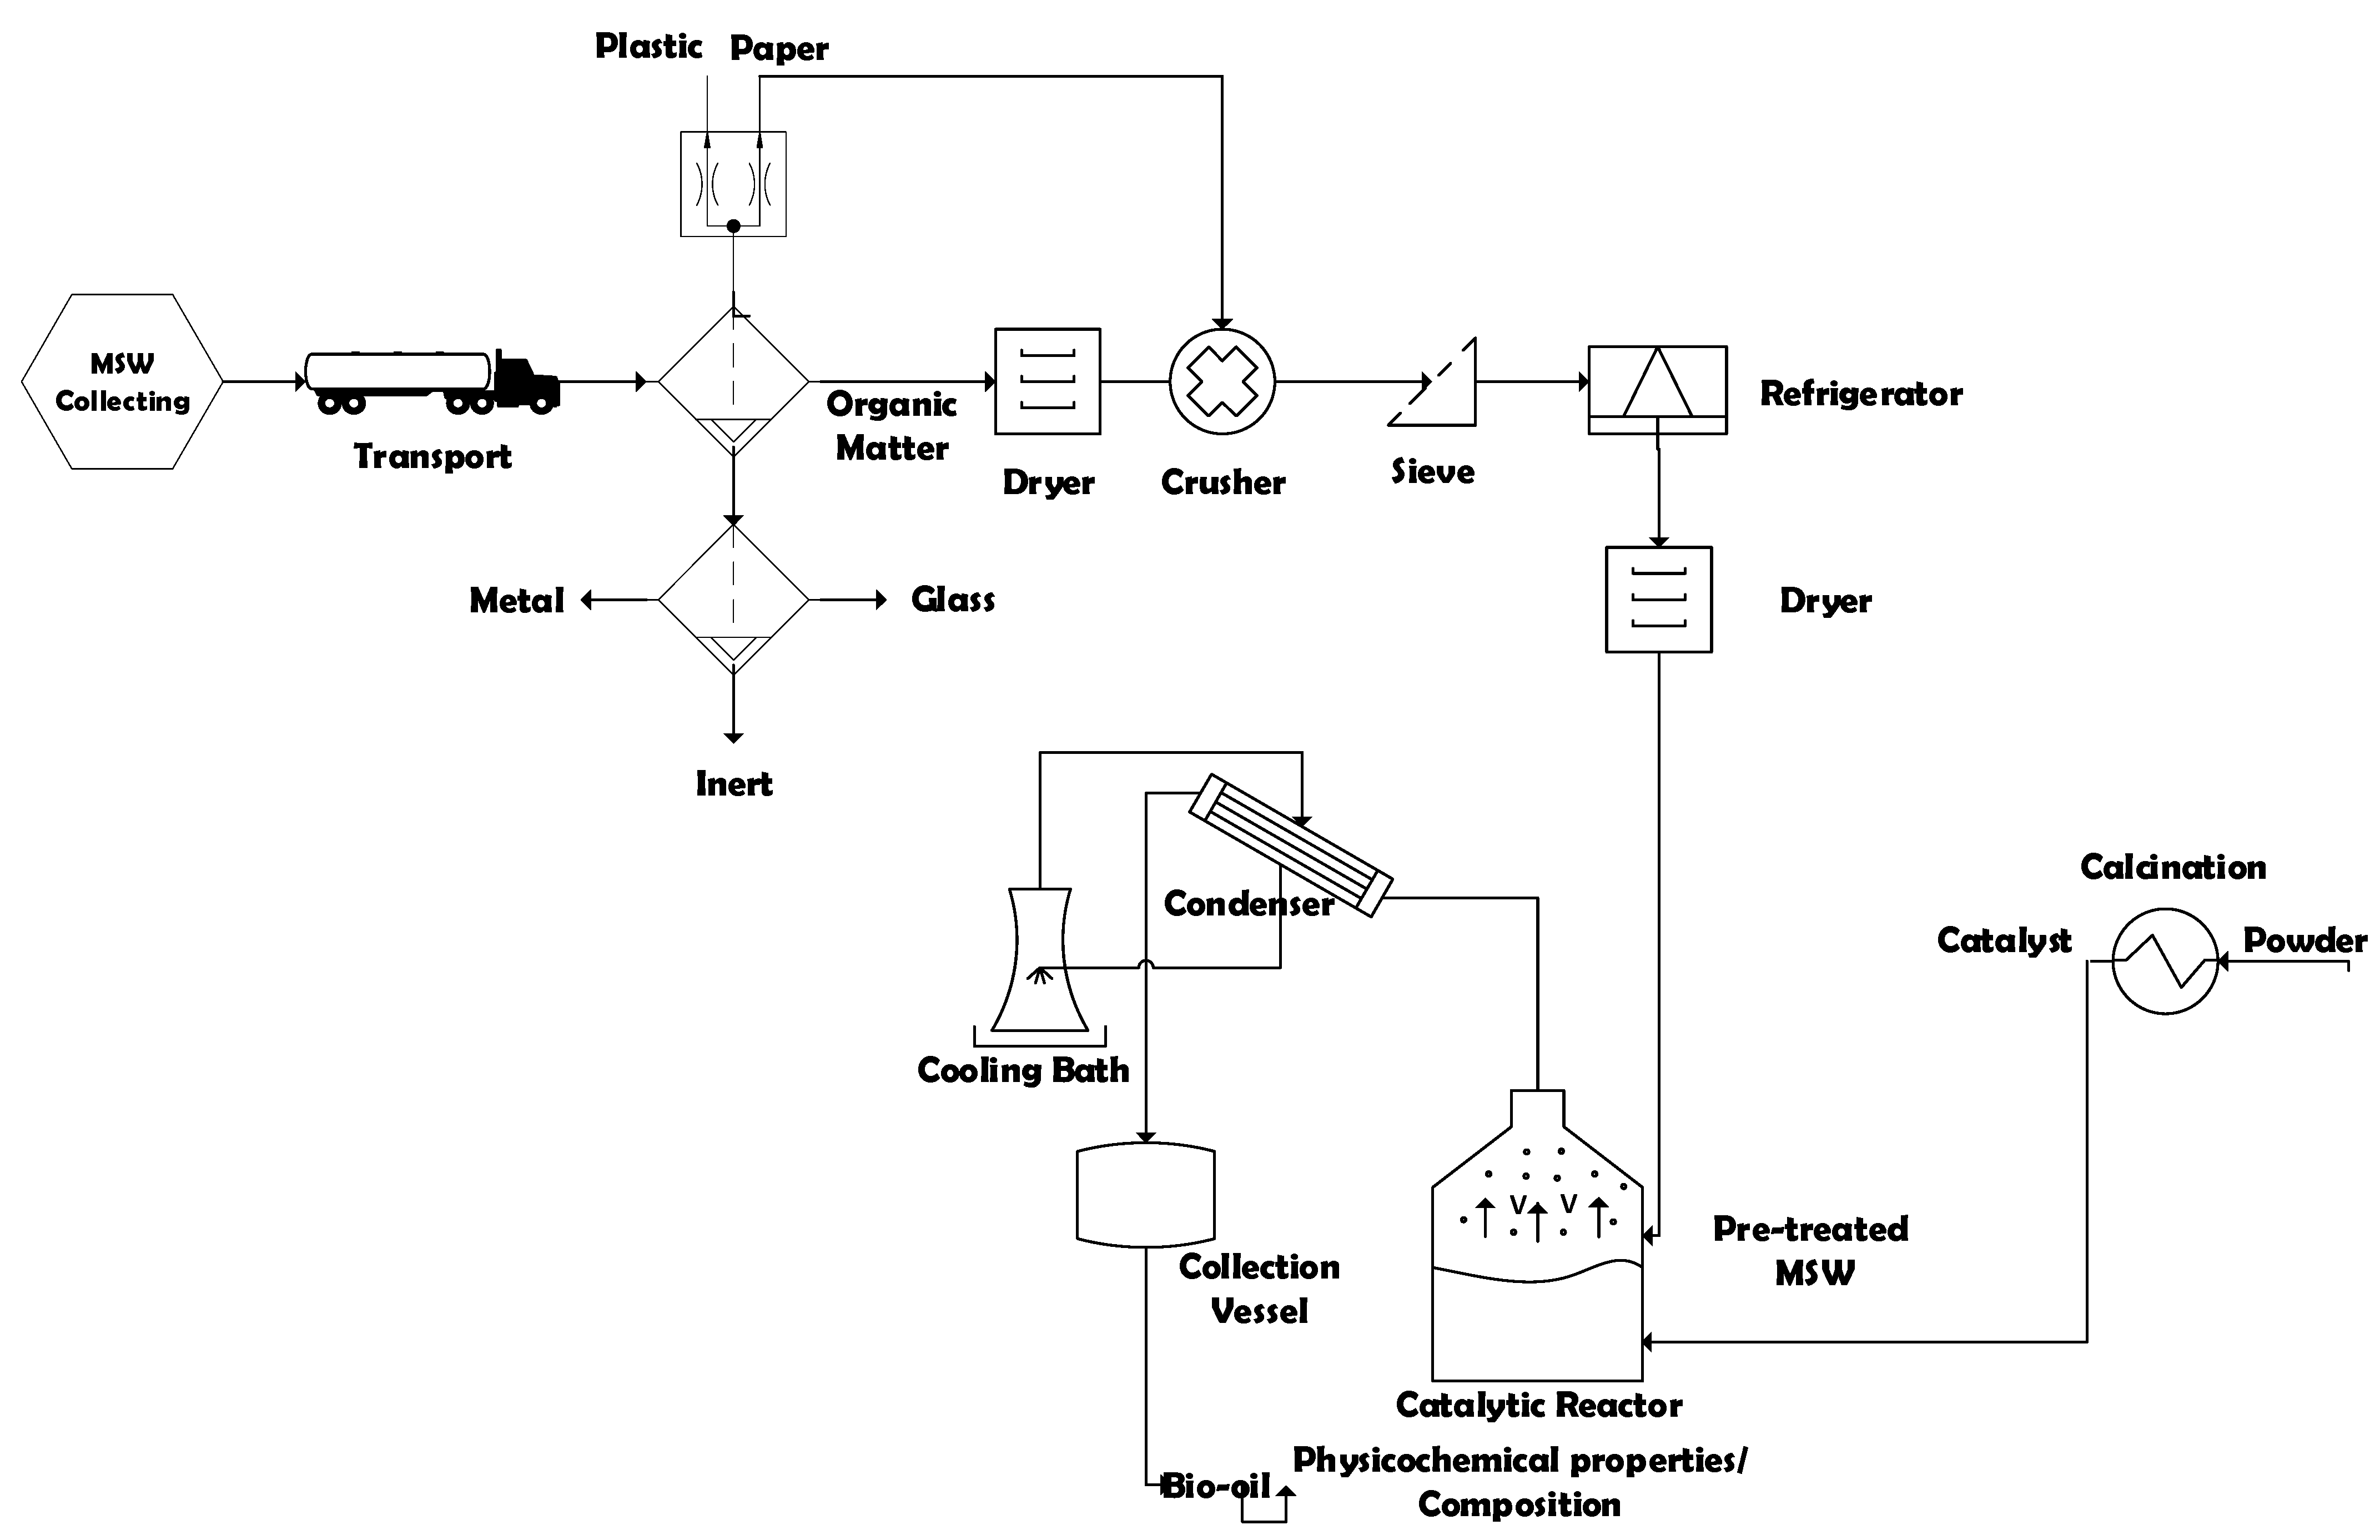
The process flowsheet illustrated in Figure 1 summarizes the applied strategy, as well as the process methodology, described as a logical sequence of ideas, methods, and procedures to sustainable disposal and thermal treatment of Municipal Solid Wastes (MSW) into activated carbon and bio-oil by pyrolysis and catalytic cracking in laboratory scale. First, based on geographic and socio-economic database (IBGE 2010), the collecting sectors of MSW in the municipality of Belém-Pará-Brazil were chosen. Then, the MHSW collected and transported to the segregation area. Afterwards, the gravimetric analysis of MSW was carried out and the material (Paper, Cardboard, Tetra Pack, Hard Plastic, Soft Plastic, Metal, Glass, Organic Matter, and Inert) were separated. Afterwards, the selected organic matter was submitted to drying. Then, the selected paper was crushed together with dried organic matter. The crushed material was sieved and conditioned in a freezer. Before the thermal processing, the feezed material was dried again. The thermal transformation experiments were carried out in laboratory scale. The effects of temperature and catalysts (organic matter + paper) were analyzed. The density, acidity, and composition of bio-oil were determined. The solid phase (bio-adsorbent) was characterized.
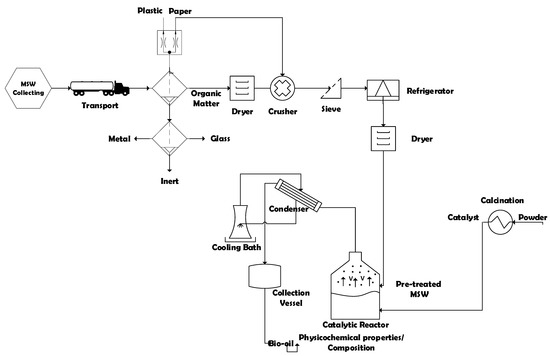
Figure 1.
Process flowsheet by collecting, classification/segregation, and pre-treatment of MHSW and thermal processing of pre-treated (organic matter + paper) at 400, 450, and 475 °C, 1.0 atm, 0.0, 5.0, 10.0, and 15.0% (wt.) of Ca(OH)2, in laboratory scale.
2.2. Conceptual Design
The plan of action applied to systematically study the sustainable disposal and thermal treatment of Municipal Household Solid Wastes (MHSW) was designed conceptually as a logical sequence of ideas, concepts, and methods, including the choice of a statistically representative route (socio-economic and geographic database), simulation of a statistically representative collected mass of a MHSR route, application of a realistic and/or real sampling of MHSW, as the MSW is collected door-to-door, transport of MHSW residues to a special segregation place, selection/classification of MHSR according to the class of materials (metal, glass, polymers, carbohydrates + lipids + proteins + fibers = organic matter, textiles, aluminum foil + plastic layers + cardboard + plastic caps + bioplastics = tetra pack, paper, cardboard, paper tissue + masks + disposal diapers + pads = sanitary household waste), centesimal characterization of organic matter, pre-treatment of organic matter/paper (drying, crushing, sieving, freezing, drying), thermochemical processing (pyrolysis, catalytic cracking), and characterization of reaction products (bio-oil, bio-adsorbent).
2.2.1. Selection of Routes
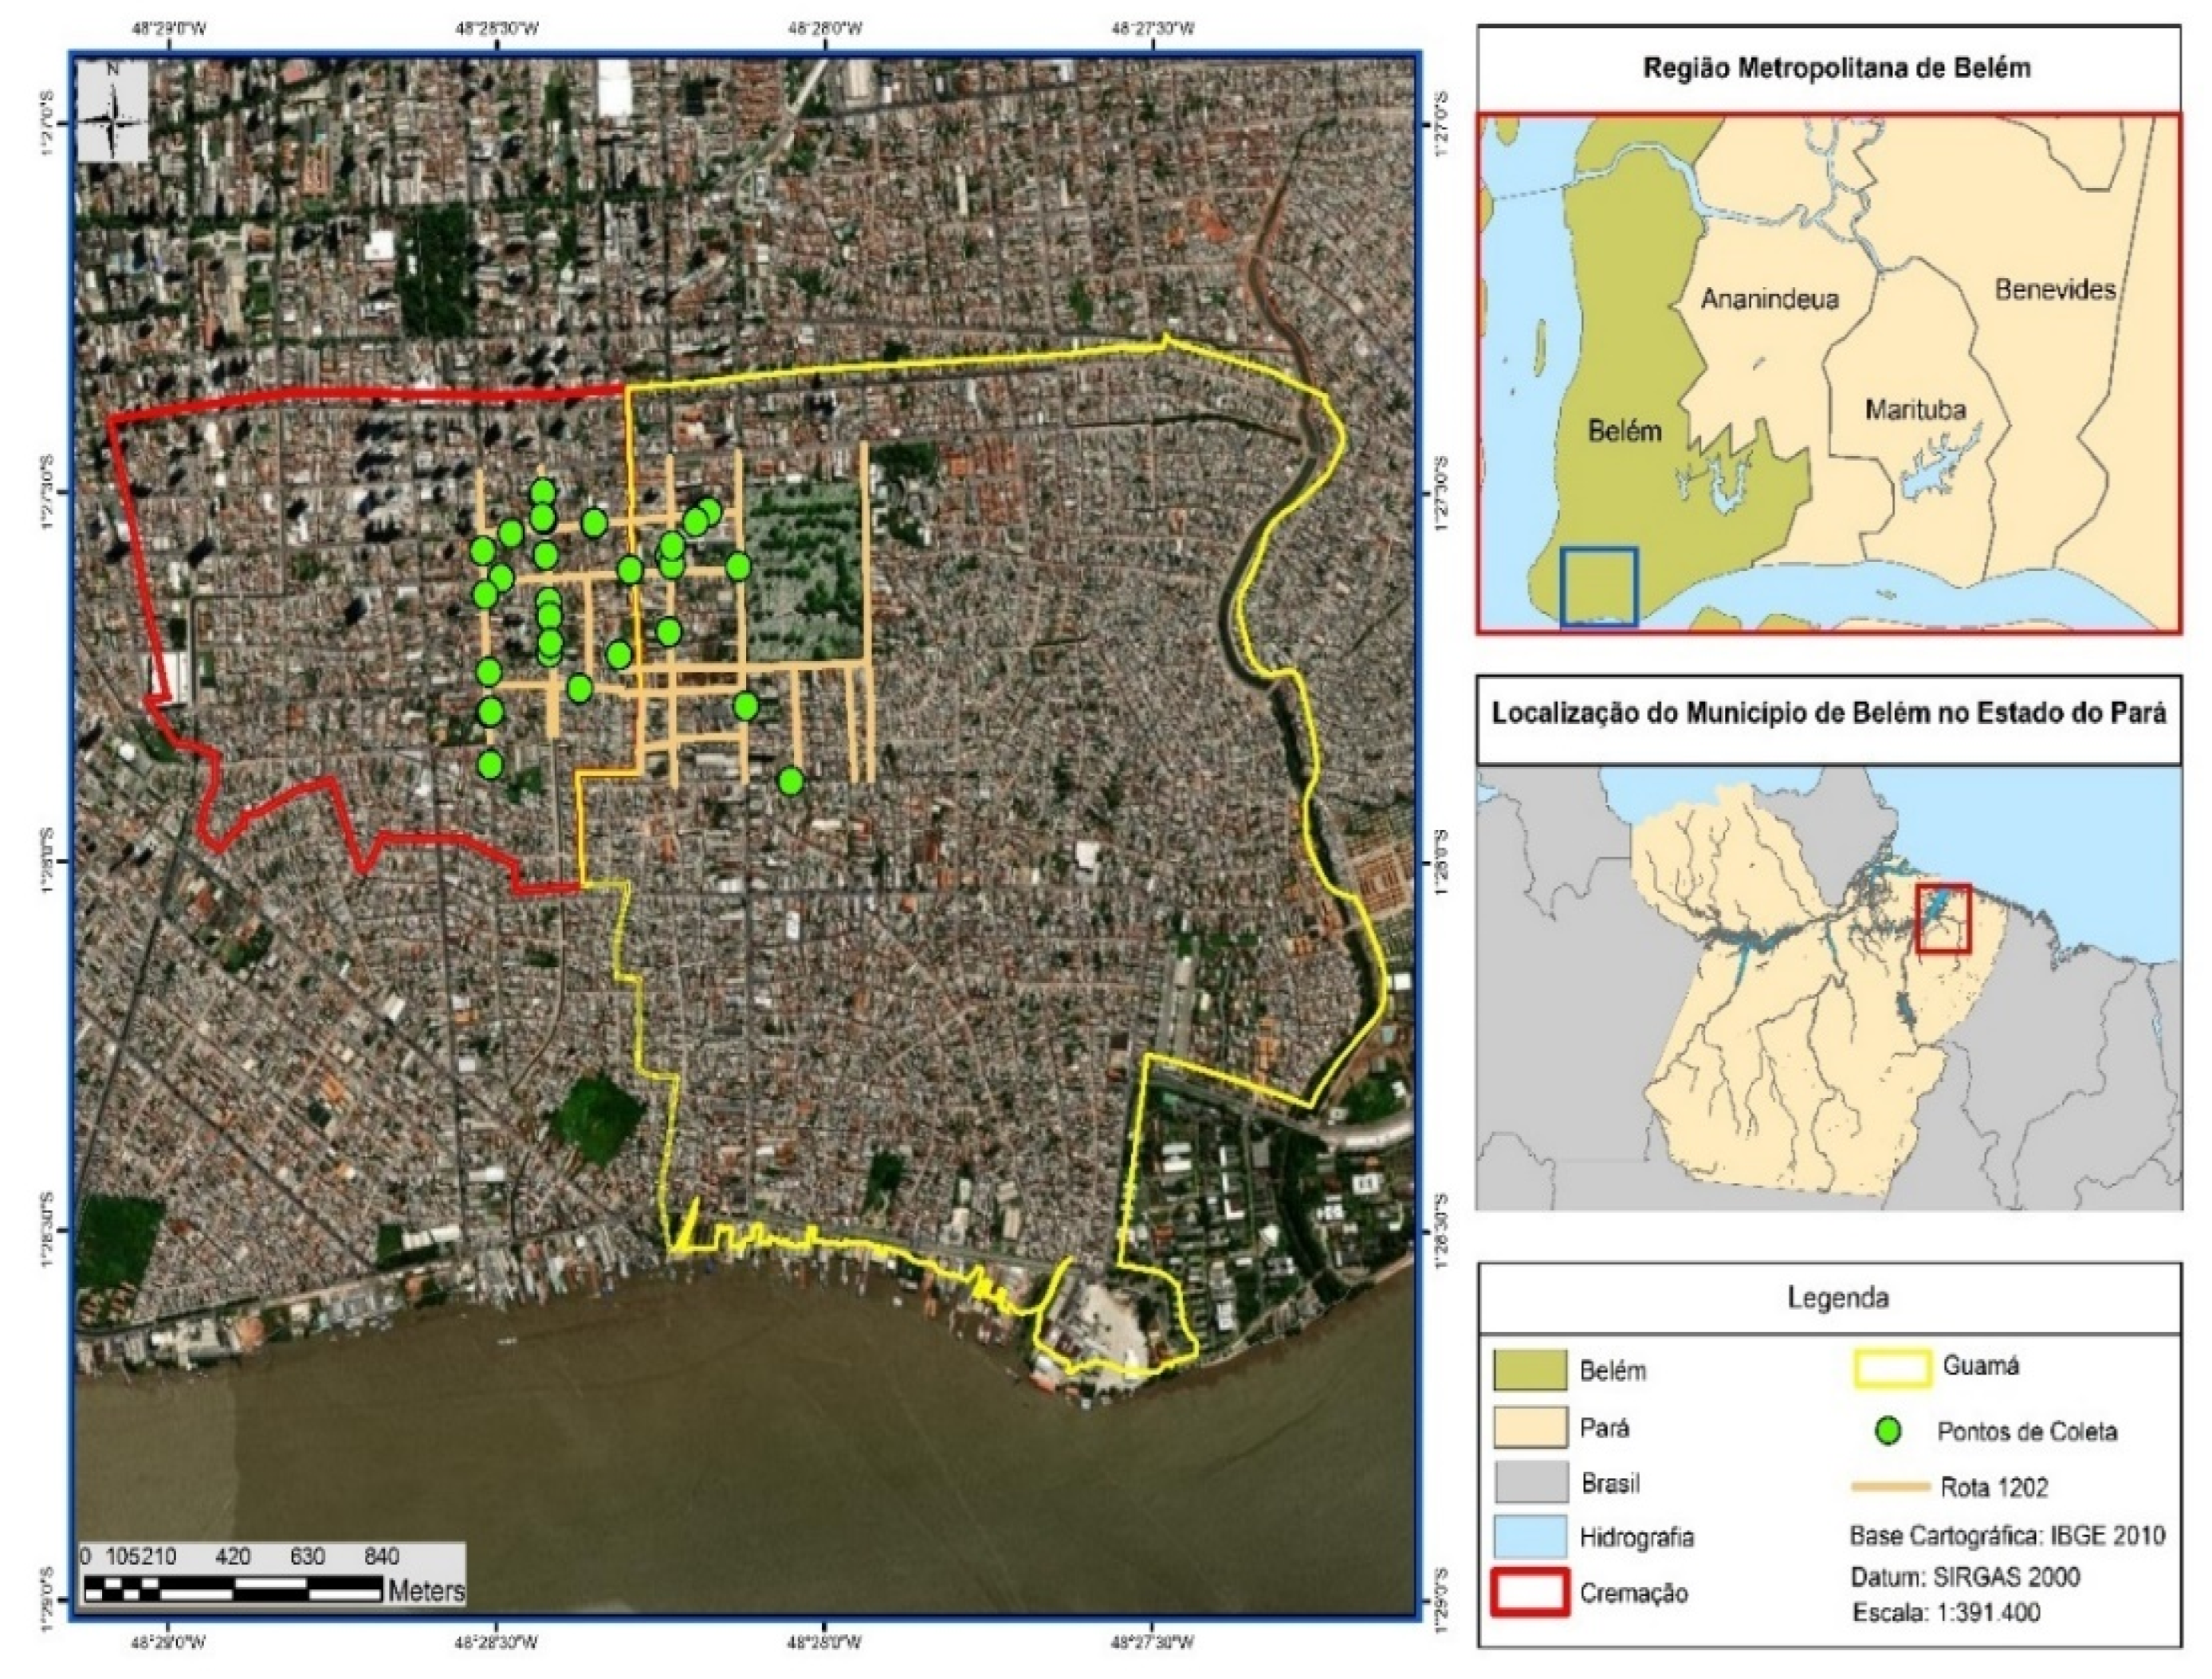
The strategy applied for the selection of collecting routes in the municipality of Belém-Pará-Brazil is described synthetically as follows. The company Terraplena Ltd. (Belém-Pará-Brazil) collects urban solid waste in the Metropolitan Region of Belém-Pará-Brazil, with a total of 37 routes. In order to reduce the size of the sample collection space, route 1202 was chosen, corresponding to the neighborhoods of Cremação and Guamá. These neighborhoods have socio-economic and demographic characteristics stratified into Class D and E, respectively, according to IBGE in 2010 [43], shown in Table 1. Furthermore, adding the average per capita family income of the Classes D and E of all the neighborhoods of Belém gives 85.71%. In addition, adding the population of all the neighborhoods in the municipality of Belém, including classes D and E, gives a population percentage of 92.01%, as shown in Table 2. In this sense, based on the facts described above, route 1202 was chosen in order to significantly represent the gravimetric analysis of urban solid waste in the municipality of Belém-Pará-Brazil.

Table 1.
Socio-economic classification in the municipality of Belém-Pará-Brazil based on minimum salary [IBGE,2012].

Table 2.
Socio-economic classification, population, and average family income in reais (R$) of all the neighborhoods in the municipality of Belém-Pará-Brazil [IBGE,2012].
The Cremação neighborhood is located in the developed urban center and borders the neighborhoods of Nazaré, São Brás, and Batista Campos. It has a population of 31,264 inhabitants with a per capita income of R$1093.90, according to IBGE in 2010 [43], therefore, it belongs to the socio-economic Class D. Its area includes fairs, shops, schools, residential buildings, and houses. The Guamá neighborhood is the most populous in the municipality of Belém-Pará-Brazil, with 94,610 inhabitants, as well as an average per capita income of R$525.80, belonging to the socio-economic Class E. Its area is diversified, containing a commercial sector, a fair, as well as schools and residential houses.
The collecting points (green circles) of municipal household solid wastes (MHSW) are described in Figure 2 and the spatial coordinates (Longitude-X, Latitude-Y) of each point are described in Supplementary Table S1. The collection points, twenty-seven in total, were randomly selected in order to diversify the sampling of MHSW in each neighborhood, based on the methodology described in the literature by Nunes (2015) [44].
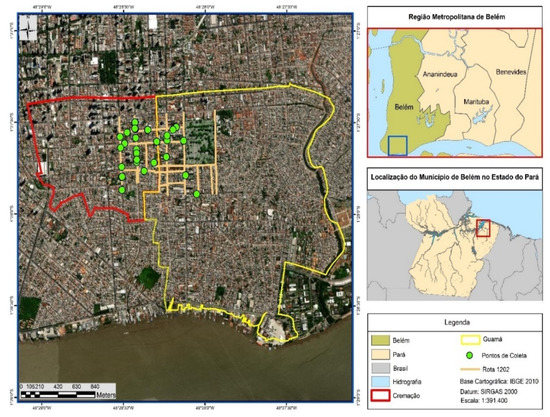
Figure 2.
Collecting points (green circles) of municipal household solid waste (MHSW) in the neighborhoods of Cremação and Guamá in the city of Belém-Pará-Brazil on 18 October 2021, 20 October 2021, 27 October 2021, and 29 October 2021.
2.2.2. Simulation of Sample Mass of MHSR
In order to compute the statistically representative sample volume of MHSW, a simulation was performed, aided by the software StatDisk 13.0. The simulation was based on the volume collected by route using a collector truck of 15 m3, assuming that average density of MHSW was that of liquid water. The significance and confidence levels were set equal to 5% and 95%, respectively, with a margin of error of 10%, giving as result a sample of mass ≈ 100 kg [45].
2.2.3. Sampling, Transport, and Segregation of MHSW
In order preserve the original characteristics of MHSW, that is, the MHSW before mixing and compaction, which not only causes loss mass by dewatering but also a rapid degradation of organic matter, as well as production of leachate with huge loads of contaminants, the collecting of MHSW samples were carried out door-to-door. The collections of MHSW on route 1202 were carried out on the 18th, 20th, 27th, and 29th of October 2021. The samples were packed in plastic bags with a capacity of 200 kg and transported using an appropriate vehicle to prevent the material from being compacted. Afterwards, the plastic bags of MHSW were placed over a waterproofed surface inside the UFPA’s Sludge and Composting Experimental Laboratory. Finally, the HHSW were selected/classified manually and weighed using a digital balance (Welmy, São Paulo-Brazil, Model: W200/50).
2.3. Materials
2.3.1. Mixture of Organic Matter and Papers
The organic matter, a mixture of carbohydrates, lipids, proteins, and fibers, selected from municipal household solid waste (MHSW), was submitted to pre-treatment (drying, crushing, sieving) and conditionate in a freezer to avoid physicochemical and microbiologic degradation.
2.3.2. Pre-Treatment of Organic Matter and Papers
First, the selected/classified organic matter was submitted to drying at 105 °C for 24 h using an analogic controlled oven (DeLeo, Porto Alegre, Brazil, Model:). Then, the selected/segregated papers from MHSW were dried at 105 °C for 24 h using an analogic controlled oven (DeLeo, Brazil, Model:). Afterwards, the dried organic matter was crushed together with the dried paper using a grain/straw knife mill (TRAPP, Jaraguá do Sul, Brazil, Model: TRF 600). Then, the milled/crushed mixture of organic matter and paper was sieved using a series of sieves (4.0, 6.0, 12, and 14 mesh) and conditioned in a freezer. A total of four batches of pre-treated organic matter + paper, one for each MHSW collecting, was carried out. The pre-treated mixture of organic matter and paper used as feed material by thermal processing is shown in Figure 3.

Figure 3.
Pre-treated organic matter + paper used as feed material by thermal processing in laboratory scale. Organic matter after crushing and sieving retained over 12 mesh sieve (a), organic matter mixed after sieving using 4, 6, 12, and 14 mesh (b), organic matter + paper after drying/crushing/sieving packed in plastic bags (c).
2.3.3. Centesimal and Physicochemical Characterization of Organic Matter and Papers
The dried, crushed and sieved organic matter was subjected to centesimal characterization for lipids, proteins, moisture, and ash according to official methods AOCS 963.15, AOCS 991.20, AOCS 935.29, and ASTM D 3174-04 [8,46]. In addition, pH and electrical conductivity were also measured according to ASTM D1293-18 and ASTM D 1125-14 [47].
2.4. Experimental Apparatus and Procedures
2.4.1. Experimental Apparatus
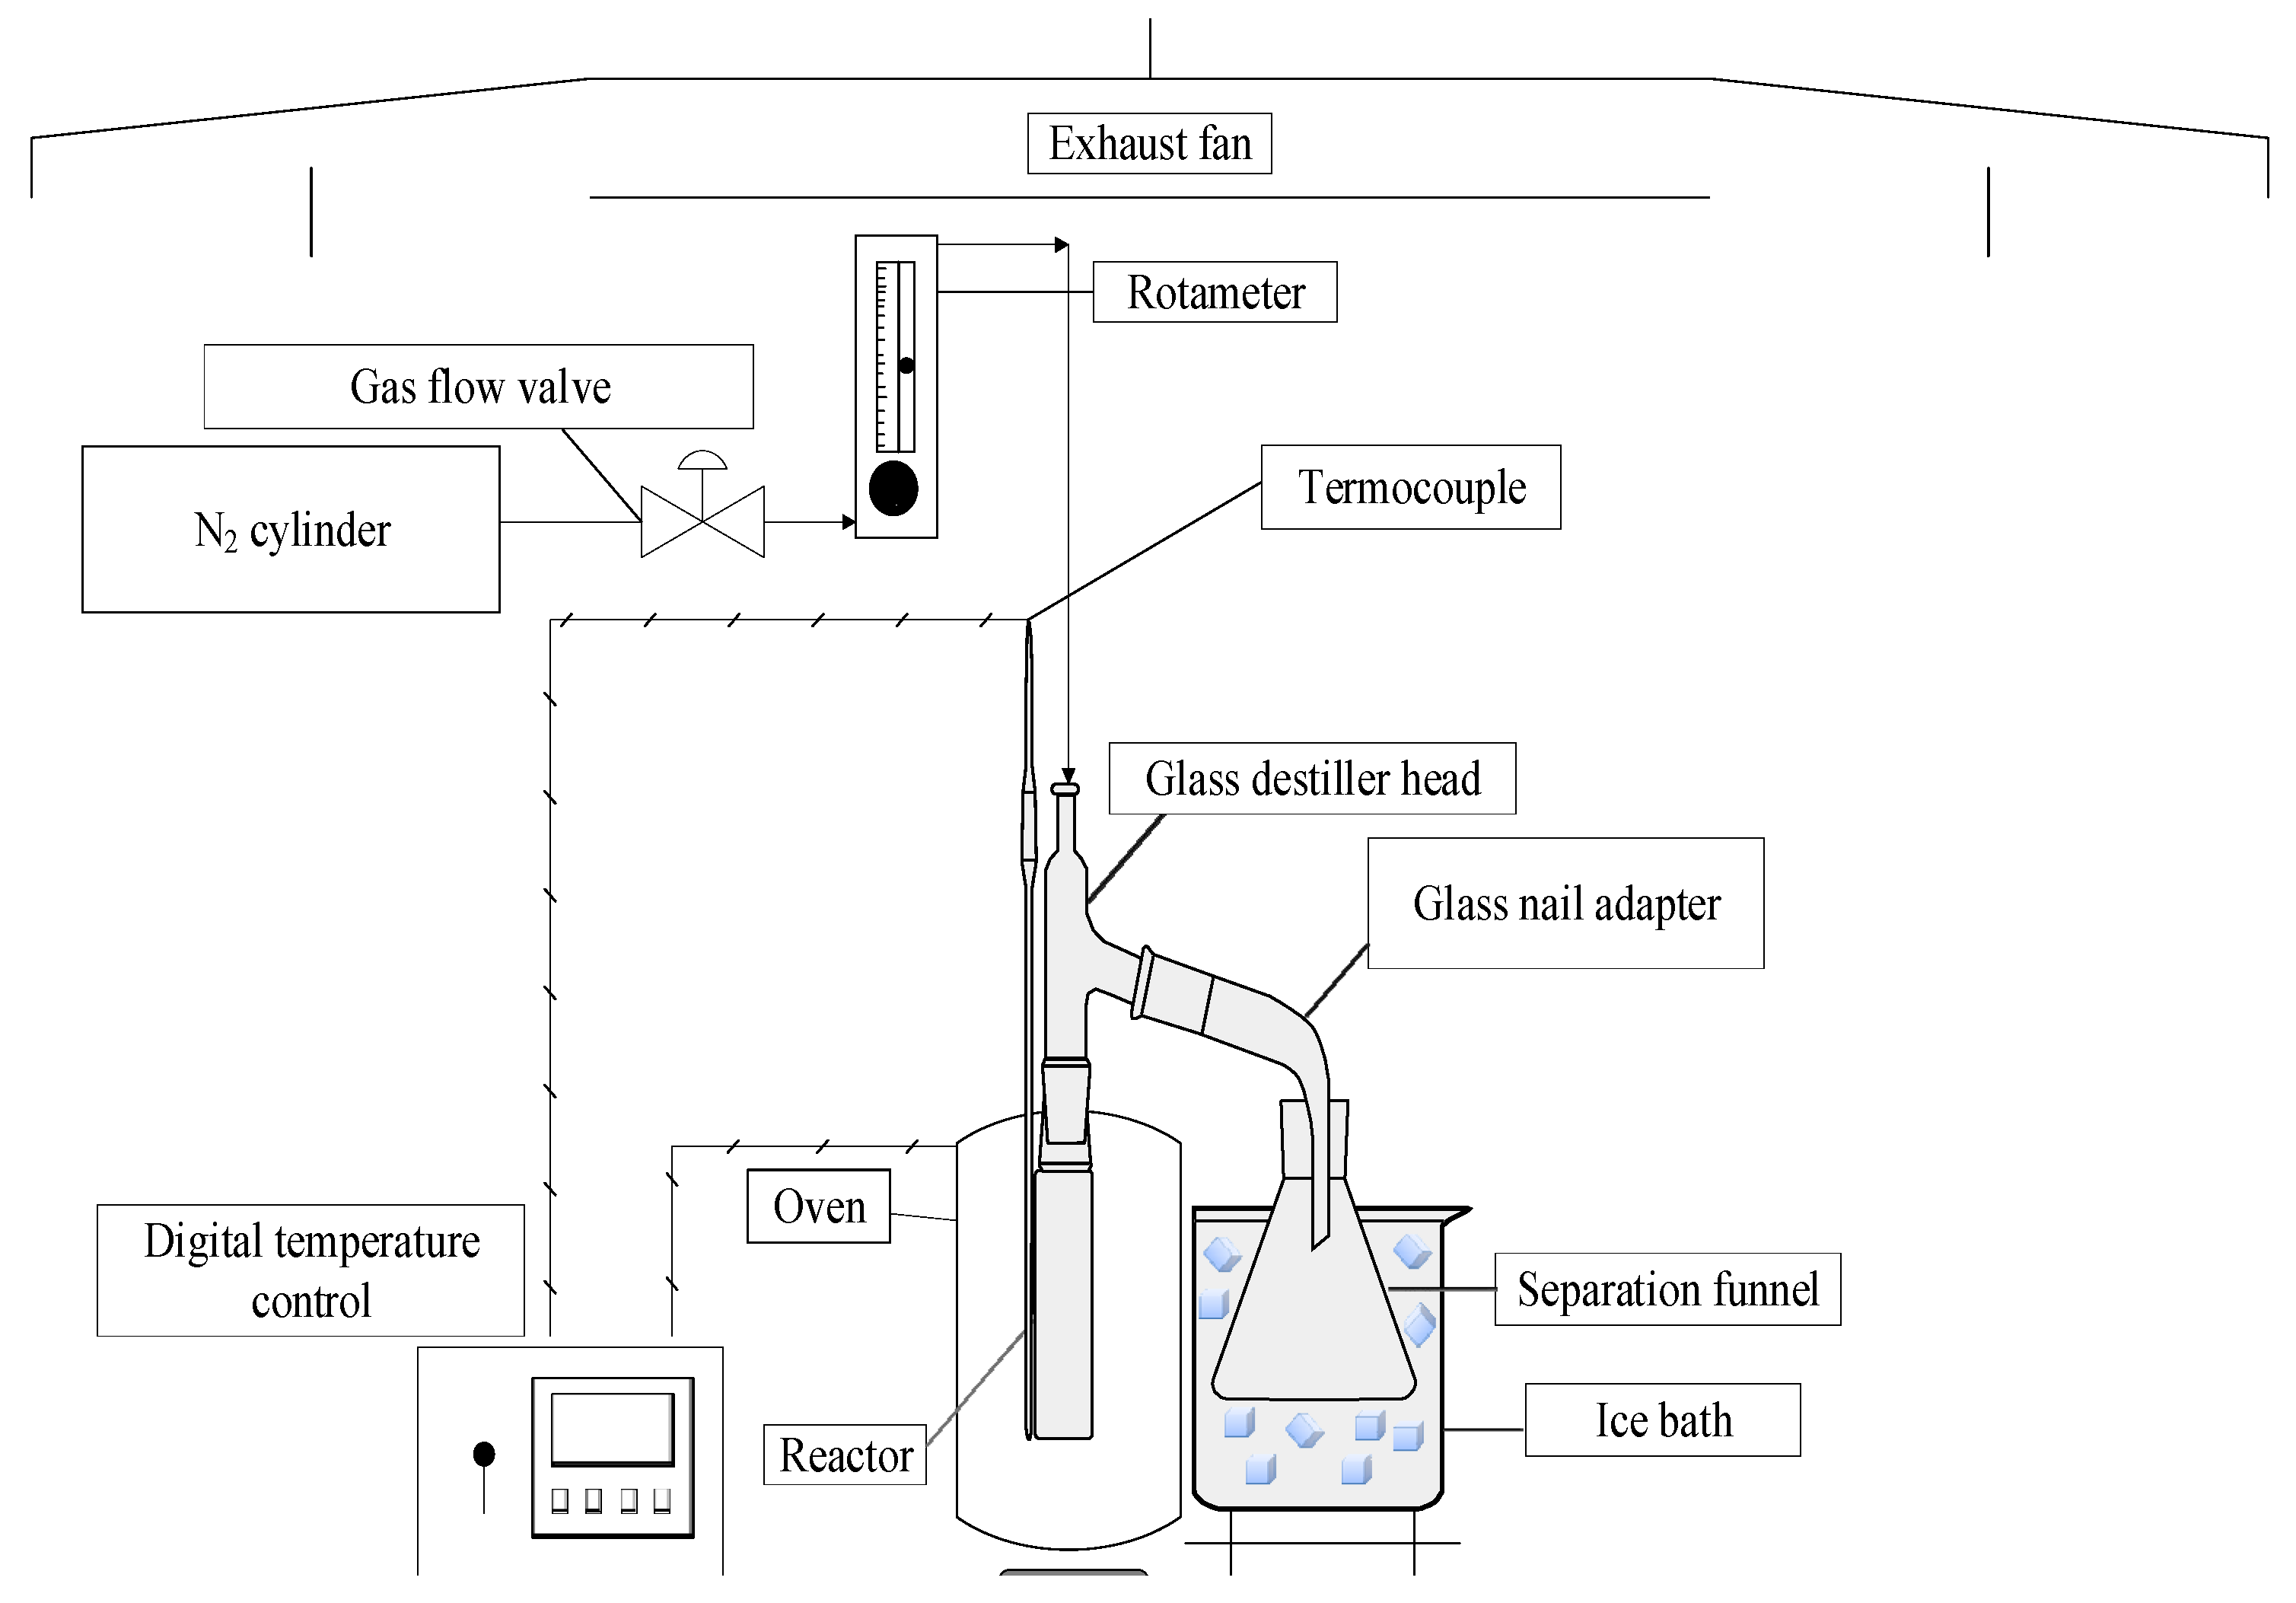
The schematic diagram of borosilicate glass reactor in a laboratory scale is shown in Figure 4. The experimental apparatus contains a cylindrical reactor of 200 mL, a Liebig glass condenser, a ceramic heating system of 800 W, and a digital temperature control (Therma, San Jose, CA, USA, Model: TH90DP202-000), as described in detail elsewhere [8,48,49].
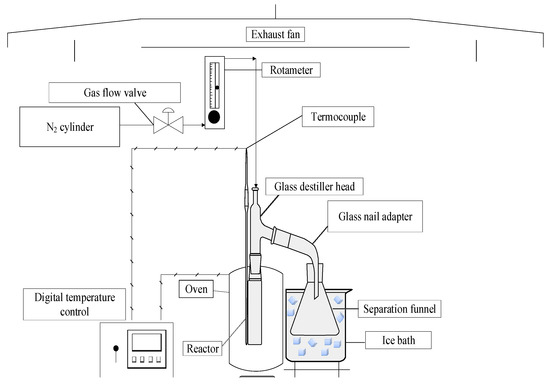
Figure 4.
Schema of laboratory scale borosilicate glass reactor.
2.4.2. Experimental Procedures
By the pyrolysis of pre-treated solid mixture of organic matter + paper, approximately 50.0 g was weighed using a semi-analytical balance (Marte, São-Paulo-Brazil, Model: AL500). After sealing the reactor, the experimental apparatus was set up. Then, the cooling system was turned on and the water temperature was set at 10 °C. Afterwards, the desired heating rate (10 °C/min) and temperature (400, 450, and 475 °C) were set up. The reactor temperature was recorded every 10 min. The mass of liquid phase and coke were collected and weighed, and the mass of gas was computed by difference. The bio-oil was separated from aqueous phase by decantation inside the separation funnel. Afterwards, the bio-oil physicochemical was characterized by density and acidity.
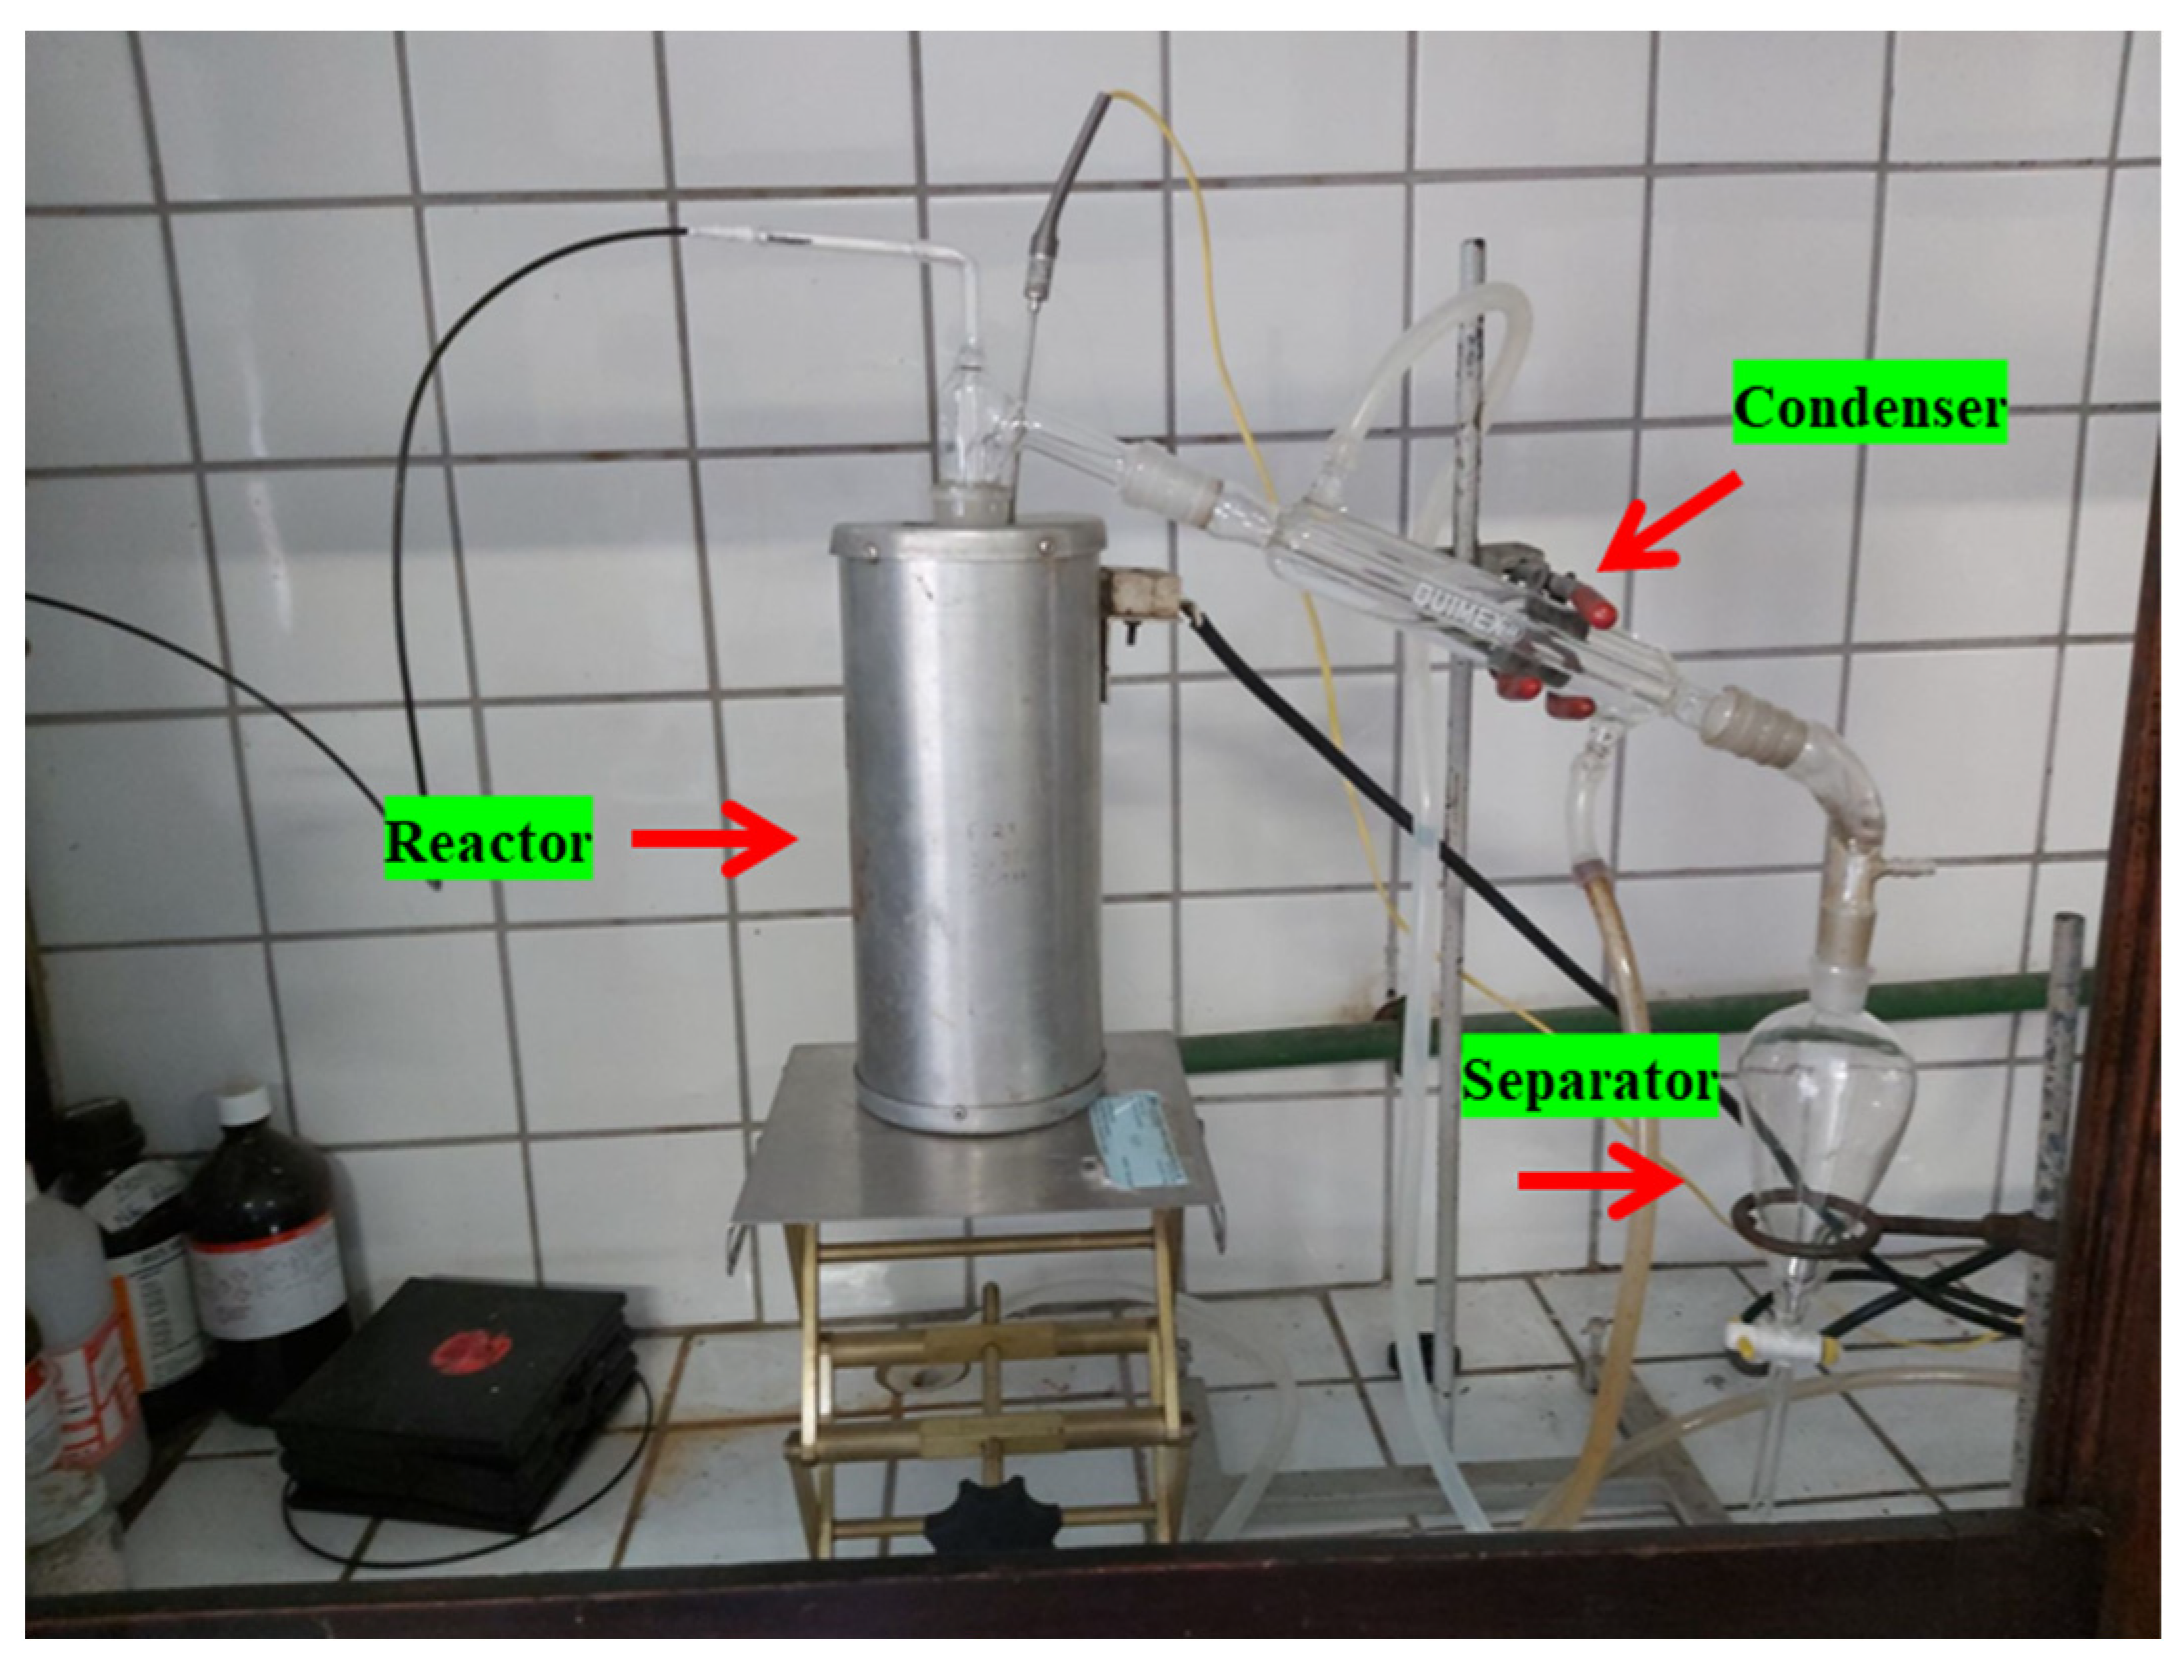
By the thermal catalytic cracking experiments, calcium hydroxide (Ca(OH)2) was mixed with pre-treated organic matter + paper using a glass Becker of 250 mL. The thermal catalytic cracking experiments were carried out with 5.0, 10.0, and 15.0% (wt.) Ca(OH)2. Afterwards, the mixture was placed inside the reactor, as depicted in Figure 5. Then, the desired heating rate (10 °C/min) and temperature (475 °C) were set up. The reactor temperature was recorded every 10 min. The mass of liquid phase and coke were collected and weighed, and the mass of gas was computed by difference. The bio-oil was separated from aqueous phase by decantation inside the separation funnel. Afterwards, the bio-oil physicochemical was characterized by density and acidity.
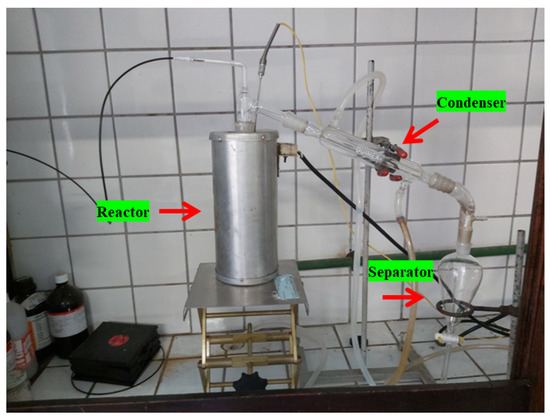
Figure 5.
Experimental apparatus (glass reactor in laboratory scale).
2.5. Physicochemical and Chemical Composition of Bio-Oil
2.5.1. Physicochemical Characterization of Bio-Oil and Aqueous Phase
The bio-oil and the aqueous phase were characterized in terms of acidity according to the AOCS Cd 3d-63 method, as described elsewhere [8,48,49,50,51].
2.5.2. Chemical Composition of Bio-Oil and Aqueous Phase
The chemical composition of bio-oil and aqueous phase were determined by GC-MS and the equipment and procedure were described in detail by Castro et al. [8,52,53]. The concentrations were expressed in area, as no internal standard was injected for comparison in the peak areas. In addition, a qualitative analysis of the bio-oil was performed by FT-IR [8,48,49,50].
2.6. Characterization of Bio-Char
2.6.1. SEM and EDS Analysis
The morphological characterization of bio-char was obtained by thermal catalytic cracking with 5.0, 10.0, and 15.0% (wt.) Ca(OH)2) of organic matter + paper, performed by scanning electron microscopy using a microscope (Tescan GmbH, Brno, Czech Republic, Model: Vega 3). The samples were covered with a thin layer of gold using a Sputter Coater (Leica Biosystems, Nußloch, Germany, Model: Balzers SCD 050). Elemental analysis and mapping were carried out by energy dispersive X-ray spectroscopy (Oxford instruments, Abingdon, UK, Model: Aztec 4.3) [52,53].
2.6.2. XRD Analysis
The crystalline characterization of bio-char obtained by thermal processing (pyrolysis and thermal catalytic cracking with 5.0, 10.0, and 15.0% (wt.) Ca(OH)2) of organic matter + paper performed by x-ray diffraction using a diffractometer (Rigaku, Tokyo, Japan, Model: MiniFlex600) at the Laboratory of Structural Characterization (FEMAT/UNIFESSPA) and the equipment specifications described as follows: generator (maximum power: 600 W; tube voltage: 40 kV; tube current: 15 mA; X-ray tube: Cu), optics (fixed divergence, scattering and receiving slit; filter; Kβ sheet; monochromator: graphite; soller slit: 5.0°), goniometer (model: vertical, radius: 150 mm, scanning range: –3 A, 145° (2θ); scanning speed: 0.01 to 100°/min (2θ); accuracy: ±0.02°), and detector (high-speed silicone tape) [52,53].
2.7. Mass Balances by Catalytic of Organic Matter and Paper
The application of mass conservation principle in the form of an overall mass balance within the pyrolysis/catalytic reactor, operating in a batch mode open thermodynamic system, yields the following equations [53].
where is the mass flow rate entering the glass reactor, is the mass flow rate leaving the glass reactor, is the time rate variation of feed mass inside the glass reactor, and is the mass flow rate of pyrolysis/catalytic cracking vapors leaving the glass reactor and entering the condenser. By applying an overall steady state mass balance within the condenser, this yields Equation (5).
where is the mass flow rate of non-condensable gases leaving the condenser, computed by difference, and is the mass flow rate of bio-oil collected inside the separation funnel. The mass of solid remaining in the reactor is . By performing a steady state global mass balance within the control volume consisting of glass reactors, condenser, and separation funnel, this yields Equation (6).
The process performance evaluated by computing the yields of bio-oil, solid (coke), and gas defined by Equations (7) and (8), and the yield of gas by difference, using Equation (9).
2.8. Methods of Statistical Analysis
In the statistical analysis of the gravimetric data of the four samples collected, the analysis of variance method (ANOVA) and the Tukey test were applied using Minitab software. The populations analyzed are the different fractions of MHSW materials of the gravimetric analysis and the responses are the percentages of each MHSW fraction material in relation to the total mass of the sample. The ANOVA investigated the hypothesis that the population means can be considered equal, and the Tukey test showed how the different fractions of MHSW materials are grouped according to their mass percentages.
3. Results
3.1. Centesimal Characterization of (Organic Matter + Paper) Fraction of MHSW
The dried, crushed, and sieved fraction of MHSW (organic matter + paper) was subjected to centesimal characterization for lipids, proteins, moisture, ash, pH, and electrical conductivity according to official methods AOCS 963.15, AOCS 991.20, AOCS 935.29, ASTM D 3174-04, ASTM D1293-18, and ASTM D 1125-14 [8,46], and the results are depicted in Table 3, compared with similar data reported in the literature [15,54]. The results show that ash and moisture content are close to similar data for proximate analysis of MHSW reported in the literature [15,54].

Table 3.
Centesimal characterization for lipids, proteins, moisture, ash, pH, and electrical conductivity of dried, crushed, and sieved fraction of MHSW (organic matter + paper).
3.2. Characterization of Bio-Char
3.2.1. SEM Analysis
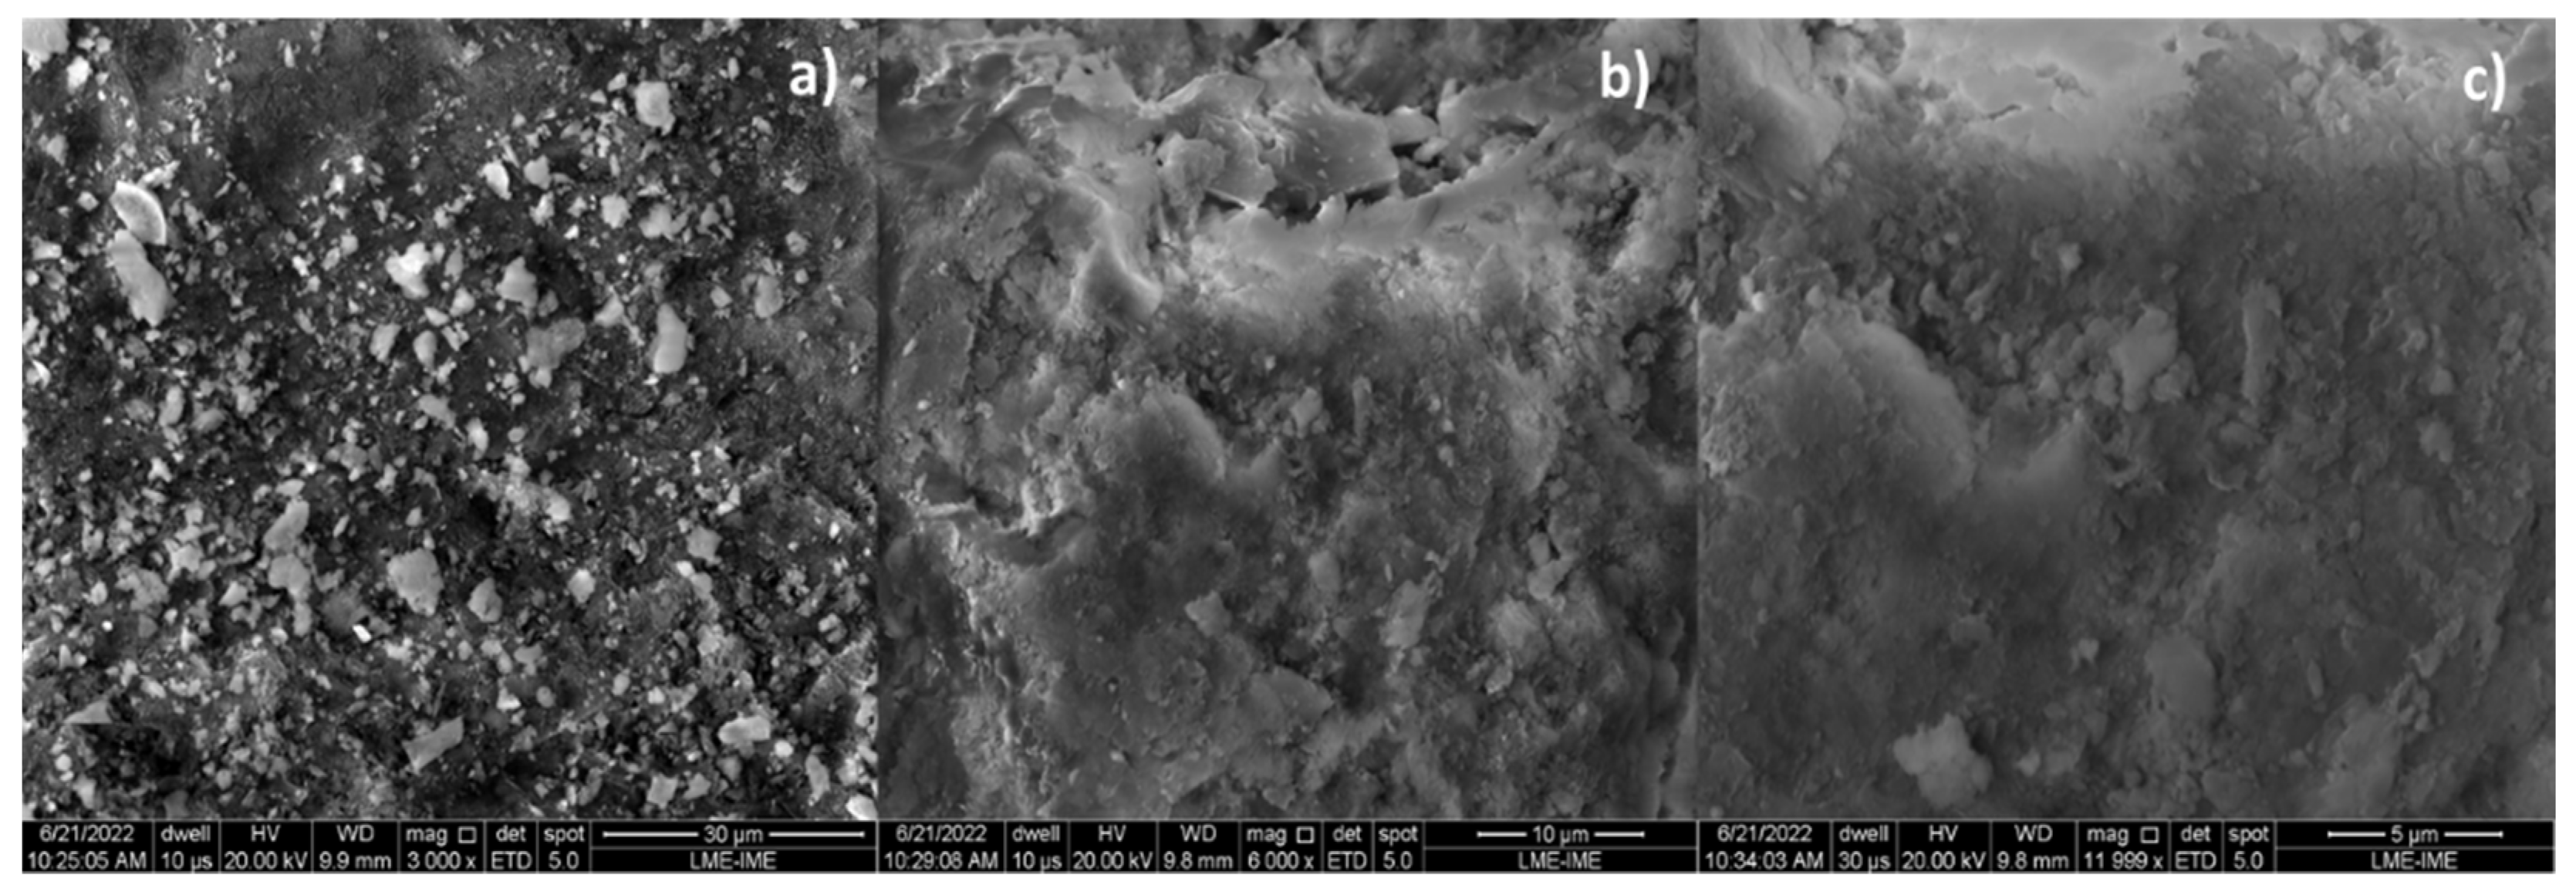
The microscopies, without the pre-treatment of metallization, of bio-char obtained by catalytic cracking of (organic matter + paper) at 475 °C, 1.0 atmosphere, with 5.0% (wt.) Ca(OH)2 depicted in Figure 6a show a carbonized surface (black colored) and granules (white colored) of different sizes scatter over the surface. The carbonized surface (black colored) is due to the thermochemical transformation of (organic matter + paper) fraction of MHSW, while the white colored surface is due to the Ca(OH)2 used as catalysts. The granules (white colored) of different sizes scatter over the surface being are similar to SEM images of CaCO3 (calcite) reported by Cabrera-Penna et al. [55], as well as the SEM images of Ca(OH)2 reported by Hassani et al. [56], and SEM images of bio-char obtained by pyrolysis of MSW reported by Gopu et al. [57].
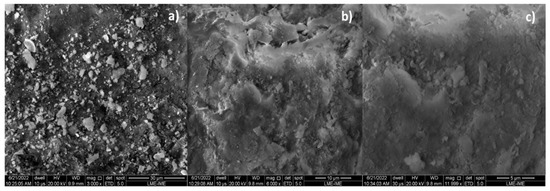
Figure 6.
SEM of bio-char obtained by thermal catalytic cracking of (organic matter + paper) fraction of MHSW at 475 °C, 1.0 atmosphere, with 5.0% (wt.) Ca(OH)2 [MAG: 5999× (a); MAG: 3000× (b); MAG: 11,999× (c)].
By increasing the Ca(OH)2 content to 10 and 15% (wt.), one observes that the granules (white colored) of different sizes spread over the surface, covering the carbonized surface, as shown in Figure 7a and Figure 8a. The higher the Ca(OH)2 content by catalytic cracking of (organic matter + paper) at 475 °C, 1.0 atmosphere, the higher the surface of carbonized surface (black colored) covered by the granules (white colored).

Figure 7.
SEM of bio-char obtained by thermal catalytic cracking of (organic matter + paper) fraction of MHSW at 475 °C, 1.0 atmosphere, with 10.0% (wt.) Ca(OH)2 [MAG: 3000× (a); MAG: 6000× (b); MAG: 12,000× (c)].

Figure 8.
SEM of bio-char obtained by thermal catalytic cracking of (organic matter + paper) fraction of MHSW at 475 °C, 1.0 atmosphere, with 15.0% (wt.) Ca(OH)2 [MAG: 3000× (a); MAG: 6000× (b); MAG: 12,000× (c)].
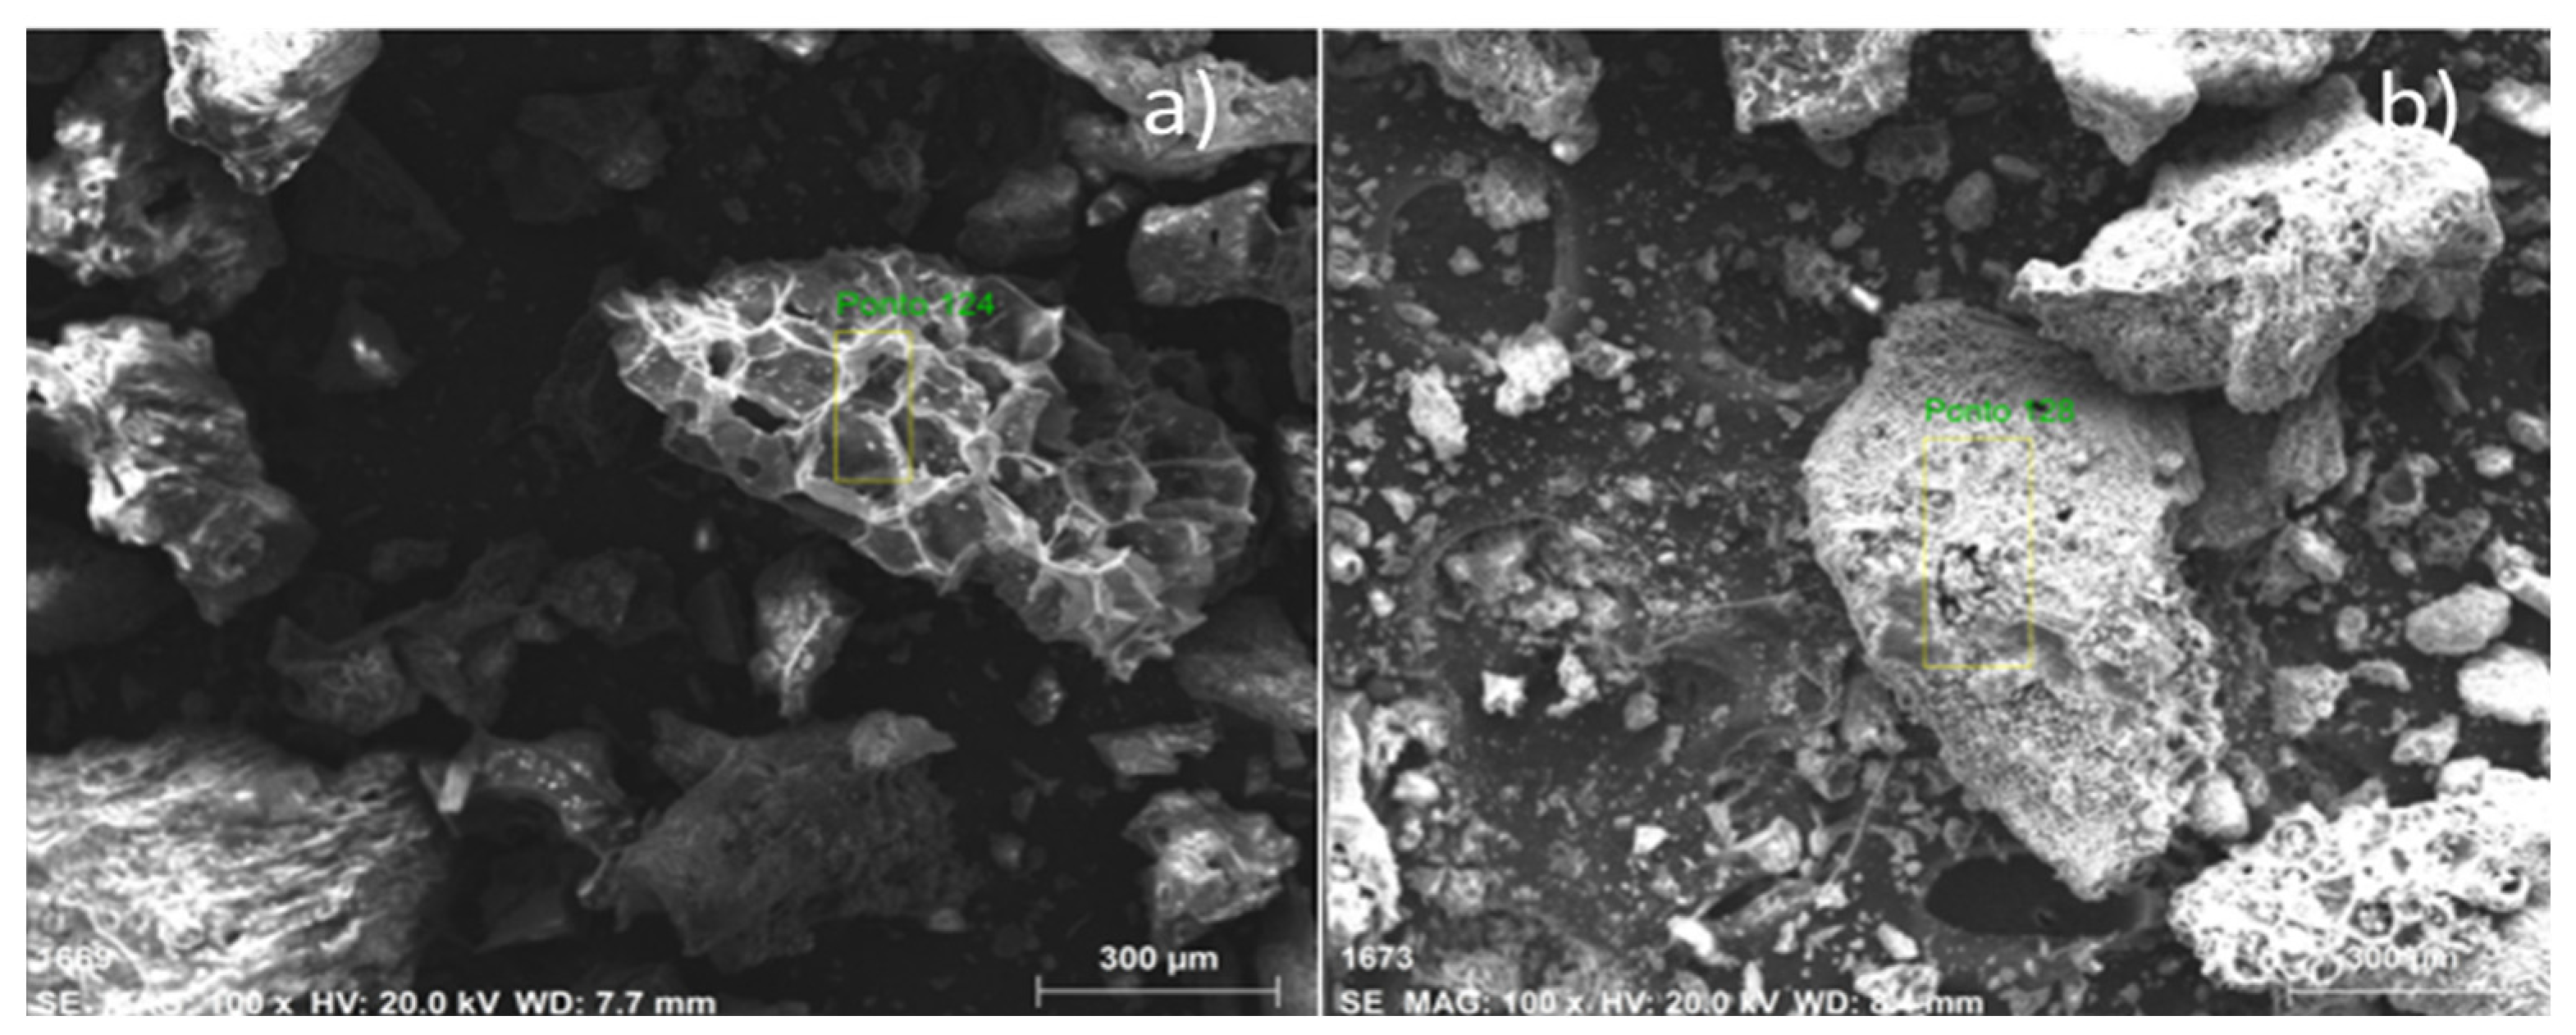
The microscopies, with the pre-treatment of metallization, of bio-char obtained by pyrolysis of (organic matter + paper) fraction of MHSW at 450 °C, 1.0 atmosphere, and by catalytic cracking of (organic matter + paper) fraction of MHSW at 475 °C, 1.0 atmosphere, with 10.0% (wt.) Ca(OH)2, in laboratory scale, illustrated in Figure 9. The SEM images of bio-char by pyrolysis of (organic matter + paper) fraction of MHSW at 450 °C, 1.0 atmosphere, illustrated in Figure 9a, show the formation of a porous structure similar to a beehive, proving that pyrolysis has drastically changed the morphological structure of (organic matter + paper) fraction of MHSW. In addition, the appearance of granules has not been seen. On the other hand, the SEM images of bio-char by catalytic cracking of (organic matter + paper) fraction of MHSW at 475 °C, 1.0 atmosphere, with 10.0% (wt.) Ca(OH)2, shows the formation of cavities over the carbonized structure of bio-char, as well as the appearance of granules (white) on the carbonized structure of bio-char. This is likely due to the Ca(OH)2 being used as catalysts. The granules (white colored) of different sizes scattered over the surface are similar to SEM images of CaCO3 (calcite) reported by Cabrera-Penna et al. [55], as well as the SEM images of Ca(OH)2 reported by Hassani et al. [56], and SEM images of bio-char obtained by pyrolysis of MSW reported by Gopu et al. [57].
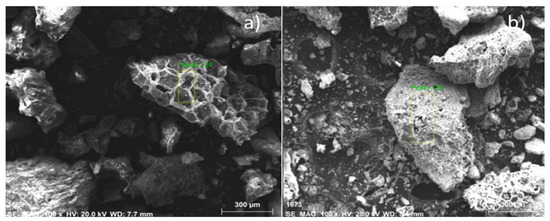
Figure 9.
SEM of bio-chars obtained by pyrolysis of (organic matter + paper) fraction of MHSW at 450 °C, 1.0 atmosphere (a), and catalytic cracking of (organic matter + paper) fraction of MHSW at 475 °C, 1.0 atmosphere, with 10.0% (wt.) Ca(OH)2 (b) [MAG: 100× (a); MAG: 100× (b)].
3.2.2. EDS Analysis
The results of elemental analysis performed by energy dispersive x-ray spectroscopy at a point for bio-chars obtained by pyrolysis of (organic matter + paper) fraction of MHSW at 450 °C, 1.0 atmosphere and by catalytic cracking of (organic matter + paper) fraction of MHSW at 475 °C, 1.0 atmosphere, with 10.0% (wt.) Ca(OH)2 as catalyst, in laboratory scale, are shown in Table 4. The content of carbon in bio-char obtained by catalytic cracking of (organic matter + paper) fraction of MHSW at 475 °C, 1.0 atmosphere, with 10.0% (wt.) Ca(OH)2 as catalyst decreases, while those of oxygen and calcium increase. This is probably due to the reaction of metal oxides present in the (organic matter + paper) fraction of MHSW by thermochemical decomposition at 475 °C, 1.0 atmosphere, with Ca(OH)2, forming CaCO3 (calcite) as proposed by Kumagai et al. [58], for the thermal degradation of PET, a fraction of MSW, in the presence of Ca(OH)2. The CaCO3 (calcite) in the form of granules of different sizes are scattered over the carbonized surface of bio-char during the catalytic cracking of (organic matter + paper) fraction of MHSW at 475 °C, 1.0 atmosphere, decreasing the specific reaction area, and thus making the carbonization of (organic matter + paper) fraction of MHSW difficult. A decrease on the carbon content in the solid phase (carbonaceous residue) by pyrolysis of PET in the presence of Ca(OH)2 was also observed/reported by Kumagai et al. [58]. The oxygen content increases due to the formation of CaCO3 (calcite) by decarboxylation of pyrolysis vapor by CaO, an intermediate reaction product obtained by hydrolysis of Ca(OH)2 [58]. Finally, the calcium content is increased by the addition of 10.0% (wt.) Ca(OH)2 as catalyst.

Table 4.
Percentages in mass and atomic mass of bio-chars obtained by pyrolysis of (organic matter + paper) fraction of MHSW at 450 °C, 1.0 atmosphere, and by catalytic cracking of (organic matter + paper) fraction of MHSW at 475 °C, 1.0 atmosphere, with 10.0% (wt.) Ca(OH)2 as catalyst, in laboratory scale.
3.2.3. XRD Analysis
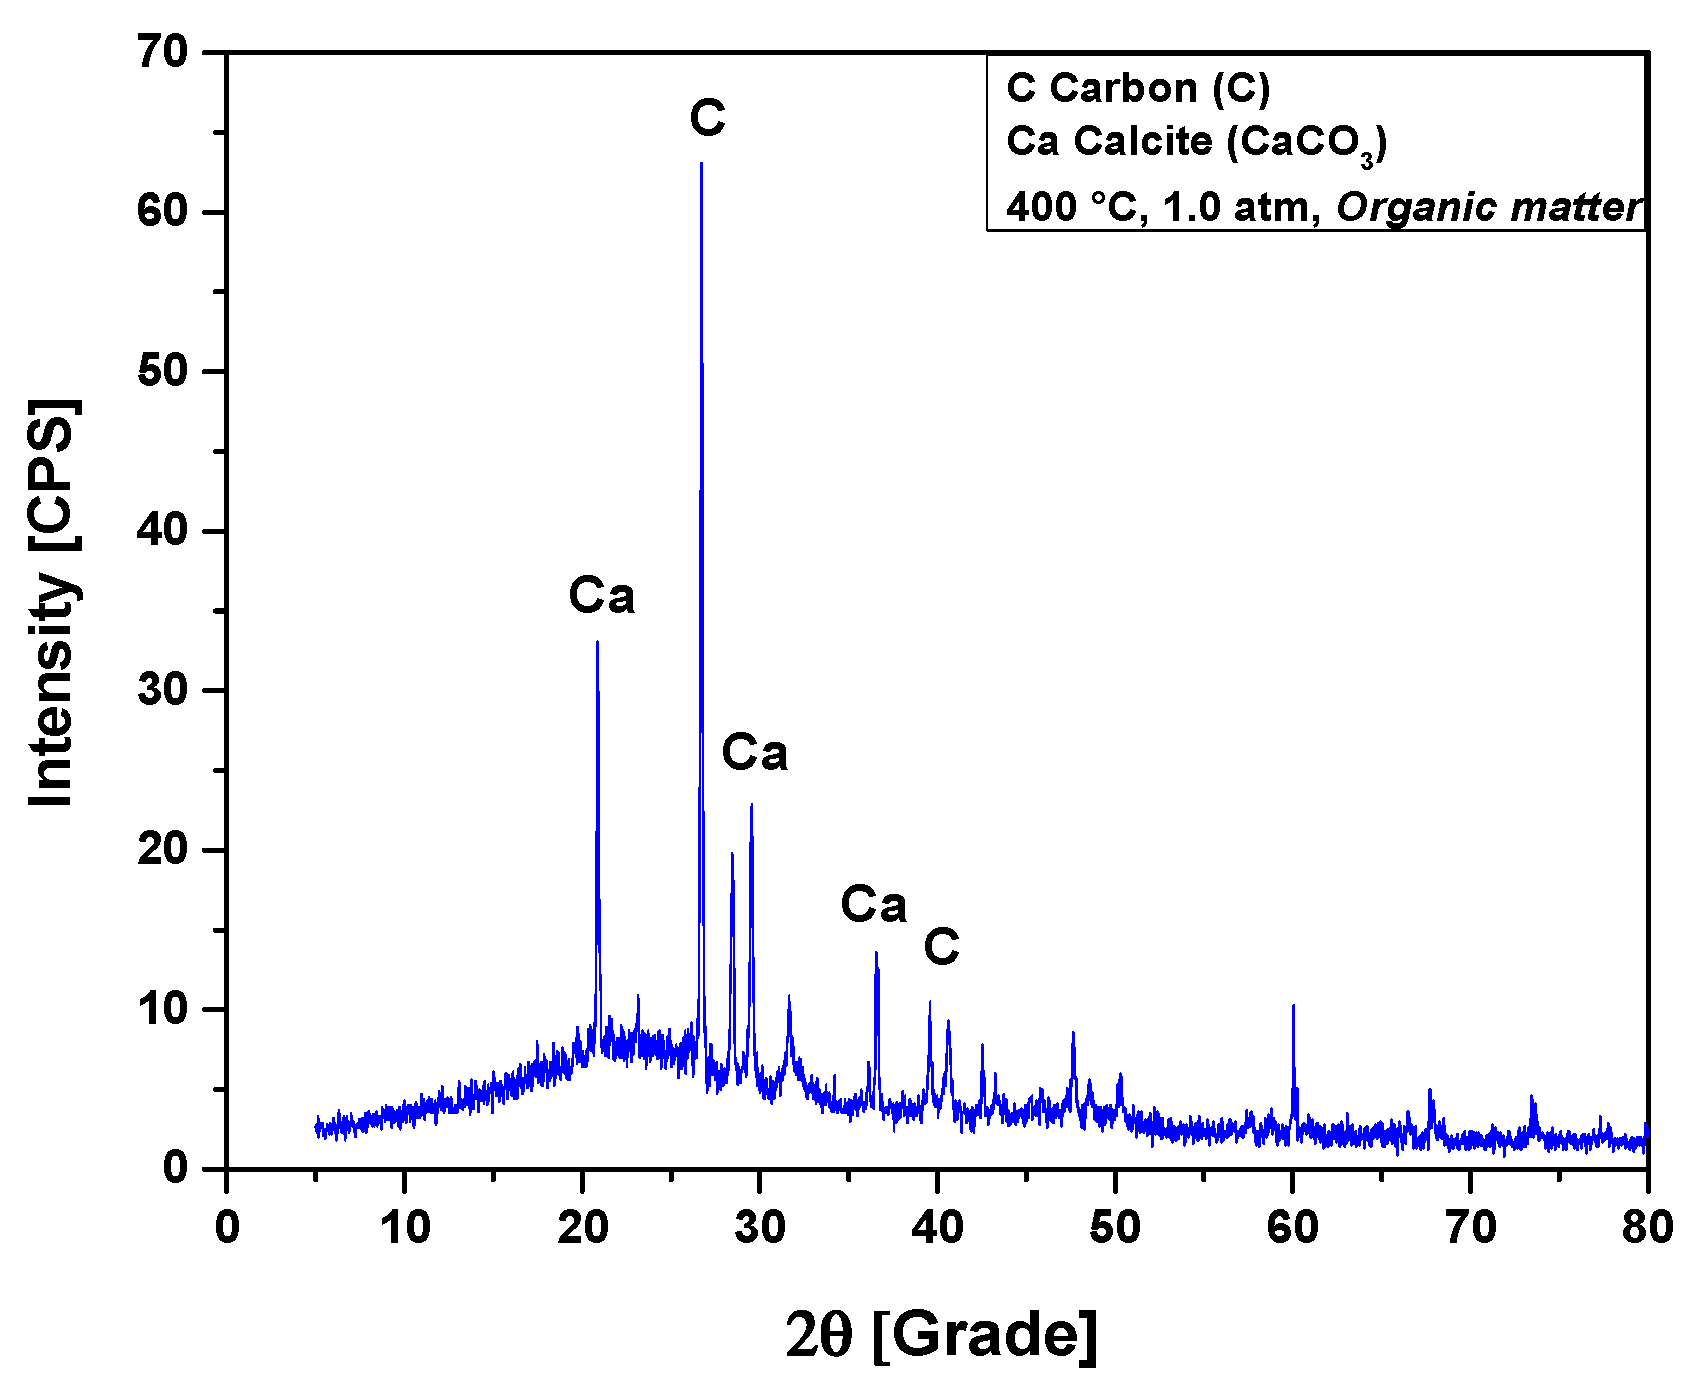
The XRD analysis of bio-char obtained by pyrolysis of (organic matter + paper) a fraction of MHSW at 400 °C, 1.0 atmosphere, is shown in Figure 10. The XRD shows the presence of three peaks associated with the crystalline phase CaCO3 (Calcite), one of high intensity on the position 2θ: 29.5 (100%), another of medium intensity on the position 2θ: 20.8 (50%), and a third of low intensity on the position 2θ: 36.6 (16.2%). This is according to the position 2θ: 29.4 (100%), characteristic of CaCO3 rhombohedral phase (PDF 83-1762) [59,60]. According to Ghavanati et al. [61], the organic fraction of municipal household solid waste contains 4.6 ± 0.6% (wt.) calcium (Ca) on its centesimal composition. Calcium reacts with oxygen to form calcium oxide (2Ca + O2 → 2CaO). During the pyrolysis reaction of organic fractions of municipal household solid waste (OFMHSW), carbon dioxide (CO2) is the major gaseous reaction product formed [26]. Calcite (CaCO3) is formed by the carbonation of calcium oxide (CaO) with CO2 at high temperatures [62]. According to Kumagai et al. [58], calcite (CaCO3) is formed by decarboxylation of OFMHSW pyrolysis vapor compounds containing carboxyl groups, such as carboxylic acids, by CaO [58]. Two peaks were associated with the crystalline phase graphite, a peak of high intensity observed on the position 2θ: 26.7 (100%), while a peak of low intensity was identified on the position 2θ: 42.5 (6.7%).
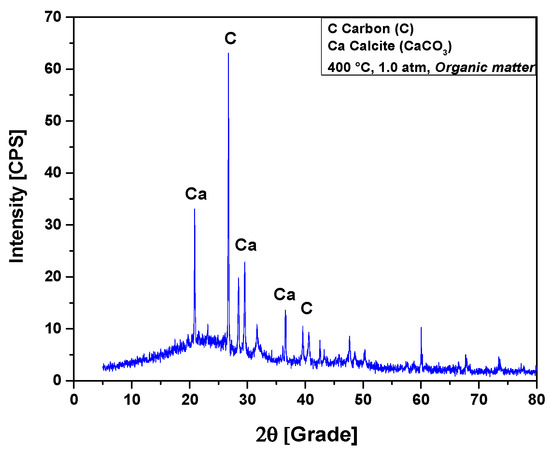
Figure 10.
XRD of solid phase products by pyrolysis of (organic matter + paper) fraction of MHSW at 400 °C, 1.0 atmosphere, using a borosilicate glass reactor of 125 mL, in laboratory scale.
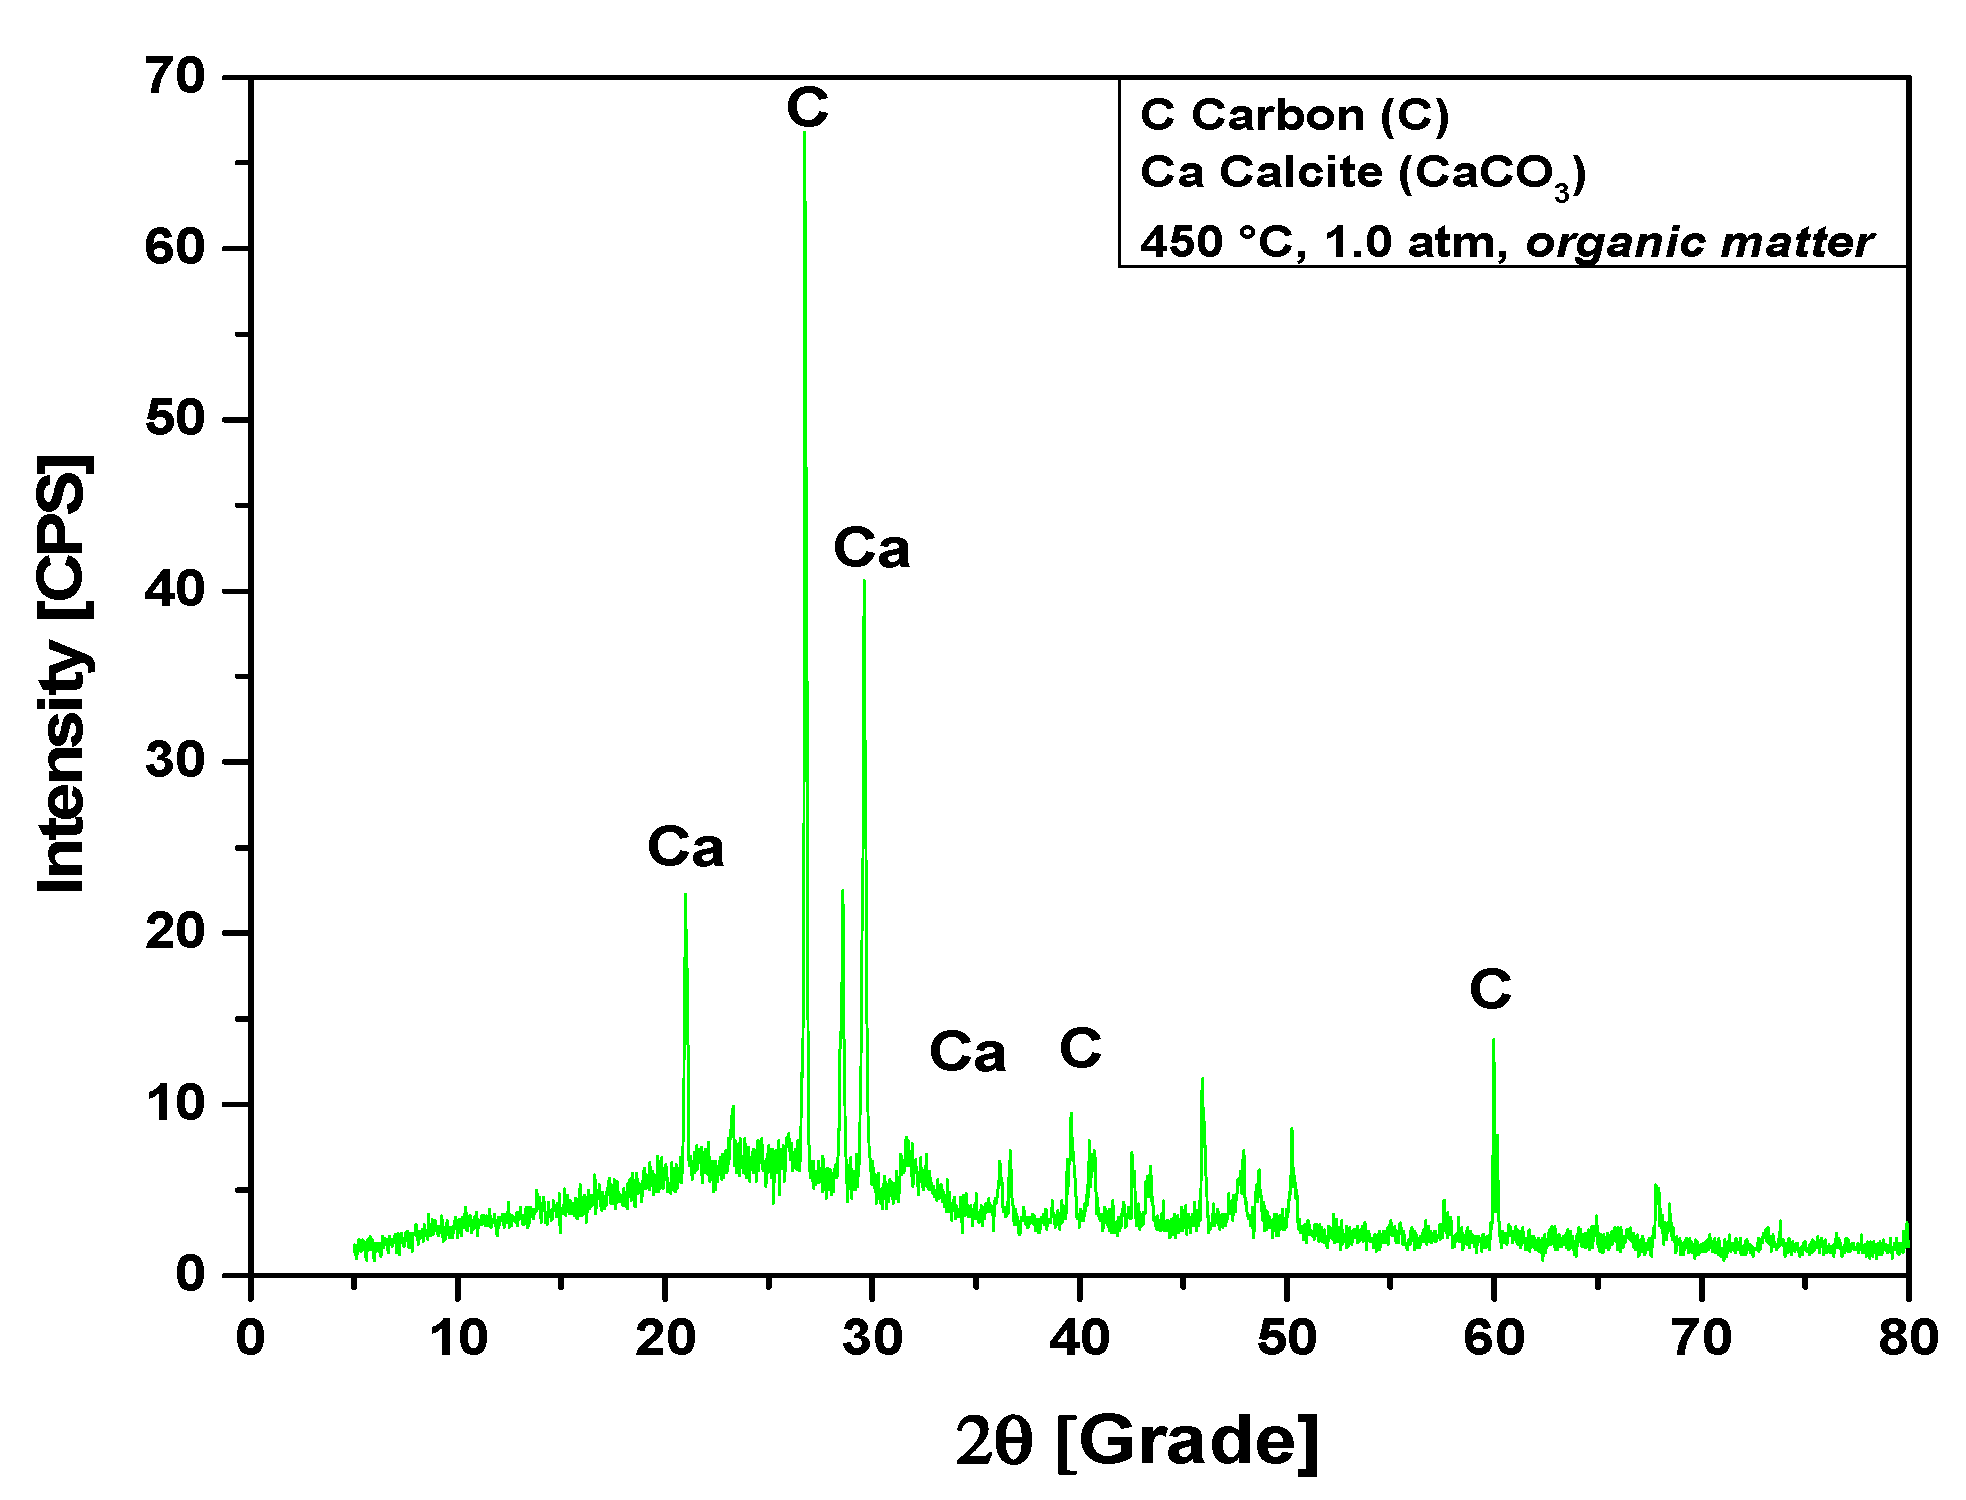
The XRD analysis of bio-char obtained by pyrolysis of (organic matter + paper) fraction of MHSW at 450 °C, 1.0 atmosphere, shown in Figure 11, identified the presence of two crystalline phase, CaCO3 (Calcite) and graphite (C). The XRD shows the presence of three peaks associated with the crystalline phase CaCO3 (Calcite), one of high intensity on the position 2θ: 29.5 (100%), another of medium intensity on the position 2θ: 20.8 (50.7%), and a third of low intensity on the position 2θ: 36.6 (16%). Three peaks were associated with the crystalline phase graphite (C), one peak of high intensity observed on the position 2θ: 26.7 (100%), and two peaks of low intensity identified on the positions 2θ: 42.5 (6.7%) and 2θ: 60.0 (15%).
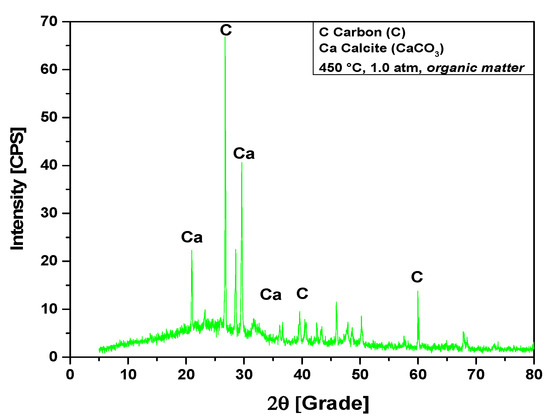
Figure 11.
XRD of solid phase products by pyrolysis of (organic matter + paper) fraction of MHSW at 450 °C, 1.0 atm, using a borosilicate glass reactor of 125 mL, in laboratory scale.
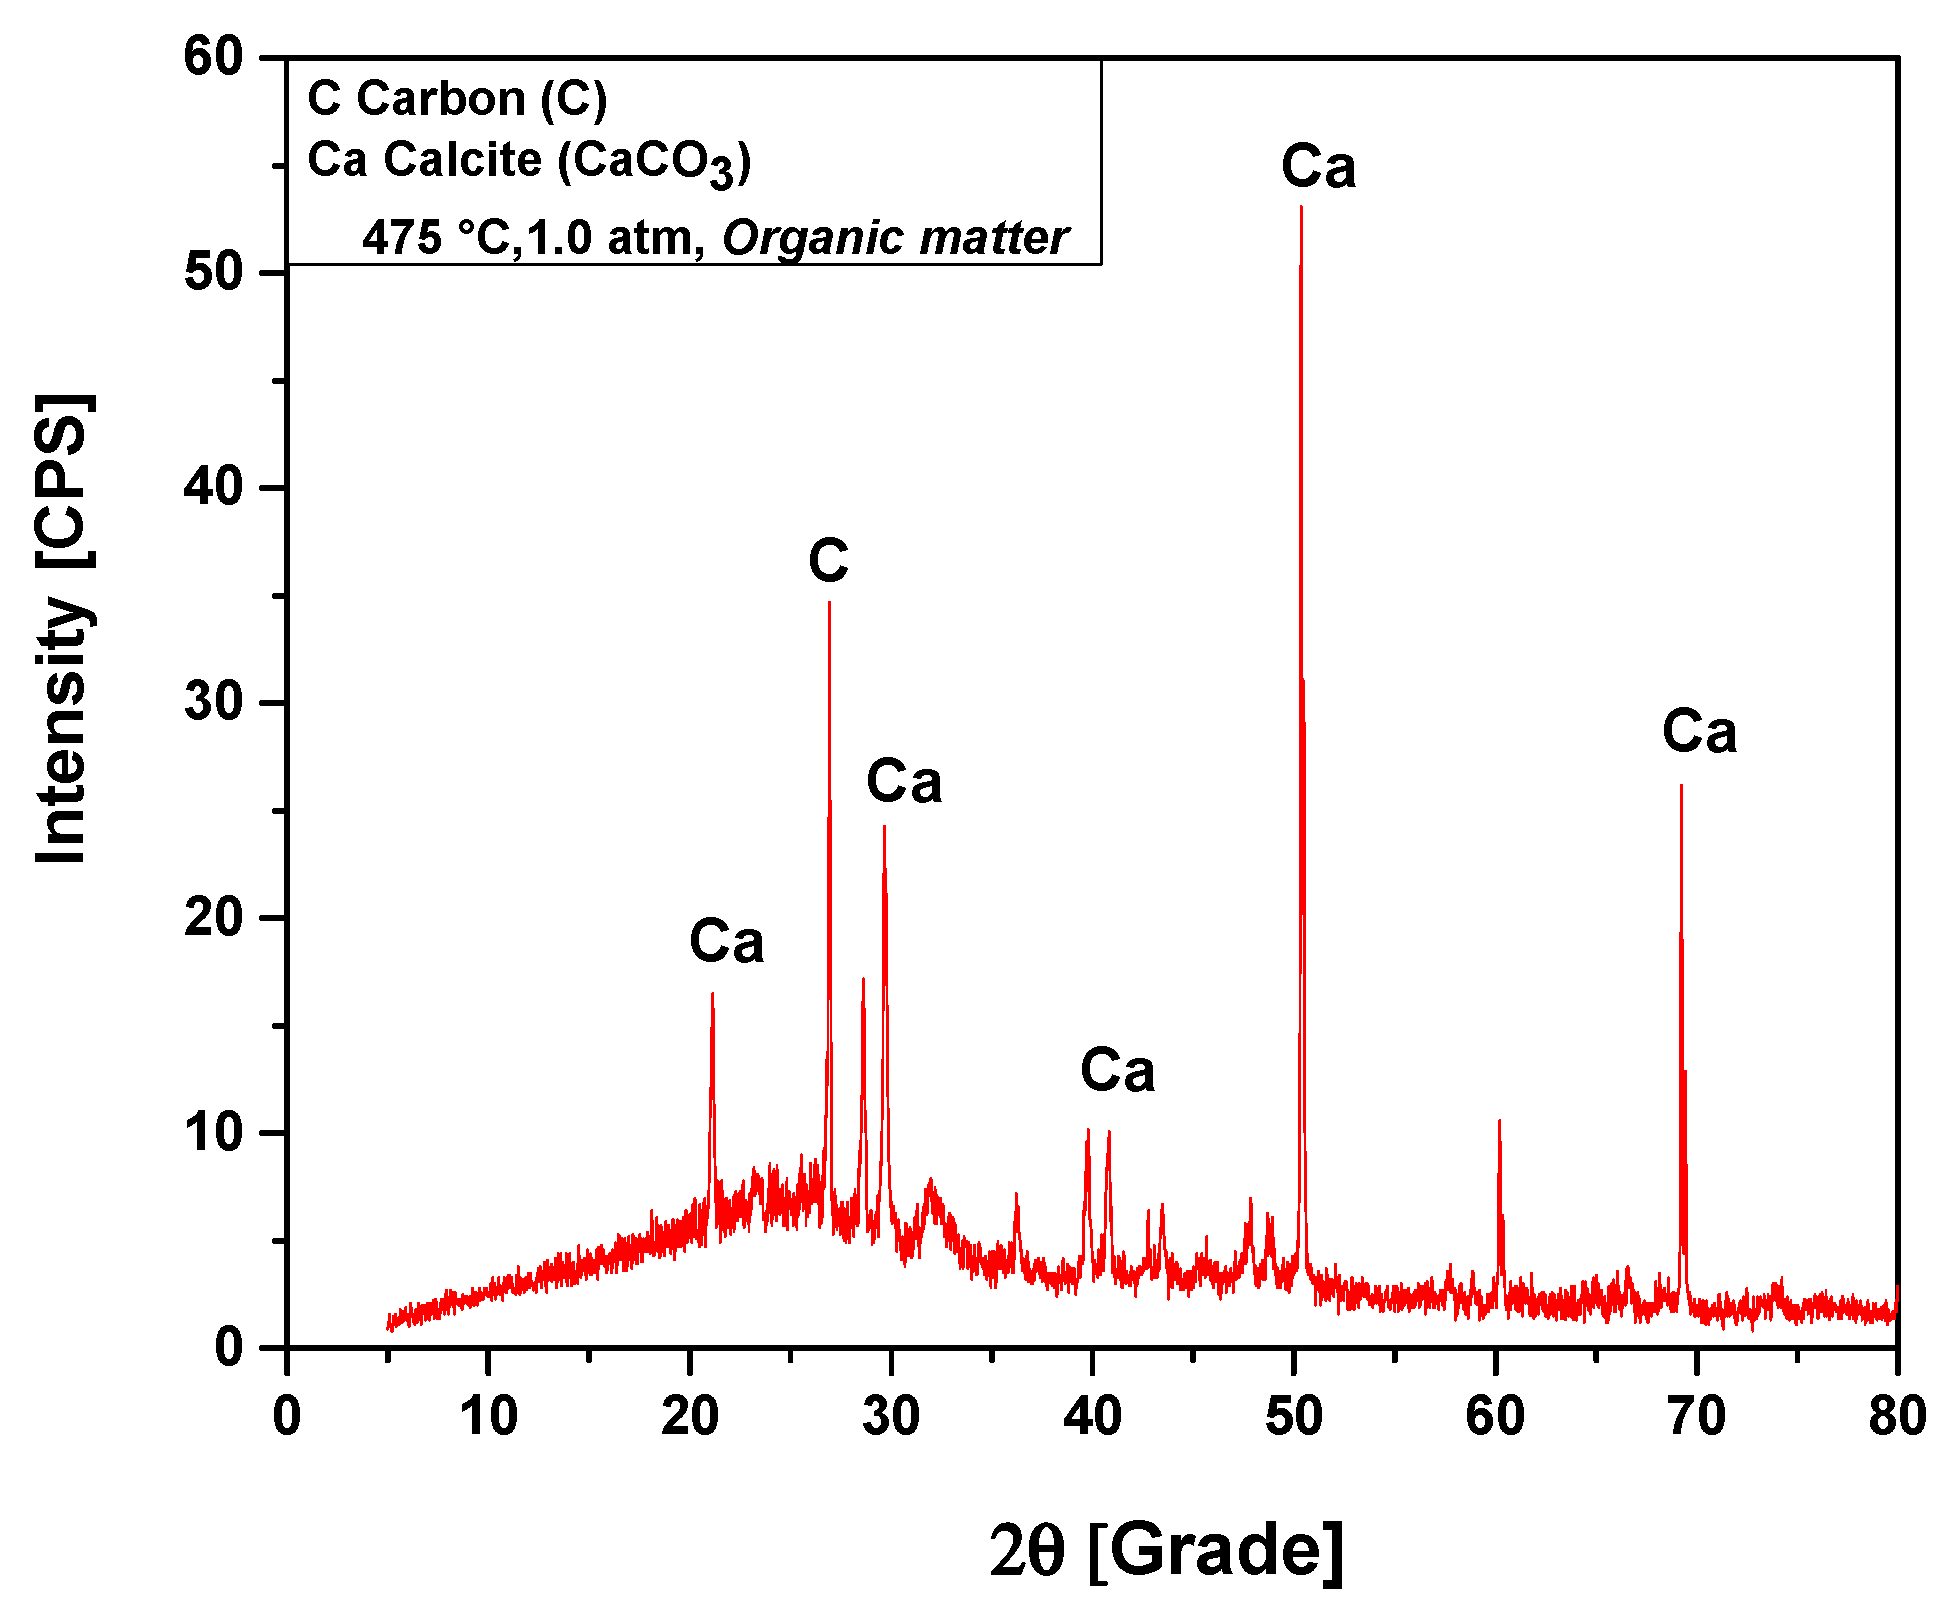
The XRD analysis of bio-char obtained by pyrolysis of (organic matter + paper) fraction of MHSW at 475 °C, 1.0 atmosphere, shown in Figure 12, identified the presence of two crystalline phase, CaCO3 (Calcite) and graphite (C). The XRD shows the presence of four peaks associated with the crystalline phase CaCO3 (Calcite), one of high intensity on the position 2θ: 50.3 (100%), one of medium intensity on the position 2θ: 69.2 (48.9%), and two of low intensity on the positions 2θ: 21.1 (22.2%) and 2θ: 29.6 (38.1%). One peak of high intensity is associated with the crystalline phase graphite, observed on the position 2θ: 26.6 (100%).
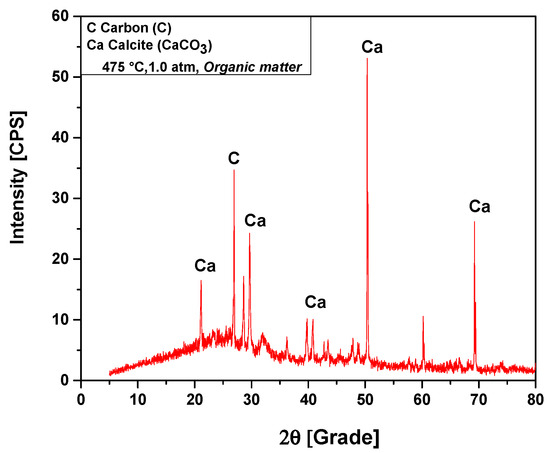
Figure 12.
XRD of solid phase products by pyrolysis of (organic matter + paper) fraction of MHSW at 475 °C, 1.0 atm, using a borosilicate glass reactor of 125 mL, in laboratory scale.
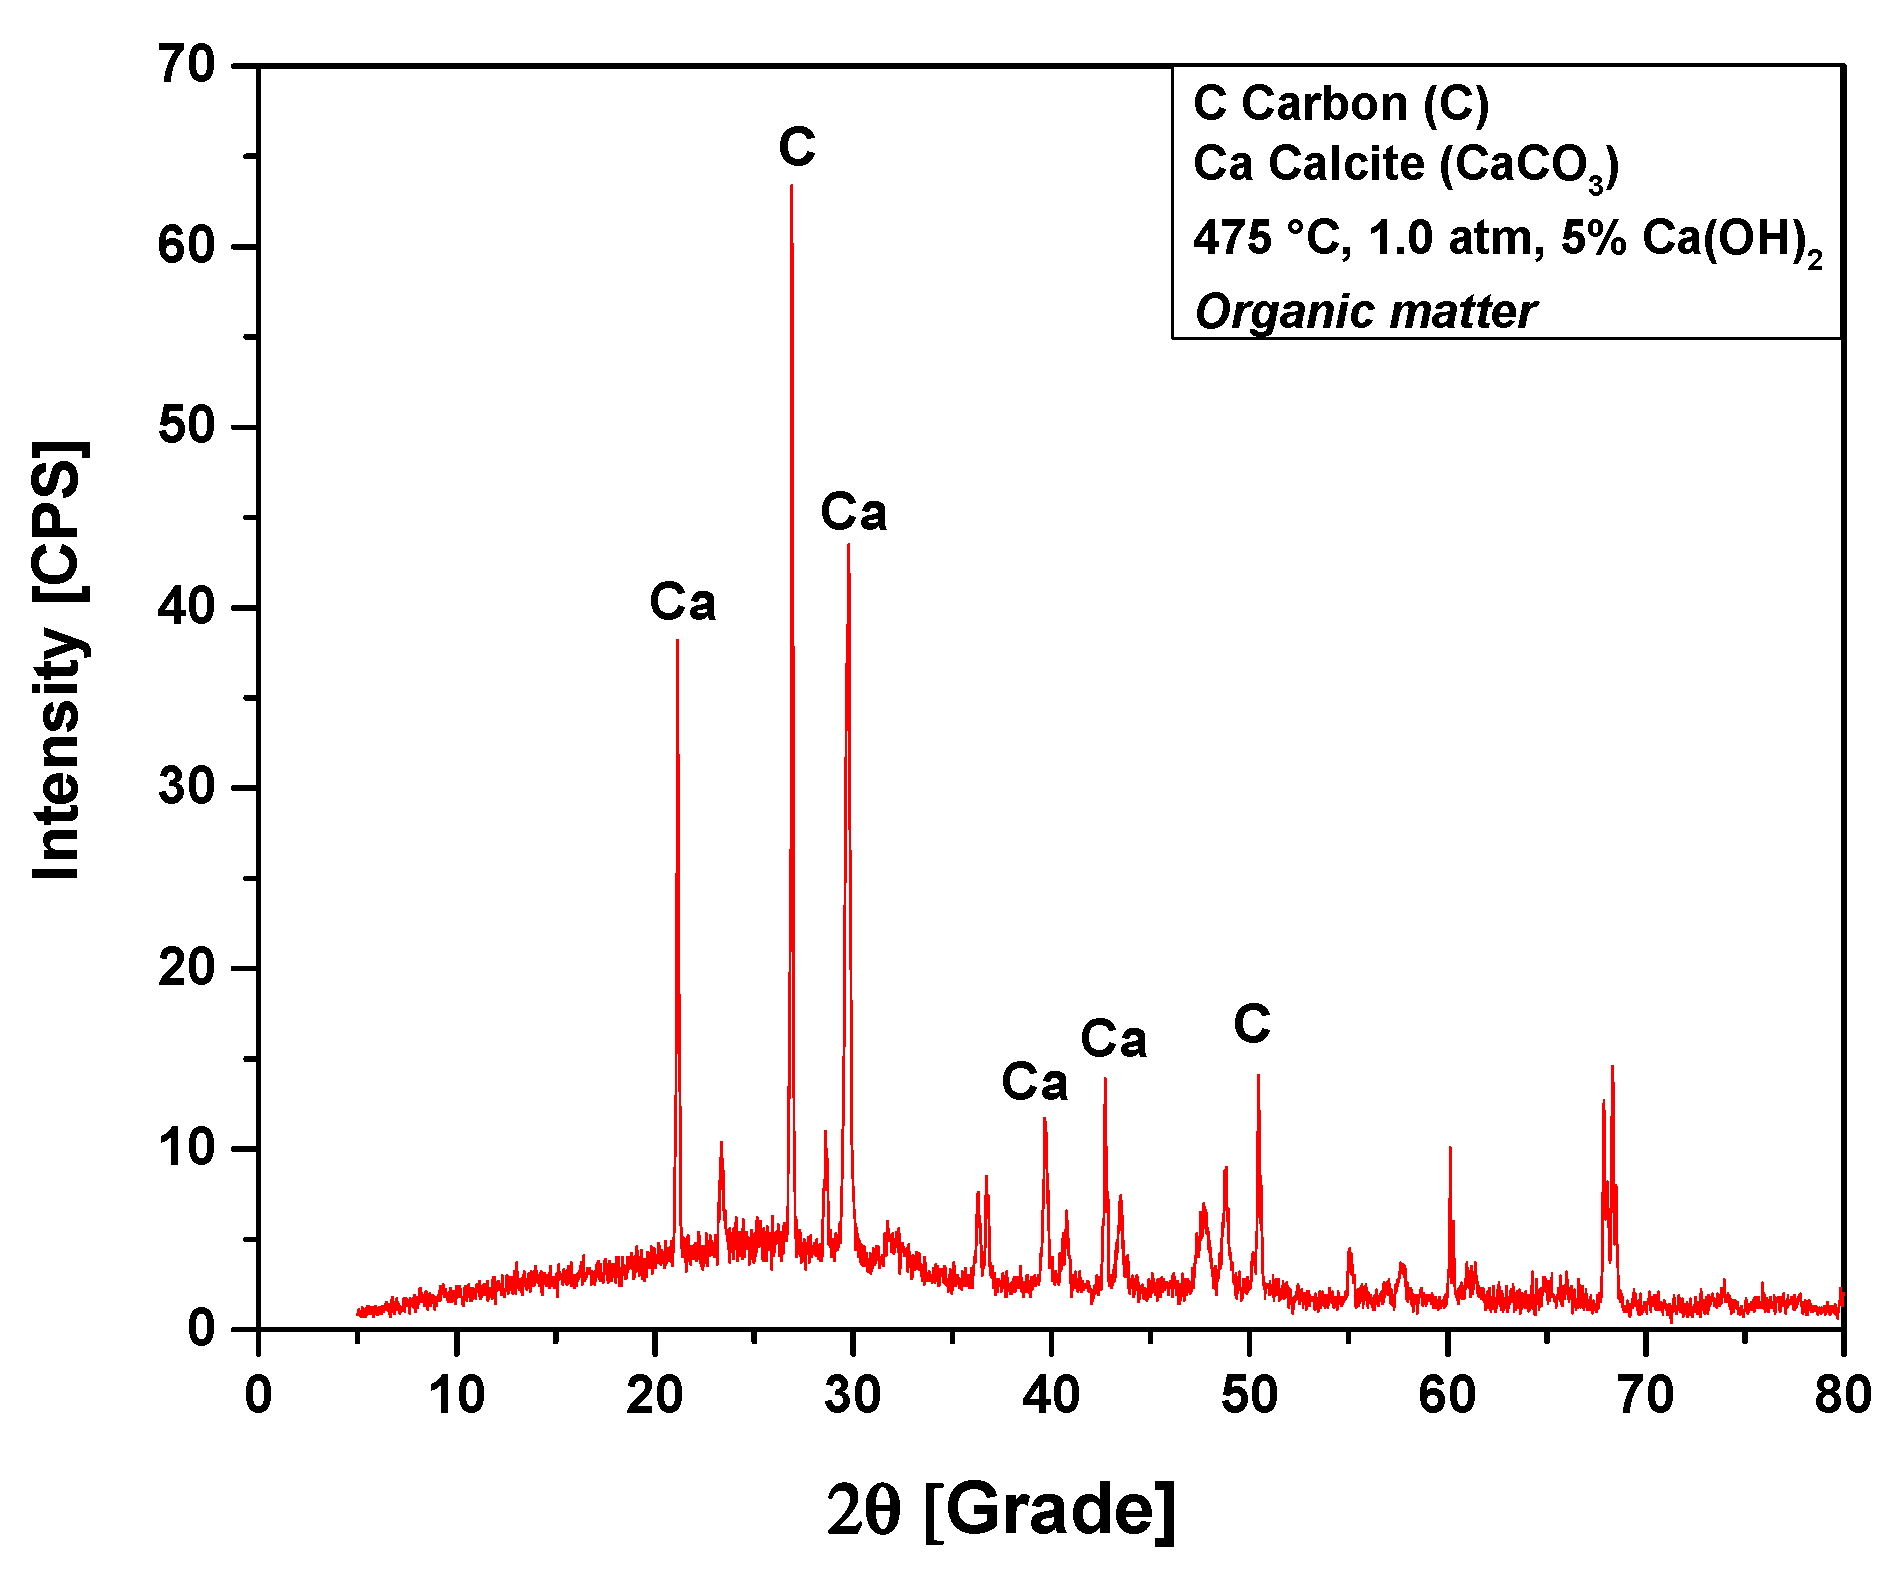
The XRD analysis of bio-char obtained by catalytic cracking of (organic matter + paper) fraction of MHSW at 475 °C, 1.0 atmosphere, with 5% (wt.) Ca(OH)2, shown in Figure 13, identified the presence of two crystalline phases: CaCO3 (Calcite) and graphite (C). Three peaks are associated with the crystalline phase CaCO3 (Calcite), one of high intensity on the position 2θ: 29.7 (100%), two of low intensity on the positions 2θ: 20.8 (50.7%), and a third of low intensity on the position 2θ: 39.8 (13.3%) and 2θ: 42.7 (19.4%). Two peaks were associated with the crystalline phase graphite (C), one peak of high intensity observed on the position 2θ: 26.9 (100%), and the other of low intensity on the positions 2θ: 50.4 (19.5%). One observes an increase on the peak intensity of CaCO3 (Calcite) due to the use of Ca(OH)2 as a catalyst. In fact, Ca(OH)2 reacts at high temperatures, losing a H2O molecule (Ca(OH)2 → CaO + H2O) [58], and CaCO3 is formed by decarboxylation of OFMHSW pyrolysis vapor compounds containing carboxyl groups, such as carboxylic acids, by CaO [58].
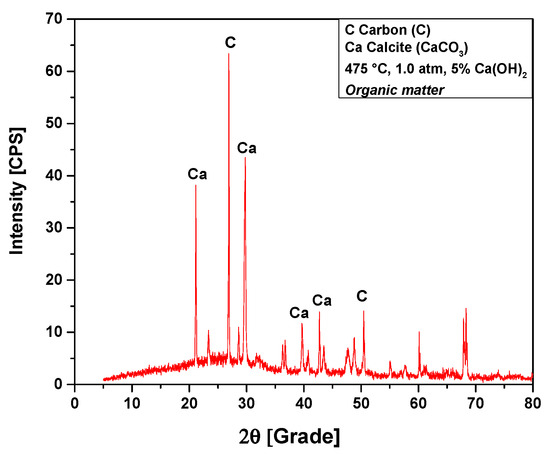
Figure 13.
XRD of solid phase products by catalytic cracking of (organic matter + paper) fraction of MHSW at 475 °C, 1.0 atm, with 5.0% (wt.) Ca(OH)2, using a borosilicate glass reactor of 125 mL, in laboratory scale.
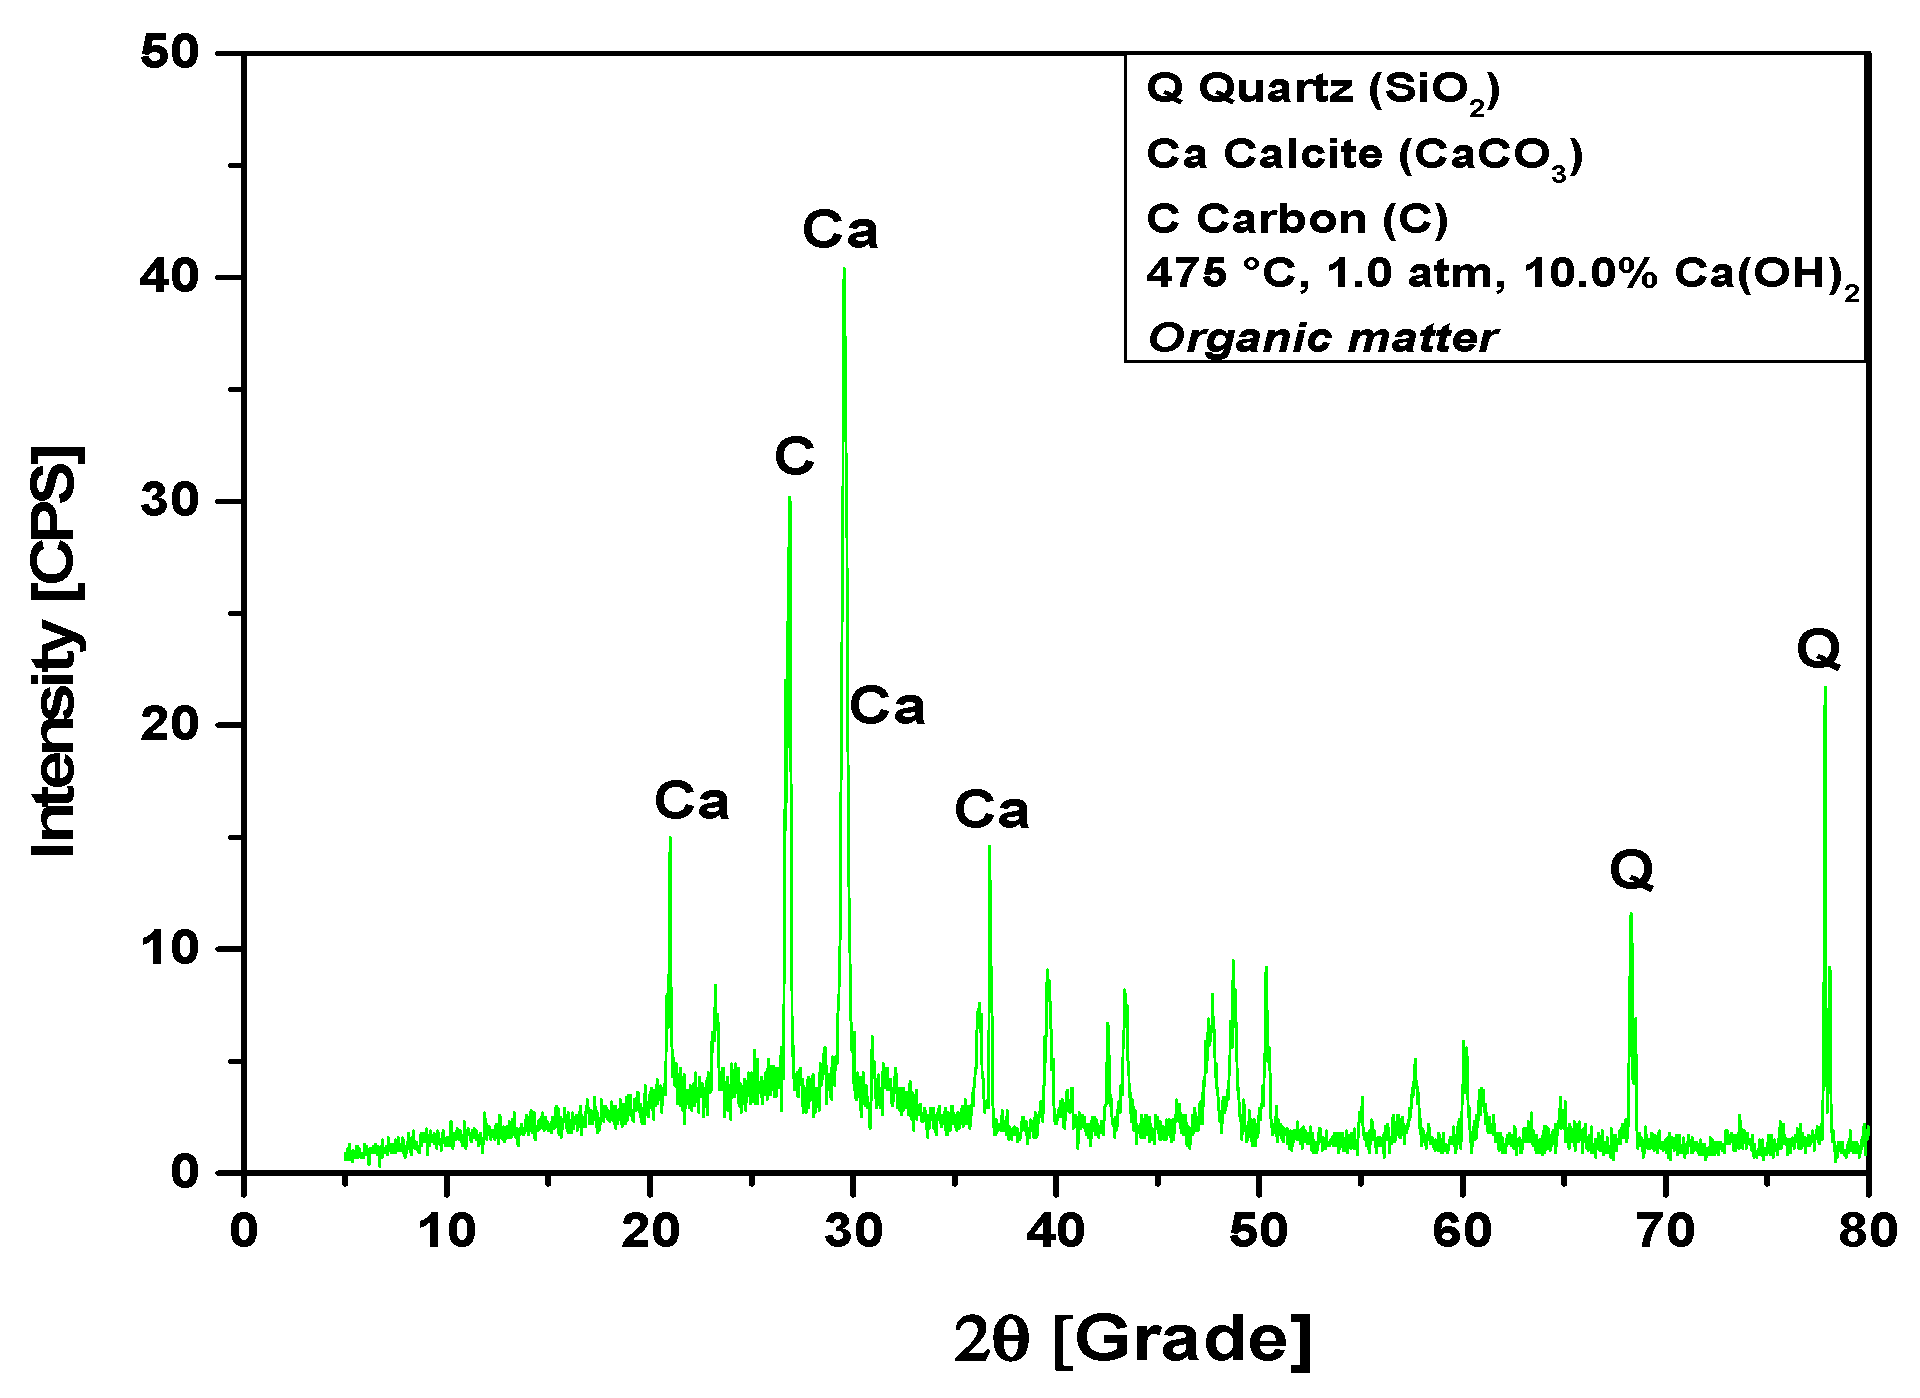
The XRD analysis of bio-char obtained by catalytic cracking of (organic matter + paper) fraction of MHSW at 475 °C, 1.0 atmosphere, with 10% (wt.) Ca(OH)2, shown in Figure 14, identified the presence of three crystalline phase, CaCO3 (Calcite), graphite (C), and quartz (SiO2). The occurrence of quartz (SiO2) is probably due to the presence of small particles of sand within OFMHSW. Four peaks are associated with the crystalline phase CaCO3 (Calcite), one of high intensity on the position 2θ: 29.5 (100%), and three of low intensity on the positions 2θ: 20.9 (31.6%), 2θ: 36.6 (33.3%), and 2θ: 39.5 (16%). One peak of high intensity is associated with the crystalline phase graphite (C) on the position 2θ: 26.8 (100%). One peak of medium intensity is associated with the crystalline phase quartz (SiO2) on the position 2θ: 77.8 (56.8%). In addition, by analyzing the XRD, one observes the high intensity of CaCO3 (Calcite) peaks, proving that higher Ca(OH)2 content leads to a higher intensity of CaCO3 (Calcite) peaks. This causes a decrease on the carbonization degree, that is, the carbon content in bio-char, according to the findings reported by Kumagai et al. [58].
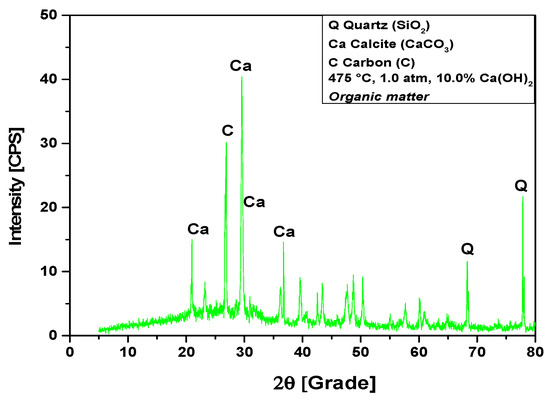
Figure 14.
XRD of solid phase products by catalytic cracking of (organic matter + paper) fraction of MHSW at 475 °C, 1.0 atm, with 10.0% (wt.) Ca(OH)2, using a borosilicate glass reactor of 125 mL in laboratory scale.
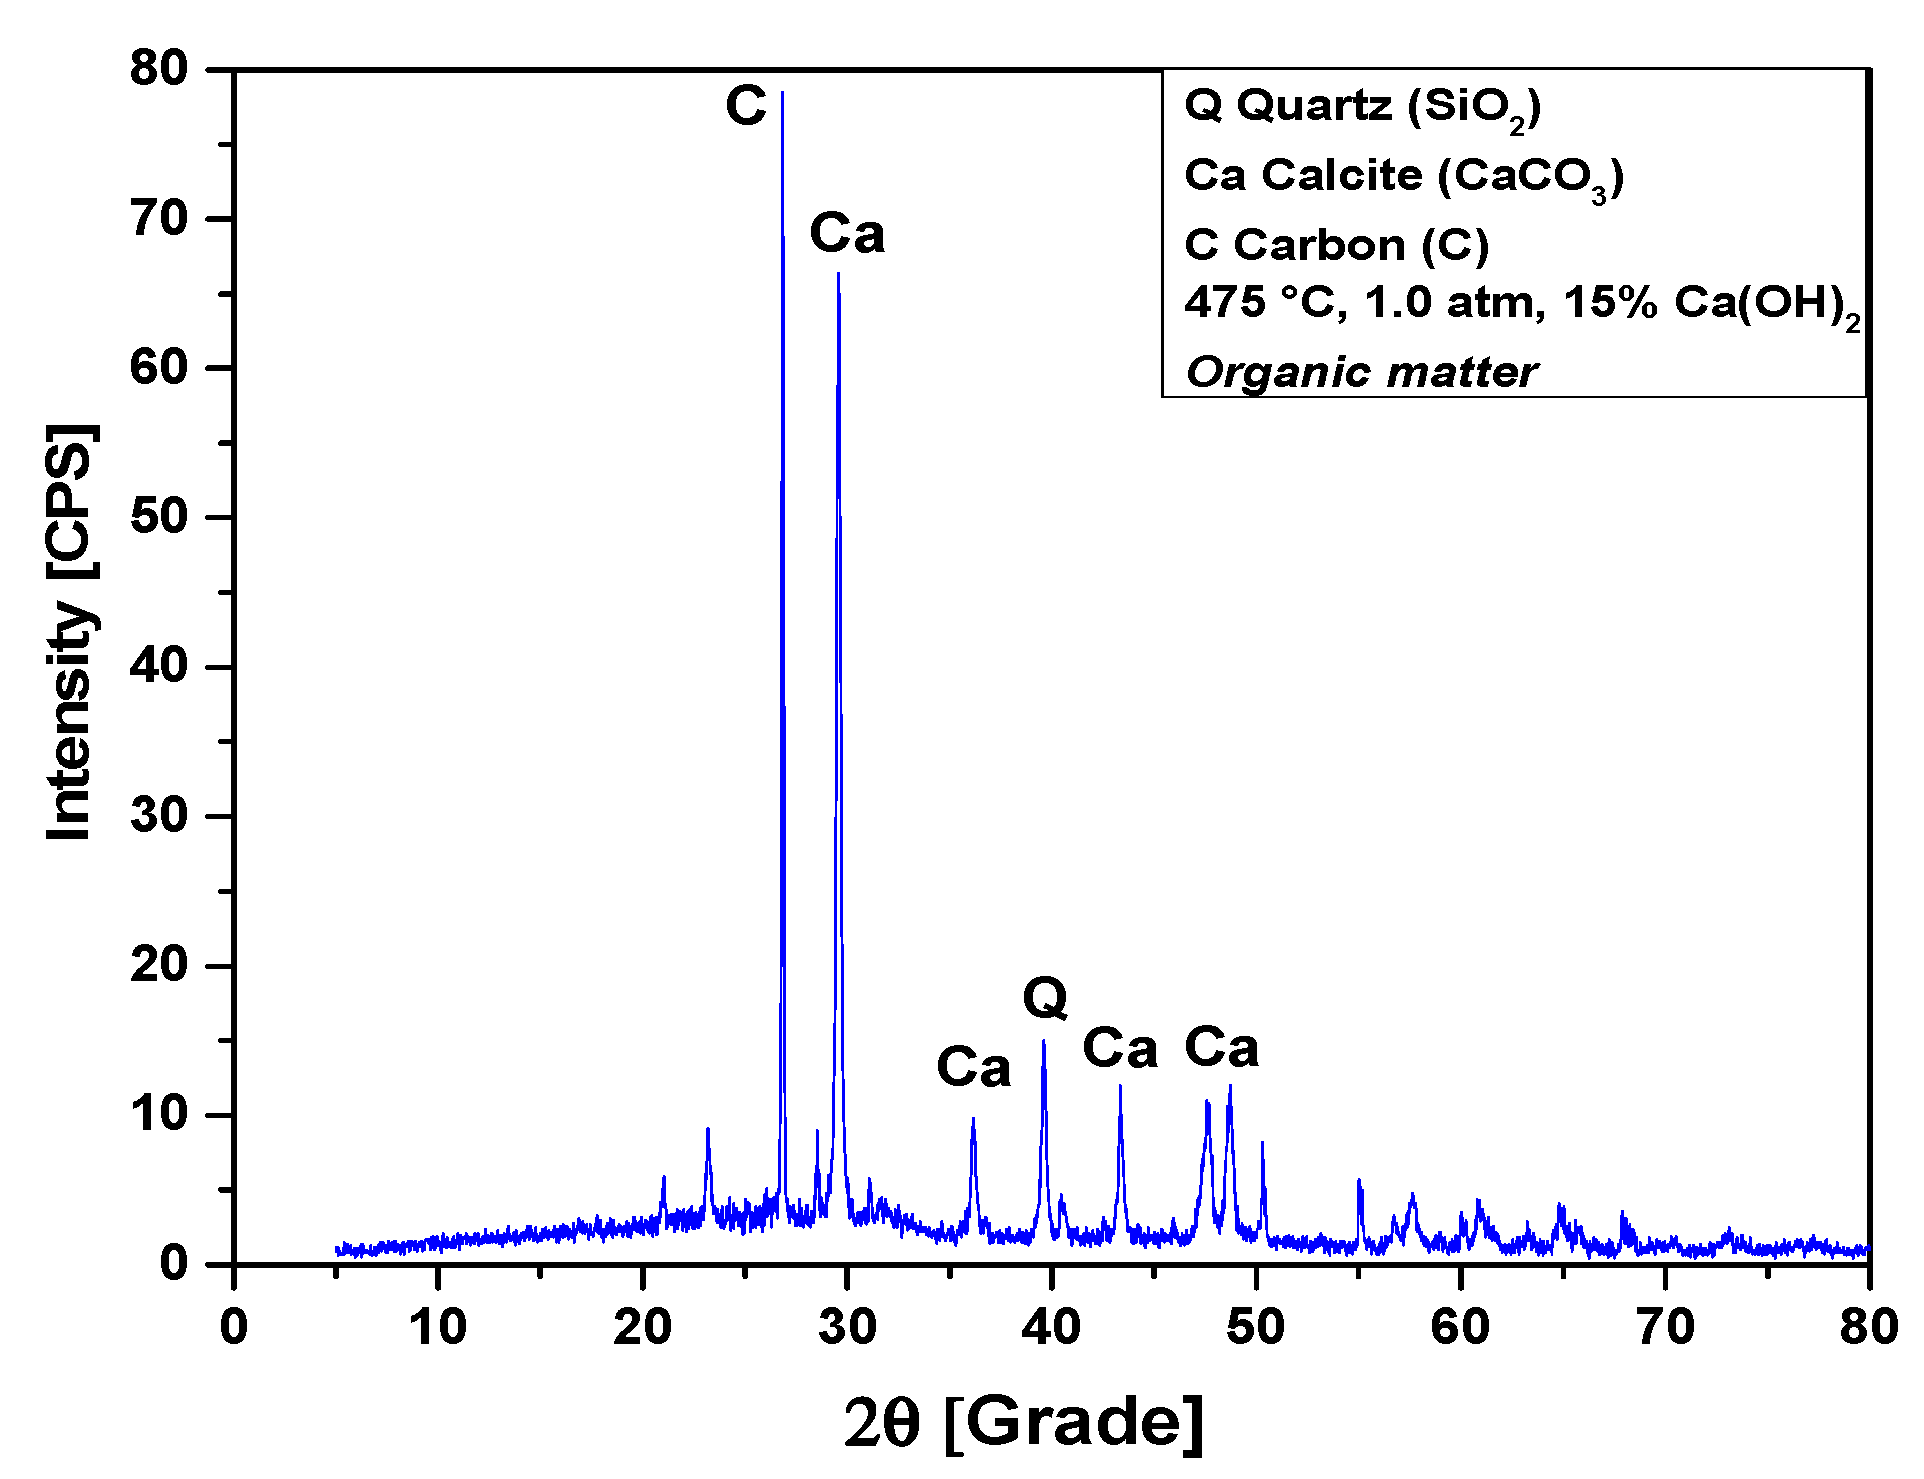
The XRD analysis of bio-char obtained by catalytic cracking of (organic matter + paper) fraction of MHSW at 475 °C, 1.0 atmosphere, with 15% (wt.) Ca(OH)2, shown in Figure 15, identified the presence of three crystalline phase, CaCO3 (Calcite), graphite (C), and quartz (SiO2). The occurrence of quartz (SiO2) is probably due to the presence of small particles of sand within OFMHSW. Three peaks are associated with the crystalline phase CaCO3 (Calcite), one of high intensity on the position 2θ: 29.5 (100%), and two of low intensity on the positions 2θ: 43.3 (12.1%) and 2θ: 36.1 (9%). One peak of high intensity associated with the crystalline phase graphite (C) on the position 2θ: 26.8 (100%). One peak of low intensity associated with the crystalline phase quartz (SiO2) on the position 2θ: 39.6 (30%).
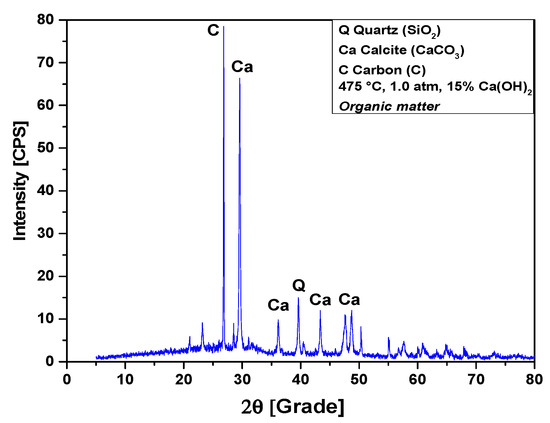
Figure 15.
XRD of solid phase products by catalytic cracking of (organic matter + paper) fraction of MHSW at 475 °C, 1.0 atm, with 15.0% (wt.) Ca(OH)2, using a borosilicate glass reactor of 125 mL, in laboratory scale.
3.3. Gravimetric Analysis of Municipal Household Solid Waste (MHSW)
Route Number, Date, Collecting Time, Mass of MHSW, Percentage of Class of Materials
Table 5 shows the results of gravimetric analysis of MHSW in the city of Belém-Pará-Brazil in the period from 18 October 2021 to 29 October 2021, according to ABNT NBR 1007 [63]. In addition, Table 5 includes the route number, date, collecting time, mass of MHSW, and percentage of MHSW fractions (metal, glass, polymers, carbohydrates + lipids + proteins + fibers = organic matter, textiles, aluminum foil + plastic layers + cardboard + plastic caps + bioplastics = tetra pack, paper, cardboard, paper tissue + masks + disposal diapers + pads = sanitary household waste). By analyzing the data in Table 5, one observes the heterogeneity of MHSW, and hence, the difference on percentage of the different MHSW fractions on different days of collection. As for the variance in mass (wt.%) of each MHSW fraction, the organic matter fraction was higher compared to the other MHSW fractions, as it composes more than half of all other MHSW fractions for all the samples, and the percentage in weight varies between 54.44 and 71.91% (wt.). In the first sampling, 54.44% was obtained (wt.), in the second 65.84% (wt.), and third and fourth samples obtained 58.73% and 71.91% (wt.), respectively. By comparing the results illustrated in Table 5, for the organic fraction of MHSW, with similar data reported in the literature [30,64,65,66,67,68], described in Table 6, one observes that the variance in mass (wt.%) for organic fraction of municipal household solid waste is according to those reported in the literature [65,66,67,68]. In addition, the variance in mass (wt.%) for organic fraction of municipal household solid waste, between 56.21 and 67.45% (wt.), lies between the interval of 56% (wt.) and 64% (wt.) of OFMHSW for middle- and low-income countries [69], which is the case for population income stratus of the neighborhoods of Cremação and Guamá in the city of Belém-Pará-Brazil.

Table 5.
Gravimetric analysis of Municipal Household Solid Waste (MHSW) in the city of Belém-Pará-Brazil on 18 October 2021, 20 October 2021, 27 October 2021, and 29 October 2021 according to ABNT NBR 1007 [63], route number, date, collecting time, mass of MSW, and percentage of class of materials (metal, glass, polymers, carbohydrates + lipids + proteins + fibers = organic matter, textiles, aluminum foil + plastic layers + cardboard + plastic caps + bioplastics = tetra pack, paper, cardboard, paper tissue + masks + disposal diapers + pads = sanitary household waste).

Table 6.
Gravimetric analysis of Municipal Household Solid Waste (MHSW) reported in the literature [30,64,65,66,67,68], and percentage of class of materials (metal, steel, aluminum, glass, sand, plastic films + rigid plastics = polymers/plastics, carbohydrates + lipids + proteins + fibers = organic matter, wood, textiles, rubber, leather, aluminum foil + plastic layers + cardboard + plastic caps + bioplastics = tetrapak, paper, cardboard, paper tissue + masks + disposal diapers + pads = sanitary household waste, others).
Table 7 shows the results of ANOVA applied to the percentages of each MHSW fraction material in relation to the total mass of the sample.

Table 7.
ANOVA applied to the percentages of each MHSW fraction material in relation to the total mass of the sample for the gravimetric analysis of MHSW.
The F-value (134.08) was higher than the critical F-value (2.305), meaning that the null hypothesis, that is, that all population means of the samples are equal, was rejected. Thus, the materials of MHSW present considerable variation from the averages of their individual percentage values. In addition, as the analysis used a 95% confidence level, the fact that the P-value is less than 0.05 demonstrates that the type of material is significant, that is, it effects the percentage values of MHSW fraction materials in relation to the total mass of the samples.
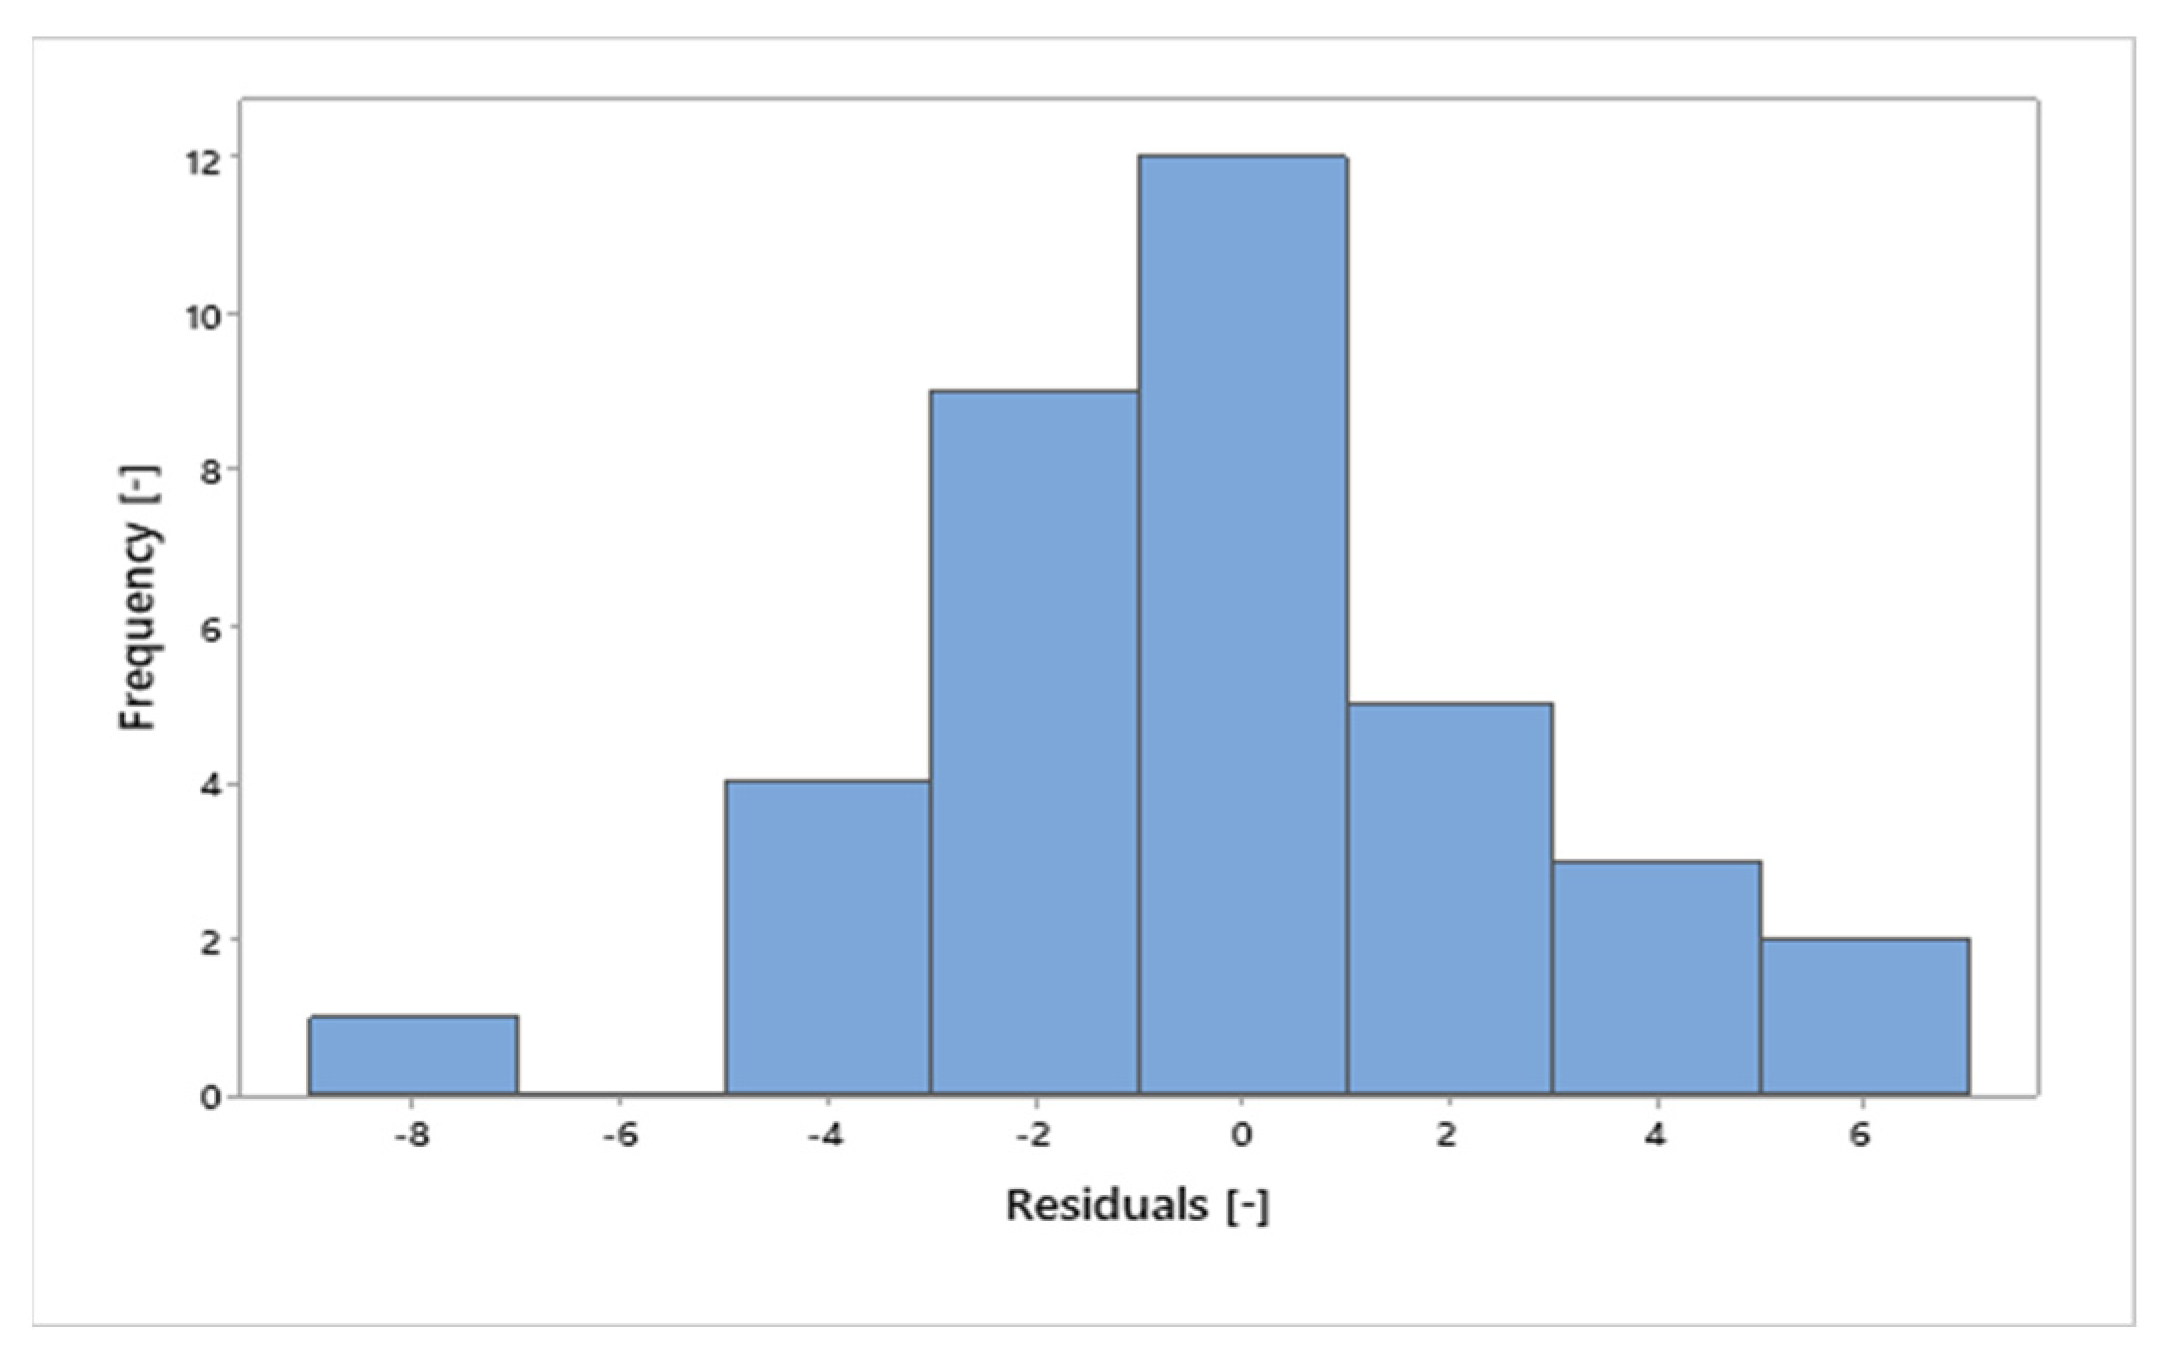
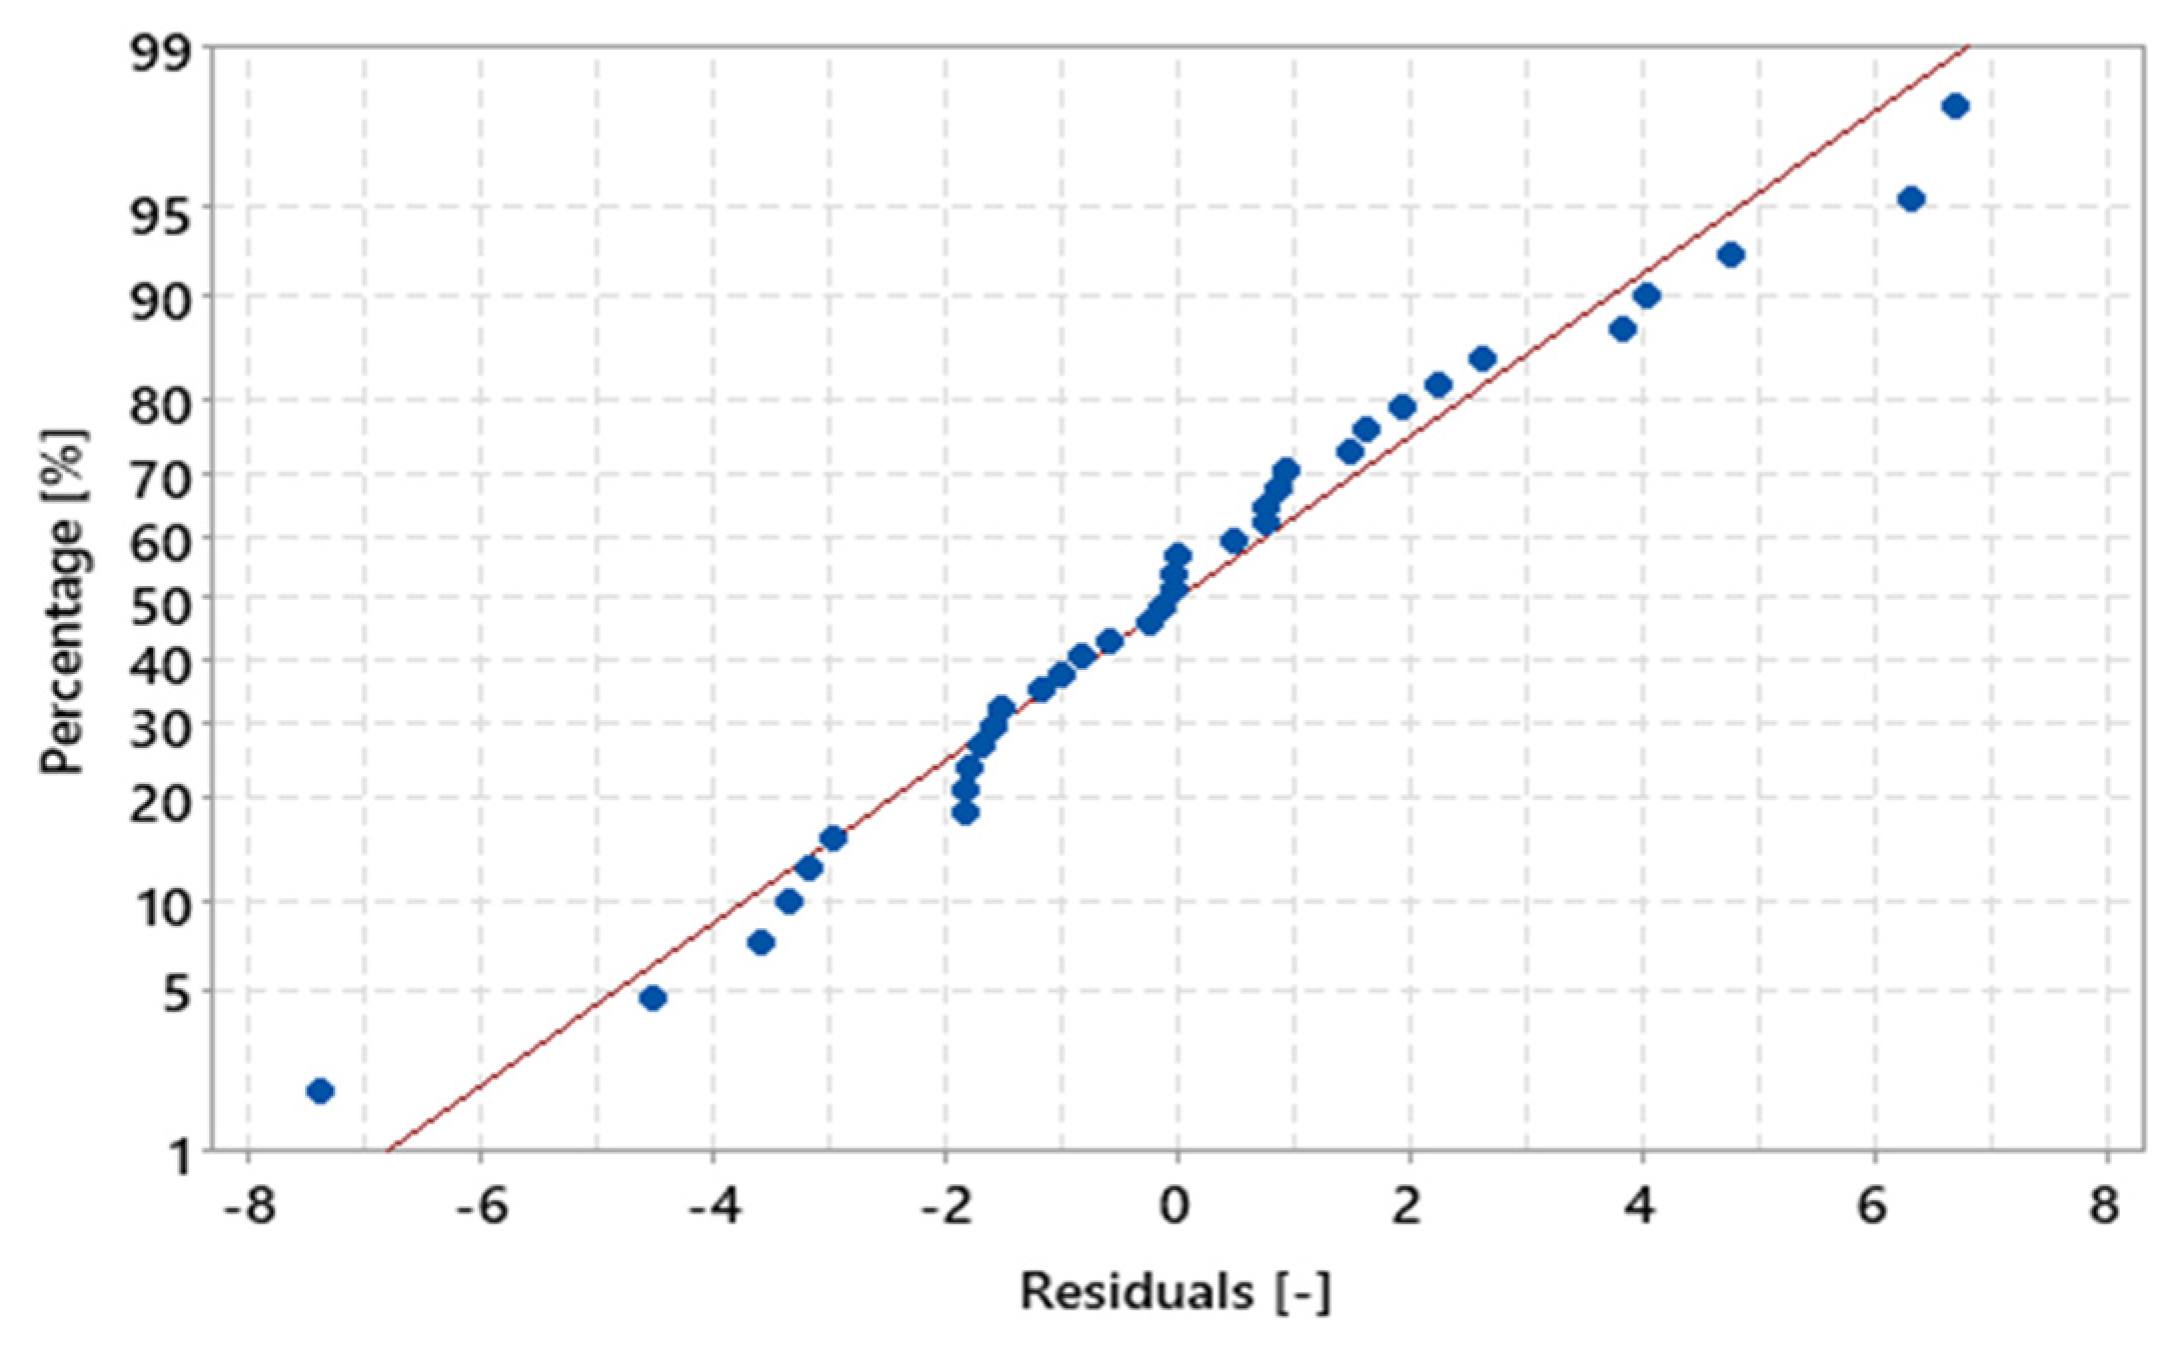
In Figure 16, it can be seen that the residuals behave similarly to a bell-shaped normal curve. Figure 17 shows the values of the residuals that fall along an approximately straight line, which contributes to the statement that the residuals are normally distributed. Furthermore, the value of the coefficient of determination (R²) was 97.54%, indicating that the percentage values in relation to the total mass of the sample are strongly explained by the variable “MHSW fraction materials”.
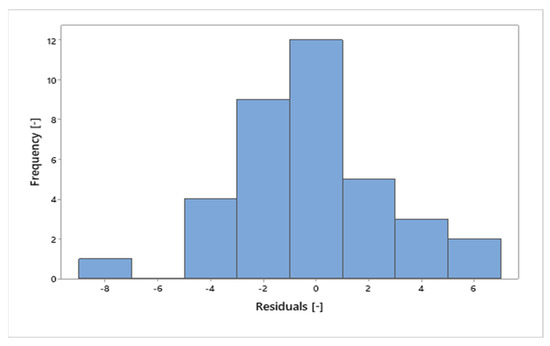
Figure 16.
Frequency x residuals for the statistical analysis of gravimetric data of MHSW in the city of Belém-Pará-Brazil on 18 October 2021, 20 October 2021, 27 October 2021, and 29 October 2021.
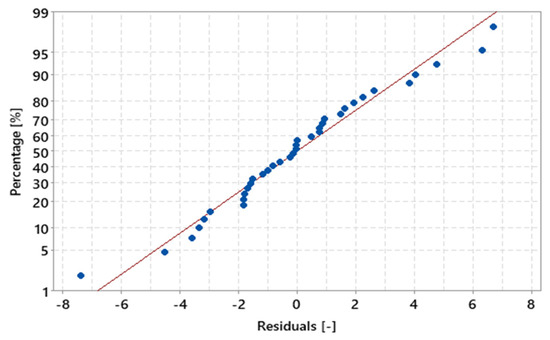
Figure 17.
Percentage of MHSW fraction materials x residuals for the statistical analysis of gravimetric data of MHSW in the city of Belém-Pará-Brazil on 18 October 2021, 20 October 2021, 27 October 2021, and 29 October 2021.
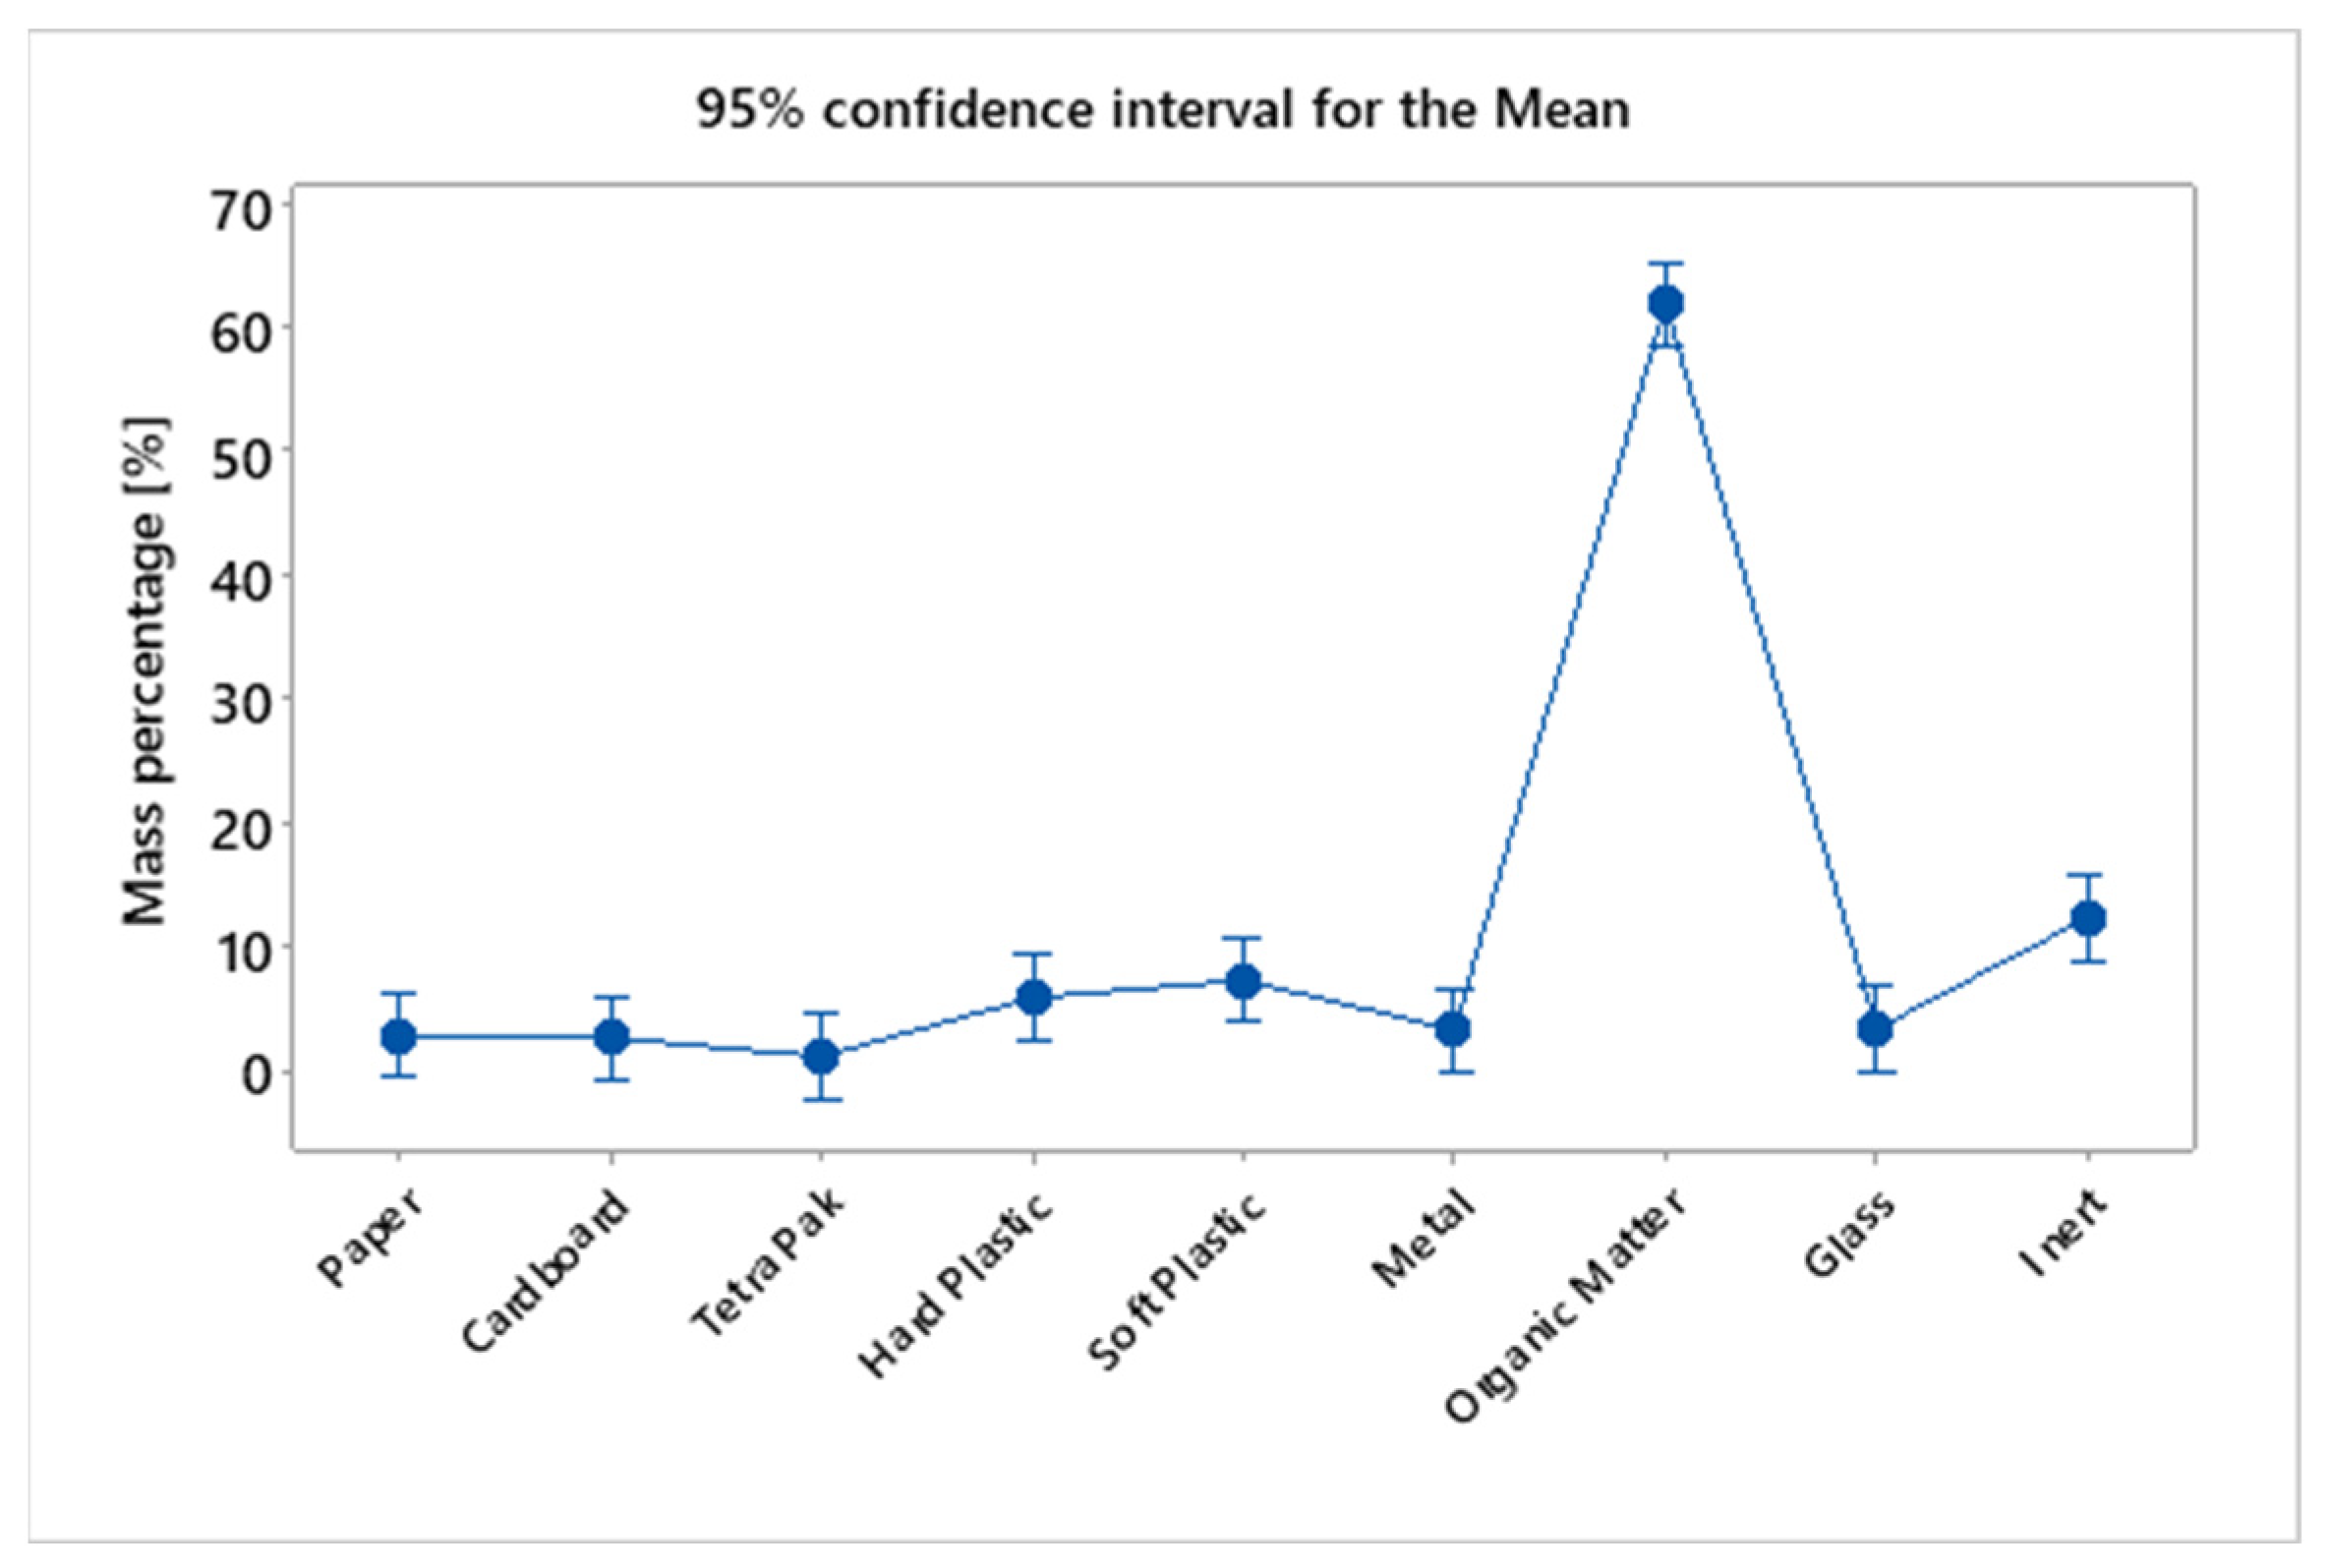
In Table 8, the result of the Tukey test is presented, demonstrating that the averages of the percentage values of MHSW fraction materials are not the same, grouping them in different sets. The Tukey test generated 3 different groups, group A composed only of organic-base materials, having the highest average percentage (61.83%), followed by group B, composed of inert materials (12.29%), light (7.22%), and heavy plastics (5.83%). Group C, on the other hand, is composed of materials with the lowest percentage representation in relation to the total mass of the sample for the gravimetric analysis of MHSW, ranging from 1.08% to 7.22%. It can be observed that light and heavy plastics were part of groups B and C because they are at the intersection of the elements of sets formed by groups B and C. Figure 18 shows the mass percentage of MHSW fraction materials in a 95% confidence interval.

Table 8.
TURKEY test applied to the percentages of each MHSW fraction material in relation to the total mass of the sample for the gravimetric analysis of MHSW.
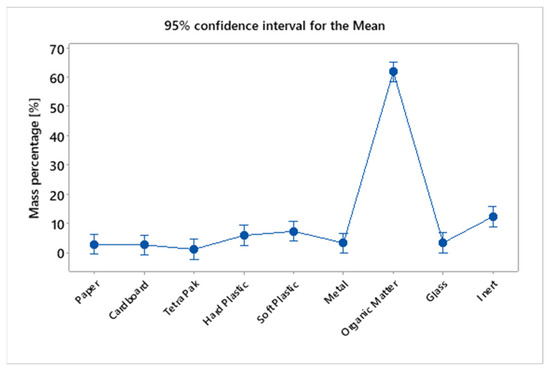
Figure 18.
Mass percentage of MHSW fraction materials in a 95% confidence interval for the statistical analysis of gravimetric data of MHSW in the city of Belém-Pará-Brazil on 18 October 2021, 20 October 2021, 27 October 2021, and 29 October 2021.
3.4. Pyrolysis of MHSW Fraction (Organic Matter + Paper) in Fixed Bed Reactor
3.4.1. Process Conditions, Mass Balances, and Yields of Reaction Products
Influence of Pyrolysis Temperature
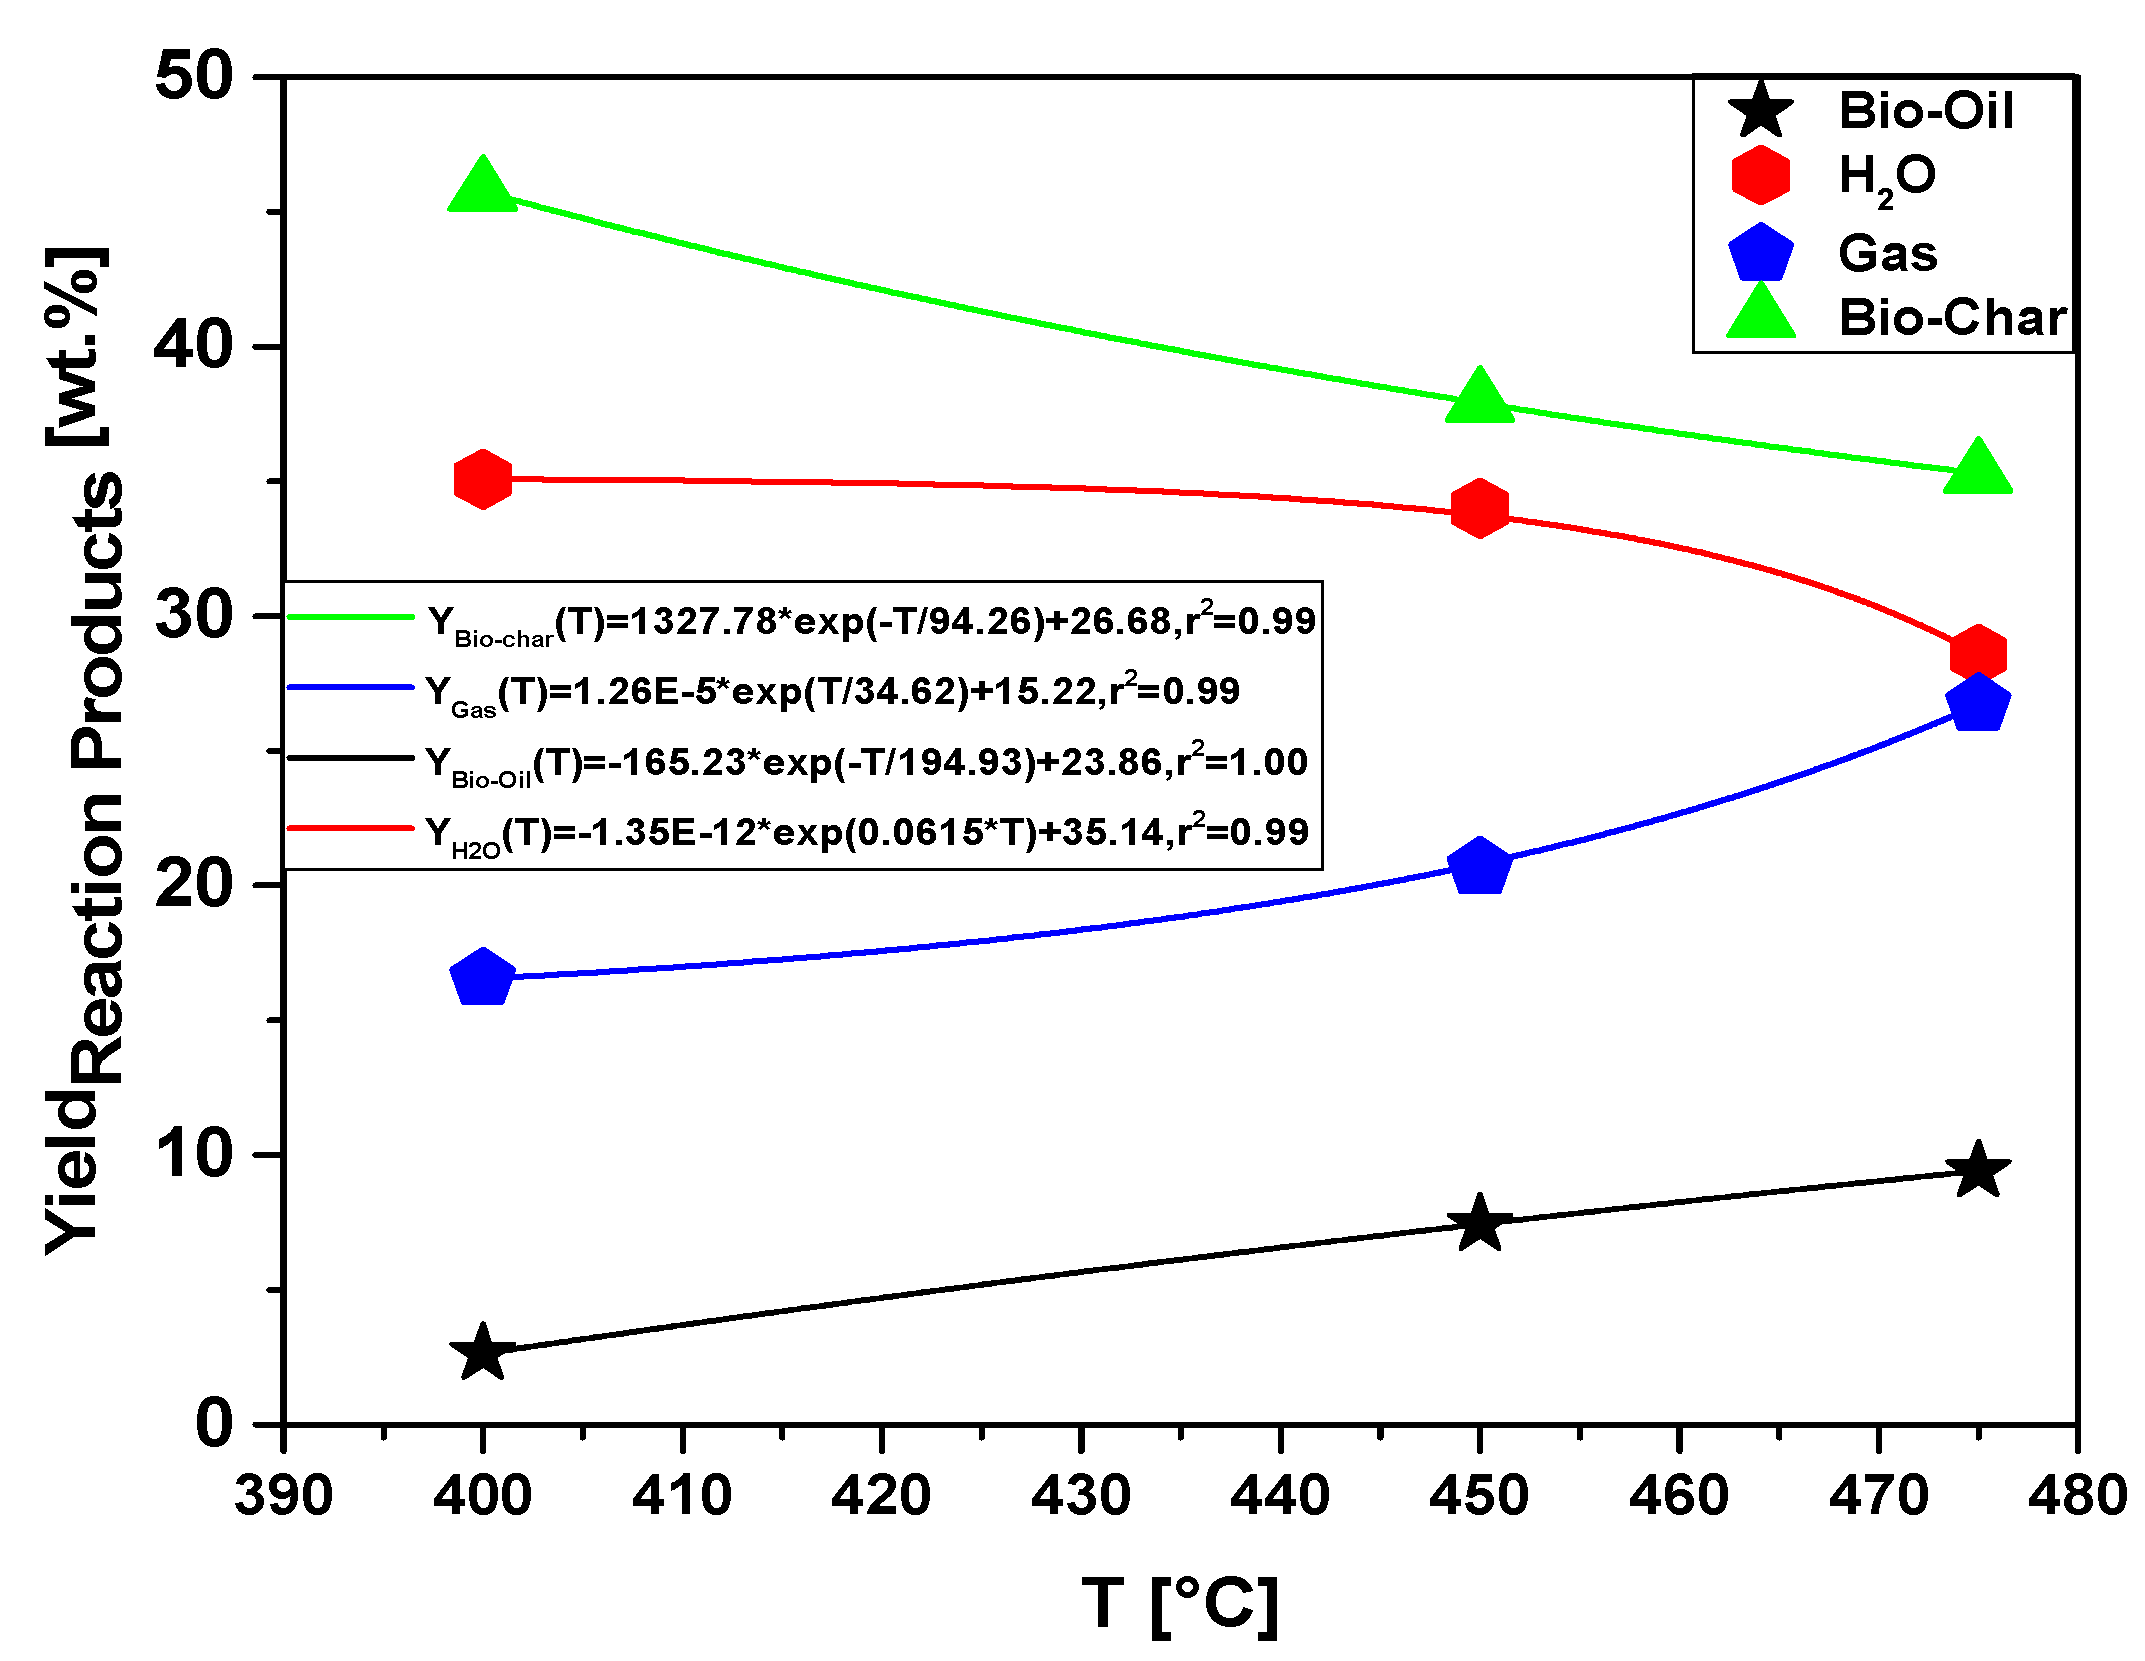
The process parameters, mass balances, and yields of reaction products (liquids, solids, H2O, and gas) by pyrolysis of MHSW fraction (organic matter + paper) at 400, 450, and 475 °C, 1.0 atmosphere, in laboratory scale, are illustrated in Table 9 and Figure 19. With the results described, it was possible that the highest yield among the thermal experiments performed was for the formation of bio-char, 45.75% (wt.) at 400 °C, consequently having a decrease in the yield of bio-oil that obtained value of 2.63% (weight). For the formation of bio-oil, the highest yield among the experiments was 9.41% (wt.) at a temperature of 475 °C. Furthermore, there was significant formation for the aqueous and gas phase of 35.08% (wt.) and 26.72% (wt.) for temperatures of 400 °C and 475 °C, respectively. The bio-oil yield increases with pyrolysis temperature, as more energy is available to promote the fragmentation of strong organic chemical bonds. Temperature has a great effect on the distribution of reaction products.

Table 9.
Process parameters, mass balances, and yields of reaction products (liquids, solids, H2O, and gas) by pyrolysis of MHSW fraction (organic matter + paper) at 400, 450, and 475 °C, 1.0 atmosphere, in laboratory scale.
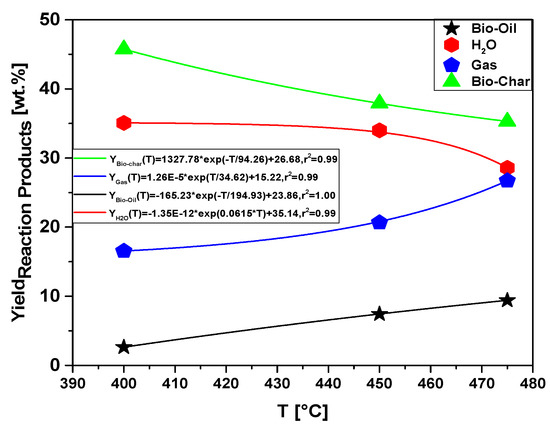
Figure 19.
Effect of pyrolysis temperature on the yields of reaction products (bio-oil, aqueous phase, bio-char, and gas) by pyrolysis of MHSW fraction (organic matter + paper) at 400, 450, and 475 °C, 1.0 atmosphere, in laboratory scale.
The yield behavior of bio-oil is according to similar studies reported in the literature for pyrolysis of MSW [8,12,13,19,23,24,26,27,31]. In all the studies, the yield of bio-oil increases with temperature between 350 and 600 °C, decreasing after 600 °C, while that of bio-char decreases [8,12,13,19,23,24,26,27,31]. In addition, the yield of gas increases continuously [8,12,13,23,24,26,27,31]. Song et al. [24] reported, for the pyrolysis of MSW, that the yield of bio-char increases between 400 and 600 °C, reaching a maximum at 600 °C and decreasing after 600 °C, while that of bio-char decreases almost exponentially, and the gas yield increases continuously, according to the yields of reaction products as a function of temperature plotted in Figure 19.
Influence of Catalyst-to-MHSW Fraction
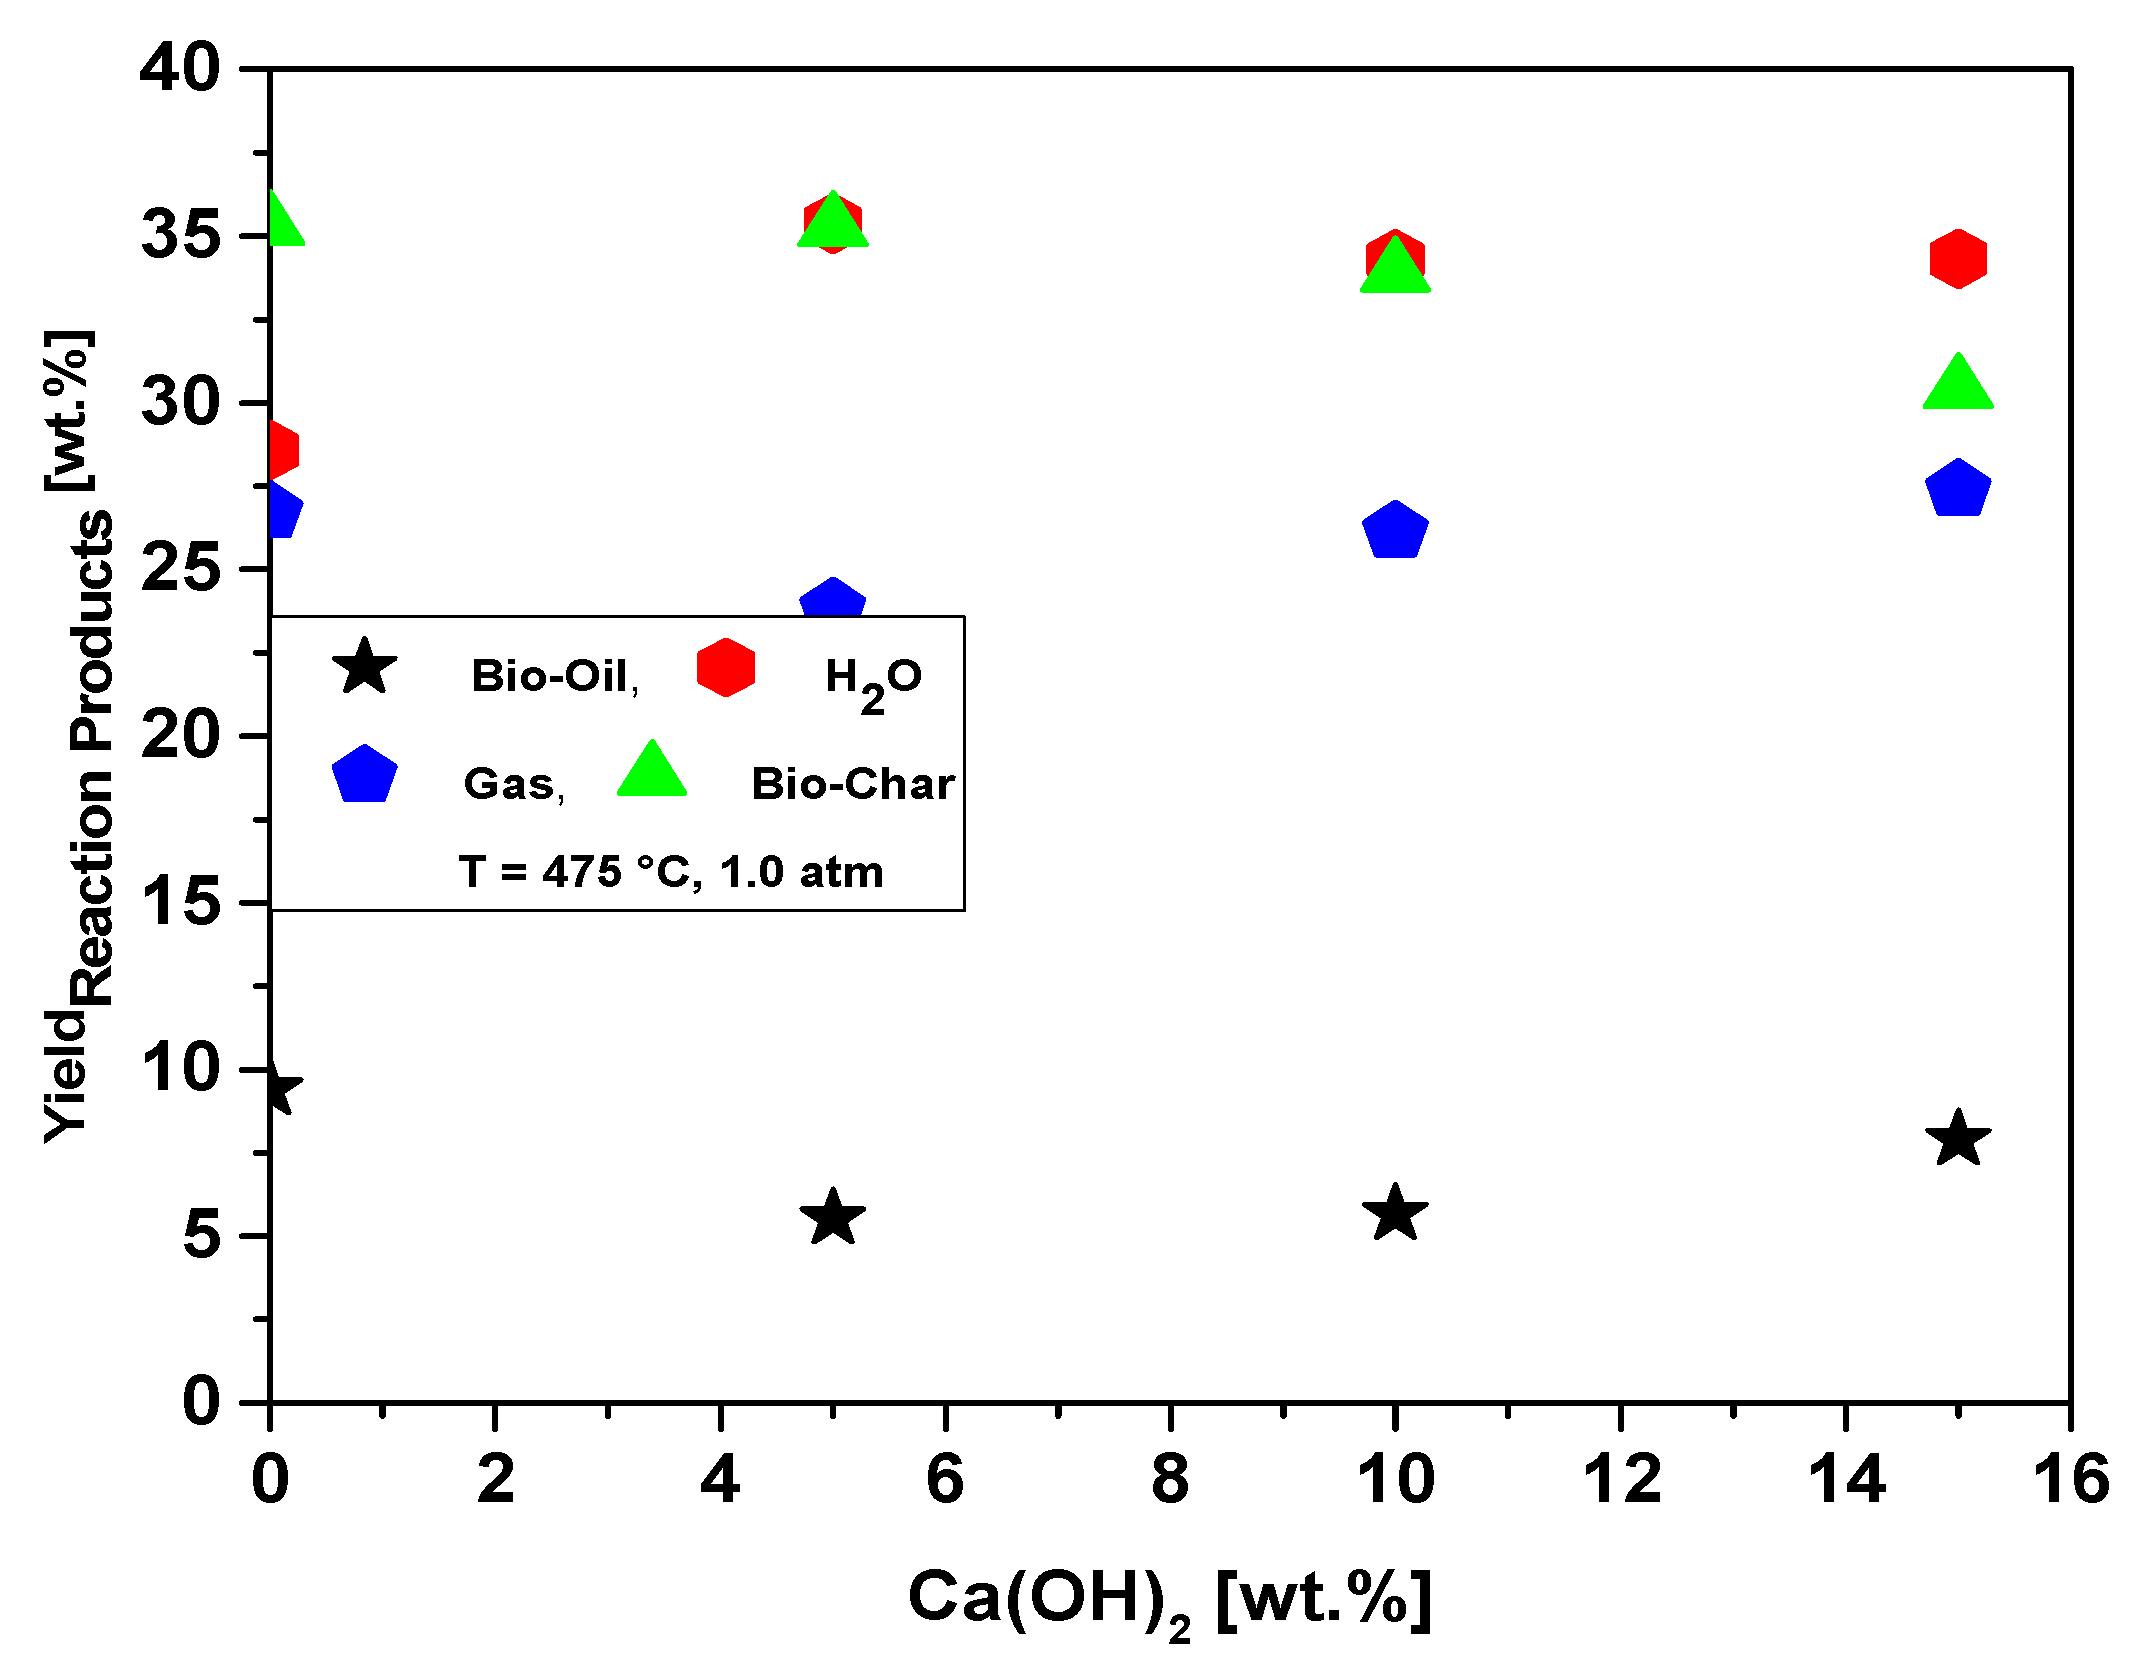
Table 10 illustrates the process parameters, mass balances, and yields of reaction products (liquids, solids, H2O, and gas) by catalytic cracking of MHSW fraction (organic matter + paper) at 475 °C, 1.0 atmosphere, with 5.0, 10.0, and 15.0% (wt.) Ca(OH)2 as catalyst, in laboratory scale. The catalytic cracking experiments show bio-oil yields between 5.52 and 7.0% (wt.), aqueous phase yields between 34.30 and 35.37% (wt.), solid phase yields between 30.40 and 35.27% (wt.), and gas yields between 23.82 and 27.37% (wt.). The bio-oil and gas yields increase slightly with Ca(OH)2 content, while that of bio-char decreases, and the H2O phase remains constant, according to the yields of reaction products as a function of Ca(OH)2 content plotted in Figure 20. Regarding the influence of the Ca(OH)2 catalyst content at 475 °C, the results could show that its addition to the process decreased the bio-oil yield, at the same time as the Ca(OH)2 concentrations increased the bio-oil yield varied between 2.21% (wt.) and 3.16% (wt.). The results are according to Song et al. [24], who studied the catalytic cracking of MSW with CaO as catalyst, reporting that increasing the content of CaO between 0.0 and 7.0% (wt.), the yields of H2O phase and bio-char remain constant, while that of gas increases slightly, and the yield of bio-oil decreases. In fact, according to Kumagai et al. [58], calcium oxide (CaO) is transformed into calcite (CaCO3) due to decarboxylation of OFMHSW pyrolysis vapor compounds containing carboxyl groups, such as carboxylic acids, by CaO [58]. In this context, it is expected that bio-oils formed by catalytic cracking of OFMHSW using CaO as catalysts not only to be enriched in hydrocarbons but also contains lower acidity, as CaCO3 is a stronger alkali compared to CaO.

Table 10.
Process parameters, mass balances, and yields of reaction products (liquids, solids, H2O, and gas) by thermal catalytic cracking of MHSW fraction (organic matter + paper) at 475 °C, 1.0 atm, 5.0, 10.0, and 15.0% (wt.) Ca(OH)2, in laboratory scale.
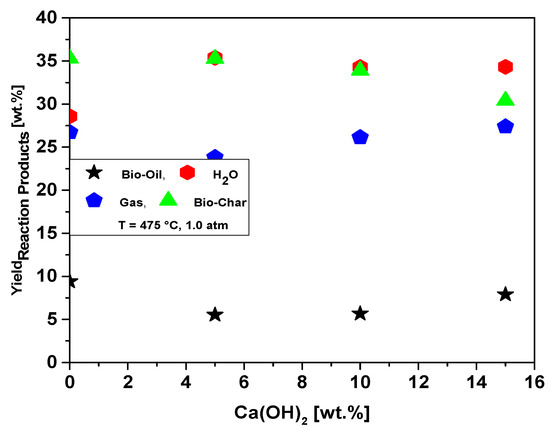
Figure 20.
Effect of Ca(OH)2-to-MHSW ratio on the yield of bio-oil, bio-char, aqueous, and gas phases by thermal catalytic cracking of MHSW fraction (organic matter + paper) at 475 °C, 1.0 atm, 5.0, 10.0, and 15.0% (wt.) Ca(OH)2, in laboratory scale.
3.4.2. Physicochemical and Compositional Characterization of Bio-Oil
Acidity of Bio-Oil
Table 11 shows the effect of temperature on the acidity of bio-oil by pyrolysis of MHSW fraction (organic matter + paper) at 400, 450, and 475 °C, 1.0 atm, in laboratory scale. The acidity of bio-oil decreases with increasing process temperature, while that of aqueous phase increases. The acidity of bio-oil obtained at 475 °C, 1.0 atm, in laboratory scale is close to that of bio-oil (70.25 ± 1.0 mg KOH/g) obtained by pyrolysis of açaí (Euterpe oleraceae, Mart) seeds at 450 °C, 1.0 atm, in laboratory scale. As described in Section 3.2.3, higher temperatures promote the formation calcite (CaCO3), a strong alkali, by carbonation of calcium oxide (CaO) with CO2 at high temperatures [62], as well as by decarboxylation of OFMHSW pyrolysis vapor compounds containing carboxyl groups, such as carboxylic acids, by CaO [58], and decarboxylation of carboxylic acids produces bio-oils with lower acidity.

Table 11.
Effect of temperature on the acid index of bio-oils and aqueous phase by pyrolysis of MHSW fraction (organic matter + paper) at 400, 450, and 475 °C, 1.0 atm, in laboratory scale.
Table 12 shows the effect of Ca(OH)2 content on the acidity of bio-oil by catalytic cracking of MHSW fraction (organic matter + paper) at 475 °C, 1.0 atm, with 5.0, 10.0, and 15.0% (wt.) Ca(OH)2, in laboratory scale. The addition of Ca(OH)2 causes a drastic diminution on the acidity of bio-oil, as calcite is a strong alkali. However, by increasing the Ca(OH)2 content, the acidity of both bio-oil and aqueous phase remains almost constant, that is, Ca(OH)2 content has little or almost no effect on the acidity of bio-oils. This is probably due to the reaction mechanism of decarboxylation [70]. If the reaction mechanism produces H+ as an intermediate, an increase on the Ca(OH)2-to-MHSW fraction ratio, that is, an increase on the concentration of alkalis has a limited effect [70].

Table 12.
Effect of Ca(OH)2 content on the acid index of bio-oils and aqueous phase by catalytic cracking of MHSW fraction (organic matter + paper) at 475 °C, 1.0 atm, 5.0, 10.0, and 15.0% (wt.) Ca(OH)2, in laboratory scale.
FT-IR of Bio-Oil
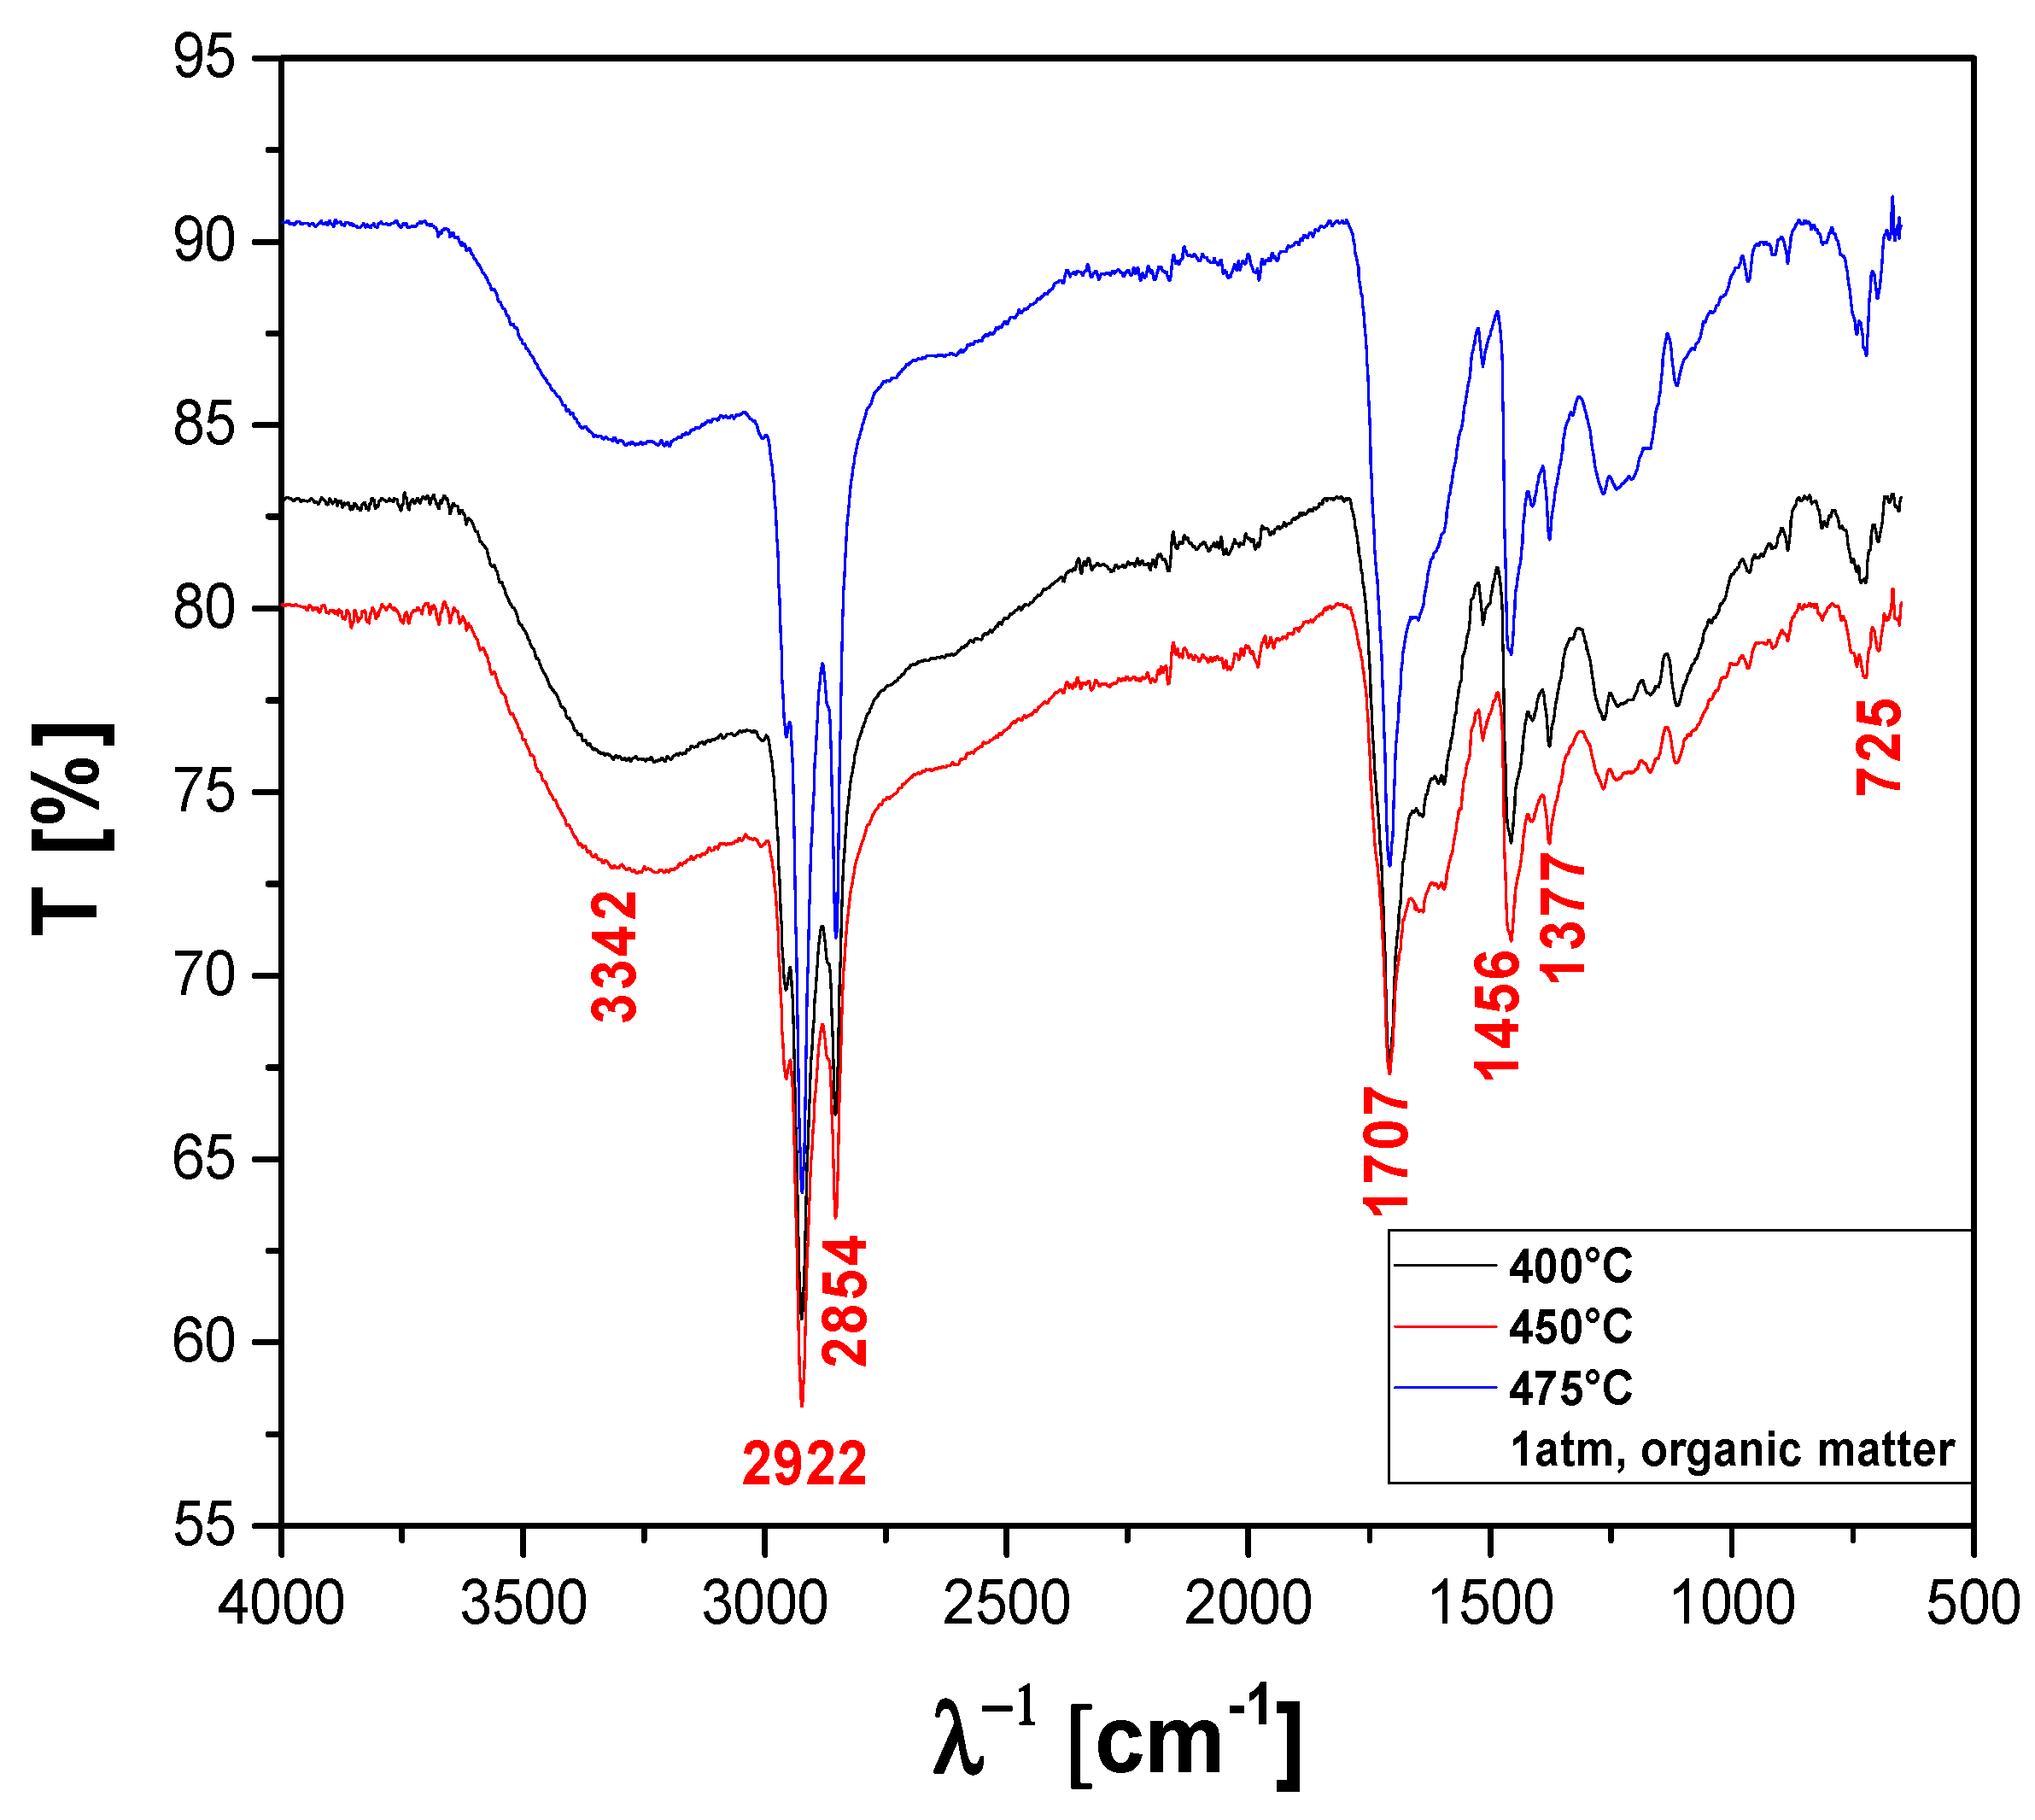
The FT-IR qualitative analysis of chemical functions present in the bio-oils obtained by pyrolysis of MHSW fraction (organic matter + paper) at 400, 450, and 475 °C, 1.0 atm, in laboratory scale, is shown in Figure 21. A wide vibration band between 3600–3200 cm−1 is observed, characteristic of the O–H angular deformation, associated with the presence of H2O. The bands close to 2922 and 2854 cm−1 refer to the aliphatic axial deformations of the C-H bonds of the methylene (CH2) and methyl (CH3) groups. The peak of 1707 cm−1 indicates the presence of carbonyls of oxygenated compounds. The 1456 cm−1 band can be attributed to CH2 bond stretches, and the 1377 cm−1 band is attributed to CH3 (methyl) stretches. The peak of asymmetric angular strain outside the plane of the C-H bond of the methylene group is observed at 725 cm−1.
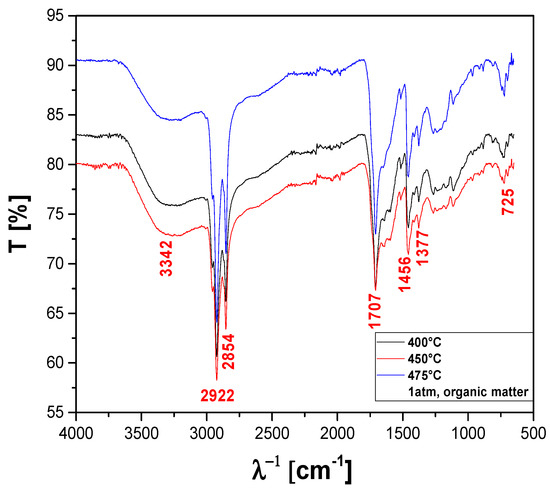
Figure 21.
FT-IR of bio-oil obtained by pyrolysis of MHSW fraction (organic matter + paper) at 400, 450, and 475 °C, 1.0 atmosphere, in laboratory scale.
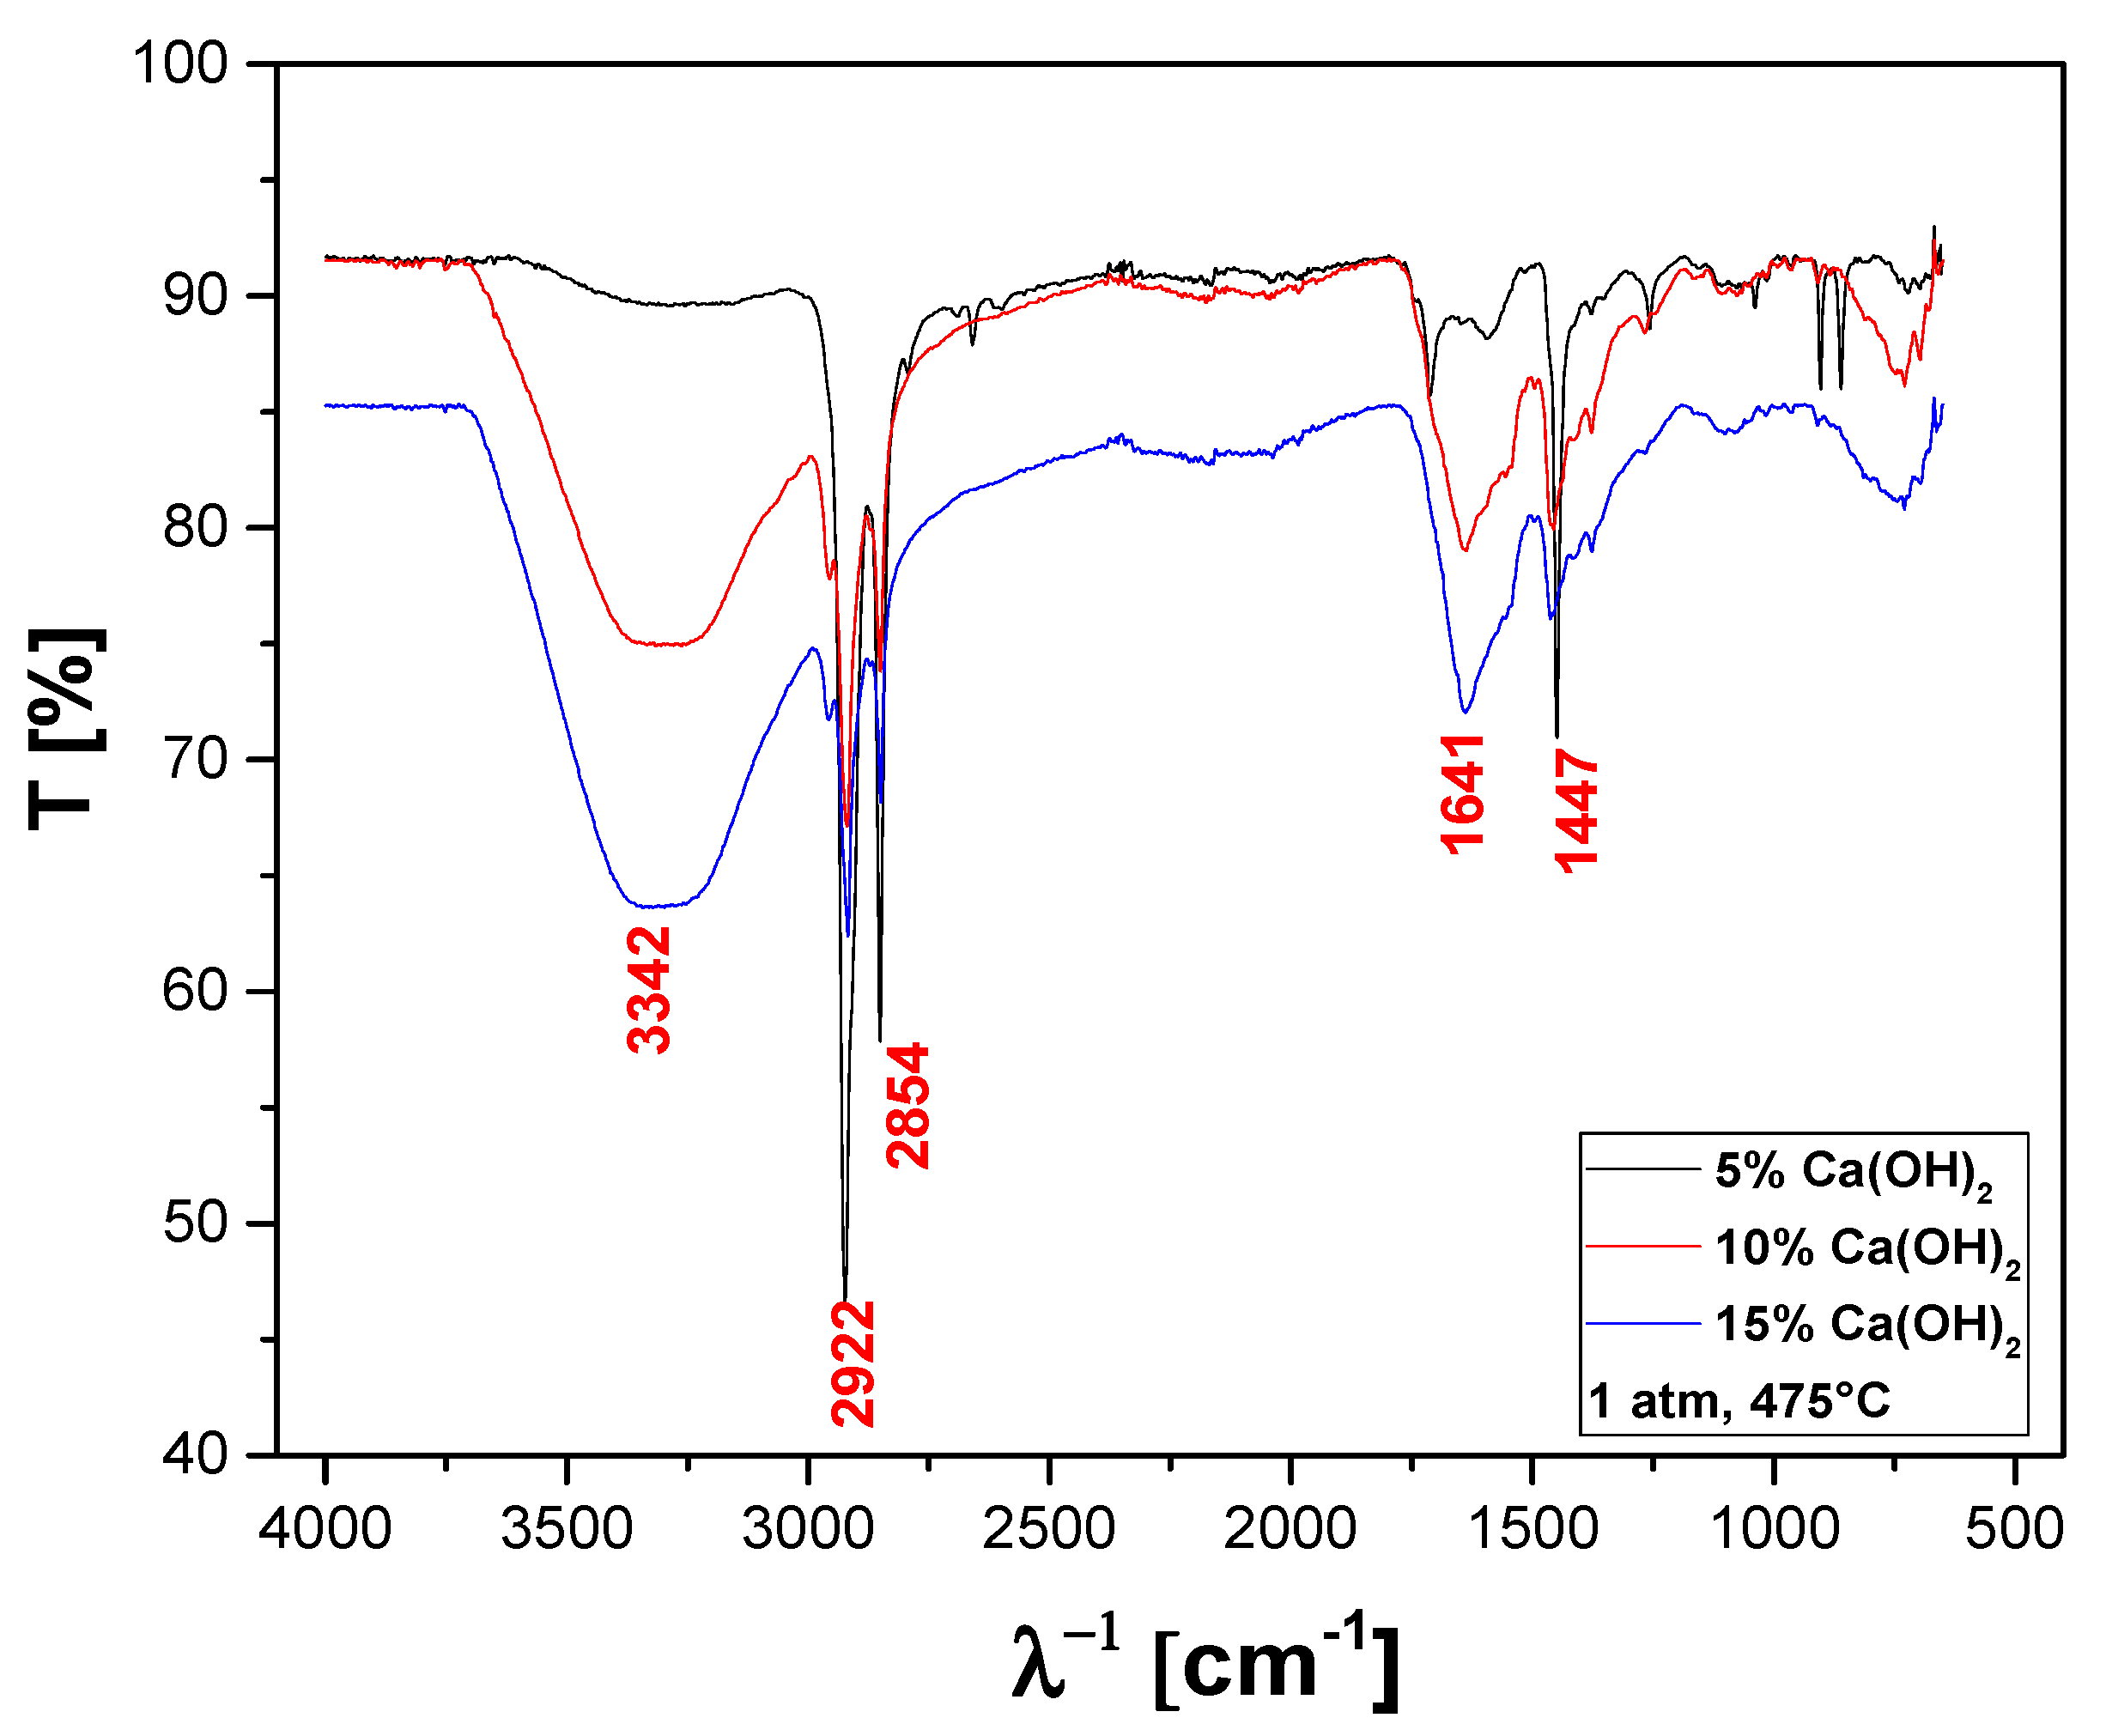
The FT-IR qualitative analysis of chemical functions present in the bio-oils obtained by catalytic cracking of MHSW fraction (organic matter + paper) at 475 °C, 1.0 atm, 5.0, 10.0, and 15.0% (wt.) Ca(OH)2, in laboratory scale, is shown in Figure 22.
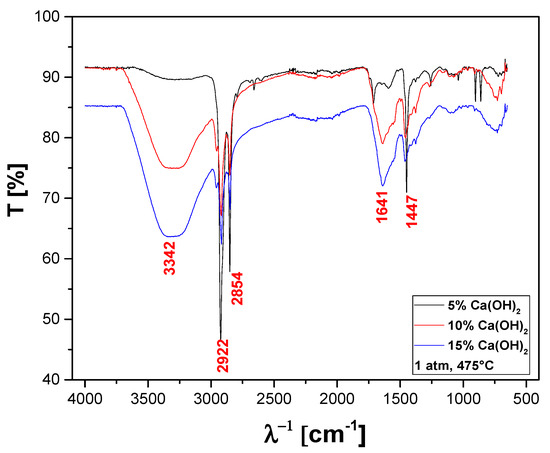
Figure 22.
FT-IR of bio-oil obtained by catalytic cracking of MHSW fraction (organic matter + paper) at 475 °C, 1.0 atm, 5.0, 10.0, and 15.0% (wt.) Ca(OH)2, in laboratory scale.
A wide vibration band was observed between 3600–3200 cm−1, characteristic of the O–H angular deformation, associated with the presence of H2O. The bands close to 2922 and 2854 cm−1 refer to the aliphatic axial deformations of the C-H bonds of the methylene (CH2) and methyl (CH3) groups. It can also be observed that a stretch that occurs at 1660–1600 cm−1, and the conjugation moves the C=C stretch to lower frequencies and increases the intensity. The band of 1447 cm−1 can be attributed to the stretching of CH2 bonds. The FT-IT is characteristic of aliphatic hydrocarbons as well as oxygenates, associated with the presence of a carboxyl group, characteristics of carboxylic acids, according to similar analyses of bio-oils by FT-IR reported elsewhere [48,49,50,51,71].
Chemical Composition of Bio-Oil
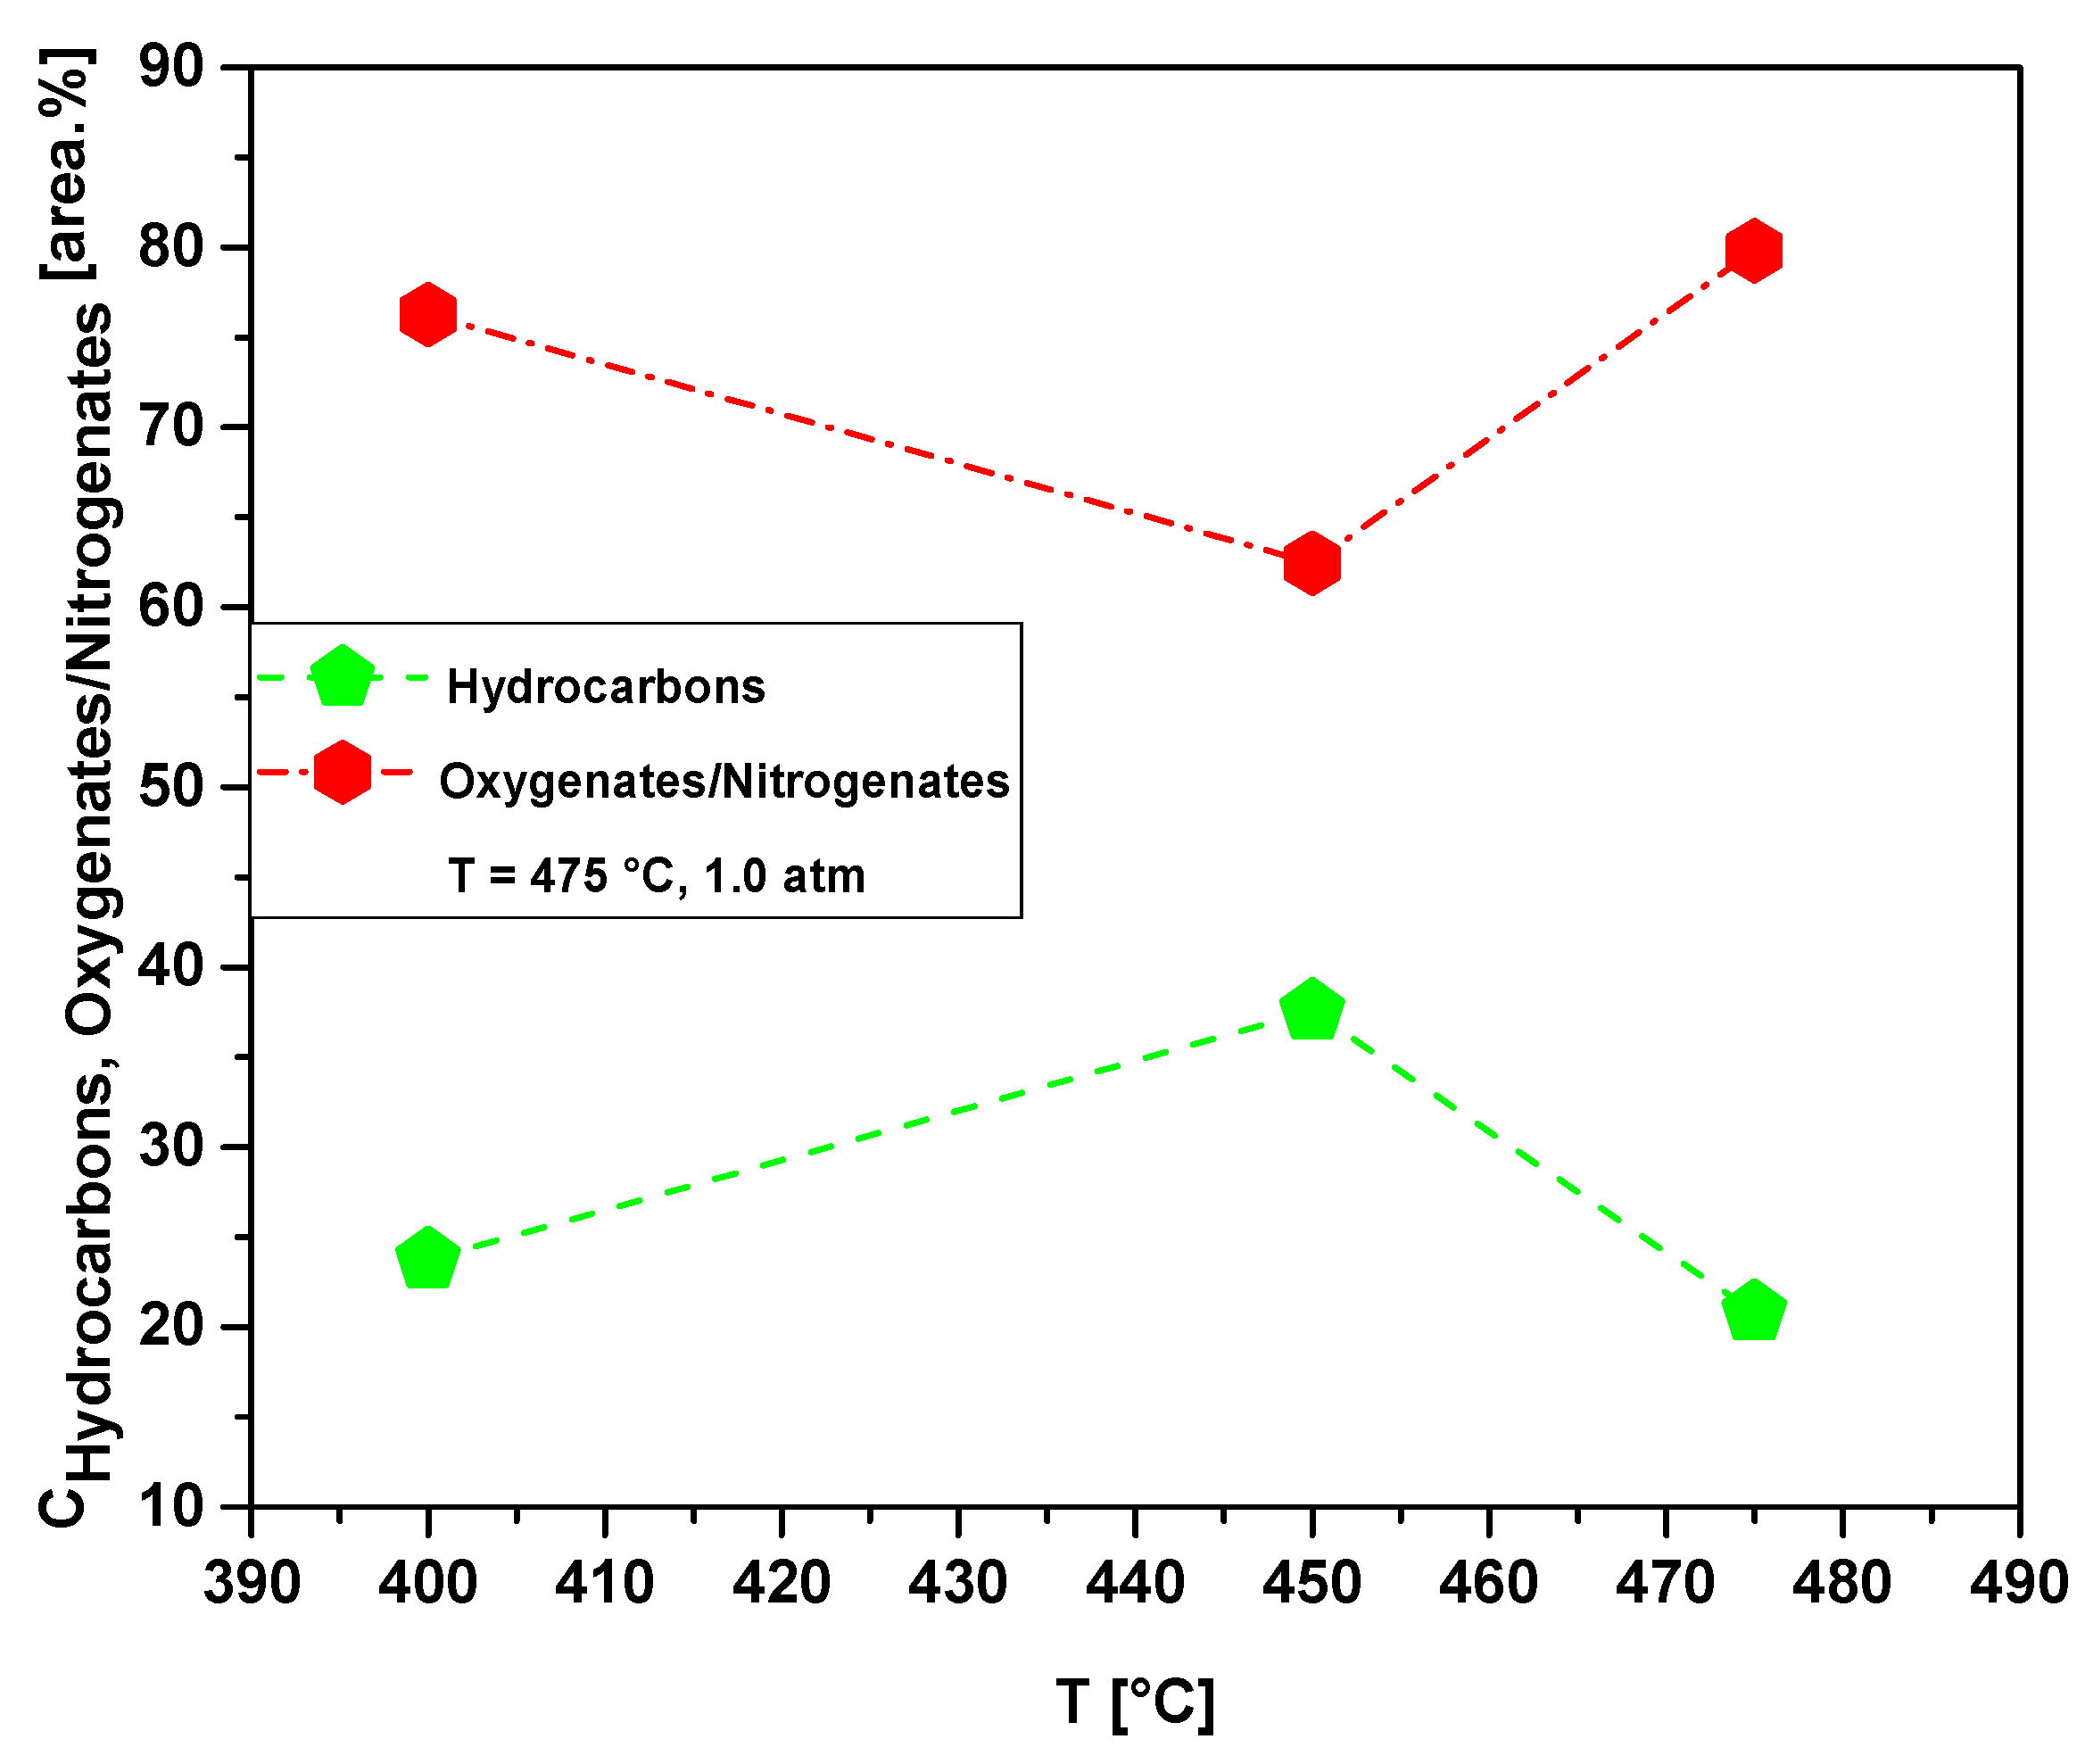
Table 13 and Figure 23 show the effect of temperature on the content of hydrocarbons and oxygenates in bio-oil obtained by pyrolysis of MHSW fraction (organic matter + paper) at 400, 450, and 475 °C, 1.0 atmosphere, in laboratory scale. The chemical functions (alkanes, alkenes, alkynes, aromatics, carboxylic acids, esters, alcohols, phenols, amines, amides, aldehydes, nitrogenates, and ketones), sum of peak areas, CAS numbers, and retention times of all the molecules identified in bio-oil by GC-MS, are illustrated in Supplementary Tables S2–S4. The concentration of hydrocarbons in bio-oil has a maximum at 450 °C. This is according to the acidity of bio-oils illustrated in Table 11, where the bio-oil obtained by catalytic cracking of MHSW fraction (organic matter + paper) at 475 °C, 1.0 atm, 10.0% (wt.) Ca(OH)2 presents its lower acid value.

Table 13.
Effect of temperature on the chemical composition, expressed as hydrocarbons and oxygenates/nitrogenates, of bio-oils obtained by pyrolysis of MHSW fraction (organic matter + paper) at 400, 450, and 475 °C, 1.0 atm, in laboratory scale.
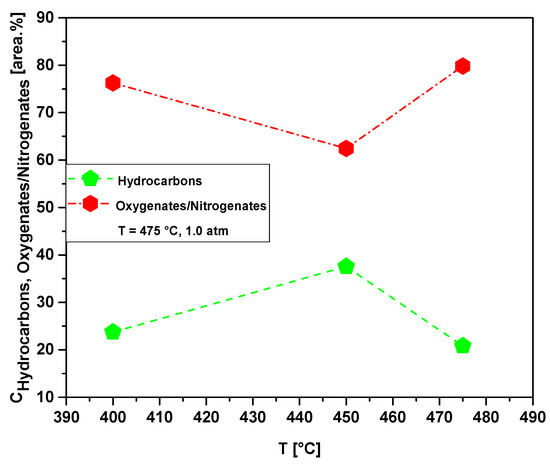
Figure 23.
Effect of temperature on the chemical composition, expressed as hydrocarbons and oxygenates/nitrogenates, of bio-oils obtained by pyrolysis of MHSW fraction (organic matter + paper) at 400, 450, and 475 °C, 1.0 atm, in laboratory scale.
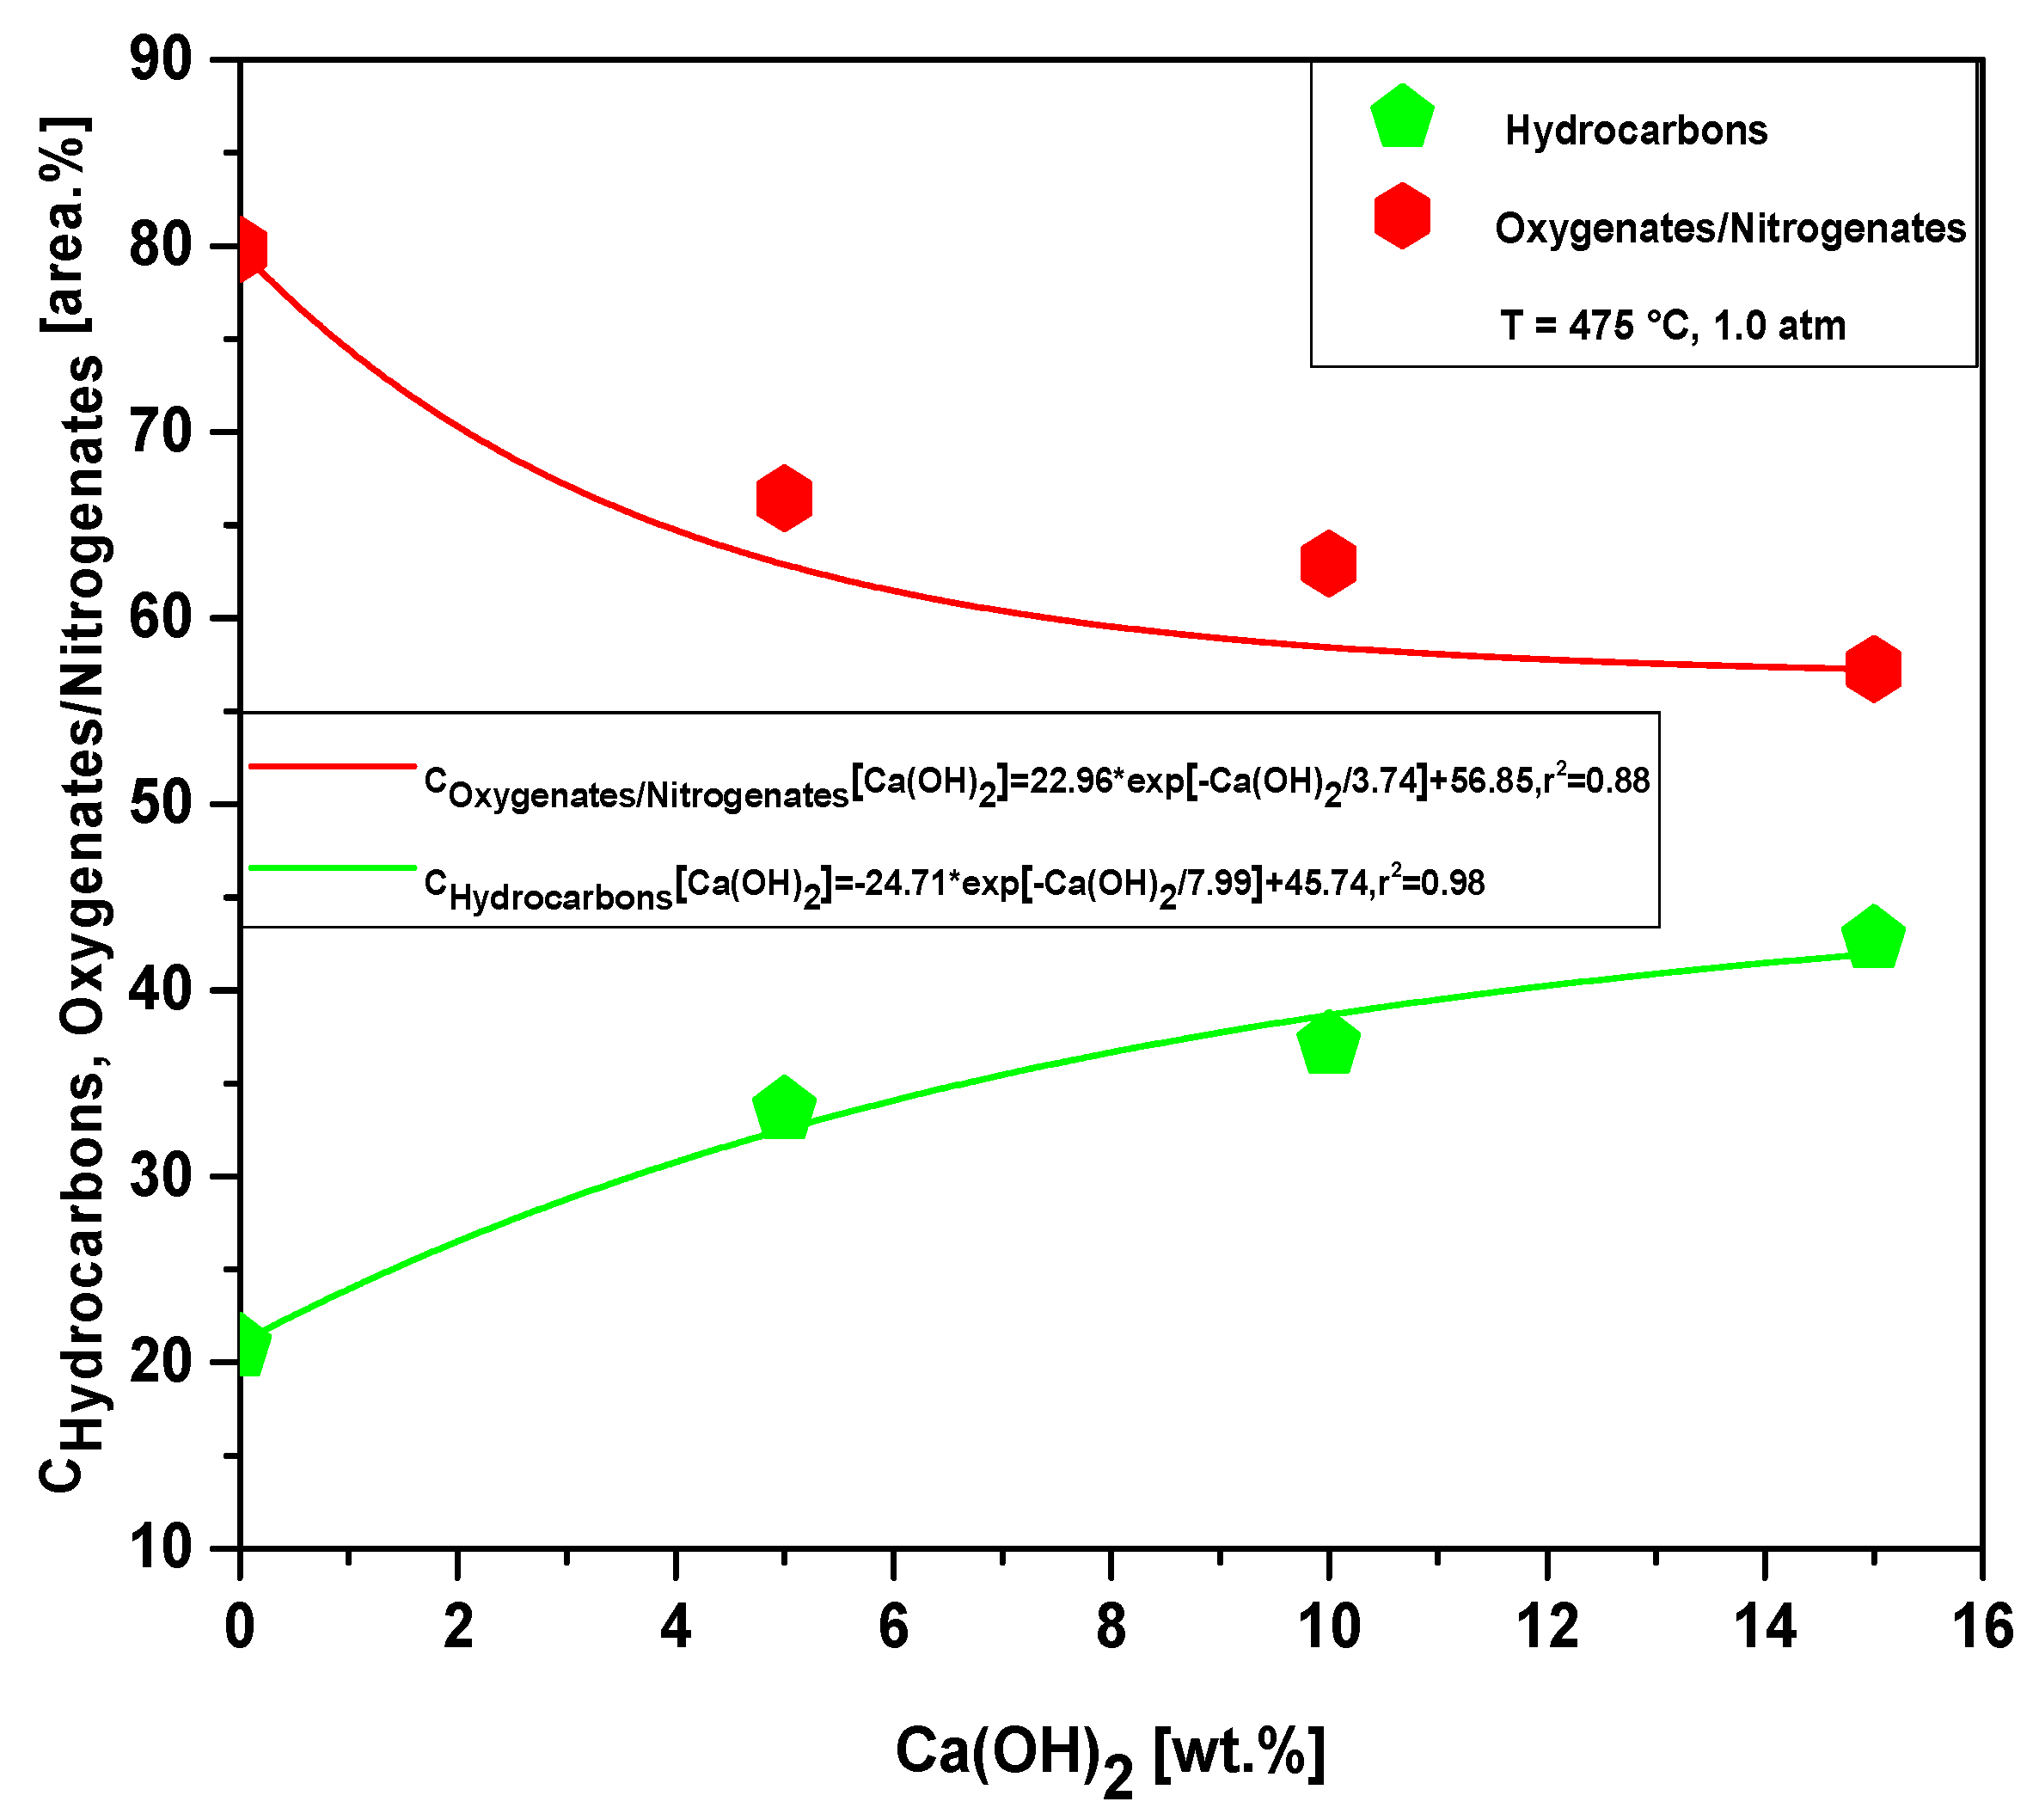
Figure 24 and Tables S5–S7 show the effect of Ca(OH)2-to-MHSW fraction ratio on the content of hydrocarbons and oxygenates in bio-oil obtained by catalytic cracking of MHSW fraction (organic matter + paper) at 475 °C, 1.0 atm, 5.0, 10.0, and 15.0% (wt.) Ca(OH)2, in laboratory scale. The chemical functions (alkanes, alkenes, alkynes, aromatics, esters, carboxylic acids, phenols, aldehydes, alcohols, amines, amides, nitrogenates, and ketones), sum of peak areas, CAS numbers, and retention times of all the molecules identified in bio-oil by GC-MS, are illustrated in Supplementary Tables S5–S7. The concentration of hydrocarbons in bio-oil increases exponentially with increasing Ca(OH)2-to-MHSW fraction ratio due to the catalytic deoxygenation of fatty acids molecules, by means of decarboxylation/decarbonylation, producing aliphatic and aromatic hydrocarbons, as reported in the literature [53], while that of oxygenates decreases exponentially. The bio-oils compositions described in Tables S2–S7 is according to those described in the literature for bio-oils obtained by pyrolysis of MHSW [8,11,12,17,19,21,22,23,24,26,28,72,73]. The occurrence of compounds containing nitrogen is likely due to the presence of nitrogen in OFMHSW determined by elemental analysis, as reported by AlDayyat et al. [20] and by Ghavanati et al. [61]. Regarding the influence of the catalyst content on the chemical composition, Figure 24 illustrates that increasing the catalyst content causes a decrease in the concentration of oxygenates and an increase in the concentration of hydrocarbons.
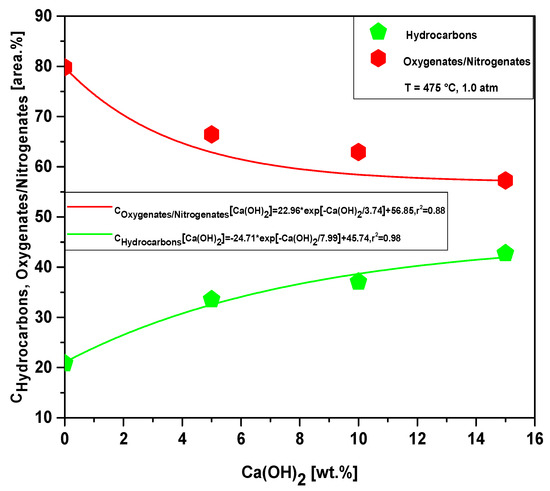
Figure 24.
Effect of Ca(OH)2-to-MHSW ratio on the content of oxygenates and hydrocarbons in bio-oil obtained by catalytic cracking of MHSW fraction (organic matter + paper) at 475 °C, 1.0 atm, 5.0, 10.0, and 15.0% (wt.) Ca(OH)2, in laboratory scale.
4. Conclusions
The SEM images of bio-char produced by pyrolysis of (organic matter + paper) fraction of MHSW at 450 °C, 1.0 atmosphere, show the formation of porous structure similar to a beehive, proving that pyrolysis has drastically changed the morphological structure of (organic matter + paper) fraction of MHSW.
The XRD analysis of bio-char, obtained by catalytic cracking of (organic matter + paper) fraction of MHSW at 450 °C, 1.0 atmosphere, and at 475 °C, 1.0 atmosphere, with 5, 10, and 15% (wt.) Ca(OH)2, identified the presence of the crystalline phases CaCO3 (Calcite) and graphite (C).
The pyrolysis of MHSW fraction (organic matter + paper) produces a bio-oil with yields between 2.63 and 9.41% (wt.). The bio-oil yield increases with pyrolysis temperature. For the catalytic cracking, the bio-oil and gas yields increase slightly with CaO content, while that of bio-char decreases, and the H2O phase remains constant.
The acidity of bio-oil decreases with increasing process temperature and with aid Ca(OH)2 as catalyst. The concentration of hydrocarbons in bio-oil increases with increasing Ca(OH)2-to-MHSW fraction ratio due to the catalytic deoxygenation of fatty acid molecules by means of decarboxylation/decarbonylation, producing aliphatic and aromatic hydrocarbons.
Supplementary Materials
The following supporting information can be downloaded at: https://www.mdpi.com/article/10.3390/en15217971/s1, Table S1. Coordinates (Longitude-X, Latitude-Y) of each collecting points (green circles) (Longitude-X, Latitude-Y) of municipal household solid waste (MHSW) in the neighborhoods of Cremação and Guamá in the city of Belém-Pará-Brazil on 18/10/2021, 20/10/2021, 27/10/2021, and 29/10/2021, Table S2: Classes of compounds, summation of peak areas, CAS number, and retention times of chemical compounds identified by GC-MS in bio-oil by pyrolysis of (organic matter + paper) fraction from MHSW at 400 °C, 1.0 atm, in laboratory scale, Table S3: Classes of compounds, summation of peak areas, CAS number, and retention times of chemical compounds identified by CG-MS in bio-oil by pyrolysis of (organic matter + paper) fraction from MHSW at 450 °C, 1.0 atm, in laboratory scale, Table S4: Classes of compounds, summation of peak areas, CAS number, and retention times of chemical compounds identified by CG-MS in bio-oil by pyrolysis of (organic matter + paper) fraction from MHSW at 475 °C, 1.0 atm, in laboratory scale, Table S5: Classes of compounds, summation of peak areas, CAS number, and retention times of chemical compounds identified by CG-MS in bio-oil by thermal catalytic cracking of (organic matter + paper) fraction from MHSW at 475 °C, 1.0 atm, 5.0% (wt.) of Ca(OH)2, in laboratory scale, Table S6: Classes of compounds, summation of peak areas, CAS number, and retention times of chemical compounds identified by CG-MS in bio-oil by thermal catalytic cracking of (organic matter + paper) fraction from MHSW at 475 °C, 1.0 atm, 10.0% (wt.) of Ca(OH)2, in laboratory scale, Table S7: Classes of compounds, summation of peak areas, CAS number, and retention times of chemical compounds identified by CG-MS in bio-oil by thermal catalytic cracking of (organic matter + paper) fraction from MHSW at 475 °C, 1.0 atm, 5.0% (wt.) of Ca(OH)2, in laboratory scale.
Author Contributions
The individual contributions of all the co-authors are provided as follows: F.P.d.C.A. contributed with formal analysis and writing original draft preparation, investigation and methodology, D.O.P. contributed with formal analysis, investigation and methodology, J.C.C.d.S. contributed with formal analysis, investigation and methodology, J.F.H.F. contributed with formal analysis, investigation and methodology, K.C.A.B. contributed with investigation and methodology, L.P.B. contributed with investigation and methodology, C.C.F. contributed with investigation and methodology, A.F.d.F.C. contributed with investigation and methodology, L.M.P. contributed with investigation and methodology, S.P.A.d.P. contributed with resources, chemical analysis, R.B.P.F. contributed with collecting and sampling, B.R.C. contributed with collecting and sampling, S.A.P.d.M. contributed with formal analysis, investigation and methodology, A.C.P.A. contributed with SIG analysis, D.A.R.d.C. contributed with investigation and methodology, M.C.S. contributed with formal analysis, investigation and methodology, N.M.M. contributed with formal analysis, investigation and methodology, S.D.J. contributed with resources, chemical analysis, A.A.M.P.J. contributed with chemical analysis and formal analysis, L.E.P.B. with co-supervision, and resources, J.A.R.P. contributed with supervision, conceptualization, and data curation, and N.T.M. contributed with supervision, conceptualization, and data curation. All authors have read and agreed to the published version of the manuscript.
Funding
This research received no external funding.
Institutional Review Board Statement
Not applicable.
Informed Consent Statement
Not applicable.
Acknowledgments
I would like to acknowledge and dedicate this research in memory to Hélio da Silva Almeida, he used to work at the Faculty of Sanitary and Environmental Engineering/UFPa, and passed away on 13 March 2021. His contagious joy, dedication, intelligence, honesty, seriousness, and kindness will always be remembered in our hearts.
Conflicts of Interest
The authors declare no conflict of interest.
References
- Mia, S.; Uddin, E.; Kader, A.; Ahsan, A.; Mannan, M.; Hossain, M.M.; Solaiman, Z.M. Pyrolysis and co-composting of municipal organic waste in Bangladesh: A quantitative estimate of recyclable nutrients, greenhouse gas emissions, and economic benefits. Waste Manag. 2018, 75, 503–513. [Google Scholar] [CrossRef]
- Balcazar, J.G.C.; Dias, R.A.; Balestieri, J.A.P. Analysis of hybrid waste-to-energy for medium-sized cities. Energy 2013, 55, 728–741. [Google Scholar] [CrossRef]
- Srivastava, V.; Ismail, S.A.; Singh, P.; Singh, R.P. Urban solid waste management in the developing world with emphasis on India: Challenges and opportunities. Rev. Environ. Sci. Bio/Technol. 2014, 14, 317–337. [Google Scholar] [CrossRef]
- Lohri, C.R.; Rajabu, H.M.; Sweeney, D.J.; Zurbrügg, C. Char fuel production in developing countries—A review of urban biowaste carbonization. Renew. Sustain. Energy Rev. 2016, 59, 1514–1530. [Google Scholar] [CrossRef]
- Lohri, C.R.; Faraji, A.; Ephata, E.; Rajabu, H.M.; Zurbrügg, C. Urban biowaste for solid fuel production: Waste suitability assessment and experimental carbonization in Dar es Salaam, Tanzania. Waste Manag. Res. J. A Sustain. Circ. Econ. 2015, 33, 175–182. [Google Scholar] [CrossRef]
- Lohri, C.R.; Diener, S.; Zabaleta, I.; Mertenat, A.; Zurbrügg, C. Treatment technologies for urban solid biowaste to create value products: A review with focus on low- and middle-income settings. Rev. Environ. Sci. Bio/Technol. 2017, 16, 81–130. [Google Scholar] [CrossRef]
- Ding, Y.; Zhao, J.; Liu, J.-W.; Zhou, J.; Cheng, L.; Zhao, J.; Shao, Z.; Iris, Ç.; Pan, B.; Li, X.; et al. A review of China’s municipal solid waste (MSW) and comparison with international regions: Management and technologies in treatment and resource utilization. J. Clean. Prod. 2021, 293, 126144. [Google Scholar] [CrossRef]
- de Castro, D.R.; Ribeiro, H.D.S.; Guerreiro, L.H.; Bernar, L.P.; Bremer, S.J.; Santo, M.C.; Almeida, H.D.S.; Duvoisin, S.; Borges, L.P.; Machado, N.T. Production of Fuel-Like Fractions by Fractional Distillation of Bio-Oil from Açaí (Euterpe oleracea Mart.) Seeds Pyrolysis. Energies 2021, 14, 3713. [Google Scholar] [CrossRef]
- dos Santos, P.B.; Ribeiro, H.J.D.S.; Ferreira, A.C.; Ferreira, C.C.; Bernar, L.P.; Assunção, F.P.D.C.; de Castro, D.A.R.; Santos, M.C.; Duvoisin, S.; Borges, L.E.P.; et al. Process Analysis of PMMA-Based Dental Resins Residues Depolymerization: Optimization of Reaction Time and Temperature. Energies 2021, 15, 91. [Google Scholar] [CrossRef]
- Paula, T.P.; Marques, M.F.V.; Marques, M.R.D.C. Influence of mesoporous structure ZSM-5 zeolite on the degradation of Urban plastics waste. J. Therm. Anal. 2019, 138, 3689–3699. [Google Scholar] [CrossRef]
- Quesada, L.; Calero, M.; Martín-Lara, M.A.; Pérez, A.; Blázquez, G. Characterization of fuel produced by pyrolysis of plastic film obtained of municipal solid waste. Energy 2019, 186, 115874. [Google Scholar] [CrossRef]
- Phan, A.N.; Ryu, C.; Sharifi, V.N.; Swithenbank, J. Characterisation of slow pyrolysis products from segregated wastes for energy production. J. Anal. Appl. Pyrolysis 2008, 81, 65–71. [Google Scholar] [CrossRef]
- Bin Yang, Y.; Phan, A.N.; Ryu, C.; Sharifi, V.; Swithenbank, J. Mathematical modelling of slow pyrolysis of segregated solid wastes in a packed-bed pyrolyser. Fuel 2006, 86, 169–180. [Google Scholar] [CrossRef]
- Sørum, L.; Grønli, M.G.; Hustad, J.E. Pyrolysis characteristics and kinetics of municipal solid wastes. Fuel 2001, 80, 1217–1227. [Google Scholar] [CrossRef]
- Shi, H.; Mahinpey, N.; Aqsha, A.; Silbermann, R. Characterization, thermochemical conversion studies, and heating value modeling of municipal solid waste. Waste Manag. 2016, 48, 34–47. [Google Scholar] [CrossRef] [PubMed]
- Vakalis, S.; Sotiropoulos, A.; Moustakas, K.; Malamis, D.; Vekkos, K.; Baratieri, M. Thermochemical valorization and characterization of household biowaste. J. Environ. Manag. 2017, 203, 648–654. [Google Scholar] [CrossRef] [PubMed]
- Peng, C.; Feng, W.; Zhang, Y.; Guo, S.; Yang, Z.; Liu, X.; Wang, T.; Zhai, Y. Low temperature co-pyrolysis of food waste with PVC-derived char: Products distributions, char properties and mechanism of bio-oil upgrading. Energy 2020, 219, 119670. [Google Scholar] [CrossRef]
- Tursunov, O. A comparison of catalysts zeolite and calcined dolomite for gas production from pyrolysis of municipal solid waste (MSW). Ecol. Eng. 2014, 69, 237–243. [Google Scholar] [CrossRef]
- Islam, M.S.; Miah, M.Y.; Ismail, M.; Jamal, M.S.; Banik, S.K.; Saha, M. Production of Bio-Oil from Municipal Solid Waste by Pyrolysis. Bangladesh J. Sci. Ind. Res. 1970, 45, 91–94. [Google Scholar] [CrossRef]
- AlDayyat, E.; Saidan, M.; Al-Hamamre, Z.; Al-Addous, M.; Alkasrawi, M. Pyrolysis of Solid Waste for Bio-Oil and Char Production in Refugees’ Camp: A Case Study. Energies 2021, 14, 3861. [Google Scholar] [CrossRef]
- Gandidi, I.M.; Susila, M.D.; Pambudi, N.A. Co-cracking of real MSW into bio-oil over natural kaolin. IOP Conf. Ser. Earth Environ. Sci. 2017, 60, 012019. [Google Scholar] [CrossRef]
- Gandidi, I.M.; Susila, M.D.; Rustamaji, H. Effect of natural zeolite and kaolin as a catalyst in the isothermal-catalytic cracking of real municipal solid waste (MSW) for bio-oil production. IOP Conf. Ser. Earth Environ. Sci. 2018, 160, 012018. [Google Scholar] [CrossRef]
- Velghe, I.; Carleer, R.; Yperman, J.; Schreurs, S. Study of the pyrolysis of municipal solid waste for the production of valuable products. J. Anal. Appl. Pyrolysis 2011, 92, 366–375. [Google Scholar] [CrossRef]
- Song, Q.; Zhao, H.-Y.; Xing, W.-L.; Song, L.-H.; Yang, L.; Yang, D.; Shu, X. Effects of various additives on the pyrolysis characteristics of municipal solid waste. Waste Manag. 2018, 78, 621–629. [Google Scholar] [CrossRef]
- Hasan, M.; Rasul, M.; Khan, M.; Ashwath, N.; Jahirul, M. Energy recovery from municipal solid waste using pyrolysis technology: A review on current status and developments. Renew. Sustain. Energy Rev. 2021, 145, 111073. [Google Scholar] [CrossRef]
- Ateş, F.; Miskolczi, N.; Borsodi, N. Comparision of real waste (MSW and MPW) pyrolysis in batch reactor over different catalysts. Part I: Product yields, gas and pyrolysis oil properties. Bioresour. Technol. 2013, 133, 443–454. [Google Scholar] [CrossRef]
- Miskolczi, N.; Ateş, F.; Borsodi, N. Comparison of real waste (MSW and MPW) pyrolysis in batch reactor over different catalysts. Part II: Contaminants, char and pyrolysis oil properties. Bioresour. Technol. 2013, 144, 370–379. [Google Scholar] [CrossRef]
- Chen, C.; Jin, Y.; Chi, Y. Effects of moisture content and CaO on municipal solid waste pyrolysis in a fixed bed reactor. J. Anal. Appl. Pyrolysis 2014, 110, 108–112. [Google Scholar] [CrossRef]
- Wang, N.; Qian, K.; Chen, D.; Zhao, H.; Yin, L. Upgrading gas and oil products of the municipal solid waste pyrolysis process by exploiting in-situ interactions between the volatile compounds and the char. Waste Manag. 2020, 102, 380–390. [Google Scholar] [CrossRef]
- Liu, G.; Liao, Y.; Guo, S.; Ma, X.; Zeng, C.; Wu, J. Thermal behavior and kinetics of municipal solid waste during pyrolysis and combustion process. Appl. Therm. Eng. 2016, 98, 400–408. [Google Scholar] [CrossRef]
- Veses, A.; Sanahuja-Parejo, O.; Callén, M.S.; Murillo, R.; García, T. A combined two-stage process of pyrolysis and catalytic cracking of municipal solid waste for the production of syngas and solid refuse-derived fuels. Waste Manag. 2019, 101, 171–179. [Google Scholar] [CrossRef] [PubMed]
- Chen, D.; Yin, L.; Wang, H.; He, P. Pyrolysis technologies for municipal solid waste: A review. Waste Manag. 2014, 34, 2466–2486. [Google Scholar] [CrossRef] [PubMed]
- Sipra, A.T.; Gao, N.; Sarwar, H. Municipal solid waste (MSW) pyrolysis for bio-fuel production: A review of effects of MSW components and catalysts. Fuel Process. Technol. 2018, 175, 131–147. [Google Scholar] [CrossRef]
- Lu, J.-S.; Chang, Y.; Poon, C.-S.; Lee, D.-J. Slow pyrolysis of municipal solid waste (MSW): A review. Bioresour. Technol. 2020, 312, 123615. [Google Scholar] [CrossRef]
- Wang, H.; Wang, L.; Shahbazi, A. Life cycle assessment of fast pyrolysis of municipal solid waste in North Carolina of USA. J. Clean. Prod. 2015, 87, 511–519. [Google Scholar] [CrossRef]
- Chhabra, V.; Parashar, A.; Shastri, Y.; Bhattacharya, S. Techno-Economic and Life Cycle Assessment of Pyrolysis of Unsegregated Urban Municipal Solid Waste in India. Ind. Eng. Chem. Res. 2021, 60, 1473–1482. [Google Scholar] [CrossRef]
- Zaman, A.U. Life cycle assessment of pyrolysis–gasification as an emerging municipal solid waste treatment technology. Int. J. Environ. Sci. Technol. 2013, 10, 1029–1038. [Google Scholar] [CrossRef]
- Dong, J.; Tang, Y.; Nzihou, A.; Chi, Y.; Weiss-Hortala, E.; Ni, M. Life cycle assessment of pyrolysis, gasification and incineration waste-to-energy technologies: Theoretical analysis and case study of commercial plants. Sci. Total Environ. 2018, 626, 744–753. [Google Scholar] [CrossRef]
- Samolada, M.C.; Zabaniotou, A.A. Comparative assessment of municipal sewage sludge incineration, gasification and pyrolysis for a sustainable sludge-to-energy management in Greece. Waste Manag. 2014, 34, 411–420. [Google Scholar] [CrossRef]
- Mostashari-Rad, F.; Ghasemi-Mobtaker, H.; Taki, M.; Ghahderijani, M.; Saber, Z.; Chau, K.-W.; Nabavi-Pelesaraei, A. Data supporting midpoint-weighting life cycle assessment and energy forms of cumulative exergy demand for horticultural crops. Data Brief 2020, 33, 106490. [Google Scholar] [CrossRef]
- Nabavi-Pelesaraei, A.; Rafiee, S.; Mohammadkashi, N.; Chau, K.-W.; Mostashari-Rad, F. Principle of Life Cycle Assessment and Cumulative Exergy Demand for Biodiesel Production: Farm-to-Combustion Approach. In Synergy Development in Renewables Assisted Multi-Carrier Systems. Green Energy and Technology; Amidpour, M., Ebadollahi, M., Jabari, F., Kolahi, M.-R., Ghaebi, H., Eds.; Springer: Cham, Switzerland, 2022; pp. 127–169. [Google Scholar] [CrossRef]
- Nabavi-Pelesaraei, A.; Mohammadkashi, N.; Naderloo, L.; Abbasi, M.; Chau, K.-W. Principal of environmental life cycle assessment for medical waste during COVID-19 outbreak to support sustainable development goals. Sci. Total Environ. 2022, 827, 154416. [Google Scholar] [CrossRef]
- IBGE. Instituto Brasileiro de Geografia e Estatística. Censo Brasileiro de 2010; IBGE: Rio de Janeiro, Brazil, 2012. Available online: https://censo2010.ibge.gov.br/ (accessed on 1 August 2022).
- Nunes, L.R.S. Caracterização Física de Resíduos Sólidos no Porto de Belém e Terminal Petroquímico de Miramar. Master’s Thesis, Universidade Federal do Pará, Instituto de Tecnologia, Belém, Brazil, 2015. Available online: https://ppgec.propesp.ufpa.br/ARQUIVOS/dissertacoes/2015/lailanunes.pdf (accessed on 1 August 2022).
- Fesseha, S.N.; Bin, F. The Assessment of Solid Waste Products Management in Ethiopians Municipal Urban Areas. Int. J. Soc. Sci. Manag. 2015, 2, 165–179. [Google Scholar] [CrossRef]
- de Andrade Cordeiro, M.; de Almeida, O.; de Castro, D.A.; da Silva Ribeiro, H.J.; Machado, N.T. Produção de Etanol através da Hidrólise Enzimática do Caroço de Açaí (Euterpe oleracea, Mart). Rev. Bras. Energ. Renov. 2019, 8, 122–152. [Google Scholar]
- NBR 10.007; Amostragem de Resíduos Sólidos. ABNT—Associação Brasileira de Normas Técnicas: Rio de Janeiro, Brazil, 2004.
- Almeida, H.D.S.; Corrêa, O.; Ferreira, C.; Ribeiro, H.; de Castro, D.; Pereira, M.; Mâncio, A.D.A.; Santos, M.; da Mota, S.; Souza, J.D.S.; et al. Diesel-like hydrocarbon fuels by catalytic cracking of fat, oils, and grease (FOG) from grease traps. J. Energy Inst. 2016, 90, 337–354. [Google Scholar] [CrossRef]
- Almeida, H.D.S.; Corrêa, O.; Eid, J.; Ribeiro, H.; de Castro, D.; Pereira, M.; Pereira, L.; Aâncio, A.D.A.; Santos, M.; da Mota, S.; et al. Performance of thermochemical conversion of fat, oils, and grease into kerosene-like hydrocarbons in different production scales. J. Anal. Appl. Pyrolysis 2016, 120, 126–143. [Google Scholar] [CrossRef]
- da Mota, S.; Mancio, A.; Lhamas, D.; de Abreu, D.; da Silva, M.; dos Santos, W.; de Castro, D.; de Oliveira, R.; Araújo, M.; Borges, L.E.; et al. Production of green diesel by thermal catalytic cracking of crude palm oil (Elaeis guineensis Jacq) in a pilot plant. J. Anal. Appl. Pyrolysis 2014, 110, 1–11. [Google Scholar] [CrossRef]
- Ferreira, C.; Costa, E.; de Castro, D.; Pereira, M.; Mâncio, A.; Santos, M.; Lhamas, D.; da Mota, S.; Leão, A.; Duvoisin, S., Jr.; et al. Deacidification of organic liquid products by fractional distillation in laboratory and pilot scales. J. Anal. Appl. Pyrolysis 2017, 127, 468–489. [Google Scholar] [CrossRef]
- Bernar, L.P.; Ferreira, C.C.; Costa, A.F.d.F.; Ribeiro, H.J.D.S.; dos Santos, W.G.; Pereira, L.M.; Pereira, A.M.; Moraes, N.L.; Assunção, F.P.D.C.; da Mota, S.A.P.; et al. Catalytic Upgrading of Residual Fat Pyrolysis Vapors over Activated Carbon Pellets into Hydrocarbons-like Fuels in a Two-Stage Reactor: Analysis of Hydrocarbons Composition and Physical-Chemistry Properties. Energies 2022, 15, 4587. [Google Scholar] [CrossRef]
- Ferreira, C.C.; Bernar, L.P.; Costa, A.F.d.F.; Ribeiro, H.J.D.S.; Santos, M.C.; Moraes, N.L.; Costa, Y.S.; Baia, A.C.F.; Mendonça, N.M.; da Mota, S.A.P.; et al. Improving Fuel Properties and Hydrocarbon Content from Residual Fat Pyrolysis Vapors over Activated Red Mud Pellets in Two-Stage Reactor: Optimization of Reaction Time and Catalyst Content. Energies 2022, 15, 5595. [Google Scholar] [CrossRef]
- Zhou, H.; Long, Y.; Meng, A.; Li, Q.; Zhang, Y. Classification of municipal solid waste components for thermal conversion in waste-to-energy research. Fuel 2015, 145, 151–157. [Google Scholar] [CrossRef]
- Cabrera-Penna, M.; Rodríguez-Páez, J. Calcium oxyhydroxide (CaO/Ca(OH)2) nanoparticles: Synthesis, characterization and evaluation of their capacity to degrade glyphosate-based herbicides (GBH). Adv. Powder Technol. 2020, 32, 237–253. [Google Scholar] [CrossRef]
- Hassani, E.; Feyzbar-Khalkhali-Nejad, F.; Rashti, A.; Oh, T.-S. Carbonation, Regeneration, and Cycle Stability of the Mechanically Activated Ca(OH)2 Sorbents for CO2 Capture: An In Situ X ray Diffraction Study. Ind. Eng. Chem. Res. 2020, 59, 11402–11411. [Google Scholar] [CrossRef]
- Gopu, C.; Gao, L.; Volpe, M.; Fiori, L.; Goldfarb, J.L. Valorizing municipal solid waste: Waste to energy and activated carbons for water treatment via pyrolysis. J. Anal. Appl. Pyrolysis 2018, 133, 48–58. [Google Scholar] [CrossRef]
- Kumagai, S.; Grause, G.; Kameda, T.; Yoshioka, T. Recovery of benzene-rich oil from the degradation of metal- and metal oxide-containing poly(ethylene terephthalate) composites. J. Mater. Cycles Waste Manag. 2013, 16, 282–290. [Google Scholar] [CrossRef]
- Tas, A.C.; Aldinger, F. Formation of apatitic calcium phosphates in a Na-K-phosphate solution of pH 7.4. J. Mater. Sci. Mater. Med. 2005, 16, 167–174. [Google Scholar] [CrossRef][Green Version]
- Wang, X.; Xu, X.; Ye, Y.; Wang, C.; Liu, D.; Shi, X.; Wang, S.; Zhu, X. In-situ High-Temperature XRD and FTIR for Calcite, Dolomite and Magnesite: Anharmonic Contribution to the Thermodynamic Properties. J. Earth Sci. 2019, 30, 964–976. [Google Scholar] [CrossRef]
- Ghanavati, H.; Nahvi, I.; Karimi, K. Organic fraction of municipal solid waste as a suitable feedstock for the production of lipid by oleaginous yeast Cryptococcus aerius. Waste Manag. 2015, 38, 141–148. [Google Scholar] [CrossRef]
- Li, Z.-S.; Fang, F.; Tang, X.-Y.; Cai, N.-S. Effect of Temperature on the Carbonation Reaction of CaO with CO2. Energy Fuels 2012, 26, 2473–2482. [Google Scholar] [CrossRef]
- NBR 10004; Resíduos Sólidos—Classificação. ABNT—Associação Brasileira de Normas Técnicas: Rio de Janeiro, Brazil, 2004.
- Drudi, K.C.; Drudi, R.; Martins, G.; Antonio, G.C.; Leite, J.T.C. Statistical model for heating value of municipal solid waste in Brazil based on gravimetric composition. Waste Manag. 2019, 87, 782–790. [Google Scholar] [CrossRef]
- Nizami, A.; Shahzad, K.; Rehan, M.; Ouda, O.; Khan, M.; Ismail, I.; Almeelbi, T.; Basahi, J.; Demirbas, A. Developing waste biorefinery in Makkah: A way forward to convert urban waste into renewable energy. Appl. Energy 2017, 186, 189–196. [Google Scholar] [CrossRef]
- Singh, R.P.; Singh, P.; Araujo, A.; Ibrahim, M.H.; Sulaiman, O. Management of urban solid waste: Vermicomposting a sustainable option. Resour. Conserv. Recycl. 2011, 55, 719–729. [Google Scholar] [CrossRef]
- Zhou, H.; Long, Y.; Meng, A.; Li, Q.; Zhang, Y. Interactions of three municipal solid waste components during co-pyrolysis. J. Anal. Appl. Pyrolysis 2015, 111, 265–271. [Google Scholar] [CrossRef]
- da Silva, L.J.d.V.B.; dos Santos, I.F.S.; Mensah, J.H.R.; Gonçalves, A.T.T.; Barros, R.M. Incineration of municipal solid waste in Brazil: An analysis of the economically viable energy potential. Renew. Energy 2019, 149, 1386–1394. [Google Scholar] [CrossRef]
- Kumar, A.; Samadder, S.R. A review on technological options of waste to energy for effective management of municipal solid waste. Waste Manag. 2017, 69, 407–422. [Google Scholar] [CrossRef]
- Renz, M. Ketonization of Carboxylic Acids by Decarboxylation: Mechanism and Scope. Eur. J. Org. Chem. 2005, 2005, 979–988. [Google Scholar] [CrossRef]
- Maniscalco, M.; Infurna, G.; Caputo, G.; Botta, L.; Dintcheva, N.T. Slow Pyrolysis as a Method for Biochar Production from Carob Waste: Process Investigation and Products’ Characterization. Energies 2021, 14, 8457. [Google Scholar] [CrossRef]
- Mati, A.; Buffi, M.; Dell’Orco, S.; Lombardi, G.; Ramiro, P.M.R.; Kersten, S.R.A.; Chiaramonti, D. Fractional Condensation of Fast Pyrolysis Bio-Oil to Improve Biocrude Quality towards Alternative Fuels Production. Appl. Sci. 2022, 12, 4822. [Google Scholar] [CrossRef]
- Belbessai, S.; Azara, A.; Abatzoglou, N. Recent Advances in the Decontamination and Upgrading of Waste Plastic Pyrolysis Products: An Overview. Processes 2022, 10, 733. [Google Scholar] [CrossRef]
Publisher’s Note: MDPI stays neutral with regard to jurisdictional claims in published maps and institutional affiliations. |
© 2022 by the authors. Licensee MDPI, Basel, Switzerland. This article is an open access article distributed under the terms and conditions of the Creative Commons Attribution (CC BY) license (https://creativecommons.org/licenses/by/4.0/).

