Author Contributions
The authors have contributed to the current study as follows: Conceptualization, M.P. and M.L.; methodology, V.P. and M.L.; software, R.F. and V.P.; validation, V.P., M.P. and M.L.; formal analysis, R.F.; investigation, R.F.; resources, R.F.; data curation, M.L.; writing—original draft preparation, R.F.; writing—review and editing, V.P.; visualization, R.F.; supervision, M.P. and M.L.; project administration, M.P. and M.L.; funding acquisition, M.P. and M.L. All authors have read and agreed to the published version of the manuscript.
Figure 1.
Distribution of selected hours in a day.
Figure 1.
Distribution of selected hours in a day.
Figure 2.
Diagram of the distribution network in the IN region.
Figure 2.
Diagram of the distribution network in the IN region.
Figure 3.
Share of individual sales in the total sales of top 10 models of BEV and PHEV. (a) BEV. (b) PHEV.
Figure 3.
Share of individual sales in the total sales of top 10 models of BEV and PHEV. (a) BEV. (b) PHEV.
Figure 4.
Top 10 BEVs (a) and PHEVs (b)—Usable batteries and on-board charging limitations.
Figure 4.
Top 10 BEVs (a) and PHEVs (b)—Usable batteries and on-board charging limitations.
Figure 5.
Distribution of home chargers based on EV model and its on-board charger.
Figure 5.
Distribution of home chargers based on EV model and its on-board charger.
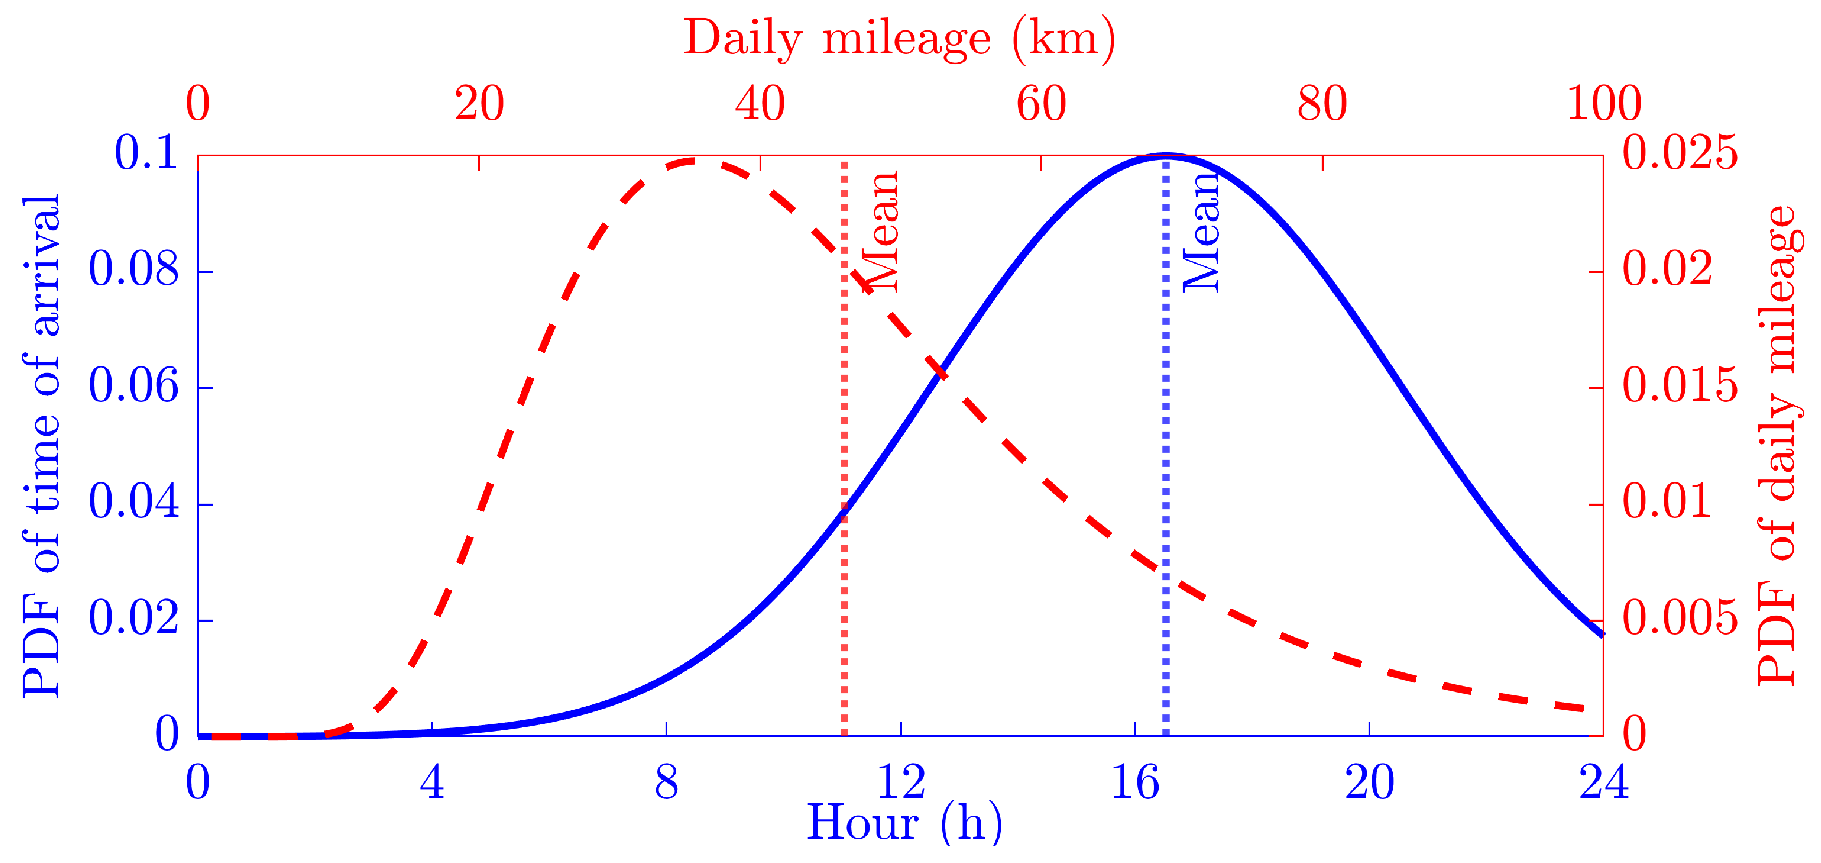
Figure 6.
Probability density functions (PDFs) of arrival time and daily mileage.
Figure 6.
Probability density functions (PDFs) of arrival time and daily mileage.
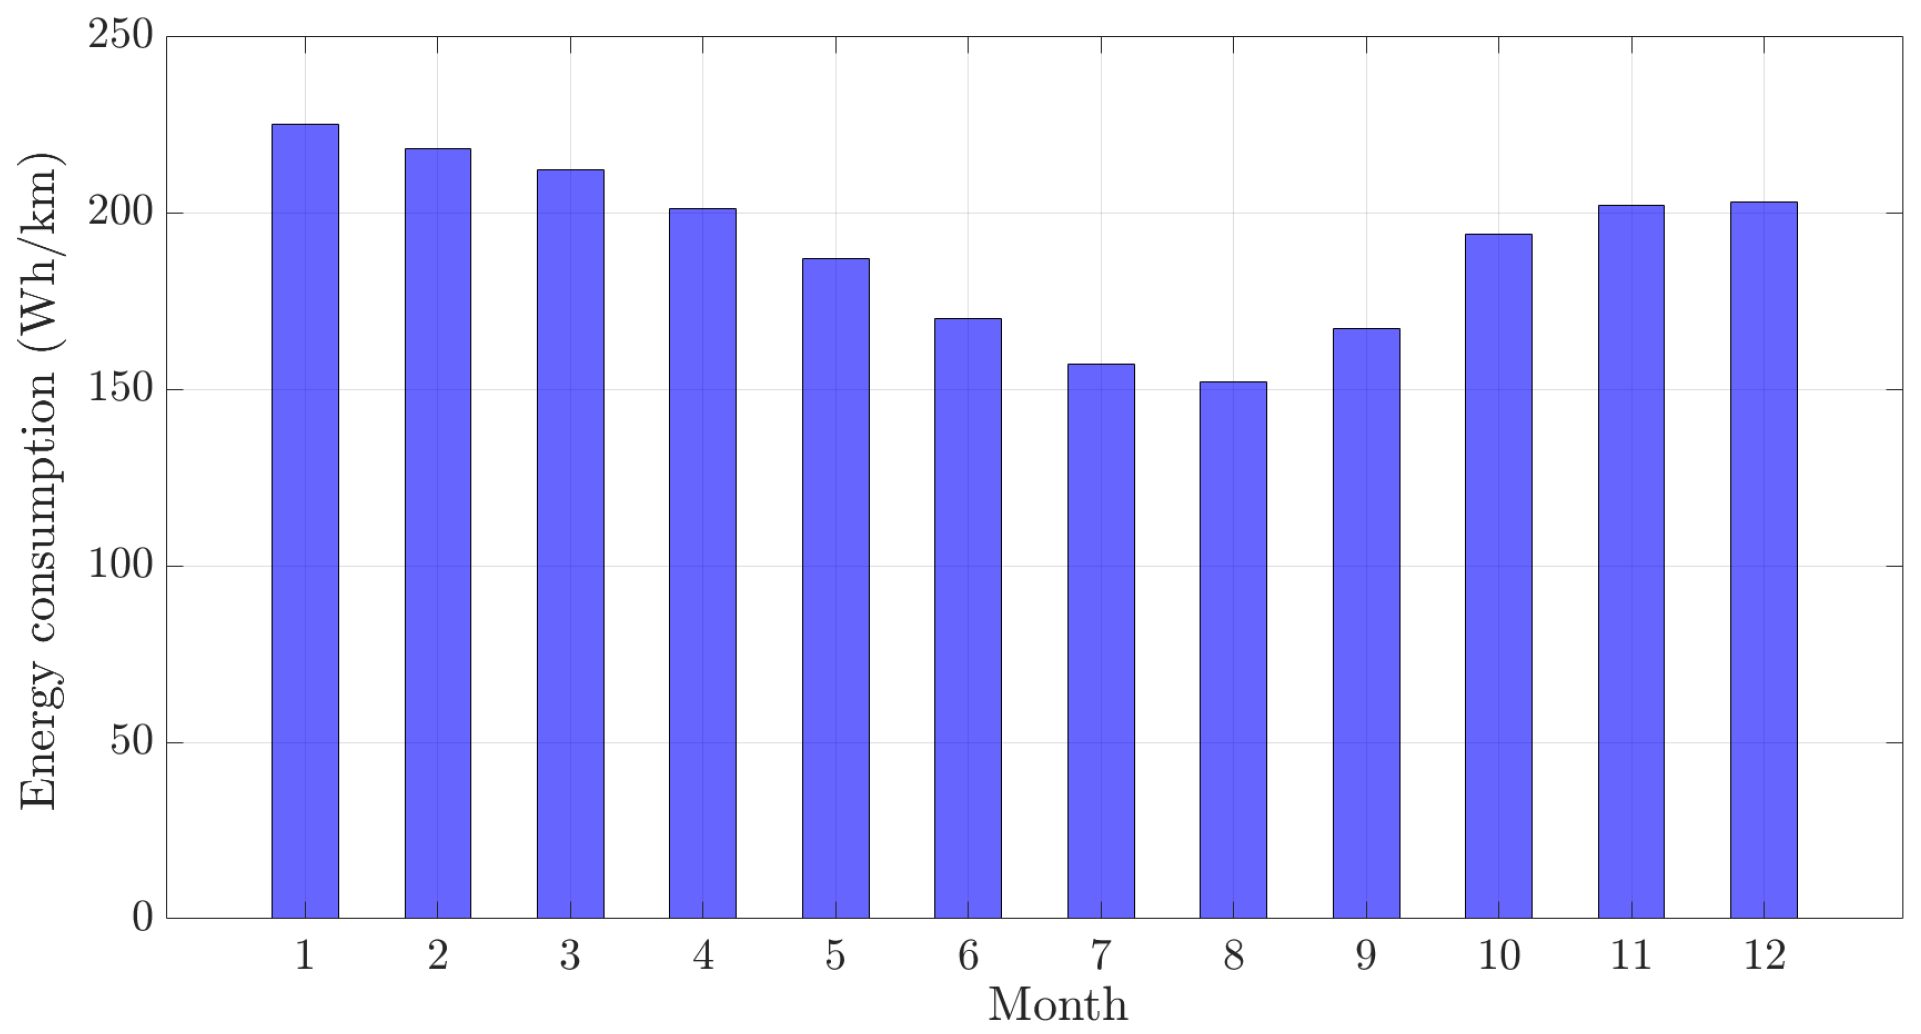
Figure 7.
Average EV energy consumption in Helsinki [
22].
Figure 7.
Average EV energy consumption in Helsinki [
22].
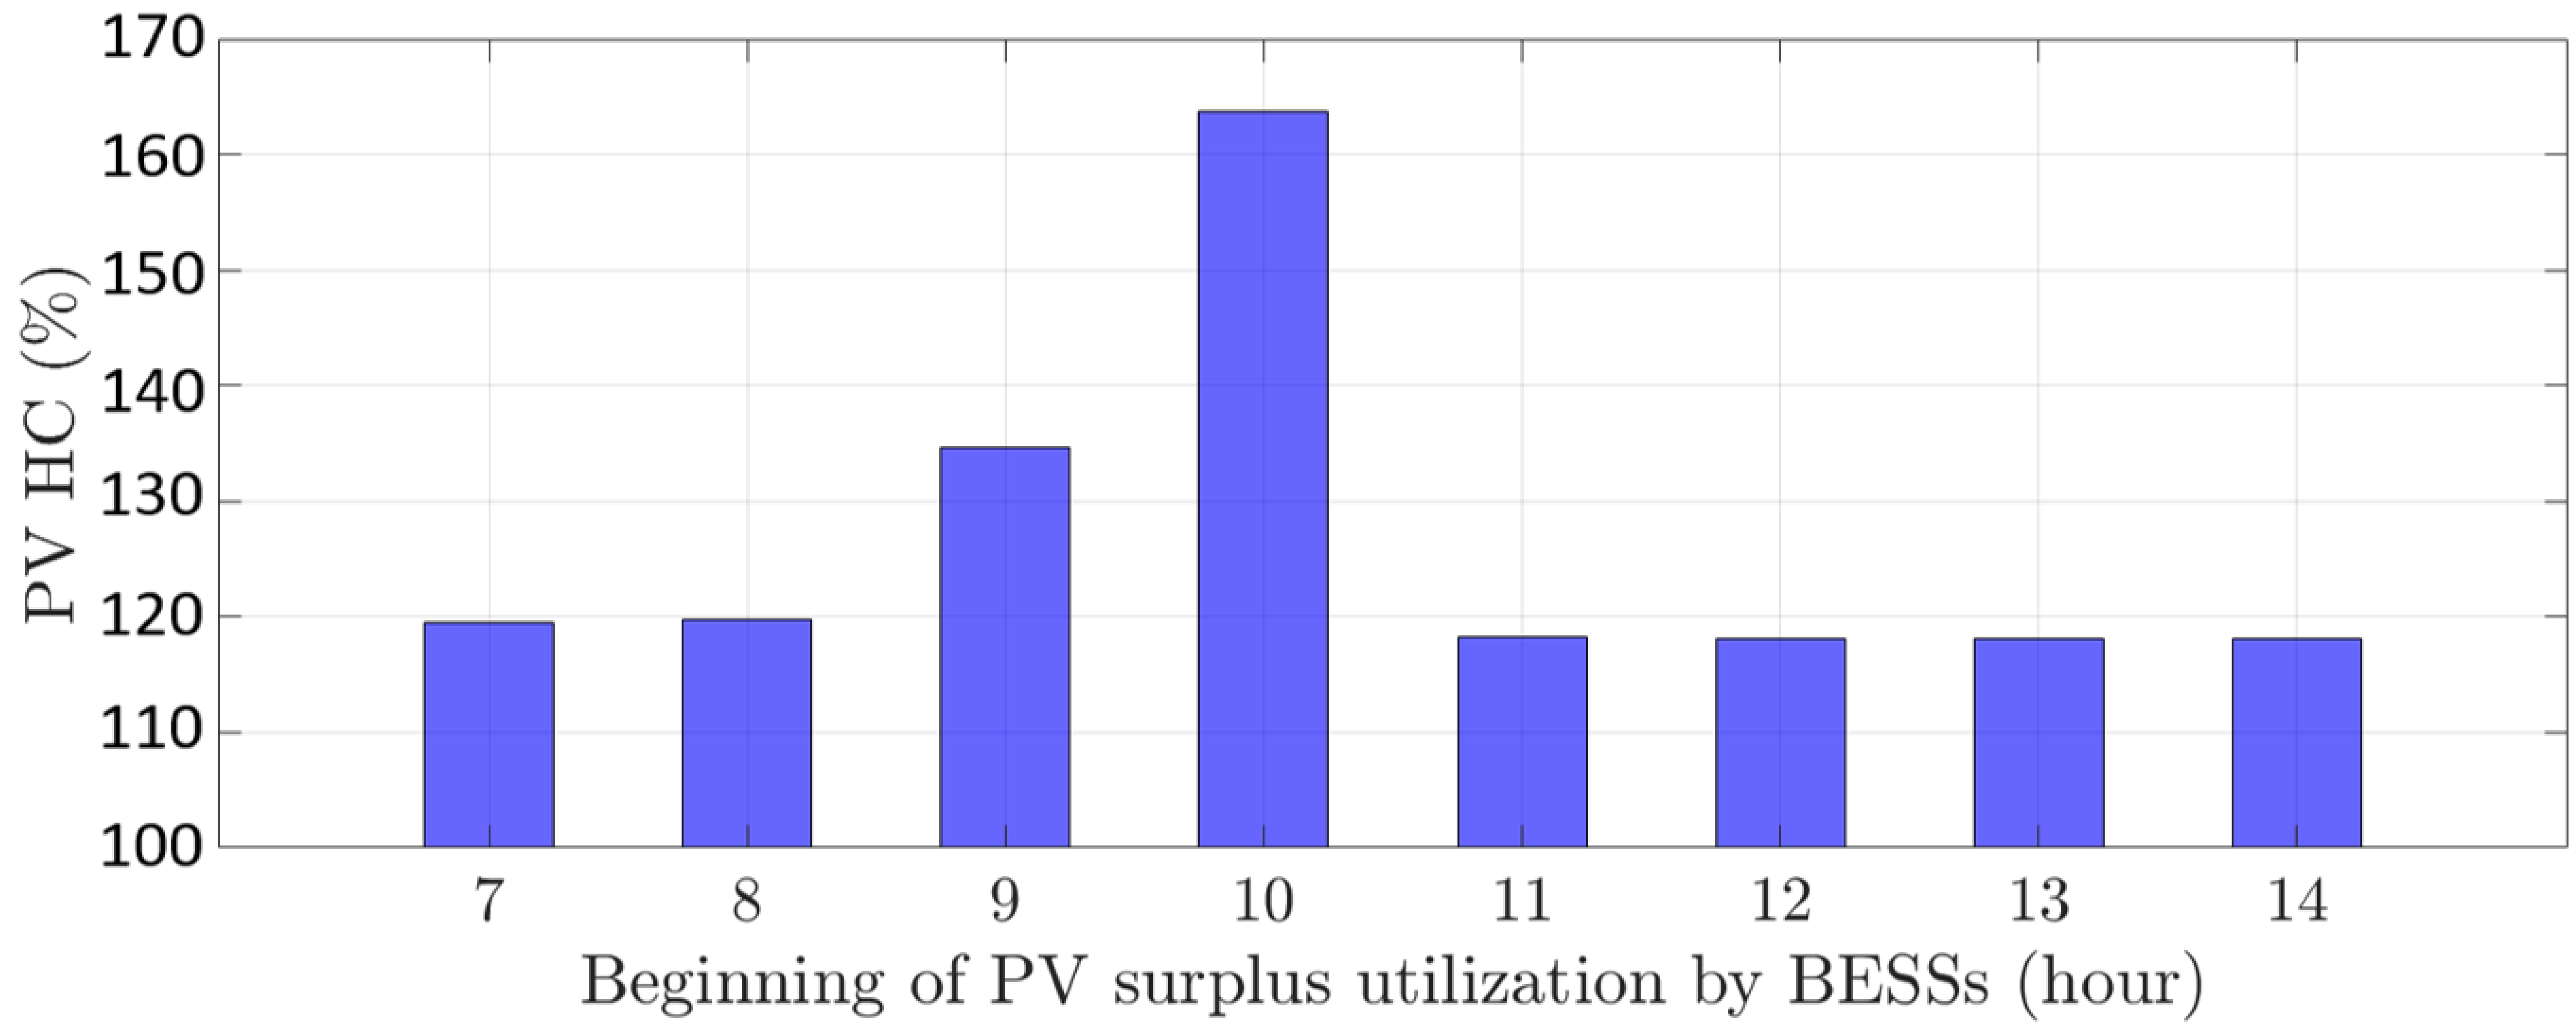
Figure 8.
Analysis of the most suitable hour allowing BESSs to use PV surplus; IN region; 100% penetration of 5 kW/13.5 kWh BESSs; 500 iterations per case.
Figure 8.
Analysis of the most suitable hour allowing BESSs to use PV surplus; IN region; 100% penetration of 5 kW/13.5 kWh BESSs; 500 iterations per case.
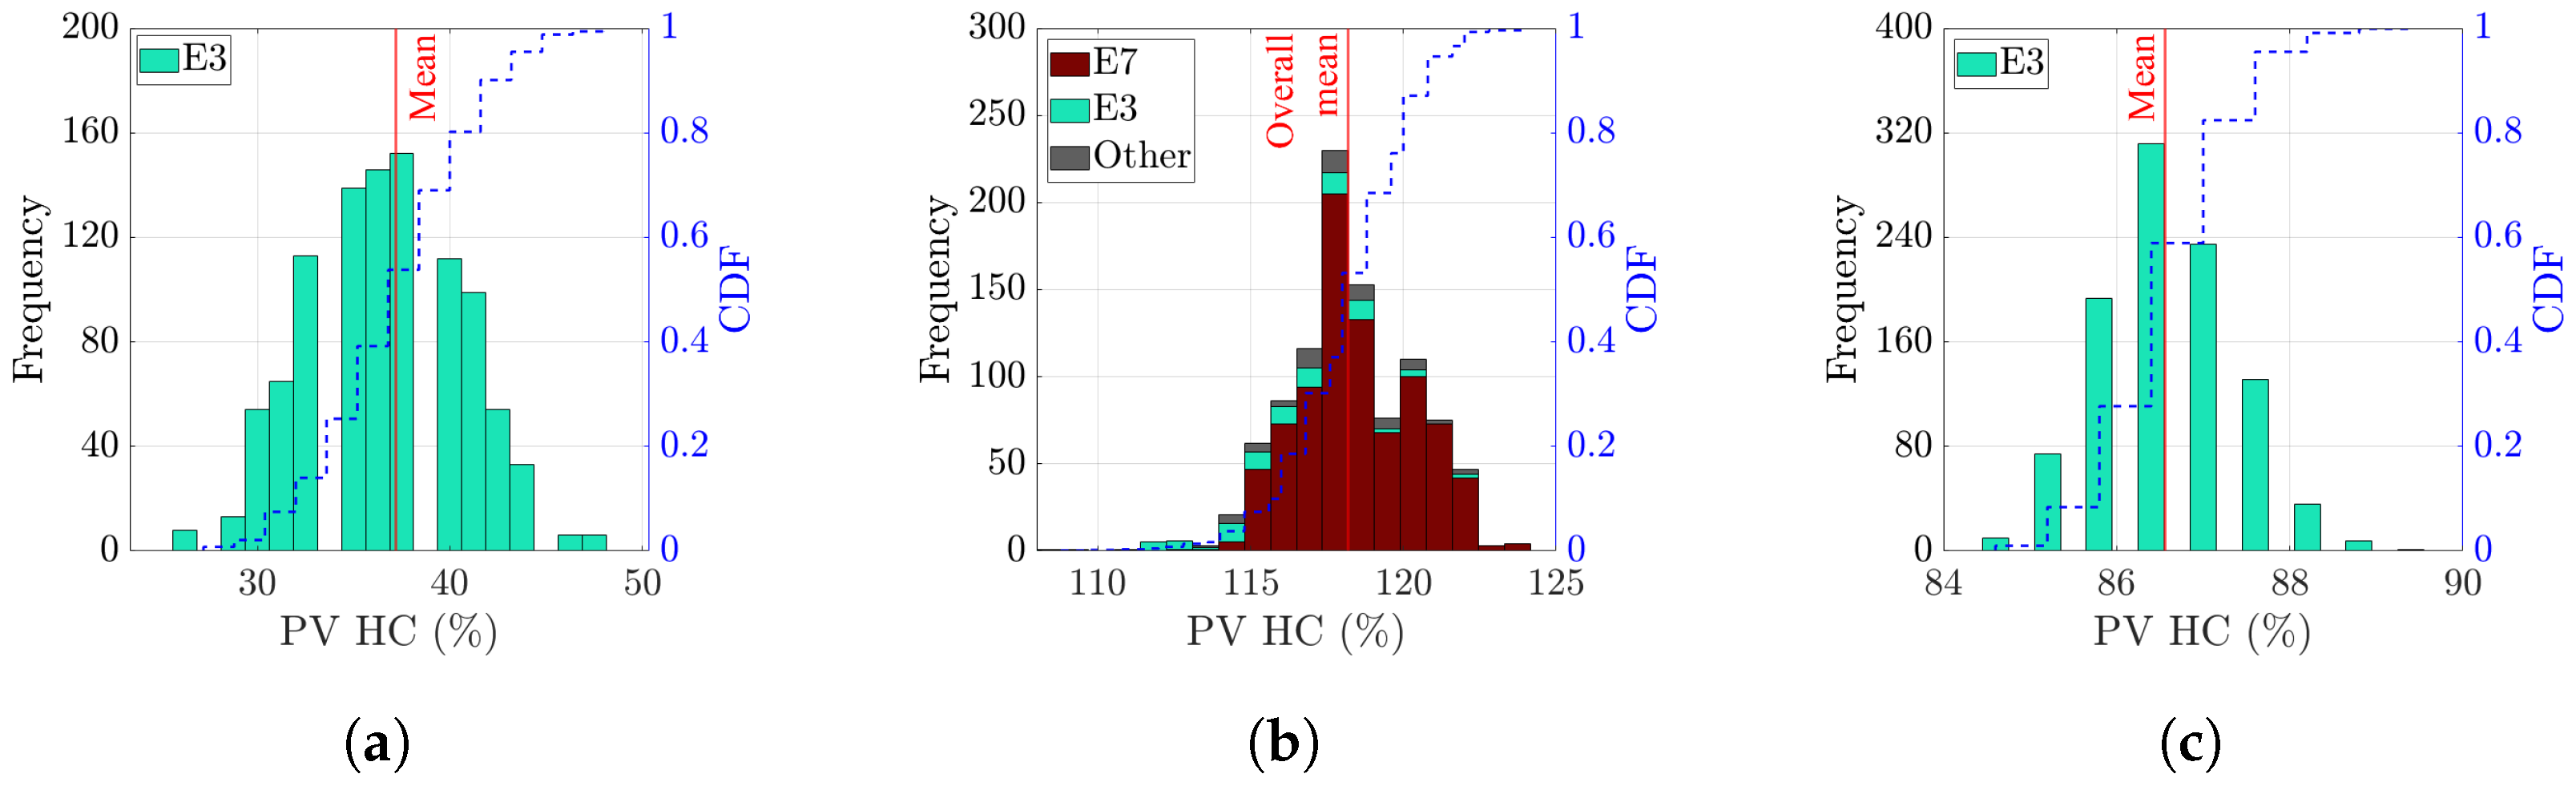
Figure 9.
PV HC of the reference case; 1000 iterations (Overvoltage (E3), Transformer capacity (E7)). (a) PR. (b) IN. (c) PU.
Figure 9.
PV HC of the reference case; 1000 iterations (Overvoltage (E3), Transformer capacity (E7)). (a) PR. (b) IN. (c) PU.
Figure 10.
PV HC to load of the reference case; 1000 iterations (Overvoltage (E3), Transformer capacity (E7)). (a) PR. (b) IN. (c) PU.
Figure 10.
PV HC to load of the reference case; 1000 iterations (Overvoltage (E3), Transformer capacity (E7)). (a) PR. (b) IN. (c) PU.
Figure 11.
Example of the total load of the transformer in the reference case; IN region; PV generation at the point of HC of 118.2% (236 kWp).
Figure 11.
Example of the total load of the transformer in the reference case; IN region; PV generation at the point of HC of 118.2% (236 kWp).
Figure 12.
Example of the total load of the transformer, including operation of BESSs; IN region; PV systems at the point of HC at around 163.7% (327 kWp); BESS penetration 100% (40× BESS 5 kW/13.5 kWh).
Figure 12.
Example of the total load of the transformer, including operation of BESSs; IN region; PV systems at the point of HC at around 163.7% (327 kWp); BESS penetration 100% (40× BESS 5 kW/13.5 kWh).
Figure 13.
Example of the change of BESS SoC of a customer with Storage Heating (SH) (a) and District Heating (DH) (b); PV systems at the point of HC; BESS 5 kW/13.5 kWh.
Figure 13.
Example of the change of BESS SoC of a customer with Storage Heating (SH) (a) and District Heating (DH) (b); PV systems at the point of HC; BESS 5 kW/13.5 kWh.
Figure 14.
Impact of the number of iterations on the simulation accuracy.
Figure 14.
Impact of the number of iterations on the simulation accuracy.
Figure 15.
Impact of the probability that EV remains connected all day on PV HC. Note that the reference case HCs: PR = 37.2%; IN = 118.2%; PU = 86.6%. (a) Regional difference with PC fleet: All BEVs. (b) PC fleet difference in IN region.
Figure 15.
Impact of the probability that EV remains connected all day on PV HC. Note that the reference case HCs: PR = 37.2%; IN = 118.2%; PU = 86.6%. (a) Regional difference with PC fleet: All BEVs. (b) PC fleet difference in IN region.
Figure 16.
Analysis of the impact of change of BESS power/size on PV HC; IN region; 100% BESS penetration; 500 iterations per analyzed combination.
Figure 16.
Analysis of the impact of change of BESS power/size on PV HC; IN region; 100% BESS penetration; 500 iterations per analyzed combination.
Figure 17.
The cost efficiency of network reinforcement vs. BESS; PR Region.
Figure 17.
The cost efficiency of network reinforcement vs. BESS; PR Region.
Table 1.
Network parameters of the simulated regions.
Table 1.
Network parameters of the simulated regions.
| Parameter | Region |
|---|
| PR | IN | PU |
|---|
| Number of feeders | 1 | 3 | 3 |
| Nodes per feeder | 8 | 4/3/3 | 2/2/1 |
| Customers per node | 1 | 4 | 60 |
| Total customers | 8 | 40 | 300 |
Table 2.
Transformer specifications.
Table 2.
Transformer specifications.
| Region | Transformer (kVA) | Short Circuit Impedance (%) | No-Load Losses (W) | Load Losses (W) |
|---|
| PR | 50 | 4 | 90 | 1100 |
| IN | 200 | 4 | 253 | 2834 |
| PU | 1000 | 6 | 770 | 10,500 |
Table 3.
Cable specifications.
Table 3.
Cable specifications.
| Region | Cable (mm) | Length (m) | Impedance (/km) | Ampacity (A) |
|---|
| PR | AXMK | 150 | 0.53 + 0.08i | 185 |
| IN | AXMK | 100 | 0.20 + 0.08i | 330 |
| PU | AXMK | 100 | 0.10 + 0.04i | 660 |
Table 4.
Heating modes across the regions.
Table 4.
Heating modes across the regions.
| Heating Mode | Region |
|---|
| PR | IN | PU |
|---|
| Storage heating (SH) (%) | 5.9 | 7.6 | 0.5 |
| District heating (DH) (%) | 52.9 | 52.5 | 95.3 |
| Direct electric heating (DEH) (%) | 41.2 | 39.9 | 4.2 |
Table 5.
Simulated EV penetration levels.
Table 5.
Simulated EV penetration levels.
| PC Fleet | Share of BEVs (%) | Share of PHEVs (%) | Not-EVs (%) |
|---|
| 2030 | 8.98 | 11.54 | 80.48 |
| 2040 | 22.68 | 19.65 | 57.66 |
| all BEVs | 100 | 0 | 0 |
Table 6.
Overview of EV chargers.
Table 6.
Overview of EV chargers.
| EV Charger Rated Power (kW) | Type | Probability (%) |
|---|
| 3.7 | 1 × 230 V/16 A | 34.5 |
| 7.4 | 1 × 230 V/32 A | 26.7 |
| 6.9 | 3 × 230 V/10 A | 4.7 |
| 11 | 3 × 230 V/16 A | 30.2 |
| 22 | 3 × 230 V/32 A | 3.9 |
Table 7.
PV HC of networks in reference case (Overvoltage (E3), Transformer capacity (E7)).
Table 7.
PV HC of networks in reference case (Overvoltage (E3), Transformer capacity (E7)).
| Region | Limiting Constraint | (%) |
|---|
| Predominantly Rural (PR) | E3 (100%) | 37.2 |
| Intermediate (IN) | E7 (91%), E3 (15%) | 118.2 |
| Predominantly Urban (PU) | E3 (100%) | 86.6 |
Table 8.
PV HC of networks, including uncontrolled charging of EVs (Overvoltage (E3), Transformer capacity (E7)).
Table 8.
PV HC of networks, including uncontrolled charging of EVs (Overvoltage (E3), Transformer capacity (E7)).
| Region | PC Fleet | Limiting Constraint | (%) |
|---|
| PR | 2030 | E3 (100%) | 37.0 |
| 2040 | E3 (100%) | 37.2 |
| All BEVs | E3 (100%) | 37.0 |
| IN | 2030 | E7 (89%), E3 (15%) | 118.2 |
| 2040 | E7 (87%), E3 (16%) | 118.5 |
| All BEVs | E7 (78%), E3 (24%) | 119.3 |
| PU | 2030 | E3 (100%) | 86.7 |
| 2040 | E3 (100%) | 87.0 |
| All BEVs | E3 (100%) | 88.5 |
Table 9.
PV HC of networks, including daily controlled charging of EVs (Overvoltage (E3), Transformer capacity (E7)).
Table 9.
PV HC of networks, including daily controlled charging of EVs (Overvoltage (E3), Transformer capacity (E7)).
| Region | PC Fleet | Limiting Constraint | u (%) |
|---|
| PR | 2030 | E3 (100%) | 37.1 |
| 2040 | E3 (100%) | 37.1 |
| All BEVs | E3 (100%) | 37.5 |
| IN | 2030 | E7 (89%), E3 (13%) | 118.4 |
| 2040 | E7 (88%), E3 (15%) | 118.9 |
| All BEVs | E7 (72%), E3 (30%) | 120.2 |
| PU | 2030 | E3 (100%) | 86.8 |
| 2040 | E3 (100%) | 87.2 |
| All BEVs | E3 (100%) | 89.0 |
Table 10.
PV HC of networks, including uncontrolled BESSs (Overvoltage (E3), Transformer capacity (E7)).
Table 10.
PV HC of networks, including uncontrolled BESSs (Overvoltage (E3), Transformer capacity (E7)).
| Region | BESS Penetration (%) | Limiting Constraint | u (%) |
|---|
| PR | 50 | E3 (100%) | 55.2 |
| 100 | E3 (100%) | 72.8 |
| IN | 50 | E7 (81%), E3 (20%) | 141.5 |
| 100 | E7 (89%), E3 (13%) | 163.7 |
| PU | 50 | E3 (100%) | 110.3 |
| 100 | E3 (100%) | 120.5 |
Table 11.
PV HC of networks, including controlled BESSs (Overvoltage (E3), Transformer capacity (E7)).
Table 11.
PV HC of networks, including controlled BESSs (Overvoltage (E3), Transformer capacity (E7)).
| Region | BESS Penetration (%) | Limiting Constraint | (%) |
|---|
| PR | 100 | E3 (100%) | 128.7 |
| IN | 100 | E7 (100%) | 210.0 |
| PU | 100 | E7 (100%) | 245.6 |
Table 12.
PV HC of networks, including daily controlled charging of EVs and BESSs (Undervoltage (E2), Overvoltage (E3), Voltage unbalance (E4), Transformer capacity (E7)).
Table 12.
PV HC of networks, including daily controlled charging of EVs and BESSs (Undervoltage (E2), Overvoltage (E3), Voltage unbalance (E4), Transformer capacity (E7)).
| Region | BESS Penetration (%) | Limiting Constraint | (%) |
|---|
| PC fleet: 2040 |
| PR | 50 | E3 (99%), E4 (1%) | 58.6 |
| 100 | E3 (99%), E2 (2%) | 88.8 |
| IN | 50 | E7 (83%), E3 (19%) | 150.4 |
| 100 | E7 (93%), E3 (8%) | 177.6 |
| PU | 50 | E3 (100%) | 123.9 |
| 100 | E3 (100%) | 144.9 |
| PC fleet: All BEVs |
| PR | 50 | E3 (98%), E4 (1%) | 68.4 |
| 100 | E3 (97%), E2 (2%) | 110.8 |
| IN | 50 | E7 (87%), E3 (14%) | 163.0 |
| 100 | E7 (99%), E3 (2%) | 197.8 |
| PU | 50 | E3 (99%), E7 (1%) | 159.2 |
| 100 | E7 (98%), E3 (4%) | 208.3 |
Table 13.
PV HC of networks, including daily controlled charging of EVs and BESSs utilizing their full potential; PC fleet: All BEVs; (Undervoltage (E2), Overvoltage (E3), Transformer capacity (E7)).
Table 13.
PV HC of networks, including daily controlled charging of EVs and BESSs utilizing their full potential; PC fleet: All BEVs; (Undervoltage (E2), Overvoltage (E3), Transformer capacity (E7)).
| Region | BESS Penetration (%) | Limiting Constraint | (%) |
|---|
| PR | 100 | E3 (97%), E2 (2%) | 127.2 |
| IN | 100 | E7 (100%) | 212.6 |
| PU | 100 | E7 (100%) | 249.7 |
Table 14.
Summary table of the main findings.
Table 14.
Summary table of the main findings.
| Case | PV HC (%) |
|---|
| Category | Sub-Category | PR | IN | PU |
|---|
| Reference case (no EV, BESS) | - | 37.2 | 118.2 | 86.6 |
| EV, uncontrolled charging | EV fleet 2030 | 37.0 | 118.2 | 86.7 |
| EV fleet 2040 | 37.2 | 118.5 | 87.0 |
| EV fleet All BEVs | 37.0 | 119.3 | 88.5 |
| EV, controlled charging | EV fleet 2030 | 37.1 | 118.4 | 86.8 |
| EV fleet 2040 | 37.1 | 118.9 | 87.2 |
| EV fleet All BEVs | 37.5 | 120.2 | 89.0 |
EV, controlled charging
80% probability of EV parked all day | EV fleet All BEVs | 58.4 | 172.5 | 208.4 |
| BESS, uncontrolled charging | BESS penetration 50% | 55.2 | 141.5 | 110.3 |
| BESS penetration 100% | 72.8 | 163.7 | 120.5 |
| BESS, controlled charging | BESS penetration 100% | 128.7 | 210.0 | 245.6 |
EV, controlled charging
with uncontrolled BESS | EV fleet 2040
BESS penetration 50% | 58.6 | 150.4 | 123.9 |
EV fleet 2040
BESS penetration 100% | 88.8 | 177.6 | 144.9 |
EV fleet All BEVs
BESS penetration 50% | 68.4 | 163.0 | 159.2 |
EV fleet All BEVs
BESS penetration 100% | 110.8 | 197.8 | 208.3 |
EV, controlled charging
with controlled BESS | EV fleet All BEVs
BESS penetration 100% | 127.2 | 212.6 | 249.7 |


