
An Econometric Model of the Operation of the Steel Industry in POLAND in the Context of Process Heat and Energy Consumption


Abstract
1. Introduction
- Is there an econometric model describing heat consumption (intensity) in the steel industry in Poland in relation to steel production and the energy economy?
- What are the relations between heat intensity and energy prices and steel production in Poland?
- How might the current energy crisis affect steel production?
2. Literature Review
2.1. Productivity of Processes in the Context of Energy and Heat (Carbon) Consumption in the Steel Industry
- The increase in transformer capacity
- Installation of supporting burner
- The reduction in the time of melting by injection of oxygen gas
- The reduction in melting time using the method of carbon injection
- Installation of scrap pre-heater
- Reduction in power-off time
- Installation of a new secondary smelting plant
- Reduction in tapping process temperature
- Optimum control of the input of electric power
- Reduction in heat loss by cooling water of technological furnace body
- Reduction in tap-to-tap time
- Improvement in air ratio
- Pre-heating of air combustion by waste heat recovery
- Lower discharging billet temperature
- Hot charge ratio improvement
- Heat loss from furnace wall reduction
- Prevention of loss of heat from openings, such as inspection ports or charging ports
- Insulation of water-cooled skid pipe reinforcement
- Regenerative burner introduction
- Improvement in rolling yield
2.2. Sustainable Fuel and Energy Management in the Polish Steel Industry Report
3. Modelling the Heat and Power Management of the Polish Steel Industry, Materials and Methods
4. Econometric Model
- y*t—heat intensity in steel production [GJ] in the period (T) from 2004 to 2020,
- x1t—energy price (all taxes and levies included) [PLN/kWh] in the period (T) from 2004 to 2020, and
- x2t—steel production [thousand tonnes] in the period (T) from 2004 to 2020.
- An increase in the energy prices: all taxes and levies included by a unit [PLN/kWh] (x1t) will reduce the heat intensity in steel production (y*t) by 5,290,326 GJ, with the first factor remaining unchanged, which is the steel production in this model (x2t).
- An increase in the steel production (x2t) by a unit [thousand tonnes] will increase the heart intensity in steel production (y*t) by 929.274 GJ, with the second factor remaining unchanged, which, in this model, is energy prices (x1t).
5. Discussion
6. Conclusions
Author Contributions
Funding
Informed Consent Statement
Data Availability Statement
Conflicts of Interest
References
- Gajdzik, B.; Wyciślik, A. Environmental strategies as the system of action–chronological order and market classification. Annals. F.E.H. J. Eng. 2007, 3, 116–121. [Google Scholar]
- 2008/2001/EU; Renewable Energy Directive. European Commission: Brussels, Belgium, 2008. Available online: https://ec.europa.eu/energy/topics/renewable-energy/directive-targets-and-rules/renewable-energy-directive_en (accessed on 5 July 2022).
- OECD and Green Growth. Brochure of Organization for Economic Co-Operation and Development. 2009. Available online: https://www.oecd.org/greengrowth/44273385.pdf (accessed on 30 August 2022).
- Brundtland, G.H. Our Common Future, Report of the World Commission on Environment and Development, Our Common Future (Brundtland Report); Oxford University Press: New York, NY, USA, 1987. [Google Scholar]
- Płaczek, E. Zrównoważony rozwój–nowym wyzwaniem dla współczesnych operatorów logistycznych. (Sustainable development—A new challenge for modern companies). Pr. Nauk. Politech. Warsz. Transp. 2012, 84, 79–92. [Google Scholar]
- Industry 5.0 Towards A Sustainable, Human Centric and Resilient European Industry; European Commission: Brussels, Belgium, 2021; p. 14. Available online: https://op.europa.eu/en/publication-detail/-/publication/aed3280d-70fe-11eb-9ac9-01aa75ed71a1/language-en/format-PDF/source-search (accessed on 10 September 2021).
- Gajdzik, B.; Grabowska, S.; Saniuk, S.; Wieczorek, T. Sustainable Development and Industry 4.0: A Bibliometric Analysis Identifying Key Scientific Problems of the Sustainable Industry 4.0. Energies 2020, 13, 4254. [Google Scholar] [CrossRef]
- Grabowska, S.; Saniuk, S.; Gajdzik, B. Industry 5.0: Improving humanization and sustainability of Industry 4.0. Scientometrics 2022, 127, 3117–3144. [Google Scholar] [CrossRef]
- Saniuk, S.; Grabowska, S.; Straka, M. Identification of Social and Economic Expectations: Contextual Reasons for the Transformation Process of Industry 4.0 into the Industry 5.0 Concept. Sustainability 2022, 14, 1391. [Google Scholar] [CrossRef]
- Lee, J.; Bagheri, B.; Kao, H. Research Letters: A Cyber-Physical Systems architecture for Industry 4.0-based manufacturing systems. Manuf. Lett. 2015, 3, 18–23. [Google Scholar] [CrossRef]
- Liu, Y.; Peng, Y.; Wang, B.; Yao, S.; Liu, Z. Review on cyber-physical systems. IEEE/CAA J. Autom. Sin. 2017, 4, 27–40. [Google Scholar] [CrossRef]
- Romero, D.; Noran, O.; Stahre, J.; Bernus, P.; Fast-Berglund, Å. Towards a human-centred reference architecture for next generation balanced automation systems: Human-automation symbiosis. In Advances in Production Management Systems: Initiatives for a Sustainable World, Proceedings of the IFIP International Conference on Advances in Production Management Systems—APMS, Tokyo, Japan, 7–9 September 2015; Springer: Berlin/Heidelberg, Germany, 2015; pp. 556–566. Available online: https://link.springer.com/chapter/10.1007/978-3-319-22759-7_64 (accessed on 20 March 2022).
- Romero, D.; Stahre, J.; Wuest, T.; Noran, O.; Bernus, P.; Fast-Berglund, Å.; Gorecky, D. Towards an Operator 4.0 Typology: A Human-Centric Perspective on the Fourth Industrial Revolution Technologies. In Proceedings of the International Conference on Computers and Industrial Engineering (CIE46), Tianjin, China, 29–31 October 2016; Volume 11, pp. 1–11. [Google Scholar]
- Marshall, L.; Suliman, A.; Lei, Z. A Novel Productivity Measure for Steel Fabrication Fitting Process. In Proceedings of the Canadian Society of Civil Engineering Annual Conference 2021, Virtual Conference, 26-29 May 2021; Springer: Singapore, 2022; Volume 240, pp. 43–55. [Google Scholar]
- Wang, X.; Tang, R. Research on carbon productivity and its spatial convergence of steel industry in China. Environ. Sci. Pollut. Res. 2022, 29, 49234–49252. [Google Scholar] [CrossRef]
- Panigrahi, R.R.; Jena, D.; Mishra, P.C. Inventory automation practices and productivity: A study on steel manufacturing firms. Int. J. Appl. Syst. Stud. 2022, 9, 195–213. [Google Scholar] [CrossRef]
- Maddalena, R. Steel product development aided by automated particle workflow: In steel production, an automated particle workflow can increase the efficiency and statistical relevance of nanosized precipitate analyses, resulting in increased productivity and accuracy. Adv. Mater. Process. 2021, 179, 30–32. [Google Scholar]
- Saha, S.; Paul, B.C.; Das, S. Productivity improvement in butt joining of thick stainless steel plates through the usage of activated TIG welding. SN Appl. Sci. 2021, 3, 416. [Google Scholar] [CrossRef]
- Aha, B.; Hettich, D.; Veldhuis, M.; Filzek, J. Higher productivity in forming high-alloyed steel by temperature insensitive friction behavior. In Proceedings of the ESAFORM 2021—24th International Conference on Material Forming, Liège, Belgium, 14–16 April 2021; p. 2075. [Google Scholar]
- Serebrennikova, A.G.; Savilov, A.V.; Osipov, V.V. High productivity turning of stainless steel 06cr14h6cu2monbti. Lect. Notes Netw. Syst. 2021, 200, 292–302. [Google Scholar]
- Kuriakose, S.; Kuriakose, S. Productivity improvement through identifying hazardous conditions in steel foundry. IOP Conf. Ser. Mater. Sci. Eng. 2020, 872, 012091. [Google Scholar]
- Sharma, A.; Roy, H.; Dalei, N.N. Estimation of energy intensity in Indian iron and steel sector: A panel data analysis. Stat. Transit. 2019, 20, 107–121. [Google Scholar] [CrossRef]
- Energy Use in the Steel Industry. Available online: https://worldsteel.org/wp-content/uploads/Fact-sheet-Energy-use-in-the-steel-industry.pdf (accessed on 5 September 2022).
- Gabriel, M.; Pessl, E. Industry 4.0 and sustainability impacts: Critical discussion of sustainability aspects with a special focus on future of work and ecological consequences. Ann. Fac. Eng. Hunedoara 2016, 14, 131. [Google Scholar]
- Erboz, G. How to Define Industry 4.0: The Main Pillars of Industry 4.0. 2017. Available online: https://www.researchgate.net/publication/326557388_How_To_Define_Industry_40_Main_Pillars_Of_Industry_40 (accessed on 5 September 2022).
- Miśkiewicz, R.; Wolniak, R. Practical Application of the Industry 4.0 Concept in a Steel Company. Sustainability 2020, 12, 5776. [Google Scholar] [CrossRef]
- Gajdzik, B.; Wolniak, R. Digitalisation and Innovation in the Steel Industry in Poland—Selected Tools of ICT in an Analysis of Statistical Data and a Case Study. Energies 2021, 14, 3034. [Google Scholar] [CrossRef]
- Gajdzik, B.; Wolniak, R. Transitioning of Steel Producers to the Steelworks 4.0—Literature Review with Case Studies. Energies 2021, 14, 4109. [Google Scholar] [CrossRef]
- Gajdzik, B. How Steel Mills Transform into Smart Mills: Digital Changes and Development Determinants in the Polish Steel Industry. Eur. Res. Stud. J. 2022, 25, 27–42. [Google Scholar] [CrossRef]
- Gajdzik, B. Frameworks of the Maturity Model for Industry 4.0 with Assessment of Maturity Levels on the Example of the Segment of Steel Enterprises in Poland. J. Open Innov. Technol. Mark. Complex. 2022, 8, 77. [Google Scholar] [CrossRef]
- Peters, H. Application of industry 4.0 concepts at steel production from an applied research perspective. In Proceedings of the 17th IFAC Symposium on Control, Optimization, and Automation in Mining, Mineral and Metal Processing, Vienna, Austria, 31 August–2 September 2016; Available online: https://tc.ifac-control.org/6/2/files/symposia/vienna-2016/mmm2016_keynotes_peters (accessed on 10 March 2022).
- European Steel Technology Platform—Vision 2030; Report of the Group of Personalities; European Commission: Brussels, Belgium, 2022.
- Chen, D.; Lu, B.; Chen, G.; Yu, W. Influence of the production fluctuation on the process energy intensity in iron and steel industry. Adv. Prod. Eng. Manag. 2017, 12, 75–87. [Google Scholar] [CrossRef]
- Lu, B.; Chen, G.; Chen, D.; Yu, W. An energy intensity optimization model for production system in iron and steel industry. Appl. Therm. Eng. 2016, 100, 285–295. [Google Scholar] [CrossRef]
- Filippini, M.; Geissmann, T.; Karplus, V.J.; Zhang, D. The productivity impacts of energy efficiency programs in developing countries: Evidence from iron and steel firms in China. China Econ. Rev. 2020, 59, 101364. [Google Scholar] [CrossRef]
- Energy Efficiency in Iron and Steel Making. Available online: https://www.energyefficiencymovement.com/wp-content/uploads/2022/04/ABB_EE_WhitePaper_Metals_250422.pdf (accessed on 5 September 2022).
- Toulouevski, Y.N.; Zinurov, I.Y. EAF in Global Steel Production; Energy and Productivity Problems; Springer: Singapore, 2017; Available online: https://link.springer.com/chapter/10.1007/978-981-10-5885-1_1 (accessed on 15 September 2022).
- Tang, L.; Meng, Y.; Chen, Z.-L.; Liu, J. Coil batching to improve productivity and energy utilization in steel production. Manuf. Serv. Oper. Manag. 2016, 18, 262–279. [Google Scholar] [CrossRef]
- Morfeldt, J. Tools for Evaluating Energy Efficiency of Steel Production. Lessons from Sweden and Europe. Master’s Thesis, KTH Royal Institute of Technology, Stockholm, Sweden, 2014. Available online: http://www.diva-portal.org/smash/get/diva2:739556/FULLTEXT02.pdf (accessed on 5 September 2022).
- Salta, M.; Polatidis, H.; Haralambopoulos, D. Energy usage in the Greek manufacturing sector: A methodological framework based on phisical indicators with aggregation and decomposition analysis. Energy 2009, 34, 90–111. [Google Scholar] [CrossRef]
- Xu, T.; Flapper, J. Reduce energy use and greenhouse gas emissions from global diary process facilities. Energy Policy 2011, 39, 234–247. [Google Scholar] [CrossRef]
- Enerdata. Definition of Energy Efficiency Indicators in ODYSSEE Data Base; Enerdata: Grenoble, France, 2014. [Google Scholar]
- Sheinbaum, C.; Ozawa, L.; Castillo, D. Using logarithmic mean Divisia index to analyze changes in energy use and carbon dioxide emissions in Mexico’s iron and steel industry. Energy Econ. 2010, 32, 1337–1344. [Google Scholar] [CrossRef]
- Farla, J.C.; Block, K. The quality of energy intensity indicators for international comparison in the iron and steel industry. Energy Policy 2001, 29, 523–543. [Google Scholar] [CrossRef]
- Nikolaevich, M.A.; Dev, S.K. The Effect of Arc Length on Heat Exchange and Electric Power Consumption in Electric Arc Steel-Making Furnaces (EAF). J. Phys. Conf. Ser. 2021, 1888, 012026. [Google Scholar] [CrossRef]
- Kartavtsev, S.V.; Klyuchnikov, A.D. Possible limits of minimization of resource consumption at heat-engineering complex of iron and steel industry. Izv. Ferr. Metall. 2020, 7, 43–47. [Google Scholar]
- Dhande, M. Genralized Data Base Model for Heat Loss in Steel Plant. Available online: https://www.researchgate.net/publication/335692116_Genralized_Data_Base_Model_for_Heat_Loss_in_Steel_Plant?channel=doi&linkId=5d7625f0299bf1cb80935730&showFulltext=true (accessed on 5 September 2022).
- Shpak, N.; Melnyk, O.; Horbal, N.; Ruda, M.; Sroka, W. Assessing the implementation of the circular economy in the EU countries. Forum Sci. Oeconomia 2021, 9, 25–39. [Google Scholar] [CrossRef]
- Duda, A.; Valverde, G.F. The Economics of Coking Coal Mining: A Fossil Fuel Still Needed for Steel Production. Energies 2021, 14, 7682. [Google Scholar] [CrossRef]
- Vaněk, M.; Bora, P.; Maruszewska, E.W.; Kašparková, A. Benchmarking of mining companies extracting hard coal in the Upper Silesian Coal Basin. Resour. Policy 2017, 53, 378–383. [Google Scholar] [CrossRef]
- Bertrand, G.; Cassard, D.; Arvanitidis, N.; Stanley, G. Map of critical raw material deposits in Europe. Energy Procedia 2016, 97, 44–50. [Google Scholar] [CrossRef]
- Impact of energy market developments on the steel industry. In Proceedings of the 74th Session of The OECD Steel Committee, Paris, France, 1–25 July 2013; Available online: https://www.oecd.org/sti/ind/Item%209.%20Laplace%20-%20Steel%20Energy.pdf, (accessed on 5 September 2022).
- The Study on Conservation and Efficiency Improvement in the Republic of Indonesia. Available online: https://openjicareport.jica.go.jp/pdf/11949294_03.pdf, (accessed on 5 September 2022).
- Gajdzik, B. Przedsiębiorstwo Hutnicze po Restrukturyzacji. Monography Dissertation, Silesian University of Technology, Gliwice, Poland, 2009. [Google Scholar]
- Gajdzik, B. Comprehensive classification of environmental aspects in a manufacturing enterprise. Metalurgija 2012, 51, 541–544. [Google Scholar]
- Górski, M.; Pchałek, M.; Radecki, W.; Jerzmański, J.; Bar, M.; Urban, S.; Jendrośka, J. Prawo Ochrony Środowiska; Publisher C. H. Beck: Warsaw, Poland, 2001. [Google Scholar]
- 96/61/UE; IPPC: Integrated Pollution Prevention and Control Directive. Department of Agriculture, Environment and Rural Affairs: London, UK, 1996.
- IED: Industrial Emissions Directive. 2010, European Commission Brussels. Available online: https://eur-lex.europa.eu/legal-content/EN/TXT/?uri=CELEX%3A32010L0075 (accessed on 10 September 2022).
- 2003/87/UE; ETS: Emissions Trading System Directive. 2003. (Podstawy Europejskiego Systemu Handlu Emisjami CO2 Zostały Ustanowione Dyrektywą Parlamentu Europejskiego 2003/87/WE z 13 Października 2003 r.). European Commission: Brussels, Belgium, 2003. Available online: https://eur-lex.europa.eu/legal-content/EN/TXT/?uri=celex%3A32003L0087 (accessed on 10 September 2022).
- European Commission. Energy Roadmap 2050; Publications Office of the European Union: Luxembourg, 2012; ISBN 978-92-79-21798-2. [Google Scholar] [CrossRef]
- Statistics Poland (GUS): Warsaw, Poland. Environment. 2021; Available online: www.stat.gov.pl, https://stat.gov.pl/obszary-tematyczne/srodowisko-energia/srodowisko/ochrona-srodowiska-2021,1,22.html; (accessed on 10 September 2022).
- Dz.U. 2022.1072; Ustawa o Podziemnym Składowaniu Tego Gazu (Chapter 4a). Available online: https://isap.sejm.gov.pl/isap.nsf/download.xsp/WDU20220001072/T/D20221072L.pdf (accessed on 10 September 2022).
- Fanchi, J.R.; Fanchi, C.J. Energy in the 21st Century; World Scientific Publishing Company: Singapore, 2016. [Google Scholar] [CrossRef]
- Strategiczny Program Badań Przygotowany o Wizje Rozwoju Polskiego Hutnictwa do 2030; Polish Steel Technology Platform. 2006, pp. 1–77. Available online: https://docplayer.pl/23772985-Polska-platforma-technologiczna-stali-ppts.html (accessed on 7 September 2022).
- Efektywność Wykorzystania Energii w Latach 2010–2020; Statistics Poland (GUS): Warsaw, Poland. Available online: https://stat.gov.pl/obszary-tematyczne/srodowisko-energia/energia/efektywnosc-wykorzystania-energii-w-latach-2010-2020,9,5.html (accessed on 7 September 2022).
- Gospodarka Paliwowo-Energetyczna w Latach 2011–2020; Energy Statistics. Statistical Analyses; Statistics Poland (GUS): Warsaw, Poland. Available online: https://stat.gov.pl/obszary-tematyczne/srodowisko-energia/energia/gospodarka-paliwowo-energetyczna-w-latach-2019-i-2020,4,16.html (and other years) (accessed on 7 September 2022).
- Polish Steel Association. Presentation PDF. In Proceedings of the Conference PTE/O Katowice, Katowice, Poland, 28–30 October 2021. [Google Scholar]
- Polish Steel Industry; Report 2021; Polish Steel Association: Katowice, Poland, 2021; p. 20.
- Steel Production in Figures; Yearly Report; World Steel Association: Brussels, Belgium. Available online: https://worldsteel.org/steel-topics/statistics/world-steel-in-figures/ (accessed on 10 September 2022).
- Gajdzik, B.; Gawlik, R.; Skoczypiec, S. Forecasting-Scenario-Heuristic method proposal for assessment of feasibility of steel production scenarios in Poland—Managerial implications for production engineering. Arch. Civ. Mech. Eng. 2018, 18, 1651–1660. [Google Scholar] [CrossRef]
- Gajdzik, B.; Gawlik, R. Choosing the Production Function Model for an Optimal Measurement of the Restructuring Efficiency of the Polish Metallurgical Sector in Years 2000–2015. Metals 2018, 8, 1651–1660. [Google Scholar] [CrossRef]
- Gajdzik, B.; Sitko, J. An analysis of the causes of complaints about steel sheets in metallurgical product quality management systems. Metalurgija 2014, 53, 135–138. [Google Scholar]
- Gajdzik, B.; Wolniak, R. Influence of the COVID-19 crisis on steel production in Poland compared to the financial crisis of 2009 and to boom periods in the market. Resources 2021, 10, 4. [Google Scholar] [CrossRef]
- Ustawa z Dnia 19 Lipca 2019 r. o Systemie Rekompensat dla Sektorów i Podsektorów Energochłonnych. Available online: https://isap.sejm.gov.pl/isap.nsf/DocDetails.xsp?id=WDU20190001532 (accessed on 10 September 2022).
- Europe 2020, A Strategy for Smart, Sustainable and Inclusive Growth; European Commission: Brussels, Belgium, 2010.
- Polityka Energetyczna Polski Do 2040 r; (PEP2040); Rada Ministrów: Warsaw, Poland, 2021.
- World Energy Scenarios, Composing Energy Futures to 2050; World Energy Council: London, UK, 2013.
- Yohe, G.W.; Lasco, R.; Ahmad, Q.K.; Arnell, N.; Cohen, S.; Janetos, T.; Perez, R.; Hope, C.; Ebi, K.; Romero Lankao, P.; et al. Perspectives on climate change and sustainability. Change 2006, 25, 49. [Google Scholar]
- McCarthy, J.J.; Canziani, O.F.; Leary, N.A.; Dokken, D.J.; White, K.S. Climate Change 2007: Impacts, Adaptation and Vulnerability. Contribution of Working Group II to the fourth Assessment Report of the Intergovernmental Panel on Climate Change; Cambridge University Press: Cambridge, UK, 2001; pp. 811–841. [Google Scholar]
- Chefuruka, P. Report: World Energy to 2050, Forty Years of Decline. 2007. Available online: https://www.irena.org/-/media/Files/IRENA/Agency/Publication/2018/Apr/IRENA_Report_GET_2018.pdf (accessed on 10 September 2022).
- Strategia na Rzecz Odpowiedzialnego Rozwoju (z Perspektywą do 2030 r.); Warsaw, Poland. Available online: http://nettg.pl/uploads/docs/2016-08/1470123409-strategia-mr.pdf (accessed on 12 September 2022).
- IPCC. Climate Chage 2013: The Physical Science Basis, Report of the Intergovernmental Panel on Climate Change; Cambridge University Press: Cambridge, UK, 2013. [Google Scholar] [CrossRef]
- Banuri, T.; Opschoor, H. Climate Change and Sustainable Development; DESA working Paper No 56/2007, St/ESA/2007/DWP/56; 2007. Available online: https://www.un.org/esa/desa/papers/2007/wp56_2007.pdf (accessed on 12 September 2022).
- Beg, N.; Morlot, J.C.; Davidson, O.; Afrane-Okesse, Y.; Tyani, L.; Denton, F.; Sokona, Y.; Thomas, J.P.; La Rovere, E.L.; Parikh, J.K.; et al. Linkages between climate change and sustainable development. Clim. Policy 2002, 2, 129–144. [Google Scholar] [CrossRef]
- Opracowanie, S.; Dzienniak, H.I.P.H. Sytuacja Sektora Stalowego w Polsce; Polish Steel Assotiation: Katowice, Poland, 2021. [Google Scholar]
- Zagórska, M.; Dzienniak, S. Droga Energia Przyczyną Niskiej Konkurencyjności Polskiej Gospodarki na Przykładzie Przemysłu Stalowego; Akademia WSB (na Zlecenie PTE Oddział Katowice): Katowice, Poland, 2021; pp. 271–285. [Google Scholar]
- Eurostat: Production of Electricity and Derived Heat by Type of Fuel in 2018 (nrg_bal). Available online: https://appsso.eurostat.ec.europa.eu/nui/show.do?dataset=nrg_bal_peh&lang=en, (accessed on 12 September 2022).
- The European Green Deal, Official Journal COM/2019/640 Final. Available online: https://eur-lex.europa.eu/legal-content/EN/TXT/?qid=1596443911913&uri=CELEX:52019DC0640#document2 (accessed on 12 September 2022).
- Baláž, P.; Bayer, J. Energy process and their impact in the competitiveness of the EU steel industry. Prague Econ. Papers. Univ. Econ. Prague 2019, 28, 1–20. [Google Scholar]
- Sutherland, B.R. Accelerating Green Steel in the EU. Joule 2020, 4, 1860–1861. [Google Scholar] [CrossRef]
- Ponciano, J. Green Steel. Forbes 2019, 202, 46–48. [Google Scholar]
- Moshen, M.S.; Akash, B.A. Energy analysis of the steel making industry. Int. J. Energy Res. 1998, 22, 1049–1054. [Google Scholar]
- Arens, M.; Vogl, V. Can we find a market for green steel? Steel Times Int. 2019, 43, 59–63. [Google Scholar]
- Olofsson, E. Regional effects of a green steel industry–fuel substitution and feedstock competition. Scand. J. For. Res. 2019, 34, 39–52. [Google Scholar] [CrossRef]
- He, J.; Suwaed, A.S.H.; Vasdravellis, G.; Wang, S. Behaviour and design of the ‘lockbolt’ demountable shear connector for sustainable steel-concrete structures. Structures 2022, 44, 988–1010. [Google Scholar] [CrossRef]
- Hagedorn, M.; Rische, M.; Wimmer, G.; Carstens, C.; Steinparzer, T. Sustainable Steel Production by Integration of Induction Furnaces. In Proceedings of the Sustainable Steel Production by Integration of Induction Furnaces, AISTech—Iron and Steel Technology Conference Proceedings; 2022; pp. 95–103. [Google Scholar]
- Pourmehdi, M.; Paydar, M.M.; Ghadimi, P.; Azadnia, A.H. Analysis and evaluation of challenges in the integration of Industry 4.0 and sustainable steel reverse logistics network. Comput. Ind. Eng. 2022, 163, 107808. [Google Scholar] [CrossRef]
- OECD. Supporting Livelihoods during the COVID-19 Crisis: Closing the Gaps in Safety Nets. OECD Policy Responses to Coronavirus (COVID-19); OECD: Paris, France, 2020. [Google Scholar]
- Bhaskar, A.; Abhishek, R.; Assadi, M.; Somehesaraei, H.N. Decarbonizing primary steel production: Techno-economic assessment of a hydrogen based green steel production plant in Norway. J. Clean. Prod. 2022, 350, 131339. [Google Scholar] [CrossRef]
- Florens, F.; Rübbelke, D.; Vögele, S. Energy Efficiency and Industrial Output: The Case of the Iron and Steel Industry. Discussion Paper no. 13-101. Available online: https://d-nb.info/1190294761/34 (accessed on 10 October 2022).
- Vijayakumar, N.; Pai, R.; Mildt, D. Integration of Green Steel Production in Renewable Energy-Dominated Grids. In Proceedings of the AISTech—Iron and Steel Technology Conference, Nashville, TN, USA, 29 June–1 July 2021; pp. 1176–1187. [Google Scholar]
- CNA. Europe’s Recent Electricity Price Surge Inevitable If It Wants Green Energy. Available online: https://www.channelnewsasia.com/commentary/europe-eu-electricity-price-green-energy-transition (accessed on 5 September 2022).
- Kaklauskas, A.; Lepkova, N.; Raslanas, S.; Vetloviene, I.; Milevicius, V.; Sepliakov, J. COVID-19 and Green Housing: A Review of Relevant Literature. Energies 2021, 14, 2072. [Google Scholar] [CrossRef]
- Rochedo, P.R.R.; Fragkos, P.; Garaffa, R.; Couto, L.C.; Baptista, L.B.; Cunha, B.S.L.; Schaeffer, R.; Szklo, A. Is Green Recovery Enough? Analysing the Impacts of Post-COVID-19 Economic Packages. Energies 2021, 14, 5567. [Google Scholar] [CrossRef]
- Zakeri, B.; Paulavets, K.; Barreto-Gomez, L.; Echeverri, L.G.; Pachauri, S.; Boza-Kiss, B.; Zimm, C.; Rogelj, J.; Creutzig, F.; Ürge-Vorsatz, D.; et al. Pandemic, War, and Global Energy Transitions. Energies 2022, 15, 6114. [Google Scholar] [CrossRef]
- Madaleno, M.; Dogan, E.; Taskin, D. A step forward on sustainability: The nexus of environmental responsibility, green technology, clean energy and green finance. Energy Econ. 2022, 109, 105945. [Google Scholar] [CrossRef]
- Elsayed, A.H.; Naifar, N.; Nasreen, S.; Tiwari, A.K. Dependence structure and dynamic connectedness between green bonds and financial markets: Fresh insights from time-frequency analysis before and during COVID-19 pandemic. Energy Econ. 2022, 107, 105842. [Google Scholar] [CrossRef]
- Kennedy, J. Pathway to Green Steel in the U.S. In Proceedings of the by 2027, AISTech—Iron and Steel Technology Conference, Pittsburg, CA, USA, 16–18 May 2022; pp. 252–256. [Google Scholar]
- Luo, S.; Hu, W.; Liu, W.; Cao, D.; Du, Y.; Zhang, Z.; Chen, Z. Impact analysis of COVID-19 pandemic on the future green power sector: A case study in the Netherlands. Renew. Energy 2022, 191, 261–277. [Google Scholar] [CrossRef]
- Muslemani, H.; Liang, X.; Kaesehage, K.; Ascui, F.; Wilson, J. Opportunities and challenges for decarbonizing steel production by creating markets for ‘green steel’ products. J. Clean. Prod. 2021, 315, 128127. [Google Scholar] [CrossRef]
- Griffin, P.W.; Hammond, G.P. The prospects for ‘green steel’ making in a net-zero economy: A UK perspective. Glob. Transit. 2021, 3, 72–86. [Google Scholar] [CrossRef]
- Budd, L.; Ison, S. Responsible Transport: A post-COVID agenda for transport policy and practice. Transp. Res. Interdiscip. Perspect. 2020, 6, 100151. [Google Scholar] [CrossRef] [PubMed]
- Editor’s Pick: Powering Health Across Africa through COVID-19 and a Changing Climate|Sustainable Energy for All. Available online: https://www.seforall.org/news/powering-health-across-africa-through-covid-19 (accessed on 23 November 2020).
- Babich, A.; Senk, D. Chapter 12—Coal use in iron and steel metallurgy. Coal Handb. Towards Clean. Prod. 2013, 2, 267–311. [Google Scholar] [CrossRef]
- SeforAll. Energy Safety Nets: Using Social Assistance Mechanisms to Close Affordability Gaps for the Poor; SEforAll: Vienna, Austria, 2020. [Google Scholar]
- Steffen, B.; Patt, A. A historical turning point? Early evidence on how the Russia-Ukraine war changes public support for clean energy policies. Energy Res. Soc. Sci. 2022, 91, 102758. [Google Scholar] [CrossRef]
- International Energy Agency (IEA). Russia’s War on Ukraine. Available online: https://www.iea.org/topics/russia-s-war-onukraine (accessed on 5 September 2022).
- Newton, P.W.; Rogers, B.C. Transforming Built Environments: Towards Carbon Neutral and Blue-Green Cities. Sustainability 2020, 12, 4745. [Google Scholar] [CrossRef]
- Wolniak, R.; Saniuk, S.; Grabowska, S.; Gajdzik, B. Identification of Energy Efficiency Trends in the Context of the Development of Industry 4.0 Using the Polish Steel Sector as an Example. Energies 2020, 13, 2867. [Google Scholar] [CrossRef]
- ArcelorMittal to Close Two Steel Plants Amid European Energy Crisis. Wall Str. J. 2022. Available online: https://www.wsj.com/articles/arcelormittal-closes-two-steel-plants-amid-european-energy-crisis-11662136823 (accessed on 5 September 2022).
- Gencturk, A. Skyrocketing Energy Prices Force Many Dutch Factories to Shut Down: Report. 2022. Available online: https://www.aa.com.tr/en/economy/skyrocketing-energy-prices-force-many-dutch-factories-to-shut-down-report/2676130 (accessed on 5 September 2022).
- Kolisnichenko, V. Italian Long Steel Companies to Stop Production Due to the Energy Crisis. 2022. Available online: https://gmk.center/en/news/italian-long-steel-companies-to-stop-production-due-to-the-energy-crisis/ (accessed on 5 September 2022).
- Grigorenko, Y. The Rising Price of Gas Puts EU Steel Industry at Risk. 2022. Available online: https://gmk.center/en/news/the-rising-price-of-gas-puts-eu-steel-industry-at-risk/ (accessed on 5 September 2022).
- Pacana, A.; Siwiec, D.; Bednarova, L. Method of Choice: A Fluorescent Penetrant Taking into Account Sustainability Criteria. Sustainability 2020, 12, 5854. [Google Scholar] [CrossRef]
- Siwiec, D.; Pacana, A. Model of Choice Photovoltaic Panels Considering Customers’ Expectations. Energies 2021, 14, 5977. [Google Scholar] [CrossRef]
- Pacana, A.; Czerwinska, K.; Bednarova, L. Comprehensive improvement of the surface quality of the diesel engine piston. Metalurgija 2019, 58, 329–332. [Google Scholar]
- Knight, D.; Brankley, L. Specifying sustainable steel: The revised cares sustainable constructional steel certification scheme. Struct. Eng. 2021, 99, 28–29. [Google Scholar]
- Du, S. Life Cycle Assessment of a New Steel-making Process for Sustainable Steel Industrial Development in China. J. Phys. Conf. Ser. 2020, 1699, 012005. [Google Scholar] [CrossRef]
- Wu, R.; Lin, B. Does Energy Efficiency Realize Energy Conservation in the Iron and Steel Industry? A Perspective of Energy Rebound Effect. Int. J. Environ. Res. Public Health 2022, 19, 11767. [Google Scholar] [CrossRef]
- Devlin, A.; Yang, A. Regional supply chains for decarbonising steel: Energy efficiency and green premium mitigation. Energy Convers. Manag. 2022, 254, 115268. [Google Scholar] [CrossRef]
- Colla, V.; Branca, T.A. Sustainable steel industry: Energy and resource efficiency, low-emissions and carbon-lean production. Metals 2021, 11, 1469. [Google Scholar] [CrossRef]
- Galitskaya, E.; Zhdaneev, O. Development of electrolysis technologies for hydrogen production: A case study of green steel manufacturing in the Russian Federation. Environ. Technol. Innov. 2022, 27, 102517. [Google Scholar] [CrossRef]


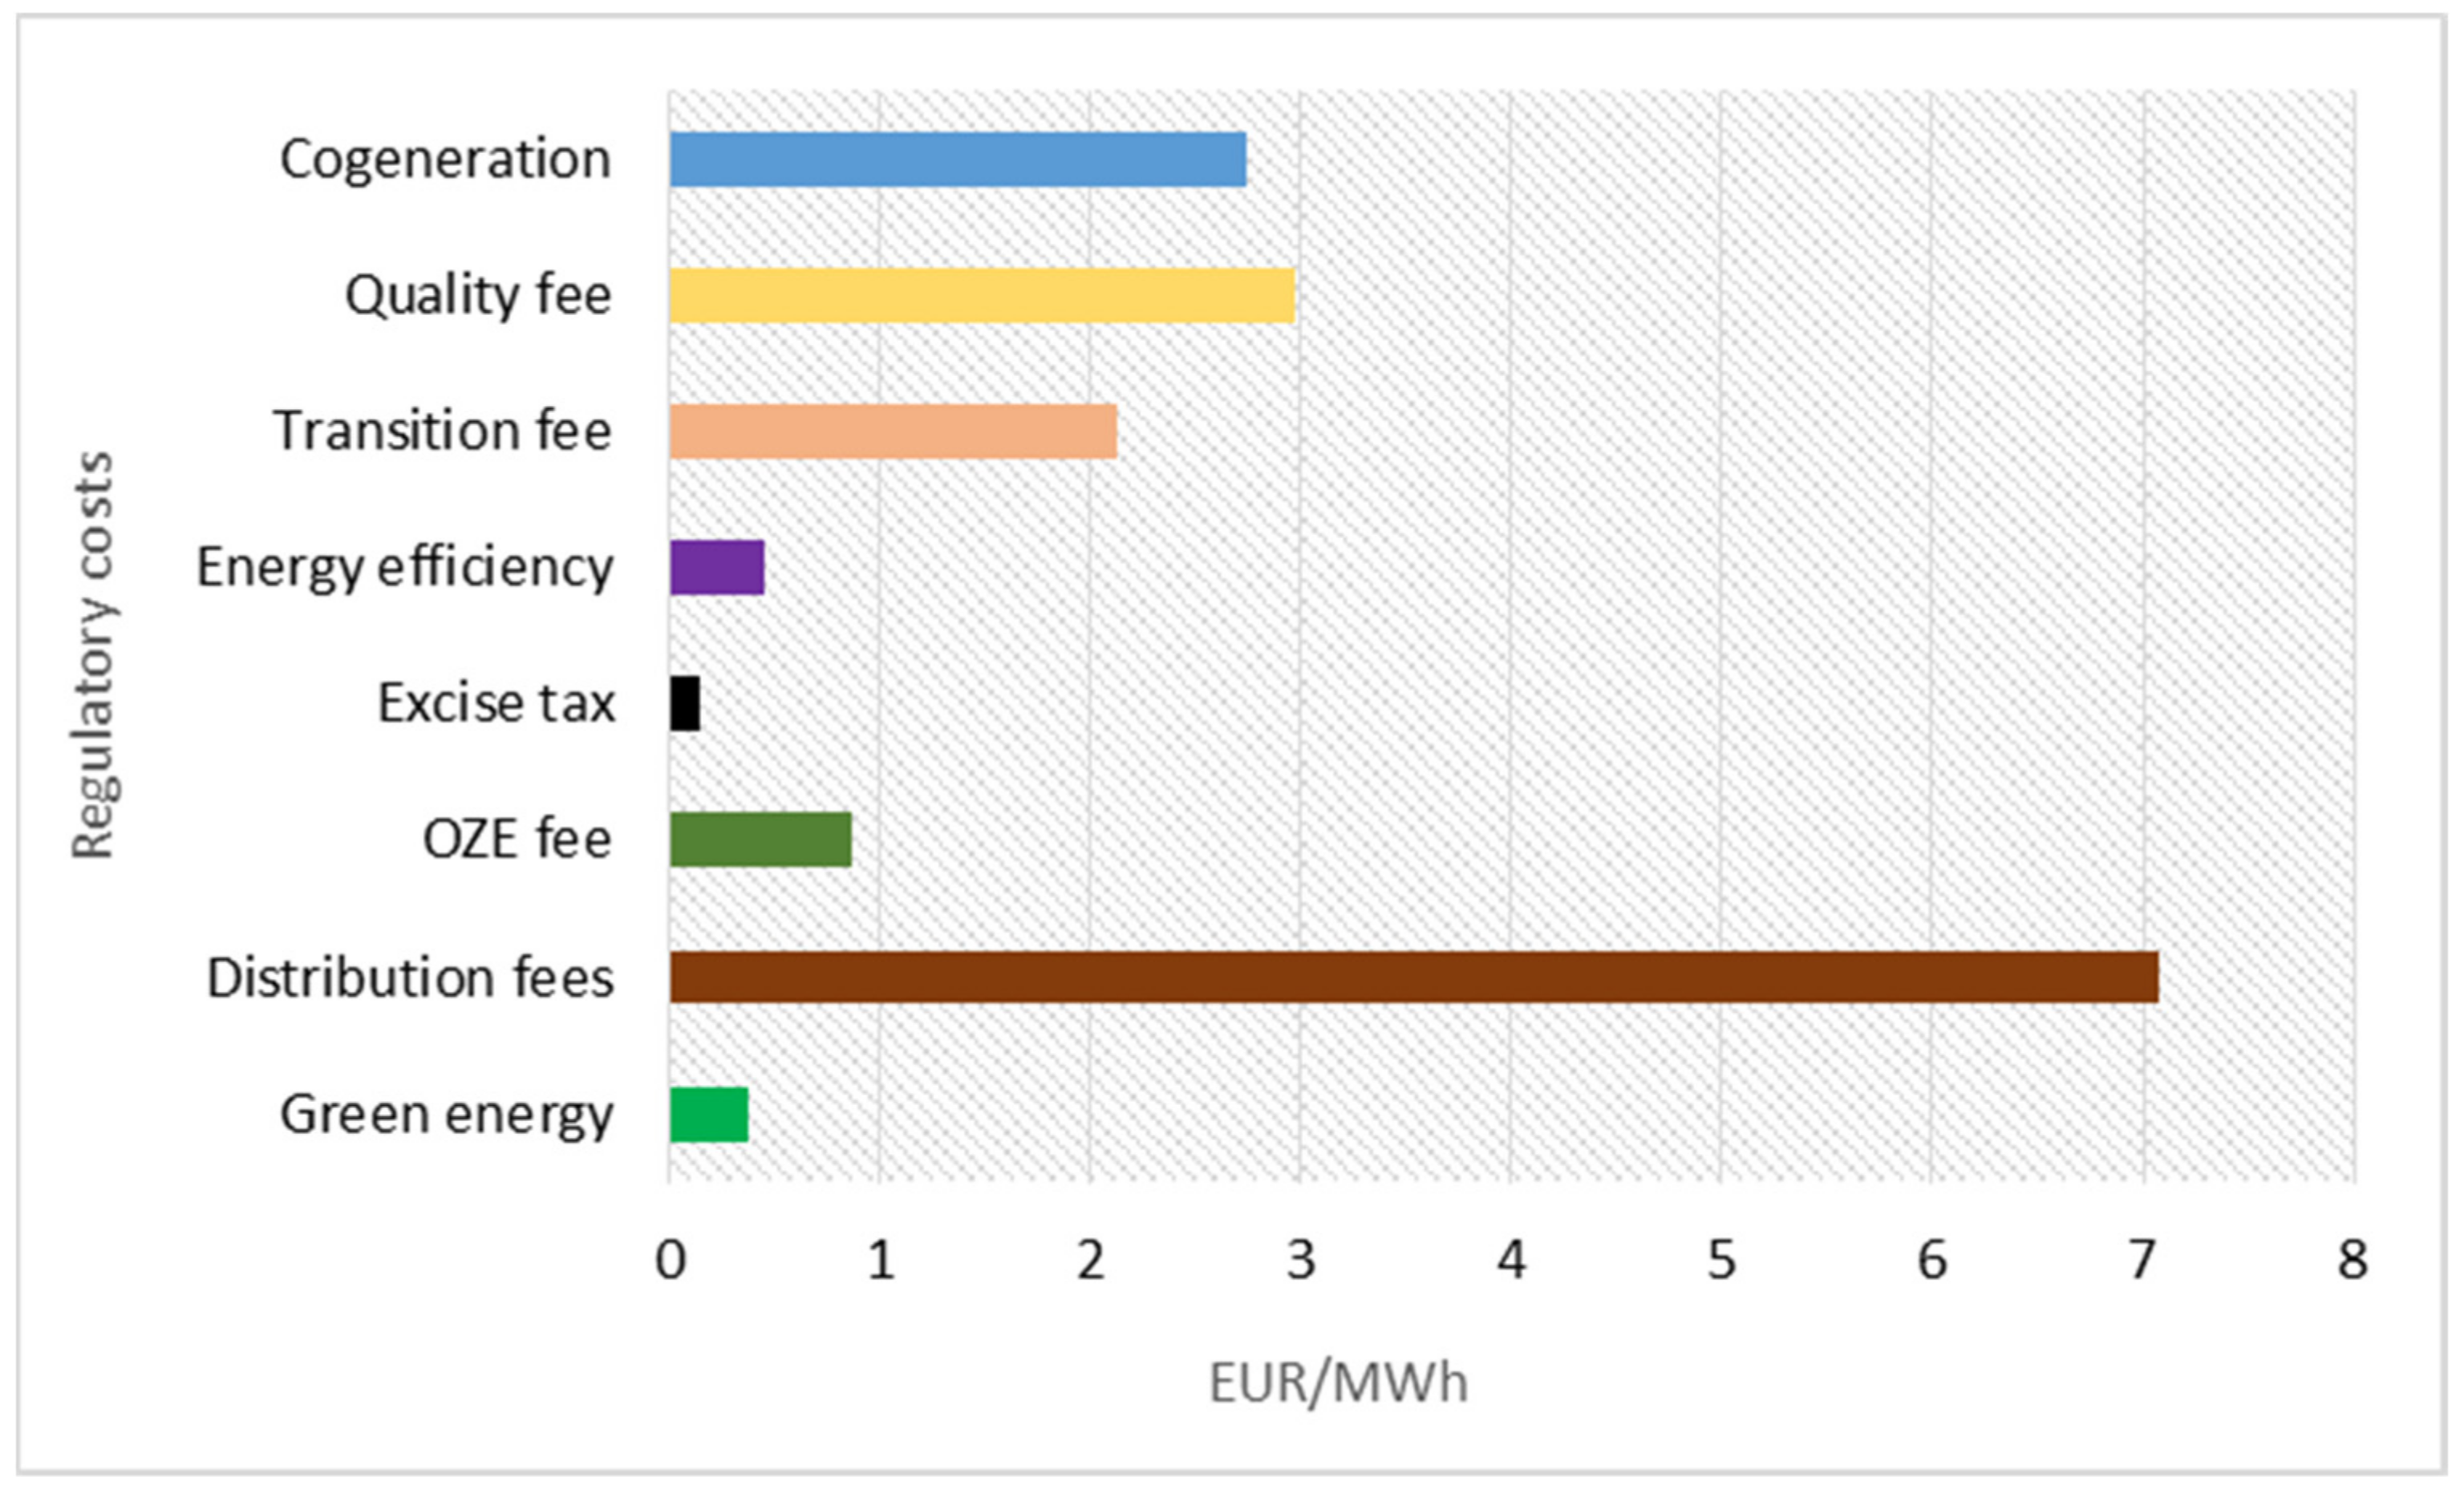
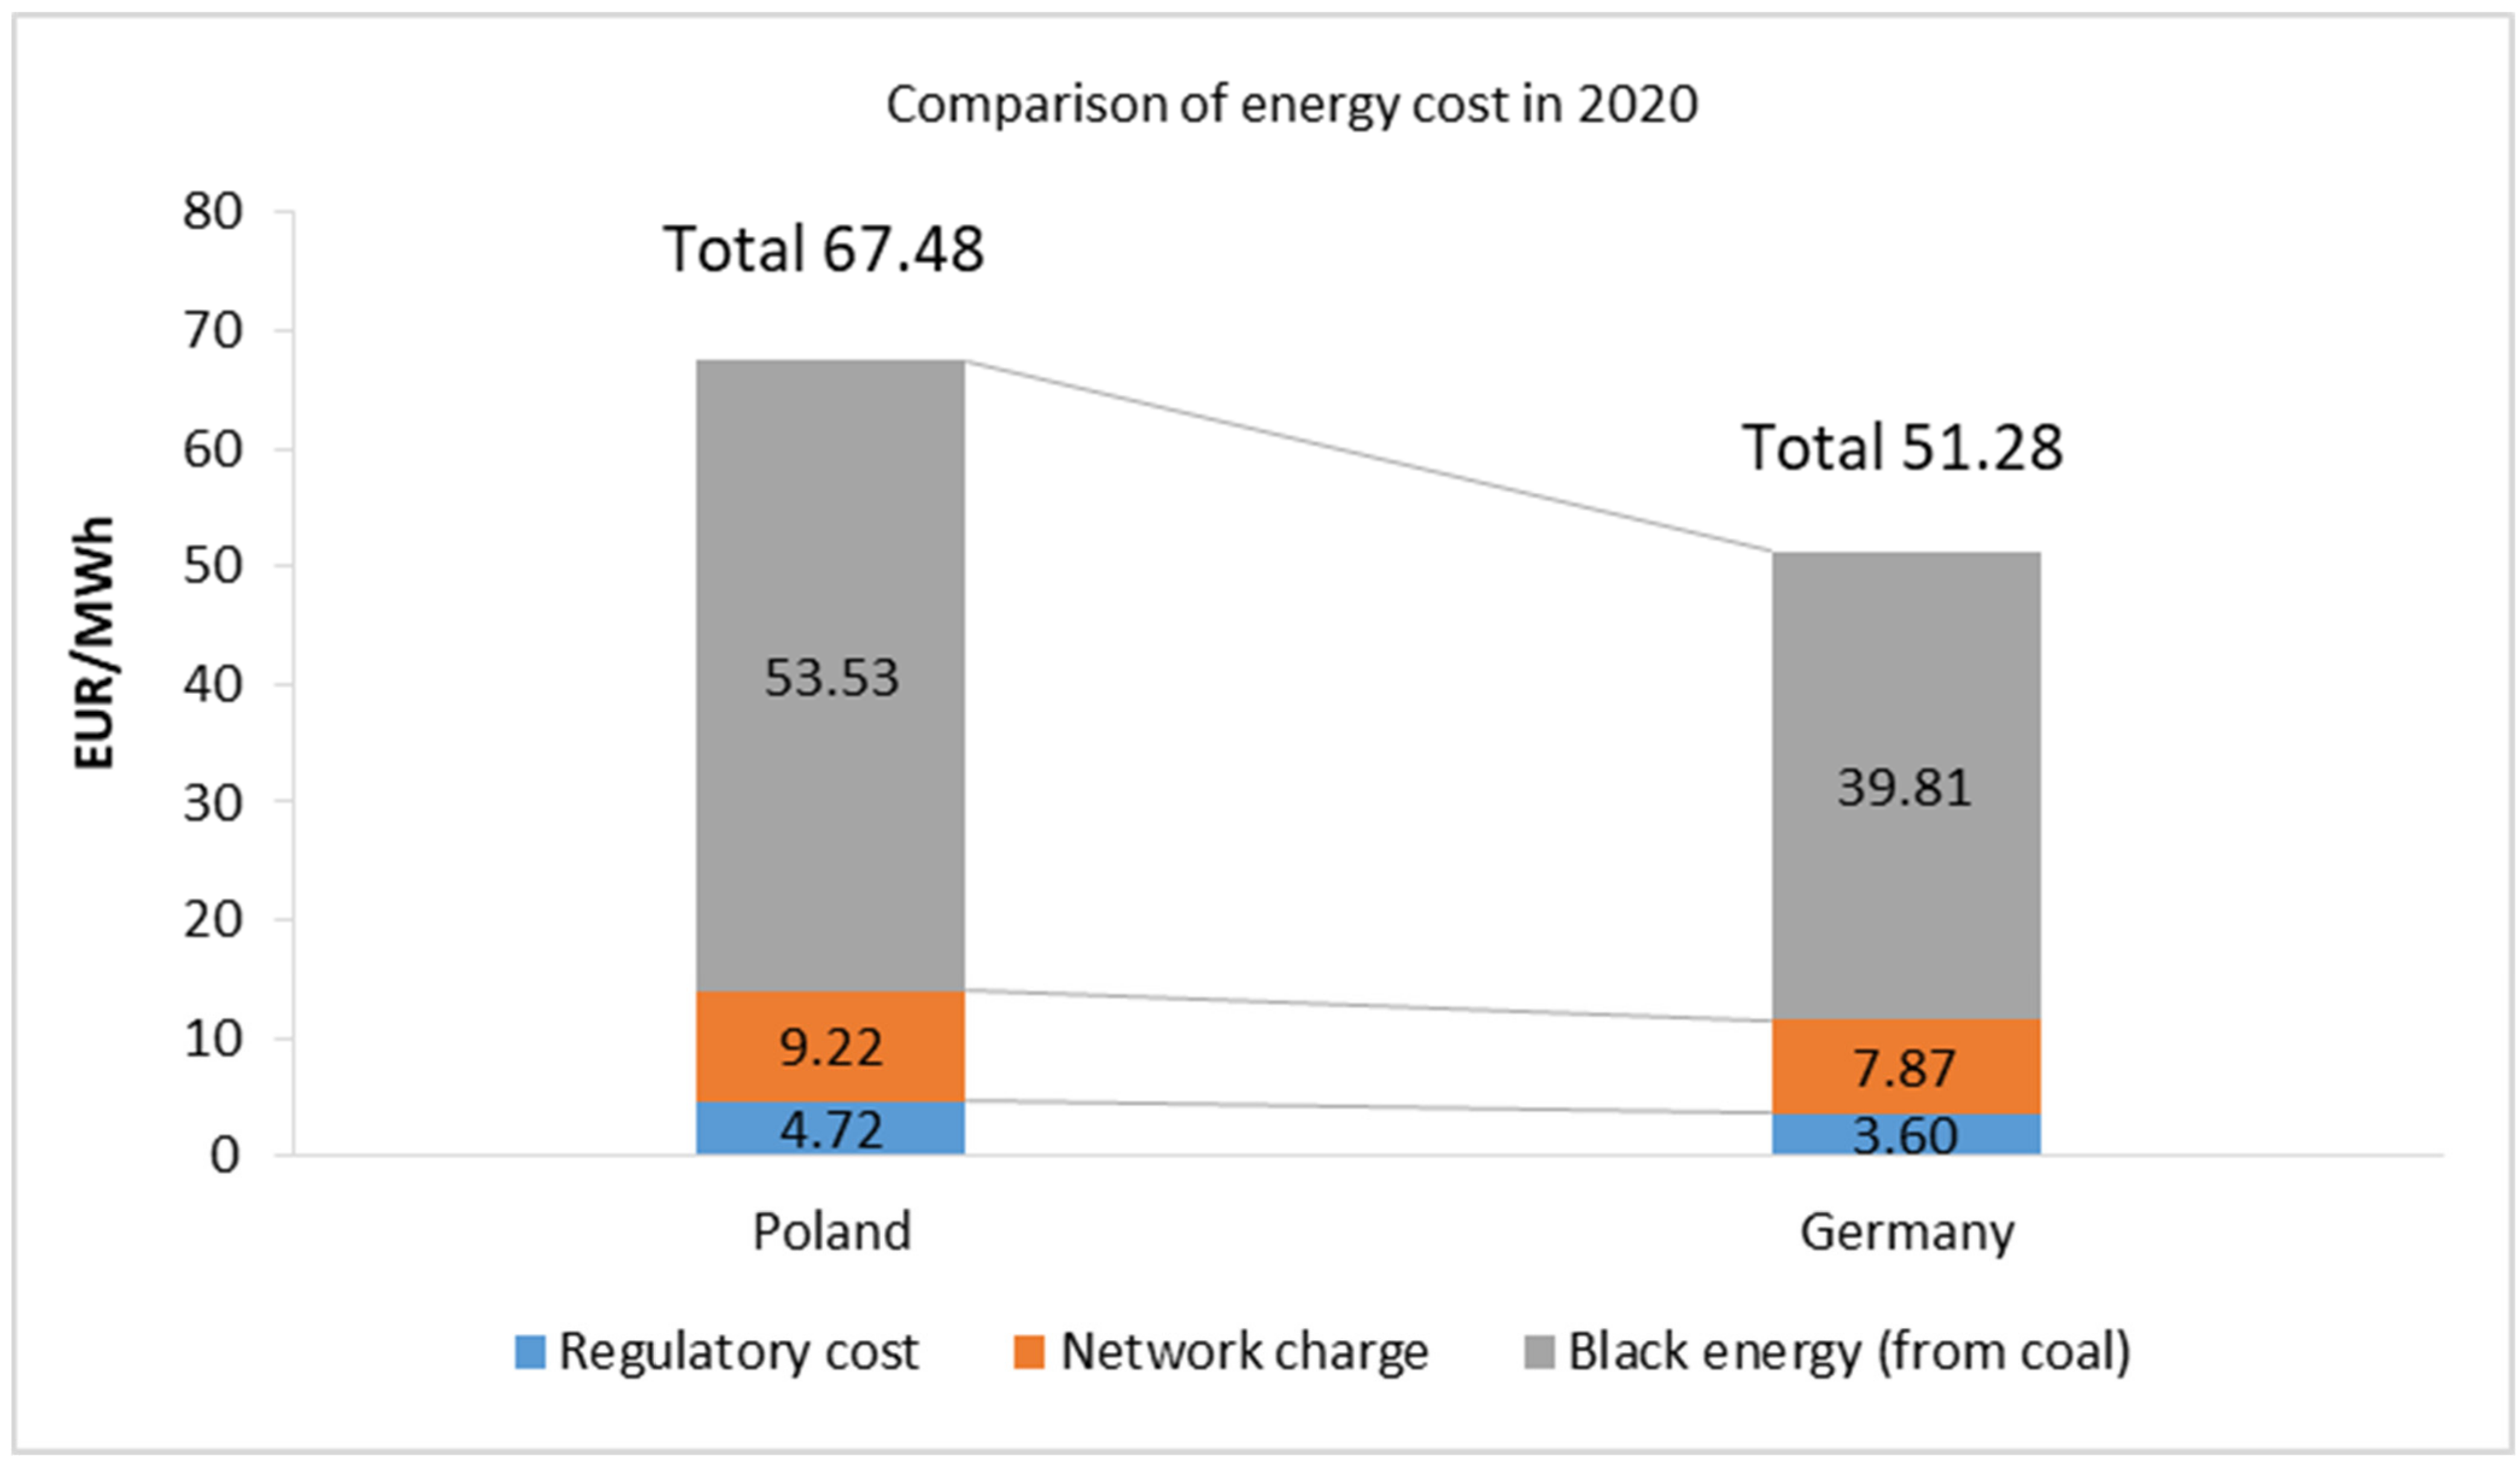
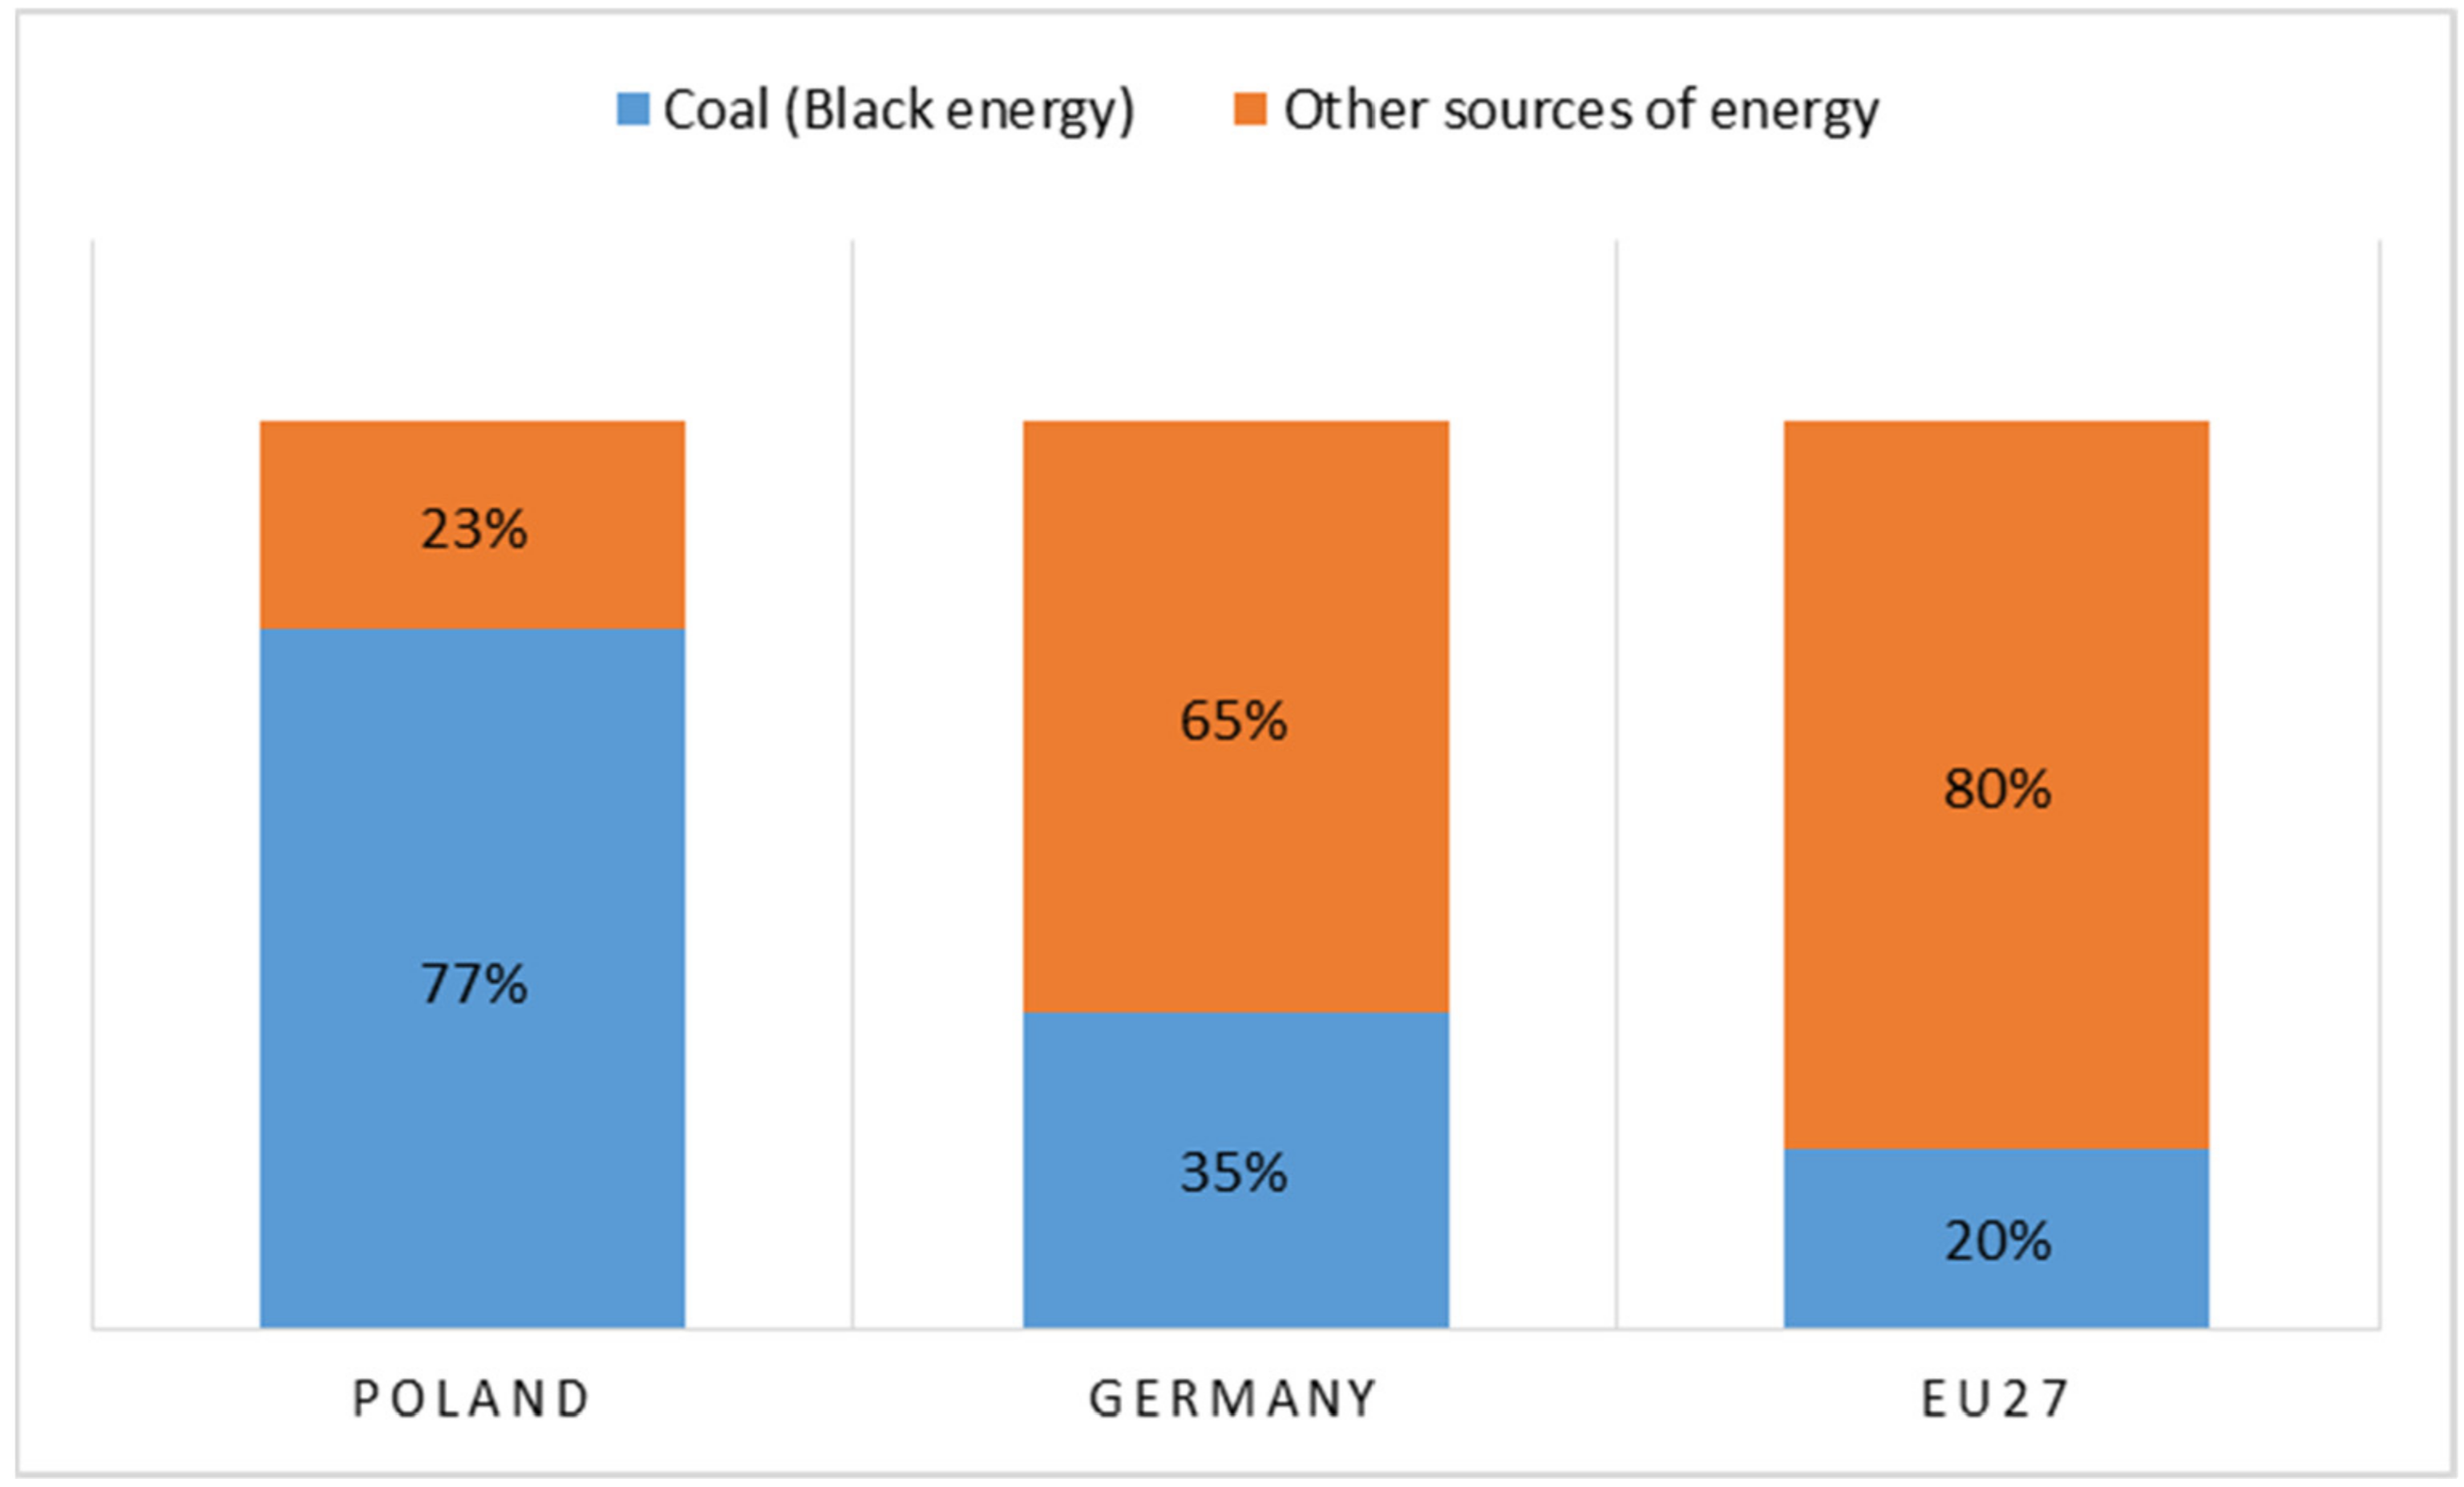
| Branch | CO2 Emissions (Tonnes) | 2021/2020 | |
|---|---|---|---|
| 2020 | 2021 | % | |
| Main activity producer power plants | 87,918,825 | 104,965,331 | 19.39 |
| Main activity producer combined heat and power plants | 21,692,971 | 23,635,764 | 8.96 |
| Main activity producer heating plants | 5,631,168 | 6,210,186 | 10.28 |
| Industrial CHP plants | 6,297,335 | 6,372,520 | 1.19 |
| Cement industry | 11,153,180 | 10,597,955 | −4.98 |
| Refinery industry | 10,739,707 | 9,968,433 | −7.18 |
| Chemical industry | 9,708,163 | 9,787,938 | 0.82 |
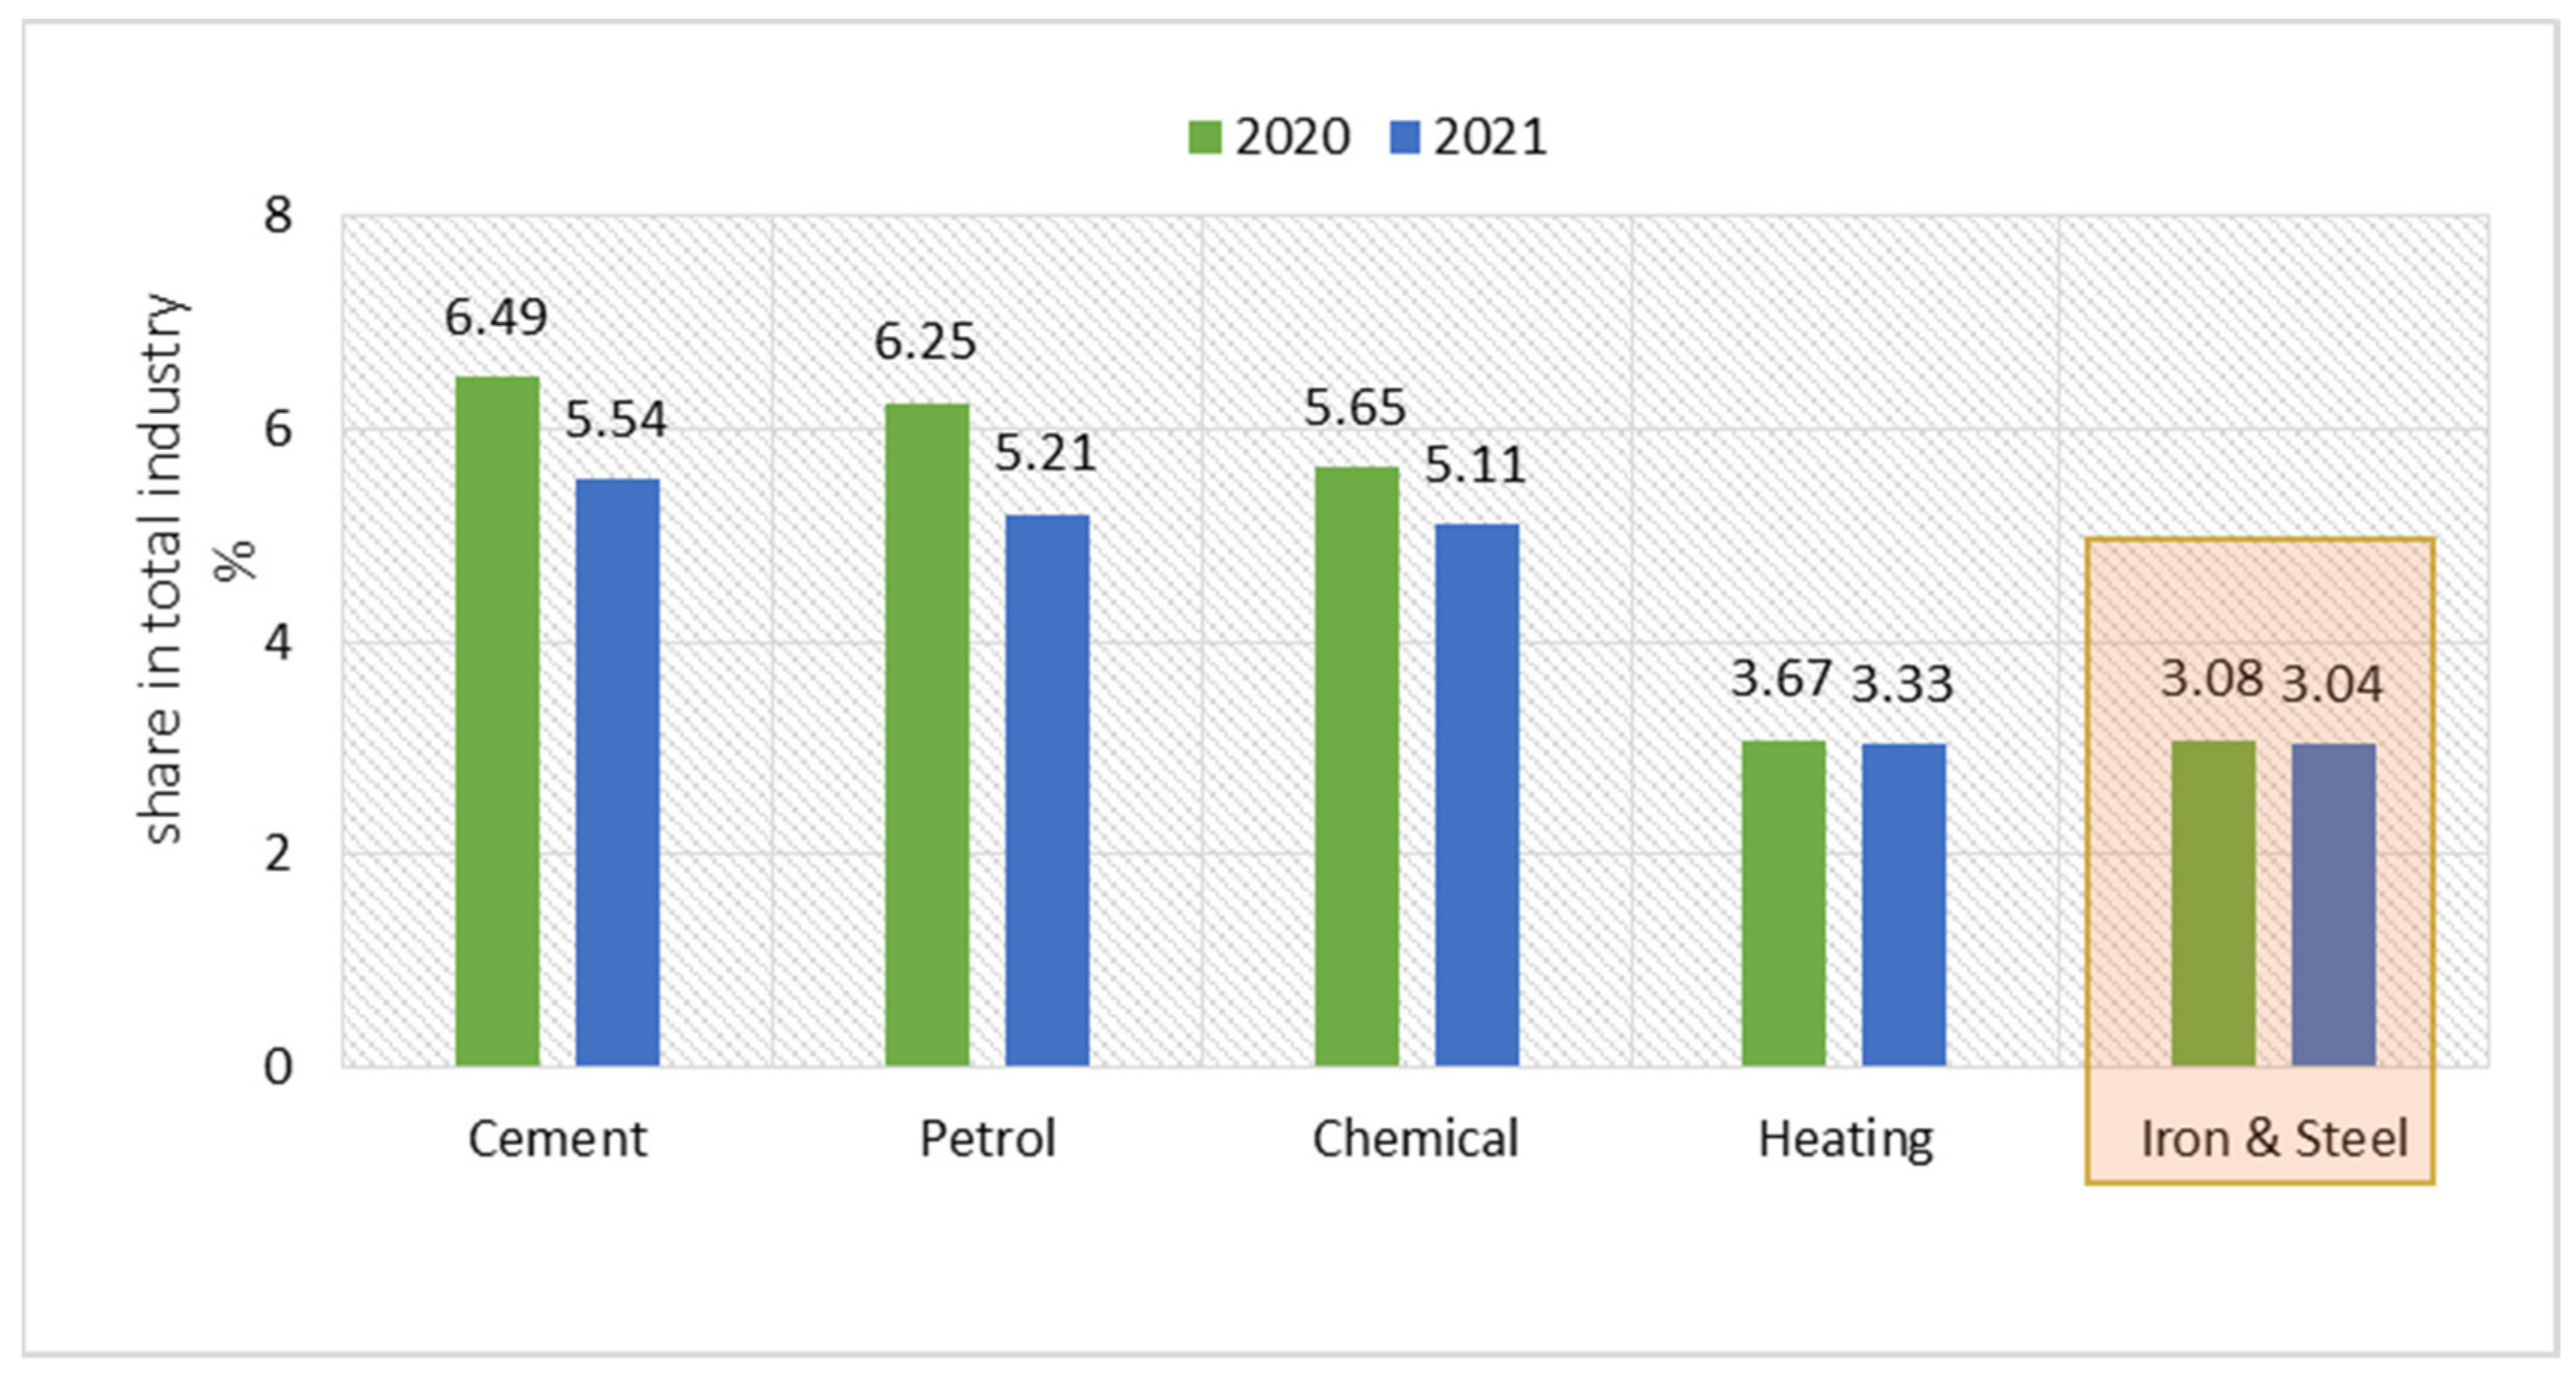
| Iron and steel industry | 5,289,065 | 5,813,034 | 9.91 |
| Non-ferrous metals smelting | 1,885,839 | 2,004,405 | 6.29 |
| Sugar industry | 1,166,264 | 1,133,573 | −2.80 |
| Wood-based industry | 277,828 | 298,034 | 7.27 |
| Coking industry | 1,741,844 | 2,025,507 | 16.29 |
| Mineral industry | 35,070 | 35,830 | 2.17 |
| Other industries | 2,161,224 | 2,106,693 | −2.52 |
| Glass industry | 2,053,338 | 2,283,326 | 11.20 |
| Lime industry | 1,600,969 | 1,797,803 | 12.29 |
| Ceramics | 1,017,156 | 1,102,688 | 8.41 |
| Paper industry | 1,359,473 | 1,328,832 | −2.25 |
| Total | 171,729,419 | 191,467,852 | 11.49 |
| Specification | Electricity | Specification | Energy Intensity in Value Added |
|---|---|---|---|
| 2020 | Average Annual Change (2020 to 2010) | ||
| Branches | Ktoe | Branches | |
| Chemical and petrochemical | 789 | Machinery | −5.7% |
| Food, beverages and tabacco | 639 | Textilie | −3.9% |
| Iron and steel | 479 | Mineral | −2.6% |
| Non-metallic minerals | 478 | Chemical | −0.7% |
| Paper, pulp and printing | 423 | Wood and wood products | −0.2% |
| Machinery | 406 | Paper, pulp, and printing | 0.3% |
| Transport equipment | 255 | Iron and steel | 0.4% |
| Mining and quarrying | 238 | Food | 0.9% |
| Wood and wood products | 210 | Transport equipment | 2.9% |
| Non-ferrous metals | 196 | ||
| Textilie and leather | 50 | ||
| Construction | 33 | ||
| Others | 473 | Others | −0.7% |
| Total | 4670 |
| No. | Y*t | Xt | R2 | Result | ||
|---|---|---|---|---|---|---|
| X1t | X2t | |||||
| 1. | Heat intenity in BF process (pig iron) per 1 tonne of product | Energy intensity in BOF process per 1 tonne of steel produced in BOF | - | - | 0.556242 | no statistical significance |
| 2. | Energy intensity in EAF process per 1 tonne of steel produced in EAF | All taxes and levies inculded | - | - | 0.578502 | no statistical significance |
| 3. | Energy intensity in steel production per 1 tonne of crude steel | Steel production (total) | Excluding taxes and levies | 0.4193 | no statistical significance | |
| 4. | All taxes and levies included | Energy intensity in steel production (total) | 0.531025 | no statistical significance | ||
| 5. | Energy intensity in steel production (total) | Steel production by process: EAF | Heat intensity in steel production (total) | 0.505108 | no statistical significance | |
| 6. | Energy intensity in steel production (total) | Steel production by process: EAF | All taxes and levies included | 0.598897 | no statistical significance | |
| 7. | Heat intensity in steel production (total) | Energy prices: all taxes and levies included | Steel production total | 0.88064 | model is statistical significance |
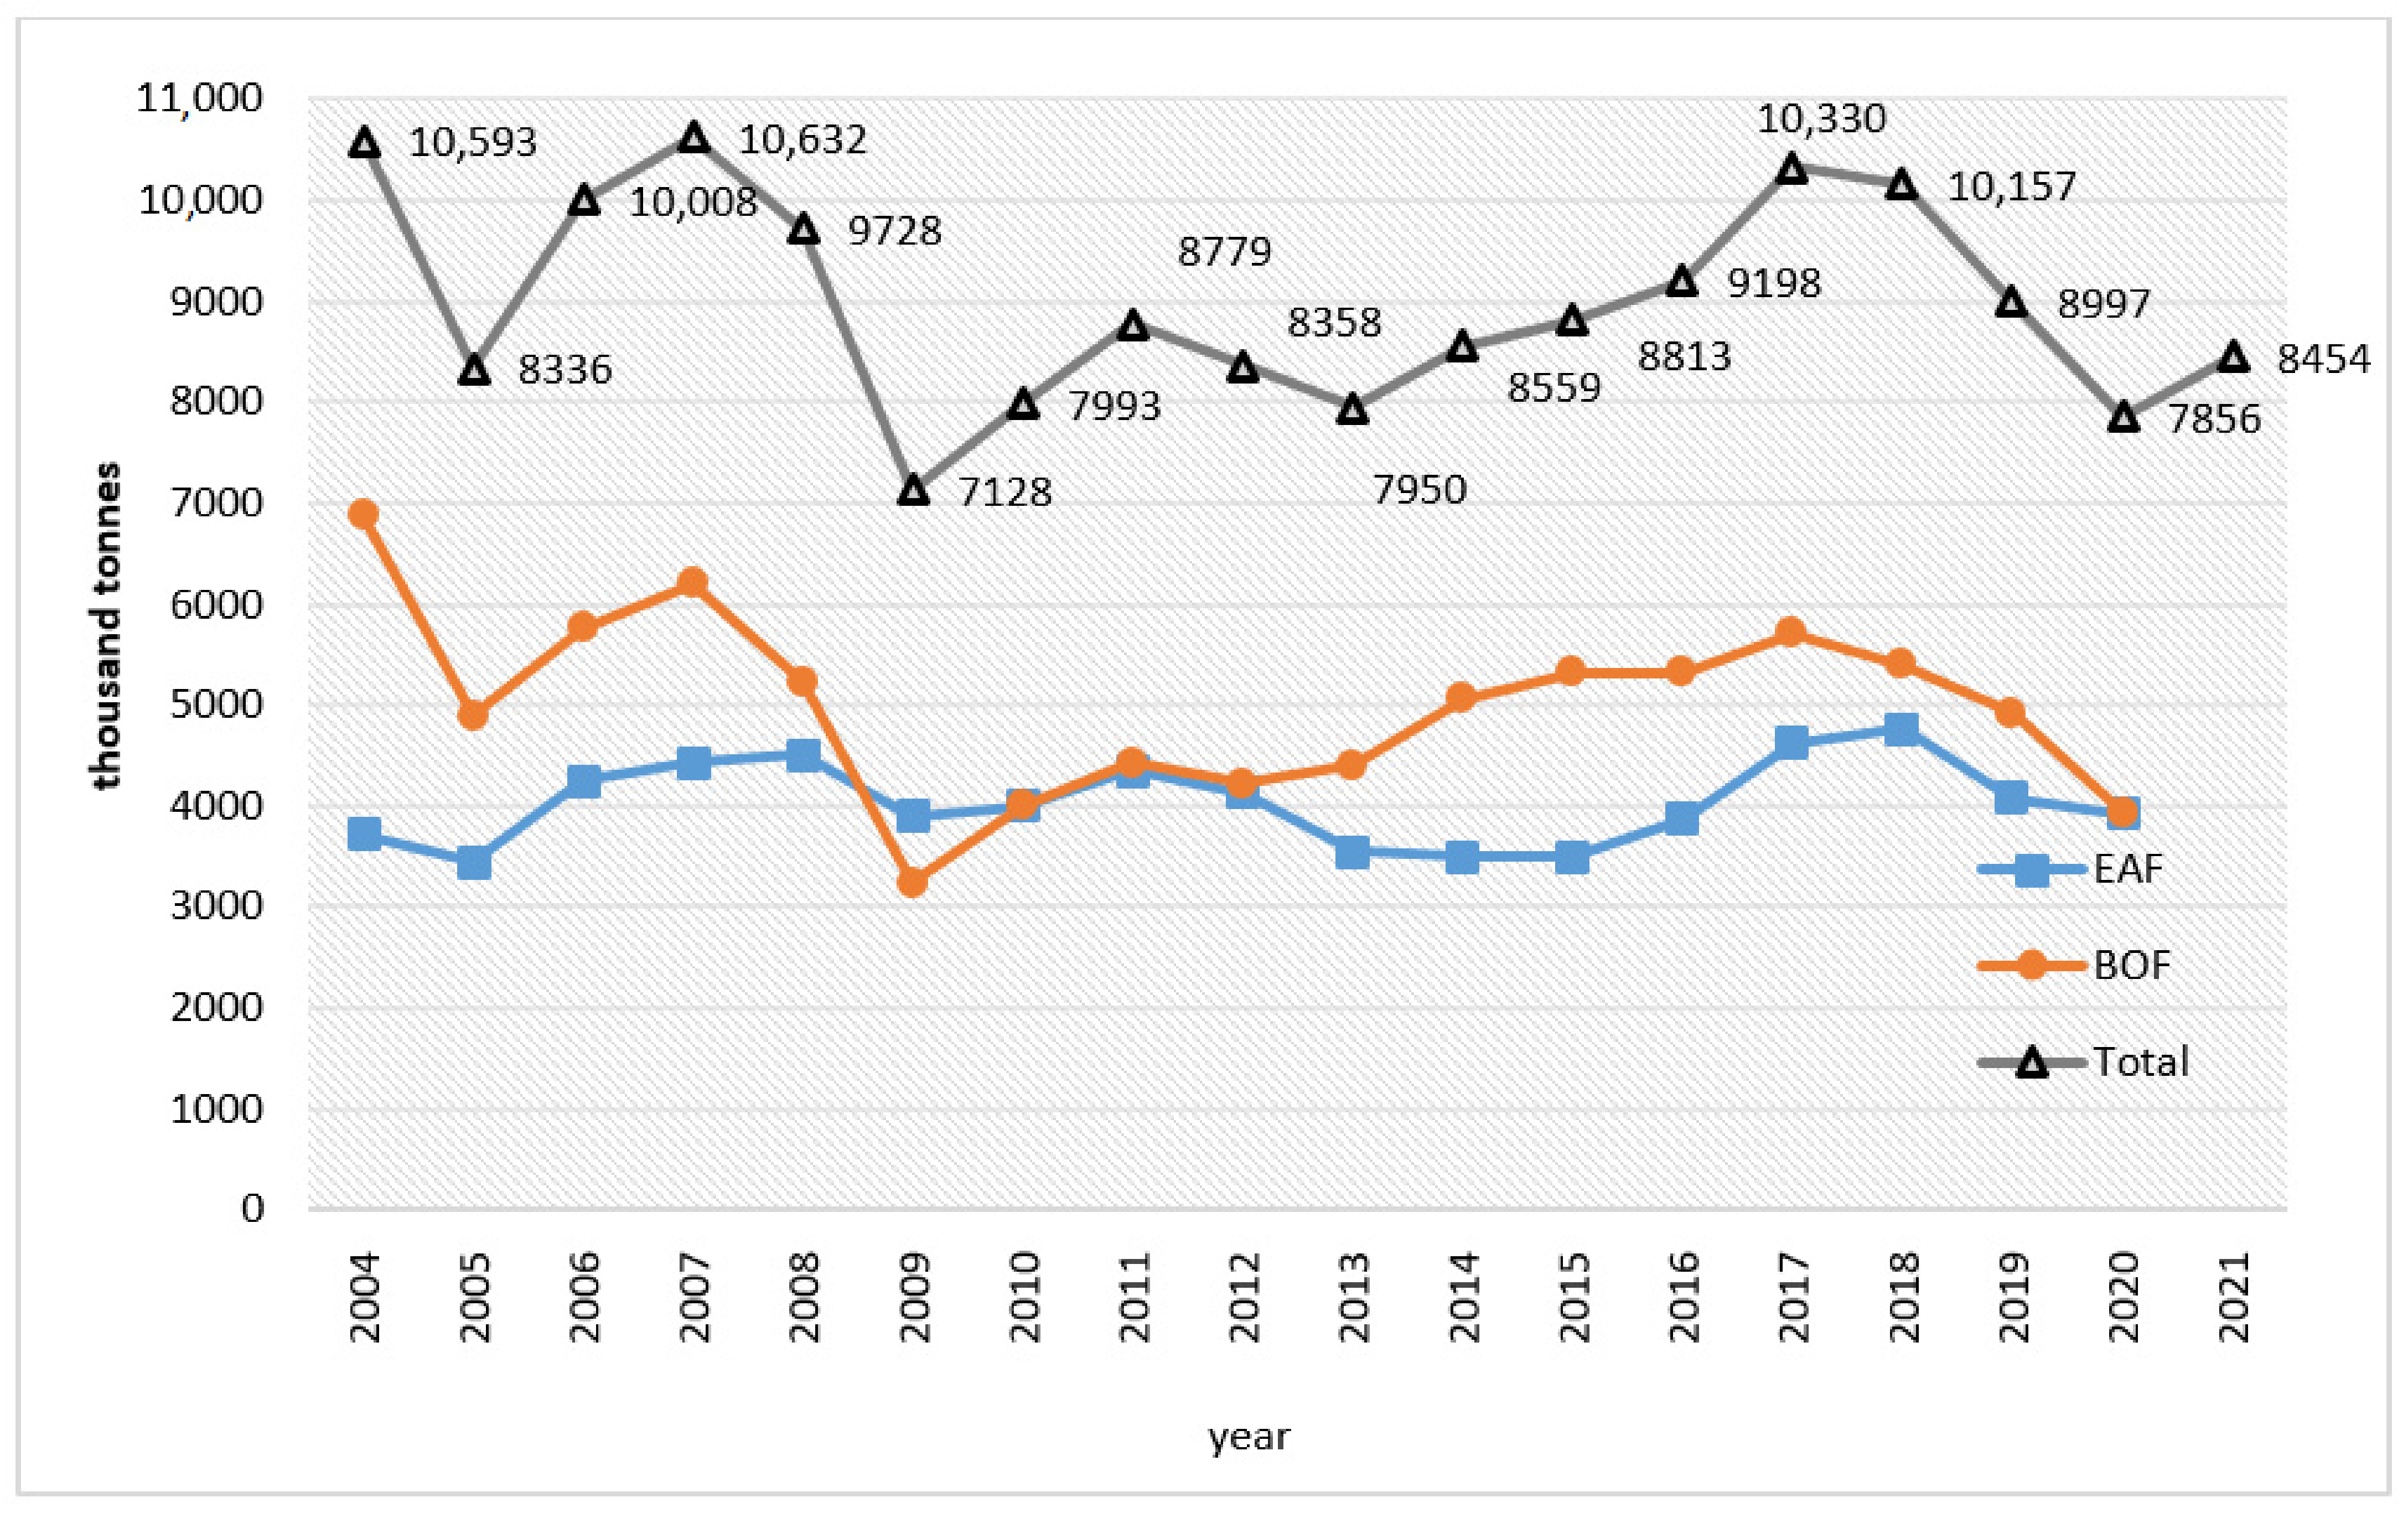
| T | Year (t) | Total Heat Intensity in Steel Production in Poland [GJ] | Price of Energy in Poland: All Taxes and Levies Included [PLN/kWh] | Total Steel Production in Poland [Thousand Tonnes] |
|---|---|---|---|---|
| 1 | 2004 | 9,176,746 | 0.2355 | 10,593 |
| 2 | 2005 | 5,582,352 | 0.2361 | 8336 |
| 3 | 2006 | 8,115,360 | 0.2427 | 10,008 |
| 4 | 2007 | 8,620,203 | 0.2482 | 10,632 |
| 5 | 2008 | 7,714,424 | 0.2984 | 9728 |
| 6 | 2009 | 4,995,698 | 0.3873 | 7128 |
| 7 | 2010 | 5,563,254 | 0.3762 | 7993 |
| 8 | 2011 | 5,619,256 | 0.3813 | 8779 |
| 9 | 2012 | 5,937,344 | 0.3855 | 8358 |
| 10 | 2013 | 6,110,152 | 0.3506 | 7950 |
| 11 | 2014 | 6,741,570 | 0.3127 | 8559 |
| 12 | 2015 | 6,966,449 | 0.3319 | 8813 |
| 13 | 2016 | 6,768,135 | 0.3195 | 9198 |
| 14 | 2017 | 7,560,971 | 0.3331 | 10,330 |
| 15 | 2018 | 7,379,043 | 0.3370 | 10,157 |
| 16 | 2019 | 6,689,118 | 0.4031 | 8997 |
| 17 | 2020 | 4,411,638 | 0.4362 | 7856 |
| SUMMARY-EXIT | ||||||||
| Regression statistics | ||||||||
| Multiple R | 0.938424 | |||||||
| R square | 0.88064 | |||||||
| Matched R square | 0.863588 | |||||||
| Standard error | 479017.9 | 0.071463 | ||||||
| Observations | 17 | |||||||
| VARIANCE ANALYSIS | ||||||||
| df | SS | MS | F | Significance F | ||||
| Regression | 2 | 2.37 × 10¹³ | 1.19 × 10¹³ | 51.64598 | 3.45 × 10⁻⁷ | |||
| Residual | 14 | 3.21 × 10¹² | 2.29 × 10¹¹ | |||||
| Total | 16 | 2.69 × 10¹³ | ||||||
| Coefficients/factors | Standard error | t Stat | Value-p | lower 95% | upper 95% | lower 95.0% | upper 95.0% | |
| Cut/cuuting/cut through | 64,352.28 | 1,933,324 | 0.033286 | 0.973917 | −4,082,214 | 4,210,919 | −4,082,214 | 4,210,919 |
| All taxes and levies included | −5,290,326 | 2,474,402 | −2.13802 | 0.050633 | −1.1 × 10⁷ | 16,739.2 | −1.1 × 10⁷ | 16,739.2 |
| Steel Production | 929.276 | 145.1161 | 6.403674 | 1.64 × 10⁻⁵ | 618.033 | 1240.519 | 618.033 | 1240.519 |
| Statistical Indicator | Indicator Value | Assessment on the Basis of an Indicator |
|---|---|---|
| 1. Determination factor | R2 = 0.88 | An 88% variability of y is explained by the model; match of the model to empirical data are very good |
| 2. Indicator: Rd2 | R2d = 0.94 | Do porównania z modelami o innej liczbie zmiennych |
| 3. Statistics F | F = 51.7 p > 0.99 | There is a linear relationship (statistics based on linearised empirical data: LN) |
| 4. Expressiveness factor | Se = 0.07 | Good match |
| 5. Significance test: t Student test | x1: t = −2.1 p > 0.95 x2: t = 6.4 p > 0.99 | Parameter x1 is relevant Parameter x2 is relevant |
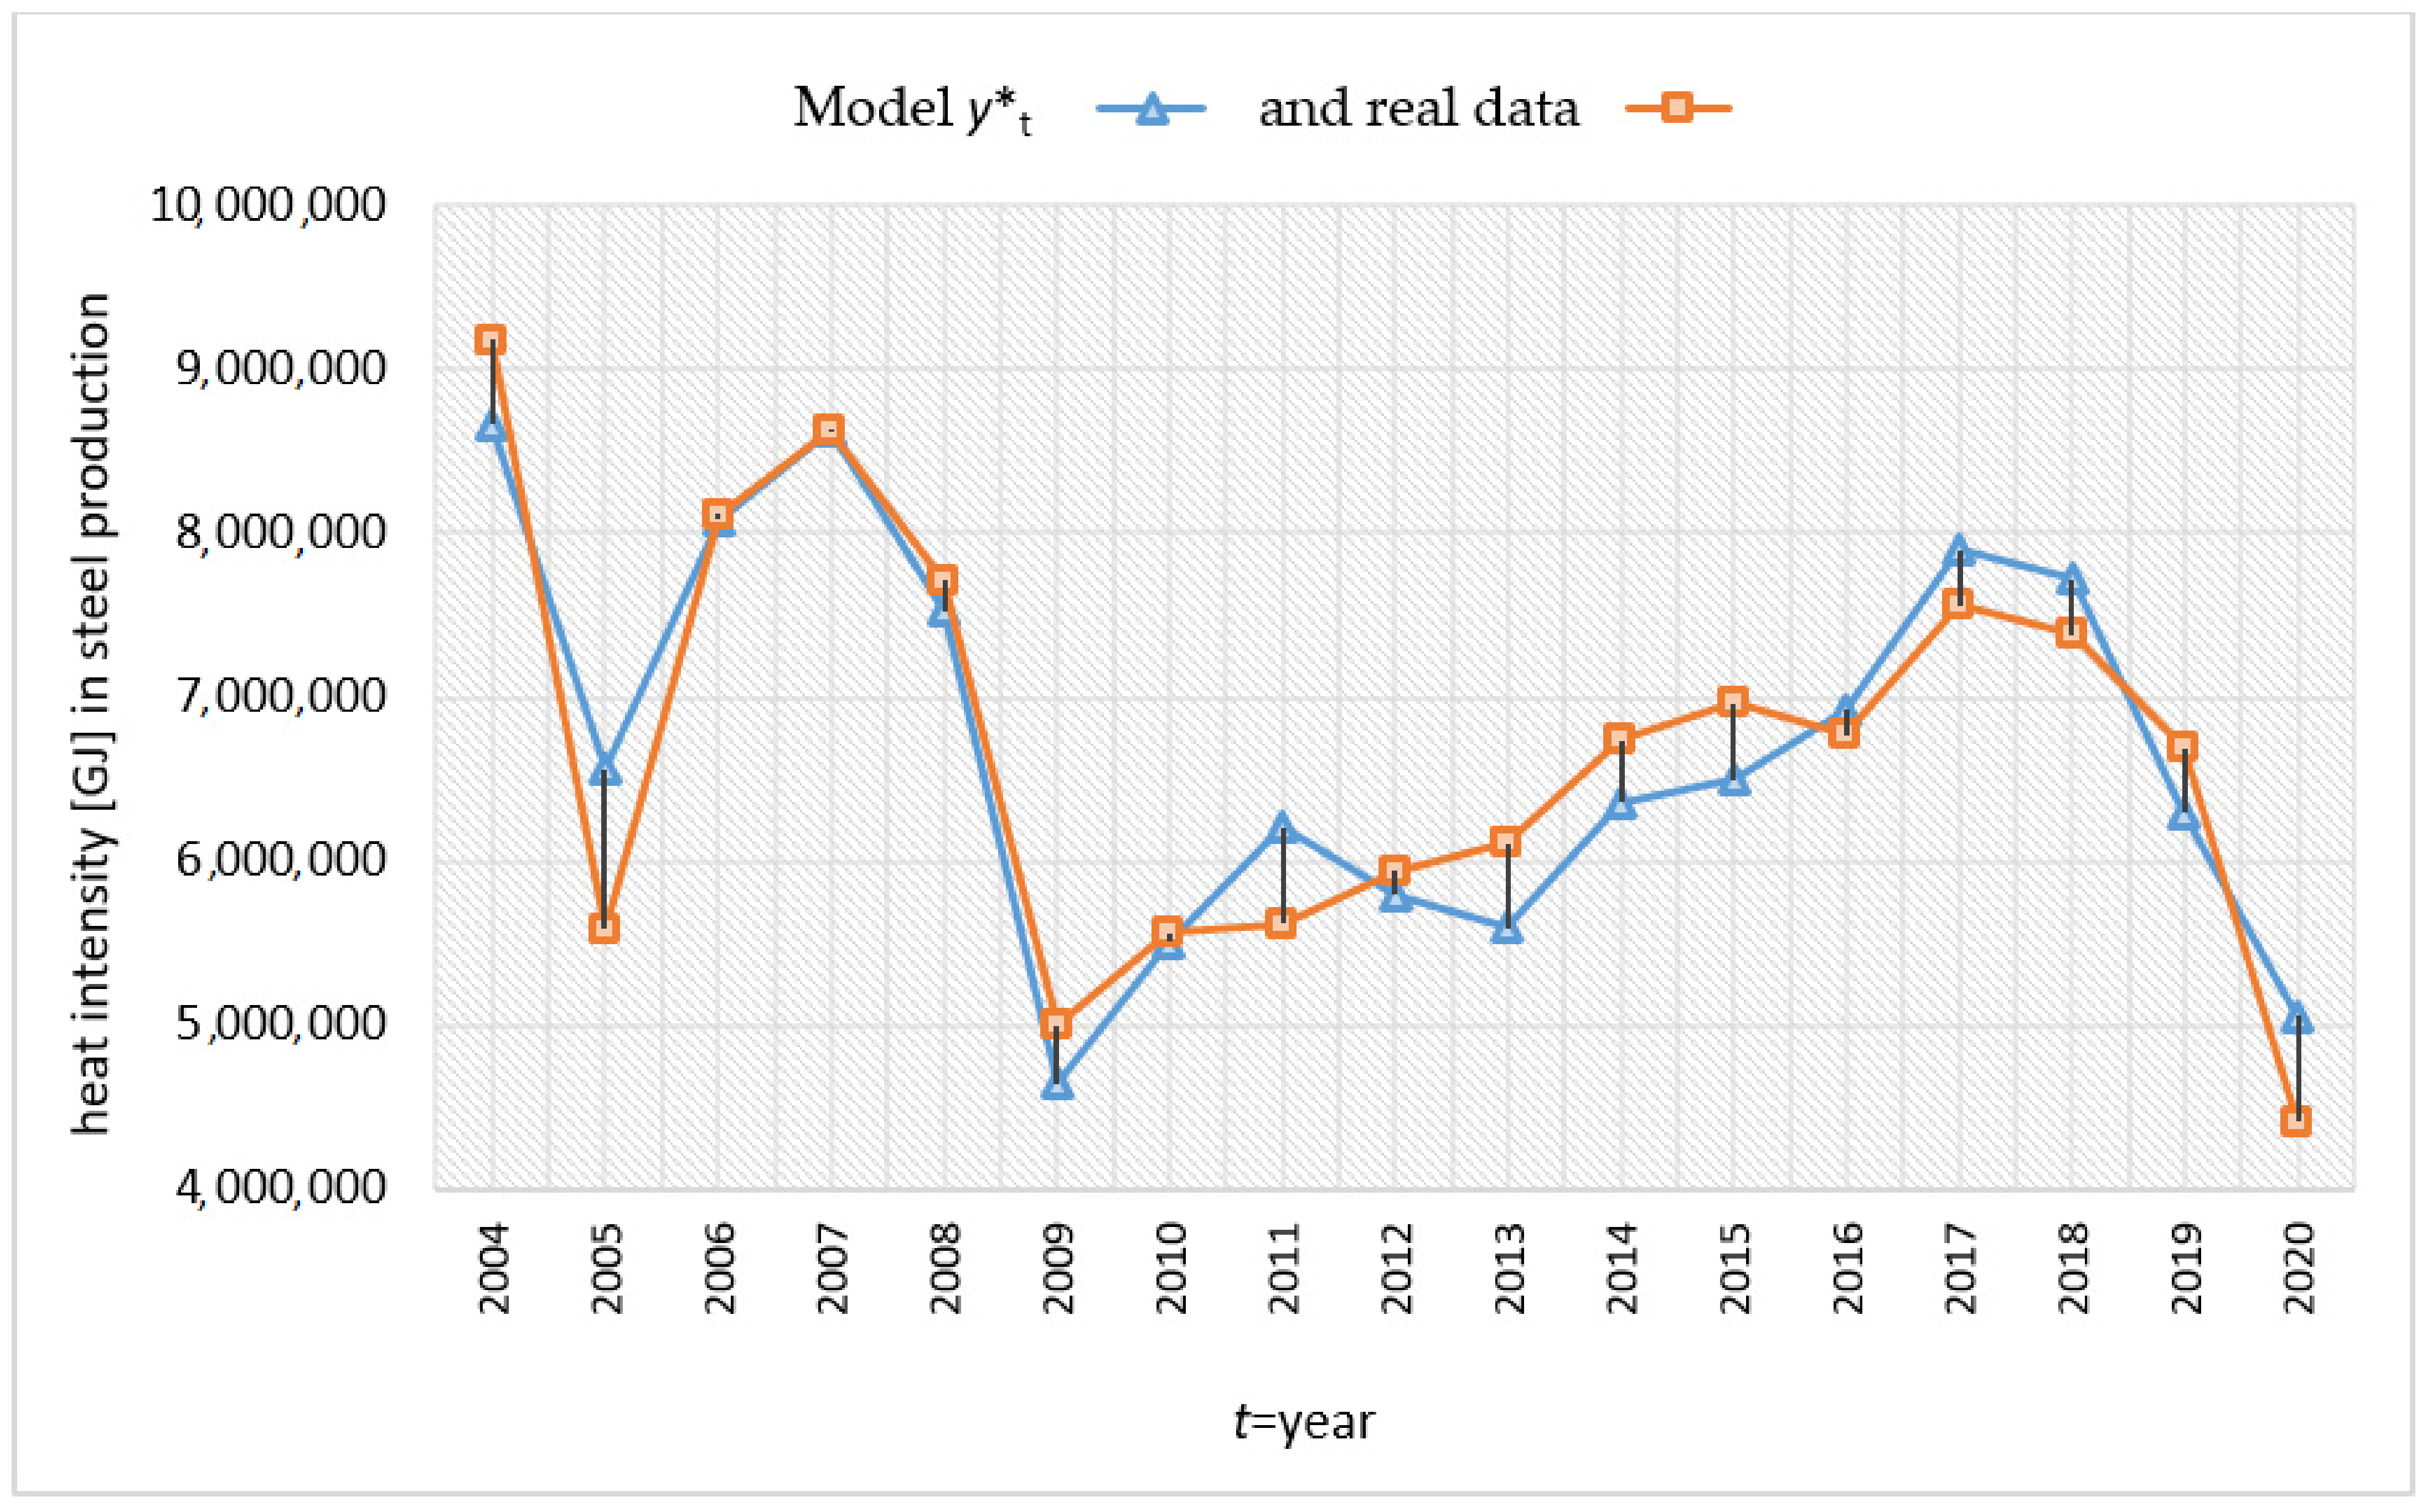
| t = Year | y*t Data from Model No. 2 Obianted for Heat Intenisty [GJ] | yt Real Data about Heat Intenisty [GJ] | Residual Components y−y*t [GJ] |
|---|---|---|---|
| 2004 | 8,662,032 | 9,176,746 | 514,714 |
| 2005 | 6,561,921 | 5,582,352 | −979,569 |
| 2006 | 8,080,134 | 8,115,360 | 35,227 |
| 2007 | 8,631,003 | 8,620,203 | −10,801 |
| 2008 | 7,525,355 | 7,714,424 | 189,068 |
| 2009 | 4,640,001 | 4,995,698 | 355,697 |
| 2010 | 5,501,857 | 5,563,254 | 61,397 |
| 2011 | 6,205,529 | 5,619,256 | −586,274 |
| 2012 | 5,791,820 | 5,937,344 | 145,523 |
| 2013 | 5,597,308 | 6,110,152 | 512,844 |
| 2014 | 6,363,276 | 6,741,570 | 378,294 |
| 2015 | 6,498,017 | 6,966,449 | 468,432 |
| 2016 | 6,921,838 | 6,768,135 | −153,703 |
| 2017 | 7,901,566 | 7,560,971 | −340,595 |
| 2018 | 7,720,433 | 7,379,043 | −341,390 |
| 2019 | 6,292,518 | 6,689,118 | 396,600 |
| 2020 | 5,057,104 | 4,411,638 | −645,466 |
| t = Year | y*t Forecasting Data from Model No. 2 Obianted for Heat Intenisty in Polish Steel Industry [GJ] | Energy Prices x1t [PLN/kWh] | Steel Production x2t [Thousnad Tonnes] |
|---|---|---|---|
| 2021 | 5,277,065 | 0.4875 | 8454 |
| 2022 | 4,051,253 | 0.6500 F | 8060 F |
Publisher’s Note: MDPI stays neutral with regard to jurisdictional claims in published maps and institutional affiliations. |
© 2022 by the authors. Licensee MDPI, Basel, Switzerland. This article is an open access article distributed under the terms and conditions of the Creative Commons Attribution (CC BY) license (https://creativecommons.org/licenses/by/4.0/).
Share and Cite
Gajdzik, B.; Wolniak, R.; Grebski, W.W. An Econometric Model of the Operation of the Steel Industry in POLAND in the Context of Process Heat and Energy Consumption. Energies 2022, 15, 7909. https://doi.org/10.3390/en15217909
Gajdzik B, Wolniak R, Grebski WW. An Econometric Model of the Operation of the Steel Industry in POLAND in the Context of Process Heat and Energy Consumption. Energies. 2022; 15(21):7909. https://doi.org/10.3390/en15217909
Chicago/Turabian StyleGajdzik, Bożena, Radosław Wolniak, and Wieslaw Wes Grebski. 2022. "An Econometric Model of the Operation of the Steel Industry in POLAND in the Context of Process Heat and Energy Consumption" Energies 15, no. 21: 7909. https://doi.org/10.3390/en15217909
APA StyleGajdzik, B., Wolniak, R., & Grebski, W. W. (2022). An Econometric Model of the Operation of the Steel Industry in POLAND in the Context of Process Heat and Energy Consumption. Energies, 15(21), 7909. https://doi.org/10.3390/en15217909