Abstract
The rapidly increasing concentrations of carbon dioxide lead to a threat of global climate change. As one of the major sources of carbon emissions in the Antarctic region, shipborne tourism in the Antarctic is expanding rapidly. Consequently, the carbon emissions of shipborne tourism in Antarctica are rapidly increasing. However, there is not enough attention being paid to this issue. In this paper, a calculation model was established to calculate the carbon emissions of cruise ships from the 2003/04 season to the 2016/17 season. The evolution of the carbon emissions from Antarctic cruise ships was described. An aggregate energy efficiency index was developed to evaluate the energy efficiency performance of Antarctic vessels. The key drivers were analyzed to find the paths of carbon reduction. The results show that: (1) The emissions per passenger-trip did not show a downward trend. The total carbon emissions increased continuously with the increasing number of tourists. The total carbon emissions in the 2016/17 season was double that in the 2003/04 season. (2) The aggregate energy efficiency index of Antarctic tour vessels has not reached an advanced level yet. It is the main reason for the high value of emissions per passenger-trip. (3) Due to the oversupply of Antarctica tour ships, there is a low rate of occupancy, which accounts for the decline in aggregate energy efficiency from the 2014/15 season to the 2016/17 season. This study suggests that the administrators of Antarctica should strengthen supervision of the tourism market, control the rapid growth in the number of cruise ships, improve the aggregate energy efficiency of cruise ships and form an efficient and green Antarctic tourism management system.
1. Introduction
The concentration of carbon in the Antarctic atmosphere has been rising at a faster rate than on other continents since the end of the last century. The value of that concentration has reached the level of 400 ppm recently [1,2]. Although it is still not clear what portion of that is from emissions within the Antarctic continent, it is certain that carbon emissions within or near the continent will make the situation worse [3]. Antarctic tourism is a major source of carbon emissions within the Antarctic continent, especially on the Antarctic Peninsula and its surrounding areas [4]. If per capita carbon emissions continue to be high, with the rapid expansion of the scale of Antarctic tourism, which is estimated to be rising at an average annual growth rate of 15%, carbon emissions from Antarctic tourism will increase significantly, inevitably exacerbating the rising trend of CO2 concentration in the Antarctic region. The Antarctic Treaty Organization and the Antarctic Travel Association have successively introduced restrictions (including banning cruise ships with more than 500 people on board), the International Maritime Organization has banned ships containing heavy oil from entering Antarctica, and some travel agencies have introduced environmental education measures to encourage tourists to conduct low-carbon Antarctic tours. The number of Antarctic tourists has grown from 23,000 in the 2003/04 season to 74,401 in the 2019/20 season [5,6].
Shipborne tourism has long been the main route for most tourists (more than 95%) to the South Pole. In the 2016/17 season, ship-based tourism accounted for 98.4% (44,358 from a total of 45,083) of the Antarctic tourism market. Tourists travel from all over the world to southern Chile or to the port of Ushuaia in Argentina before sailing to the Antarctic Peninsula [7]. The Antarctic Peninsula, close to South America, has a relatively mild summer climate, relatively less sea ice, a wide range of wildlife, diverse landscapes and science stations, which will fully meet the curiosity of visitors [8,9]. In recent years, the rapid growth in the number of visitors to the Antarctic Peninsula has raised concerns about the environmental impact, security problems and regulatory difficulties of Antarctic tourism [10,11]. The validity of these concerns remains controversial, and part of reason is that they have not been extensively studied.
Researchers began to focus on the impact of Antarctic tourism on global change in 2006. The existing research mainly focuses on three aspects [12,13]: the accounting of carbon emissions related to travel to Antarctic [14,15,16,17,18], perceptions of climate change and weather conditions [19,20,21,22,23] and effects of climate change on key resources such as heritage sites [24,25,26]. The carbon emissions accounting is the basis of next stage research, such as analyzing the environmental impact of ship-based tourism, exploring the key drivers of carbon emission mitigation and proposing emission reduction paths. The study in this paper starts from the calculation of carbon emissions from Antarctica shipborne tourism [26].
Previous studies on carbon emissions accounting for Antarctic tourism have explored the calculation method for carbon emissions from Antarctica tour vessels. Some empirical research was also conducted for certain tourism seasons. Amelung and Lamers [14] estimated the emission of CO2 equivalents involved in activities of almost the entire journey, from the origin of the trip to the “ harbor or airport of the last country before the arrival of the Antarctic ”, then to the Antarctic Peninsula, and activities on the Antarctic Peninsula. They estimated emissions of around 15 tonnes of CO2 equivalents per passenger (for flights and the cruise to Antarctica). Farreny et al. [16] improved the calculation model for the fuel consumption of ships in the study by Amelung and Lamers [14] to ensure that the calculation results of fuel consumption are closer to reality. They also improved the estimation boundaries for carbon emissions, and only calculated the CO2 emissions of cruise ships during operation in Antarctic waters. Farreny et al. [16] calculated carbon emissions from Antarctic tourism during the 2008/09 tourism season based on an improved methodology. The results show that the carbon emissions per passenger-trip were about 5.44 tons, and carbon emissions per passenger-day were 0.49 tons. About 70% of the carbon emissions come from cruise ship trips to and from Antarctica, and 30% come from air travel from home and then back to home. This highlights the importance of ship-based tourism in controlling the environmental impact of Antarctic tourism. By constantly updating the calculation model for fuel consumption, existing studies put forward a relatively practical calculation method for the fuel consumption of Antarctica tour vessels. It lays a foundation for establishing the methodology framework of carbon emissions accounting for Antarctic shipborne tourism.
Unfortunately, the focus of current research is still at the accounting stage. And only certain seasons of the carbon emissions of Antarctic tour vessels have been calculated. Lacking is a continuous systematic accounting and analysis for time series changes in carbon emissions from Antarctic shipborne tourism, not to mention the lack of analysis and research on a carbon emissions reduction path for Antarctic tourism. There still are many controversies regarding the carbon emissions of shipborne tourism in Antarctica [27,28]. Different studies are often directed at different years and the methods used are also different. The results obtained are not comparable. To resolve these issues, a calculation model of carbon emission for Antarctic shipborne tourism and a 17-seasons time series analysis have been used to explore a dynamic presentation of carbon emissions of Antarctic tourism in a longer-term perspective. An aggregate energy efficiency index (AEI) was developed to evaluate the performance of Antarctic vessels for energy use. The variation of AEI across the tourism seasons was tracked to analyze possible paths for energy conservation and emissions reduction. Based on the above analysis, we propose policy recommendations for tourism carbon reduction in Antarctica.
The remaining sections are organized as follows. Section 2 focuses on methodology, presenting the calculation model of carbon emissions from Antarctic shipborne tourism and the aggregate energy efficiency index. The data sources and revisions are also provided in this section. Section 3 presents the results of carbon emission calculations (total carbon emissions, per capita carbon emissions and carbon emissions per passenger per day) and the aggregate energy efficiency index for Antarctic vessels from the 2003/2004 season to the 2016/2017 season. The related discussion is presented in Section 4. The final section provides the conclusion, details a series of policy recommendations and outlines the study’s limitations and future areas of research.
2. Materials and Methods
2.1. The Calculation Model for Carbon Emissions from Antarctic Shipborne Tourism
In this study, the carbon emissions of each season were calculated using the bottom-up approach [29]. The daily fuel consumption of a single ship is calculated according to its operating data. Then the carbon emission is calculated by multiplying the emission coefficient and the number of operation days (see Formula (1)). Finally, total carbon emission is collected. The results are measured in tons of CO2.
where Ci is the total carbon emission of ship i, γ is the emission coefficient, Fi is the daily fuel consumption of ship i, and Ti is the number of operation days.
The daily fuel consumption depends on the ship type, operating status and the duration of each operating status. It can be calculated by the following model:
where represents the fuel use at maximum power, wj represents the proportion of fuel consumption in at each operation status, j represents the operation status, either “hoteling” state or cruise state, and tij represents the daily running duration and this is different for each state or each ship type.
The fuel use of each ship at maximum power () is calculated based on the regression model of tonnage and maximum power consumption, and the model expression is as follows:
where GTi is gross tonnage of ship i, in tons, and α and β is the regression coefficient. The estimated value of α and β can vary with the selected sample data.
The estimated value in the study of Hickman (α = 16.904, β = 0.00198) was based on fuel consumption and gross tonnage data from 83 passenger ships of any kind, with unknown relevance for Antarctic tourism. Farreny et al. [16] estimated the value (α = 8.103, β = 0.002) based on information about 16 out of the 36 vessels of the Antarctic fleet, a sample size that is deemed large enough to consider the model representative of the entire fleet. The two estimations have virtually identical slopes (β), but their constants (α) are different. The constant estimated by Hickman et al. [30] is more than twice the constant estimated by Farreny et al. This implies that the difference in results between the two estimations is relatively large for small ships, and relatively small for very large ships. This paper uses the value estimated by Farreny et al. for it based on a sample of the actual Antarctic tourism fleet, which makes it superior to that proposed by Hickman et al.
The proportion (w) of fuel consumption in is different in each operation status. In ‘hoteling’ state, the ship is in a fixed port or anchorage, and the fuel consumed is much less than in ‘cruise’ state [14]. According to Hickman [30], the fuel consumption in ‘cruise’ state and in ‘hoteling’ state are, respectively, 80% and 32% of the fuel consumption at maximum power.
In one voyage, the time ratio between ‘cruise’ state and ‘hoteling’ state in traditional vessels and cruise-only ships is calculated separately. The operation duration of a ship in ‘cruise’ state is estimated by dividing the total distance by its cruising speed. Empirical observations show that the average voyages of traditional vessels and cruise-only ships are 2000 miles and 1300 miles, respectively, with average speeds of 9 and 12 knots, respectively. For the rest of the time, the ship is in ‘hoteling’ state, where it may be suspended for reasons such as boarding or leaving. The results of the calculations show that the time spent by traditional vessels and cruise-only ships in ‘cruise’ state is very similar, 71% and 70%, respectively. The rest of the time is spent in ‘hoteling’ state [31].
The procedure of converting fuel consumption into carbon emissions follows the study by Farreny et al. [16]. The carbon emission factors come from Hickman’s research [30]. In this study, the total carbon emissions, the emissions per passenger-trip and emissions per passenger-day were calculated.
2.2. The Building of the Aggregate Energy Efficiency Index Model
According to the existing research and the carbon emission calculation model for Antarctic tour vessels [9,32], the carbon emissions of Antarctic shipborne tourism is influenced by the luxury degree (ratio of gross tonnage to capacity), occupancy rate of vessels, the trip length and technical characteristics (dynamic efficiency, shape design, etc.) of cruise ships. Given the availability and continuity of the data (the technology update of a cruise ship is often discontinuous), this study selects the first three indicators: ratio of gross tonnage to capacity, occupancy rate of vessels and the trip length, to build the aggregate energy efficiency index model for Antarctic tour vessels.
2.2.1. Ratio of Gross Tonnage to Capacity (RTC)
The ratio of gross tonnage to capacity is expressed by the number of passengers that a ship can load in each kiloton (Formula (4)). It reflects the extent to which the tourism vessels are luxury vessels [33].
where Ci represents the capability of ship i and GTi represents the gross tonnage of ship i.
The lower the ratio of gross tonnage to capacity, the more the tonnage per passenger, the more luxurious the vessels are, and the greater the carbon emissions per passenger-trip will be; on the other hand, the higher the ratio of gross tonnage to capacity, the less the tonnage per passenger, the more economical the vessels are, and the smaller the carbon emissions per passenger-trip will be.
2.2.2. Occupancy of Vessels (OV)
The occupancy rate of a ship is the ratio of passengers to its maximum carrying capacity (Formula (5)).
where Ni represents the number of passengers of ship i on a trip.
The occupancy rates reflect how efficiently a ship is being used on a certain trip [34]. The higher the occupancy rate of a ship is, the lower its per capita fuel consumption will be and the lower its corresponding carbon emissions.
2.2.3. Length of the Trip (LT)
The trip length is the time duration it takes a ship to make a trip to and from the Antarctic continent. The longer the trip length, the higher the corresponding fuel consumption and carbon emissions. It is worth noting that the standard value of travel length is not 0, but rather the minimum time duration necessary to meet the basic needs of tourists. The length of travel duration is directly related to the carbon emissions of the cruise ship. In the case of a fixed tonnage and load factor, the longer the trip length, the greater the total carbon emissions of the cruise ship will be.
2.2.4. The Aggregate Energy Efficiency Index (AEI)
The aggregate energy efficiency index reflects the degree of energy conservation of a tour ship. It is a combination of information from RTC, OV and LT. In this study, the geometric mean was used to aggregate the information of these three factors (Formula (6)). The geometric average can highlight the role of the Buckets effect, which conforms the relationship between energy efficiency and the three factors. Specifically, a low cruise occupancy rate for a tour ship, even if the cruise ship has a high tonnage to capacity ratio and a short trip length, will lead to a relatively high per capita carbon emission for the trip.
where , , represent the standard value of RTC, OV and LT, respectively.
The method of data standardization is shown in Formula (7).
where maxxi and minxi represent the maximum value and minimum value of variable x, respectively. Ei represents the effect of variable x on the energy efficiency. If variable x has a positive effect on the energy efficiency, then Ei is positive, and vice versa.
It is worth noting that, during data standardization, a certain effect of a variable on the energy efficiency is corresponding with a certain calculation function in Formula (7). When a variable is positive for the energy efficiency, it is a positive variable and should be standardized by the first function in Formula (7). Otherwise, the second function should be selected. For energy efficiency, the larger the RTC value is, the lower the energy efficiency of the cruise ship will be. Therefore, the RTC plays a positive role and belongs to the positive variables. Similarly, OV is a positive indicator and LT is a negative indicator.
The value of AEI is calculated by two steps. In the first step, the values of RTC, OV and LT are substituted into Formula (7) for data standardization. In the second step, the standard value of the three indicators are substituted into Formula (6) to obtain the value of the aggregate energy efficiency index. In order to avoid zero values in the results of data standardization, the minimum values of RTC and OV were set to 2.5 persons per kiloton and 30% respectively. The maximum value of LT was set to 40 days.
Because the number of cruise ships for each tourism season is different, the results of AEI among different seasons cannot be compared directly. In order to solve this problem, the results of AEI are classified into four value ranges by quartile. The four ranges are the low value area [0,0.25), relative low value area [0.25, 0.5), relative high value area [0.5, 0.75), and high value area [0.75, 1). Consequently, the variation of AEI in the time series can be reflected by the change in the number of ships in the same value area. Specifically, the number of ships in each value area should be counted first. Then the proportion of the number of ships of a value area to the total number of ships during certain seasons should be calculated.
2.3. Data Resources and Revision
The gross tonnage and maximum passenger capacity of Antarctic tour vessels are mainly taken from Wikipedia and the official website of the cruise ship company. Other data, including the number of passengers, trip length and frequency, are all from the statistical data of Antarctic tourism released by International Association of Antarctica Tour Operators (IAATO). This study’s analysis ends in the 2016/17 season, as IAATO no longer disclosed specific information about Antarctic cruise ships after 2019.
During the data compilation, we found some special phenomena associated with the Antarctic excursion vessels and some errors in the data published on the IAATO official website. For the former, to be specific, one ship may use two or more designations to sail in the same season. For example, the Explorer II was named Explorer II in 2003/04, but was named either Alexander von Humboldt or Explorer II for different voyages during the 2004/05–2007/08 seasons (for the first few voyages of each of these tour seasons it was named the Alexander von Humboldt, and for the last several voyages it was called the Explorer II). Since the 2008/09 season, it has been renamed as the Minerva. As for the data error issues, there are several mistakes in the data released by the IAATO. For instance, in the 2003/04 season, the cruise ship World Discoverer had a sailing span from 18 December 2003 to 5 December 2004, so the sailing time was almost one year. After verification, we ascertained that its actual return was on 5 January 2004. In this paper, we recognized all multi-name vessels and corrected any data errors that have been discovered.
Additionally, the trip length data of Antarctic tourism vessels released by IAATO needed to be discriminated. Due to different schedules, different voyages have different trip lengths. For the ships with longer sailing times, maybe forty days or longer, we found that the ships did not travel all that time in the Antarctic. This paper analyzes and deals with this issue. For example, Bark Europe often travels for as long as 50 days in the last voyage of each season. By understanding its logbooks [35], we found that the destination of this voyage is Cape Town, South Africa. And the actual trip length in the Antarctic is only about 30 days.
The lanes of traditional vessels are relatively fixed (between Ushuaia and the Antarctic Peninsula). However, the lanes of cruise-only ships are not fixed. Each voyage has a unique origin and destination, usually including bigger ports such as Buenos Aires, Santiago (Chile) and Rio de Janeiro, or other larger ports. They often cruise for months. In this period, about six or seven days are usually in Antarctic waters, leaving or returning to Ushuaia. In this study, the carbon emissions of cruise-only ships was calculated only for when they cruise in Antarctic waters.
The operations data (number of vessels, number of passengers, etc.) for traditional vessels and cruise-only ships is sourced from IAATO and the Tierra de Fuego Tourism Office. The list of vessels included in the analysis, with their gross tonnage, years of operation in the Antarctic, total passengers and average trip length are shown in the Supplementary Materials.
SPSS19.0 was used for data collation and analysis in this paper.
3. Results
3.1. The Scale Evolution of Antarctic Shipborne Tourism
The scale of Antarctic cruise tourism has shown an overall increase during the 17 tourism seasons, as shown in Table 1. The total number of Antarctic cruise ships has nearly doubled from 28 in the 2003/04 season to 42 in 2019/20 season. Meanwhile, the total number of Antarctic cruise tourists has more than tripled from 24,082 to 74,401. Notably, there was a significant decline in the scale of Antarctic cruise tourism from the 2009/10 season to the 2011/12 season.

Table 1.
The number of vessels and passengers of Antarctic tourism from 2003/04 season to 2019/20 season.
3.2. The Carbon Emissions from Vessels of Antarctic Tourism
The results for the carbon emissions of Antarctic tourism are shown by three indicators: total carbon emissions, carbon emissions per passenger-trip and carbon emissions per passenger per day.
3.2.1. The Total Carbon Emissions
As shown in Figure 1, the variation of total carbon emissions from vessels in Antarctica shows an S-shaped trend. The peaks (141.85 kt) and troughs (98.75 kt) appeared in the 2008/09 season and the 2011/12 season, respectively.
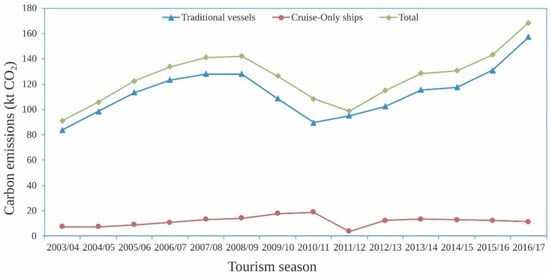
Figure 1.
Carbon emissions of Antarctic tour ships from 2003/04 season to 2016/17 season.
Carbon emissions from traditional vessels were on the rise from the 2003/04 season to the 2007/08 season, and then declined until the 2011/12 season. In the last six seasons, the carbon emissions resume their rise and reach 167.6 kt in the 2016/17 season.
Carbon emissions from cruise-only ships are relatively low in total, and its change shows different trends. The total carbon emissions continued to rise before the 2010/11 season. Then, there was a sharp decline in the 2011/12 season. After a slight rebound in the 2012/13 tourism season, the emissions saw a gradual slowdown.
3.2.2. The Emissions per Passenger-Trip
Figure 2 shows the line chart for carbon emissions per passenger-trip for the Antarctic ships, differentiating between traditional vessels and cruise-only ships.
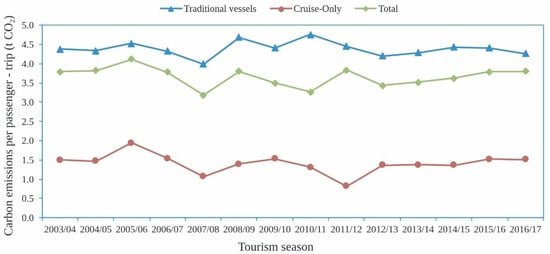
Figure 2.
Emissions per passenger-trip of Antarctic tour ships from 2003/04 season to 2016/17 season.
As shown in Figure 2, the carbon emissions per passenger-trip of ship-based tourism in Antarctic fluctuated between 3.2 t and 4.14 t. The highest value (4.14 t) appeared in the 2005/06 season and the lowest value in the 2007/08 season. The volatility gradually decreased over time. Unfortunately, no downward trend appeared in the change of carbon emissions per passenger-trip. And there is a continuous increase from the 2012/13 season to the 2015/16 season.
The carbon emissions per passenger-trip of traditional vessels fluctuated between 4.01 t and 4.76 t. Its volatility is very similar to the volatility of the total.
The carbon emissions per passenger-trip of cruise-only ships fluctuate within the range of 0.82–1.94 t. There are two lower points in its line chart at the 2007/08 season and the 2011/12 season. It also reveals a general downward trend from the 2005/06 season to the 2011/12 season, and then a rising tendency appeared in the last five seasons.
3.2.3. The Emissions per Passenger-Day
As shown in Figure 3, the carbon emissions per passenger-day of ships in Antarctica fluctuated between 0.33–0.42 t, and the average value for traditional vessels fluctuated between 0.35–0.46 t. The average value for cruise-only ships fluctuated between 0.13–0.34 t.
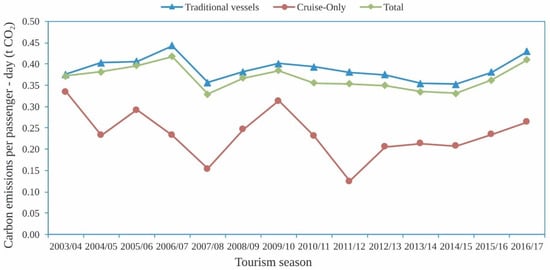
Figure 3.
Emissions per passenger-day of Antarctic tour ships from 2003/04 season to 2016/17 season.
3.3. The Aggregate Energy Efficiency Index
3.3.1. Ratio of Gross Tonnage to Capacity (RTC)
As shown in Figure 4, the ratio of gross tonnage to capacity is on a declining curve. The abnormally high value point disappeared in the 2009/10 season. The smallest mid-value (about 22/kt) appeared in the 2010/11 season. Comparing the change in the ratio of gross tonnage to capacity with that of the carbon emissions per passenger-trip, we find that either the maximum value or the minimum value appeared in the corresponding year. This is evidence for the conclusion that the ratio of gross tonnage to capacity is one of the main influencing factors for carbon emissions per passenger-trip.
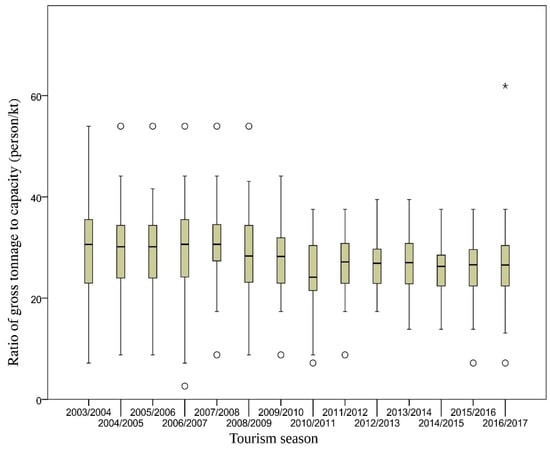
Figure 4.
The change of the ratio of gross tonnage to capacity (only traditional vessels). Note: * represents for extremely abnormal value.
3.3.2. Occupancy of Vessels (OV)
Figure 5 shows the changes of occupancy of traditional Antarctic cruise vessels in the past 14 seasons. In general, the change of occupancy is in correspondence with the change of tourist numbers. From the 2003/04 season to the 2008/09 season, as the number of tourists in Antarctica continued to increase, the average occupancy of Antarctic vessels continued to increase; on the other hand, the number of vessels with abnormally low occupancy of vessels was decreasing. In the 2007/08 season, the number of tourists peaked and there was no abnormal low value of occupancy. The abnormal low values for occupancy of vessels begin to increase when the number of Antarctic tourists decreases from the 2009/10 season. In 2011, the extreme low value appeared. Since the 2012/13 season, however, the occupancy of vessels has increased, with the number of tourists increasing at the same time. However, it is worth noting that the occupancy of vessels appeared to continuously decrease in the last three seasons.
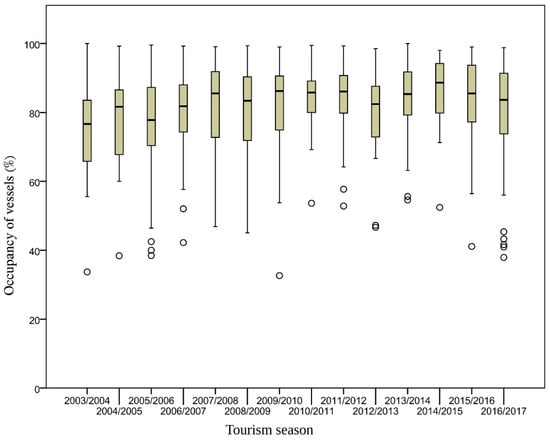
Figure 5.
The change of occupancy (only traditional vessels).
3.3.3. Length of the Trip (LT)
It can be seen from the box diagram in Figure 6 that the average trip length of most traditional vessels in Antarctica is around 10–15 days. The range of the trip length is expanding year after year and this trend reflects the enrichment and diversification of Antarctic tourism services. The median of average trip length was fluctuating before the 2009/10 tourism season and then stabilized at around 12 days after the 2010/11 tourism season.
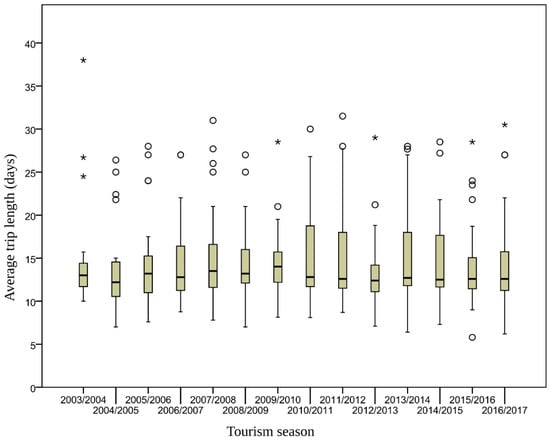
Figure 6.
The average trip length for traditional vessels from 2003/04 season to 2016/17 season. Note: * represents for extremely abnormal value of trip length.
3.3.4. The Aggregate Energy Efficiency Index
The proportion change of the aggregate energy efficiency index (AEI) during 14 tourist seasons is shown in Figure 7.
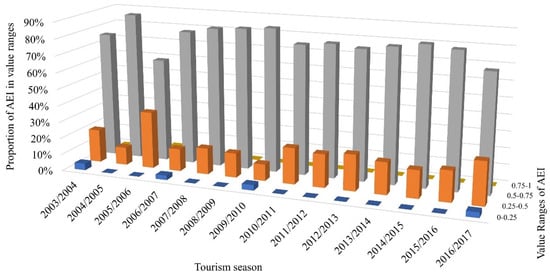
Figure 7.
The change of the aggregate energy efficiency index during 14 seasons.
As shown in Figure 7, a large proportion of ships have a relatively high AEI value in all 14 tourism seasons. The cruise ships in the region with the second highest index values account for the largest proportion. A small proportion of cruise ships are located in the relatively low AEI value area. Only a tiny proportion of cruise ships belong to the high AEI value area. There are also several cruise ships that have the low AEI value.
In terms of the change of AEI values, there are only slight fluctuations during the 14 seasons. There is no tendency to the high-value region. Nevertheless, in the last three seasons, the AEI values of ships show a tendency towards the low value area.
4. Discussion
4.1. Carbon Emissions and Variations
As shown in the calculation results for carbon emissions, the highest total carbon emissions of Antarctic shipborne tourism were 167.6 kt and appeared in the 2016/17 season. The values of total carbon emissions are smaller than those of other mainland tourist attractions. However, the emissions per passenger-trip have reached 4.14 t, which is obviously higher than those of other mainland tourist attractions. This is consistent with the results of Farreny et al. [16] in their research on the 2008/2009 tourism season. An obvious reason for this phenomenon is distance. The special geographical position of Antarctica makes for a longer voyage in Antarctic tourism. Tourists spend most of their travel time on the ships. Thus, Antarctic tour ships have a variety of energy needs, including power for lights, heating and accommodations. Ships in the Antarctic tourism lanes will evidently consume more fuel than those in other lanes. This is confirmed by Simonsen et al. [36], whose study on cruise ships’ energy consumption found that cruise ships in the polar regions consume more fuel than those in other regions [37]. Another reason for the high energy consumption is special weather and navigation conditions. Compared with shipborne tourism in lower latitudes, the Antarctic cruise ships are faced with lower ambient temperature and more severe navigation conditions. The routes of Antarctic cruise ships are located in the latitudes higher than 60 °S. The perennial average temperature in these latitudes is lower than for tour attractions in any other region. Therefore, the energy consumption for cabin heating is relatively higher than that in other regions. In terms of navigation conditions, the Southern Ocean brings more wind, waves and resistance to the cruise ships. In particular, the cruise ships are faced with greater navigation resistance than in other regions when passing through the Drake Passage [38].
The carbon emissions per passenger-trip for cruise-only ships are significantly less than those for traditional vessels (by about 2–5 times). One reason is the scale effect on this kind of ship. Cruise-only ships can carry several thousands of passengers in one trip. The Star Princess, the largest cruise ship in Antarctica, can pick up about 5000 travelers in one trip. Additionally, travelers on cruise-only ships are not able to land in Antarctica and thus have a shorter cruise duration, about 6–7 days, than those in landing ships, about 20 days.
In the field of carbon emissions variation, the emissions per passenger-trip fluctuated in the fourteen tourism seasons. There was no apparent declining trend that appeared over the 14 seasons. Consequently, the total carbon emissions would vary with the number of tourists. This has been confirmed by the results of this study. The trend of total carbon emissions is consistent with that of the number of tourists. This means that if the emissions per passenger-trip are not effectively controlled in the near future, the total carbon emissions of ship-based tourism will continue to rise with the increase of the number of tourists [39].
The impact of the global economic situation on Antarctic tourism cannot be underestimated. The number of Antarctic tourists fell only in the 2008/09 season. The impact of the 2008 recession is the main reason for the decline in Antarctic tourism carbon emissions in the 2008/09 season. The impact lasted until the 2011/12 season when it began to recover. The International Association of Antarctic Tour Operators (IAATO) reported 74,401 Antarctic tourists in the 2019–2020 season, doubling the number just five years earlier [40]. This fully reflects the influence of the global economic situation on changes in Antarctic tourism demand [41]. Unfortunately, the COVID-19 pandemic has also had a negative impact on tourism and the global economy, leading to a sharp drop in Antarctic tourism. [42] As the pandemic dissipates and the global economy recovers, however, the scale of Antarctic tourism is set to rise [25].
4.2. The Aggregate Energy Efficiency Index (AEI) of Antarctic Tour Vessels
4.2.1. Variation of AEI Value
Compared with uncontrollable factors such as weather conditions, navigation conditions and global economic changes, factors such as the ratio of gross tonnage to capacity, occupancy rate and trip length of cruise ships are more controllable for carbon reduction in Antarctic shipborne tourism. According to the distribution and variation of the aggregate energy efficiency index, there are few tour ships with high AEI value. Thus, there is still more room for further improvement in carbon emissions from Antarctic shipborne tourism. In the last three tourism seasons, the AEI value of ships has shifted from the high value area to the low value area, which indicates that the energy efficiency of the ships appears to be in a downward trend. This downward trend may drive an increase in the emissions per passenger-trip and may even increase the total carbon emissions. It is urgent to take corresponding measures to regulate the operation and management of Antarctic tourism.
4.2.2. Variation of Indicators
The variation of AEI values can be explained by the variation of the three indicators: ratio of gross tonnage to capacity, occupancy rate and the trip length. The variation of the three indicators is discussed to find out the short planks that hinder carbon reduction in Antarctic shipborne tourism.
The distribution of the ratio of gross tonnage to capacity of tourism vessels in Antarctica tends to be concentrated over time, and the ratio range is continuously narrowing. From the 2009/10 season, the relatively abnormally high value of the ratio of gross tonnage to capacity of the vessels has disappeared, and the type of vessels has a tendency towards homogenization. From the 2011/12 season to the 2016/17 season, the mid-value of the ratio of gross tonnage to capacity is basically stable at the level of 30 passengers/kt. The vessels in this level can meet the various needs of visitors such as tourism comfort, landing, cost economy and so on. In other words, the tendency to homogenization in Antarctic tourist vessels is the result of market selection. As a result, more vessels at the level of 30 passengers/kt will operate in Antarctic waters in the future. Thus, the key to control the carbon emissions of the Antarctic tourist vessels is to control the carbon emissions of vessels at this level.
The ratio of gross tonnage to the capacity of a ship is basically fixed after the construction. But the carbon emission for each journey also depends on its occupancy and trip length.
The changes in occupancy rates suggested that Antarctic tourism still has much room for reform in the integration of tourist resources. Specifically, in the years when tourists are more frequent, cruise vessels generally have higher passenger loading rates. On the other hand, in the seasons with fewer tourists, the resources are not well integrated, making more vessels run with low load, which will inevitably increase the carbon emissions per passenger-trip and, in turn, increase the total carbon emissions. In other words, the carbon emissions of Antarctic tourism will not decrease correspondingly as the number of tourists decreases.
The longer average trip lengths always mean more frequent landing of visitors. From the tourists’ experience perspective, more landing means a richer travel experience. Nevertheless, from the perspective of Antarctic environment conservation, more landing means more carbon emissions and greater interference with the Antarctic environment. Therefore, the appropriate trip length for Antarctic tourism should be a compromise between having a diversity of tourism services and conservation of the local environment.
4.2.3. Short Planks for the Improvement of Energy Efficiency
When focusing on the changes during the last three tourism seasons, it is not difficult to find that the decrease in the occupancy rate is the main reason for the increase in emissions per passenger-trip. During the last three seasons, a change in trip length is not obvious, and the ratio of gross tonnage to capacity shows a slight upward trend while the occupancy rate shows a significant downward trend.
The decrease in the occupancy rate is related to the better expectations of Antarctic tour operators for the future market. The growing number of Antarctic tourists in these years brought a huge business opportunity for cruise operators. However, as superabundant cruise ships are put into service for Antarctic tourism, the increase in supply exceeds the increase in demand, resulting in resource surplus, energy efficiency reduction and carbon emissions increase [20].
In the future, it is necessary to establish an access permission mechanism and a price regulation mechanism for Antarctic shipborne tourism to control the excessive growth in the number of tour ships [43]. The access permission mechanism should limit the number of luxury cruise ships with low ratios of gross tonnage to capacity [44]. The price regulation mechanism should play an important role in limiting tours with a trip length of more than 20 days, and control the rapid growth in the supply of Antarctic cruise ship programs [45].
In fact, some international institutions and organizations have conducted some explorations into how to control the environmental impact of Antarctic tourism [46]. As an instance, the International Maritime Organization (IMO) issued a ban in 2011 forbidding all ships using heavy oil to enter Antarctica. Affected by this ban, cruise ships have to instead use more expensive light diesel. Rising costs sharply diminished their price advantage, making the number of Antarctic cruise ships and their carbon emissions continue to decline [8].
Improving the energy efficiency of cruise ships is also an effective way to reduce emissions. Clean Cruise Shipping is an alternative solution. It encourages cruise ships to use cleaner fuels as power sources. Studies have found that using LNG/OPS instead of diesel can significantly reduce the carbon emissions of cruise ships. [47] In the future, Antarctic cruise tourism should shift to a greener fuel mix.
5. Conclusions
Antarctic shipborne tourism is expanding at an unprecedented rate. This alarming situation has a direct impact on Antarctic carbon concentrations as well as an indirect impact on global climate change. In this research, the carbon emissions of Antarctic cruise ships were calculated from the 2003/04 season to the 2016/17 season. The trend of total carbon emissions, carbon emissions per passenger-trip and carbon emissions per passenger-day for Antarctic traditional vessels and cruise-only ships were analyzed. An aggregate energy efficiency index was developed to evaluate the energy efficiency performance of Antarctic tour ships. The Antarctic environment management system and the path of Antarctic tourism carbon reduction were discussed, combined with analysis of the ratio of gross tonnage to capacity, passenger loading rates and the trip lengths of Antarctic tour vessels.
The carbon emissions per passenger-trip of Antarctic shipborne tourism are fluctuating at a high level and have not shown a downward trend. As a result, the total carbon emissions appear to continuously increase with the growing number of tourists. The total carbon emission has doubled during 14 seasons. The emissions per passenger-trip of Antarctic shipborne tourism fluctuated between 3.2 t and 4.1 t in the 14 tourist seasons. Not only has there been no downward trend overall, but it has continued to rise in the last three tourist seasons. Total carbon emissions increased as the number of tourists increased rapidly.
The aggregate energy efficiency index of Antarctica tour vessels is far from ideal. Furthermore, there has not been an improvement trend during these 14 seasons. The low performance on energy efficiency by Antarctic tour vessels is the main reason for the high carbon emissions per passenger-trip. According to the evaluation results for the aggregate energy efficiency index of Antarctica tour vessels, the proportion of cruise ships with high energy-efficiency is very low. As for the variation of the aggregate energy efficiency index, the energy efficiency of tour vessels shows no increase tendency during the 14 tourist seasons, but rather declined in the last three tourist seasons.
The decline of the occupancy rate stemming from the oversupply of Antarctic tour ships is the main reason for the recent decline in aggregate energy efficiency. In addition, the number of luxury tour ships and the lengths of the trips have not been effectively controlled, and they have also boosted the carbon emissions per passenger-trip of Antarctic shipborne tourism.
The study suggests that Antarctic tourism administrators (such as the Antarctic Treaty Consultative Meeting, abbr. ATCM) and operating organizations (such as IAATO) should include the issue of carbon emissions control in Antarctic shipborne tourism on the agenda. They need to establish and improve management mechanisms as soon as possible to control the excessive growth of Antarctic tourism projects and avoid the waste of resources and emissions due to oversupply.
The management and regulation of Antarctic tourism plays an important role in controlling the carbon emissions of Antarctic cruise ship tourism. The rising carbon emissions from Antarctic tourism requires ATCM and IAATO to take more efficiency management and regulation measures. In the future, the management of Antarctic tourism should pay more attention to the integration of Antarctic tourism resources and limit the luxury of Antarctic cruise ships. Future research should focus on two aspects. One is to explore appropriate aggregate control indicators and establish a management system to reduce per capita carbon emissions in exchange for greater tourist capacity. The other is to explore the issue of appropriate travel times to meet the basic travel needs, thus avoiding the high carbon emissions from prolonged travel.
Supplementary Materials
The following supporting information can be downloaded at: https://www.mdpi.com/article/10.3390/en15217837/s1.
Author Contributions
Conceptualization, supervision and project administration: G.L. and Y.W.; writing, reviewing and editing: G.L. and W.L.; data collection and curation: Y.D.; methodology and resources: Y.W. All authors have read and agreed to the published version of the manuscript.
Funding
This research was funded by the National Natural Science Foundation of China (Grant Nos. 72104172, 72174137, 72004155, 41776199).
Data Availability Statement
Not applicable.
Acknowledgments
We wish to thank Jingfang Tu, a researcher in the Polar Research Institute of China, and Haining Wang, an Antarctic explorer, for their suggestions about the discussion of this issue. We also wish to thank graduate candidates Pengfei Cui, Bohui Jin and Duo Xu, for their help in the data collection and data analysis.
Conflicts of Interest
The authors declare no conflict of interest.
References
- Betts, R.A.; Jones, C.D.; Knight, J.R.; Keeling, R.F.; Kennedy, J.J. El Nino and a record CO2 rise. Nat. Clim. Chang. 2016, 6, 806–810. [Google Scholar] [CrossRef]
- Lloret, J.; Carreno, A.; Caric, H.; San, J.; Fleming, L.E. Environmental and human health impacts of cruise tourism: A review. Mar. Pollut. Bull. 2021, 173, 112979. [Google Scholar] [CrossRef] [PubMed]
- Fang, S.; Chen, X.; Zhang, K.; Wei, H.; Ge, J. The Antarctic Astronomical Observations Intelligent Support Equipment “Dome A” Site-Testing Observatory: Electric Power Generation and Control Systems. Energies 2020, 13, 4308. [Google Scholar] [CrossRef]
- Barnes, D.K.A.; Sands, C.J.; Paulsen, M.L.; Moreno, B.; Moreau, C.; Held, C.; Downey, R.; Bax, N.; Stark, J.S.; Zwerschke, N. Societal importance of Antarctic negative feedbacks on climate change: Blue carbon gains from sea ice, ice shelf and glacier losses (vol 108, 43, 2021). Sci. Nat. 2021, 108, 51. [Google Scholar] [CrossRef] [PubMed]
- IAATO. Tourism Summary by Expedition. 2018. Available online: https://iaato.org/documents/10157/1941394/2016-2017+Tourism+Summary+by+Expedition/4b359a83-3272-4824-9321-e086614cc19b (accessed on 15 July 2022).
- Liggett, D.; Frame, B.; Gilbert, N.; Morgan, F. Is it all going south? Four future scenarios for Antarctica. Polar Rec. 2017, 53, 459–478. [Google Scholar] [CrossRef]
- Jensen, M.; Vereda, M. The Origins and Development of Antarctic Tourism through Ushuaia as a Gateway Port; Springer International Publishing: Berlin/Heidelberg, Germany, 2016. [Google Scholar]
- Bender, N.A.; Crosbie, K.; Lynch, H.J. Patterns of tourism in the Antarctic Peninsula region: A 20-year analysis. Antarct. Sci. 2016, 28, 194–203. [Google Scholar] [CrossRef]
- Cajiao, D.; Benayas, J.; Tejedo, P.; Leung, Y.-F. Adaptive Management of Sustainable Tourism in Antarctica: A Rhetoric or Working Progress? Sustainability 2021, 13, 7649. [Google Scholar] [CrossRef]
- Erceg, D. Explorers of a Different Kind: A History of Antarctic Tourism 1966–2016. Ph.D. Thesis, The Australian National University, Canberra, Australia, 2017. [Google Scholar] [CrossRef]
- Sánchez, R.A.; Roura, R. Supervision of Antarctic Shipborne Tourism: A Pending Issue? In Tourism in Antarctica: A Multidisciplinary View of New Activities Carried Out on the White Continent; Springer International Publishing: Cham, Switzerland, 2016; pp. 41–63. [Google Scholar]
- Stewart, E.J.; Liggett, D.; Dawson, J. The evolution of polar tourism scholarship: Research themes, networks and agendas. Polar Geogr. 2017, 40, 59–84. [Google Scholar] [CrossRef]
- Alekseev, I.; Abakumov, E. Soil organic carbon stocks and stability of organic matter in permafrost-affected soils of Yamal region, Russian Arctic. Geoderma Reg. 2022, 28, e00454. [Google Scholar] [CrossRef]
- Amelung, B.; Lamers, M. Estimating the Greenhouse Gas Emissions from Antarctic Tourism. Tour. Mar. Environ. 2007, 4, 121–133. [Google Scholar] [CrossRef]
- Eijgelaar, E.; Thaper, C.; Peeters, P. Antarctic cruise tourism: The paradoxes of ambassadorship, “last chance tourism” and greenhouse gas emissions. J. Sustain. Tour. 2010, 18, 337–354. [Google Scholar] [CrossRef]
- Farreny, R.; Oliver-Sola, J.; Lamers, M.; Amelung, B.; Gabarrell, X.; Rieradevall, J.; Boada, M.; Benayas, J. Carbon dioxide emissions of Antarctic tourism. Antarct. Sci. 2011, 23, 556–566. [Google Scholar] [CrossRef]
- Demiroglu, O.C.; Hall, C.M. Geobibliography and Bibliometric Networks of Polar Tourism and Climate Change Research. Atmosphere 2020, 11, 498. [Google Scholar] [CrossRef]
- Lemelin, H.; Dawson, J.; Stewart, E.J.; Maher, P.; Lueck, M. Last-chance tourism: The boom, doom, and gloom of visiting vanishing destinations. Curr. Issues Tour. 2010, 13, 477–493. [Google Scholar] [CrossRef]
- Denstadli, J.M.; Jacobsen, J.K.S. More Clouds on the Horizon? Polar Tourists’ Weather Tolerances in the Context of Climate Change. Scand. J. Hosp. Tour. 2014, 14, 80–99. [Google Scholar] [CrossRef][Green Version]
- Førland, E.J.; Steen Jacobsen, J.K.; Denstadli, J.M.; Lohmann, M.; Hanssen-Bauer, I.; Hygen, H.O.; Tømmervik, H. Cool weather tourism under global warming: Comparing Arctic summer tourists’ weather preferences with regional climate statistics and projections. Tour. Manag. 2013, 36, 567–579. [Google Scholar] [CrossRef]
- Hall, C.M. Will Climate Change Kill Santa Claus? Climate Change and High-Latitude Christmas Place Branding. Scand. J. Hosp. Tour. 2014, 14, 23–40. [Google Scholar] [CrossRef]
- Tervo-Kankare, K. The Consideration of Climate Change at the Tourism Destination Level in Finland: Coordinated Collaboration or Talk about Weather? Tour. Plan. Dev. 2011, 8, 399–414. [Google Scholar] [CrossRef]
- Gomez-Martin, M.B. Tourism Climatology: Past, Present, and Future. Atmosphere 2021, 12, 605. [Google Scholar] [CrossRef]
- Powell, R.B.; Ramshaw, G.P.; Ogletree, S.S.; Krafte, K.E. Can heritage resources highlight changes to the natural environment caused by climate change? Evidence from the Antarctic tourism experience. J. Herit. Tour. 2016, 11, 71–87. [Google Scholar] [CrossRef]
- Tejedo, P.; Benayas, J.; Cajiao, D.; Leung, Y.F.; De Filippo, D.; Liggett, D. What are the real environmental impacts of Antarctic tourism? Unveiling their importance through a comprehensive meta-analysis. J. Environ. Manag. 2022, 308, 114634. [Google Scholar] [CrossRef] [PubMed]
- Li, W.; Li, G.; Dou, Y. Carbon footprint for human activities on Antarctic: A review. J. Earth Sci. Clim. Chang. 2017, 8. [Google Scholar] [CrossRef]
- Dowling, R.K. Tourism in the Antarctic: Opportunities, constraints, and future prospects: Thomas, G. Bauer; The Haworth Hospitality Press, New York, 2001, pp. xiv+275, ISBN 0-7890-1104-2. Tour. Manag. 2003, 24, 345–346. [Google Scholar] [CrossRef]
- Saeporsdottir, A.D.; Hall, C.M.; Wendt, M. Overtourism in Iceland: Fantasy or Reality? Sustainability 2020, 12, 7375. [Google Scholar] [CrossRef]
- Corbett, J.J.; Fischbeck, P. Emissions from Ships. Science 1997, 278, 823–824. [Google Scholar] [CrossRef]
- Hickman, J.; Hassel, D.; Joumard, R.; Samaras, Z.; Sorenson, S.C. Methodology for Calculating Transport Emissions and Energy Consumption; The National Academies of Sciences: Washington, DC, USA, 1999. [Google Scholar]
- Kizielewicz, J. Monitoring Energy Efficiency and Environmental Ship Index by Cruise Seaports in Northern Europe. Energies 2022, 15, 4215. [Google Scholar] [CrossRef]
- Steiner, N.S.; Bowman, J.; Campbell, K.; Chierici, M.; Eronen-Rasimus, E.; Falardeau, M.; Flores, H.; Fransson, A.; Herr, H.; Insley, S.J.; et al. Climate change impacts on sea-ice ecosystems and associated ecosystem services. Elem. Sci. Anthr. 2021, 9, 00007. [Google Scholar] [CrossRef]
- Bialystocki, N.; Konovessis, D. On the estimation of ship’s fuel consumption and speed curve: A statistical approach. J. Ocean. Eng. Sci. 2016, 1, 157–166. [Google Scholar] [CrossRef]
- Yan, R.; Wang, S.; Psaraftis, H.N. Data analytics for fuel consumption management in maritime transportation: Status and perspectives. Transp. Res. Part E Logist. Transp. Rev. 2021, 155, 102489. [Google Scholar] [CrossRef]
- Europa, B. Brochures Bark Europa. Available online: https://www.barkeuropa.com/dynamics/modules/SFIL0200/view.php?fil_Id=3160 (accessed on 15 July 2022).
- Simonsen, M.; Walnum, H.J.; Gössling, S. Model for Estimation of Fuel Consumption of Cruise Ships. Energies 2018, 11, 1059. [Google Scholar] [CrossRef]
- Yüksel, O.; Köseoğlu, B. Regression Modelling Estimation of Marine Diesel Generator Fuel Consumption and Emissions. Trans. Marit. Sci. 2022, 11, 79–94. [Google Scholar] [CrossRef]
- Spinelli, F.; Mancini, S.; Vitiello, L.; Bilandi, R.N.; De Carlini, M. Shipping Decarbonization: An Overview of the Different Stern Hydrodynamic Energy Saving Devices. J. Mar. Sci. Eng. 2022, 10, 574. [Google Scholar] [CrossRef]
- Kruczek, Z.; Kruczek, Z.; Kruczek, M.; Szromek, A.R. Possibilities of Using the Tourism Area Life Cycle Model to Understand and Provide Sustainable Solution for Tourism Development in the Antarctic Region. Sustainability 2018, 10, 89. [Google Scholar] [CrossRef]
- Cajiao, D.; Leung, Y.-F.; Larson, L.R.; Tejedo, P.; Benayas, J. Tourists’ motivations, learning, and trip satisfaction facilitate pro-environmental outcomes of the Antarctic tourist experience. J. Outdoor Recreat. Tour. 2022, 37, 100454. [Google Scholar] [CrossRef]
- REUTERS Economic Downturn Puts Freeze on Antarctic Tourism. Available online: http://archives.dailynews.lk/2010/01/07/wld26.asp (accessed on 2 October 2022).
- Hughes, K.A.; Convey, P. Implications of the COVID-19 pandemic for Antarctica. Antarct. Sci. 2020, 32, 426–439. [Google Scholar] [CrossRef]
- Verbitsky, J. Antarctic tourism management and regulation: The need for change. Polar Rec. 2013, 49, 278–285. [Google Scholar] [CrossRef]
- Kizielewicz, J. Eco-Trends in Energy Solutions on Cruise Ships. Energies 2021, 14, 3746. [Google Scholar] [CrossRef]
- Dawson, J.; Johnston, M.E.; Stewart, E.J. Governance of Arctic expedition cruise ships in a time of rapid environmental and economic change. Ocean. Coast. Manag. 2014, 89, 88–99. [Google Scholar] [CrossRef]
- Kajàn, E. Polar tourism: Human, environmental and governance dimensions. Polar Geogr. 2011, 34, 333–335. [Google Scholar] [CrossRef]
- Olaniyi, E.O.; Prause, G.; Gerasimova, V.; Inkinen, T. Clean Cruise Shipping: Experience from the BSR. Sustainability 2022, 14, 5002. [Google Scholar] [CrossRef]


Publisher’s Note: MDPI stays neutral with regard to jurisdictional claims in published maps and institutional affiliations. |
© 2022 by the authors. Licensee MDPI, Basel, Switzerland. This article is an open access article distributed under the terms and conditions of the Creative Commons Attribution (CC BY) license (https://creativecommons.org/licenses/by/4.0/).