Abstract
The optimized concentration of SF6 gas is the key to maintaining a good insulation performance by GIS equipment. The precise measurements of the SF6 concentration and decomposition byproducts could be used to indicate the remaining GIS insulation level during long-term operations. In this paper, a finite-element simulation model was created to investigate the SF6 gas decomposition and diffusion dynamics. A theoretical analysis and simulation of the overheating fault, i.e., the contact between the GIS disconnect switches, were carried out, followed by an estimation of the SF6 decomposition and diffusion characteristics caused by the local heating faults, based on the calculated flow velocity field and temperature field.
1. Introduction
Compared with the traditional means of electrical transmission, such as overhead lines and underground cables, GIS equipment has advantages, such as a high reliability and flexibility. Statistics show that the accident rate for a GIS is only 16.6~40%, compared to that of the traditional electrical transmission. However, with the extension of service time and application cases, such as new energy power systems, the reported failure of GIS equipment is undesirably increased. The major criterion affecting the insulation performance is the gradual decomposition and deterioration of the SF6 dielectrics and the abnormal heating of the internal equipment, due to a poor contact performance. Due to the uneven and poor contacts that occur during the spring performance, the knife gate mouth, when using the clamping spring fixed tulip contact position, is the most likely area to be affected by the abnormal heating inside a GIS. In addition, the GIS equipment uses a sealed structure; if an accident occurs, it is difficult to locate the fault, potentially leading to a long period of repairs. Consequently, not only are the safety and stable operations of the entire power system threatened, but there are also adverse social impacts, and even significant economic losses [1,2]. Therefore, studies on the GIS equipment’s overheating fault mechanism and diagnosis methods could help to improve the response time, accuracy, and reliability of the GIS equipment in overheating fault diagnoses and ensure the safe and stable operation of the power system.
In recent decades, efforts have been made regarding the investigation of the decomposition characteristics of SF6 gas. Most previous studies were carried out on pure SF6 gas. Infrared spectroscopy was first used in [3] to study the decomposition of SF6 gas in a closed glass tube by introducing a high-temperature copper wire inside the pipe, which indicated that the decomposition temperature of SF6 gas was between 500 °C and 600 °C The thermal stability of SF6 was studied in [4], where it was found that the decomposition product of SF6 gas, i.e., SF4, was detected when the temperature exceeded 1500 K. Recently, the increasing interest in applying GIS equipment has promoted both experimental and simulation works on SF6 gas’ decomposition characteristics. The literature [5] conducted a heat generation simulation study using the casing of the circuit breaker to simulate the decomposition of SF6 gas at different temperatures and humidity levels, which found that the decomposition of SF6 gas that occurs at 350 °C, was mainly SO2, H2S and HF. The greater the humidity, the more violent the decomposition of SF6, and the greater the volume fraction of these byproducts. The Literature [6] simulated the SF6 decomposition products and their volume fractions at different temperatures and humidity and found that SF6 gas is more easily decomposed at a high humidity, but the diffusion characteristics of SF6 and its decomposition products are not involved. In the literature [7], a live detection test of the decomposition products of the GIS equipment was carried out, and no SO2 and H2S components were detected inside the GIS equipment under normal operations. CO components were detected inside more than 50% of the equipment samples, but the test lacked the theoretical and simulation studies to guide the arrangement of the detection points.
At present, traditional diagnosis methods for detecting overheating faults inside a GIS, such as the direct temperature measurement method and non-contact temperature measurement method, cannot identify the exact type of fault inside the GIS equipment, and the fault identification accuracy is low. To realize an early overheating fault diagnosis of the GIS equipment, based on the temperature rises and the SF6 decomposition gas, this paper takes the GIS isolation switch as the testing object. The overheating deterioration mechanism of the GIS isolation cutter contact and the relationship between the contact resistance and the temperature, as well as the basic theory of the SF6 gas diffusion and the influencing factors, were studied using the finite element analysis method. This numerical study of the diffusion characteristics of the SF6 decomposition gas under local superheat conditions can be used as a reference for the determination of the best gas sampling point for the thermal fault diagnosis of physical GIS models.
2. Contact Deterioration and Temperature Rise Characteristics of the Disconnect Switch Contacts
Reliable contact is an important condition to ensure the stable operation of GIS disconnect switches, and the calculation of the contact resistance is the basis for analyzing the temperature field and overheating faults in the GIS disconnect switches. This section first studies the basic structure of the disconnect switch, then analyzes the calculation method of the contact resistance and the temperature rise in the disconnect switch contacts. Finally, the calculated parameters are used as the basis for studying the relationship between the temperature rise and the contact resistance.
2.1. Analysis of the Basic Structure and the Key Parameters of the GIS Disconnect Switches
The GIS switch blade type equipment uses contacts as the plug between the electrical equipment. Due to the elasticity of these contacts, the electrical equipment could move within them when subjected to heat or external forces and movement. These contacts serve as buffers and reduce the damage to the insulator caused by thermal or mechanical stresses [8].
The common forms of GIS contacts include strap contacts, spiral spring contacts and tulip contacts. At present, most of the GIS equipment in operation is equipped with tulip contacts, which are composed of multiple contact pieces surrounded by a spring, with a compact structure and uniform electric field distribution [9]. At the same time, it is mostly used in oilless switches and combined appliances, due to its advantages of having more contact points, a good electrical conductivity, and a high stability. Its typical structural form is shown in Figure 1.
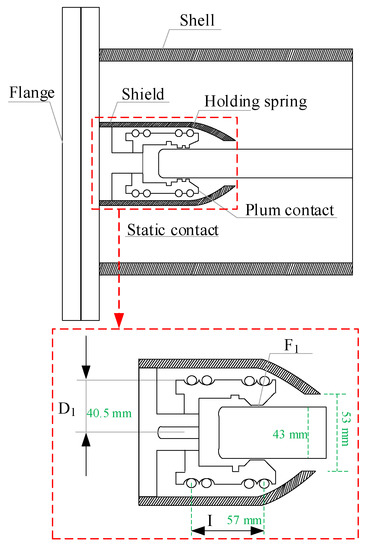
Figure 1.
Structure and design parameters of the tulip contact.
The pressure between the tulip contact finger and the conductor is mainly provided by the clamping spring that surrounds the outside of the tulip contact finger, so the mechanical characteristics of the clamping spring need to be considered when calculating the contact pressure [10].
Let the diameter of the clamping spring be D0 when it is naturally closed, and its diameter be D2 when in operation. The force acting on the clamping spring by the tulip contact is F1, and the reaction force, the natural elongation of the clamping spring, is l0. According to the conservation of energy, the relationships between the above parameters can be described by Equation (1)
where n is the number of contacts, Rm is the outer radius of the spring, K is the spring stiffness coefficient, X is the spring elongation corresponding to a spring diameter of D, and dX is the amount of change in the length of the spring.
Substituting X, dX into the energy balance equation, the expression for the contact pressure of a single contact piece and conductor is found to be
When Rm = D2/2, is the expression of the centripetal force of each spring on each contact finger, when the spring is in operation is:
Since the tulip contacts themselves act as part of the conductive circuit, the spring force acting on a single tulip contact has twice the contact pressure between the tulip contact and the conductor contact, and if there are n clamping springs on the contacts, the contact pressure on a single contact is
where n is the number of springs; FKM is the spring-to-finger pressure; and FK is the finger-to-moving-contact pressure.
2.2. Calculation Method of the Contact Resistance and Temperature Rise of the GIS Disconnect Switch Contacts
GIS isolation contact resistance is the main factor affecting the rise in the temperature of the GIS isolation contacts. To study the effect that the rising temperature has on a GIS isolation contact and the gas decomposition characteristics, the correspondence between the contact resistance and temperature rise of GIS isolation contact must first be evaluated. The contact pressure is the key factor affecting the contact resistance, and the size of the contact resistance and its stability has a significant impact on the temperature rise in the GIS equipment, during long-term operations. Considering the influence of each factor on the contact resistance, the empirical Formula (6) is derived
where Rk is the contact resistance (μΩ), Kc is the material- and processing-related correlation coefficient, FK is the contact pressure (N), and Kc = 100 for the copper–silver-plated–silver-plated contacts. Xc-s is the mutual inductance between a unit length of cable conductor and its sheath.
In actual operation, the change in contact resistance would lead to a change in the rise in temperature of the contact point of the GIS isolation cutter gate. The relationship between the contact resistance and temperature rise is
where ∆Tmax is the maximum value of the local temperature rise; λ is the thermal conductivity of the contact element (λCopper = 383 W/(mK), λSilver = 411 W/(mK)); α is the temperature coefficient of the contact element (αSilver = 0.0038 ppm/°C, αCopper = 0.00393 ppm/°C); and I is the current [11].
When the GIS isolation cutter gate is operated under a certain stable current, Equation (7) shows that the temperature rise in the GIS contact is mainly determined by the size of the contact resistance under the condition that the temperature coefficient α and the thermal conductivity λ of the contact element are certain. This is positively correlated, and the expression is
For the copper–silver-plated–silver-plated material contacts, assuming that the contact pressure is 0.2 N (the smaller the pressure, the looser the contact point, and the greater the contact resistance), Equation (6) shows that the contact resistance can reach 700 µΩ. The literature research [12] shows that, in the case of large loads (load current up to 1200 A), the contact resistance reached 700 µΩ, and the tulip contact–finger contact temperature rises can reach 520 °C, the SF6 decomposition temperature.
3. Diffusion Characteristics of SF6 Gas
The decomposition products of SF6 diffuse within the GIS model until a dynamic equilibrium is reached. The diffusion law of gas should be studied from the microscopic perspective, based on which of the influencing factors of gas diffusion are investigated, and then the natural convection phenomenon that occurs within the closed cavity under the condition of the local heat source, is explored from the macroscopic perspective, in combination with this paper’s research subject.
3.1. Decomposition Properties of the Gases and Their Influencing Factors
Although the chemical nature of SF6 is very stable, in the actual engineering, many factors affect the decomposition of SF6 gas, and its decomposition products also show large differences. The main influencing factor is temperature, which serves as an insulating medium. When local overheating occurs in the GIS isolation knife gate, SF6 works under high-temperature conditions and is prone to chemical reactions with the surrounding electrons. Its chemical equation can be expressed as follows:
where e is the free electron; (SF6) * is the negatively charged particle cluster, i.e., the product of the chemical reaction between SF6 and the surrounding electron e under high-temperature conditions.
Under high-temperature conditions, the charged negative particle cluster is further decomposed into , , SF5, F, and electron e. The products , SF5 and are important signs of the decomposition of the SF6 molecules [13]. The chemical equation for the decomposition of (SF6) * is shown below.
From Equations (9) and (10) under high-temperature conditions, SF6 gas easily reacts with the surrounding ions and produces various kinds of sulfide and fluoride mixed substances.
The solid insulation material in the GIS equipment will react with the SF6 decomposition products to produce SO2 and H2S, etc. Meanwhile, CO, CO2, NO, NO2 and other gases will be produced, due to the cracking of the solid insulation material. The insulation performance of these SF6 gas decomposition and reaction products will be greatly reduced.
Under the threshold temperature for the gas decomposition, according to the literature [14], tests were carried out to study the influence of temperature on the concentration of the decomposed SF6 gas. An alternative current generator was used to heat the GIS isolation switch to make its temperature exceed the threshold temperature for the gas decomposition. A thermal sensor was applied to monitor the temperature rising data in real time and detect the concentration changes of the decomposed gas. According to the test data, the corresponding concentration changes of CO, SO2 and H2S, as the SF6 decomposition products under the overheating conditions increase gradually with the increase of the contact temperature, as shown in Figure 2.
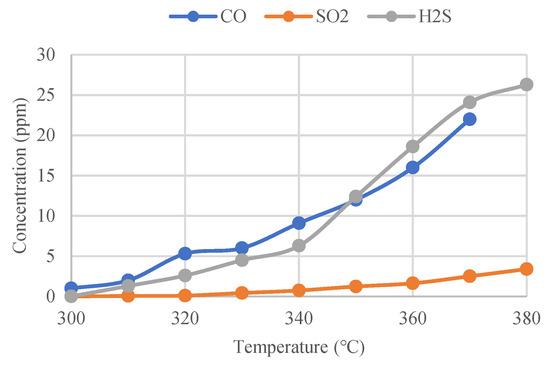
Figure 2.
CO, SO2 and H2S concentrations as a function of temperature.
By comparing Figure 2, the following conclusions can be drawn.
- (1)
- With the increase of the contact temperature, the growth rate of the CO concentration is significantly accelerated. When the contact temperature increases from 320 °C to 330 °C, the CO concentration grows significantly. When the contact temperature reaches 370 °C, the CO concentration approaches 16 ppm.
- (2)
- With the increase of the contact temperature, the growth rate of the H2S concentration also accelerates, but the initial concentration of H2S is smaller than CO; when the contact temperature reaches 350 °C, the concentration of CO is 9 ppm and the concentration of H2S is 13 ppm, and the concentration of H2S is obviously larger than the concentration of CO. Therefore, the concentration of H2S grows faster than that of CO. When the contact temperature reaches 370 °C, the concentration of H2S reaches 23 ppm, which is also higher than that of CO.
- (3)
- The concentration of SO2 increased gradually with the increase of the contact temperature, but always remained at a lower concentration level. When the contact temperature reached 370 °C, the concentration of SO2 was about 2.5 ppm, which is lower compared to CO and H2S.
3.2. The Diffusion Law of Gases and Its Influencing Factors
Gas diffusion can be divided into continuous motion and intermittent motion. The research subject of this paper is mainly the SF6 decomposition products, whose diffusion process is mainly influenced by the flow and temperature fields, and is a kind of continuous forced diffusion. The main theories regarding gas diffusion can be divided into two categories, namely, the gradient transport theory and statistical theory. The gradient transport theory includes Fick’s law and the K theory, and statistical theory includes diffusion with intermittent motion, diffusion with continuous motion (the Taylor diffusion theory) and the Sutton diffusion mode [15,16]. In this paper, we mainly applied gradient transport theory, i.e., Fick’s law and the K-theory.
In 1855, the German A.E. Fick, who proposed the fundamental laws that can describe molecular diffusion, studied the theory of diffusion in the one-dimensional case, with the classical conduction equation
where K is the diffusion coefficient of the gas and is generally in the range of 1 × 10⁻⁴ ~1 × 10⁻⁵ m2/s; is the average value of certain conservative properties within the unit air mass.
In a three-dimensional space, it is more common that the diffusion coefficients are not necessarily equal, but vary, with three spatial coordinates. Their equation is as follows:
In the above equation, Kx, Ky, and Kz are the diffusion coefficients in the x, y, and z directions, respectively; this turns the gas diffusion problem into a problem of solving Equation (9) or (10) under suitable boundary conditions, a theory commonly referred to as the K-theory. When Kx, Ky and Kz are taken as constants, the corresponding equation is Fick’s law. K can be considered a flux that measures a passive property quantity, such as smoke. By definition, this quantity does not affect the kinetics of the gas motion, but simply moves with the gas.
3.3. Investigation of the Natural Convection in a Closed Cavity under the Action of a Local Heat Source
The nature of convection is a macroscopic mechanical motion, which can generally be divided into two categories: forced convection and natural convection. Forced convection is convection caused by external forces, while natural convection is convection caused by the density difference of the fluid, and thus the buoyancy force, which can be caused by the difference in temperature or concentration [17]. In this paper, we focus on convection caused by the temperature and concentration differences in closed walls, which belong to the category of natural convection. Natural convection can be divided into laminar and turbulent flow. When the flow rate is very low, the fluids begin to flow in layers, which is known as the laminar flow. When the flow rate increases, the laminar flow is destroyed, and the fluids mix with each other and make irregular movements; this is turbulent flow. The turbulent and laminar flow states are usually judged by the Reynolds number Re, but for natural convection, the turbulent and laminar flow states are usually judged by the Grashof number Gr and the Rayleigh number Ra. The Re number, Gr number and Ra number are defined as follows:
In the above equation, u is the fluid flow rate; ∆T is the temperature difference; L is the characteristic length; v is the fluid kinematic viscosity; and a is the thermal diffusivity.
This paper mainly focuses on the diffusion of the SF6 decomposition products in the GIS isolation knife gate, under local superheat conditions. Diffusion within the closed cavity, under a local heat source, is mainly affected by the size of the heat source; the size of the cavity also has some influence. The literature [18] shows that the natural convection within the closed rectangular cavity will be related to the flow field inside the cavity and the size of the heat source with a Ra number.
According to the literature [19], the following conclusions can be drawn.
- (1)
- The direction of the fluid movement is the flow to the upper middle, and then separate the flow at the top, and then flow downward after flowing to the inner side of the wall, and the trajectory of this flow is independent of the Ra number and the size of the heat source.
- (2)
- The larger the size of the heat source, the greater the fluid flow rate, the higher the Ra number, the more obvious the effect.
Diffusion in the closed cavity, under the local heat source, where forced diffusion and free diffusion coexist, in the initial stage of the thermal decomposition of the gas, is mainly affected by the fluid motion for the forced convection diffusion, while the free diffusion, caused by the concentration difference is very small and can be ignored; later fluid motion slows down, the free diffusion of the gas needs to be considered.
4. Numerical Simulation of the SF6 Decomposition Gas Diffusion Characteristics under the Local Superheat Conditions
4.1. Analysis of the Multi-Field Coupling Calculation Methods
In this paper, we consider that the coupling between the flow and temperature fields is stronger than the coupling between the electromagnetic and temperature fields, i.e., the flow and temperature fields are calculated simultaneously. In this paper, the indirect coupling calculation method, based on FEM and FVM, is considered in the coupling analysis of the multi-physics fields. According to the calculation flow of eddy field and the flow field-temperature field sequential coupling, FEM is first used for the eddy field analysis to calculate the Joule heat loss and the eddy loss of the physical model, and then the calculated loss is coupled to the fluid field as a heat source. FVM is used for the flow field–temperature field calculations, to finally obtain the flow and temperature field distribution of the physical model and the calculation flow is shown in Figure 3.
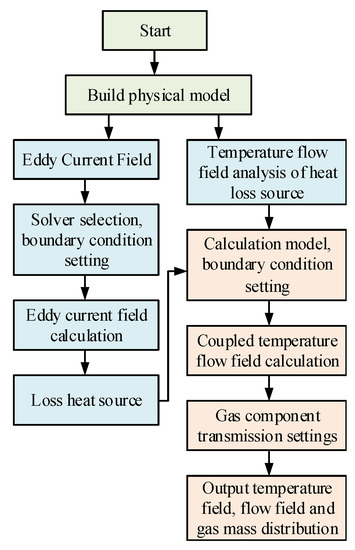
Figure 3.
Flow chart of the indirect coupling calculation of the multi-physical fields.
The main features of the multi-physics field indirect coupling method used in this paper, are as follows:
- (1)
- The indirect coupled analysis method solves each physical field independently. A suitable solution model and a mesh discretization method are used for each field, thus improving the efficiency of the solution.
- (2)
- The indirect coupling analysis is mainly an independent solution, obtained after decoupling the vortex field and the flow field–temperature field, i.e., the solution of the flow field and the temperature field still belongs to the direct coupling analysis, and the solution of the vortex field and the flow field–temperature field causes the number of degrees of freedom to decrease when the flow field and the temperature field are directly coupled to the solution.
4.2. Numerical Modeling Analysis of the SF6 Decomposition Gas Diffusion under the Natural Convection Conditions
When modeling under natural convection, it is necessary to first analyze the boundary conditions of the model and study the parameters related to its solution domain and the division of the mesh, particularly the addition of heat and gas sources to the model, their application in component transport, etc.
4.2.1. GIS Physical Model Results
The GIS physical model includes moving contacts, static contacts, shield, flange, and housing, etc. The model structure is shown in Figure 1. The static contact, shield, flange and housing are all aluminum alloy materials, where the tulip contact finger material is silver-plated copper and the dynamic contact material is purple copper. The sealed cavity is filled with 0.4 MPa SF6 with gas.
Referring to the literature [20] for the tulip contact temperature field simulation, for the geometric model of the tulip contacts, the tulip contacts consist of 16 tulip contacts, and the contact point areas of 15 of them are disconnected so that only one contact point is left for the tulip contacts. The holding spring is ignored for the purpose of the mesh division. In this paper, the contact resistance is equated to a square with adjustable conductivity, and the corresponding conductivity is calculated from the contact resistance for the simulation. The structure of the tulip contact after the simplification is shown in Figure 4.
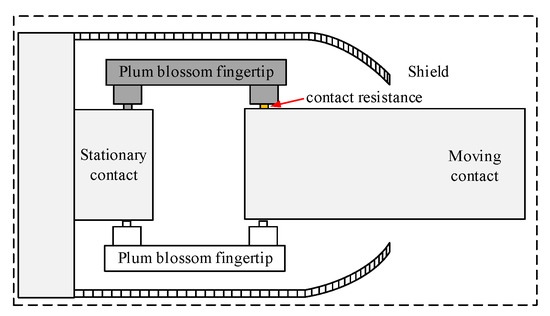
Figure 4.
Detail of the structure of the geometric model of the tulip contact.
4.2.2. GIS Disconnect Switch Flow Field–Temperature Field Solution Domain
For the GIS disconnect switch model, the fluid is divided into air outside the cavity and SF6 inside the cavity. The air domain is the natural convection formed by the cylindrical winding flow inside the large space with the length of the outer-surface diameter of the enclosure, while the SF6 domain is the natural convection inside the closed cavity. The relevant parameters of the flow field calculation are shown in Table 1.

Table 1.
Calculated parameters of the GIS disconnect switch flow field.
For the cylindrical winding flow in the air domain, when the Gr number is less than 6.6 × 10⁷, the flow state of the fluid is laminar, while for the natural convection in a closed cavity, the turbulence started to appear at the cavity boundary when the Ra number reached 107. Since the Ra number exceeded 107, the standard k-ε turbulence model was used for the calculations in this paper.
The radiative heat exchange was adopted as a multi-surface (S2S) radiation model, which could calculate the radiative heat exchange between the diffuse gray surfaces in the enclosed area [21]. As the outer surface of the enclosure is painted and the emissivity is higher than that of the polished metal surface, the emissivity of the outer surface of the enclosure was set to 0.7 and that of the other surfaces to 0.3. On the basis of the above assumptions, the solution domain of the three-dimensional flow–temperature field of the GIS isolation switch is shown in Figure 5.
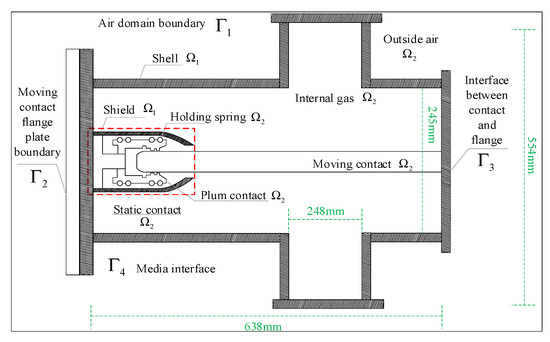
Figure 5.
Schematic diagram of the flow field–temperature field solution domain of the GIS isolation switch.
The solution domain of the flow field–temperature field was divided into fluid Ω1 and solid Ω2, where the fluid domain included the air domain and the 0.4 Mpa gas domain (SF6) inside the chamber. The main boundaries involved in the solution domain of the flow field–temperature field analysis, was the air domain boundary Γ1, the flange boundary Γ2, the dynamic contact–flange intersection Γ3 and the medium interface Γ4. The boundary conditions were the same as those for the flow field.
The solver is a split-solver, i.e., based on pressure, with a SIMPLEC algorithm, the Green–Gauss node-based format for the gradient term, the PRESTO! format for the pressure term, and the second-order windward format for the momentum, the turbulent kinetic energy, the turbulent dissipation and the energy terms, as well as temperature-monitoring points at the shell and contact fingers. Following the initialization of the heat source, the pressure of the gas in the cavity used Patch to create the gauge pressure in the 0.4 MPa cavity, and the flow field–temperature field was solved by completing the above settings.
4.3. Mesh Division and the Component Transport Model Setup
4.3.1. Grid Division
The structure of the GIS disconnects switch model studied in this paper was symmetrical, so a top-down strategy was adopted for the structural meshing of the GIS disconnect switch model, and the specific division was not introduced. The tulip contact division was used as an example, as shown in Figure 6.
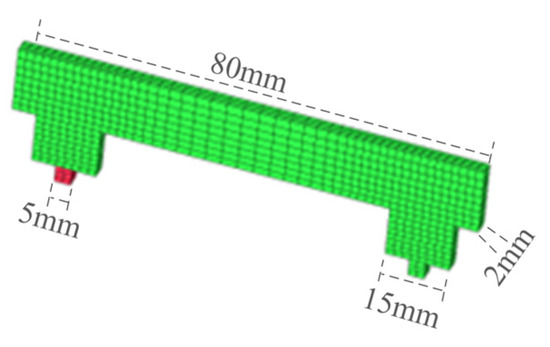
Figure 6.
GIS model plum touch finger.
4.3.2. Setting of the Component Transport Model
To simulate the diffusion law of the SF6 gas decomposition by heat in the GIS isolation switch tank, the above model was used for the simulation analysis and, when the flow field–temperature field was stable, the gas source was added to the original model for the simulation analysis, to simulate the diffusion law of the SF6 gas decomposition products by heat in the GIS isolation switch tank, under local superheat conditions.
The addition of the gas sources was realized by the component transport model in the fluent, which can be used to solve the transport process and chemical reactions. The simulation model established in this paper mainly focuses on the diffusion law of the SF6 decomposition products in the GIS isolation barrier, so the non-reactive component transport model was used for the analysis.
5. Numerical Simulation Results and the Analysis of the SF6 Decomposition Gas Diffusion under the Natural Convection Conditions
5.1. Flow Field–Temperature Field Results and Analysis
The simulation mainly studied the diffusion of several decomposition gases inside the GIS under local superheat conditions, but the diffusion of the gases is closely related to the flow field and temperature field inside the GIS cavity. According to the above model and the simulation design parameters, the velocity cloud diagram of the GIS flow field and the velocity vector diagram of the GIS flow field are shown in Figure 7 and Figure 8, respectively.
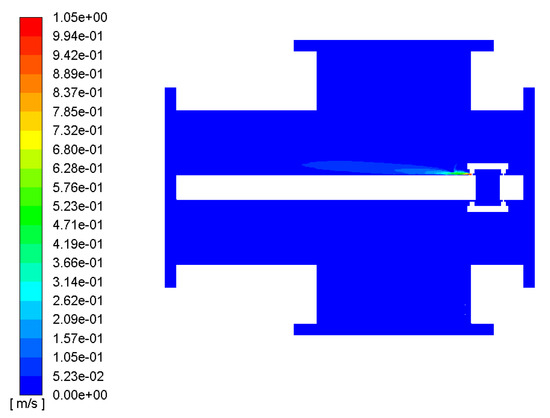
Figure 7.
GIS flow-field velocity cloud.
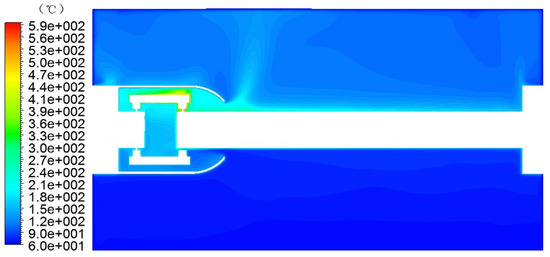
Figure 8.
GIS model simulation temperature field.
The fluid inside the GIS is mainly SF6 gas, as can be seen in Figure 6. In the local fault overheating conditions, the fluid inside the GIS SF6 began to flow; as the temperature rose, the hot gas flowed upward, first from the contact point to the shield, then with the opening of the shield to the upper wall of the GIS interior spurt, and then the airflow reached the inner wall of the GIS cavity in the right part, above the opening of the shield. Then, part of the airflow flowed along the inner wall of the cavity, and part of the gas bounced downward through the upper wall.
Figure 6 also shows that the velocity was highest at the opening of the shield, at about 0.9–1.0 m/s. The fluid velocity between the opening of the shield and the upper wall of the GIS cavity was also high, and when the fluid reached the upper wall of the GIS model cavity, its velocity gradually slowed down, due to the blocking effect of the upper wall of the GIS model cavity.
The temperature field of the GIS model was simulated and obtained, as shown in Figure 8.
As can be seen from Figure 8, the temperature rise inside the GIS cavity was generated from the contact area between the tulip contact finger and the moving contact, and the contact area was equivalent to the heat source, i.e., the simulated local overheating fault area. The temperature of the contact point increased with the increase in the current, heating the fluid around the contact area. The fluid absorbed the heat energy and converted it into rising kinetic energy to flow in the cavity. The heat flow reached the upper wall of the GIS model cavity. As the upper wall was an aluminum alloy wall, the temperature was significantly lower than the airflow temperature, so the airflow transferred some of the energy to the GIS model cavity wall, causing its temperature to slowly rise, while the airflow temperature decreased.
5.2. Diffusion and Distribution of the Gas Components
The simulation results of the flow and the temperature fields were studied and analyzed, and the following simulation results were analyzed for the diffusion and distribution of the gas components. The results of the mass fraction distribution of harmful gases CO, SO2 and H2S at different moments, were selected for the analysis.
5.2.1. Analysis of the CO Mass Fraction Distribution
The distribution of the CO mass fraction at different moments, is shown in Figure 9.
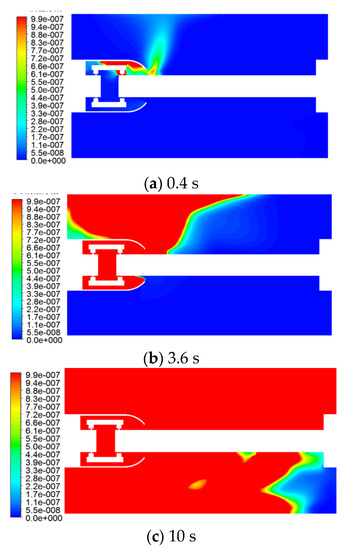
Figure 9.
CO mass fraction variation law with time.
As can be seen from Figure 9, CO gas was generated from the contact part (the connection position between the tulip contact finger and the moving contact), first diffused to the position above the inner shield with the fluid flow in the cavity, and then spurted outward along the opening of the shield, until it reached the upper wall of the inner GIS cavity. The first time it reached the position located above the shield opening, to the right; then, due to the blockage of the upper wall surface, the gas continued to flow along the upper wall surface to the left and right wall surfaces to diffuse, and part of the rebound underwent a downward diffusion. In this process, the diffusion of gas converted from the form of forced convection to the form of natural convection. This forced diffusion is caused by the gas convection, while the natural diffusion is caused by the gas concentration difference. As the gas source was close to the left side of the GIS cavity, the CO gas reached the upper wall surface and the upper left corner of the left flange first, then relied on the concentration diffusion and moved to the right flange of the GIS cavity. The concentration was higher near the upper right corner.
5.2.2. Analysis of the Mass Fraction Distribution of SO2
The distribution of the SO2 mass fraction at different moments, is shown in Figure 10.
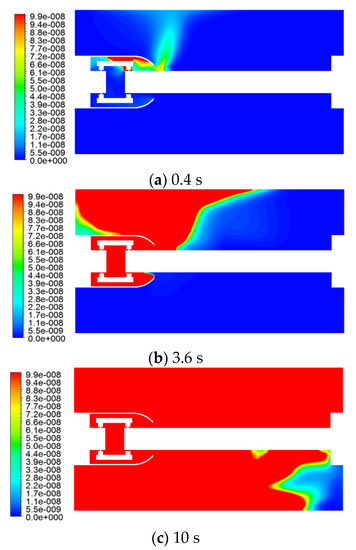
Figure 10.
Variation of the SO2 mass fraction with time.
The concentration of SO2 was also an order of a magnitude lower than that of C and H2S because the gas production was not high. The gas first reached the inner wall surface of the GIS housing at the top right of the shield, and then reached the upper left wall surface of the left flange, which coincided with the flow and temperature fields.
5.2.3. Analysis of the Mass Fraction Distribution of H2S
The distribution of the H2S mass fraction at different moments, is shown in Figure 11.
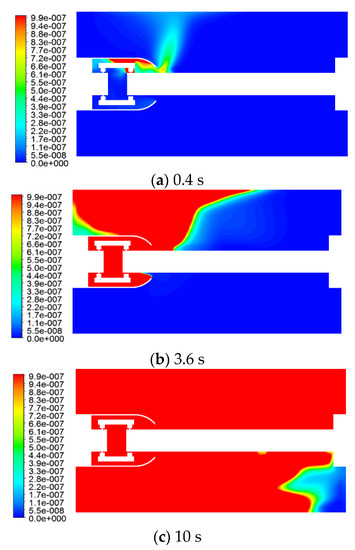
Figure 11.
H2S mass fraction as a function of time.
The H2S gas production was greater, and its concentration was higher. H2S gas first reached the inner wall surface of the GIS housing at the top right of the shield, then reached the upper left wall surface of the left flange, which coincided with the flow and temperature fields.
From the above mass distribution diagrams of the three gases and the simulation results of the flow and temperature fields, the flow and temperature fields had a large influence on the gases. The gas diffusion is basically forced diffusion, caused by fluid flow in the early stage, and then turned into natural convection diffusion, caused by the concentration differences. Its diffusion trend was similar to the distribution of the temperature field and the flow field. The best gas sampling point of the GIS model can be found from the simulation results, providing a basis for the more accurate collection of the decomposition gas of the GIS equipment in actual operation and maintenance.
6. Conclusions
In this paper, a multi-physics field coupled with the numerical simulation of a GIS isolation switch model, was carried out using simulation software. First, the finite element method and finite volume method were studied and the multifield coupling calculation method was analyzed. The model was then numerically modeled, and the calculation principle, solution domain and boundary conditions and the mesh division of the model were studied. Finally, based on the numerical modeling of the SF6 decomposition gas diffusion under natural convection, the model simulation results were obtained, and the results regarding the vortex field, flow field, temperature field and the mass distribution of the SF6 decomposition gas diffusion were obtained and analyzed. The following conclusions can be drawn:
- The vortex field yields the contact resistance as the main heat source, which plays a decisive role in the distribution of the temperature and flow fields; the simulation results of the flow field–temperature field show that the contact point is the heat source, forming a temperature difference that leads to the natural convection within the model.
- CO, H2S and SO2 gases are diffused with the flow field in the early stage. First, the diffusion occurs until the shield opens above the right side of the upper wall of the GIS cavity. Then, due to the blockages, part of the gas along the upper wall continues to flow to the left and right wall diffusion. Part of the rebound downward diffusion, at this time, slowly occurs, causing the fluid flow to rely on the diffusion of the gas concentration difference.
- The gas source is close to the left side of the GIS cavity. The simulation results show that, after the arrival of the gas on the upper wall, the source is first diffused to the upper left corner of the left flange, and then relies on the diffusion concentration to the right wall flange of the GIS cavity. The concentration of gas is higher near the upper right corner.
- Accordingly, the best gas sampling point for the GIS model can be judged, which provides a basis for the more accurate collection of the GIS equipment’s decomposition gases, during the actual operation and maintenance.
Author Contributions
Conceptualization, C.J. and W.L.; methodology, W.Z. and Y.Z.; software, C.J. and Z.T.; validation, C.J. and Z.T. All authors have read and agreed to the published version of the manuscript.
Funding
This research was funded by [National Key R & amp; D Program “key technology of flexible low frequency transmission”], grant number [SQ2021YFB2400121].
Institutional Review Board Statement
Not applicable.
Informed Consent Statement
Not applicable.
Data Availability Statement
Not applicable.
Conflicts of Interest
The authors declare no conflict of interest.
References
- Cui, Y.; Ma, H.; Wang, T. Fault analysis of GIS based on fault tree theory. High Volt. Electric. 2015, 51, 6. [Google Scholar]
- Ning, Y.; Sun, H.Y.; Zhang, W.; Lu, B.; Ge, D. Analysis of overheating caused by connection gaps between GIS high-voltage bus segments. J. Electr. Eng. Technol. 2017, 32, 8. [Google Scholar]
- Camilli, G.; Gordon, G.S.; Plump, R.E. Gaseous Insulation for High-Voltage Transformers [includes discussion]. Trans. Am. Inst. Electr. Eng. Part III Power Appar. Syst. 1952, 71, 513. [Google Scholar] [CrossRef]
- Dervos, C.T.; Vassiliou, P.; Mergos, J.A. Thermal stability of SF6 associated with metallic conductors incorporated in gas insulated switchgear power substations. J. Phys. D Appl. Phys. 2007, 40, 6942. [Google Scholar] [CrossRef]
- Wang, Y.; Li, L.; Yao, W. Volume fraction and characteristics of SF6 gas decomposition products during simulated overheating faults in electrical equipment. High Volt. Electron. 2011, 47, 62–69. [Google Scholar]
- Wang, X.P.; Xiao, W.; Hu, M.Y.; Deng, Y. Classification of GIS insulation deterioration trend based on SF6 decomposition product fusion judgment. High Volt. Technol. 2016, 42, 7. [Google Scholar]
- Sun, G.; Guan, X.; Jin, X.; Xie, Z.; Kong, L. Analysis of overheating faults in bus joints of gas insulated switchgear based on multi-field coupling calculation. High Volt. Technol. 2014, 40, 3445–3451. [Google Scholar]
- Chen, Q.; Li, Q.M.; Cong, H.X.; Xing, J. Online monitoring technology of GIS disconnect switch contact temperature based on multipoint distributed fiber grating. J. Electr. Eng. Technol. 2015, 9, 298–306. [Google Scholar]
- Feng, Y.; Qi, Y.; Lan, J.; Zhang, H.; Yang, W.Y. Analysis of electrical contact performance of two different structures of tulip contacts. High Volt. Electron. 2022, 58, 6. [Google Scholar]
- Peng, H.; Wu, L.; Guan, X.Y.; Dong, Z.; Shen, Q.Y. Numerical calculation and analysis of transient temperature rise of 1250 A plug-in tulip contact based on field-coupled finite elements. High Volt. Electron. 2020, 56, 8. [Google Scholar]
- Zhang, S.L. Research on the Relationship between Contact Resistance and Temperature Rise of GIS; North China Electric Power University: Baoding, China, 2016. [Google Scholar]
- Chen, T.X.; Fang, X.L.; Su, X.Y.; Liu, T. Experimental research on application of memory alloy spacer to power device security and energy saving. Eng. J. Wuhan Univers. 2014, 47, 494–501. [Google Scholar]
- Dakin, T. Thermal Aging of Dielectric Gas. In Gaseous Dielectrics II; Christophorou, L.G., Ed.; Pergamum Press: Oxford, UK, 1980; pp. 283–293. [Google Scholar]
- Fan, Q. Development of Experimental System and Experimental Methodology for Superheat Decomposition of Sulfur Hexafluoride Gas; Chongqing University: Chongqing, China, 2013. [Google Scholar]
- Wu, J.; Wang, Z.B.; Lv, H.; Sun, S.; Wang, Q. Calculation and experimental study of GIS temperature rise considering the influence of airflow field. High Volt. Technol. 2020, 9, 815–823. [Google Scholar]
- Chen, X.L.; Zhao, T.C.; Chen, L.C.; Yao, Q.; Miao, Y.L.; Cao, Z.Q. Correlation characteristics of local overheating fault degree and SF6 decompositions in GIS equipment. High Volt. Electric. 2018, 54, 117–123. [Google Scholar]
- Tang, J.; Yang, X.; Yang, D.; Yao, Q.; Miao, Y.; Zhang, C.; Zeng, F. Using SF6 Decomposed Component Analysis for the Diagnosis of Partial Discharge Severity Initiated by Free Metal Particle Defect. Energies 2017, 10, 1119. [Google Scholar] [CrossRef]
- Xu, Z.; Min, J. Effect of heat source size on natural convection in rectangular cavity. Hydrodyn. Res. Prog. 2006, 21, 730–734. [Google Scholar]
- Moench, S.; Dittrich, R. Influence of Natural Convection and Volume Change on Numerical Simulation of Phase Change Materials for Latent Heat Storage. Energies 2022, 15, 2746. [Google Scholar] [CrossRef]
- Zhang, S.; Zhang, L.; Pan, X.M. Numerical simulation analysis of tulip contact temperature field based on virtual material method. South. Power Grid Technol. 2020, 14, 7. [Google Scholar]
- Saber, H.H.; Yarbrough, D.W. Advanced Modeling of Enclosed Airspaces to Determine Thermal Resistance for Building Applications. Energies 2021, 14, 7772. [Google Scholar] [CrossRef]


Publisher’s Note: MDPI stays neutral with regard to jurisdictional claims in published maps and institutional affiliations. |
© 2022 by the authors. Licensee MDPI, Basel, Switzerland. This article is an open access article distributed under the terms and conditions of the Creative Commons Attribution (CC BY) license (https://creativecommons.org/licenses/by/4.0/).