Abstract
Most cathode materials for Li-ion batteries exhibit a low electronic conductivity. Therefore, a considerable amount of conductive additives is added during electrode production. A mixed phase of carbon and binder provides a 3D network for electron transport and at the same time improves the mechanical stability of the electrodes. However, this so-called carbon binder domain (CBD) hinders the transport of lithium ions through the electrolyte and reduces the specific energy of the cells. Therefore, the CBD content is an important design parameter for optimal battery performance. In the present study, stochastic 3D microstructure modeling, microstructure characterization, conductivity simulations as well as microstructure-resolved electrochemical simulations are performed to identify the influence of the CBD content and its spatial distribution on electrode performance. The electrochemical simulations on virtual, but realistic, electrode microstructures with different active material content and particle size distributions provide insights to limiting transport mechanisms and optimal electrode configurations. Furthermore, we use the results of both the microstructure characterization and electrochemical simulations to deduce extensions of homogenized cell models providing improved predictions of cell performance at low CBD contents relevant for high energy density batteries.
1. Introduction
Due to their outstanding energy and power density, Li-ion batteries are widely used in portable electronic devices and electric vehicles. Nowadays, they usually consist of a graphite anode, a polymer-based separator and a cathode made of a transition metal oxide, often nickel-manganese-cobalt oxide (NMC). However, the electronic conductivity of NMCs is generally low [1] and even decreases with increasing lithium content [2]. To improve the electronic conductivity on electrode scale, conductive additives are added during fabrication. These additives are usually carbon-based and form a network for electron transport in the electrode layer [3]. To ensure an electronic conductivity that exceeds the ionic conductivity of the carbonate-based liquid electrolytes, just a few weight percent (wt-%) of carbon black is sufficient. Besides the active material (particle diameter ≈ 6–20 m) and conductive carbon (particle diameter nm), a polymeric binder is added to the electrode formulation. The binder improves mechanical stability in the electrode layer [4] and adhesion to the current collector [5,6]. The conductive additives and binder form a mixed microporous phase (carbon binder domain, CBD) during the processing steps, whose individual components are difficult to resolve with tomographic imaging techniques. However, the 3D morphology of the CBD can have a significant influence on the transport within the pore space and the active surface of the electrode [7,8,9,10]. The great importance of CBD for the performance of Li-ion batteries has led to several publications in recent years which have investigated the effect of the CBD morphology and spatial distribution on electrode properties [7,10,11,12,13,14,15,16,17]. It has been shown that the production process has a significant effect on the morphology and spatial distribution of the CBD. For instance, harsh drying conditions can cause binder migration to the electrode surface causing performance losses [8].
The central point is that the lengths of lithium ion transport pathways in the electrode layer increase with increasing CBD content amplifying transport limitations in the electrolyte [18]. Especially at high current densities, this effect reduces the performance of the battery cell [19]. Characteristic measures of elongated transport pathways are the effective and geodesic tortuosities. The effective tortuosity can be determined experimentally using impedance spectroscopy, but also based on transport simulations on electrode microstructures obtained by various imaging techniques or virtual structure generators. The geodesic tortuosity, in turn, quantifies the lengths of shortest transport pathways through the pore space. This concept can also be extended to take the inner porosity of the CBD into account [20].
The effect of the CBD on the conductive network is much less investigated [21,22]. As long as the CBD content is high, the conductive additives ensure an effective electronic conductivity exceeding the effective ionic conductivity of the electrolyte within the electrode. Under these conditions, electron transport is not limiting battery performance. Moreover, variations of the electronic conductivity of cathode active material (CAM) due to changes in lithium concentration during charge and discharge are negligible. However, in state-of-the art commercial cells, the CBD content is often reduced to only a few volume-percent (vol-%), which prevents the formation of a percolating 3D CBD network for electron transport. In this case, electric current also has to pass through the CAM and its conductivity influences the effective conductivity of the electrode. As a result, the effective electronic conductivity of the electrode also depends on the state of charge (SoC), and corresponding correlations of CAM conductivity need to be considered.
Microstructure-resolved electrochemical simulations have the advantage that the actual morphology of the electrode as well as the shape and size distribution of the constituents is explicitly considered [23,24,25,26]. Moreover, transport or thermodynamic parameters can be assigned to each material depending on the local conditions such as lithium concentration or temperature. Therefore, this approach is very accurate and provides detailed information on the influence of local inhomogeneities. Homogenized models, such as the well-known Doyle–Fuller–Newman or pseudo-2D (P2D) model [27], can be derived by averaging over a representative volume element. A significant advantage of these models is their computational efficiency allowing for fast parameter and optimization studies. The resulting constitutive equations contain characteristic properties of the porous electrodes such as the porosity, specific surface area or the representative particle diameter. Consequently, the resulting solutions, such as concentration or potential fields, are average values in the representative volume element and local fluctuations are neglected [28,29]. Moreover, additional correlations are needed in homogenized models to link structural properties and effective transport parameters. The Bruggeman correlation is a well-known example which has been used extensively to link effective transport in the electrolyte to the electrode porosity [30]. The Bruggeman exponent is typically adjusted to match the effective tortuosity or effective ionic conductivity, respectively. Often, a similar correlation is also applied for the effective electronic conductivity. However, sub-models or correlations for the effective electronic conductivity, which also consider the SoC dependence at low CBD contents, are barely reported in the literature.
In the present paper, we address this gap by combining simulation-based and data-driven techniques which have been individually calibrated and validated against experimental data [19,31,32]. First, we use a stochastic 3D microstructure generator [31] to generate NMC622 cathodes with varying density, particle size distribution, thickness and CBD content. This large set of virtual but realistic electrode microstructures is analyzed using statistical methods and numerical simulations. The resulting consistent set of effective transport parameters for both ionic and electronic transport is valuable input for homogenized models facilitating efficient but realistic optimization studies. Moreover, we perform microstructure-resolved electrochemical simulations on the exact same electrode structures to correlate structural properties with electrochemical performance [33]. The simulations give detailed insights on concentration and potential distributions in the electrode allowing for deducing guidelines for electrode development. Additionally, the simulations can be regarded as benchmark for extended homogenized cell models. In the present study, special focus is set on the development of models for the effective electronic conductivity. All additional parameters are determined by computationally efficient weighted geodesic tortuosity calculations. Therefore, this work provides interesting insights in the analysis and optimization of Li-ion battery electrodes and additionally presents improved and efficient tools for the development of electrode architectures leading to an improved performance of the cell.
The paper is structured as follows: We start with a description of our simulation methodology and workflow. Methods for the generation and characterization of virtual microstructures are presented in Section 2. The electrochemical models including submodels for the effective electronic conductivity and model parameters are introduced in Section 3. The results of our simulation study are presented in Section 4 including a discussion of the microstructure characterization by means of weighted geodesic tortuosity, microstructure-resolved simulation studies and an evaluation of the extended P2D model. Additional graphs and data can also be found as Supporting Material.
2. Generation and Characterization of Electrode Microstructures
This section deals with the generation of virtual but realistic 3D microstructures. In particular, we first describe the simulation of the CAM phase followed by the model for the spatial distribution of the CBD. Next, we describe methods for characterizing the three-phase cathodes by means of effective conductivities and weighted geodesic tortuosity.
2.1. Stochastic 3D Microstructure Modeling of the Active Material
In a first step, we use a calibrated stochastic 3D microstructure model to simulate the system of CAM particles. More precisely, the simulation of the active material phase is carried out by means of the stochastic modeling framework described and validated in [31], where the underlying model parameters are calibrated to image data considered in [20]. For convenience, we summarize the main ideas in the following. At first, a potentially overlapping system of spheres is generated, which models the locations and sizes of the CAM particles. For this purpose, the radii of the spheres are drawn from a Gamma distribution until the target volume fraction of the CAM is matched. These spheres are placed at random inside the sampling window. In the next step, the force-biased collective rearrangement algorithm described in [34,35] is used to remove the overlap. Afterwards, each sphere is replaced by a (typically) non-spherical particle, whose size corresponds to the size of the underlying sphere. The shape of the particle is described by a radius function, which is represented by a truncated series of spherical harmonics [36]. The simulation of CAM particles represented in this way is carried out by means of Gaussian random fields on the sphere using the angular power spectrum described in [26]. This stochastic microstructure model is able to generate virtual but realistic systems of CAM particles composed of NMC.
In the present paper, three different volume fractions of the CAM (50%, 60% and 70%) are considered. In addition, for each of these volume fractions, the particle size distribution is varied. This leads to small (), medium () and large particles (), where denotes the volume-based median of diameters of CAM particles. The latter is also called volume-based -diameter. Note that the simulated CAM particles are discretized using a voxel size of , where periodic boundary conditions are applied in x-, y- and z-direction, respectively. For each combination of volume fraction and particle size distribution, three realizations are generated, resulting in a total of 27 active material structures.
2.2. Conductive Additive and Binder Model
In a previous work, we concluded that inserting the CBD at contact points of CAM particles leads to realistic spatial distributions of CBD given the CAM phase [19]. Realistic means here that electrochemical simulations reproduce the corresponding experimental measurements sufficiently well. Thus, the same approach for distributing the CBD in the electrode is applied in the present study. Technically speaking, a distribution close to contact points of CAM particles can be achieved by morphological closing with a spherical structuring element [37]. However, in the present study, the radius of the spherical structuring element is chosen differently in order to vary the overall volume fraction of the CBD between 0 and 36 vol-%. Note that each voxel classified as CBD is also assumed to have an inner microporosity of 50% [14,38].
The limit of 0% CBD is a rather theoretical case, which would lead to a low mechanical stability of the electrode. Still, this case also has some practical relevance as CBD contents are reduced in state-of-the-art high energy cells and often completely omitted in solid-state batteries. This method is applied to the different active material structures created using the stochastic microstructure model described above. In Figure 1, two renderings of an electrode with virtually distributed CBD are shown. The two electrodes only differ in the volume fraction of CBD.
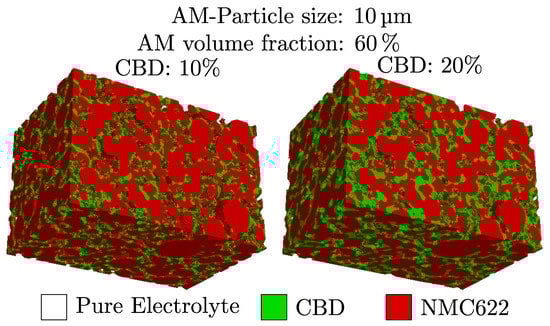
Figure 1.
The spatial distribution of CBD for two different target volume fractions of CBD.
2.3. Effective Conductivity and Tortuosity Calculations
The effective ionic and electronic conductivity are decisive properties of the porous electrodes. They are determined by both the bulk properties of the materials as well as the tortuosities of the transport pathways. The corresponding correlations are often given by
in the electrolyte () and solid phase (), respectively. Here, and denote the intrinsic conductivity and the volume fraction of phase i. The tortuosity of phase i, denoted by , can either be determined by experiments [39] (), geometrically () or based on numerical simulations (). Note that different concepts of tortuosity result in different values of the effective conductivity of the considered phase, see, e.g., [16,39], and we will analyze differences in the predictions of the computational approaches in Section 4.1. Similar relationships to the one given in Equation (1) are also used to calculate the effective diffusion coefficient of lithium ions in the electrolyte. For composite materials with multiple ions, the conductivity of each phase affects the overall effective conductivity of the composite. In our calculations, we take into account the effect of the porous CBD on ion and electron transport, respectively. Additionally, both the conductivity of the electrolyte and the conductivity of the CAM depend on the local lithium concentration. In the present study, we calculate the effective electronic conductivity either using a numerical or geometric approach and conductivities are denoted by and , respectively. The effective ionic conductivity is in all cases calculated using the numerical approach.
2.3.1. Numerical Conductivity Simulations
To determine the effective ionic and electronic conductivity of the virtual microstructures, we solve the steady-state Poisson equation on our computational domain with local variations in the isotropic conductivity depending on the material. Note that the conductivity of the electrolyte and the CAM additionally depends on the local lithium concentration . The computations are carried out for the electrodes through-plane direction applying a constant current density as a boundary condition.
Electrolyte—The ionic conductivity in the electrolyte phase is computed assuming a local effective ionic conductivity of the CBD of 12%. This value corresponds to a tortuosity within the CBD of 3.06 assuming a porosity of . Generally, the conductivity in the electrolyte phase depends on the local concentration of lithium ions. For the computation of effective ionic conductivity, we assume a homogeneous concentration of Li ions at the initial concentration of 1M, which is in contrast to the inhomogeneous concentration distributions during battery operation. Thereby, we only consider geometric effects due to the distribution of the electrolyte in the pore space and CBD.
Solid phase—In the solid phase, the Li content affects the electronic conductivity of the CAM, and the electronic conductivity of the CBD is constant. The effect of Li content on CAM bulk conductivity is shown in [2] The CBD effective electronic conductivity is assumed to be 10 S/cm. We compute the overall effective electronic conductivity of the solid phase for different Li contents in the CAM. Additionally, we separate contributions of the CAM and CBD network to the effective electronic conductivity by computing the effective conductivity and corresponding tortuosity of the two phases individually.
2.3.2. Weighted Geodesic Tortuosity and Relative Path Length
A more formal approach to describe morphological effects on conduction processes consists of quantifying the lengths of shortest transportation paths by the so-called geodesic tortuosity. As described in [20], it is possible to extend the concept of mean geodesic tortuosity of two-phase materials, formally introduced in [40], to three-phase materials, where the lengths of transportation paths through two transport phases are differently weighted, and no transport takes place in the third phase. For computations on the generated virtual microstructures, we use Dijkstra’s algorithm to determine the shortest weighted paths from 3D image data. More precisely, a phase is either completely blocking or we assign a weighting factor to it, which describes the factor by which the path length through voxels belonging to this phase is multiplied. In the present paper, we set and {1, 10, 100, 1000, 2173, 16,891, 208,312}. Note that the last three values of correspond to the ratio of the SoC-dependent effective conductivity of the active material and the effective conductivity of the CBD () for a SoC of 50%, 70% and 90%, respectively.
3. Electrochemical Simulations
3.1. Microstructure-Resolved Electrochemical Simulations
For electrochemical simulation of lithium ion batteries, we use the research branch of the Battery and Electrochemistry Simulation Tool (BEST) (https://www.itwm.fraunhofer.de/best, accessed on 27 July 2022) developed in a collaboration between Fraunhofer ITWM Kaiserslautern and the DLR Institute of Engineering Thermodynamics. This simulation tool is a finite volume implementation of a thermodynamically consistent multiphysics model and directly uses 3D microstructure data as simulation domain. Each discretization volume can be assigned unambiguously to current collectors, CAM, CBD, separator and electrolyte defining the computational grid. The simulations are able to provide the temporal and spatial distribution of Li concentration, potential, and temperature. A summary of the governing equations for the isothermal simulations presented in this work is given in Table 1, and a detailed derivation of the model is provided in [23]. Here, we give a short summary of the physical processes which are taken into account and describe extensions of the model relevant for this study.

Table 1.
List of governing equations used for the spatially resolved electrochemical simulations. The effective transport parameters in the CBD and separator are calculated according to Equation (12).
The lithium transport in the different phases is described through mass balance equations and the charge transport through charge conservation equations. The main difference between the bulk regions (electrolyte and CAM in Equations (2)–(5)) and the effective regions (separator and CBD in Equations (6)–(10)) is the description of the transport through effective parameters. In this work, we focus on the impact of the CBD on the electronic conductivity of the electrode and the ionic transport through the pore space. In this work, we assume that the CBD is microporous. Explicitly including the microporosity of the CBD in the microstructure-resolved simulations poses significant computational challenges due to the large differences in relevant length scales.
In our current approach, we treat the CBD as a homogenized medium including both the transport of electrons in the carbon particles as well as lithium ions in the electrolyte within the micro pores [41]. We assume that the homogenized CBD phase consists of 50 vol-% solid phase (conductive additive and binder), which is totally soaked (50 vol-%) with liquid electrolytes. Hence, the transport coefficients in the CBD are adjusted to describe the effective transport in this homogenized media. The effective parameters depend on the bulk parameters, the tortuosity and the volume fraction following the formulation given in Equation (1):
with , the domain and the phase . For instance, the effective diffusion coefficient within the electrolyte in the CBD region is therefore given by
Additionally, the CBD reduces the active surface area at the contact between active material and electrolyte. We assume that the reduction of surface area is proportional to the porosity of the CBD.
The interface conditions and reaction models between the different phases are listed in Tables S3 and S4 in the Supplementary Materials.
3.2. Homogenized Electrochemical Model
Newman et al. developed a pseudo-2D (P2D) model for the simulation of Li-ion batteries based on porous electrode and concentrated solution theory [27,42]. For the derivation of the constitutive equations using homogenization approaches, we refer to the work by Newman et al. [27,42]. The resulting set of equations is summarized in Table 2. In this article, we limit the discussion to the differences and challenges compared to the microstructure-resolved simulation approach.
Table 2.
List of governing equations used for the homogenized electrochemical simulations.
The transport of lithium ions by migration and diffusion in the electrolyte is described by the volume-averaged material balance. Note that, similar to the constitutive equations in the CBD, the storage term is corrected by the electrolyte volume fraction. The flux of ions is calculated using effective transport parameters taking into account both the effect of the tortuous transport pathways in the pores and CBD. Additionally, the source term describes the de-/intercalation of lithium ions, where is the electrode specific surface area.
In the active material, the storage and transport of lithium are modeled in spherical particles with representative diameters. This is a major assumption reducing the computational complexity tremendously. Transport of electrons in the solid phases is described using the charge balance in Equation (16), where is the effective conductivity of the network of solid particles including active material and CBD.
Despite the popularity of the P2D model, it has several weaknesses compared to microstructure-resolved approaches due to the assumptions pointed out above, such as (i) The homogenization approach neglects inhomogeneities in the active material and CBD distribution; (ii) Representative particles neglect variations in shape and size of the active material; (iii) The effective electronic conductivity of the electrode does not depend on the SoC. These weaknesses can be alleviated by providing additional information of the microstructure. In this work, we use numerical simulations and extended geometrical analysis to provide input for the effective transport parameters of the electrolyte and the effective electronic conductivity.
3.3. Model for the Effective Electronic Conductivity
In the standard P2D models, the electronic conductivity is assumed to be constant during the simulations. For a percolating CBD network, this is a reasonable assumption. However, at low CBD contents, the influence of CAM conductivity will become prominent, and even more so, if the conductivity of the active material is SoC-dependent and exhibits significantly smaller values compared to the CBD conductivity. NMC is a material that shows a reduced electronic conductivity for high lithium contents [2]. In this paragraph, we provide a microstructure informed yet simple model improving predictions at low CBD contents. All additional parameters are determined by computationally efficient weighted geodesic tortuosity calculations.
Figure 2 gives a schematic depiction of pathways for electron transport depending on CBD content. Generally, the overall effective conductivity of the solid phase is given by the inverse of the resistivity
where , , and are the resistivity, geodesic tortuosity and volume fraction of the solid phase. The electronically conductive phase of the electrode consists of the CAM and CBD. Hence, the contribution of each phase to the overall resistivity is path-dependent. Moreover, the conductivity of the CAM depends on the SoC, and the resistivity is not a constant value.
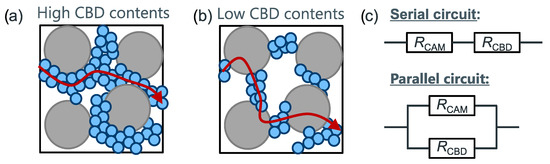
Figure 2.
Schematic depiction of current pathways at low (a) and high (b) CBD content; (c) equivalent circuits of the serial and parallel connections modeling the effective solid phase conductivity.
At high CBD contents, electrons will mainly take the path of lowest resistance through the CBD, similar to a parallel connection of the CBD and CAM network. However, at low CBD contents, a percolating network cannot be formed and electrons are forced to, at least partially, travel through the CAM. This is the relevant case for high energy density batteries. Therefore, we limit our discussion to the resistance model represented by a serial connection of CBD and CAM.
Consider a fixed electronically conducting point at the boundary of the electrode, i.e., a point that is located either at the separator or the current collector and belongs to CAM or CBD. Then, we consider the shortest electronically conducting path (with respect to the weighted tortuosity introduced in Section 2.3.2) through the electrode starting at the considered point, see the sketch in Figure 2. The length of such a shortest path determines its contribution to the electrode resistance. The resistance of each material can be written as
where is the cross section of the phase orthogonal to the main transport direction of the electronically conducting phase, i.e., in the union of CAM and CBD. Using and approximating by with A being the cross section of the representative volume element, the electrode resistivity is given by
The relative path length in the CBD and CAM with , as well as the overall geodesic tortuosity of the solid phase can be efficiently computed using the geometrical scheme presented in Section 2.3.2.
3.4. Parameters and Operation Conditions
In this paper, we investigate the effect of CBD content on performance in virtual half-cells. The half-cells consist of a lithium metal anode, glass-fiber separator (thickness 100 µm), and virtually generated cathodes following the procedure described in Section 2. The thickness of the virtual cathodes was adjusted to a capacity of 6 mAh/cm depending on the CAM content. The electrode thicknesses for the respective active material content are 138 µm for 50 vol-%, 114 µm for 60 vol-% and 98 µm for 70 vol-% CAM. Electrochemical performance was assessed by galvanostatic discharge simulations with current densities between 1 and 12 mA/cm. The lower and upper cut-off voltage have been chosen to be 3 and 4.3 V, respectively.
Material parameters are taken from our previous work [32]. There, we reported good agreement with the experimental data at different current densities and take that as a starting point for our simulation study. Note that the diffusion coefficient and conductivity of the CAM depend on the local lithium concentration in the CAM. Moreover, electrolyte parameters depend on the local concentration of lithium ions in the electrolyte. The corresponding correlations and parameters can be found in the supplementary material appended to [32].
4. Results and Discussion
The goal of our study is to establish the link between structural properties and electrochemical performance. We specifically focus on the influence of CBD for different CAM contents and particle sizes. This link is provided through 3D microstructure-resolved simulations allowing for analysis of the performance limiting processes. Moreover, we propose an extension of the commonly used P2D model to improve simulation predictions at low CBD contents.
Therefore, this section is divided into three parts focusing on the effect of CBD on ionic and electronic conductivity (Section 4.1), electrochemical performance (Section 4.2), and evaluation of the extended homogenized cell model (Section 4.3).
4.1. Effect of CBD on Ionic and Electronic Conductivity
In this section, we investigate the effect of CBD on the effective ionic and electronic conductivity of the virtual electrodes.
4.1.1. Effective Electronic Conductivity
In general, the electronic conductivity of the active material depends on the local lithium content or state of charge (SoC), respectively. Amin et al. [2] measured SoC dependent conductivities for NMC 532 and report an exponential decrease at high Li contents (cf. Figure 3a). However, the effective electronic conductivity on electrode scale is also determined by the CBD network. First, we investigate the influence of CBD on the effective electronic conductivity on electrode scale using the direct numerical simulation approach outlined in Section 2.3.1. In a second step we compare these effective conductivities to results of the conductivity model introduced in Section 3.3.
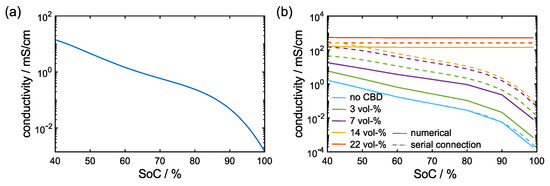
Figure 3.
(a) Dependence of the electronic conductivity of NMC on the SoC [2]; (b) effective electronic conductivity of an electrode with 50 vol-% CAM content, µm particle diameter and varying CBD content. Solid lines represent numerical conductivity simulations () and dashed lines are a result of the conductivity model based on the geodesic tortuosity computations (, Equations (20) and (22)).
Numerical simulations—Representative results of the effective conductivity simulations are given by the solid lines in Figure 3b for a microstructure with 50 vol-% CAM content and 14 µm particle diameter. In the microstructures without any CBD, the effective conductivity shows the same trend as the bulk NMC conductivity. Already small amounts of CBD improve the effective electronic conductivity. Still, a drastic decrease in conductivity can be observed at high SoC. Above 5 vol-% CBD, this feature is less pronounced and a constant conductivity of about 0.01 mS/cm is observed at high SoC. This indicates that an extended CBD network is established, which significantly affects the effective electronic conductivity. Higher CBD contents further improve the effective electronic conductivity. Remarkably, even at low SoCs, i.e., comparatively good conductivity in the CAM, the conductivity still increases by more than two orders of magnitude. At this point, the current flows almost exclusively through the CBD and the dependence on the SoC is negligible.
In the literature, a broad range of values for the electrical conductivity of the CBD is reported [43,44]. Therefore, we present additional results using a lower CBD conductivity of 2 S/cm in Figure S2 in the Supplementary Materials. Deviations to the computed effective conductivity values with 10 S/cm CBD conductivity are minor at low CBD contents. Differences become prominent only at high CBD contents once a percolating CBD network is established.
Geodesic tortuosity calculations—Figure 4a schematically shows transport pathways for electrons depending on the conductivity ratio between CAM and CBD. At a ratio close to unity, electrons choose their way through the CAM and CBD with equal probability. The corresponding path is also the shortest geometric path through the solid phase network. However, with increasing conductivity ratios, the electrons preferentially take the route through the CBD with higher conductivity. As a consequence, the relative path length in the CAM is reduced resulting in a longer overall shortest preferential path through the electrode structure. This is also demonstrated in the graphs in Figure 4b,c showing the geodesic tortuosity and relative CAM path length , respectively. At low conductivity ratios, the geodesic tortuosity in Figure 4b is close to one and then increases significantly with increasing conductivity ratio, i.e., decreasing CAM conductivity. This reflects the increase in shortest preferential path length through the solid phase associated with a decrease in the relative path length through the CAM as shown in Figure 4c. At low CBD contents, the tortuosity increases significantly and reaches an upper limit at conductivity ratios larger than 10. At high CBD contents, the overall tortuosity or preferential path length decreases. Moreover, it is constant already at small conductivity ratios indicating a percolating CBD network. In all cases, the tortuosity and path length are constant at the conductivity ratios relevant during battery operation. Therefore, we neglect the SoC dependence of the geodesic tortuosity and relative path length in calculations of the effective conductivity using Equation (22).
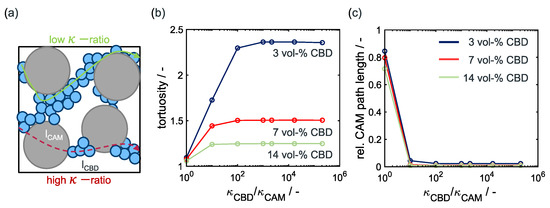
Figure 4.
(a) Schematic depiction of current pathways in an electrode with low CBD content. Weighted geodesic tortuosity (b) and relative path length (c) in an electrode with 50 vol-% CAM and µm.
The resulting effective conductivities are included as dashed lines in Figure 3b. At low CBD contents, the conductivity model consistently predicts an exponential decrease at high SoC. Moreover, at high CBD contents, the model successfully recovers the constant effective conductivity determined by the CBD that is also observed in the numerical simulations. However, at intermediate CBD contents, the model overestimates the SoC dependence of the conductivity. Moreover, the predicted effective conductivities are generally overestimated. The influence of these deviations on the electrochemical performance will be analyzed in the last section.
4.1.2. Effective Ionic Conductivity
Finally, we investigate the effective ionic conductivity of the electrode structures. The results of the simulations on electrodes with varying CAM content ( m) are shown as dashed lines in Figure 5. Additionally, the effective electronic conductivities for an intermediate SoC of 0.7 are included as reference.
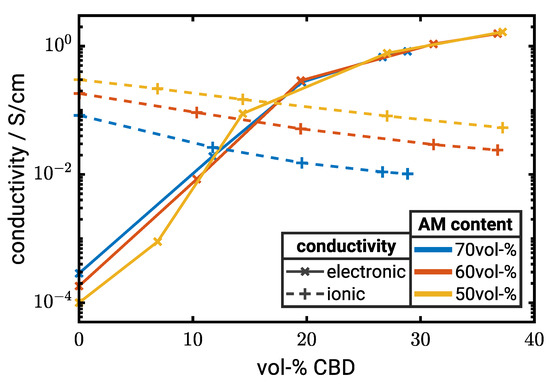
Figure 5.
Electronic (solid lines) and ionic conductivity (dashed lines) as a function of CBD content for electrodes with µm. All conductivity values in the graph are obtained by numerical simulations (). Corresponding tabulated data sets can be found as the supporting information in Table S1.
The effective ionic conductivity decreases both with increasing CAM and CBD content. In the latter case, we observe an almost linear dependence of the effective ionic conductivity on the CBD content with a slightly larger slope at high CAM loadings. Therefore, the ionic conductivity is larger than the effective electronic conductivity at low CBD contents and lower at high CBD contents.
In summary, an increase in CBD significantly improves the electronic conductivity, but, at the same time, reduces the ionic conductivity. These results suggest an optimal cell performance between 10 and 20 vol-% CBD depending on the CAM content and particle size (Figure 5). The electrochemical performance of the electrodes is investigated in the following section.
4.2. Effect of CBD on Electrochemical Performance
4.2.1. Discharge Curves
In this section, we analyze the effect of the CBD on the electrochemical properties of the NMC622 electrodes with different CAM content and particle size. Therefore, we perform galvanostatic lithiation simulations of the NMC622 half-cells. Figure 6 shows representative discharge curves of electrodes consisting of CAM particles with a diameter of µm. The CAM content is 60 vol-%, and we vary both the CBD volume fraction and current density. At 3 mA/cm, the electrodes with intermediate CBD contents of 10 vol-% and 19 vol-% provide the highest capacity. In addition, the extreme cases with no CBD or very high CBD content show a significant loss in capacity. At 12 mA/cm, the electrodes without CBD and the lowest CBD content of 10 vol-% CBD achieve the best rate performance and the capacity decreases with increasing CBD content. This indicates that, at high current densities, ion transport in the electrolyte determines battery performance since electronic conductivity of these electrodes is significantly lower than the ionic conductivity (cf. Figure 5). While electrodes for Li-Ion batteries without any CBD are of little practical relevance, the results indicate that electrodes with very low CBD contents which allow for high energy density batteries are not necessarily limited by electron transport. A more comprehensive analysis of the influence of structural parameters on the energy density will be provided in subsequent paragraphs.
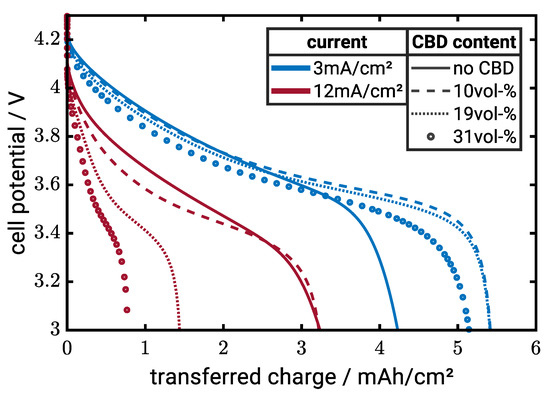
Figure 6.
Discharge simulations for electrode with 60 vol-% CAM ( µm) and current densities of 3 mA/cm (blue lines) and 12 mA/cm (red lines). The line style represents different CBD contents.
To improve the interpretation of the discharge curves presented in Figure 6, we investigate the lithium distribution in the CAM at the end of the lithiation simulations. Figure 7 shows the local SoC for the same electrodes after lithiation at a current density of 6 mA/cm (1C). In the electrodes without CBD, we observe complete lithiation near the current collector. However, only partial lithiation towards the separator due to the ohmic losses in the conductive network. Increasing the CBD content to 10 vol-% leads to a homogeneous lithiation across the entire electrode thickness. Only the particle centers are partially lithiated due to the slow diffusion in the CAM. This indicates that, at this current density, ionic and electronic transport is fairly balanced and neither of the two is limiting the electrode performance. For around 30 vol-% CBD, we observe full lithiation close to the separator and negligible lithium content close to the current collector. This demonstrates that, at high CBD contents, lithium ion transport limits the cell performance. Note that the gradient in the SoC is more pronounced in electrodes with higher loading resulting in a larger capacity loss. This is in line with the discharge curves presented in Figure 6 and demonstrates that transport limitations in the electrolyte cause a severe performance loss. The reason is the nonlinear dependence of transport parameters on lithium ion concentration. The ionic conductivity drops at low concentrations accelerating salt depletion in the electrolyte close to the current collector [45].
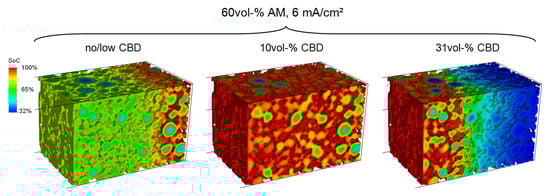
Figure 7.
Normalized lithium concentration (SoC) in the CAM at the end of lithiation simulations with 6 mA/cm. Left: No CBD. Middle: 10 vol-% CBD. Right: 30 vol-% CBD.
The optimal CBD content for homogeneous lithiation across the electrode thickness depends also on the CAM content. In our simulations, we observe homogeneous lithiation at 70 vol-% CAM content in electrodes without any CBD. In contrast, low CAM contents (50 vol-% CAM) generally favor larger CBD content. Additional concentration profiles of these two cases can be found in Figure S1 in the Supplementary Materials.
4.2.2. Energy Density
Based on the galvanostatic lithiation simulations, we calculate the energy density of the virtual electrodes. In this paragraph, we evaluate the effect of CAM content and particle size. As discussed in the previous paragraph, the optimal CBD content for highest cell capacity depends both on the structural parameters and operation conditions. Figure 8 shows the calculated energy densities depending on CAM content (Figure 8a) and particle size (Figure 8b). In the former study, the particle size is in all cases µm and in the latter the CAM content is fixed at 60 vol-%. Generally, the resulting energy density decreases as expected with increasing discharge current. At low currents, transport processes in the electrode play a negligible role, and the capacity of the electrode is fully utilized. Microstructural effects become prominent at higher current densities. Therefore, we focus in our study on current densities of 3 mA/cm and above.
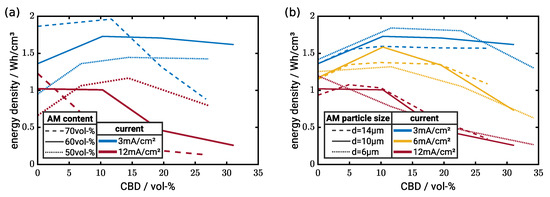
Figure 8.
Energy density as a function of CBD content. (a) Variation of CAM content ( µm). (b) Variation of particle size (60 vol-% CAM). Corresponding tabulated data sets can be found as the supporting information in Table S2.
Figure 8a shows the effect of electrode composition on energy density. Generally, high CAM contents increase the theoretical energy density of the electrodes. However, the graph illustrates that, under operation conditions, several factors influence the resulting energy density. At 3 mA/cm, high loadings and low CBD contents provide superior performance. However, at high CBD contents, the energy density drops below the energy density obtained by electrodes with low CAM loading. This demonstrates that the CBD content has to be adjusted very carefully in high energy cells.
For the electrodes with 50 vol-% CAM, the energy density in fact increases continuously with CBD content while electrodes with 60 vol-% CAM show a minor decrease in energy density at high CBD contents. However, at high current densities (12 mA/cm), high CBD contents cause in all cases a drop in energy density. Interestingly, neglecting the case with no CBD, we observe the optimum in energy density for electrodes with 50 vol-% CAM content and around 15 vol-% CBD. As shown in Figure 3, ionic and electronic conductivities are comparable in this case. This underlines the importance of both good ionic and electronic transport properties for high power applications. Still, we emphasize that the optimum strongly depends on the operating conditions. For instance at 3 mA/cm, the same electrode has an almost 50% lower energy density compared to the simulated optimum with high CAM content.
The influence of the CAM particle size is shown in Figure 8b. The particle size affects both the transport in the electrode and the utilization of the CAM limited by the chemical diffusion of intercalated lithium. Neglecting electrode effects, one would expect improved energy density for decreasing particle sizes due to a shorter diffusion length and larger interfacial area. Indeed, we observe at low currents the highest energy density for the smallest particle size. However, even at 3 mA/cm and high CBD contents, the energy density drops significantly indicating transport limitation in the electrolyte. In our study, the small particles result in tortuous transport pathways reducing effective transport properties in the electrolyte. This effect becomes more prominent at higher currents. At 6 mA/cm, particles with m provide the optimum energy density and at 12 mA/cm even the particles with m allow for obtaining the highest energy density apart from the cases without CBD. This underlines that multiple effects are coupled during battery operation and several aspects have to be taken into account for electrode design. Generally, the effect of the particle size is less pronounced in our simulations compared to the effect of electrode density. Therefore, it might be beneficial in some cases to choose the particle size more from a processing perspective.
To summarize, the optimum CBD content strongly depends on the active material content and operation conditions. For 70 vol-% active material, a minimum amount of CBD is sufficient since the active material network provides sufficient electronic conductivity. Additional CBD limits the lithium ion transport in the electrolyte and is in fact highly detrimental for cell performance. In electrodes with less active material, more CBD is needed to provide sufficient electronic conductivity. Furthermore, it can be observed that high currents shift the optima in energy density to lower CBD contents.
4.3. Effect of CBD in Homogenized Cell Models
As outlined in the previous sections, high energy electrodes with high electrode density favor low amounts of CBD. Simulation approaches can guide the development of the optimal electrode formulation. The pseudo-2D model is an important design tool for electrode development. However, the standard pseudo-2D model neglects the variation in CAM electronic conductivity which is relevant at low CBD contents and thus does not provide accurate predictions of electrode performance. In this section, we evaluate different extensions of the pseudo-2D model by comparing to the microstructure-resolved simulations presented in the previous section.
4.3.1. Effective Electronic Conductivity of CAM Particles
As shown in Figure 3, the conductivity of NMC depends on the local lithium concentration. During operation, the concentration in the CAM particles (cf. Figure 7) varies along the particle radius. Therefore, the calculation of the CAM electronic conductivity in Equation (22) is not straightforward and depends on the concentration distribution within the particle. Different approaches can be considered to calculate the effective particle conductivity. In this study, we limit ourselves to four representative conductivity cases: (i) the integral average conductivity along the particle radius, (ii) the conductivity at the particle surface, (iii) the conductivity at the particle center and (iv) a constant conductivity corresponding to an average SoC of 70%. This last case represents the standard pseudo-2D model informed by the results of our numerical conductivity simulations. Note that case (i) can be interpreted as the effective conductivity of an electron following a pathway through the particle center. During lithiation, the lithium concentration decreases towards the particle center and the electronic conductivity correspondingly increases. This indeed favors transport across the particles, assuming electronic contact on opposite sides. However, during delithiation, the situation is exactly opposite and conduction along the particle surface is favorable. Thus, different model assumptions might be more suitable depending on the operation conditions. Moreover, the contact with other particles as well as the CBD strongly influences the current distribution in the CAM.
Figure 9 shows discharge curves of the different cases along with the microstructure-resolved simulations serving as benchmark for model evaluation. In a first step, we compare to simulations without CBD. At 3 mA/cm, the cases (i), (iii) and (iv) overestimate the capacity, where the case with average conductivity is closest to the microstructure-resolved simulations. The simulation using the conductivity on the particle surface predicts lower electrode capacity. The concentration on the surface is always higher during lithiation and, thus, the CAM is conductivity lower compared to the other cases. A similar trend is observed at 12 mA/cm. However, the standard model with fixed conductivity as well as case (ii) significantly deviate from the microstructure-resolved simulations. Predictions of the other cases are similar and systematically overpredict the electrode capacity. Note that the deviations do not essentially originate in the conductivity model but can also be a result of the other model simplifications of the pseudo-2D model.
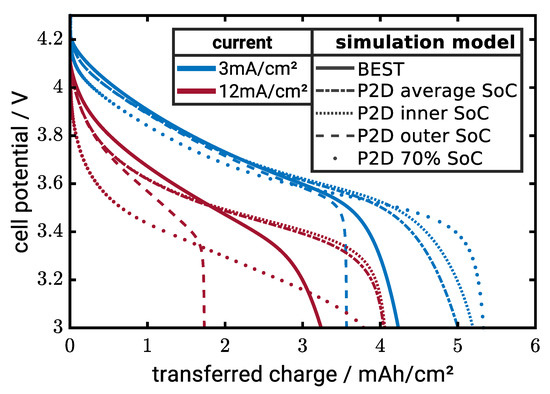
Figure 9.
Comparison of BEST-simulations with the homogenized models for electrodes with 60 vol-% CAM ( µm) and no additional CBD. Line styles represent the different models for the calculation of the effective particle conductivity.
Case (i) and (iii) both give similar simulation results. In the last part of this section, we chose the model with the average conductivity for our simulation which is closest to the benchmark.
4.3.2. Effective Electronic Conductivity on the Electrode Scale
In a next step, we also consider virtual electrodes with CBD. In this case, electronic transport in both phases has to be considered, and we evaluate the models presented in Section 3.3.
Figure 10 shows the energy density predicted by the different models as a function of the CBD. First, we focus on the low current density presented in the left graph. At high CBD contents, the microstructure-resolved and pseudo-2D simulations practically give the same results. This indicates that the pseudo-2D model which is informed with microstructural data are able to reproduce the microstructure-resolved simulations if the performance is limited by the transport in the electrolyte. At low CBD contents, we observe stronger deviations between the simulations. Still, the extended approach presented in this work is closer to the results of microstructure resolved simulations, demonstrating that the extended models indeed improve model predictions.
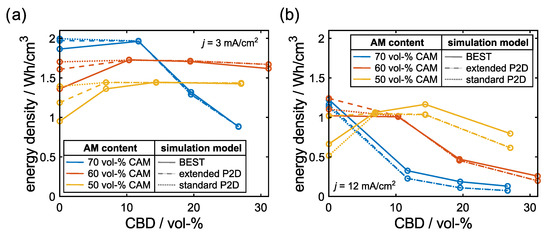
Figure 10.
Comparison of predicted energy densities of 3D microstructure-resolved (solid line) and P2D simulations using the standard (dotted) and extended (dashed) model for the solid phase conductivity. Colors represent different CAM contents. (a) current density of 3 mA/cm and (b) current density of 12 mA/cm.
At high current densities, the deviations between the pseudo-2D model and micro-structure-resolved simulations are more pronounced. Still, the models provide the same trends including optimal CBD contents. This might be exploited in optimization algorithms switching between efficient homogenized and accurate microstructure-resolved simulations.
Finally, we investigate the effect of CBD conductivity on the predicted specific energy. In the literature, effective CBD conductivities between 10 and 10 S/cm [43,44] are reported. The CBD conductivity of 10 S/cm assumed in this work is at the upper limit of reported values. Therefore, we also simulate the lower bound of 10 in our extended P2D model. Although the conductivity ratio is close to 1 in the latter case, we found only a moderate dependence of the specific energy on CBD conductivity as illustrated in Figure S3 in the Supplementary Materials.
5. Conclusions
The so-called passive materials are important constituents of the electrode formulation. Adding binder and conductive additives improves mechanical properties and electrical conductivity of the electrodes. At the same time, the amount of passive materials should be minimal to provide high energy density. Moreover, the passive materials obstruct ion transport in the electrolyte. Guidelines and tools for optimal electrode formulations are key for electrode development.
By combining stochastic structure generators and microstructure-resolved simulation tools, we are able to determine the limiting processes and optimal electrode formulations for different operation conditions. Generally, high electrode densities favor lower CBD contents. In fact, the simulations indicate that electrodes with close to zero conductive additives are favorable for high energy applications.
However, microstructure-resolved simulations are an excellent tool for mechanistic investigations computationally more efficient tools are needed for optimization studies. However, we could show that standard homogenized models, despite being informed by microstructural data, struggle to predict the performance for electrodes with low CBD contents. We demonstrated that an extended model taking into account both the conductivity in the CBD and CAM is able to improve model predictions. Still, deviations to the microstructure-resolved simulations indicate that further model improvements are needed for accurate predictions of performance at low CBD contents.
Supplementary Materials
The following are available online at https://www.mdpi.com/article/10.3390/en15217821/s1, Figure S1: Normalized lithium concentration, Figure S2: Effective conductivities, Figure S3: Energy densities, Table S1: Electronic and ionic conductivities, Table S2: Energy densities, Table S3: Interface and boundary conditions, Table S4: Reaction models, Table S5: Conversion of volume percent to weight percent
Author Contributions
Conceptualization, T.K., S.H. and B.P.; Investigation, T.K. and T.D.; Methodology, S.H.; Supervision, M.N., T.D., V.S. and A.L.; Writing—original draft, T.K. and B.P.; Writing—review & editing, S.H., M.N., T.D., V.S. and A.L. All authors have read and agreed to the published version of the manuscript.
Funding
This work has been funded by the ‘Bundesministerium für Bildung und Forschung’ within the project HiStructures under the reference Nos. 03XP0243E and 03XP0243D. This study contributes to the research performed at CELEST (Center for Electrochemical Energy Storage Ulm-Karlsruhe) and the work by MN was partially funded by the German Research Foundation (DFG) under Project ID 390874152 (POLiS Cluster of Excellence, EXC 2154). The authors acknowledge support by the state of Baden-Württemberg through bwHPC and the German Research Foundation (DFG) through grant no INST 40/575-1 FUGG (JUSTUS 2 cluster).
Data Availability Statement
Results of effective conductivity simulations available as tables in the supporting information.
Conflicts of Interest
The authors declare that there is no conflict of interest.
References
- Noh, H.J.; Youn, S.; Yoon, C.S.; Sun, Y.K. Comparison of the structural and electrochemical properties of layered Li[NixCoyMnz]O2 (x = 1/3, 0.5, 0.6, 0.7, 0.8 and 0.85) cathode material for lithium-ion batteries. J. Power Sources 2013, 233, 121–130. [Google Scholar] [CrossRef]
- Amin, R.; Chiang, Y.M. Characterization of electronic and ionic transport in Li1-xNi0.33Mn0.33Co0.33O2 (NMC333) and Li1-xNi0.50Mn0.20Co0.30O2 (NMC523) as a function of Li content. J. Electrochem. Soc. 2016, 163, A1512–A1517. [Google Scholar] [CrossRef]
- Indrikova, M.; Grunwald, S.; Golks, F.; Netz, A.; Westphal, B.; Kwade, A. The morphology of battery electrodes with the focus of the conductive additives paths. J. Electrochem. Soc. 2015, 162, A2021. [Google Scholar] [CrossRef]
- Xu, R.; Yang, Y.; Yin, F.; Liu, P.; Cloetens, P.; Liu, Y.; Lin, F.; Zhao, K. Heterogeneous damage in Li-ion batteries: Experimental analysis and theoretical modeling. J. Mech. Phys. Solids 2019, 129, 160–183. [Google Scholar] [CrossRef]
- Lestriez, B. Functions of polymers in composite electrodes of lithium ion batteries. C. R. Chim. 2010, 13, 1341–1350. [Google Scholar] [CrossRef]
- Chen, J.; Liu, J.; Qi, Y.; Sun, T.; Li, X. Unveiling the roles of binder in the mechanical integrity of electrodes for lithium-ion batteries. J. Electrochem. Soc. 2013, 160, A1502. [Google Scholar] [CrossRef]
- Mayer, J.K.; Bockholt, H.; Kwade, A. Inner carbon black porosity as characteristic parameter for the microstructure of lithium-ion electrodes and its effect on physical and electrochemical properties. J. Power Sources 2022, 529, 231259. [Google Scholar] [CrossRef]
- Jaiser, S.; Müller, M.; Baunach, M.; Bauer, W.; Scharfer, P.; Schabel, W. Investigation of film solidification and binder migration during drying of Li-Ion battery anodes. J. Power Sources 2016, 318, 210–219. [Google Scholar] [CrossRef]
- Trembacki, B.L.; Noble, D.R.; Brunini, V.E.; Ferraro, M.E.; Roberts, S.A. Mesoscale effective property simulations incorporating conductive binder. J. Electrochem. Soc. 2017, 164, E3613. [Google Scholar] [CrossRef]
- Kremer, L.S.; Hoffmann, A.; Danner, T.; Hein, S.; Prifling, B.; Westhoff, D.; Dreer, C.; Latz, A.; Schmidt, V.; Wohlfahrt-Mehrens, M. Manufacturing process for improved ultra-thick cathodes in high-energy lithium-ion batteries. Energy Technol. 2020, 8, 1900167. [Google Scholar] [CrossRef]
- Hutzenlaub, T.; Asthana, A.; Becker, J.; Wheeler, D.; Zengerle, R.; Thiele, S. FIB/SEM-based calculation of tortuosity in a porous LiCoO2 cathode for a Li-ion battery. Electrochem. Commun. 2013, 27, 77–80. [Google Scholar] [CrossRef]
- Pfaffmann, L.; Jaiser, S.; Müller, M.; Scharfer, P.; Schabel, W.; Bauer, W.; Scheiba, F.; Ehrenberg, H. New method for binder and carbon black detection at nanometer scale in carbon electrodes for lithium ion batteries. J. Power Sources 2017, 363, 460–469. [Google Scholar] [CrossRef]
- Almar, L.; Joos, J.; Weber, A.; Ivers-Tiffée, E. Microstructural feature analysis of commercial Li-ion battery cathodes by focused ion beam tomography. J. Power Sources 2019, 427, 1–14. [Google Scholar] [CrossRef]
- Zielke, L.; Hutzenlaub, T.; Wheeler, D.R.; Manke, I.; Arlt, T.; Paust, N.; Zengerle, R.; Thiele, S. A combination of X-ray tomography and carbon binder modeling: Reconstructing the three phases of LiCoO2 Li-ion battery cathodes. Adv. Energy Mater. 2014, 4, 1301617. [Google Scholar] [CrossRef]
- Foster, J.M.; Huang, X.; Jiang, M.; Chapman, S.J.; Protas, B.; Richardson, G. Causes of binder damage in porous battery electrodes and strategies to prevent it. J. Power Sources 2017, 350, 140–151. [Google Scholar] [CrossRef]
- Usseglio-Viretta, F.L.; Colclasure, A.; Mistry, A.N.; Claver, K.P.Y.; Pouraghajan, F.; Finegan, D.P.; Heenan, T.M.; Abraham, D.; Mukherjee, P.P.; Wheeler, D.; et al. Resolving the discrepancy in tortuosity factor estimation for Li-ion battery electrodes through micro-macro modeling and experiment. J. Electrochem. Soc. 2018, 165, A3403. [Google Scholar] [CrossRef]
- Entwistle, J.; Ge, R.; Pardikar, K.; Smith, R.; Cumming, D. Carbon binder domain networks and electrical conductivity in lithium-ion battery electrodes: A critical review. Renew. Sustain. Energy Rev. 2022, 166, 112624. [Google Scholar] [CrossRef]
- Morasch, R.; Landesfeind, J.; Suthar, B.; Gasteiger, H.A. Detection of binder gradients using impedance spectroscopy and their influence on the tortuosity of Li-ion battery graphite electrodes. J. Electrochem. Soc. 2018, 165, A3459. [Google Scholar] [CrossRef]
- Hein, S.; Danner, T.; Westhoff, D.; Prifling, B.; Scurtu, R.; Kremer, L.; Hoffmann, A.; Hilger, A.; Osenberg, M.; Manke, I.; et al. Influence of conductive additives and binder on the impedance of lithium-ion battery electrodes: Effect of morphology. J. Electrochem. Soc. 2020, 167, 013546. [Google Scholar] [CrossRef]
- Lautenschläger, M.P.; Prifling, B.; Kellers, B.; Weinmiller, J.; Danner, T.; Schmidt, V.; Latz, A. Understanding electrolyte filling of lithium-ion battery electrodes on the pore scale using the lattice boltzmann method. Batter. Supercaps 2022, 5, e202200090. [Google Scholar] [CrossRef]
- Laue, V.; Röder, F.; Krewer, U. Joint structural and electrochemical modeling: Impact of porosity on lithium-ion battery performance. Electrochim. Acta 2019, 314, 20–31. [Google Scholar] [CrossRef]
- Birkholz, O.; Gan, Y.; Kamlah, M. Modeling the effective conductivity of the solid and the pore phase in granular materials using resistor networks. Powder Technol. 2019, 351, 54–65. [Google Scholar] [CrossRef]
- Latz, A.; Zausch, J. Thermodynamic consistent transport theory of Li-ion batteries. J. Power Sources 2011, 196, 3296–3302. [Google Scholar] [CrossRef]
- Latz, A.; Zausch, J. Multiscale modeling of lithium ion batteries: Thermal aspects. Beilstein J. Nanotechnol. 2015, 6, 987–1007. [Google Scholar] [CrossRef] [PubMed]
- Wiedemann, A.H.; Goldin, G.M.; Barnett, S.A.; Zhu, H.; Kee, R.J. Effects of three-dimensional cathode microstructure on the performance of lithium-ion battery cathodes. Electrochim. Acta 2013, 88, 580–588. [Google Scholar] [CrossRef]
- Feinauer, J.; Brereton, T.; Spettl, A.; Weber, M.; Manke, I.; Schmidt, V. Stochastic 3D modeling of the microstructure of lithium-ion battery anodes via Gaussian random fields on the sphere. Comput. Mater. Sci. 2015, 109, 137–146. [Google Scholar] [CrossRef]
- Doyle, M.; Fuller, T.F.; Newman, J. Modeling of galvanostatic charge and discharge of the lithium/polymer/insertion cell. J. Electrochem. Soc. 1993, 140, 1526. [Google Scholar] [CrossRef]
- Traskunov, I.; Latz, A. Localized fluctuations of electrochemical properties in porous electrodes of lithium-ion batteries: Beyond porous electrode theory. Electrochim. Acta 2021, 379, 138144. [Google Scholar] [CrossRef]
- Traskunov, I.; Latz, A. New reduced-order lithium-ion battery model to account for the local fluctuations in the porous electrodes. Energy Technol. 2021, 9, 2000861. [Google Scholar] [CrossRef]
- Tjaden, B.; Cooper, S.J.; Brett, D.J.; Kramer, D.; Shearing, P.R. On the origin and application of the Bruggeman correlation for analysing transport phenomena in electrochemical systems. Curr. Opin. Chem. Eng. 2016, 12, 44–51. [Google Scholar] [CrossRef]
- Westhoff, D.; Manke, I.; Schmidt, V. Generation of virtual lithium-ion battery electrode microstructures based on spatial stochastic modeling. Comput. Mater. Sci. 2018, 151, 53–64. [Google Scholar] [CrossRef]
- Kremer, L.S.; Danner, T.; Hein, S.; Hoffmann, A.; Prifling, B.; Schmidt, V.; Latz, A.; Wohlfahrt-Mehrens, M. Influence of the electrolyte salt concentration on the rate capability of ultra-thick NCM 622 Electrodes. Batter. Supercaps 2020, 3, 1172–1182. [Google Scholar] [CrossRef]
- BEST—Battery and Electrochemistry Simulation Tool. Available online: https://www.itwm.fraunhofer.de/best (accessed on 27 July 2022).
- Mosćiński, J.; Bargieł, M.; Rycerz, Z.; Jakobs, P. The force-biased algorithm for the irregular close packing of equal hard spheres. Mol. Simul. 1989, 3, 201–212. [Google Scholar] [CrossRef]
- Bezrukov, A.; Bargieł, M.; Stoyan, D. Statistical analysis of simulated random packings of spheres. Part. Part. Syst. Charact. 2002, 19, 111–118. [Google Scholar] [CrossRef]
- Feinauer, J.; Spettl, A.; Manke, I.; Strege, S.; Kwade, A.; Pott, A.; Schmidt, V. Structural characterization of particle systems using spherical harmonics. Mater. Charact. 2015, 106, 123–133. [Google Scholar] [CrossRef]
- Soille, P. Morphological Image Analysis: Principles and Applications, 2nd ed.; Springer: Berlin/Heidelberg, Germany, 2003. [Google Scholar] [CrossRef]
- Zielke, L.; Hutzenlaub, T.; Wheeler, D.R.; Chao, C.W.; Manke, I.; Hilger, A.; Paust, N.; Zengerle, R.; Thiele, S. Three-phase multiscale modeling of a LiCoO2 cathode: Combining the advantages of FIB–SEM imaging and X-ray tomography. Adv. Energy Mater. 2015, 5, 1401612. [Google Scholar] [CrossRef]
- Landesfeind, J.; Ebner, M.; Eldiven, A.; Wood, V.; Gasteiger, H.A. Tortuosity of Battery Electrodes: Validation of Impedance-Derived Values and Critical Comparison with 3D Tomography. J. Electrochem. Soc. 2018, 165, A469–A476. [Google Scholar] [CrossRef]
- Neumann, M.; Hirsch, C.; Staněk, J.; Beneš, V.; Schmidt, V. Estimation of geodesic tortuosity and constrictivity in stationary random closed sets. Scand. J. Stat. 2019, 46, 848–884. [Google Scholar] [CrossRef]
- Prifling, B.; Neumann, M.; Hein, S.; Danner, T.; Heider, E.; Hoffmann, A.; Rieder, P.; Hilger, A.; Osenberg, M.; Manke, I.; et al. Quantitative comparison of different approaches for reconstructing the carbon-binder domain from tomographic image data of cathodes in lithium-ion batteries and its influence on electrochemical properties. Energy Technol. 2022, 202200784. [Google Scholar] [CrossRef]
- Newman, J.; Thomas-Alyea, K.E. Electrochemical Systems; J. Wiley & Sons: Hoboken, NJ, USA, 2012. [Google Scholar]
- Zheng, H.; Yang, R.; Liu, G.; Song, X.; Battaglia, V.S. Cooperation between Active Material, Polymeric Binder and Conductive Carbon Additive in Lithium Ion Battery Cathode. J. Phys. Chem. C 2012, 116, 4875–4882. [Google Scholar] [CrossRef]
- Ram, R.; Soni, V.; Khastgir, D. Electrical and thermal conductivity of polyvinylidene fluoride (PVDF)—Conducting Carbon Black (CCB) composites: Validation of various theoretical models. Compos. Part B Eng. 2020, 185, 107748. [Google Scholar] [CrossRef]
- Danner, T.; Singh, M.; Hein, S.; Kaiser, J.; Hahn, H.; Latz, A. Thick electrodes for Li-ion batteries: A model based analysis. J. Power Sources 2016, 334, 191–201. [Google Scholar] [CrossRef]
Publisher’s Note: MDPI stays neutral with regard to jurisdictional claims in published maps and institutional affiliations. |
© 2022 by the authors. Licensee MDPI, Basel, Switzerland. This article is an open access article distributed under the terms and conditions of the Creative Commons Attribution (CC BY) license (https://creativecommons.org/licenses/by/4.0/).