Article

Thermal Electrical Tests for Battery Safety Standardization

1
Physikalisch-Technische Bundesanstalt (PTB), Bundesallee 100, 38116 Braunschweig, Germany
2
Elenia Institute for High Voltage Technology and Power Systems, Technische Universität Braunschweig, Schleinitzstraße 23, 38106 Braunschweig, Germany
*
Author to whom correspondence should be addressed.
Energies 2022, 15(21), 7930; https://doi.org/10.3390/en15217930
Submission received: 16 September 2022 / Revised: 12 October 2022 / Accepted: 18 October 2022 / Published: 26 October 2022
(This article belongs to the Special Issue Particle Design and Processing for Battery Production)

Abstract

:
Battery safety tests are defined by several international standards in different ways and with heterogenous termination and failure criteria. In this work, lithium-ion cells were examined regarding their behavior in the event of overcharging and also in the event of an external short circuit with varied parameters specified by standards. The voltage, current, and temperature curves were evaluated. In addition, the changes in the cells were analyzed using electrochemical impedance spectroscopy (EIS). It is shown that the cells exhibit reproducible behavior in a clamped state. Further, it could be determined that the position of the cell opening during an overcharge has an influence on the further behavior of the cell. EIS data showed that the cells have a significantly higher internal resistance after an overcharge. The short-circuit tests at different ambient temperatures indicated that the internal resistance of the cell decreases with increasing temperature. However, no reproducible effects in impedance spectra were present after the short-circuit test. This work illustrates that the choice of test parameters and termination criteria undoubtedly influence the test results and thus may change the classification of cells as either safe or unsafe. Thus, cells may be classified as safe regarding a certain standard but unsafe regarding another.

1. Introduction

Electrically powered vehicles are becoming more popular and affordable, enabling the reduction of greenhouse gas emissions in the transport sector [1]. They are powered by battery systems, which are usually made from lithium-ion cells. Lithium-ion cells are attractive due to their high energy density and a high number of charge-discharge cycles [2]. Nevertheless, advances regarding their capacity to match the range of conventionally powered vehicles are necessary [3]. Therefore, a main area of research focuses on solutions to increase energy density [4,5,6]. One possible route to achieve higher energy density is the use of high-energy active materials such as Li-rich Mn-based cathode materials [4]. However, the safety of the cells is one of the most important aspects of the use of battery systems and needs to be considered in the development of novel battery systems [4,5,7,8]. The safety assessment of a battery system is a time-consuming task since the cells can only be tested at a late stage of development. Thus, necessary changes in the production process led to a high number of rejects. Knowledge of the performance of the cells during their lifetime and in the event of an accident has to be considered in the evaluation. In addition to the temporal aspect, the high costs for necessary tests also come into play. Currently, a large number of standards for the safety assessment of lithium-ion batteries exist in parallel [8]. An overview is given in Table 1.
Harmonization of these different safety tests in the early development phase could contribute to decreasing the time and cost expenditure while making the results more reliable and enabling an adequate comparison between different lithium-ion battery cells. For standardization, the reproducibility and the comparability of the tests need to be investigated. In this study, the results of different safety tests on a lithium-ion pouch cell will be investigated and documented. Cell behavior and cell safety will be characterized and evaluated by voltage waveform analysis and electrochemical impedance spectroscopy (EIS).
Overcharging of lithium-ion cells can occur due to errors in the charging technology or incorrect handling [13]. By definition, overcharging occurs when the cell is charged while the voltage exceeds the specified maximum end-of-charge voltage [13]. In the case of overcharging, irreversible changes in the structure occur, which may lead to a loss of the active material. Above a cathode potential of 4.5 V, the electrolyte becomes electrochemically non-stable and begins to decompose. If the cell is overcharged even further, the anode is completely lithiated and lithium is deposited on the surface of the anode [14]. Overcharging can induce excessive heating of the cell and be the cause of a “thermal runaway” which can result in flames and/or an explosion [15]. Various standards specify test procedures that are used to analyze the behavior of a cell during an overcharge [9,10,11,12].
While the safety aspects of lithium-ion cells must be assessed via adequate testing before their deployment, during the use phase, battery management techniques [16,17] are required to prohibit the operation outside safe conditions. Thus, overcharging of cells can be prevented and safe operation is ensured.
In the event of an external short circuit, two possible destructive influences on the cell occur. Firstly, a low short-circuit resistance results in a high discharge current, which can cause severe overloading of the cell and high-temperature development. In addition, a sustained external short circuit results in a deep discharge of the cell with a high current. In both scenarios, the internal structure of the cell can change electrically and chemically. Internal short circuits can lead to a high discharge current, which can result in high-temperature development. The temperature can also rise sharply due to a chemical change and the associated increase in resistance. The high temperatures can lead to thermal runaway and end in fire and/or explosion [18]. Therefore, cells are tested for their safety in the event of an external short circuit.

2. Results

To compare different test procedures for lithium-ion cells, the cells investigated in this study (cf. Section 4) were subjected to several tests. For the first approach, the test conditions of the standards for overcharging were compared and selected. The cells were overcharged in a clamped and unclamped condition and at different charging currents, and the cell behavior and cell safety were analyzed. The results are described in Section 2.1. In the next step, the parameters of an external short circuit listed in the standards were evaluated and determined. The cells were subjected to an external short circuit at different ambient temperatures. The cell behavior and safety for this test were analyzed and are presented in Section 2.2.

2.1. Overcharge Tests

The standards in Table 2 specify values for overcharge current, ambient temperature, and termination criteria.
A comparison of the four standards shows that the ambient temperature does not differ. The test started at 100% SoC except for IEC 62133-2 [11] where it started at 0 % SoC, so the normal charging process is also included. There are differences in the charging current. One of the listed standards requires a 1 C and two other standards a 2 C overcharge. IEC 62660-2 [9] states that the level of the overcharge current requires an agreement with the manufacturer. An agreement must also be made regarding the overcharge voltage limit or alternative termination criteria. The other standards show termination criteria such as overcharge voltage limits between 120% and 200%, a capacity limit of 130%, or a temperature limit of 55 °C. The test is considered failed for the failure criteria of fire and/or explosion of the cell for all four standards.

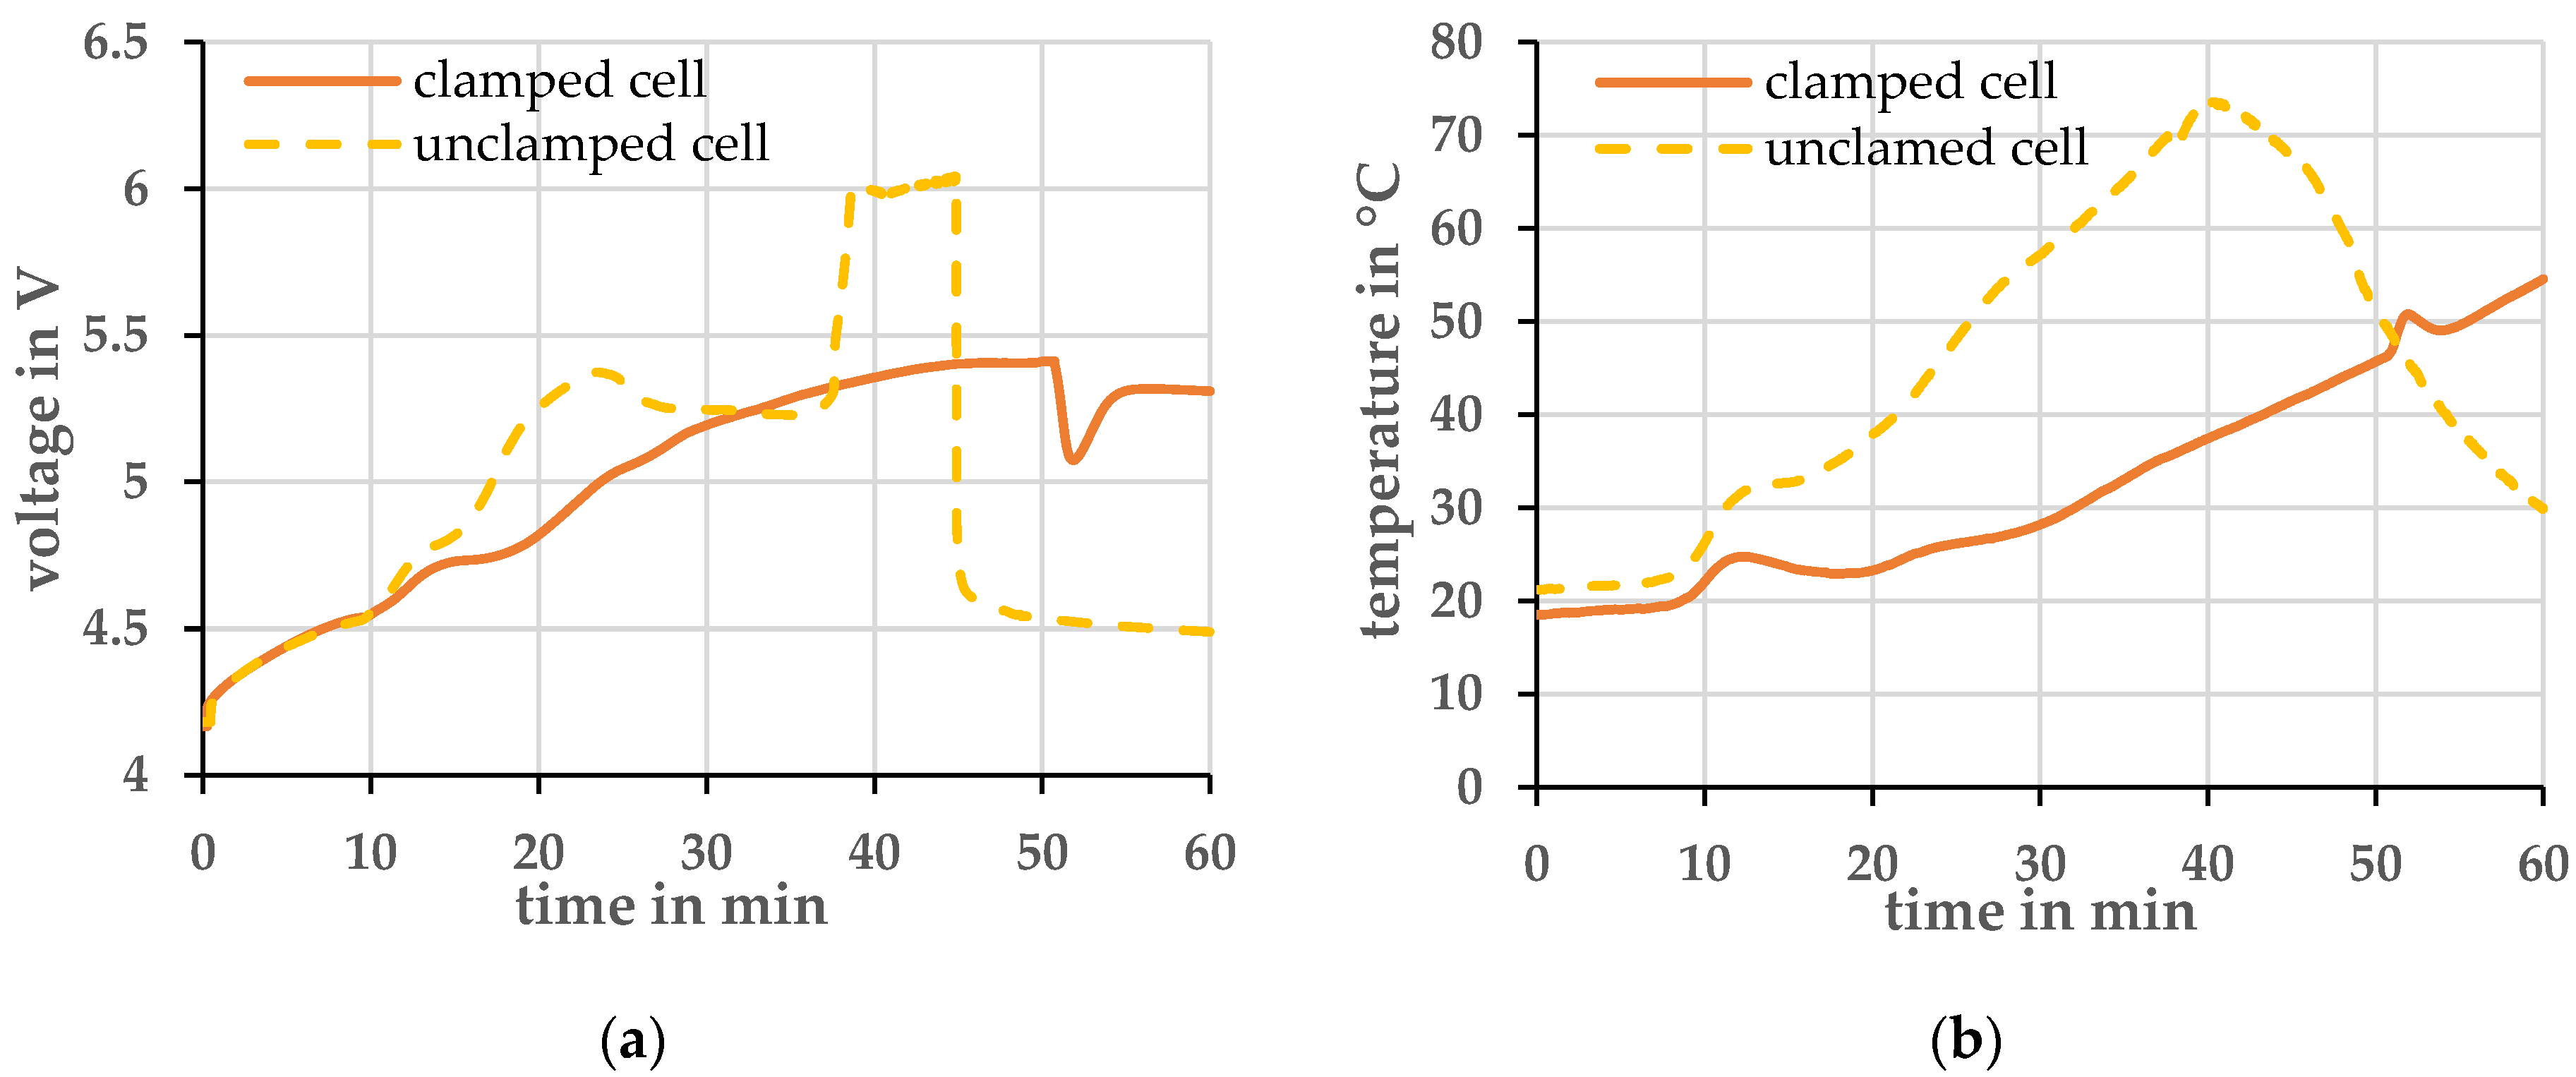
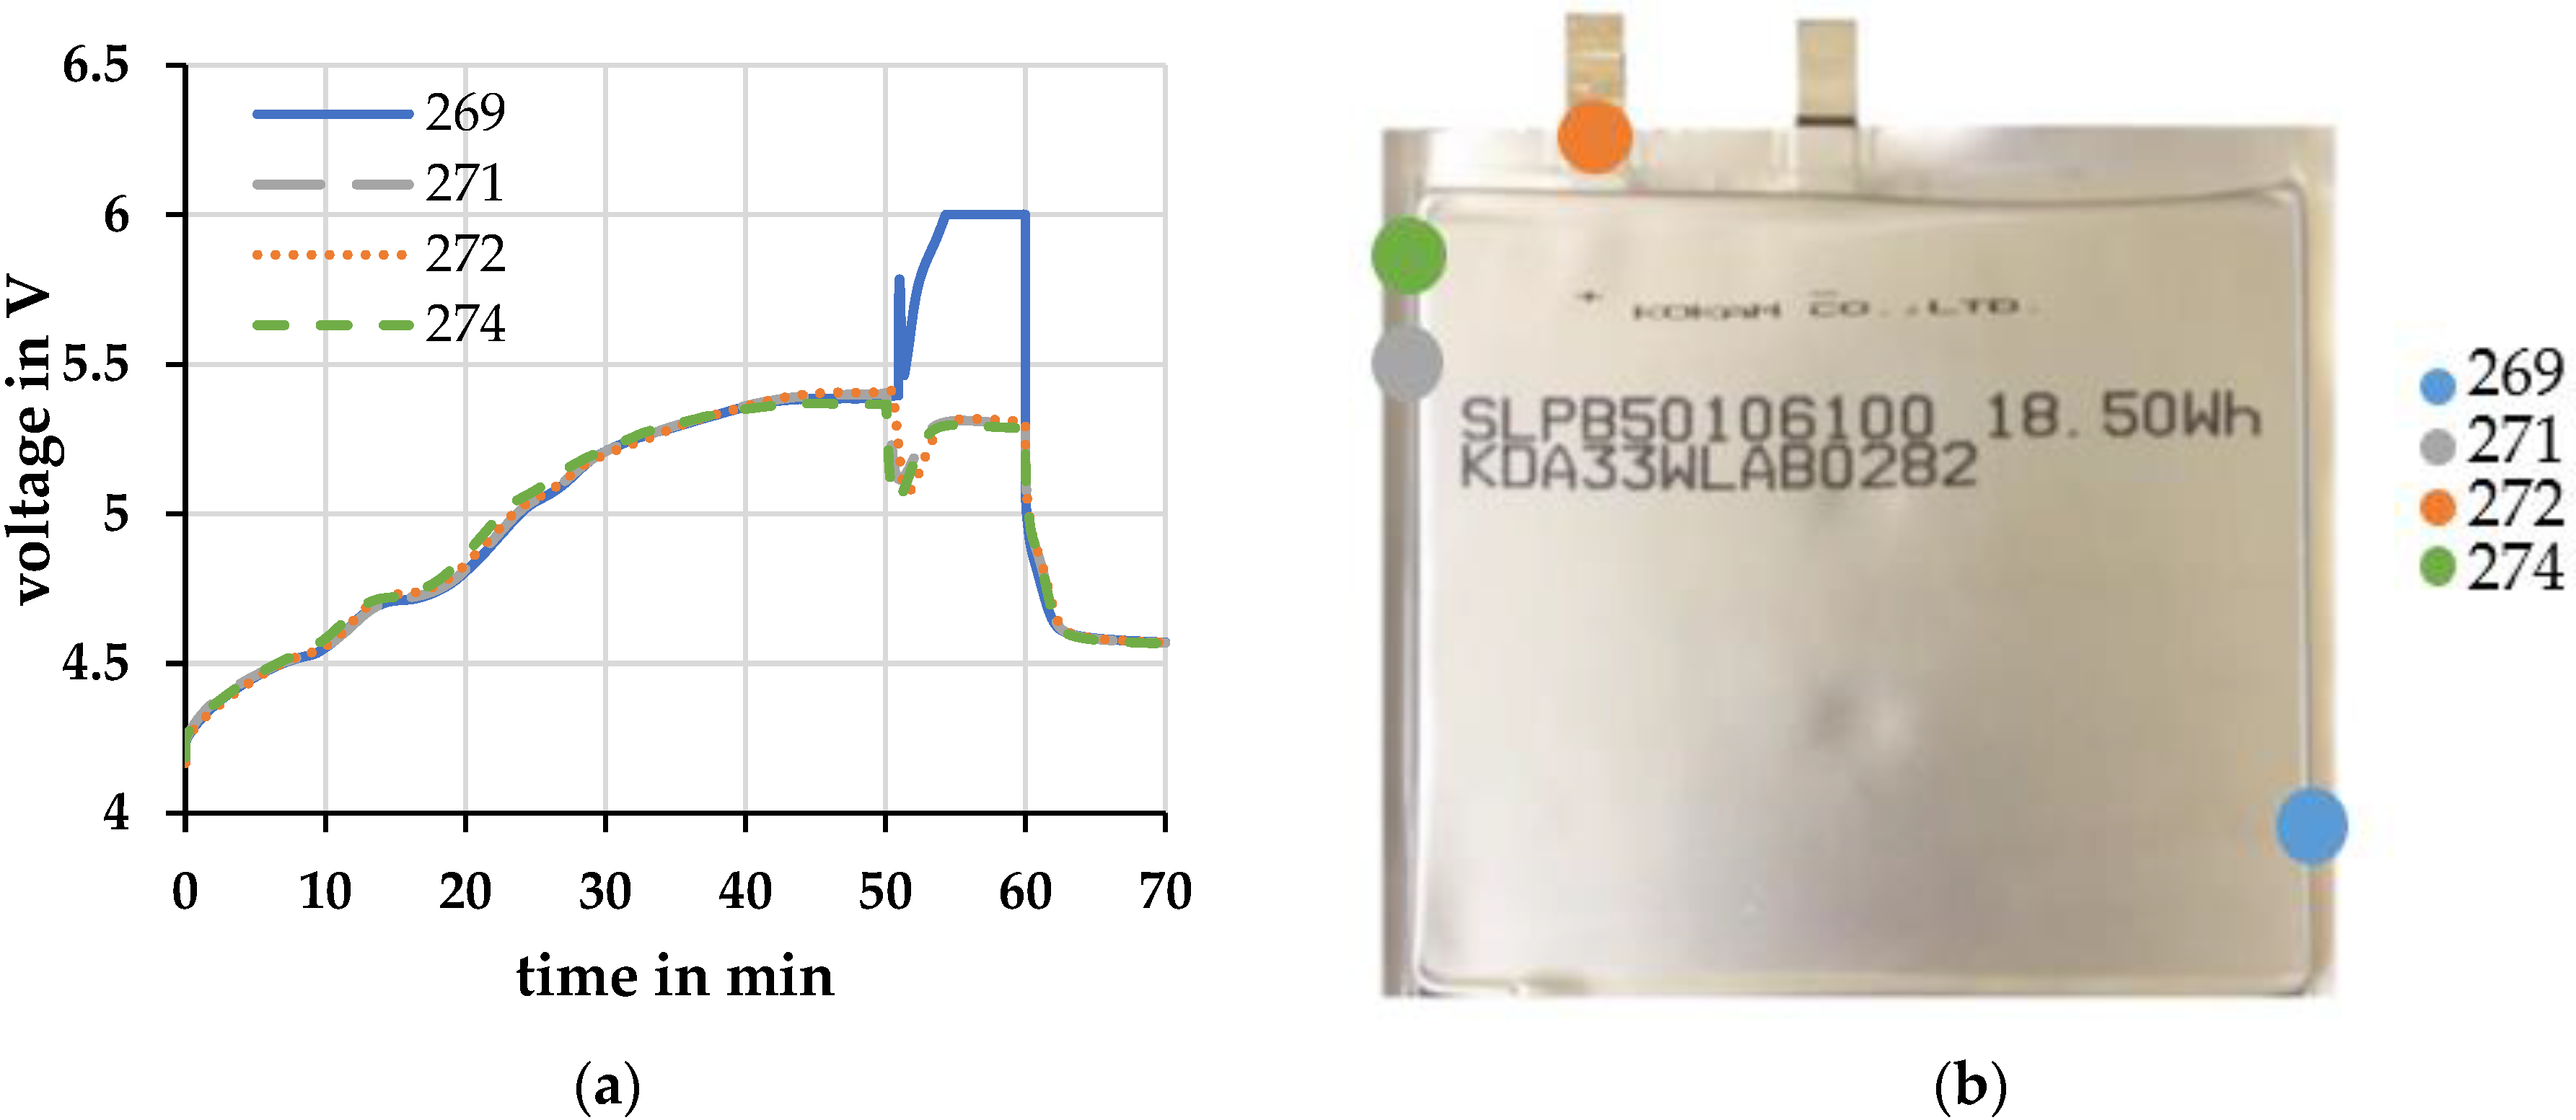
2.1.1. Overcharge Test of a Clamped and an Unclamped Cell

Preliminary investigations were first carried out to determine the reproducibility of the measurements. In Figure 1 the temporal evolution of cell voltage and temperature of a 1 C overcharge of a clamped and an unclamped cell is shown. The temperature was measured with a type K thermocouple centered on the surface of the pouch foil. The measurements clearly showed that cells that are mechanically clamped provided more reproducible results. Therefore, all further experiments were carried out with cells clamped with a pressure of 0.08 MPa.
At the beginning of the overcharge, the cells behave similarly. After about 10 min, the voltage of the unclamped cell increases more strongly. At the same time, its temperature also rises faster than that of the clamped cell. Assuming that the chemical reactions in both cells are comparable and do not lead to different thermal behavior, an increase in the ohmic resistance is the likely cause for the increased heat generation. One explanation for the increasing ohmic resistance is that the electrolyte vaporizes and migrates out of the layered structure of the lithium-ion cell. Less electrolyte is available within the structure and the resistance increases. Due to the higher resistance, the temperature increases further and leads to more vaporization of the electrolyte. This process can also be seen visually in the cell. The pouch foil of the cell is strongly deformed by the increasing pressure inside, and the cell inflates. On the other hand, in the clamped cell the pressure is larger, and the vaporization of the electrolyte is decreased. Thus, a larger portion of the electrolyte is held between the layers and the internal resistance does not increase as rapidly.
Both cells opened in this experiment, i.e., the pressure in the cell was so high that the pouch foil tore at its seam. In the data shown in Figure 1, it is most evident from the temperature data. The unstrained cell opened after about 38 min, and the cell temperature dropped in the process. The clamped cell opened after about 50 min. At this point, the temperature profile shows an upward deflection. One assumption is that the electrolyte gas held inside the structure by the bracing is hotter than the electrolyte gas, which can spread out in gas form inside the cell. When the strained cell opens, the hot gas flows past the pouch foil to the opening point. The cell surface is heated in the process.
Several cells were used in the overload tests. Before the cell opening, the cells behaved in the same way during the overcharge. After cell opening, the voltage profile of cell 269 deviates strongly from the other cells. In Figure 2, the voltage profile of cell 269 is compared with the voltage profile of three other cells.
While the three other cells show a voltage dip followed by a plateau, cell 269 shows a voltage peak and a further increase in cell voltage. After that, the cell voltage was limited to 6 V by the connected source. After the measurement, it was found that the three cells had all opened near the electrodes Figure 2b. Cell 269 had the defect further away from the electrodes Figure 2b.

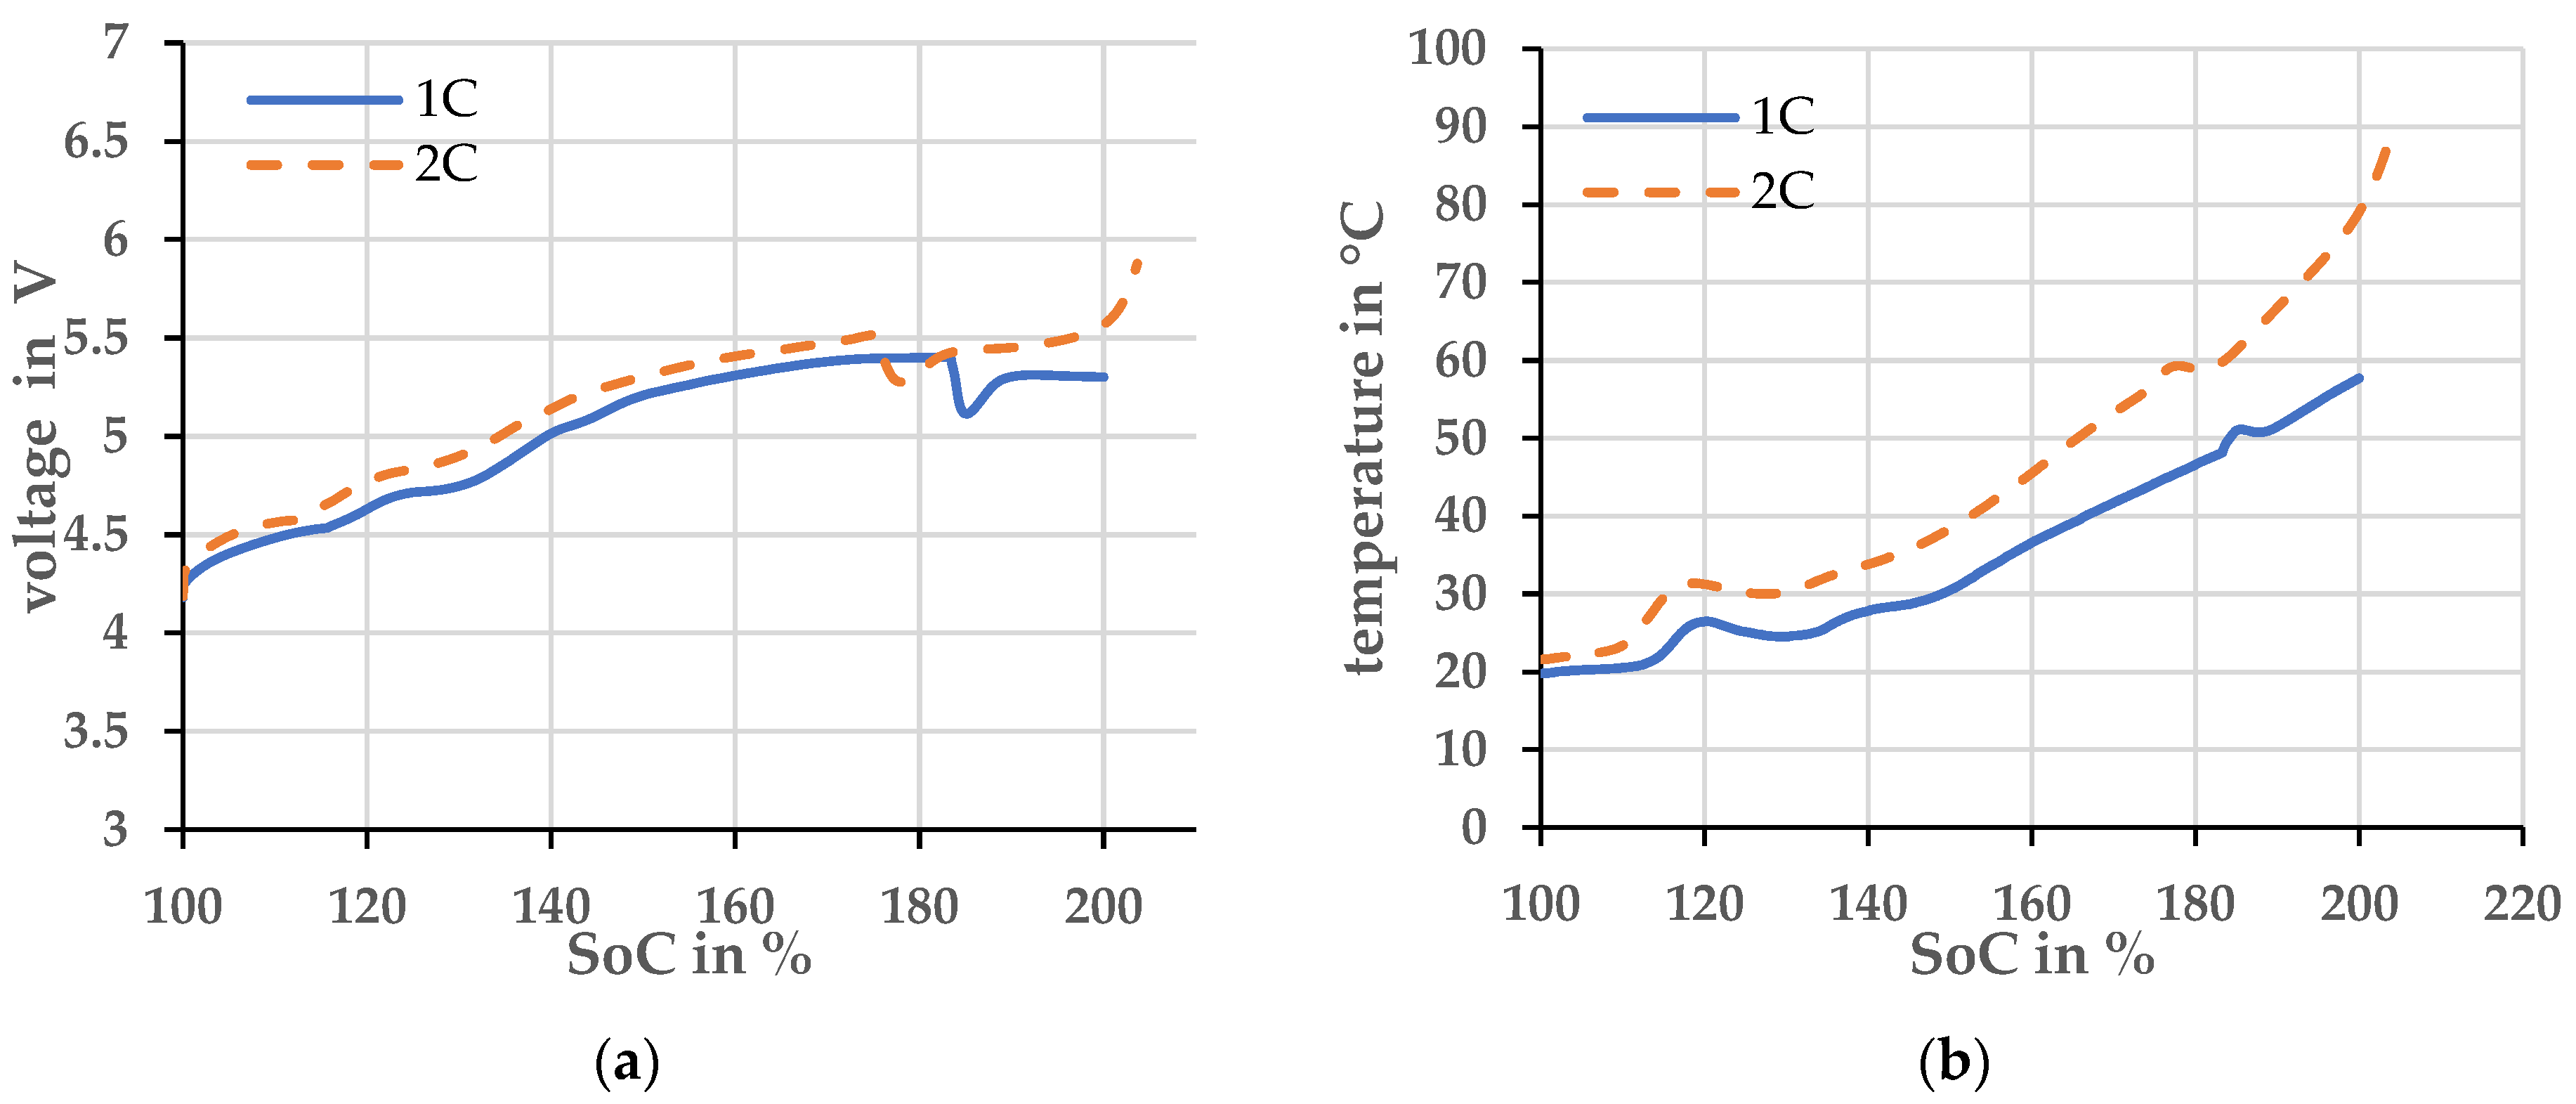
2.1.2. Effects of Different Charging Currents

After establishing that the experiment is well repeatable until the pouch cell opens, the overcharge current was varied. An overcharge with a current of 1 C was compared to an overcharge with a current of 2 C. The voltage and temperature profiles are plotted over the state of charge (SoC) in Figure 3. Here, the SoC was calculated by the integral of the current over time.
The overcharge at 2 C current leads to more heating compared to the overcharge at 1 C current. The higher current produces more heat at the ohmic resistor. The cell with the higher overcharge current opens at a lower SoC, indicated by the voltage drop and brief temperature increase. The cell with the overcharge current of 1 C opens at both a lower voltage and temperature. Therefore, the opening of the cell cannot be assigned to either of these parameters and a simple derivation of the off-gassing time is not possible. Clearly, the safety characteristic of the investigated cell depends on the specific way it is determined.

2.1.3. Electrochemical Impedance Spectroscopy (EIS) of Overcharged Cells

After the overcharge was terminated, the cells were subjected to an EIS. In the galvanostatic method of impedance spectroscopy, a current signal is impressed into the system and the voltage response is measured [19]. If a multi-phase system is measured, all impedances of the different phases are superimposed. For these different phases and processes, different time constants occur. Figure 4 shows the equivalent circuit of the lithium-ion cell [19].
The inductive behavior and the pure ohmic resistance of the cell are represented by the coil L and the resistance R0. The first RC element represents the anode processes consisting of charge transport processes and the SEI process. The charge processes of the cathode are represented by the second RC element. The Warburg impedance describes an electrochemical diffusion process. For this measurement, the Reference 3000 AE (Inc. Gamry) is used in a frequency range between 5 mHz and 10 kHz.
Figure 5 shows a typical comparison between the EIS before and after overcharging in a Nyquist diagram. From preliminary tests, it was found that the frequency range under investigation needed to be shifted after overcharge. Before overcharging, the x-axis crossing and thus the purely resistive part of the impedance could be recorded at about 1 kHz. After overcharging, this is at approximately 9 kHz. Thus, the frequency range was shifted from 5 mHz–5 kHz before overcharging to 100 mHz–10 kHz after overcharging to be able to analyze the characteristic points of the traces.
The spectrum after the overcharge suggests that the impedance of the cell has increased enormously. Qualitatively, the profile remains the same. Thus, the equivalent circuit of RC elements of the cell remains valid. The electrolyte, which has become gaseous, may have affected the resistance, as it is no longer available in gaseous form for ion transport.

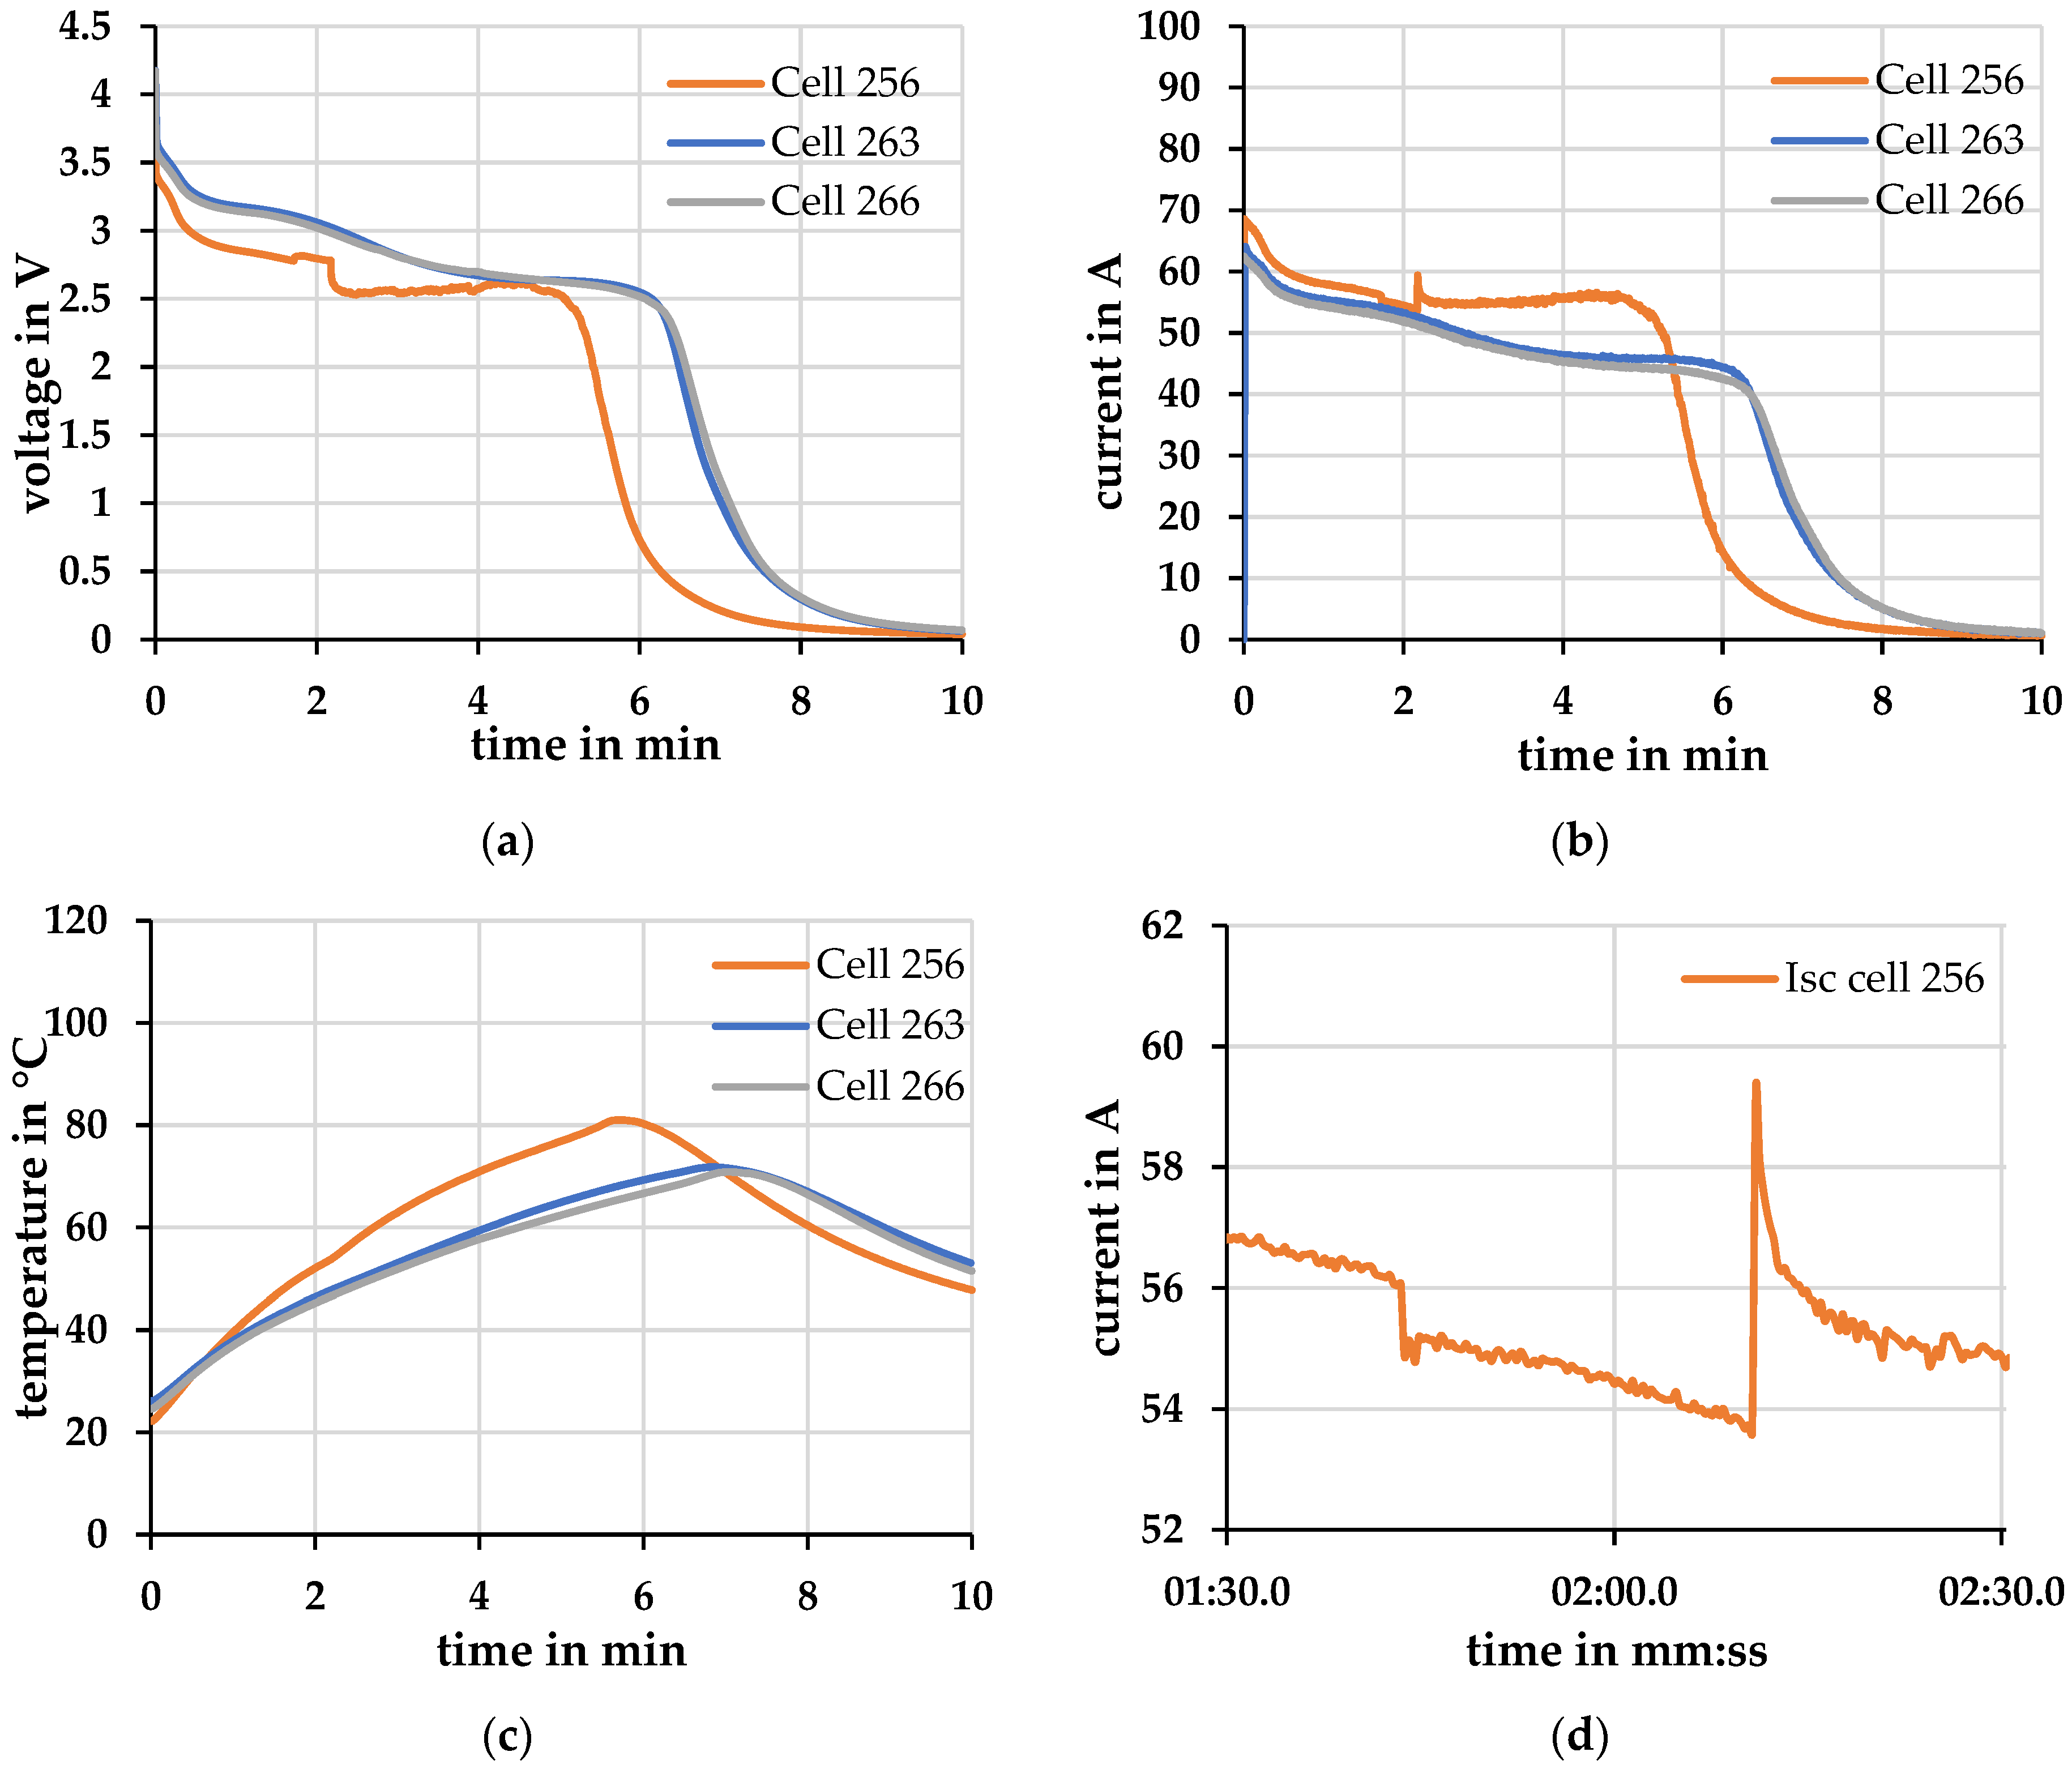
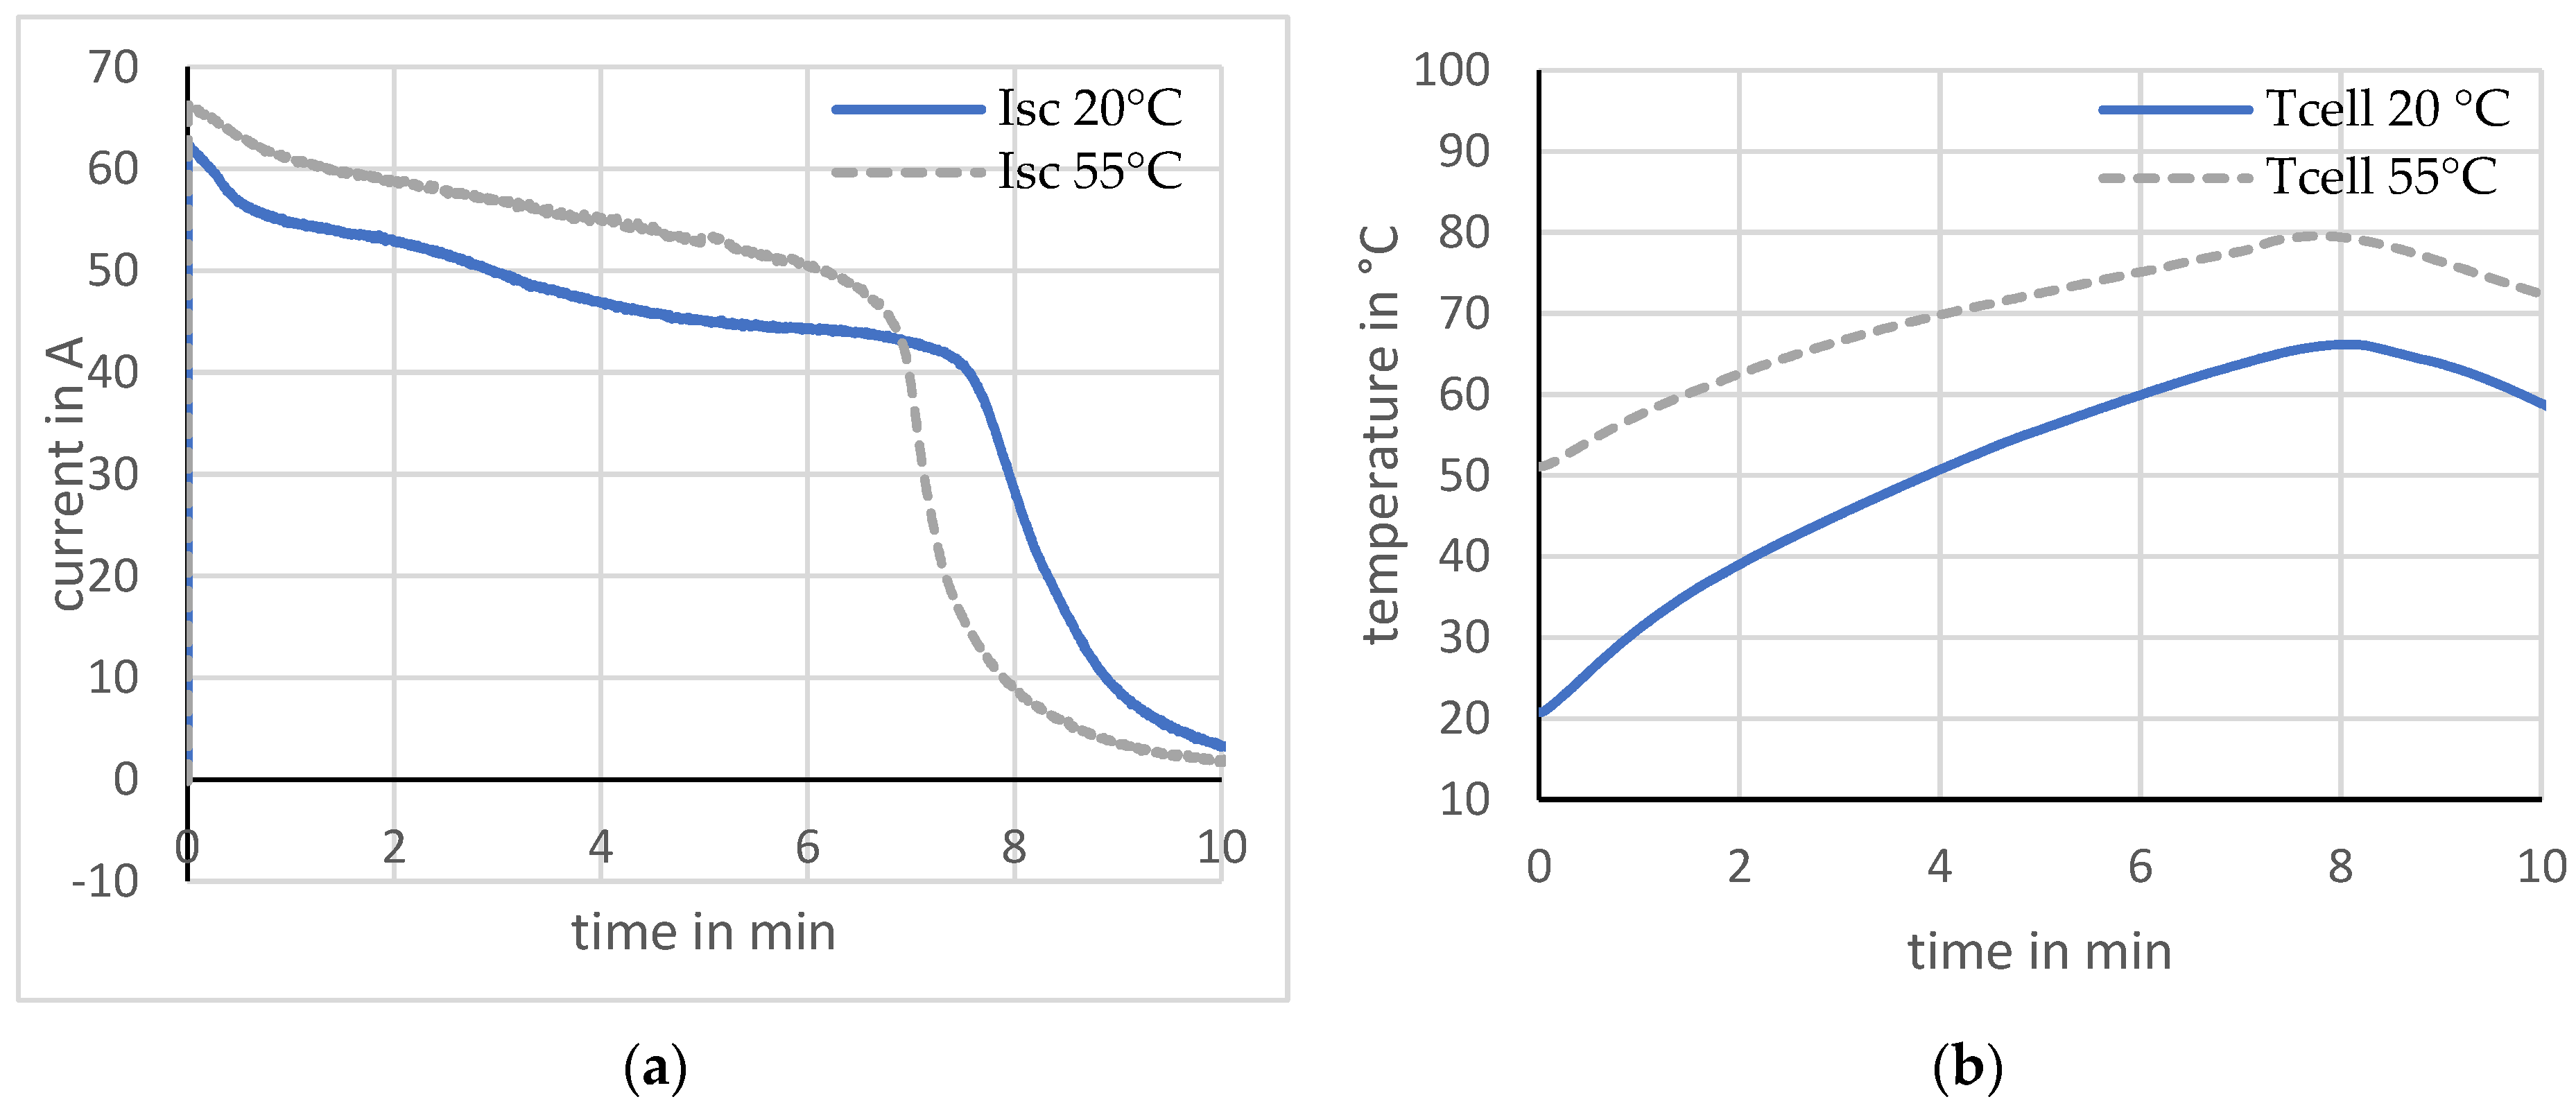
2.2. Short-Circuit Test

There are different test procedures in the standards to show the effects of an external short circuit. An excerpt of standards is shown in Table 3.
The comparison shows that for the four standards, the short-circuit test should be carried out with a fully charged cell with an SoC of 100%. The first differences between the standards become apparent in the resistance value for the external short circuit. While the standards from the area of “electric vehicles” tend to require lower resistance values of <5 mΩ or even 20 mΩ, IEC 62133-2 [11] from the area of “portable devices” requires a resistance value of 80 mΩ for the external short circuit. In addition, this standard differs significantly from the other standards in the ambient temperature of 55 °C and the termination criterion with a short-circuit duration of 24 h. The four standards designate the test as failed for the failure criterion of fire and/or explosion of the cell.
In this paper, the influence of temperature during the short circuit test is investigated. For this purpose, the temperature parameter for IEC 62133-2 [11] is varied between two values. The short-circuit test is carried out at the specified 55 °C ± 5 °C and at 20 °C as specified in the other standards. If the resistance value is changed, it is assumed that the resulting higher short-circuit current will cause the cell to heat further [20]. This investigation is not part of this paper.
The following results were obtained from experiments carried out at a short-circuit resistance of 66 mΩ and a duration of 10 min (the test specified in IEC 62133-2 [11]). The ambient temperature was varied in the two test scenarios to 20 °C and 50 °C. A sampling rate of 3 values per second was selected. Figure 6 shows the voltage, current, and temperature profile of a short circuit test at an ambient temperature of 20 °C.
During the short circuit experiment, the open circuit voltage cannot be measured. Therefore, the cell voltage Ucell is measured prior to the short circuit. The short circuit switch was closed at t = 0 min. When the short-circuit switch is closed, the cell is loaded, and the voltage drops across the internal resistance of the cell. The peak short-circuit current Isc is 62.47 A and causes a voltage drop of 0.56 V. This voltage drop must be considered when determining the SoC. Figure 7 explains the relationship between internal resistance and short-circuit resistance.
Therefore, the SoC of 0 % is reached approx. after 6 min and 20 s (Figure 6). A maximum cell temperature Tcell of 71 °C is reached. After the duration of approx. 10 min, the switch was opened again. After exceeding the SoC 0%, 0.7 Ah could still be taken from the cell. After the short circuit (red line), the cell voltage Ucell relaxes. This indicates that the anode was not completely delithiated and that there are still lithium ions in the anode. To completely delithiate the anode, it would be necessary to apply a negative voltage to the cell [21]. The cell temperature drops again even before the switch is opened, since the short-circuit current also drops sharply as the cell voltage drops sharply. None of the cells investigated opened or ignited during this type of experiment.
Differences were found when repeating the experiment on three cells. Two cells behaved similarly during the external short circuit. In Figure 8 no significant deviations in the (a) voltage-, (b) current- and (c) temperature profiles are evident between cells 263 and 266.
Cell 256, on the other hand, exhibits different behavior. The maximum short-circuit current of cell 256 is about 10% higher than that of cell 266, which has the lowest short-circuit current. Cell 263, on the other hand, achieves only a 2% higher short-circuit current. The increased short-circuit current heats cell 256 about 14% more than cell 266. Cell 256 behaves differently from the other two cells right from the start. In (d) a more distinct difference is shown in peaks in the current profile, which occurred after a time of about 1:40 and 2:10 min. These peaks indicate changes in the internal resistance of one or different layers of the cell. There may be an increase in resistance due to, for example, evaporation of the electrolyte, or there may be a decrease in resistance due to, for example, partial short circuits in the separator. This changed course of cell 256 may have been brought about by various factors. There may have been mechanical stress during the incoming cell test, which has not been explicitly listed. It is also possible that the cell was already produced with a deviation or even with a defect which, in normal use within the operating limits, would show up neither in the voltage/current profile nor in the electrochemical impedance spectroscopy.

2.2.1. Effects of Different Ambient Temperatures

The short-circuit test was also performed at an ambient temperature of 50 ± 2 °C. Two cells that did not exhibit any current peaks are compared here. The maximum short-circuit current at a temperature of 50 °C is up to approx. 12% higher than at the lower ambient temperature of 20 °C. This is based on the decreasing internal resistance of the cell at a higher ambient temperature, yielding larger short-circuit currents. Investigations using calorimeters showed that ambient temperature influences internal resistance in various ways [22]. It affects the viscosity of the electrolyte. With increasing temperature, the viscosity and thus the diffusion resistance of the lithium ions within the electrolyte decreases. The cell temperature exhibits a difference between the starting and maximum values that are about 40% lower at a higher ambient temperature. It was noticeable that current peaks occurred more frequently and were larger at a higher ambient temperature. Figure 9 shows the results.

2.2.2. Electrochemical Impedance Spectroscopy after Short-Circuit Test

EIS was performed in the frequency range between 10 kHz and 5 mHz before and after the short-circuit test. The corresponding Nyquist diagrams were analyzed. However, the profiles after the short-circuit test deviated strongly for each tested cell. No sufficiently uniform behavior has been determined. The previously used equivalent circuit can no longer be used for cells after a short-circuit test.

3. Discussion

Safety assessment of lithium-ion cells can be a time-consuming and expensive task due to the number of existing standards and the different requirements brought forth within them. In this work, comparative measurements between the requirements of four selected standards for the overcharge test and the short circuit test were carried out.
The parameters of an overcharge test were compared from the four standards in Table 2. The main differences lie in the level of the overcharge current and the termination criteria. IEC 62660-2 [9] clearly stands out in the specifications of the parameters, as it requires an agreement with the manufacturer regarding the charging current and the termination criteria. In the other standards, two different overcharge currents are specified. A 1 C and a 2 C overcharge are described. First, the effects of a 1 C overcharge on a braced and unbraced cell were explained in more detail. Mechanical bracing provides more reproducible results. These experiments can be further extended by varying the mechanical pressure. In addition, a dependency between the location of the cell opening and the cell behavior was found with overloading. This dependence should be verified by a further series of tests. The EIS measurement showed a frequency shift after overcharging. This parameter could be used to evaluate the cell condition within a battery management system.
The parameters of the four selected standards were also compared for the test with an external short circuit. The external short-circuit tests were carried out with a variation of the ambient temperature. It was shown that a higher ambient temperature resulted in a lower maximum temperature difference. It was also found that the higher ambient temperature increased the non-reproducible current jumps. For the standardization of this test, further work is needed. Test series with a variation of the short-circuit resistance covering at least the values given in the selected standards between 5 mΩ and 80 mΩ should be carried out. The EIS measurements after the short-circuit test did not give usable results.
Limitations of this work include that only a certain lithium-ion cell type was tested. Different results will be achieved when repeating the tests for different cell types. Also, the range of experimental parameters that were varied was limited. It is expected that when extending this range (e.g., ambient temperature, overcharge current, short-circuit resistance), the results would scatter more. Nevertheless, even with this subset of possible tests, significant variation in the results could be observed.
Hence, this work illustrates that the choice of test parameters and termination criteria undoubtedly influence the test results and thus may change the classification of cells as either safe or unsafe. Thus, cells may be classified as safe regarding a certain standard but unsafe regarding another. This situation requires that high care is taken during the life cycle of the cell to ensure operation only in a safe regime, even under detrimental conditions and failure modes. Harmonization of the standards in this respect would likely result in higher overall safety requirements and enable a simpler and safer life cycle operation and monitoring.

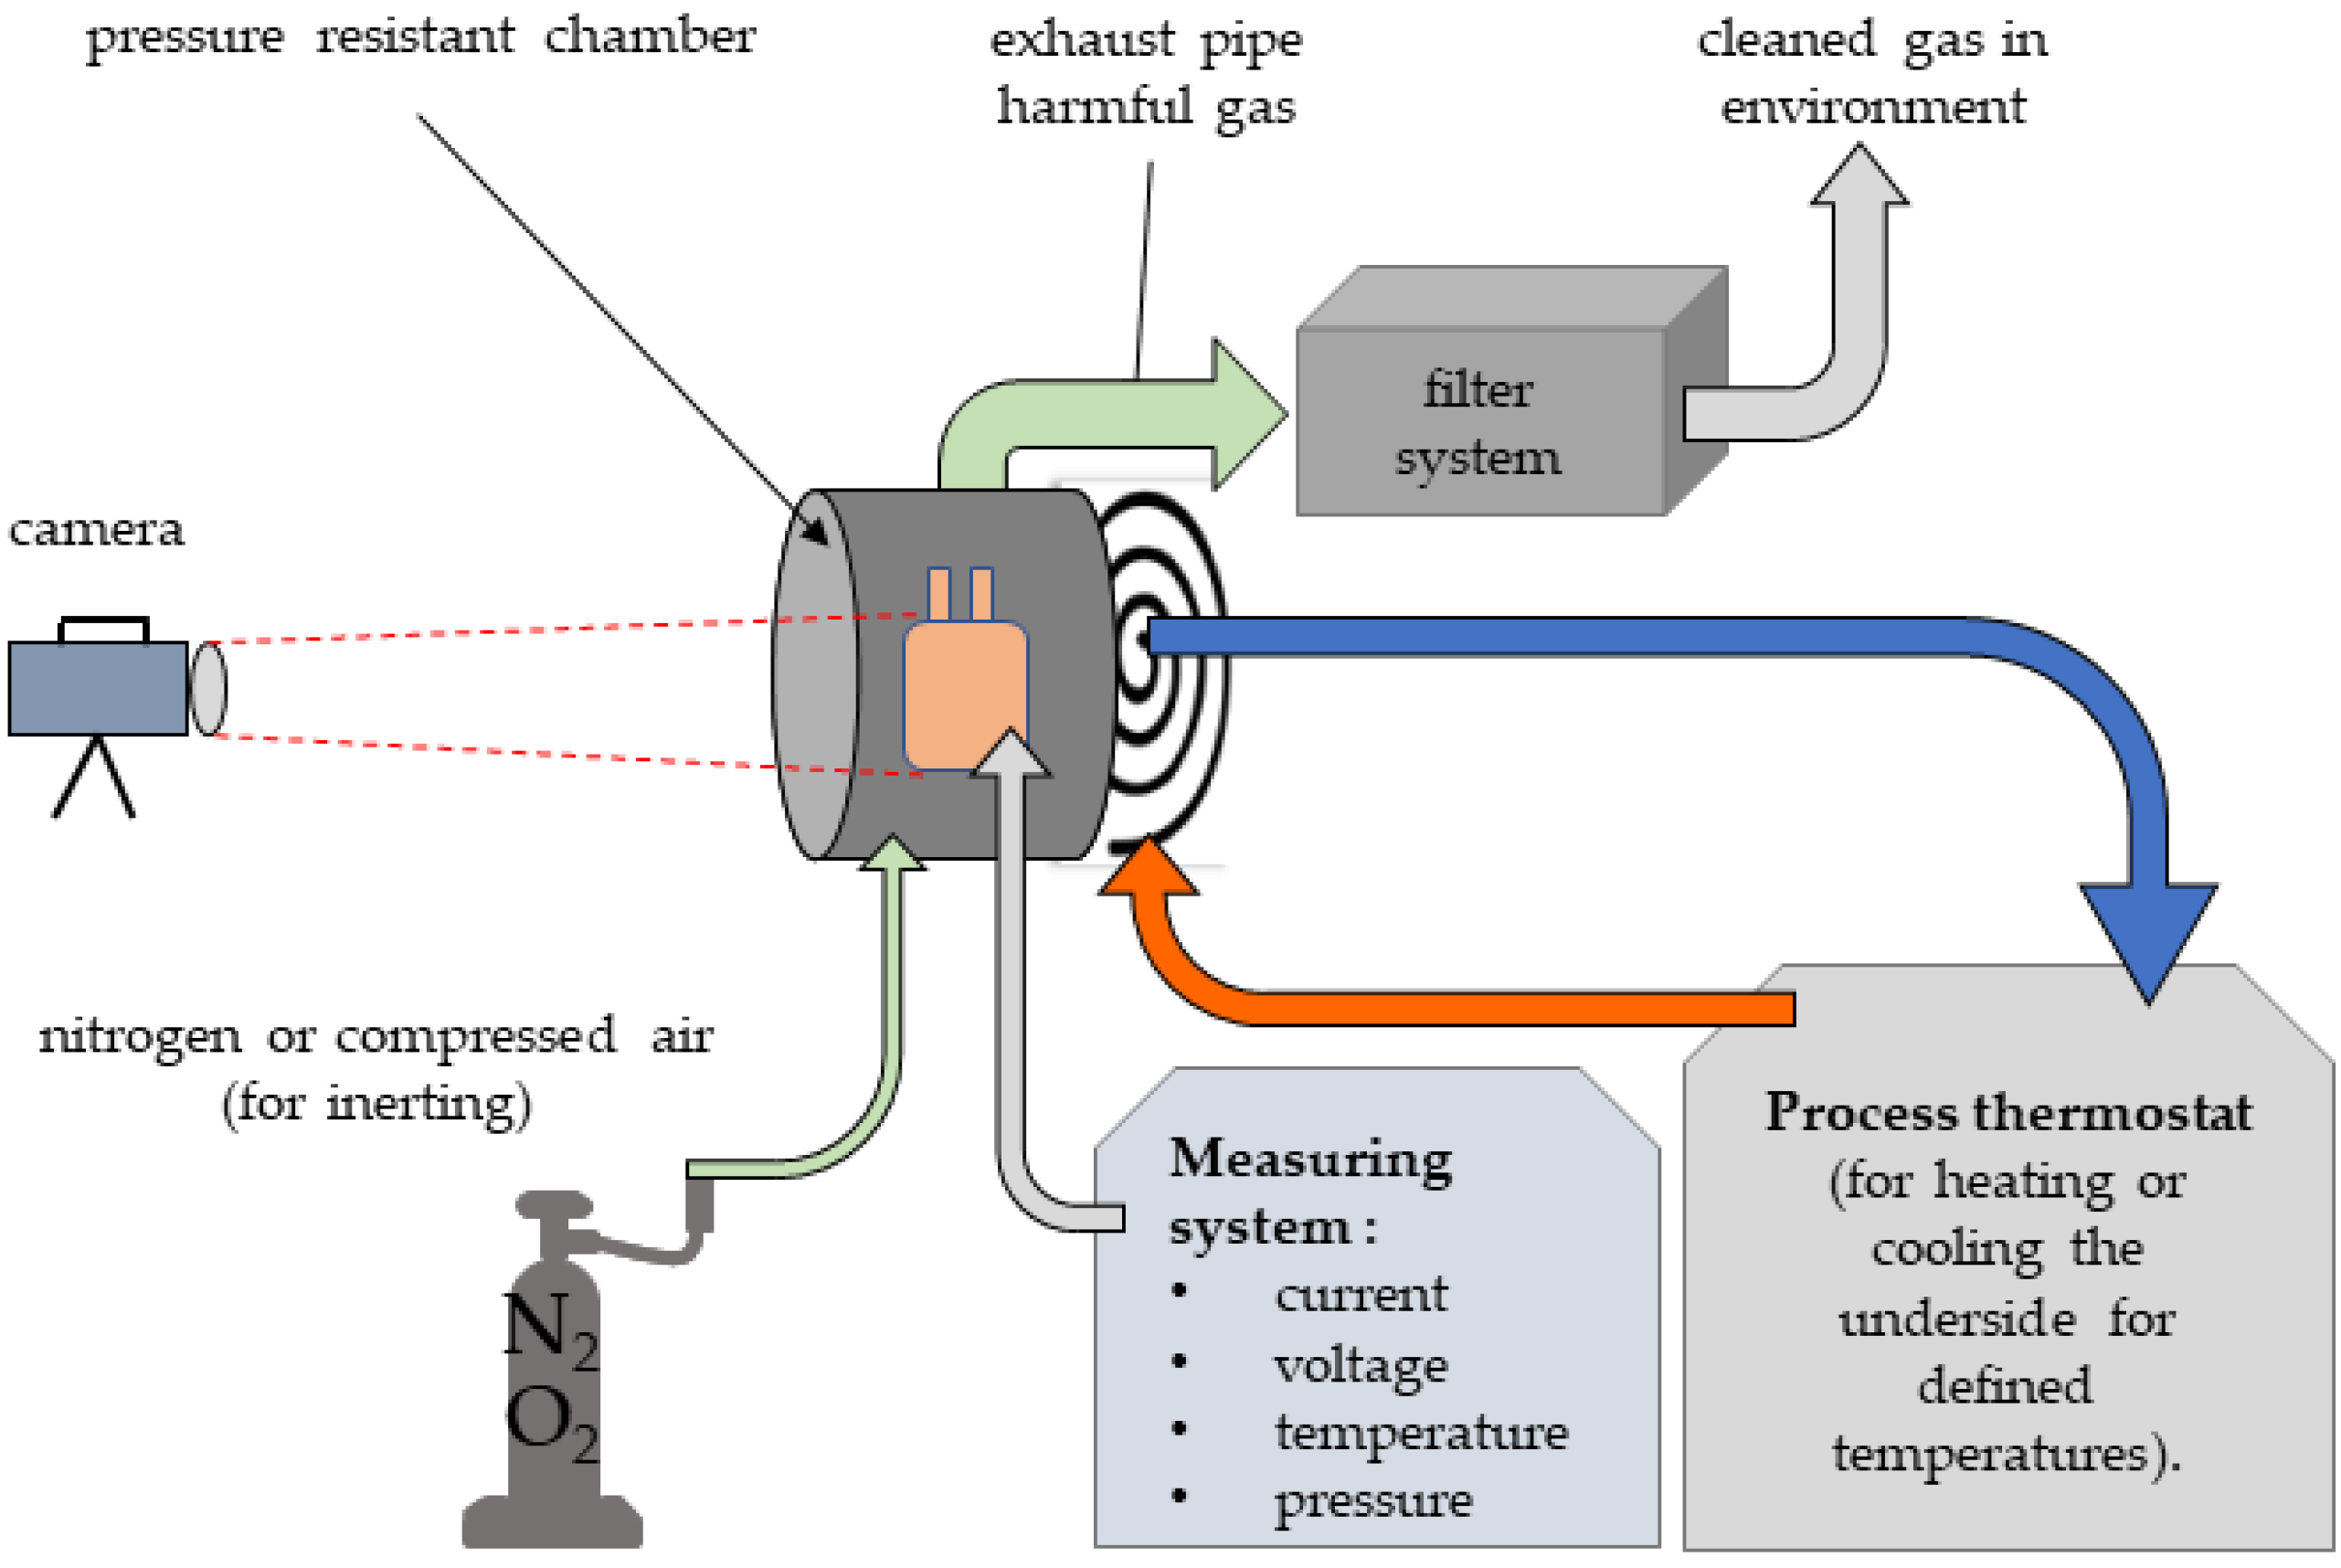
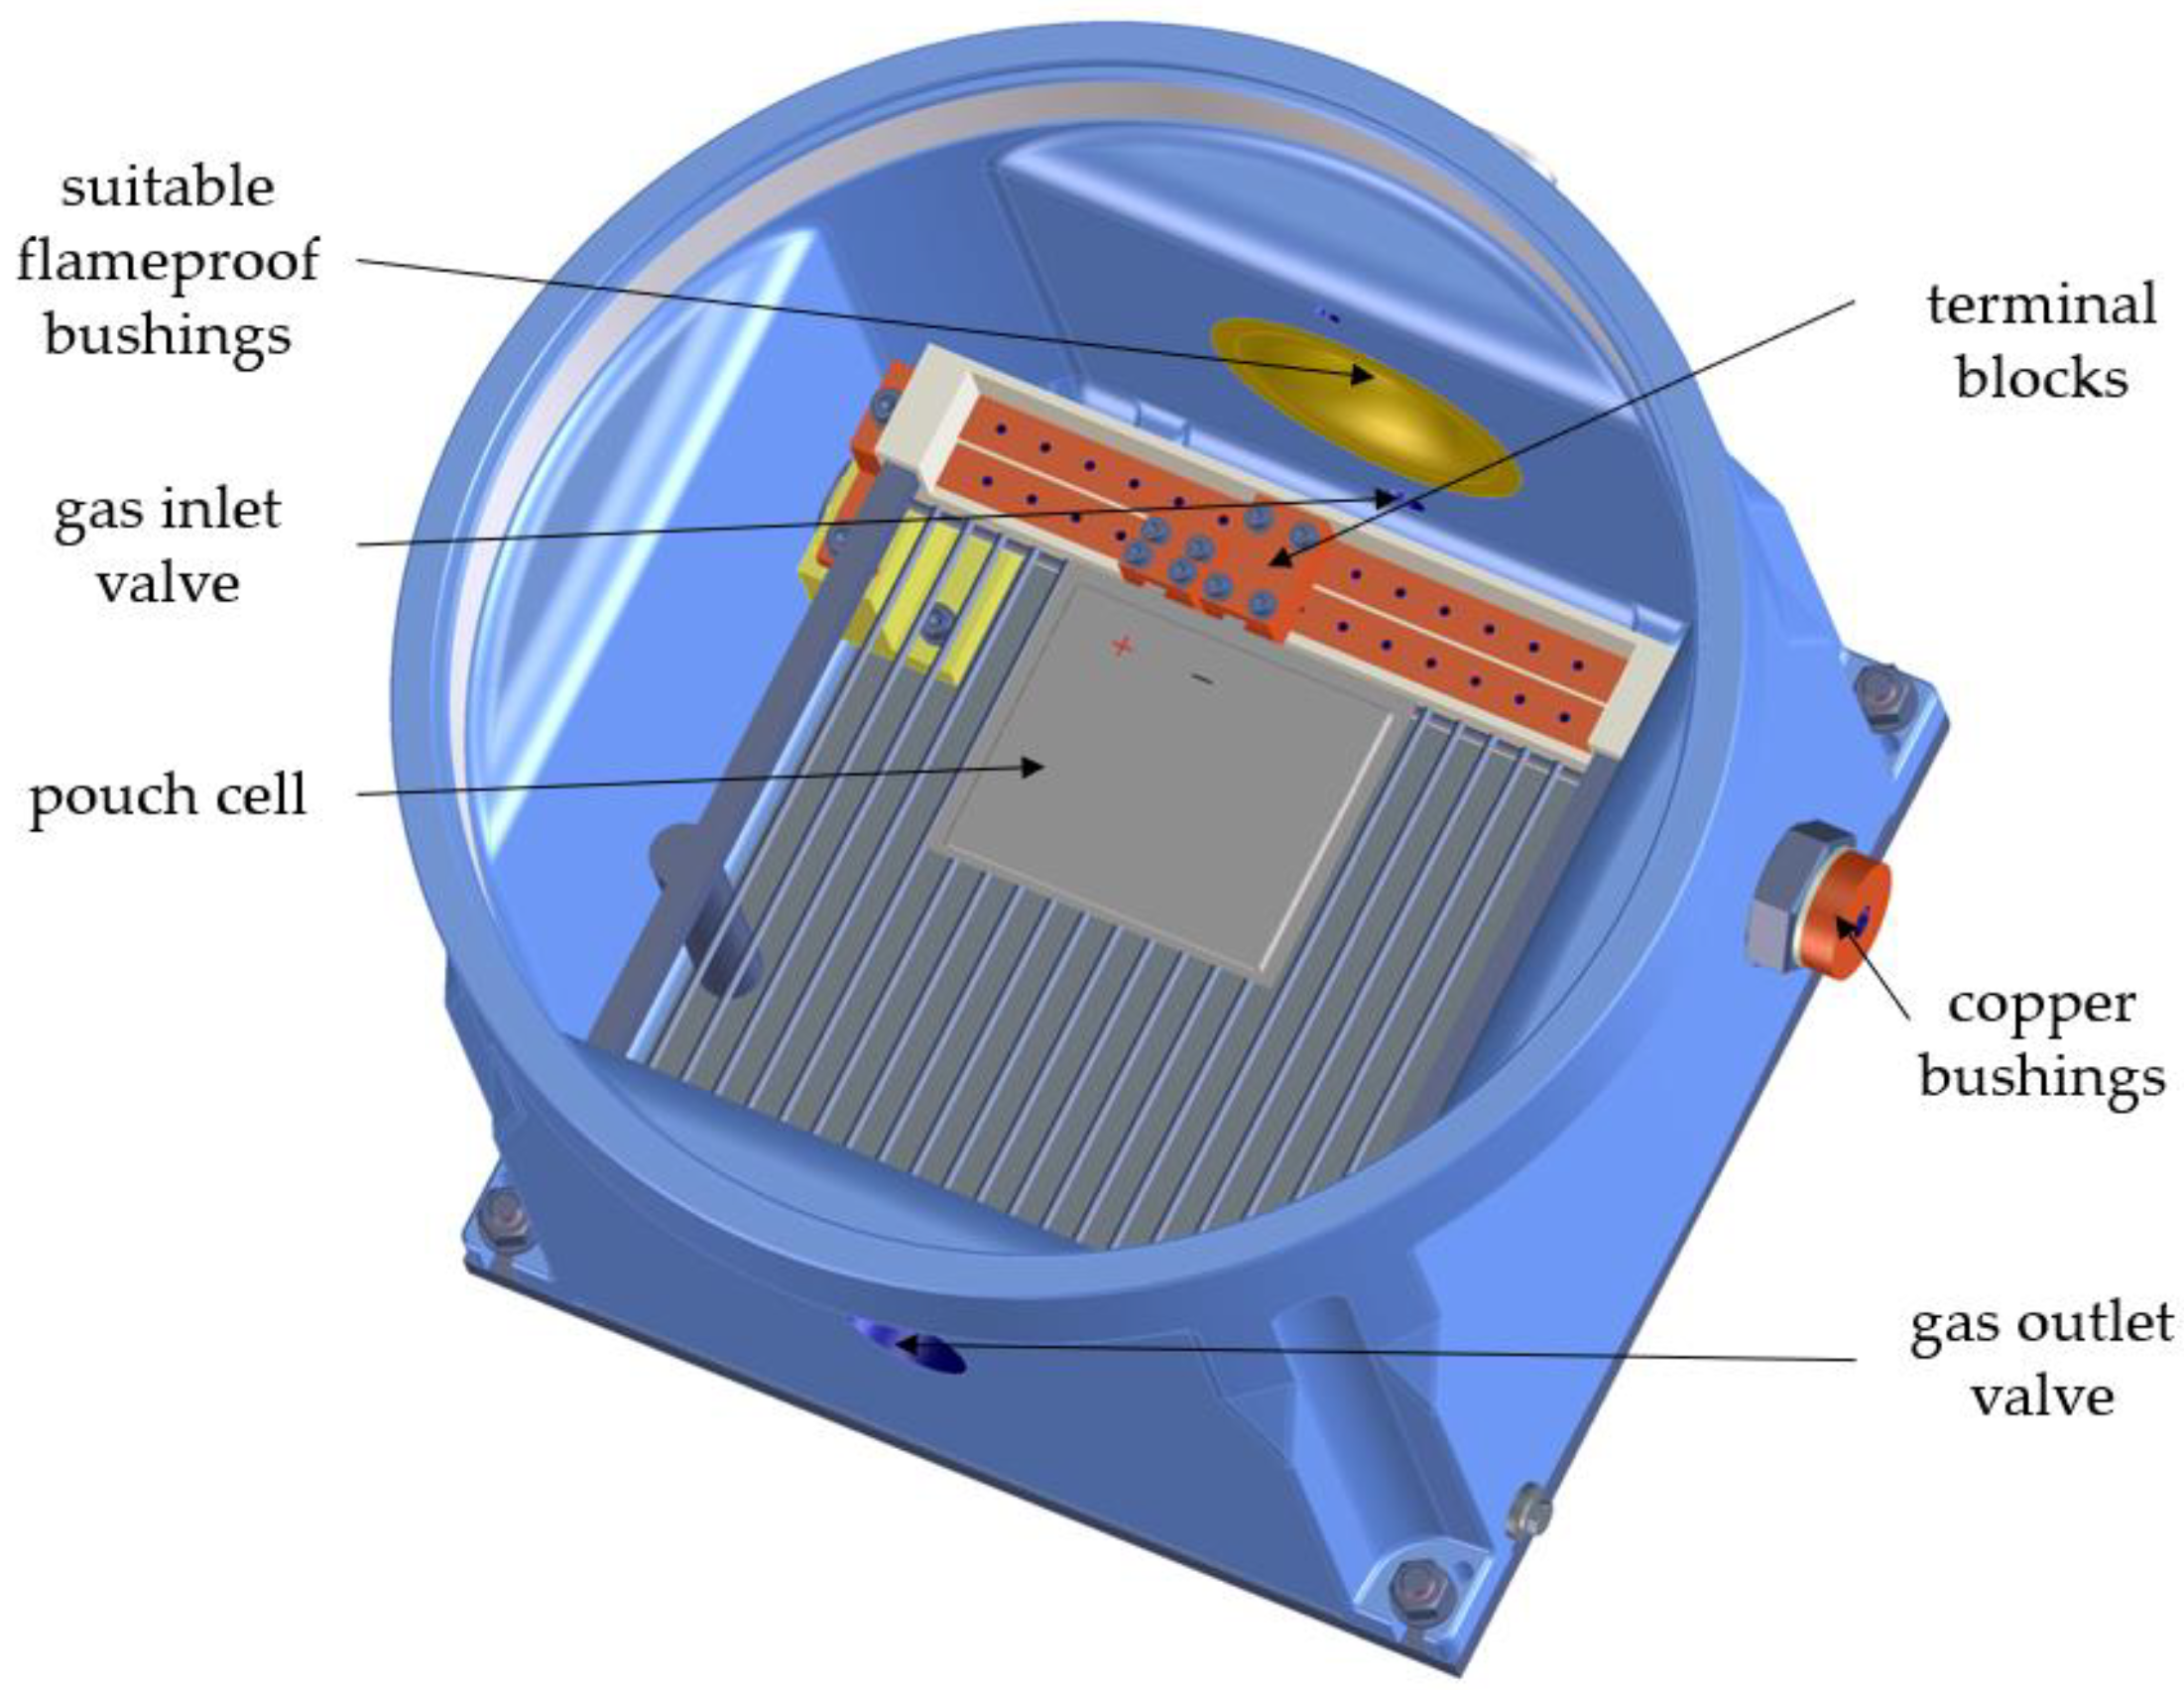
4. Materials and Methods

A high level of occupational safety is required to perform battery safety tests in thermally and electrically critical load cases. The overload tests can lead to a breakdown of the cells. In the event of an accident, high temperatures and gases that are harmful to health may be generated. A test station was designed and set up for this purpose, this is shown in Figure 10. In particular, a flameproof enclosure with appropriate functionality was constructed (Figure 11).
The flameproof enclosure consists of a chamber with a structure for contacting pouch cells. Due to the possibility of moving the terminal blocks, different pouch cell formats can be contacted. The electrical connections are led to the outside via copper bushings. The enclosure has a gas inlet and gas outlet valve to enable a purging process and to wash the resulting gas sufficiently so it can be safely released into the environment. Thermocouples for temperature measurement and measuring leads for voltage monitoring can be fed into the housing via suitable flameproof bushings. The housing is closed with a screw-on cover with a viewing window. A temperature-controlled base plate allows the housing to be regulated to a temperature of 5–50 °C by using a thermostat.
Conventionally available lithium-ion pouch cells were used for the safety tests. The cells were purchased from Inc. Kokam company. Nickel-manganese-cobalt oxide (NMC) in a 1:1:1 composition was chosen as the active material. Table 4 lists the important parameters of the cell.
The cells were examined for possible pre-damage or faulty behavior by means of a series of incoming tests. The voltage curve of a 0.5 C, 1 C, and 2 C cycle, a capacitance test, and an EIS characterization were performed. All cells used for the safety-critical tests produced unremarkable results during the input test. For the safety-critical tests, the cells were clamped between two electrically insulated stainless steel plates at a pressure of 0.08 MPa. This mimics the actual conditions of the cells in a battery system. In preliminary tests, it was also found that the cells provide more reproducible results in the clamped state. The clamping is realized by two stainless steel plates that are screwed against each other. The cell is thermally insulated by means of glass fiber fabric tape.
The cell was fully charged before the overcharge tests. Then the cell was electrically connected in the flameproof enclosure and fitted with three type K thermocouples. The overcharge was followed with the Lithium Cell MCT 100-06-6 (Digatron Power Electronics Ltd.) via the outer connections of the housing. The lines for voltage monitoring and the thermocouples were terminated to the data acquisition system 34970A with two multiplexer modules used 34902A from Inc. Keysight. The ambient temperature in the flameproof enclosure was monitored using another type of K thermocouple.
In addition to the various overload scenarios, short-circuit measurements are part of various standards. For this purpose, a short-circuit switch was designed that can realize corresponding short circuits. A very low-resistance construction is necessary. The resistance is determined by the short-circuit switch and the current shunt or possibly the current clamp.

Author Contributions

Investigation, A.S., D.K. and C.J.; Writing—original draft, A.S. and S.E.; Writing—review & editing, D.K., C.J., F.L. and M.K. All authors have read and agreed to the published version of the manuscript.

Funding

This research was funded by BMBF project “BaSS–Batteriesicherheitsstandardisierung” grant number 16EMO0318.

Data Availability Statement

Data supporting reported results can be found here: https://10.7795/720.20221021, accessed on 16 September 2022.

Conflicts of Interest

The authors declare no conflict of interest.

References

  1. Xu, B.; Sharif, A.; Shahbaz, M.; Dong, K. Have electric vehicles effectively addressed CO2 emissions? Analysis of eight leading countries using quantile-on-quantile regression approach. Sustain. Prod. Consum. 2021, 27, 1205–1214. [Google Scholar] [CrossRef]
  2. Beard, K.W. Linden’s Handbook of Batteries, 5th ed.; McGraw Hill: New York, NY, USA, 2019. [Google Scholar]
  3. Osieczko, K.; Zimon, D.; Płaczek, E.; Prokopiuk, I. Factors that influence the expansion of electric delivery vehicles and trucks in EU countries. J. Environ. Manag. 2021, 296, 113177. [Google Scholar] [CrossRef] [PubMed]
  4. He, W.; Guo, W.; Wu, H.; Lin, L.; Liu, Q.; Han, X.; Xie, Q.; Liu, P.; Zheng, H.; Wang, L.; et al. Challenges and Recent Advances in High Capacity Li-Rich Cathode Materials for High Energy Density Lithium-Ion Batteries. Adv. Mater. 2021, 33, e2005937. [Google Scholar] [CrossRef] [PubMed]
  5. Zhao, S.; Guo, Z.; Yan, K.; Wan, S.; He, F.; Sun, B.; Wang, G. Towards high-energy-density lithium-ion batteries: Strategies for developing high-capacity lithium-rich cathode materials. Energy Storage Mater. 2021, 34, 716–734. [Google Scholar] [CrossRef]
  6. Edström, K.; Dominko, R.; Fichtner, M.; Perraud, S. Battery 2030+ Roadmap; Uppsala University: Uppsala, Sweden, 2020. [Google Scholar]
  7. Tarascon, J.M.; Armand, M. Issues and challenges facing rechargeable lithium batteries. Nature 2001, 414, 359–367. [Google Scholar] [CrossRef] [PubMed]
  8. Chen, Y.; Kang, Y.; Zhao, Y.; Wang, L.; Liu, J.; Li, Y.; Liang, Z.; He, X.; Li, X.; Tavajohi, N.; et al. A review of lithium-ion battery safety concerns: The issues, strategies, and testing standards. J. Energy Chem. 2021, 59, 83–99. [Google Scholar] [CrossRef]
  9. IEC 62660-2; Secondary Lithium-Ion Cells for the Propulsion of Electric Road Vehicles: Part 2: Reliability and Abuse Testing, 2nd ed. International Electrotechnical Commission (IEC): Geneva, Switzerland, 2018.
  10. IEC 62660-3; Secondary Lithium-Ion Cells for the Propulsion of Electric Road Vehicles: Part 3: Safety Requirements, 2nd ed. International Electrotechnical Commission (IEC): Geneva, Switzerland, 2022; p. 201.
  11. IEC 62133-2; Secondary Cells and Batteries Containing Alkaline or Other non-Acid Electrolytes-Safety Requirements for Portable Sealed Secondary Cells, and for Batteries made from Them, for Use in Portable Applications: Part 2: Lithium Systems, 1st ed. International Electrotechnical Commission (IEC): Geneva, Switzerland, 2021.
  12. ISO 12405-4; Electrically Propelled Road Vehicles–Test Specification for Lithium-Ion Traction Battery Packs and Systems: Part 4: Performance Testing, 1st ed. International Organization for Standardization (ISO): Geneva, Switzerland, 2018.
  13. Zeng, Y.; Wu, K.; Wang, D.; Wang, Z.; Chen, L. Overcharge investigation of lithium-ion polymer batteries. J. Power Sources 2006, 160, 1302–1307. [Google Scholar] [CrossRef]
  14. Juarez-Robles, D.; Vyas, A.A.; Fear, C.; Jeevarajan, J.A.; Mukherjee, P.P. Overcharge and Aging Analytics of Li-Ion Cells. J. Electrochem. Soc. 2020, 167, 90547. [Google Scholar] [CrossRef]
  15. Chen, Z.; Qin, Y.; Amine, K. Redox shuttles for safer lithium-ion batteries. Electrochim. Acta 2009, 54, 5605–5613. [Google Scholar] [CrossRef]
  16. Wang, Y.; Tian, J.; Sun, Z.; Wang, L.; Xu, R.; Li, M.; Chen, Z. A comprehensive review of battery modeling and state estimation approaches for advanced battery management systems. Renew. Sustain. Energy Rev. 2020, 131, 110015. [Google Scholar] [CrossRef]
  17. Xiong, R.; Li, L.; Tian, J. Towards a smarter battery management system: A critical review on battery state of health monitoring methods. J. Power Sources 2018, 405, 18–29. [Google Scholar] [CrossRef]
  18. Larsson, F.; Mellander, B.-E. Abuse by External Heating, Overcharge and Short Circuiting of Commercial Lithium-Ion Battery Cells. J. Electrochem. Soc. 2014, 161, A1611–A1617. [Google Scholar] [CrossRef]
  19. Sauer, D.U. Grundlagen der Impedanspektroskopie für die Charakterisierung von Batterien. Tech. Mitt. 2006, 99, 74–80. [Google Scholar]
  20. Kriston, A.; Pfrang, A.; Döring, H.; Fritsch, B.; Ruiz, V.; Adanouj, I.; Kosmidou, T.; Ungeheuer, J.; Boon-Brett, L. External short circuit performance of Graphite-LiNi1/3Co1/3Mn1/3O2 and Graphite-LiNi0.8Co0.15Al0.05O2 cells at different external resistances. J. Power Sources 2017, 361, 170–181. [Google Scholar] [CrossRef]
  21. Diekmann, J.; Kwade, A. Recycling of Lithium-Ion Batteries: The LithoRec Way; Springer: Braunschweig, Germany, 2017. [Google Scholar]
  22. Lv, S.; Wang, X.; Lu, W.; Zhang, J.; Ni, H. The Influence of Temperature on the Capacity of Lithium Ion Batteries with Different Anodes. Energies 2022, 15, 60. [Google Scholar] [CrossRef]
Figure 1. Comparison of a clamped and unclamped cell at a charging current of 1 C and an ambient temperature of 20 ± 2 °C. (a) Voltage profile; (b) Temperature profile.
Energies 15 07930 g001
Figure 2. (a) Voltage profiles of different cells at a charging current of 1 C and an ambient temperature of 20 °C ± 2 °C; (b) Opening points of the cells during overcharge.
Energies 15 07930 g002
Figure 3. Two cells with different charging currents and an ambient temperature of 20 ± 2 °C (a) Voltage profiles, (b) Temperature profiles.
Energies 15 07930 g003
Figure 4. Equivalent circuit of the lithium-ion cell.
Energies 15 07930 g004
Figure 5. Comparison of electrochemical impedance spectroscopy before and after overcharging with a current of 1 C and an ambient temperature of 20 ± 2 °C.
Energies 15 07930 g005
Figure 6. Voltage and current profile at short-circuit test at Tambient = 20 ± 2 °C. The red line describes the moment when the short circuit is canceled again.
Energies 15 07930 g006
Figure 7. Relationship between internal resistance and short-circuit resistance.
Energies 15 07930 g007
Figure 8. Short-circuit at Tambient = 20 °C ± 2 °C. (a) Voltage; (b) Current; (c) Temperature; (d) Current peaks in current profile cell 256.
Energies 15 07930 g008
Figure 9. Short-circuit at different ambient temperatures. (a) Current; (b) Temperature.
Energies 15 07930 g009
Figure 10. Overview Test setup.
Energies 15 07930 g010
Figure 11. Flameproof enclosure for conducting electrical thermal tests.
Energies 15 07930 g011
Table 1. Overview of selected standards [9,10,11,12].
StandardApplication
IEC 62660-2 Electric vehicles-
Abuse test
IEC 62660-3Electric vehicles-
Safety tests
ISO 12405-2Electric Vehicles-
High Energy Applications
IEC 62133-2Use in portable devices
Table 2. Comparison of the parameters for an overload [9,10,11,12].
StandardSoCCharging CurrentAmbient Temperature Termination
Criteria
Failure
Criteria
IEC 62660-2100%Agreement with manufacturer20 °CAgreement with manufacturerFire and/or explosion
IEC 62660-3100%1 C20 °C120% voltage
130% capacity
ISO 12405-2100%1 C20 °C130% voltage
55 °C
IEC 62133-20%2 C20 °C140% voltage
Table 3. Comparison of the parameters for a short-circuit test [9,10,11,12].
StandardSoCShort-Circuit
Resistor
Ambient Temperature Termination
Criteria
Failure
Criteria
IEC 62660-2100%<5 mΩ20 °C10 minFire and/or explosion
IEC 62660-3100%<5 mΩ20 °C10 min
ISO 12405-2100%20 mΩ (−10 mΩ)20 °C10 min
IEC 62133-2100%80 mΩ ± 20 mΩ55 °C ± 5 °C24 h
Table 4. Pouch cell data.
ItemValue
Cell chemistryNMC
Cell capacity5 Ah
Voltage range2.7–4.2 V
Maximum discharge current25 A
Maximum charging current10 A
Cell weight120 g
Cell dimensionsLength: 102 mm
Width: 107 mm
Thickness: 5.9 mm
Publisher’s Note: MDPI stays neutral with regard to jurisdictional claims in published maps and institutional affiliations.

