

Geochemical Characteristics of the Chang 7 Source Rocks of the Triassic Yanchang Formation in Ordos Basin, China: Implications for Organic Matter Accumulation and Shale Oil Potential
Abstract
1. Introduction
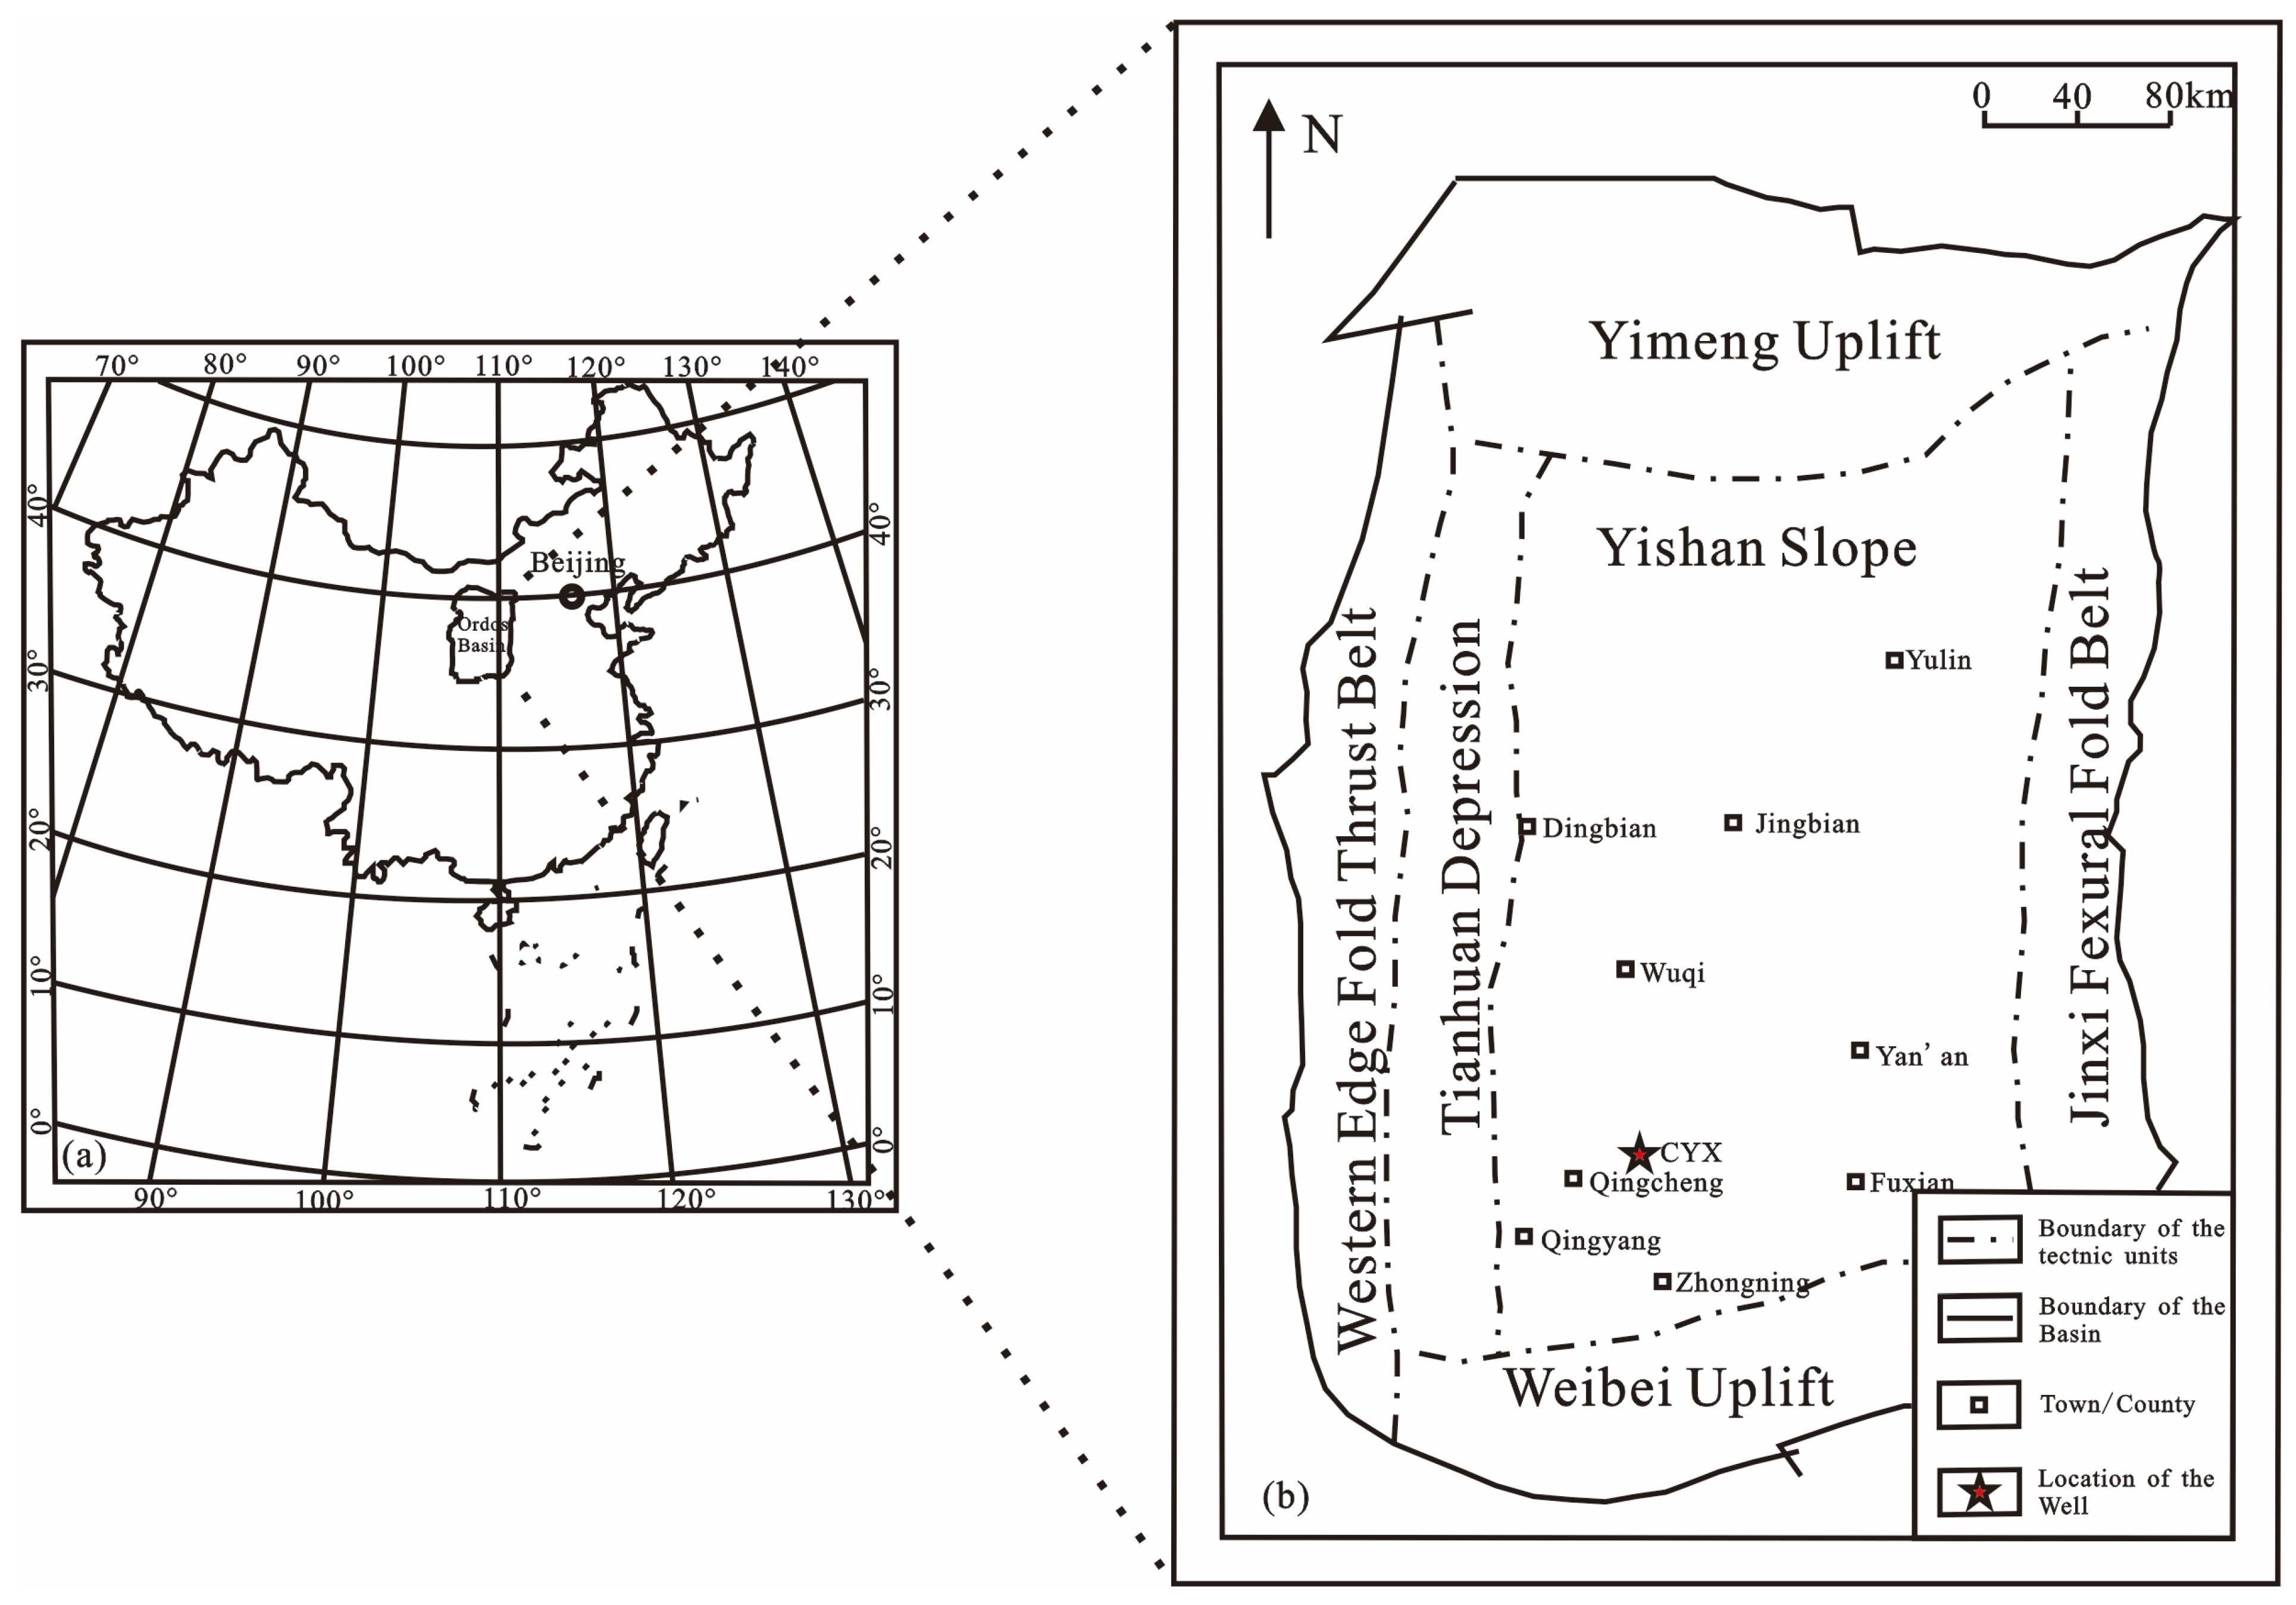
2. Geological Setting
3. Materials and Methods
3.1. Sample Description
3.2. Rock-Eval Pyrolysis and TOC
3.3. GC-MS Analysis
4. Results and Discussion
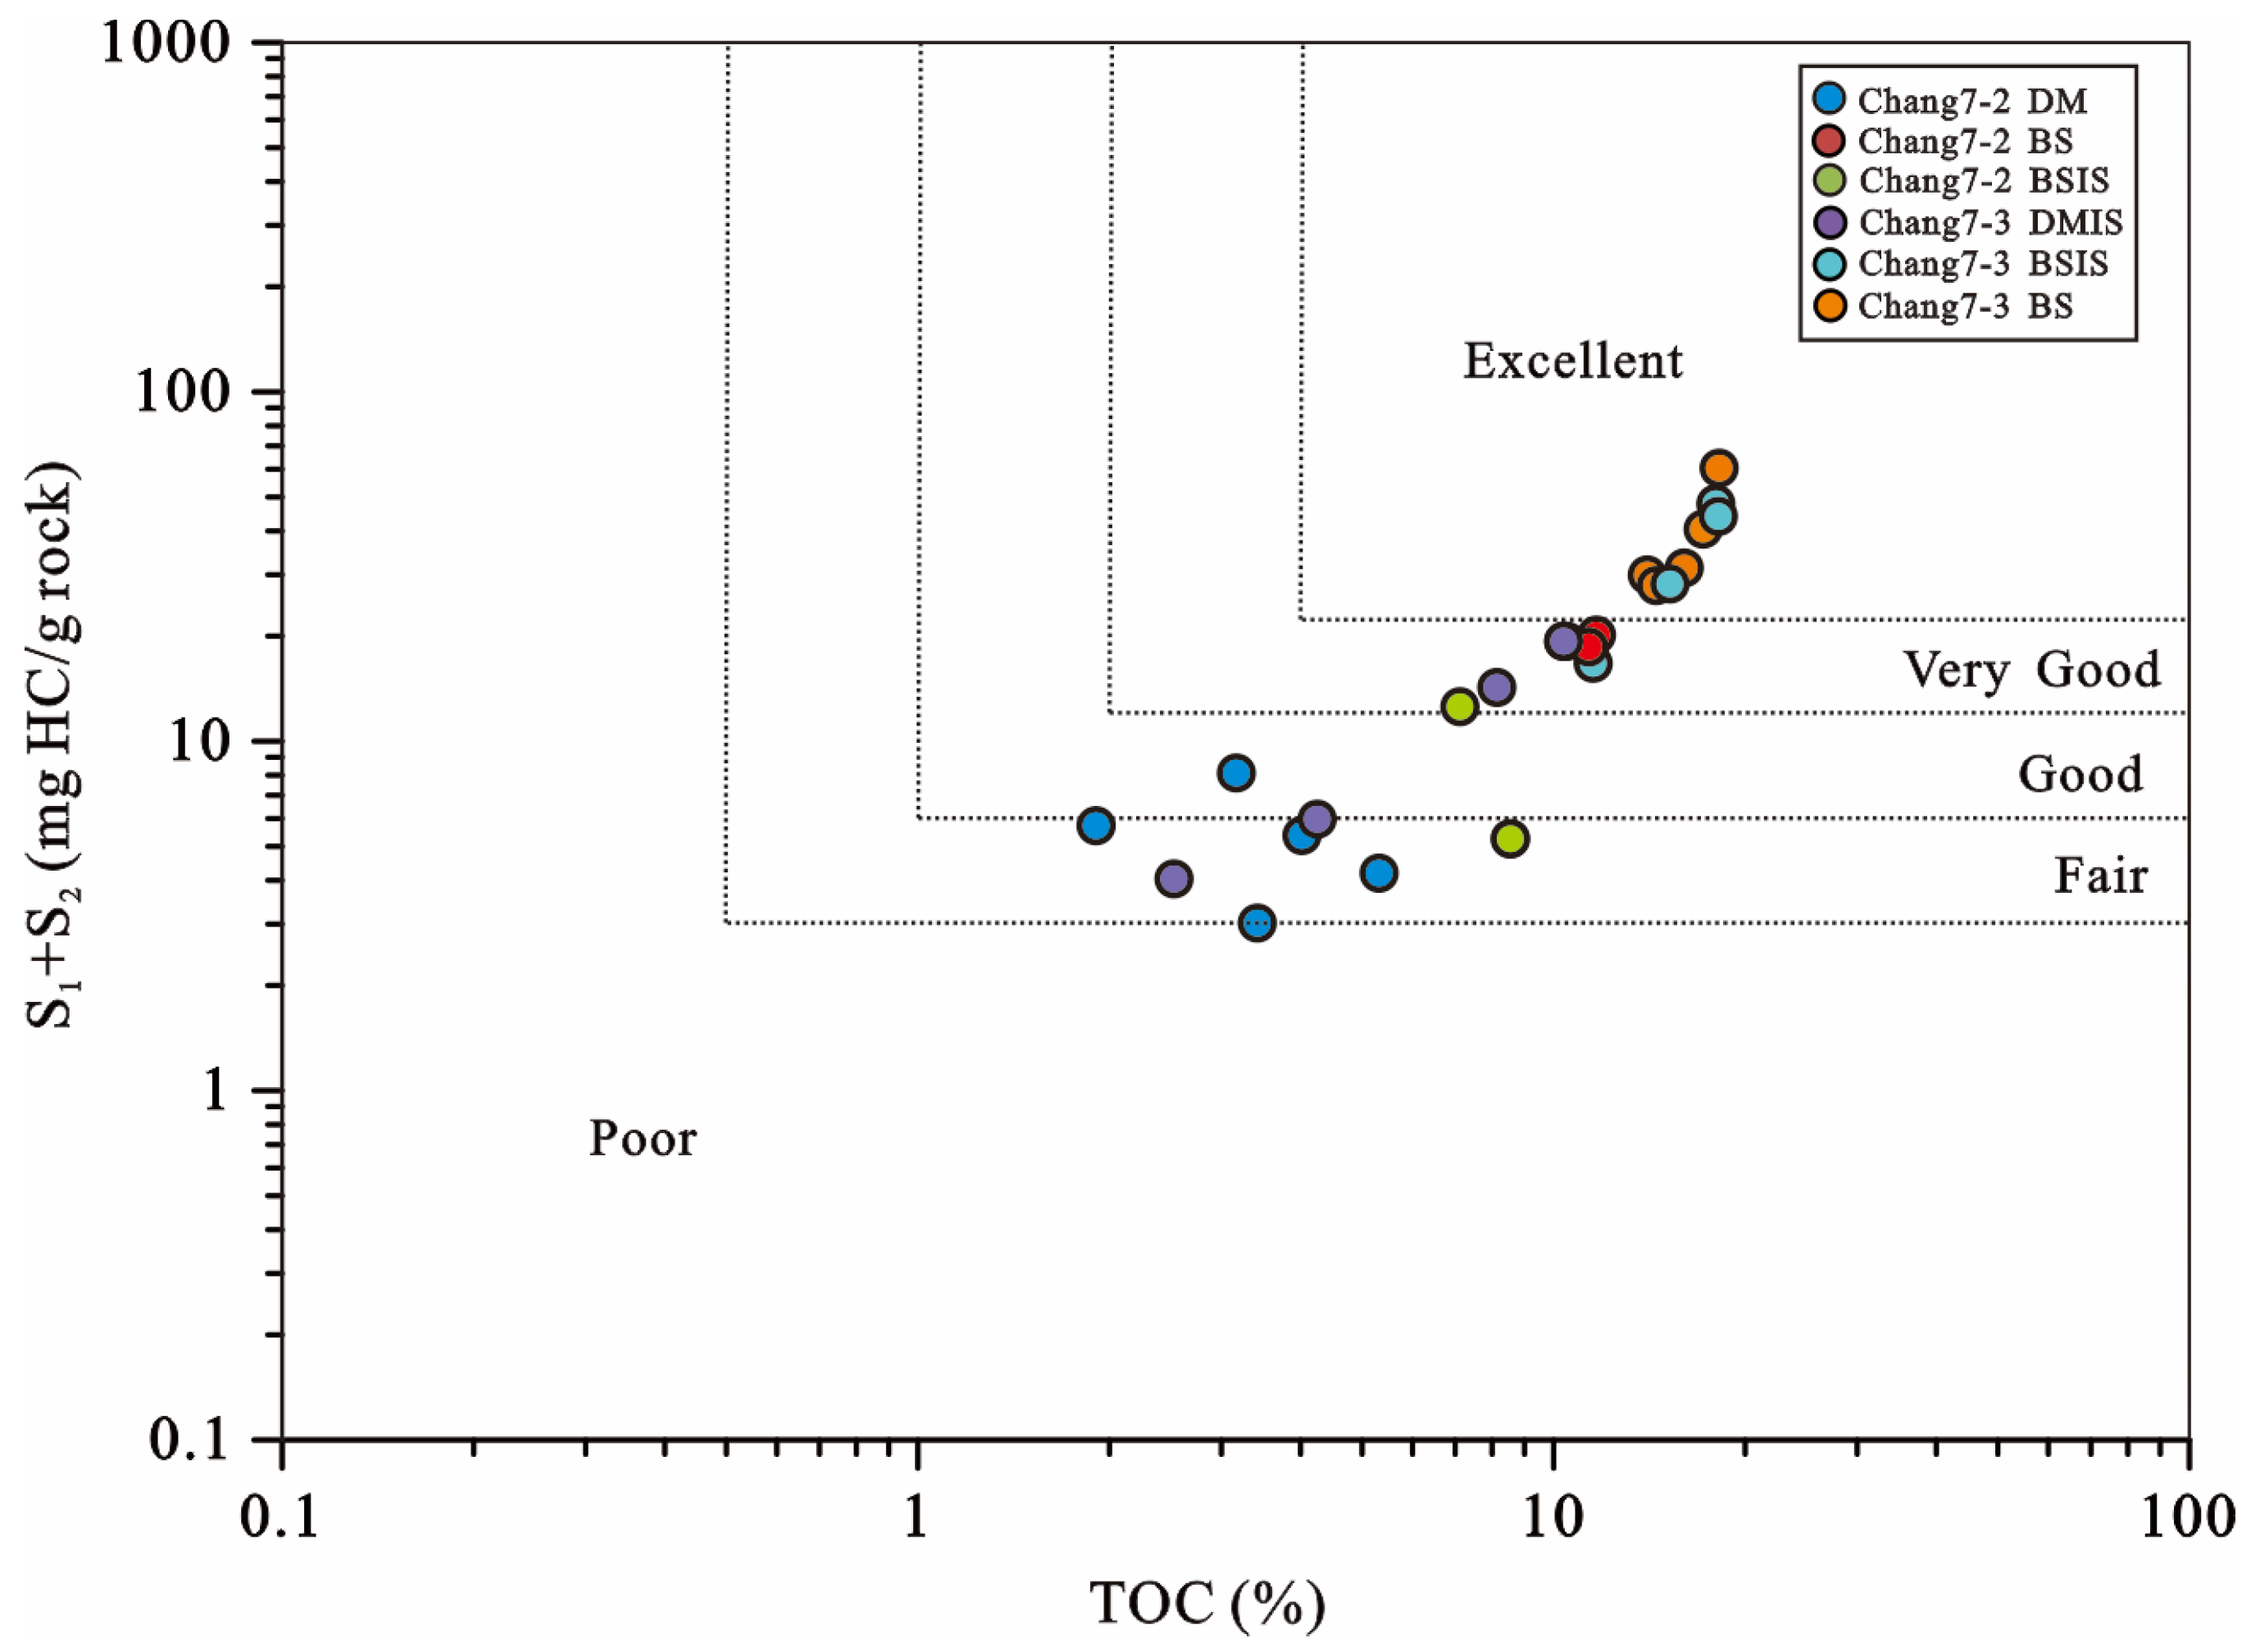
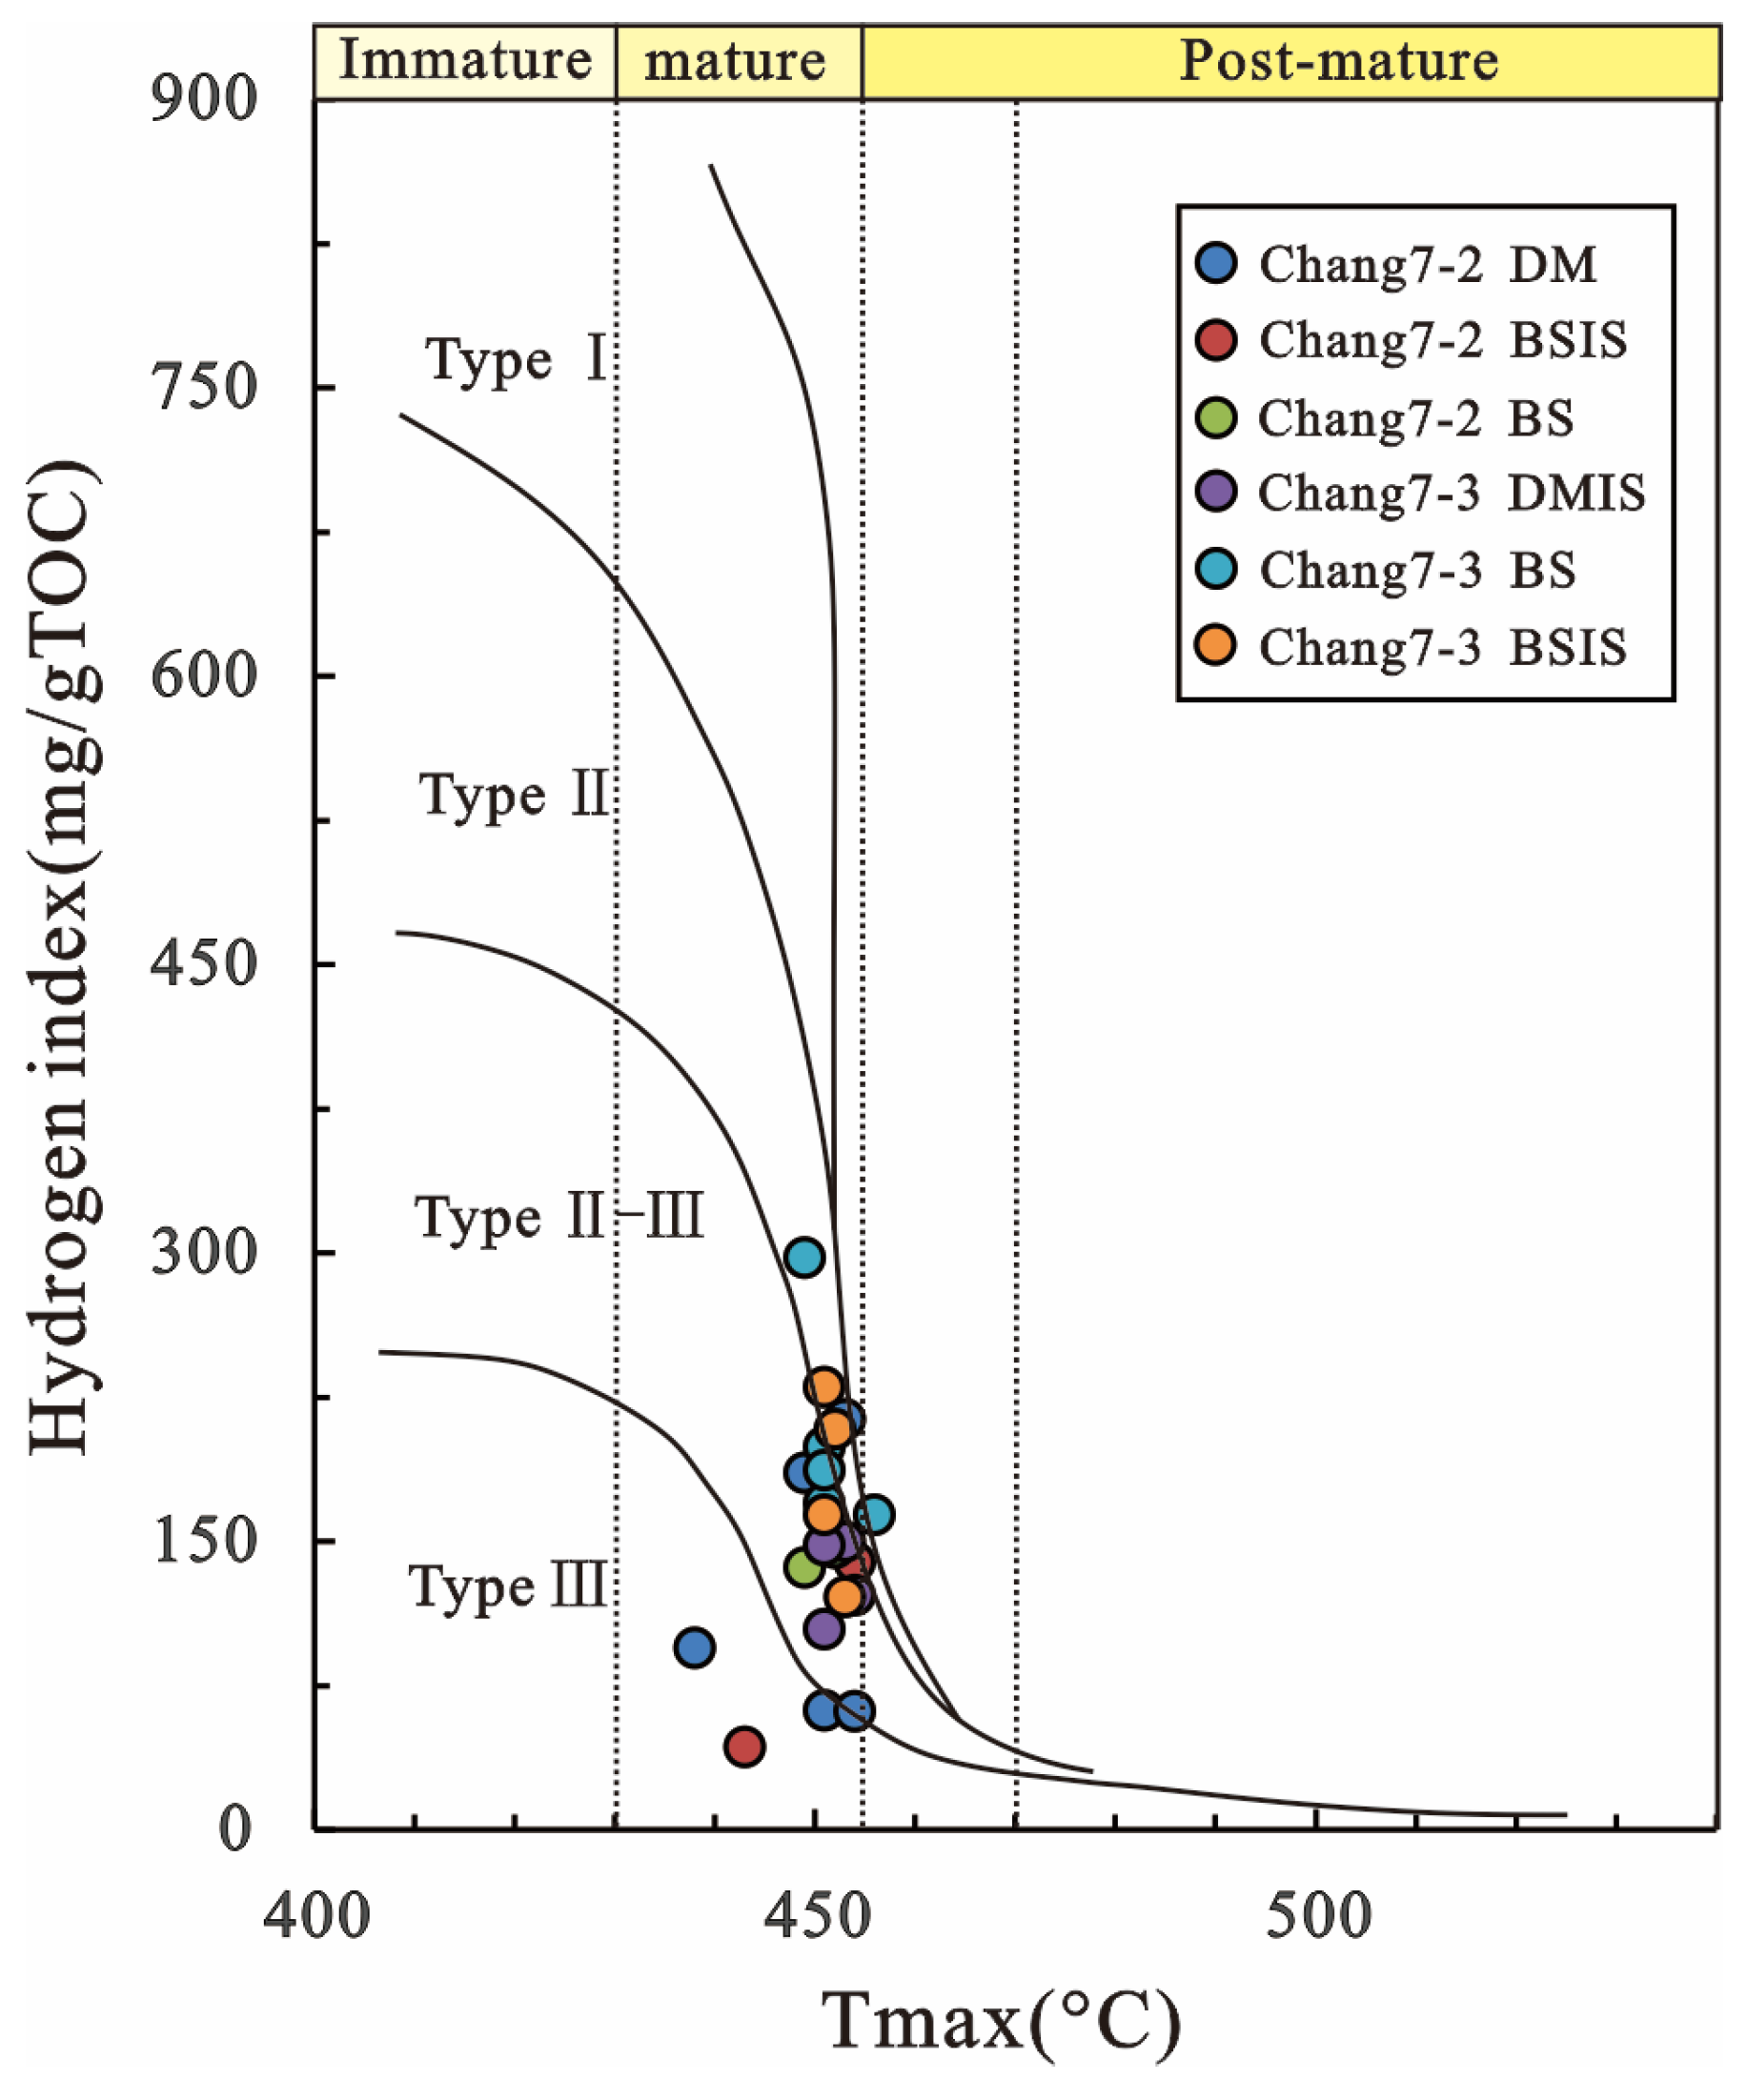
4.1. Bulk Geochemical Data and Petroleum Generation Potential
4.2. GC-MS Analysis
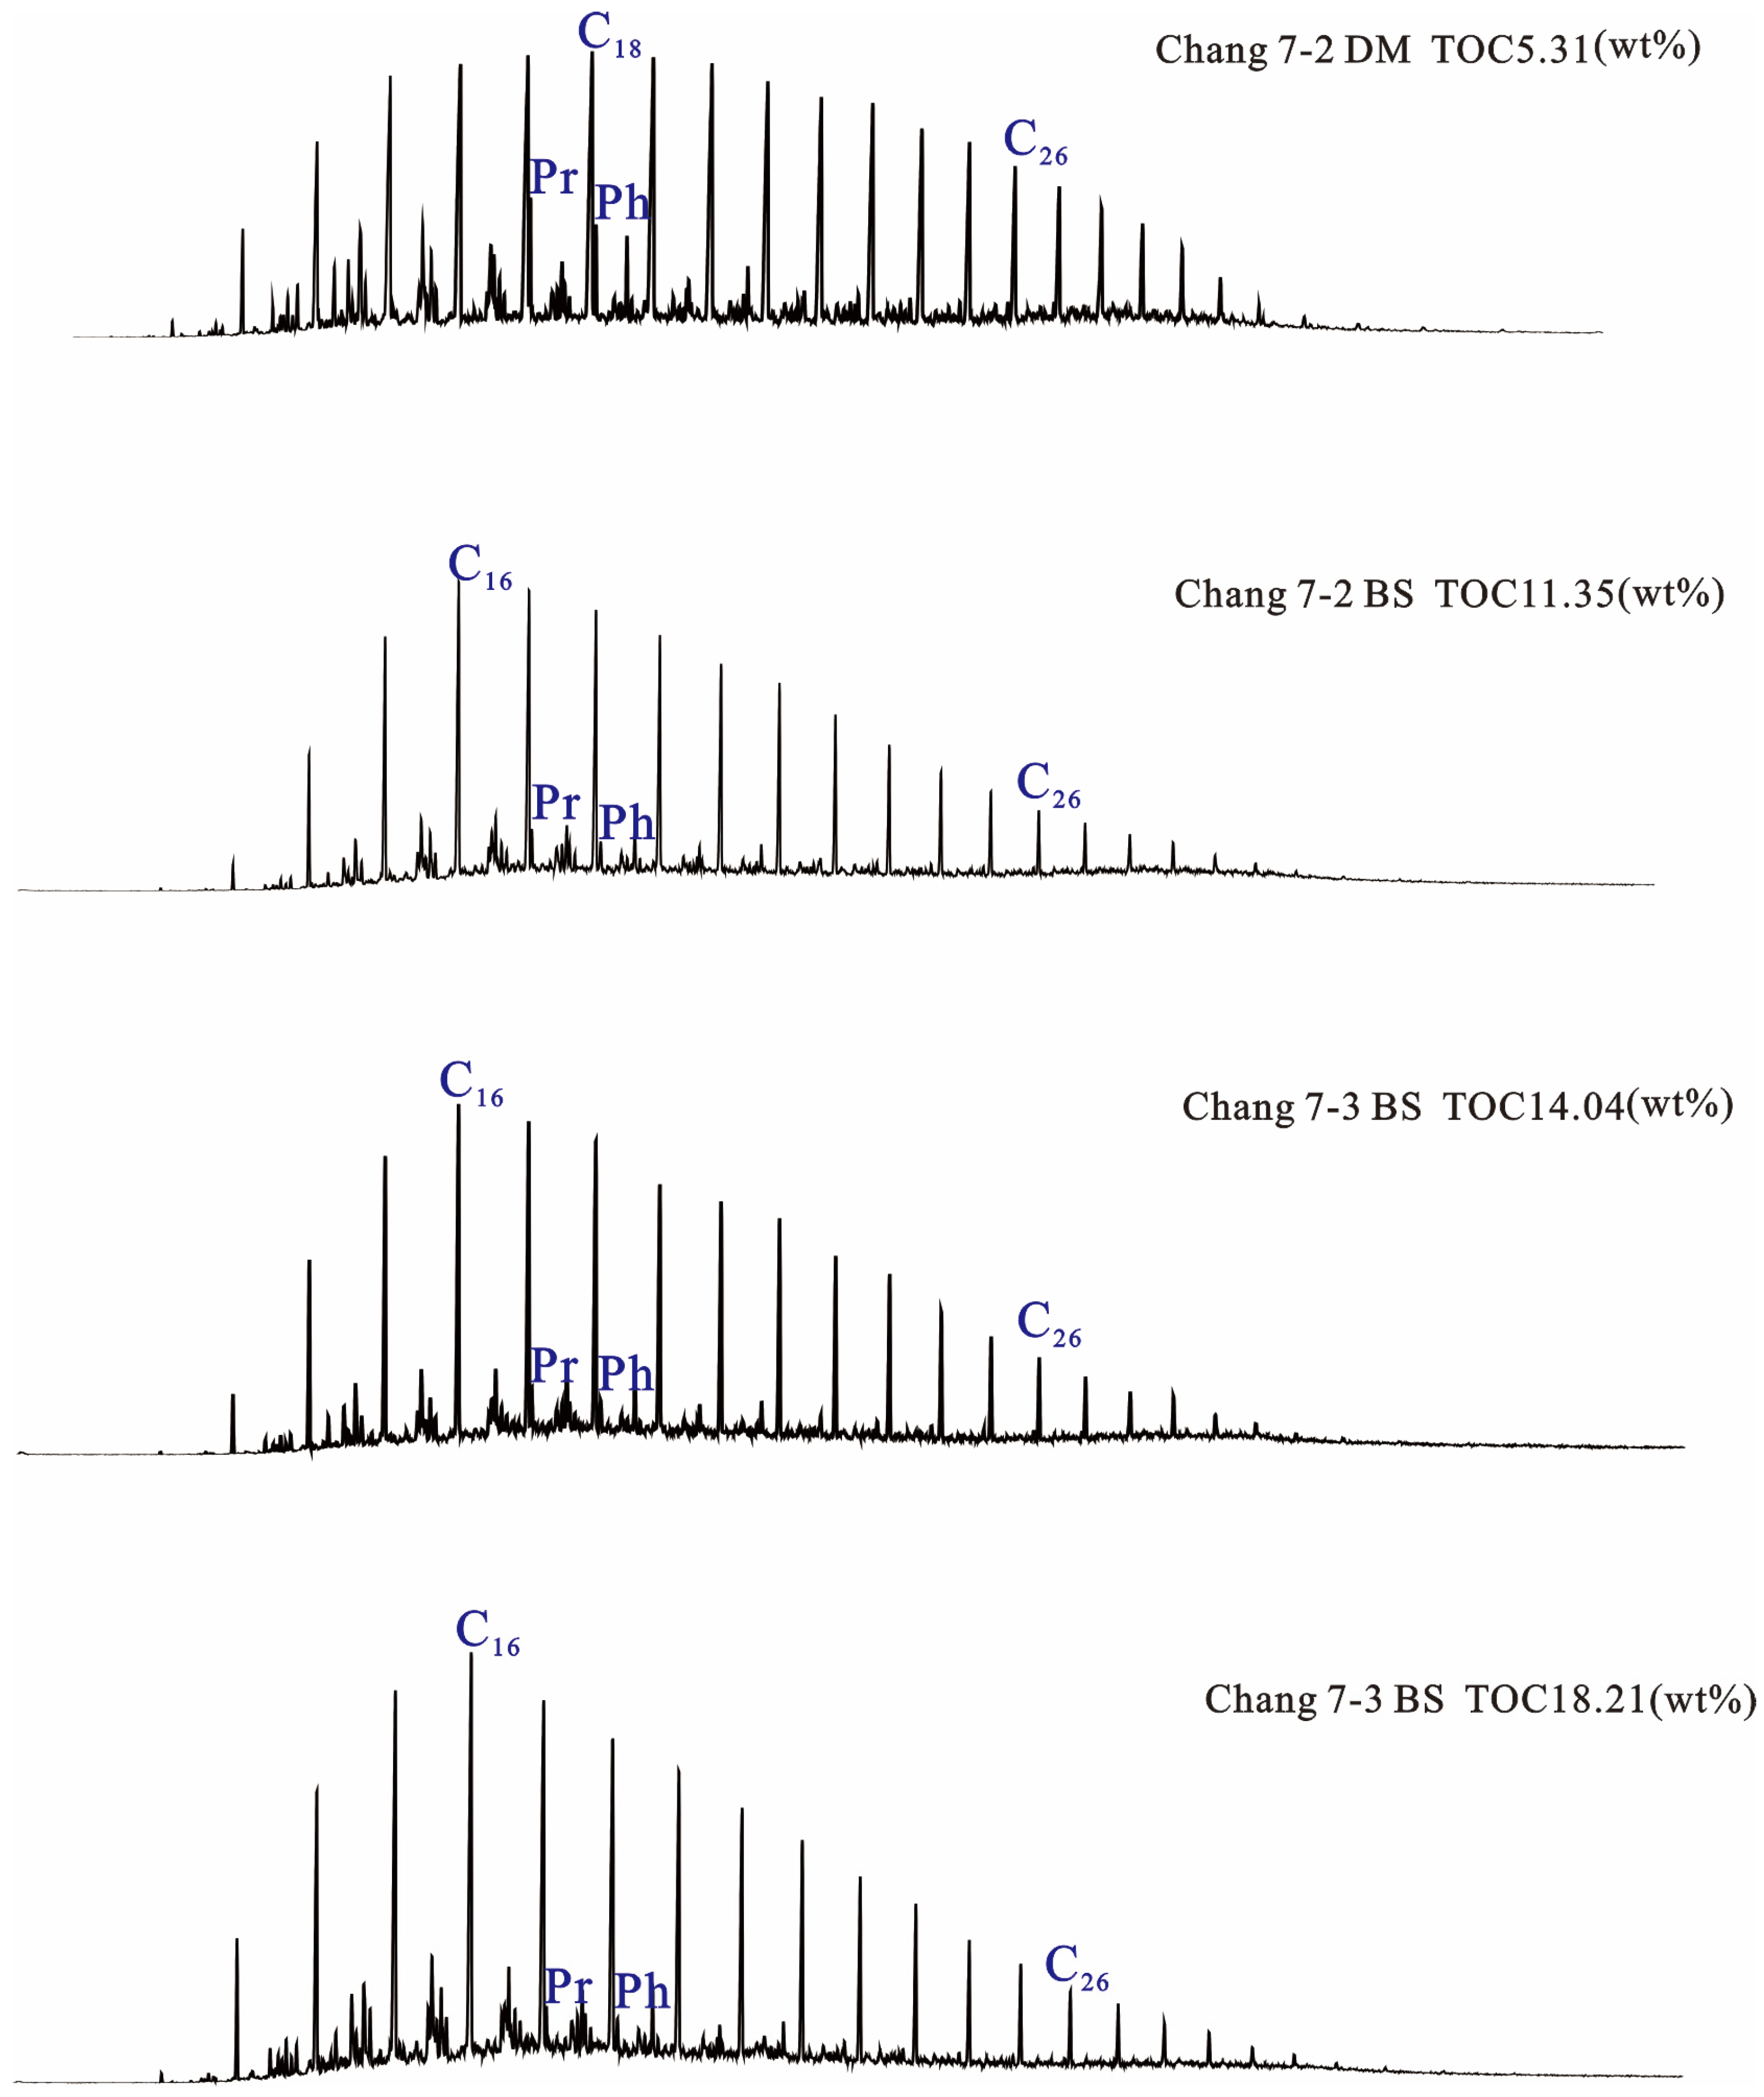
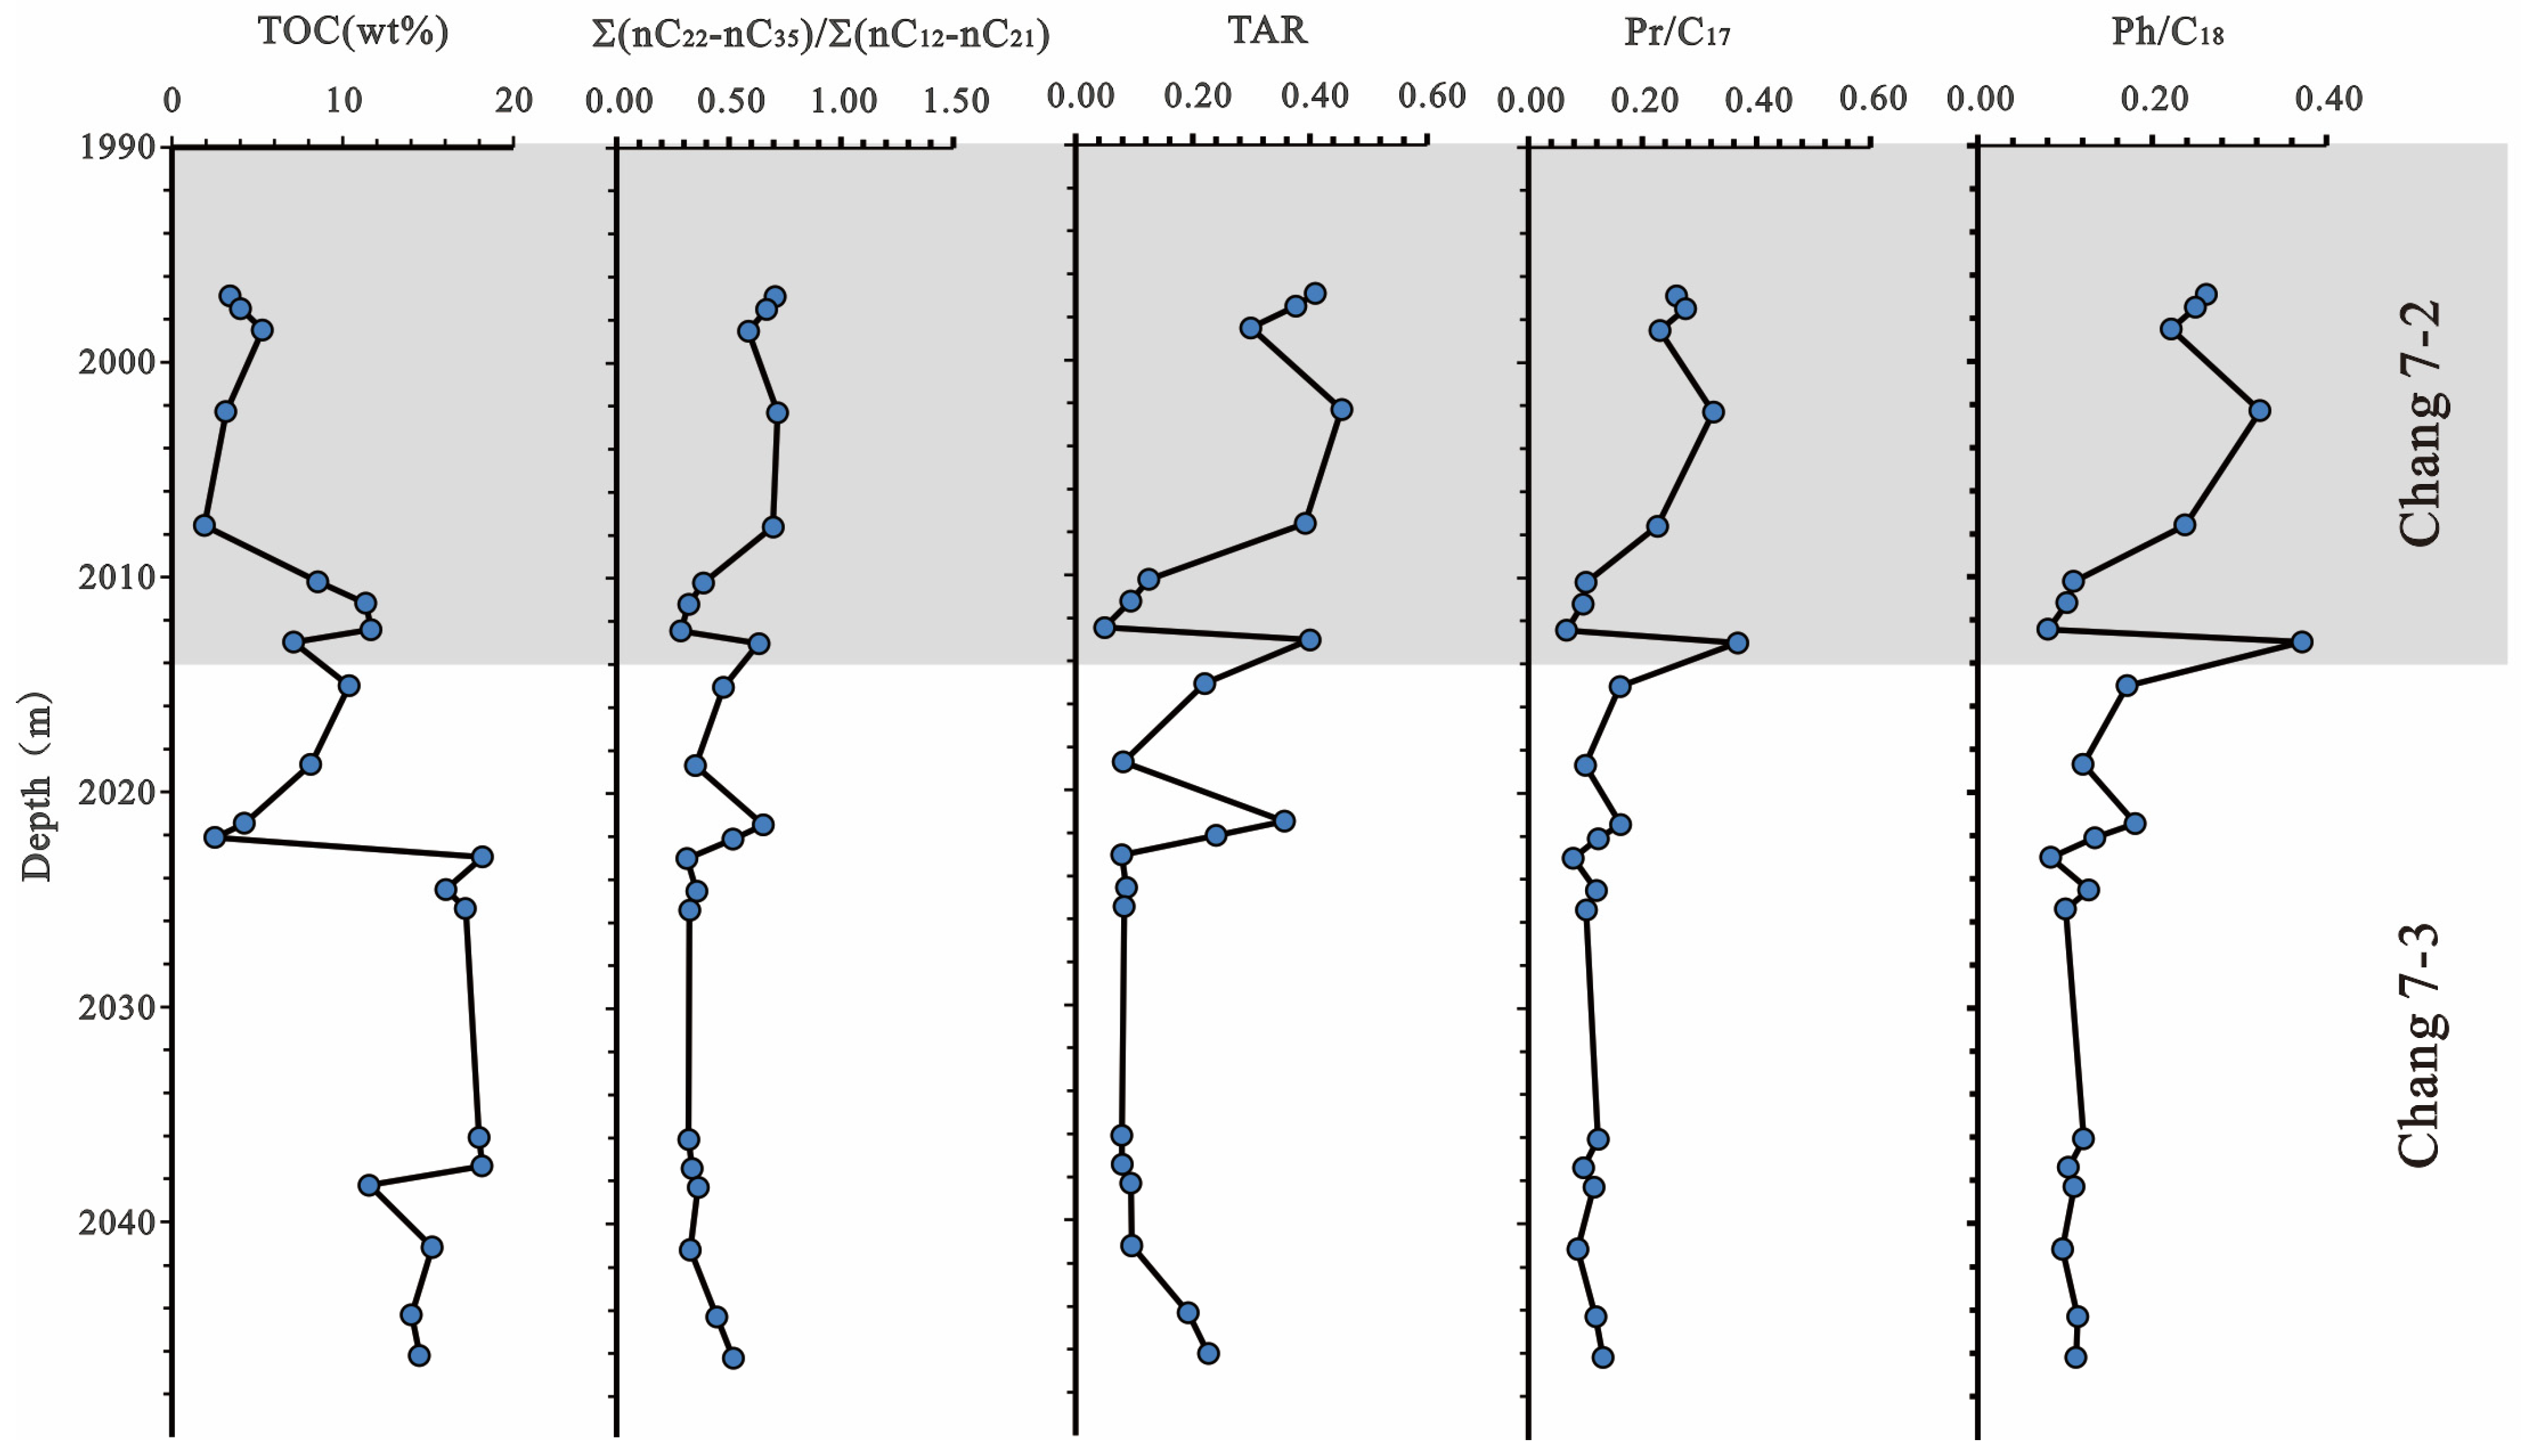
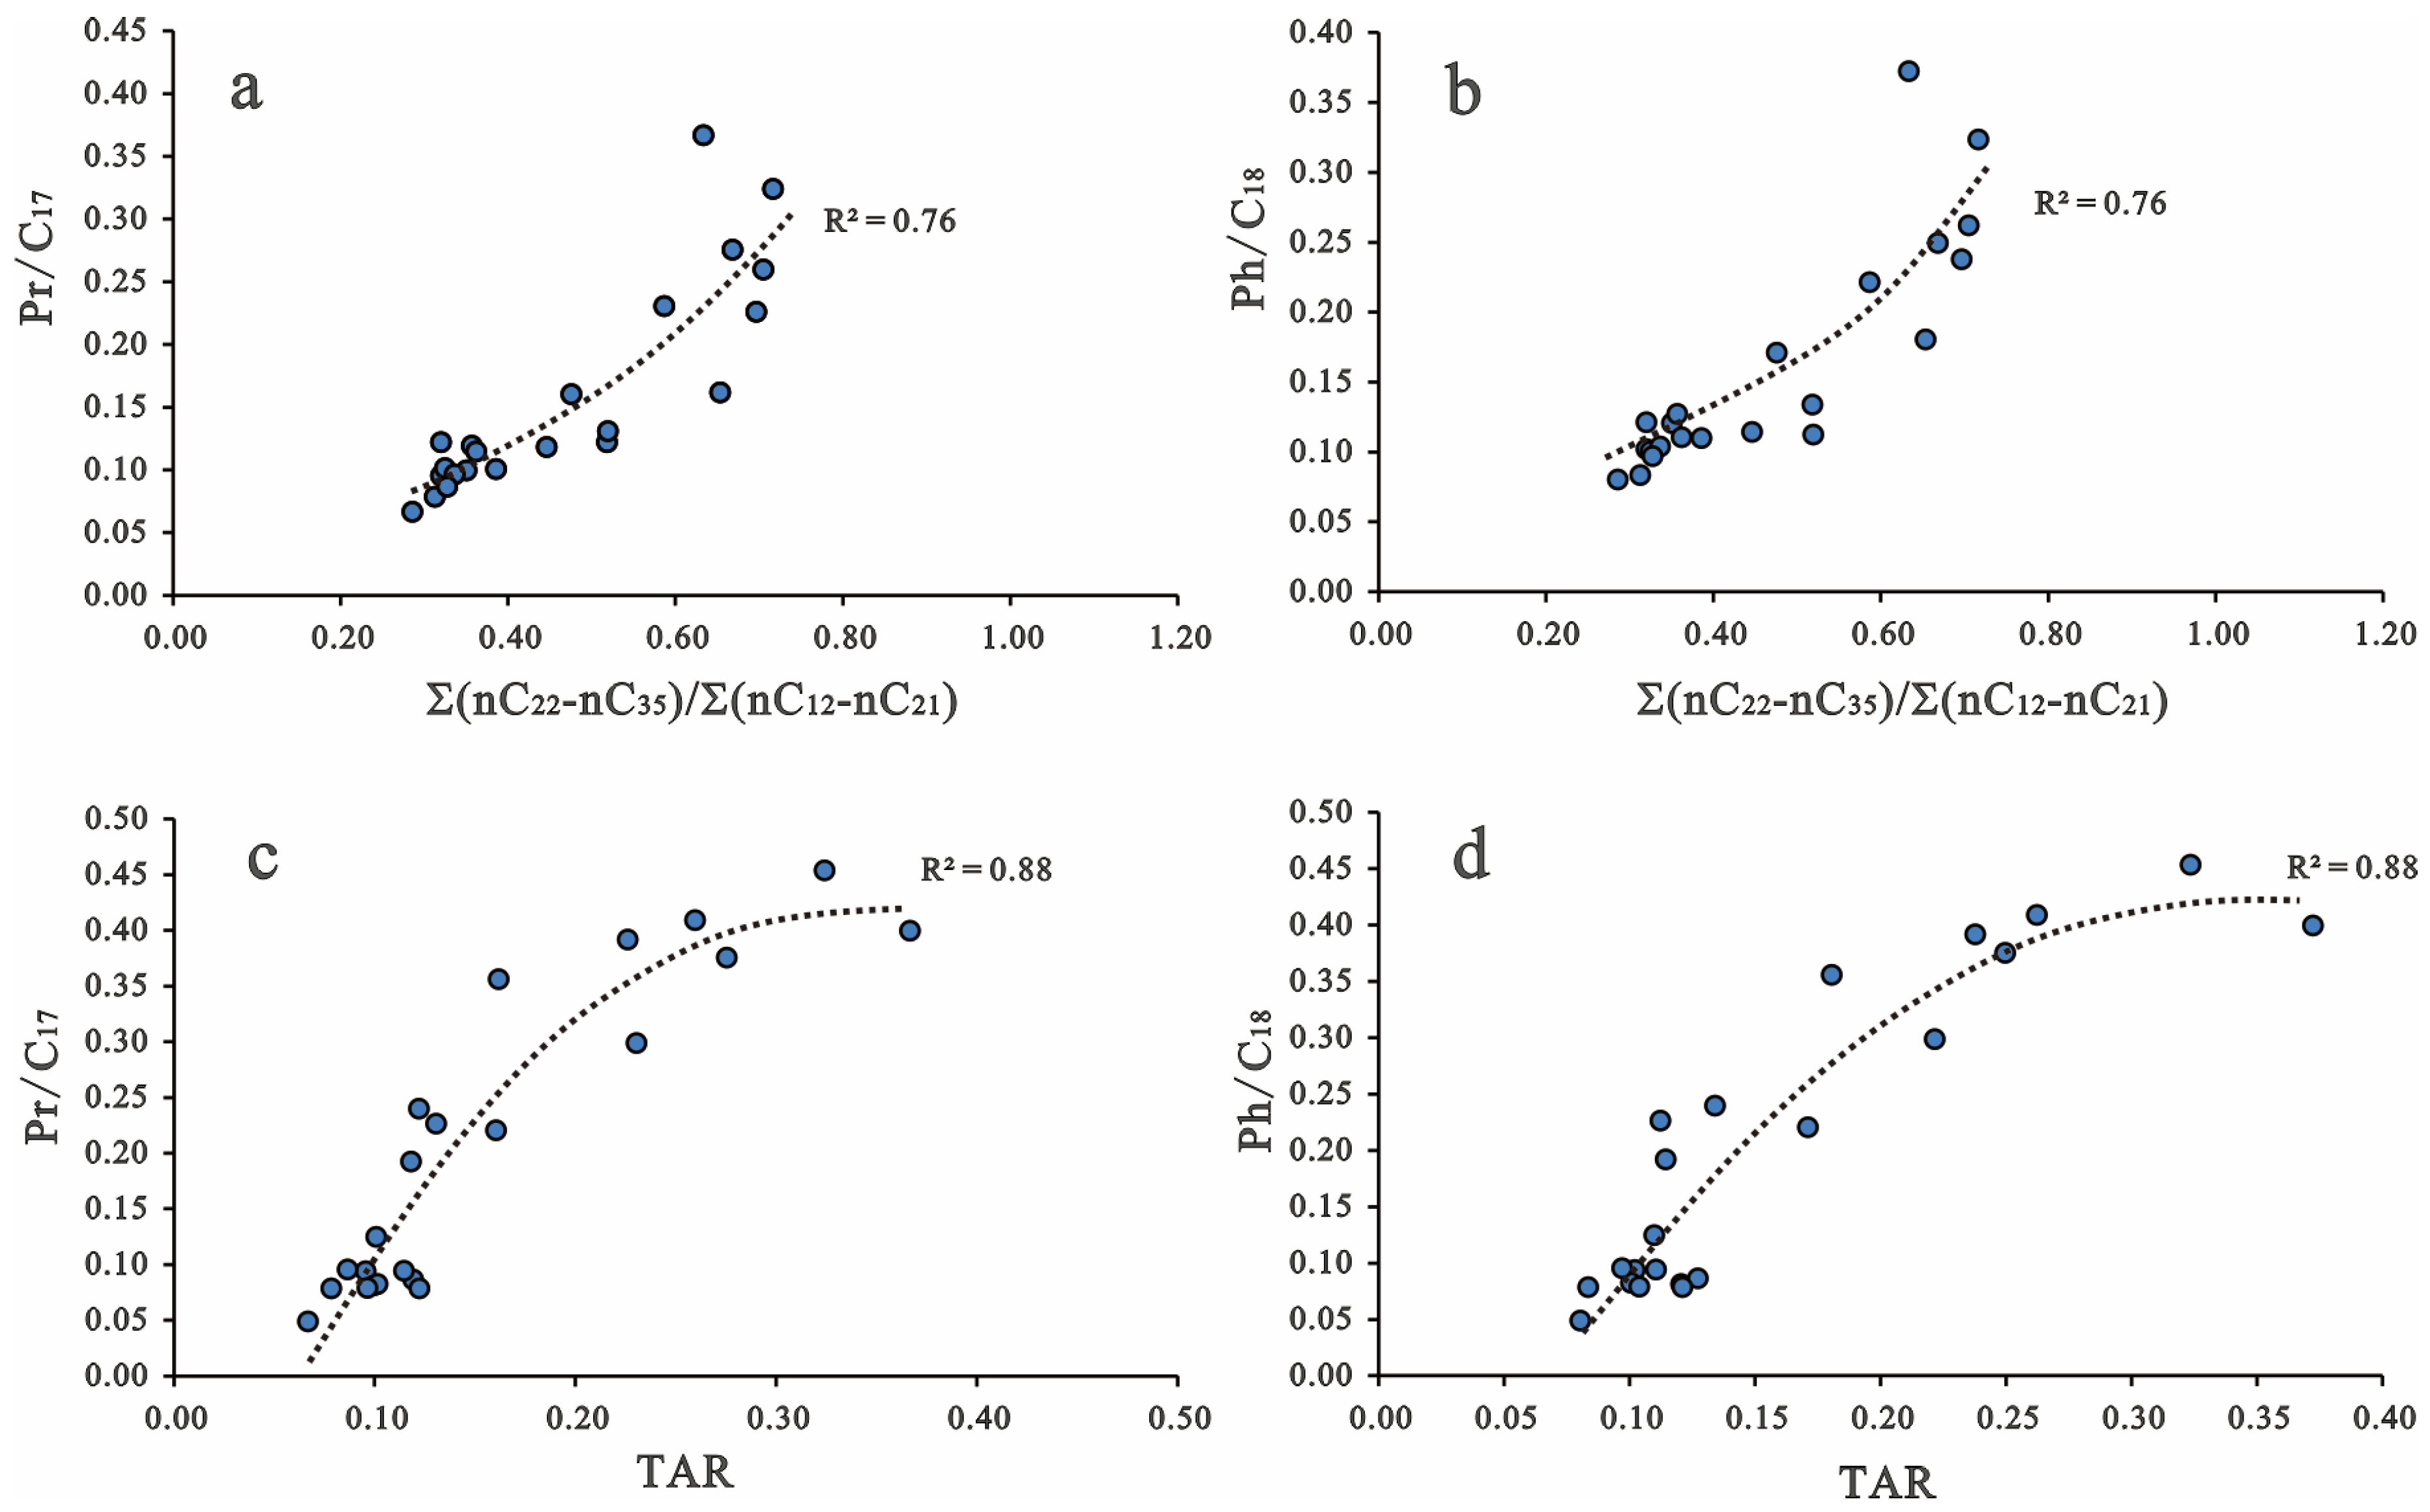
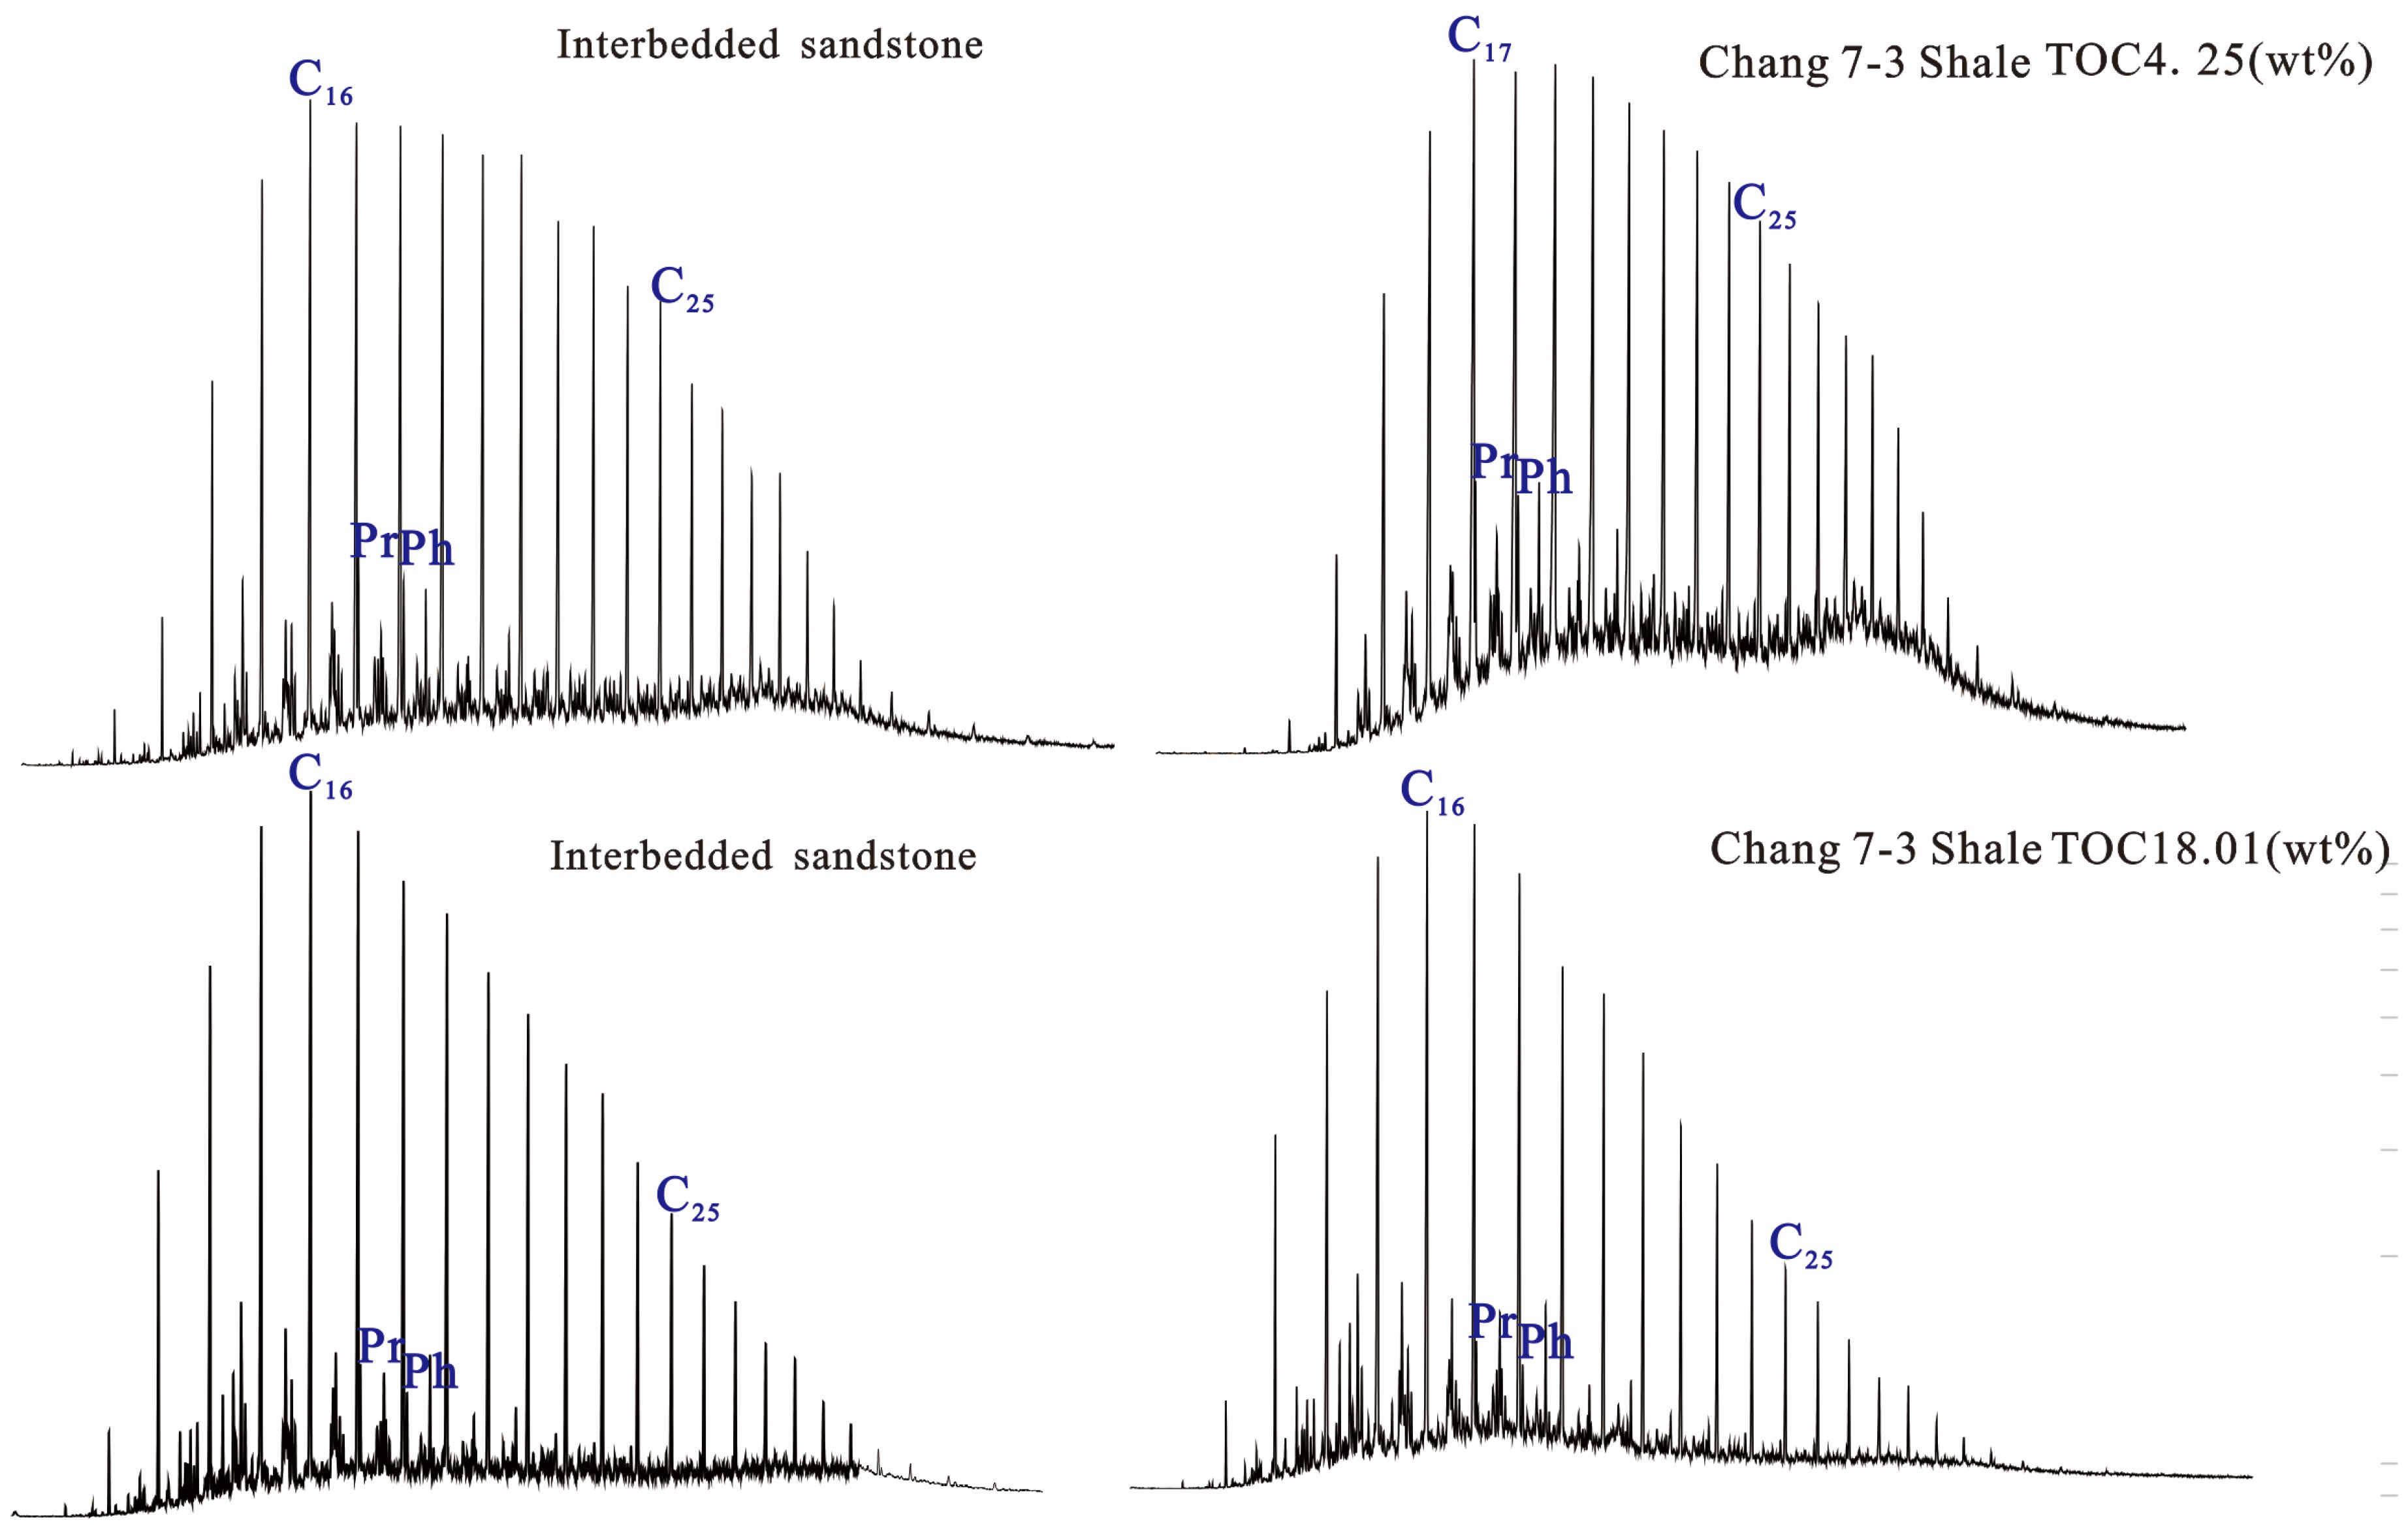
4.2.1. n-Alkanes
4.2.2. Acyclic Isoprenoids
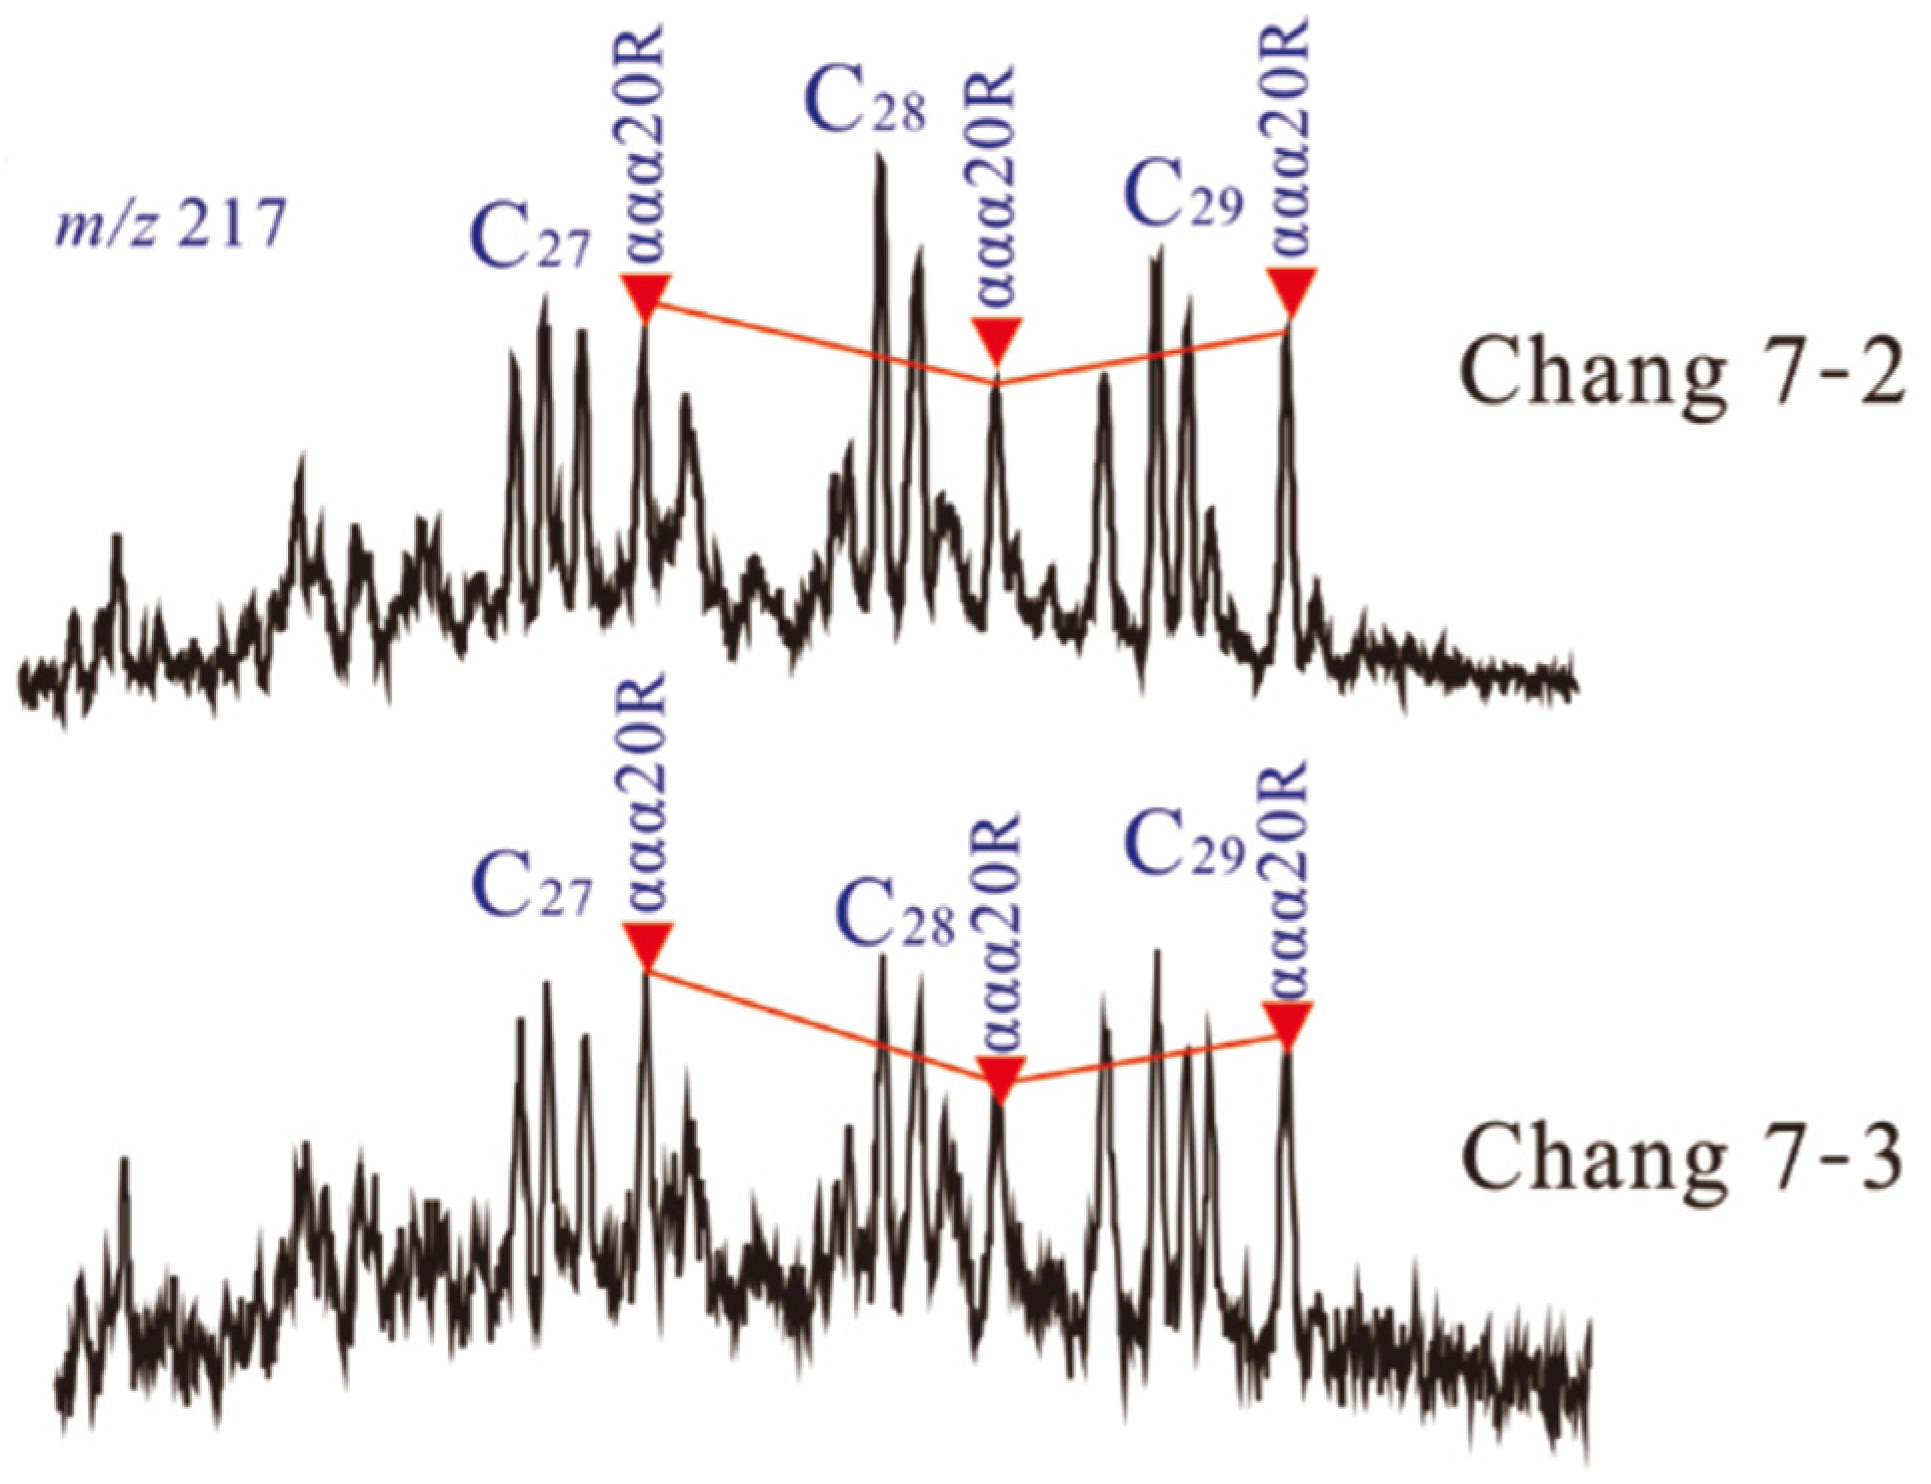
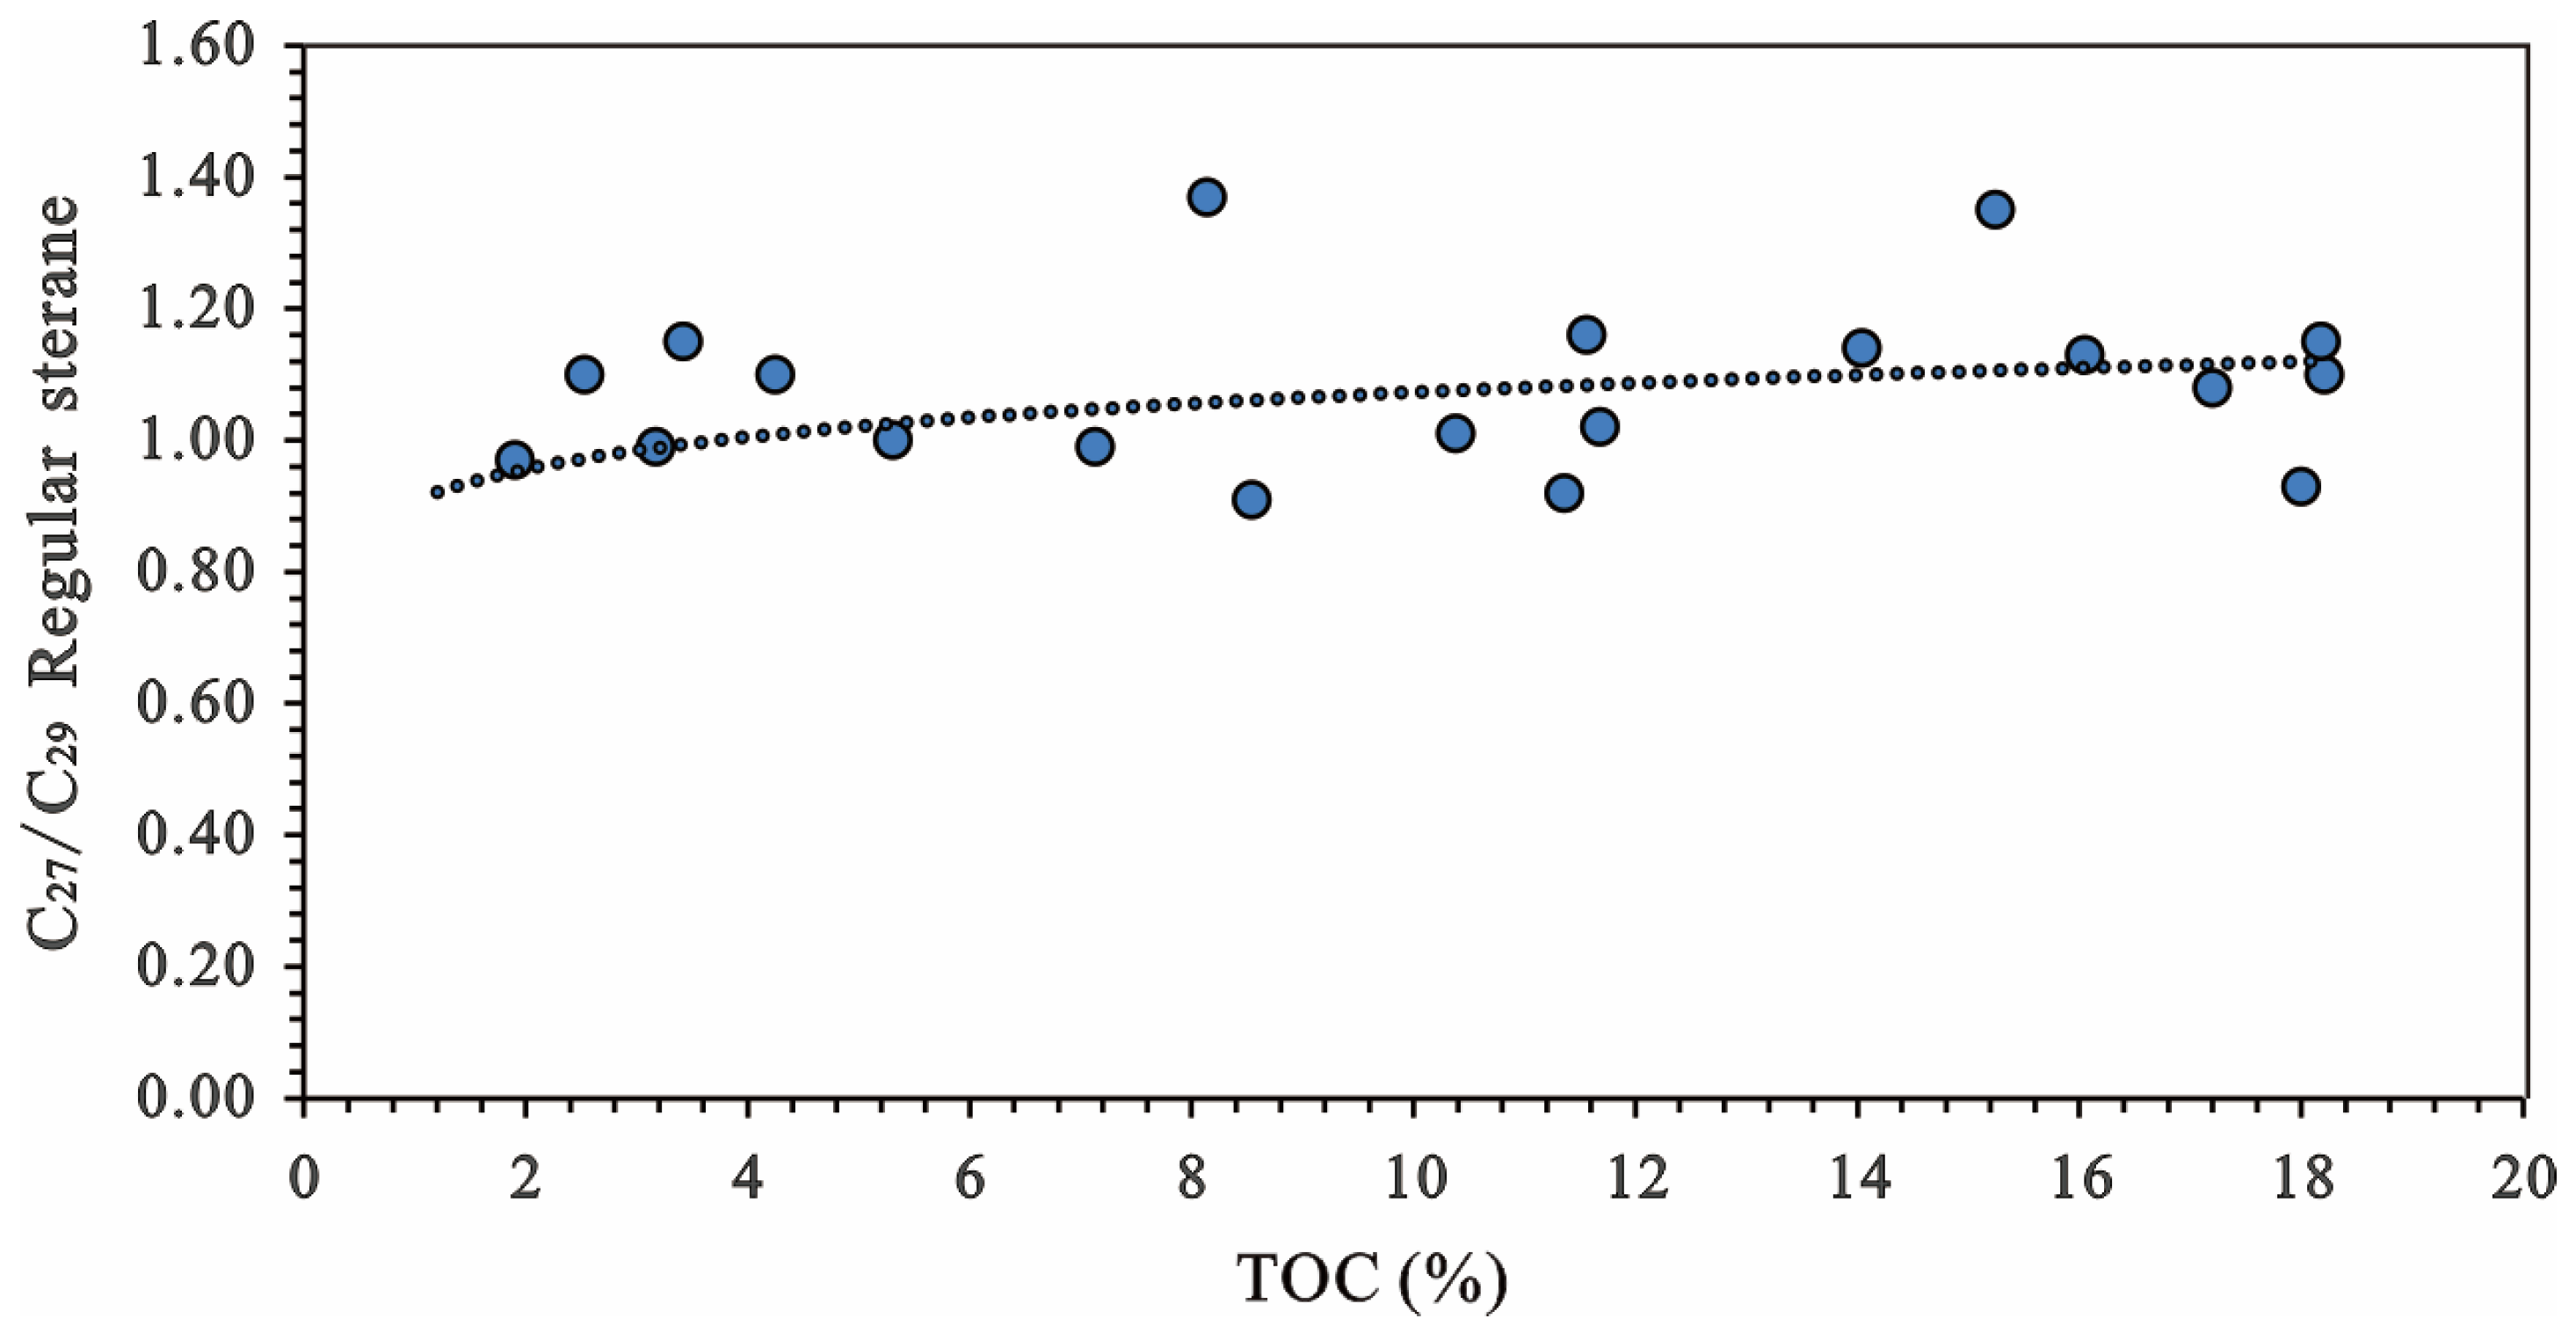
4.2.3. Steranes
4.3. Petroleum Migration and Shale Oil Potential
4.3.1. Chemical Composition of Hydrocarbons in Mudstones, Shales and Interbedded Sandstones
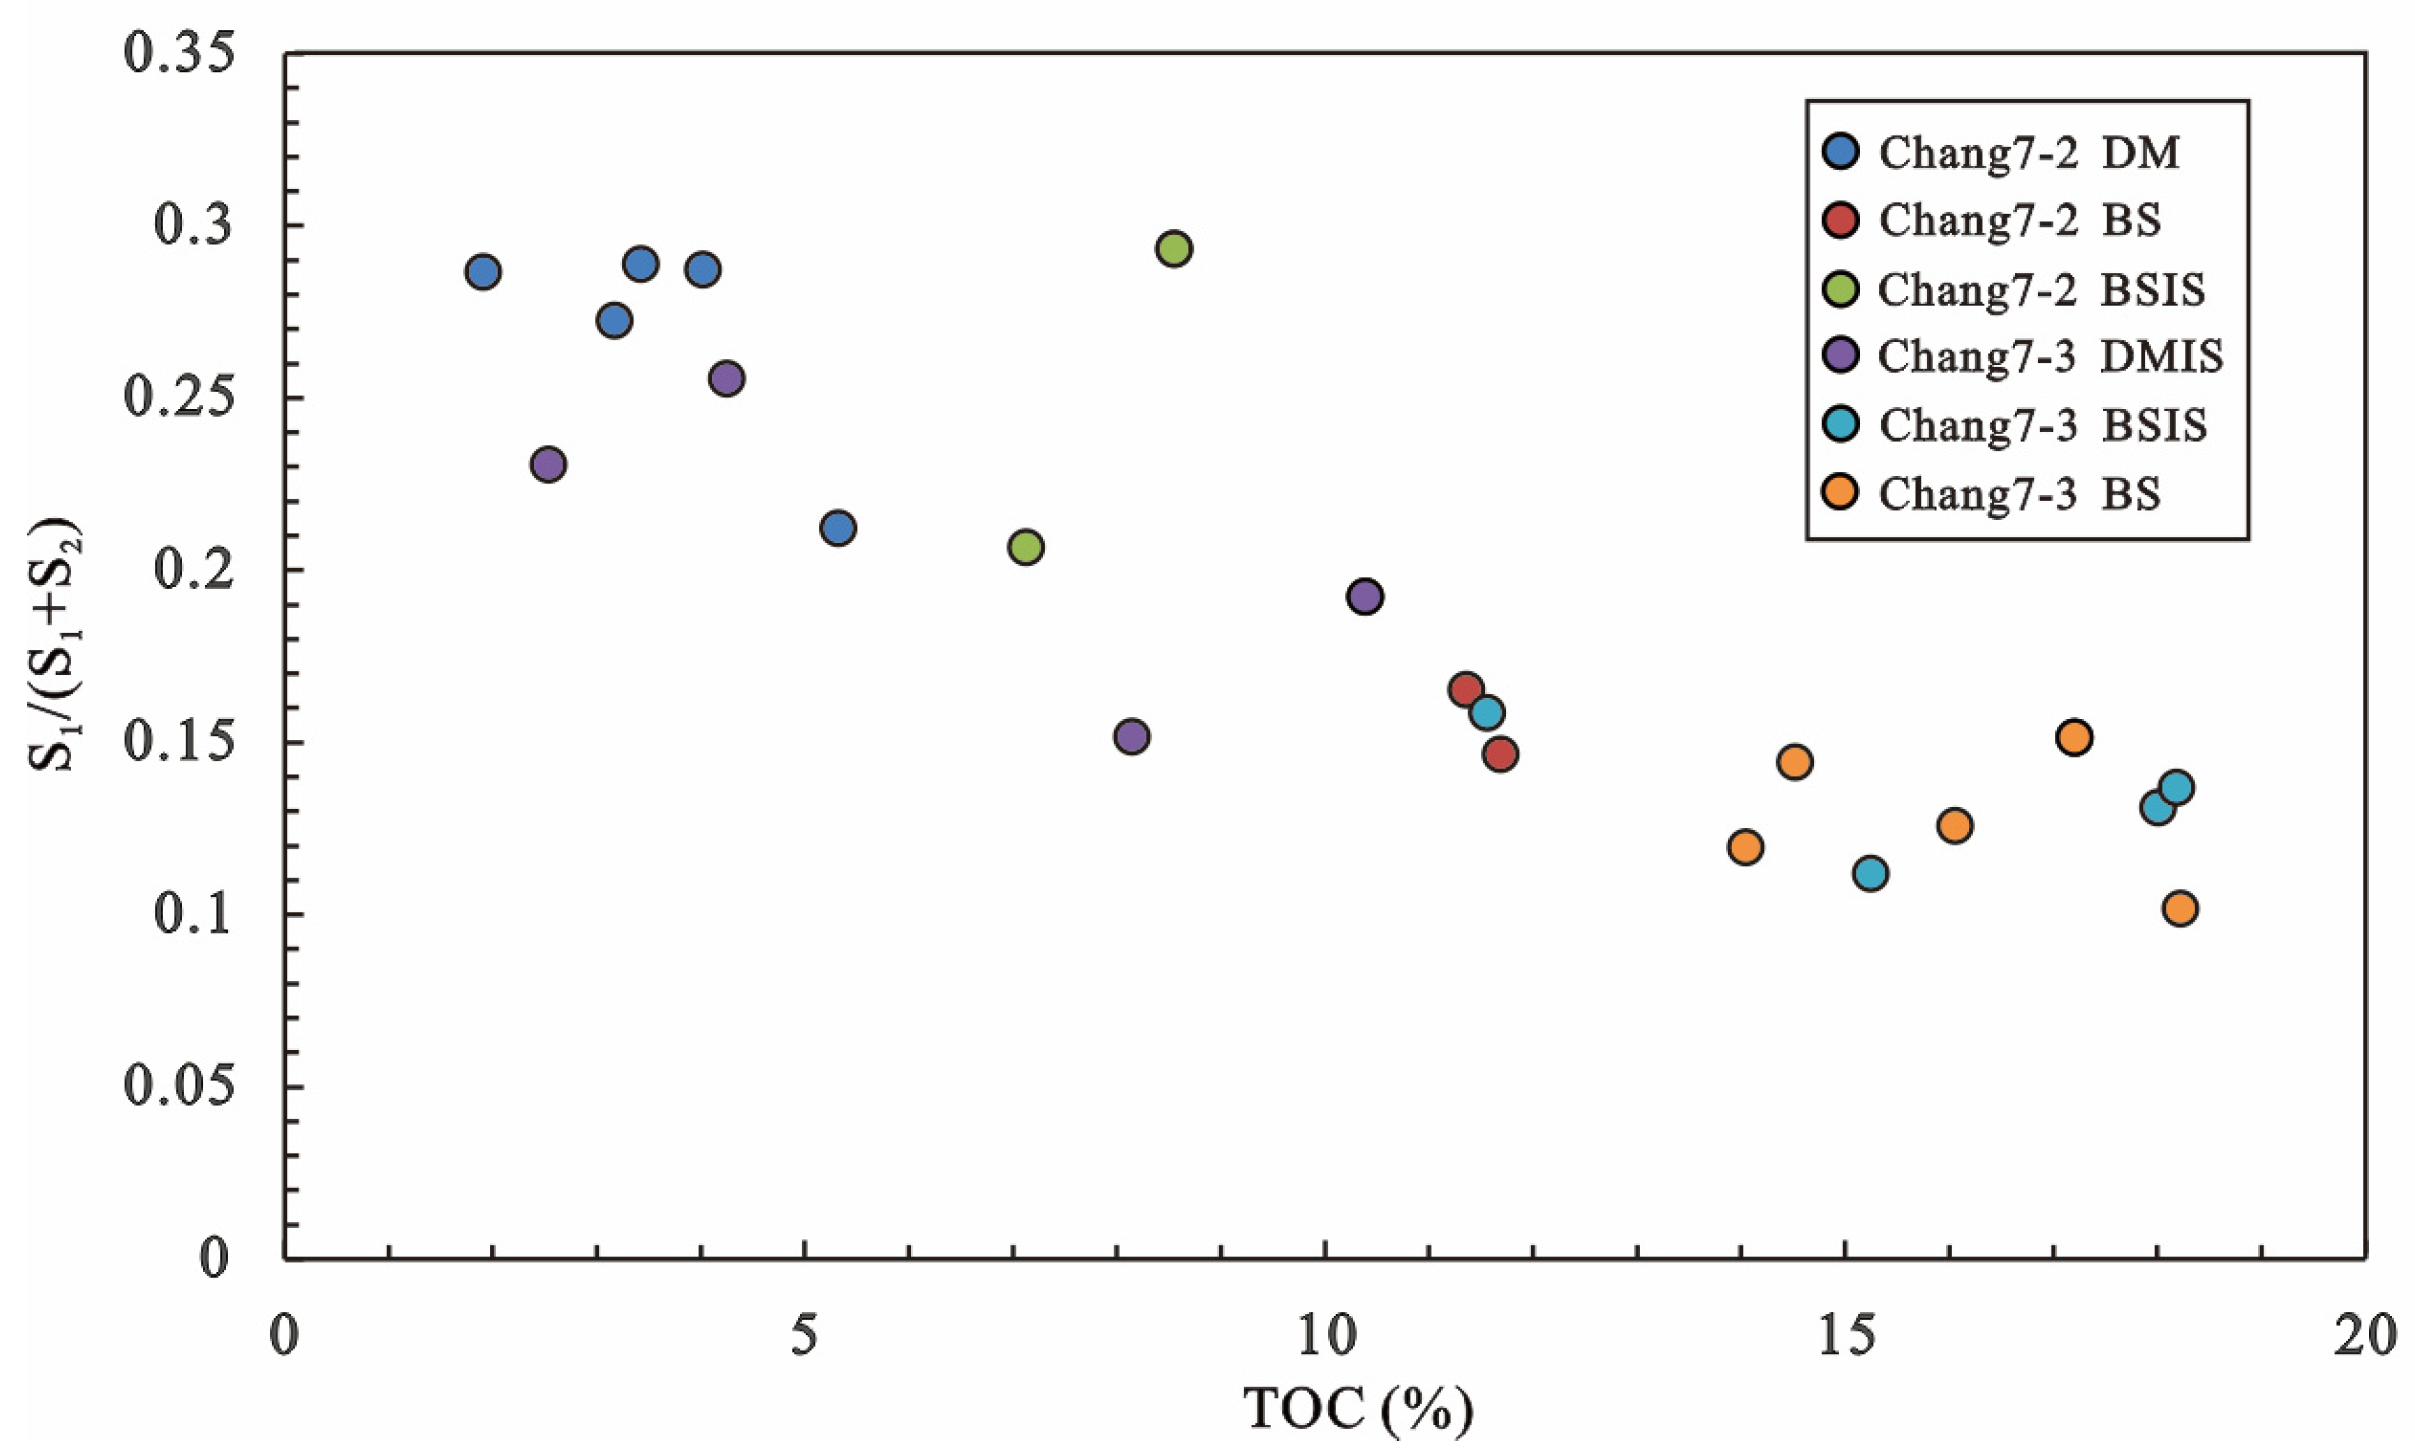
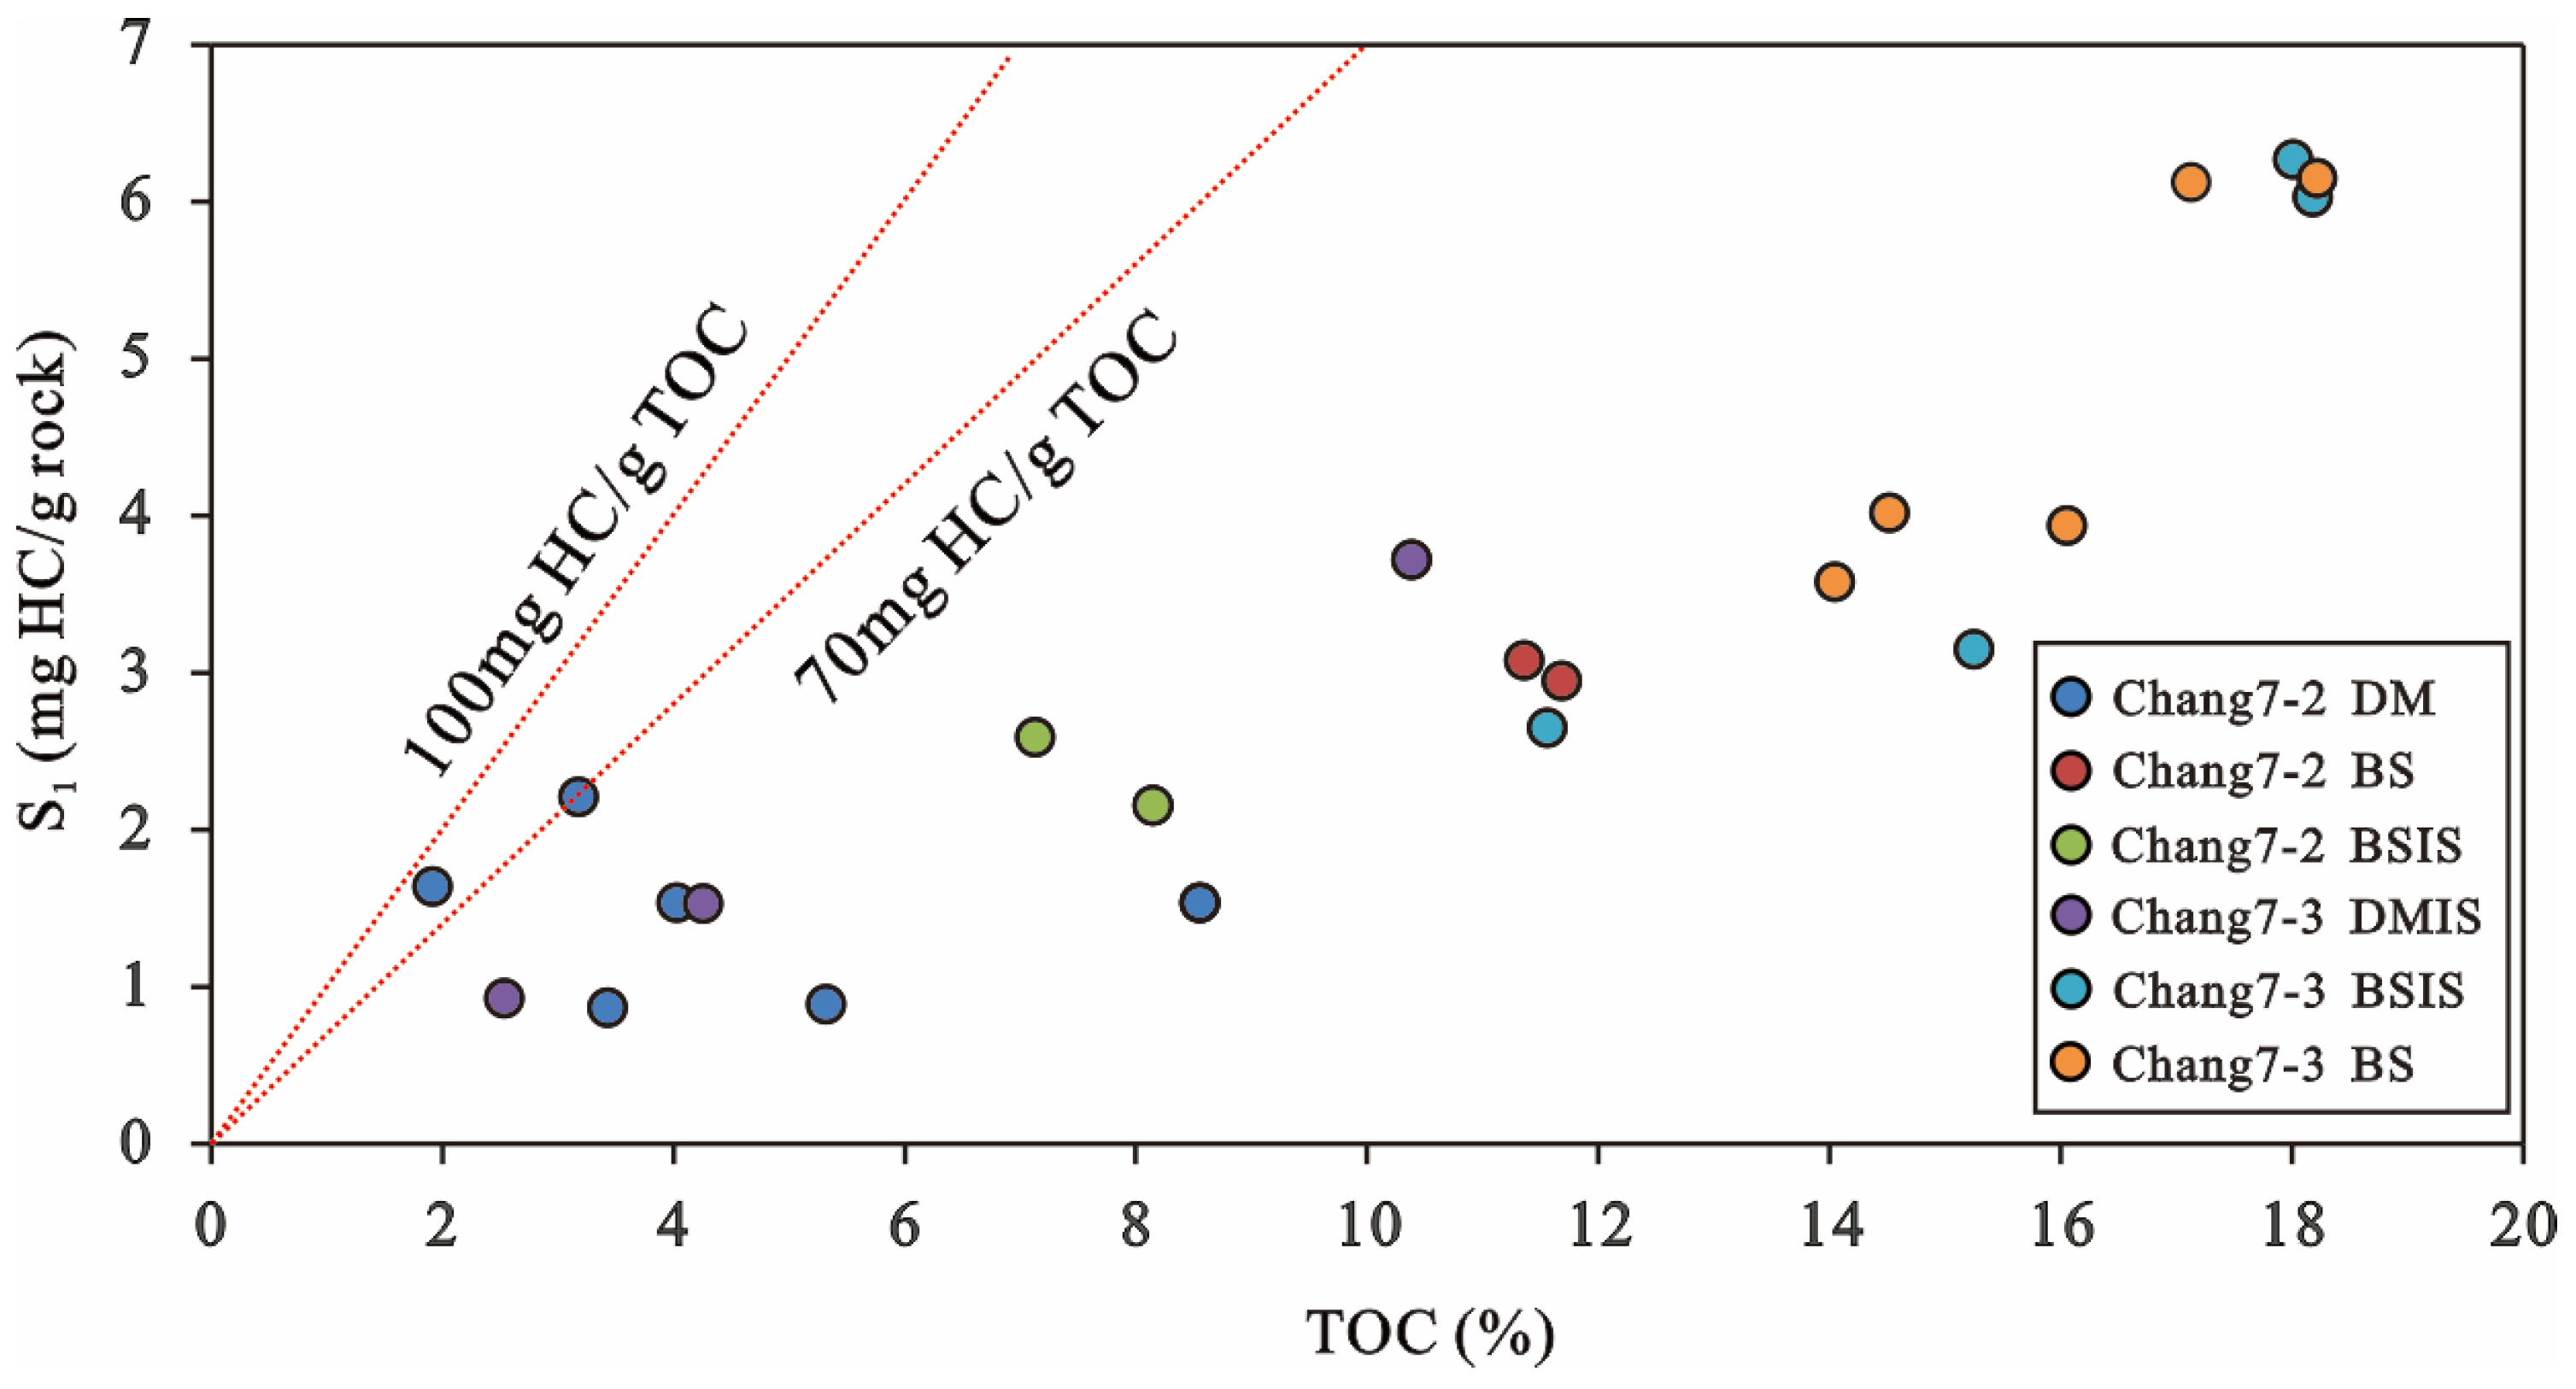
4.3.2. The Production Index and Oil Saturation Index
5. Conclusions
- (1)
- The C7-2 and C7-3 source rocks are thermally mature and have entered into the stage of hydrocarbon generation. The source rocks of C7-2 and most of the samples from C7-3 contain Type III kerogens and mixed Type III/II kerogens and are gas-prone source rocks, except for partial C7-3 BS and C7-3 BSIS, which contain Type II kerogens and are oil-prone source rocks. Most of the C7-3 and C7-2 source rocks have a very good to excellent hydrocarbon generation potential, while the C7-2 DM and C7-3 DMIS samples are fair to good source rocks.
- (2)
- Analyses of the molecular compositions of saturated fractions in shales and interbedded sandstones and the production index demonstrate the migration of petroleum from organic-rich source rocks to their organic-lean counterparts. This process results in aromatic and polar fractions being more abundant in shales, while their juxtaposed sandstones and mudstones are enriched in aliphatic fractions. C7-2 DM could be considered a potential “sweet spot” of shale oil since their OSI was the highest among all the studied samples and they had the richest light aliphatic fractions.
- (3)
- According to the analyses of biomarkers, terrigenous source input is more abundant in C7-2, whereas the source input of phytoplankton, algae or microbial lipids is more abundant in C7-3. Moreover, a high TOC content basically corresponds to low wax indexes, TARs and Pr/nC17 and Ph/nC18 ratios and high C27/C29 regular sterane ratios, which suggests that the source input of phytoplankton, algae or microbial lipids is favorable for OM accumulation.
Author Contributions
Funding
Data Availability Statement
Conflicts of Interest
References
- Tissot, B.P.; Welte, D.H. Petroleum Formation and Occurrence, 2nd ed.; Springer-Verlag: Berlin/Heidelberg, Germany, 1984. [Google Scholar]
- Magoon, L.B.; Dow, W.G. The petroleum system. In The Petroleum System: From Source to Trap; Magoon, L.B., Dow, W.G., Eds.; AAPG: Tulsa, OK, USA, 1994; Volume 60, pp. 3–24. [Google Scholar]
- Liu, B.; Mastalerz, M.; Schieber, J. SEM petrography of dispersed organic matter in black shales: A review. Earth Sci. Rev. 2022, 224, 103874. [Google Scholar] [CrossRef]
- Zhang, W.; Yang, W.; Xie, L. Controls on organic matter accumulation in the Triassic Chang 7 lacustrine shale of the Ordos Basin, central China. Int. J. Coal Geol. 2017, 183, 38–51. [Google Scholar] [CrossRef]
- Zhao, Y.; Zhang, C.; Lu, J.; Zhu, X.; Li, L.; Si, S. Sedimentary Environment and Model for Organic Matter Enrichment: Chang 7 Shale of Late Triassic Yanchang Formation, Southern Margin of Ordos Basin, China. Energies 2022, 15, 2948. [Google Scholar] [CrossRef]
- Guo, R.; Zhao, Y.; Wang, W.; Hu, X.; Zhou, X.; Hao, L.; Ma, X.; Ma, D.; Li, S. Application of Rare-Earth Elements and Comparison to Molecular Markers in Oil–Source Correlation of Tight Oil: A Case Study of Chang 7 of the Upper Triassic Yanchang Formation in Longdong Area, Ordos Basin, China. ACS Omega 2020, 5, 22140–22156. [Google Scholar] [CrossRef] [PubMed]
- Chen, G.; Wang, N.; Yang, S.; Li, X.; Zhang, P.; Su, Y. Source rock potential of the Upper Triassic Chang 7 member in the western Ordos Basin, China. J. Pet. Geol. 2022, 45, 395–415. [Google Scholar] [CrossRef]
- Cui, J.; Zhu, R.; Li, S.; Qi, Y.; Shi, X.; Mao, Z. Development patterns of source rocks in the depression lake basin and its influence on oil accumulation: Case study of the Chang 7 member of the Triassic Yanchang Formation, Ordos Basin, China. J. Nat. Gas Geosci. 2019, 4, 191–204. [Google Scholar] [CrossRef]
- Tyson, R.V. Sedimentation rate, dilution, preservation and total organic carbon: Some results of a modelling study. Org. Geochem. 2001, 32, 333–339. [Google Scholar] [CrossRef]
- Dong, T.; Harris, N.B.; Ayranci, K. Relative sea-level cycles and organic matter accumulation in shales of the Middle and Upper Devonian Horn River Group, northeastern British Columbia, Canada: Insights into sediment flux, redox conditions, and bioproductivity. GSA Bull. 2017, 130, 859–880. [Google Scholar] [CrossRef]
- Mansour, A.; Wagreich, M. Earth system changes during the cooling greenhouse phase of the Late Cretaceous: Coniacian-Santonian OAE3 subevents and fundamental variations in organic carbon deposition. Earth Sci. Rev. 2022, 229, 104022. [Google Scholar] [CrossRef]
- Mansour, A.; Wagreich, M.; Gentzis, T.; Ocubalidet, S.; Tahoun, S.S.; Elewa, A.M.T. Depositional and organic carbon-controlled regimes during the Coniacian-Santonian event: First results from the southern Tethys (Egypt). Mar. Pet. Geol. 2020, 115, 104285. [Google Scholar] [CrossRef]
- Pedersen, T.F.; Calvert, S.E. Anoxia vs. productivity: What controls the formation of oganic-carbon-rich sediments and sedimentary rocks? Am. Assoc. Pet. Geol. Bull. 1990, 74, 454–466. [Google Scholar]
- Parrish, J.T. Paleogeography of carbon organic-rich rocks and the preservation versus production controversy. In Paleogeography, Paleoclimate, and Source Rocks; Huc, A.Y., Ed.; AAPG: Tulsa, OK, USA, 1995; Volume 40, pp. 1–20. [Google Scholar]
- Hay, W.W. Paleooceanography of marine organic-carbon-rich sediments. In Paleoclimate, and Source Rocks; Huc, A.Y., Ed.; AAPG: Tulsa, OK, USA, 1995; Volume 40, pp. 21–59. [Google Scholar]
- Chen, G.; Gang, W.; Chang, X.; Wang, N.; Zhang, P.; Cao, Q.; Xu, J. Paleoproductivity of the Chang 7 unit in the Ordos Basin (North China) and its controlling factors. Palaeogeogr. Palaeoclimatol. Palaeoecol. 2020, 551, 109741. [Google Scholar] [CrossRef]
- Hollander, D.; Behar, F.; Vandernbroucks, M.; Bertrand, P.; Mckenzie, J.A. Geochemical alteration of organic matter in eutrophic Lake Greifen: Implications for the determination of organic facies and the origin of lacustrine source rocks. In Depositon of Organic Facies; Huc, A.Y., Ed.; AAPG: Tulsa, OK, USA, 1991; Volume 30, pp. 181–193. [Google Scholar]
- Curiale, J.A.; Gibling, M.R. Productivity control on oil shale formation—Mae Sot basin, Thailand. Org. Chem. 1994, 21, 67–89. [Google Scholar] [CrossRef]
- Katz, B.J. A survey of rift basin source rocks. In Hydrocarbon Habitat in Rift Basins; Lambiase, J.J., Ed.; Geological Society: London, UK, 1995; Volume 80, pp. 213–240. [Google Scholar]
- Gélinas, Y.; Baldock, J.A.; Hedges, J.I. Organic carbon composition of marine sediments: Effect of oxygen exposure on oil generation potential. Science 2001, 294, 145–148. [Google Scholar] [CrossRef]
- Coleman, M.L.; Curtis, D.C.; Irwin, H. Burial rate: A key to source and reservoir potential. World Oil 1979, 188, 83–92. [Google Scholar]
- Ibach, L.E.J. Relationship between sedimentation rate and total organic carbon content in ancient marine sediments. AAPG Bull. 1982, 66, 170–188. [Google Scholar]
- Creaney, S.; Passey, Q.R. Recurring patterns of total organic carbon and source rock quality within a sequence stratigraphy frame work. Am. Assoc. Pet. Geol. Bull. 1993, 77, 386–401. [Google Scholar]
- Yang, H.; Niu, X.; Xu, L.; Feng, S.; You, Y.; Liang, X.; Fang, W.; Zhang, D. Exploration potential of shale oil in Chang7 Member, Upper Triassic Yanchang Formation, Ordos Basin, NW China. Petrol. Explor. Develop. 2016, 43, 560–569. [Google Scholar] [CrossRef]
- Hanson, A.D.; Ritts, B.D.; Moldowan, J.M. Organic geochemistry of oil and source rock strata of the Ordos Basin, north-central China. AAPG Bull. 2007, 91, 1273–1293. [Google Scholar] [CrossRef]
- Tang, X.; Zhang, J.; Jin, Z.; Xiong, J.; Lin, L.; Yu, Y.; Han, S. Experimental investigation of thermal maturation on shale reservoir properties from hydrous pyrolysis of Chang 7 shale, Ordos Basin. Mar. Pet. Geol. 2015, 64, 165–172. [Google Scholar] [CrossRef]
- Jiang, F.; Chen, D.; Wang, Z.; Xu, Z.; Chen, J.; Liu, L.; Hu, Y.; Liu, Y. Pore char-acteristic analysis of a lacustrine shale: A case study in the Ordos Basin, NW China. Mar. Pet. Geol. 2016, 73, 554–571. [Google Scholar] [CrossRef]
- Sun, N.; Chen, T.; Zhong, J.; Gao, J.; Shi, X.; Xue, C.; Swennen, R. Petrographic and geochemical characteristics of deep-lacustrine organic-rich mudstone and shale of the Upper Triassic Chang 7 member in the southern ordos Basin, northern China: Implications for shale oil exploration. J. Asian Earth Sci. 2022, 227, 105118. [Google Scholar] [CrossRef]
- Xu, Z.J.; Liu, L.F.; Liu, B.; Wang, T.G.; Zhang, Z.H.; Wu, K.J.; Feng, C.Y.; Dou, W.C.; Wang, Y.; Shu, Y. Geochemical characteristics of the Triassic Chang 7 lacustrine source rocks, Ordos Basin, China: Implications for paleoenvironment, petroleum potential and tight oil occurrence. J. Asian Earth Sci. 2019, 178, 112–138. [Google Scholar] [CrossRef]
- Yang, H.; Zhang, W.; Wu, K.; Li, S.; Peng, P.; Qin, Y. Uranium enrichment in lacustrine oil source rocks of the Chang 7 member of the Yanchang Formation, Ordos Basin, China. J. Asian Earth Sci. 2010, 39, 285–293. [Google Scholar] [CrossRef]
- Yang, J.J. Tectonic Evolution and Oil-Gas Reservoirs Distribution in Ordos Basin; Petroleum Industry Press: Beijing, China, 2002; pp. 36–37. (In Chinese) [Google Scholar]
- Liu, C.Y.; Zhao, H.G.; Zhao, J.F.; Wang, J.Q.; Zhang, D.D.; Yang, M.H. Temporospatial coordinates of evolution of the Ordos basin and its mineralization responses. Acta Geol. Sin. 2008, 82, 1229–1243, (In Chinese with an English abstract). [Google Scholar]
- Deng, X.Q.; Lin, F.X.; Liu, X.Y.; Pang, J.L.; Lv, J.W.; Li, S.X.; Liu, X. Discussion on relationship between sedimentary evolution of the Triassic Yanchang Formation and the Early Indosinian Movement in Ordos Basin. J. Palaeogeogr. 2008, 10, 159–166, (In Chinese with English abstract). [Google Scholar]
- Yang, R.; Jin, Z.; Van Loon, T.; Han, Z.; Fan, A. Climatic and tectonic controls of lacustrine hyperpycnite origination in the Late Triassic Ordos Basin, central China: Implications for unconventional petroleum development. AAPG Bull. 2017, 101, 95–117. [Google Scholar] [CrossRef]
- Zou, C.; Wang, L.; Li, Y.; Tao, S.; Hou, L. Deep-lacustrine transformation of sandy debrites into turbidites, Upper Triassic, Central China. Sediment. Geol. 2012, 265–266, 143–155. [Google Scholar] [CrossRef]
- SY/T 5119-2008; Analysis Method for Frctions of Rock Extrct and Crude Oil. China Petroleum Standardization Committee: Beijing, China, 2008. (In Chinese)
- Espitalié, J.; Deroo, G.; Marquis, F. La pyrolyse Rock-Eval et ses applications. Rev. Inst. Fr. Pét. 1985, 40, 755–784. [Google Scholar] [CrossRef]
- Peters, K.E. Guidelines for evaluating petroleum source rock using programmed pyrolysis. AAPG Bull. 1986, 70, 318–329. [Google Scholar]
- Peters, K.E.; Cassa, M.R. Applied source rock geochemistry. In The Petroleum System—From Source to Trap; Magoon, L.B., Dow, W.G., Eds.; AAPG: Tulsa, OK, USA, 1994; Volume 60, pp. 93–120. [Google Scholar]
- Hakimi, M.H.; Abdulla, W.H. Source rock characteristics and hydrocarbon generation modelling of Upper Cretaceous Mukalla Formation in the Jiza-Qamar Basin, Eastern Yemen. Mar. Pet. Geol. 2014, 51, 100–116. [Google Scholar] [CrossRef]
- Burnham, A.K.; Sweeney, J.J. A chemical kinetic model of vitrinite maturation and reflectance. Geochim. Cosmochim. Acta 1989, 53, 2649–2657. [Google Scholar] [CrossRef]
- Clark, R.C.; Blumer, M. Distributions of n-paraffins in marine organisms and sediments. Limnol. Oceanogr. 1967, 12, 79–87. [Google Scholar] [CrossRef]
- Blumer, M.; Guillard, R.R.L.; Chase, T. Hydrocarbons of marine phytoplankton. Mar. Biol. 1971, 8, 183–189. [Google Scholar] [CrossRef]
- Matsuda, H.; Koyama, T. Early diagenesis of fatty acids in lacustrine sediments-II. A statistical approach to changes in fatty acid composition from recent sediments and some source materials. Geochim. Cosmochim. Acta 1977, 41, 1825–1834. [Google Scholar] [CrossRef]
- Cranwell, P.A. Diagenesis of free and bound lipids in terrestrial detritus deposited in a lacustrine sediment. Org. Geochem. 1981, 3, 79–89. [Google Scholar] [CrossRef]
- Peters, K.E.; Walters, C.C.; Moldowan, J.M. The Biomarker Guide: Biomarkers and Isotopes in the Environment and Human History, 2nd ed.; Cambridge University Press: New York, NY, USA, 2005. [Google Scholar]
- Hedberg, H.D. Significance of high–wax oils with respect to genesis of petroleum. AAPG Bull. 1968, 52, 736–750. [Google Scholar]
- Connan, J.; Cassou, A.M. Properties of gases and petroleum liquids derived from terrestrial kerogen at various maturation levels. Geochem. Cosmochim. Acta 1980, 44, 1–23. [Google Scholar] [CrossRef]
- Bourbonniere, R.A.; Meyers, P.A. Sedimentary geolipid records of historical changes in the watersheds and productivities of Lakes Ontario and Erie. Limnol. Oceanogr. 1996, 41, 352–359. [Google Scholar] [CrossRef]
- Meyers, P.A. Organic geochemical proxies of paleooceanographic, paleolimnlogic, and paleoclimatic processes. Org. Geochem. 1997, 27, 213–250. [Google Scholar] [CrossRef]
- Brooks, J.D.; Gould, K.; Smith, J.W. Isoprenoid hydrocarbons in coal and petroleum. Nature 1969, 222, 257–259. [Google Scholar] [CrossRef]
- Powell, T.G.; McKirdy, D.M. Relationship between ratio of pristane to phytane, crude oil composition and geological environment in Australia. Nature 1973, 243, 37–39. [Google Scholar] [CrossRef]
- Didyk, B.M.; Simoneit, B.R.T.; Brassell, S.C.; Eglinton, G. Organic geochemical indicators of paleoenvironmental conditions of sedimentation. Nature 1978, 272, 216–222. [Google Scholar] [CrossRef]
- Sofer, Z. Stable carbon isotope compositions of crude oils: Application to source depositional environments and petroleum alteration. AAPG Bull. 1984, 68, 31–49. [Google Scholar]
- Peters, K.E.; Clutson, M.J.; Robertson, G. Mixed marine and lacustrine input to an oil-cemented sandstone breccia from Brora, Scotland. Org. Geochem. 1999, 30, 237–248. [Google Scholar] [CrossRef]
- Lijmbach, G.M. On the origin of petroleum. In Proceedings of the 9th World Petroleum Congress, London, UK, 11 May 1975. [Google Scholar]
- Amijaya, H.; Schwarzbauer, J.; Littke, R. Organic geochemistry of the Lower Suban coal seam, South Sumatra Basin, Indonesia: Palaeoecological and thermal metamorphism implications. Org. Geochem. 2006, 37, 261–279. [Google Scholar] [CrossRef]
- Bechtel, A.; Gratzer, R.; Sachsenhofer, R. Chemical characteristics of Upper Cretaceous (Turonian) jet of the Gosau Group of Gams/Hieflau (Styria, Austria). Int. J. Coal Geol. 2001, 46, 27–49. [Google Scholar] [CrossRef]
- Ten Haven, H.L.; de Leeuw, J.W.; Rullkötter, J.; Sinninghe Damsté, J.S. Restricted utility of the pristane/phytane ratio as a palaeoenvironmental indicator. Nature 1987, 330, 641–643. [Google Scholar] [CrossRef]
- Hunt, J.M. Petroleum Geochemistry and Geology, 2nd ed.; W. H. Freeman: New York, NY, USA, 1996. [Google Scholar]
- Huang, W.Y.; Meinschein, W.G. Sterols as ecological indicators. Geochim. Cosmochim. Acta 1979, 43, 739–745. [Google Scholar] [CrossRef]
- Jarvie, D.M. Shale resource systems for oil and gas: Part 2—Shale-oil resource systems. In Shale Reservoirs—Giant Resources for the 21st Century; Breyer, J.A., Ed.; AAPG: Tulsa, OK, USA, 2012; Volume 97, pp. 89–119. [Google Scholar]
- Mackenzie, A.S.; Leythaeuser, D.; Schaefer, R.G. Expulsion of petroleum hydrocarbons from shale source rocks. Nature 1983, 301, 506–509. [Google Scholar] [CrossRef]
- Leythaeuser, D.; Radke, M.; Schaefer, R.G. Efficiency of petroleum expulsion from shale source rocks. Nature 1984, 311, 745–748. [Google Scholar] [CrossRef]
- Leythaeuser, D.; Schaefer, R.G.; Radke, M. Geochemical effects of primary migration of petroleum in Kimmeridge source rocks from Brae field area, North Sea. I: Gross composition of C15+-soluble organic matter and molecular composition of C15+-saturated hydrocarbons. Geochim. Cosmochim. Acta 1988, 52, 701–713. [Google Scholar] [CrossRef]
- Wilhelms, A.; Larter, S.R.; Leythaeuser, D.; Dypvik, H. Recognition and quantification of the effects of primary migration in a Jurassic clastic source-rock from the Norwegian continental shelf. Org. Geochem. 1990, 16, 103–113. [Google Scholar] [CrossRef]
- Han, Y.; Mahlstedt, N.; Horsfield, B. The Barnett Shale: Compositional fractionation associated with intraformational petroleum migration, retentioin, and expulsion. AAPG Bull. 2015, 99, 2173–2202. [Google Scholar] [CrossRef]
- Zou, C.; Pan, S.; Horsfield, B.; Yang, Z.; Hao, S.; Liu, E.; Zhang, L. Oil retention and intrasource migration in the organic-rich lacustrine Chang 7 shale of the Upper Triassic Yanchang Formation, Ordos Basin, Central China. AAPG Bull. 2019, 103, 2627–2663. [Google Scholar] [CrossRef]
- Zhang, T.; Wang, X.; Zhang, J.; Sun, X.; Milliken, K.; Ruppel, S.; Enriquez, D. Geochemical evidence for oil and gas expulsion in Triassic lacustrine organic-rich mudstone, Ordos Basin, China. Interpretation 2017, 5, SF41–SF61. [Google Scholar] [CrossRef]
- Sandvik, E.I.; Young, W.A.; Curry, D.J. Expulsion from hydrocarbon sources: The role of organic absorption. Org. Geochem. 1992, 19, 77–87. [Google Scholar] [CrossRef]
- Littke, R.; Leythaeuser, D.; Radke, M.; Schaefer, R.G. Petroleum generation and migration in coal seams of the Carboniferous Ruhr Basin, northwest Germany. Org. Geochem. 1990, 16, 247–258. [Google Scholar] [CrossRef]
- Jarvie, D.M.; Claxton, B.; Henk, B.; Breyer, J. Oil and shale gas from Barnett Shale, Ft. Worth Basin, Texas. In Proceedings of the AAPG National Convention, Denver, CO, USA, 3–6 June 2001. [Google Scholar]
- Jarvie, D.M. Components and processes affecting producibility and commerciality of shale resource systems. Geol. Acta 2014, 12, 307–325. [Google Scholar]
- Huang, Z.; Hao, Y.; Li, S.; Wo, Y.; Sun, D.; Li, M.; Chen, J. Oil-bearing potential, mobility evaluation and significance of shale oil in Chang 7 shale system in the Ordos Basin: A case study of Well H317. Geol. China 2020, 47, 210–219, (In Chinese with English abstract). [Google Scholar]


| Member | Lithology | Depth (m) | TOC (Wt. %) | S1 (mg/g) | S2 (mg/g) | Tmax (°C) | HI (mg/g) | S1 + S2 (mg/g) | S1/(S1 + S2) |
|---|---|---|---|---|---|---|---|---|---|
| C7-2 | Dark mudstone | 1996.9 | 3.42 | 0.87 | 2.14 | 451 | 63 | 3.01 | 0.29 |
| Dark mudstone | 1997.5 | 4.02 | 1.54 | 3.82 | 438 | 95 | 5.36 | 0.29 | |
| Dark mudstone | 1998.5 | 5.31 | 0.89 | 3.3 | 454 | 62 | 4.19 | 0.21 | |
| Dark mudstone | 2002.3 | 3.17 | 2.21 | 5.9 | 449 | 186 | 8.11 | 0.27 | |
| Dark mudstone | 2007.6 | 1.90 | 1.64 | 4.08 | 453 | 214 | 5.72 | 0.29 | |
| Black shale interbedded sandstone | 2010.2 | 8.54 | 1.54 | 3.71 | 443 | 43 | 5.25 | 0.29 | |
| Black shale | 2011.2 | 11.36 | 3.08 | 15.53 | 449 | 137 | 18.61 | 0.17 | |
| Black shale | 2012.4 | 11.68 | 2.95 | 17.17 | 452 | 147 | 20.12 | 0.15 | |
| Black shale interbedded sandstone | 2013.0 | 7.13 | 2.59 | 9.94 | 454 | 139 | 12.53 | 0.21 | |
| C7-3 | Dark mudstone interbedded sandstone | 2015.1 | 10.38 | 3.72 | 15.6 | 453 | 150 | 19.32 | 0.19 |
| Dark mudstone interbedded sandstone | 2018.7 | 8.14 | 2.16 | 12.06 | 451 | 148 | 14.22 | 0.15 | |
| Dark mudstone interbedded sandstone | 2021.5 | 4.25 | 1.53 | 4.45 | 451 | 105 | 5.98 | 0.26 | |
| Dark mudstone interbedded sandstone | 2022.1 | 2.53 | 0.93 | 3.1 | 454 | 122 | 4.03 | 0.23 | |
| Black shale | 2023.0 | 18.21 | 6.15 | 54.27 | 449 | 298 | 60.42 | 0.10 | |
| Black shale | 2024.5 | 16.05 | 3.94 | 27.33 | 451 | 170 | 31.27 | 0.13 | |
| Black shale | 2025.4 | 17.20 | 6.13 | 34.32 | 451 | 199 | 40.45 | 0.15 | |
| Black shale interbedded sandstone | 2036.1 | 18.00 | 6.27 | 41.48 | 451 | 230 | 47.75 | 0.13 | |
| Black shale interbedded sandstone | 2037.4 | 18.18 | 6.03 | 37.95 | 452 | 209 | 43.98 | 0.14 | |
| Black shale interbedded sandstone | 2038.3 | 11.56 | 2.65 | 14.05 | 453 | 122 | 16.7 | 0.16 | |
| Black shale interbedded sandstone | 2041.2 | 15.24 | 3.15 | 24.98 | 451 | 164 | 28.13 | 0.11 | |
| Black shale | 2044.3 | 14.04 | 3.58 | 26.31 | 451 | 187 | 29.89 | 0.12 | |
| Black shale | 2046.2 | 14.51 | 4.02 | 23.83 | 456 | 164 | 27.85 | 0.14 |
| Member | Lithology | Depth (m) | wax | Pr/Ph | Pr/nC17 | Ph/nC18 | TAR | C27/C29 |
|---|---|---|---|---|---|---|---|---|
| C7-2 | Dark mudstone | 1996.9 | 0.71 | 0.99 | 0.26 | 0.26 | 0.41 | 1.15 |
| Dark mudstone | 1997.5 | 0.67 | 1.09 | 0.28 | 0.25 | 0.38 | — | |
| Dark mudstone | 1998.5 | 0.59 | 1.05 | 0.23 | 0.22 | 0.30 | 1.00 | |
| Dark mudstone | 2002.3 | 0.72 | 1.00 | 0.32 | 0.32 | 0.45 | 0.99 | |
| Dark mudstone | 2007.6 | 0.70 | 0.93 | 0.23 | 0.24 | 0.39 | 0.97 | |
| Black shale interbedded sandstone | 2010.2 | 0.39 | 0.94 | 0.10 | 0.11 | 0.12 | 0.91 | |
| Black shale | 2011.2 | 0.32 | 0.97 | 0.10 | 0.10 | 0.09 | 0.92 | |
| Black shale | 2012.4 | 0.29 | 0.92 | 0.07 | 0.08 | 0.05 | 1.02 | |
| Black shale interbedded sandstone | 2013.0 | 0.63 | 0.97 | 0.37 | 0.37 | 0.40 | 0.99 | |
| C7-3 | Dark mudstone interbedded sandstone | 2015.1 | 0.48 | 0.94 | 0.16 | 0.17 | 0.22 | 1.01 |
| Dark mudstone interbedded sandstone | 2018.7 | 0.35 | 0.87 | 0.10 | 0.12 | 0.08 | 1.37 | |
| Dark mudstone interbedded sandstone | 2021.5 | 0.65 | 0.86 | 0.16 | 0.18 | 0.36 | 1.10 | |
| Dark mudstone interbedded sandstone | 2022.1 | 0.52 | 0.90 | 0.12 | 0.13 | 0.24 | 1.10 | |
| Black shale | 2023.0 | 0.31 | 1.01 | 0.08 | 0.08 | 0.08 | 1.10 | |
| Black shale | 2024.5 | 0.36 | 0.97 | 0.12 | 0.13 | 0.09 | 1.13 | |
| Black shale | 2025.4 | 0.32 | 1.03 | 0.10 | 0.10 | 0.08 | 1.08 | |
| Black shale interbedded sandstone | 2036.1 | 0.32 | 1.05 | 0.12 | 0.12 | 0.08 | 0.93 | |
| Black shale interbedded sandstone | 2037.4 | 0.34 | 0.98 | 0.10 | 0.10 | 0.08 | 1.15 | |
| Black shale interbedded sandstone | 2038.3 | 0.36 | 1.06 | 0.11 | 0.11 | 0.09 | 1.16 | |
| Black shale interbedded sandstone | 2041.2 | 0.33 | 0.95 | 0.09 | 0.10 | 0.10 | 1.35 | |
| Black shale | 2044.3 | 0.45 | 1.09 | 0.12 | 0.11 | 0.19 | 1.14 | |
| Black shale | 2046.2 | 0.52 | 1.14 | 0.13 | 0.11 | 0.23 | — |
Publisher’s Note: MDPI stays neutral with regard to jurisdictional claims in published maps and institutional affiliations. |
© 2022 by the authors. Licensee MDPI, Basel, Switzerland. This article is an open access article distributed under the terms and conditions of the Creative Commons Attribution (CC BY) license (https://creativecommons.org/licenses/by/4.0/).
Share and Cite
Hao, L.; Ma, X.; Gao, W.; Ren, Z.; Tao, H.; Huang, W. Geochemical Characteristics of the Chang 7 Source Rocks of the Triassic Yanchang Formation in Ordos Basin, China: Implications for Organic Matter Accumulation and Shale Oil Potential. Energies 2022, 15, 7815. https://doi.org/10.3390/en15207815
Hao L, Ma X, Gao W, Ren Z, Tao H, Huang W. Geochemical Characteristics of the Chang 7 Source Rocks of the Triassic Yanchang Formation in Ordos Basin, China: Implications for Organic Matter Accumulation and Shale Oil Potential. Energies. 2022; 15(20):7815. https://doi.org/10.3390/en15207815
Chicago/Turabian StyleHao, Lewei, Xiaofeng Ma, Wenqiang Gao, Zhaocai Ren, Huifei Tao, and Weikai Huang. 2022. "Geochemical Characteristics of the Chang 7 Source Rocks of the Triassic Yanchang Formation in Ordos Basin, China: Implications for Organic Matter Accumulation and Shale Oil Potential" Energies 15, no. 20: 7815. https://doi.org/10.3390/en15207815
APA StyleHao, L., Ma, X., Gao, W., Ren, Z., Tao, H., & Huang, W. (2022). Geochemical Characteristics of the Chang 7 Source Rocks of the Triassic Yanchang Formation in Ordos Basin, China: Implications for Organic Matter Accumulation and Shale Oil Potential. Energies, 15(20), 7815. https://doi.org/10.3390/en15207815