Article

Automatic Monitoring System for Online Module-Level Fault Detection in Grid-Tied Photovoltaic Plants

by
Belqasem Aljafari
1,
Siva Rama Krishna Madeti
2,
Priya Ranjan Satpathy
3,
Sudhakar Babu Thanikanti
3,* and
Bamidele Victor Ayodele
4,*
1
Department of Electrical Engineering, College of Engineering, Najran University, Najran 11001, Saudi Arabia
2
Department of Electrical and Electronics Engineering, SRKR Engineering College, Bhimavaram 534204, India
3
Department of Electrical and Electronics Engineering, Chaitanya Bharathi Institute of Technology, Hyderabad 500075, India
4
Department of Chemical Engineering, Universiti Teknologi PETRONAS, Seri Iskandar 32610, Malaysia
*
Authors to whom correspondence should be addressed.
Energies 2022, 15(20), 7789; https://doi.org/10.3390/en15207789
Submission received: 26 September 2022 / Revised: 15 October 2022 / Accepted: 19 October 2022 / Published: 21 October 2022

Abstract

:
In this paper, a novel fault detection and diagnosis technique for a grid-tied photovoltaic (GTPV) with the ability of module-level fault location and differentiation is proposed. The proposed system measures the voltage, current, and temperature of the PV modules using low-cost sensors and critically compares them with the mathematical evaluated data to locate the type and location of the fault in the system. Additionally, a power line communication (PLC)-based low-cost PV monitoring system for tracking the operation of individual modules along with a fault detection algorithm is proposed to detect and locate the fault in the system. An intuitive online web application is also created to make it simple for users to view monitored data online. The suggested method is shown to have reduced computing needs; thus, the transmission of data and fault diagnosis is performed using the same microcontroller without the need for extra hardware or simulation software. The usefulness of the proposed method in identifying different fault occurrences in GTPV systems has been shown via experimental findings.

1. Introduction

The global market for photovoltaics has grown considerably in recent years. The falling price of PV generating is a major contributor to this accelerated growth. Furthermore, most industrialized nations have enacted government programs to promote the development of grid-tied PV facilities. Several countries, including India, Germany, Japan, and Kenya, serve as impeccable models of success [1,2]. However, the area of PV system identification of fault has not advanced at the same rapid pace as the PV market/sector. The majority of PV systems in operation today have no kind of monitoring system in place. These are typically PV plants with an output power of less than 25 kWp [3,4]. Nevertheless, fault detection methods are increasingly crucial for implementation in lower-scale PV systems, due to the rapid expansion of PV installations [5,6,7].
In order to improve the efficiency, effectiveness, and dependability of the GTPV systems, researchers have recently been interested in fault detection methods. Maximum power point tracking (MPPT) inaccuracy [8,9,10], aging [11,12], shading impact [13,14], dust accumulation effect [15,16], snow build-up on the surface of the solar panels [17,18,19], and defective dc-ac inverters [20,21] are only some of the causes of energy loss in a PV system.
Various methods have been established for fault detection in GTPV systems. Partially shaded panels, defective modules, and a faulty string are just a few of the faults that may be detected in a PV system with the use of satellite data [22,23]. In contrast, the authors of [24,25] established a technique in which Earth capacitance measurements are used instead of weather data for PV performance diagnosis. This method consists of three layers: a passive diagnosis component, a fault localization method, and an active layer.
The authors in [26,27] suggested a robust fault detection system for GTPV installations. Artificial neural networks (ANNs) and the I-V characteristics of the studied PV system were the basis for the two algorithms used to develop the technique. On the PV side of a GTPV system, Dhimish and Holmes [28] discussed the implementation of a fault detection algorithm that can identify seven distinct failure types. In order to detect the existence of system fault conditions, the program employs the t-test statistical method. However, in [29], the alternating current side of the GTPV system is the primary focus of the fault detection method. This method uses ± 3 standard deviation statistical analysis. In [30], the authors developed a method for identifying hotspots in PV strings by characterizing their AC parameters; this method is used to determine modules in a string that are obscured by shadows; furthermore, the algorithm demonstrates that hot spot localization can be accomplished with just the measurement of two frequencies. However, Silvestre et al. [31,32] developed a method for analyzing voltage and current indicators in a GTPV system under partial shading faulty situations by using the correlation between current-to-voltage ratios in the presence of a single faulty string and in absence of any such faults [33,34,35]. There is also the ratio of voltages in the case when one PV module is bypassed, compared to the voltage ratios in the fault-free operating mode. Based on the aforementioned approaches, it can be inferred that some are not automated and only provide possible fault types (i.e., they cannot detect the location of the fault).
In this paper, a low-cost online monitoring system and fault detection algorithm have been developed to detect various faults in GTPV systems (modular level). Initially, by comparing the absolute error on the PV array power (DC power) to a predetermined threshold, a resulting diagnostic signal is generated. Thereafter, by comparing the various attributes such as string, module level powers, as well as the estimated and observed DC and voltage, we can identify the type of fault. The proposed method has detected the following fault categories:
  • − Open-circuit fault;
  • − Short-circuited fault;
  • − Partial shading fault (without bypass diode);
  • − Inverted bypass diode fault.
The developed system does not need any extra wiring installations since it employs power line communication (PLC) as the communication layer for data transfer over the existing dc power lines. Finally, a MATLAB/GUI (graphical user interface) software tool is developed to automatically show and monitor potential PV plant faults. Additionally, vital system data are shown and saved every 10 min. Therefore, the major contribution of this research study is to provide a fast and efficient fault detection technique for GTPV systems, to develop a tool using MATLAB/GUI, and to validate this technique using experimental data.
The sections of this paper are as follows: the proposed monitoring system’s design is available in Section 2. The methodology is described in Section 3. Section 4 presents experimental results that validate the proposed fault detection method. Finally, the conclusion of this study is outlined in Section 5.

2. Architecture of the Proposed Monitoring System

Figure 1 demonstrates PV plant architecture with the proposed monitoring system. The GTPV system developed at the SRKR Engineering College, Bhimavaram, India, has been used to experimentally evaluate the proposed monitoring and fault detection method. The system uses 115 WP of nominal power from 18 polycrystalline silicon PV modules. Each of the three strings of PV modules consists of six PV modules connected in series. The PV array is connected to the Mastervolt QS-6400 inverter, which is the designated inverter for this application. It comprises economical smart devices with microcontrollers. Each PV module does have a monitoring system installed and a data transfer route, as well as the tool created for system monitoring. This communication PLC technology is used by the path to facilitate communication across DC power cables that are already in place (red dotted lines) and does not need any extra installation. Table 1 lists the weather and electrical data points measured in real time with the proposed monitoring system. A potential divider and an AC transformer are used during the measurement of the output voltage of a PV module ( V P V ) and the output voltage of an inverter ( V a c ), respectively. This is done to adjust the voltage levels to the input of an analog-to-digital (ADC) converter. Both direct currents ( I P V ) and alternating currents ( I a c ) may be measured with the use of Hall effect sensors. The readings from the sensors are handled by the slave PLC module, which is constructed on a 16-bit PIC-MCU. The slave and master PLC modules are the main components of this system. Each module is determined by measurements and is examined to see if there are any anomalies. The primary PLC component is placed close to a PV inverter. It monitors voltage and current as well as other inverter and storage battery condition information. The main PLC module combines each PV module’s and inverter’s data over time and concurrently saves them to the secure digital (SD) card. A novel algorithm has been created and added to the master PLC module to recognize various defects at the modular level and show other crucial information with a 10 min watch window interval on the created tool, which enables real-time system monitoring.
The detected data are also wirelessly sent in real time to the server using the Wi-Fi module (ESP8266). The user may use a web-based tool that has been designed to monitor and detect faults in a PV plant.

3. Problem Definition for the Fault Detection in PV System

Solar PV systems do not experience the same levels of mechanical wear, heat, or maintenance difficulties that are associated with other forms of energy production since they do not include any moving components or undergo internal combustion. However, there is a considerable chance of failure because solar PV systems involve complex electronics and are situated outside where they are subjected to constant sunshine and precipitation. Esram and Chapman [36] describe the results of the monitoring of two actual PV systems. It was claimed that there was an annual power loss of 18.9% owing to seven different kinds of defects.
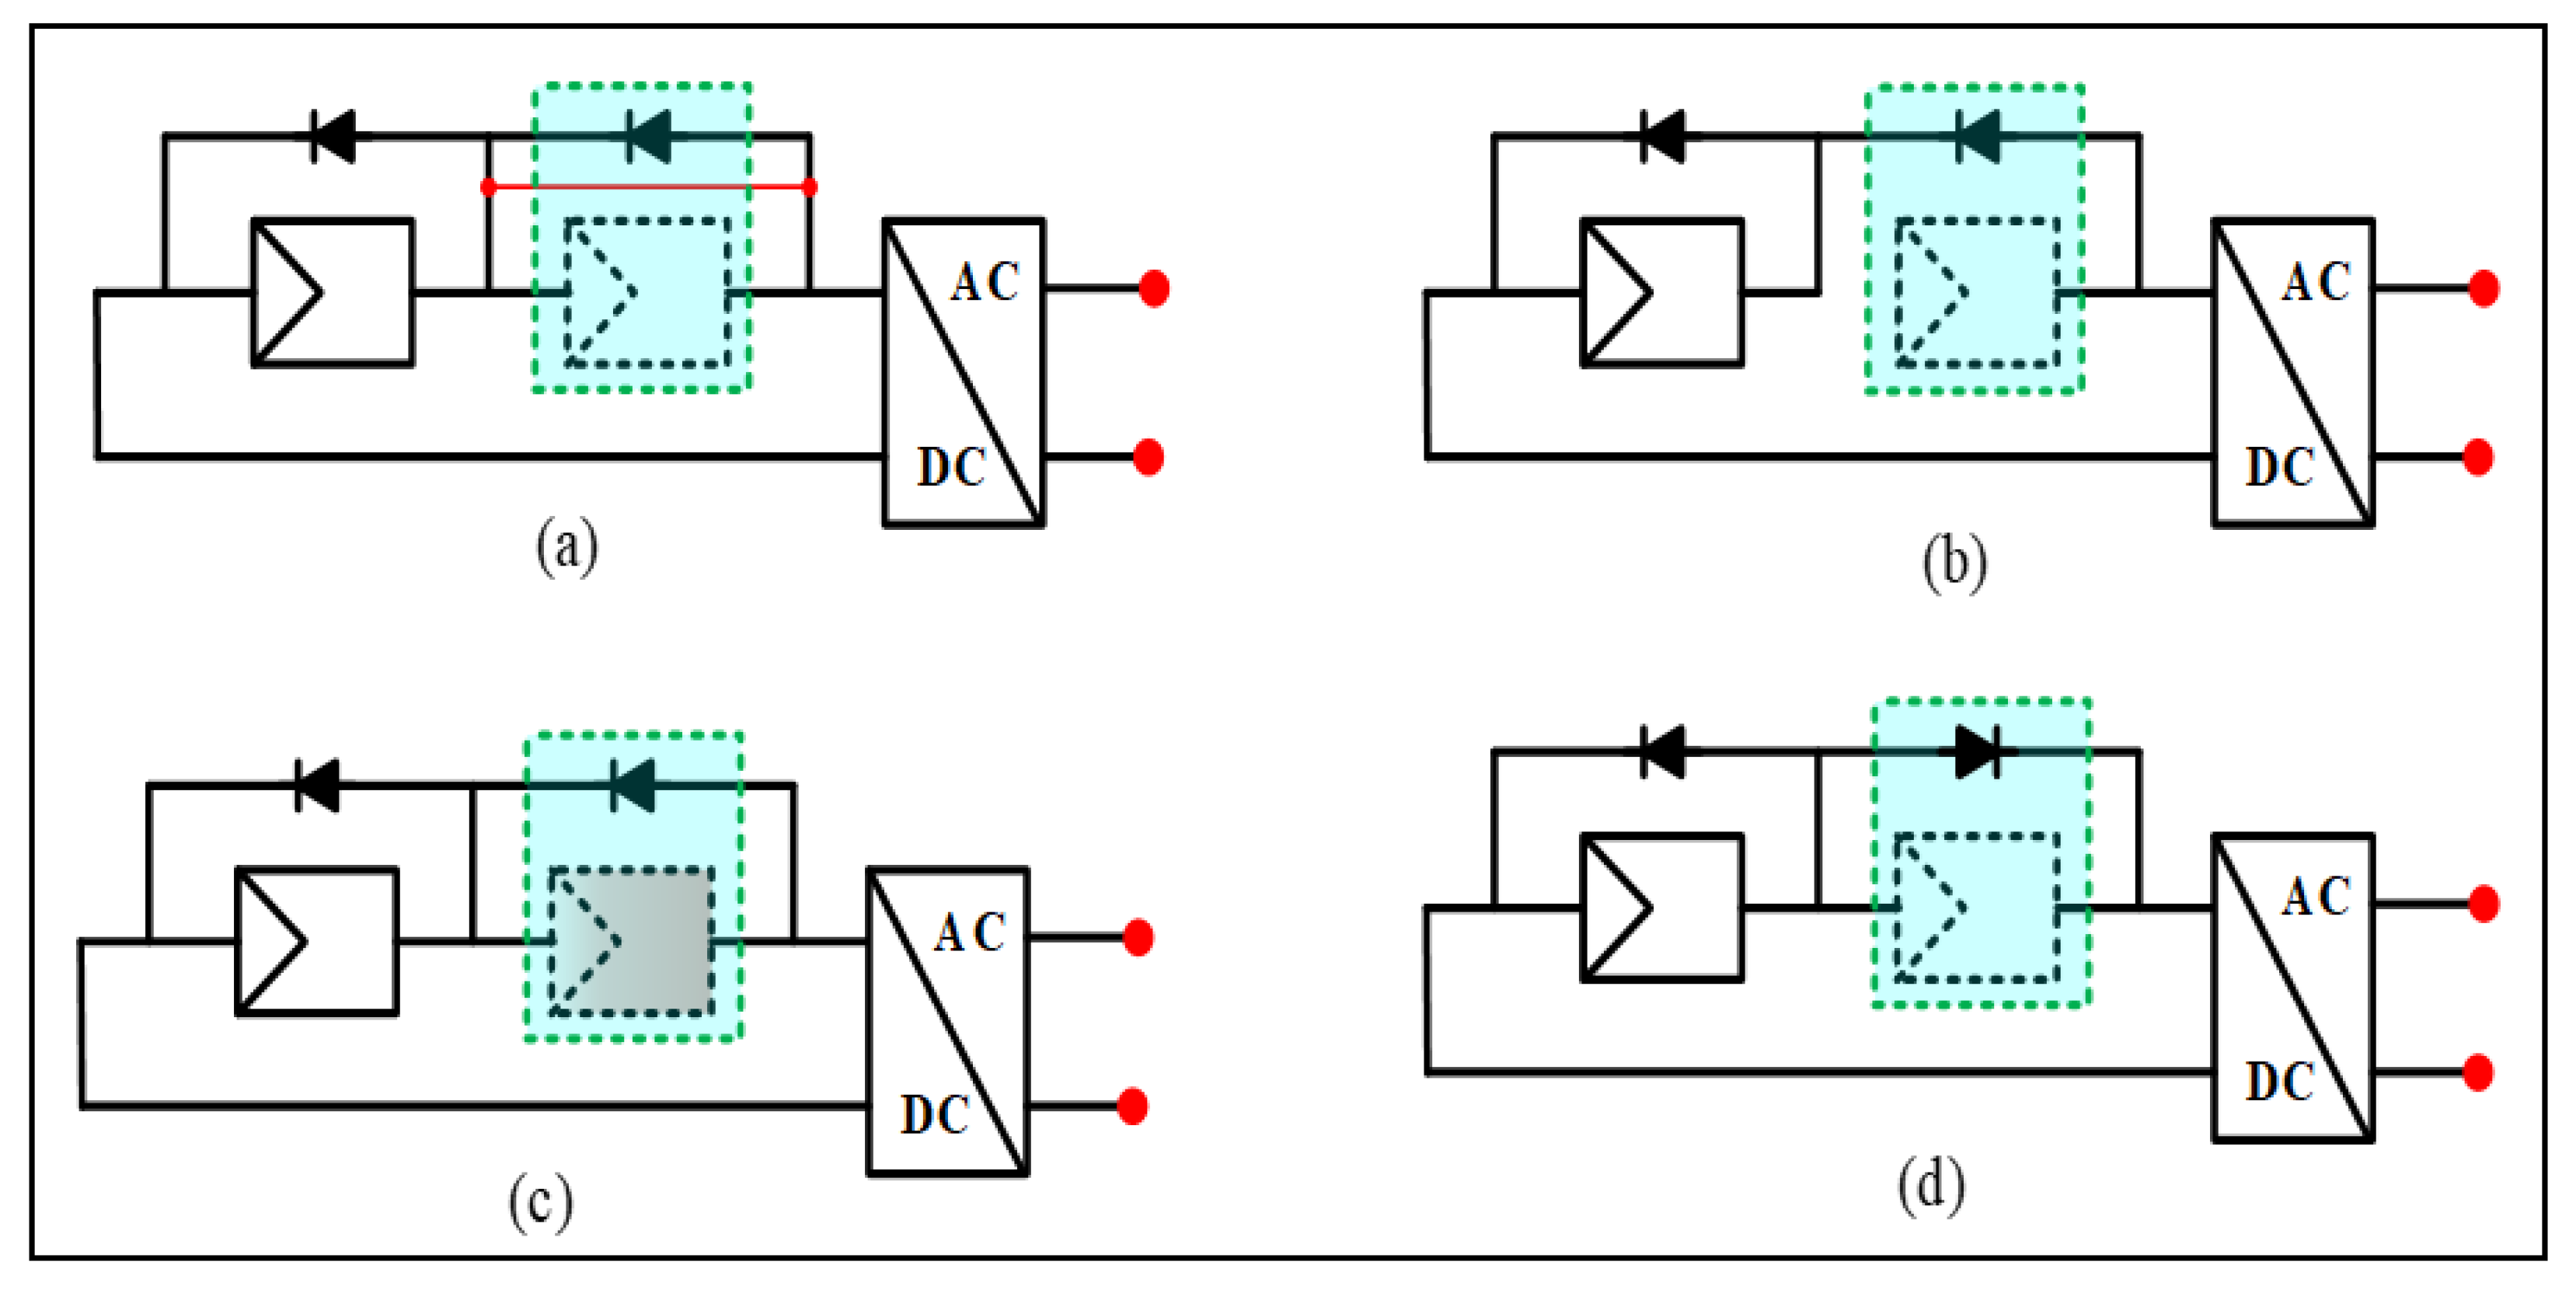
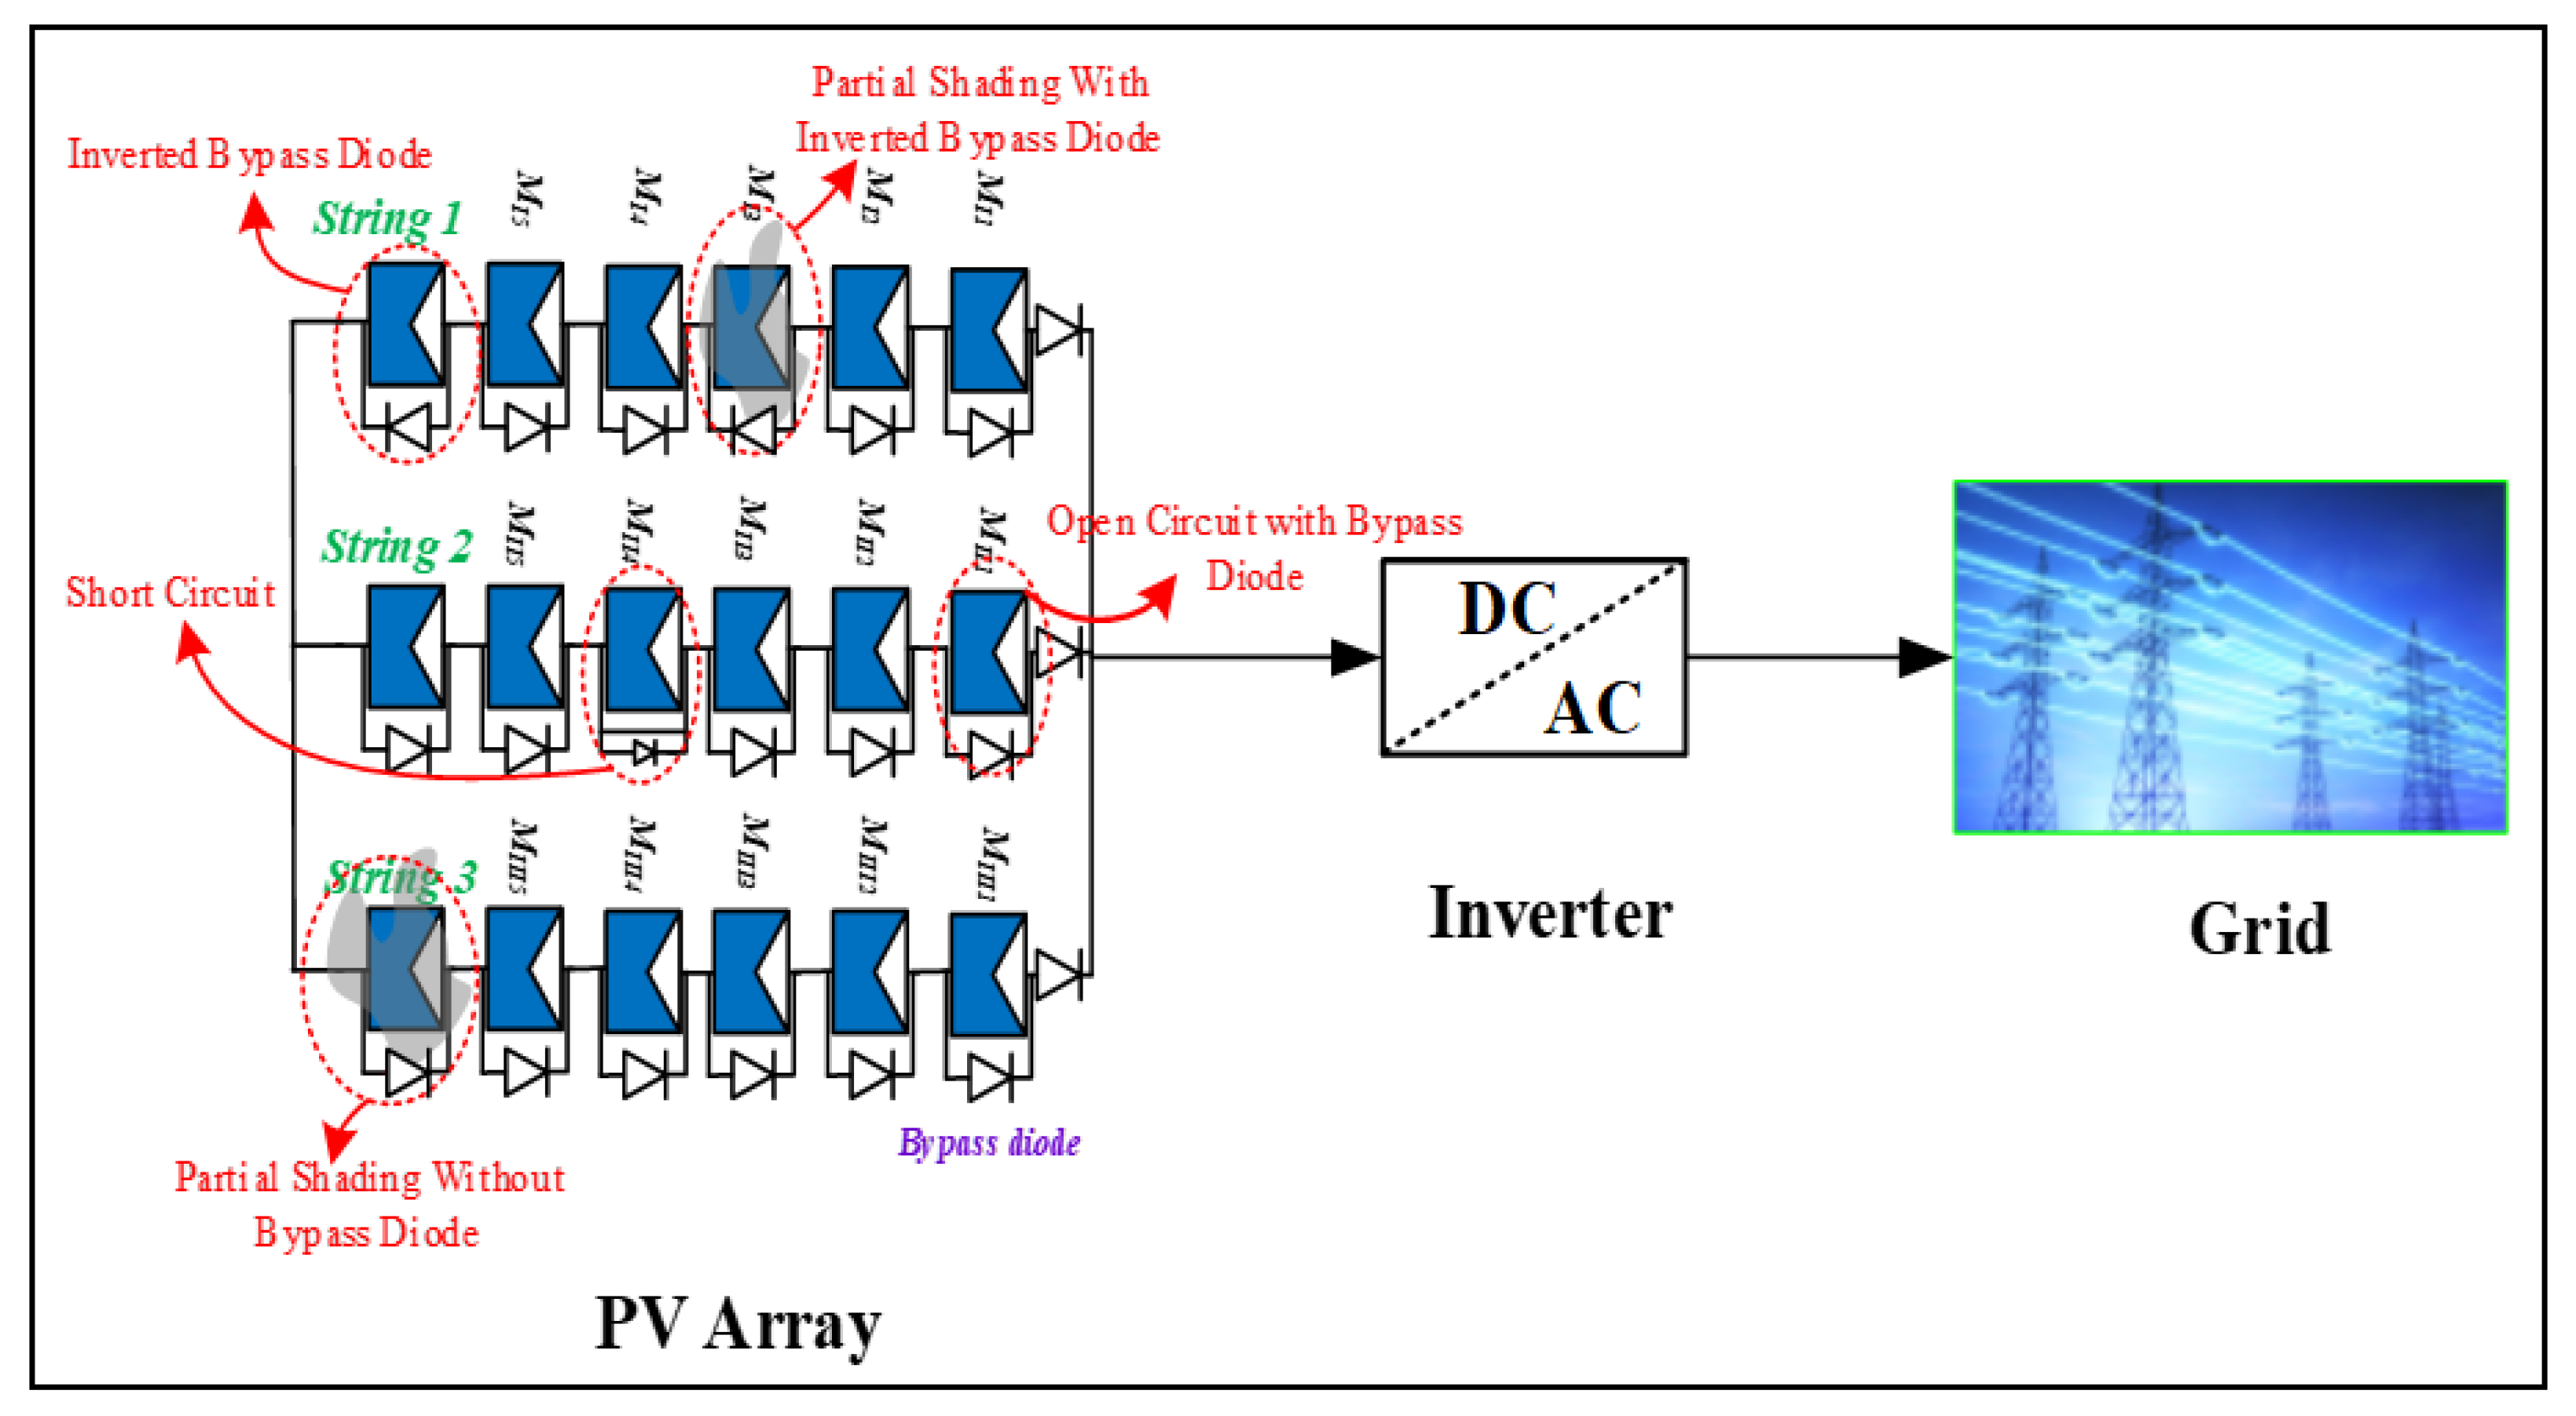
This work aims to identify the defects that may be found on both sides of the argument, and with reference to Table 2, a variety of faults will be studied. A fault known as an inverted bypass diode happens when the bypass diodes across PV modules are linked oppositely as intended as a result of the operator making poor connections. When the bypass diode terminals get shorted, a short circuit might develop between two or more PV modules that are connected in series. Because of their advanced age, the power cables that connect PV modules and PV strings are prone to open-circuit faults. Open-circuit with bypass diode fault and open-circuit without bypass diode fault are two subcategories that may be further subdivided under this category. The purpose of Figure 2 is to provide a clear understanding of the problem by displaying a schematic depiction of all of the different faults that might occur on the DC side of a PV system. The partial shading fault, which raises the temperature of a PV module/cell and results in irreversible damage to the whole PV system, may be brought on by uneven solar radiation on PV arrays owing to passing clouds, trees, and buildings closer to the PV plant, mismatched in modules, etc. In most cases, disconnected or defect in voltage or current sensors is the root cause of an MPPT failure. The destruction or malfunctioning of individual components or power switches in a power converter unit is a frequent cause of common failures in the unit (short- or open-circuited). The procedure for fault location is explained in further detail in the following parts. Figure 3 shows various faults (locations) created on the 2 kW, 6 × 3 PV array connected to the grid.

4. Methodology

The modeling of PV power is presented in this section and the basic principle of the fault identification and diagnostic process is described.

4.1. DC Predicted Power

A simulation model based on MATLAB and LabVIEW is used to estimate the predicted power [47,48,49]. Real-time climate data are provided to simulation models as input for accurate prediction of PV system output. Other simulation models to estimate the PV power have been proposed in the literature [50,51]. All of the above-mentioned techniques add cost to the system since they need a personal computer, grid electricity, and expensive commercial software for modeling and simulation (LabVIEW, etc.). Therefore, the current and voltage of the PV module at MPP have been estimated analytically, which eliminates the need for the simulation tool in the fault detection method. The maximum current and voltage of a PV module i.e., Vmm, Imm can be determined by using G and Tcell and given by:
I m m = ( I m m r 1000 G + ( d I s c m d T ) ( T c e l l T r ) )
V m m = ( N s c V T l n ( 1 + I s c m I m m I s c m ( e V o c m N s V T 1 ) ) I m m R s m )
The PV module open-circuit voltage (Vocm) and short-circuit current (Iscm) values can be obtained by using Equation (3).
I s c m = ( I s m r 1000 G + ( d I s c m d T ) ( T c e l l T r ) )
V o c m = V o c m r + ( d V s c m d T ) ( T c e l l T r ) + V T l n ( I s c m I s m r )
where I s c m r and V s c m r , respectively, stand for the PV module’s short-circuit current and open-circuit voltage under standard test conditions (STC). To investigate the efficacy of the values calculated, a simulation study was carried out. This study makes use of the basic model for PV system modeling created by [52,53]. It is evident that the predicted values generated by using (3) and (4) have results that are fairly similar to those on the manufacturer’s datasheet. I m and V m values for any arbitrary series-parallel PV array PV module connections ( N s × N p )   may be determined under any condition using (5) and (6).
I m = N p ( I m m r 1000 G + ( d I s c m d T ) ( T c e l l T r ) )
V m = N s ( N s c V T l n ( 1 + I s c m I m m I s c m ( e V o c m N s V T 1 ) ) I m m R s m )
The estimated PV array DC output power may be written as follows from the equation below.
P d c _ c a l = V m × I m
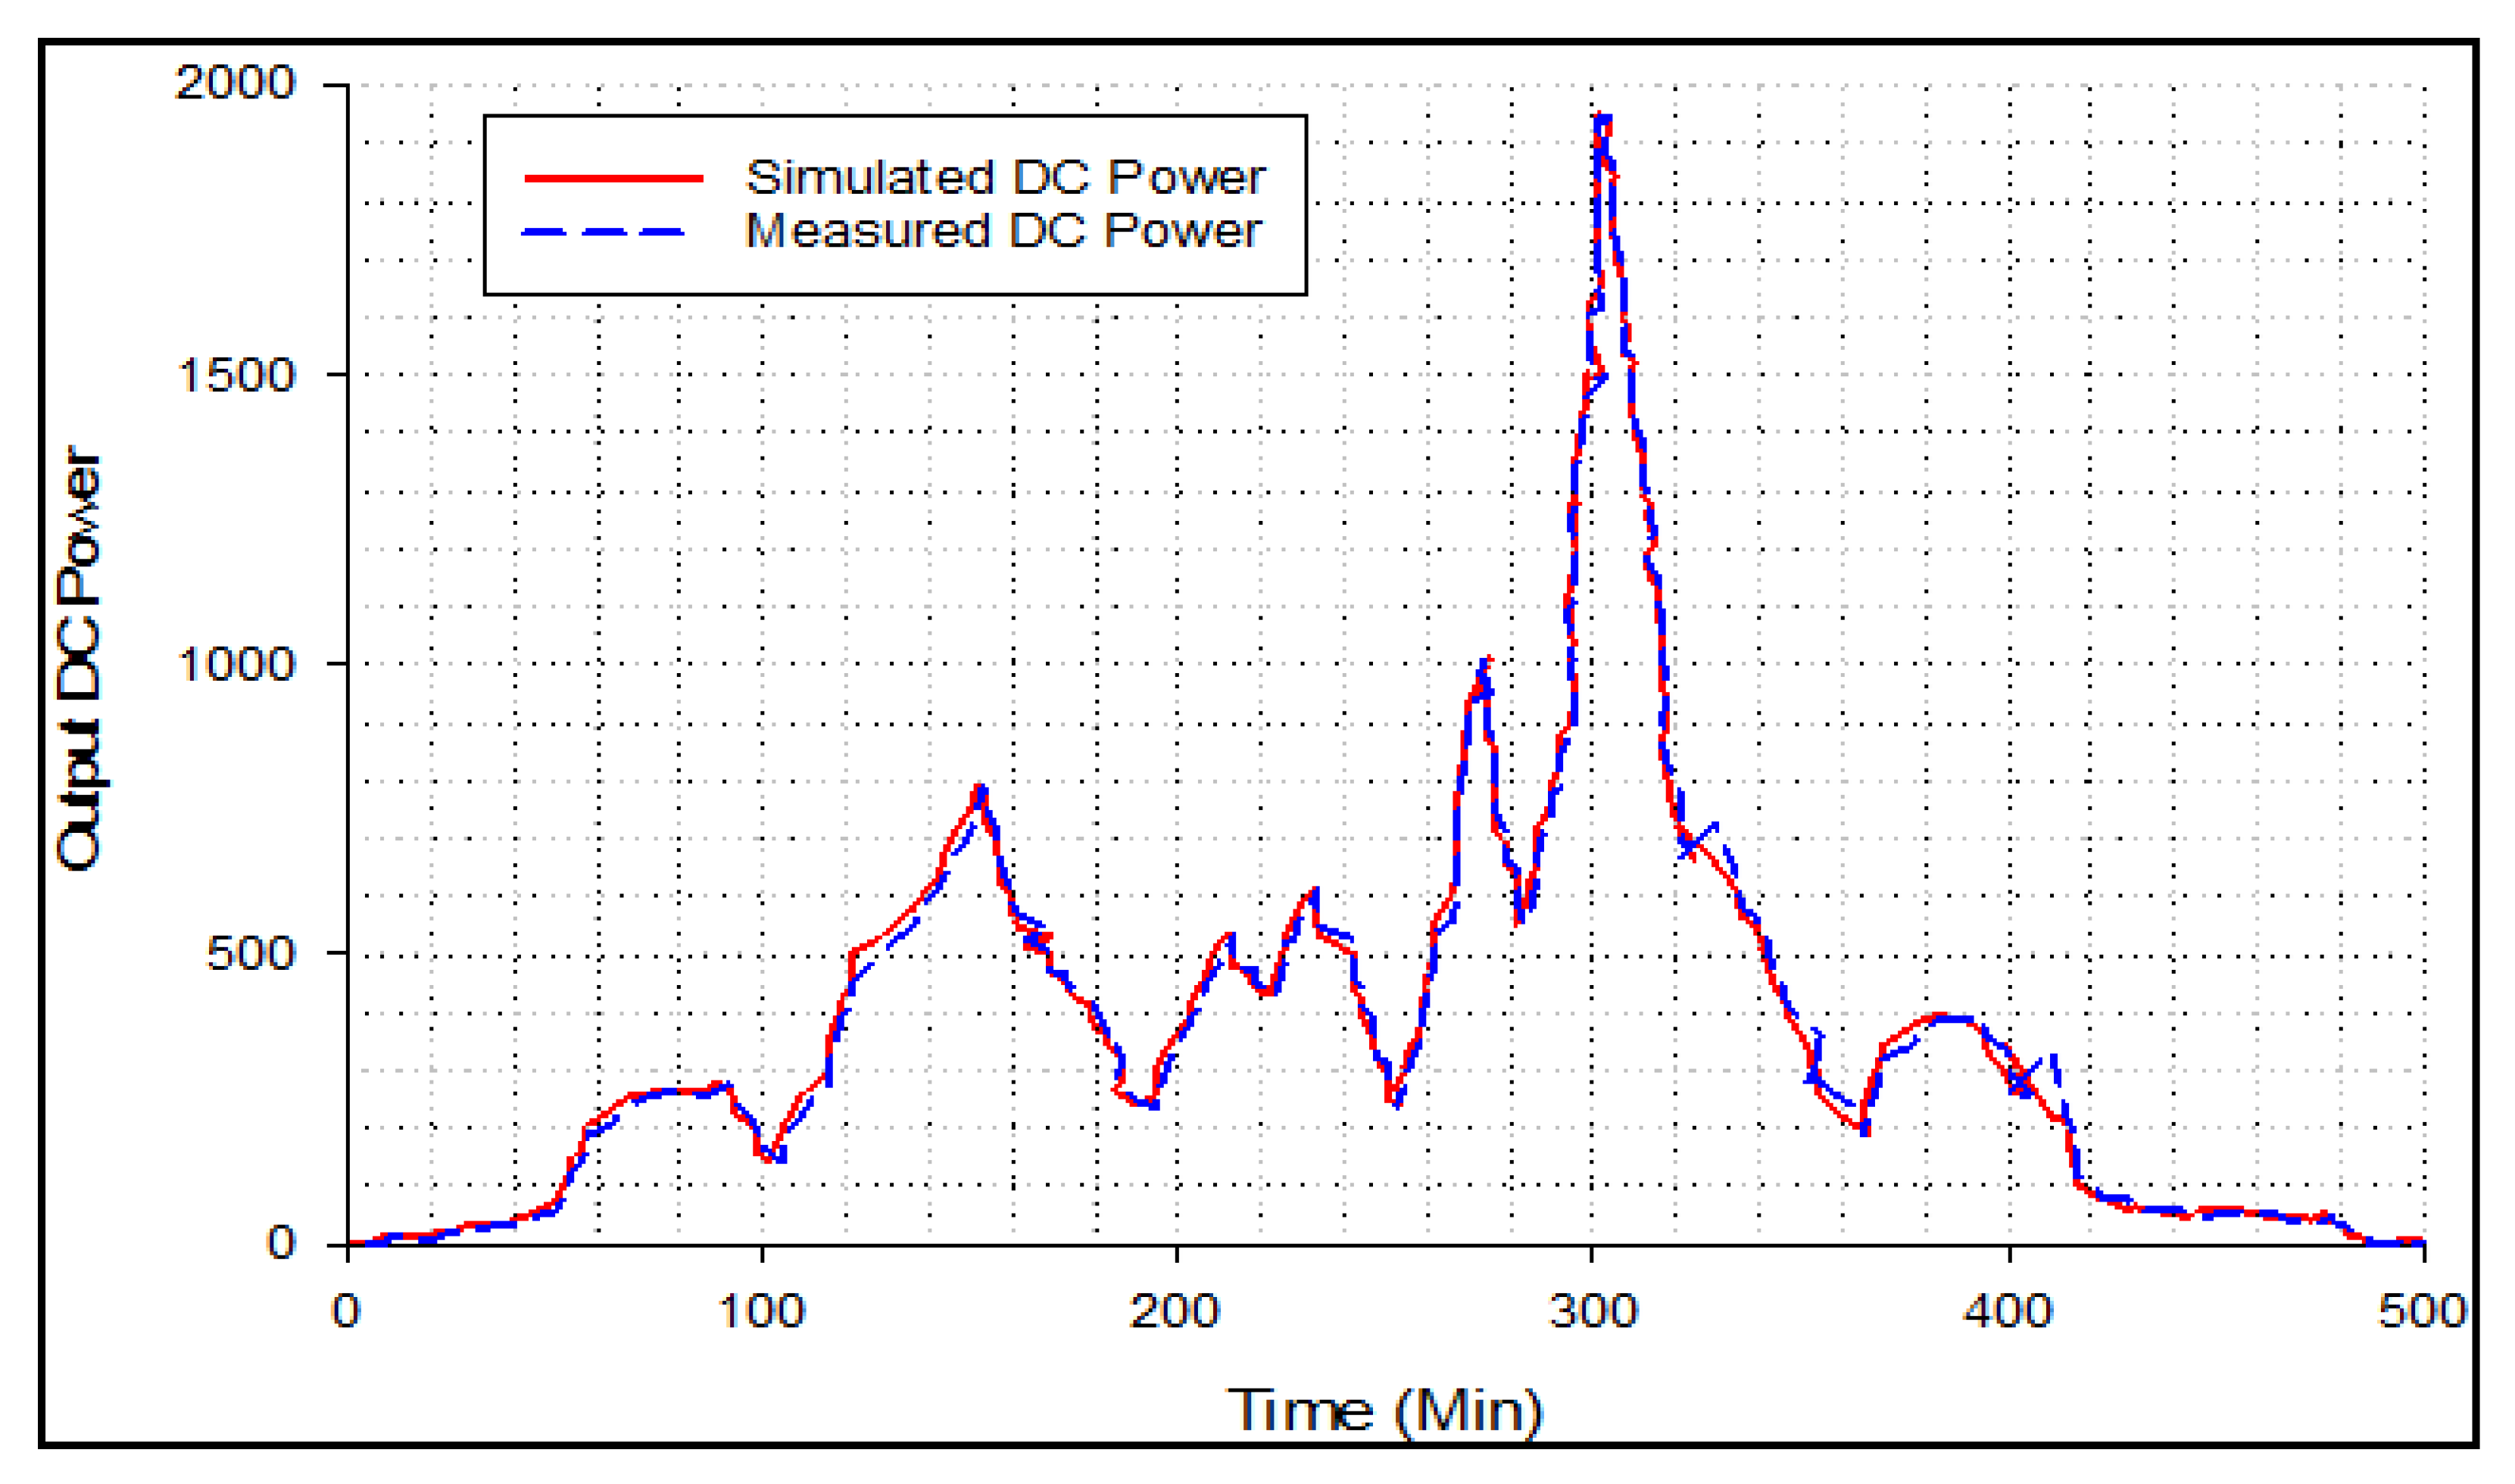
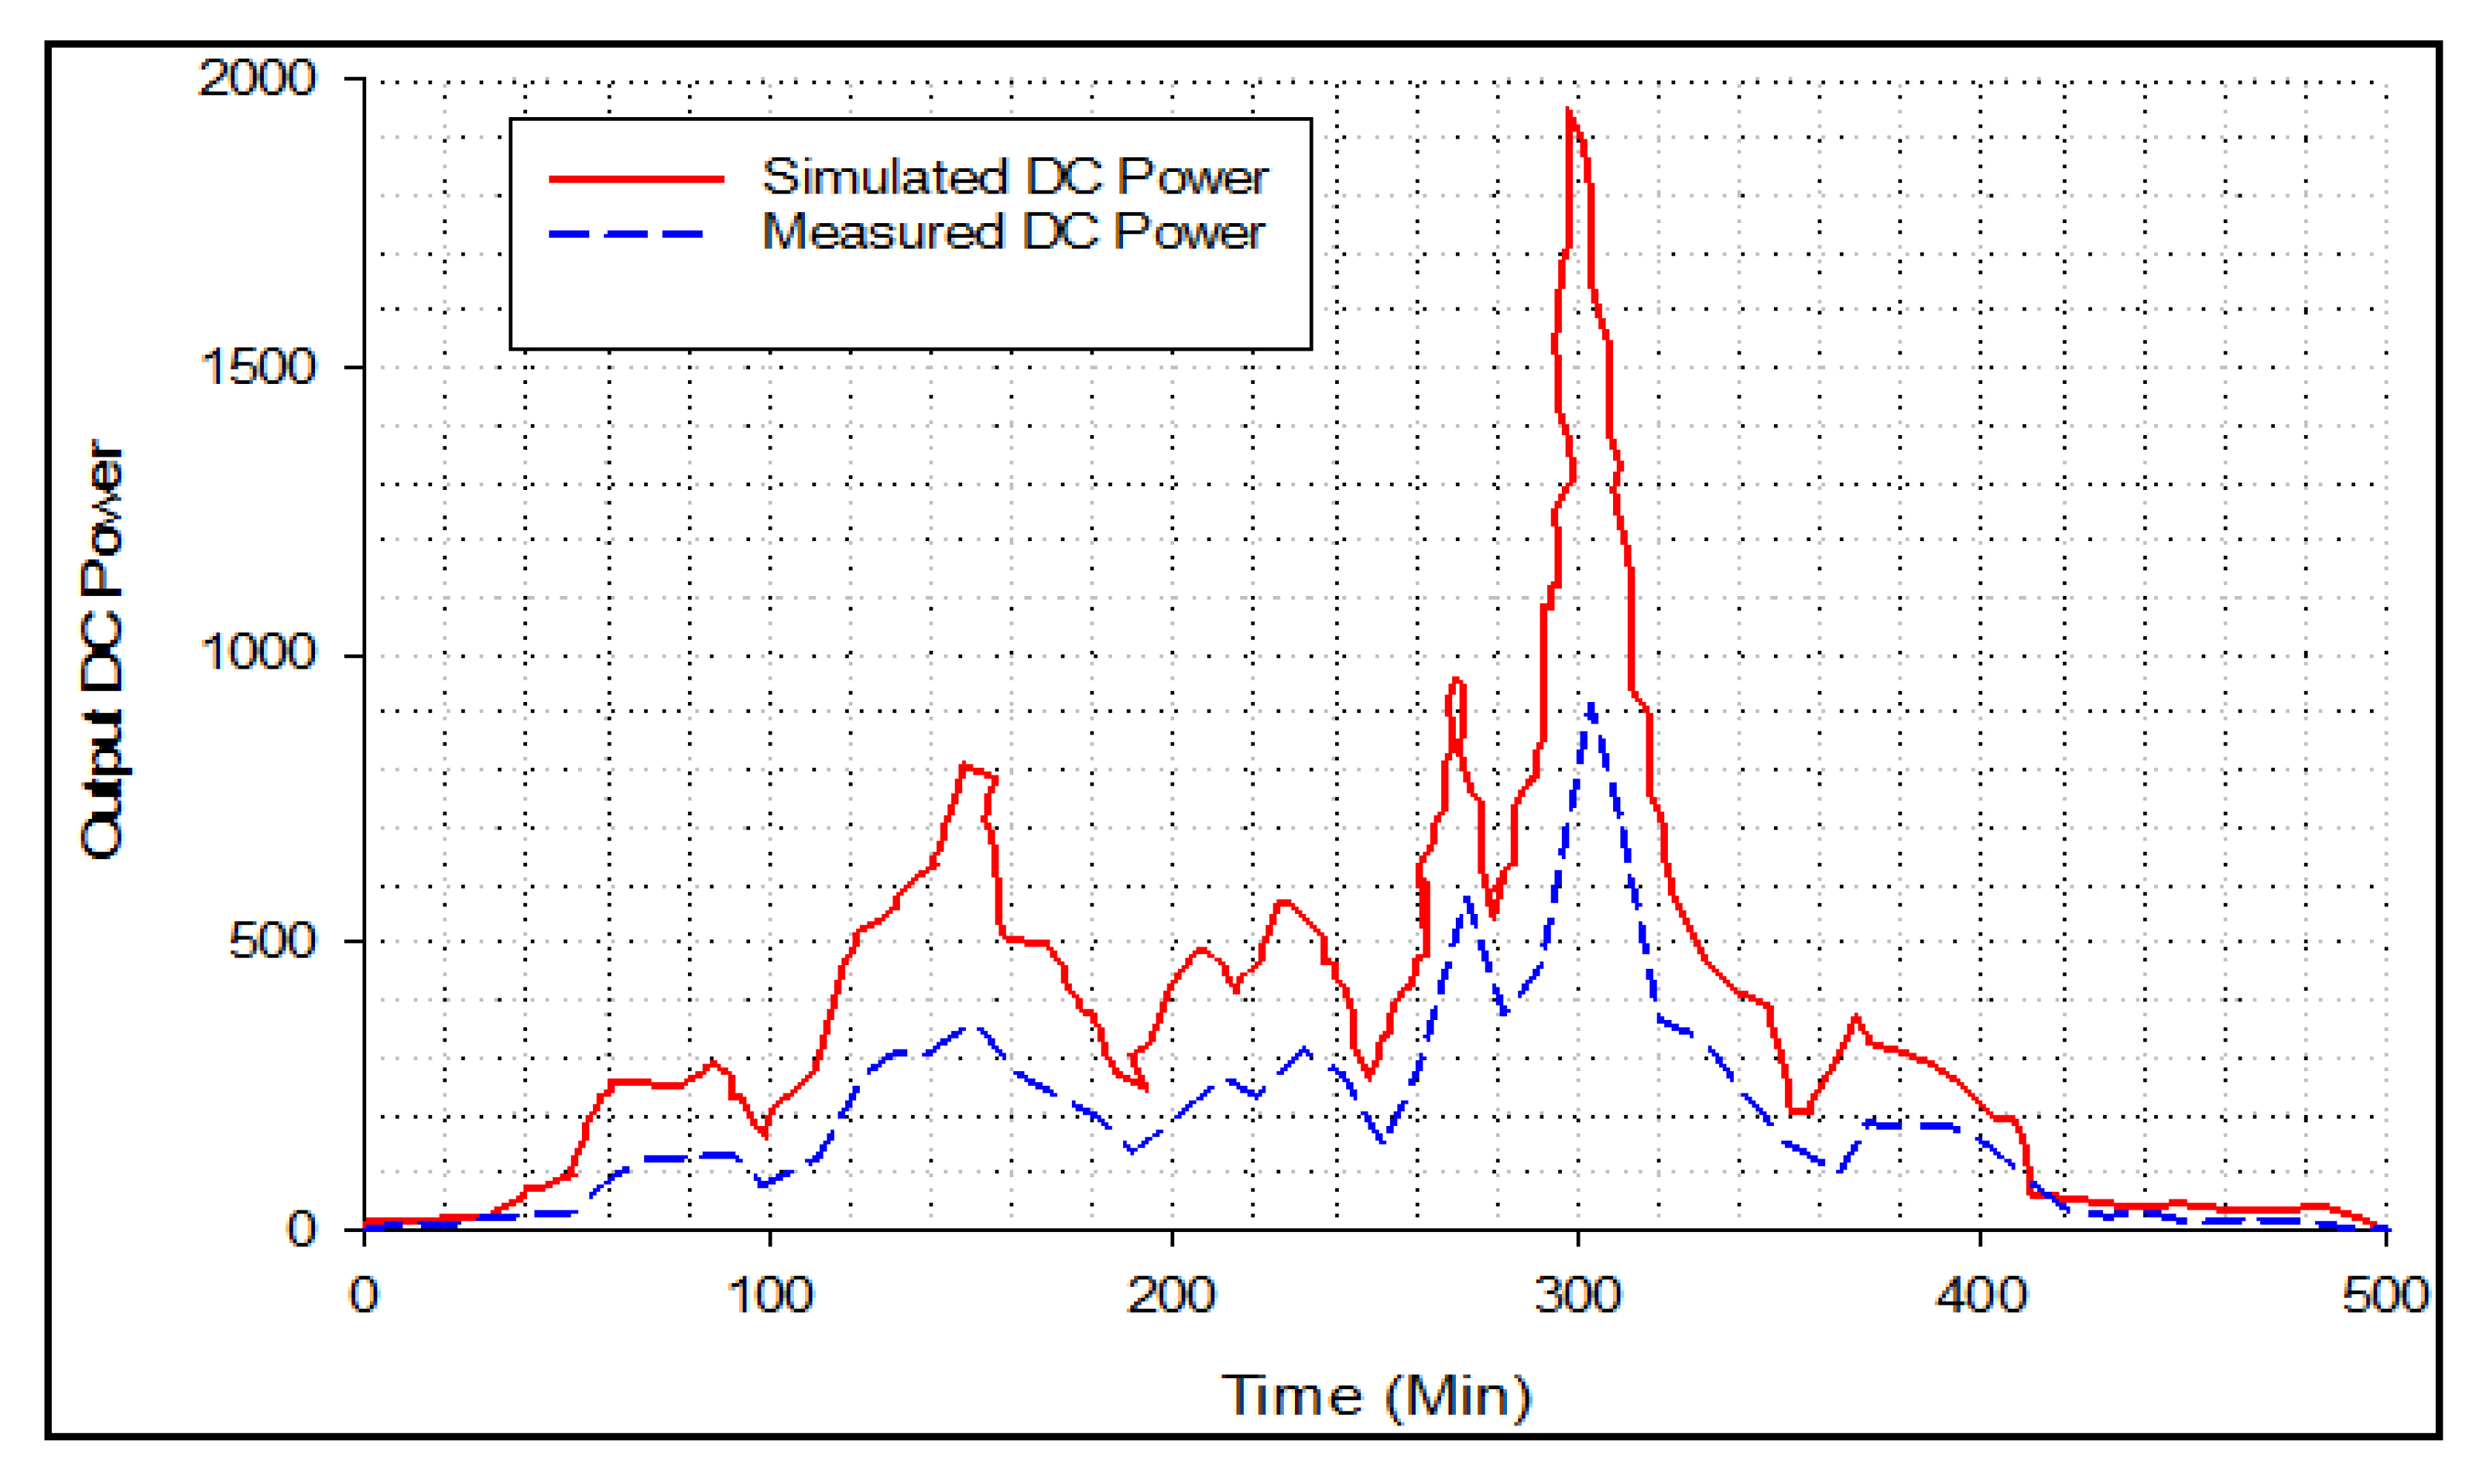
Over 3 years, the rate of power deterioration of the modules used in this experiment was examined. The value was determined to be 0.5% annually, which is well within the International Electro-Technical (IEC) 61,215 standards’ limitations [54]. Therefore, after operation of 11 years, the output power of the modules employed in this study was 90% of its original nominal value, and after 22 years, it was 80%. A comparison of the estimated and measured DC power on 29 August 2022 is shown in Figure 4. The two signals have a fair degree of agreement, and the correlation coefficient is 98%.

4.2. Proposed Fault Detection Technique

The real aim of the fault detection system is to identify when and where a fault has occurred in the GTPV plant under consideration. To monitor the weather parameters and electrical variables, the system requires a variety of sensors. The PV module model incorporates the observed module temperature and solar irradiation as inputs to compute the power output of a PV array in real time.
To extract maximum power from a PV module, the perturb and observe (P&O) MPPT approach has been used. Around the MPP, the operating point varies. The change in DC power (old and new) is set at 0.05 to decrease oscillations of the operating point near the MPP. If the power differential is below the given threshold, the MPPT stops; otherwise, it starts again. A fault is identified if it takes longer to achieve the stable state than the MPPT update interval.
The proposed fault detection technique is based on the study of the variance between the measured and the simulated DC power values. The developed technique’s accuracy is mostly dependent on the precision of the PV models analytically calculated, as well as the accuracy of the sensors and other tools used. Theoretically, the change in DC power Δ P D C ought to be nearly zero while the system is functioning normally and ought to be different from zero when a failure occurs. Practically, Δ P D C is near zero (but not precisely zero) in the absence of a malfunction; as a result, Δ P D C   has been compared to a threshold to avoid false alarms. Multiple experiments have shown that the average daily value of Δ P D C is consistently lower than 0.05; hence, we can adjust the threshold ( ε 2 ) such that it is equivalent to a number that is more than 0.05, such as 0.07. Therefore, the diagnostic signal = 1 (fault signal) is generated when:
P d c _ c a l P d c m e a s > ε 2
where P d c _ c a l represents the analytically calculated DC power and P d c m e a s represents the measured DC power.

4.3. Fault Identification

Whether the parameter Δ P D C   exceeds the threshold value is determined using the diagnostic technique outlined in Section 4.2. As a result, this shows that there is a fault in the PV array. It is important to identify the fault’s root cause. A Δ P s t r i n g   is provided as follows to identify the type of fault type present in the PV module. Diagnostic signals, power ratio indicators, and significant characteristics (voltage, current) of various PV system components have all been examined to evaluate the type and location of the fault. To achieve this, various threshold values are stated as follows:
Δ P s t r i n g ε 3
Δ P m o d ε 4
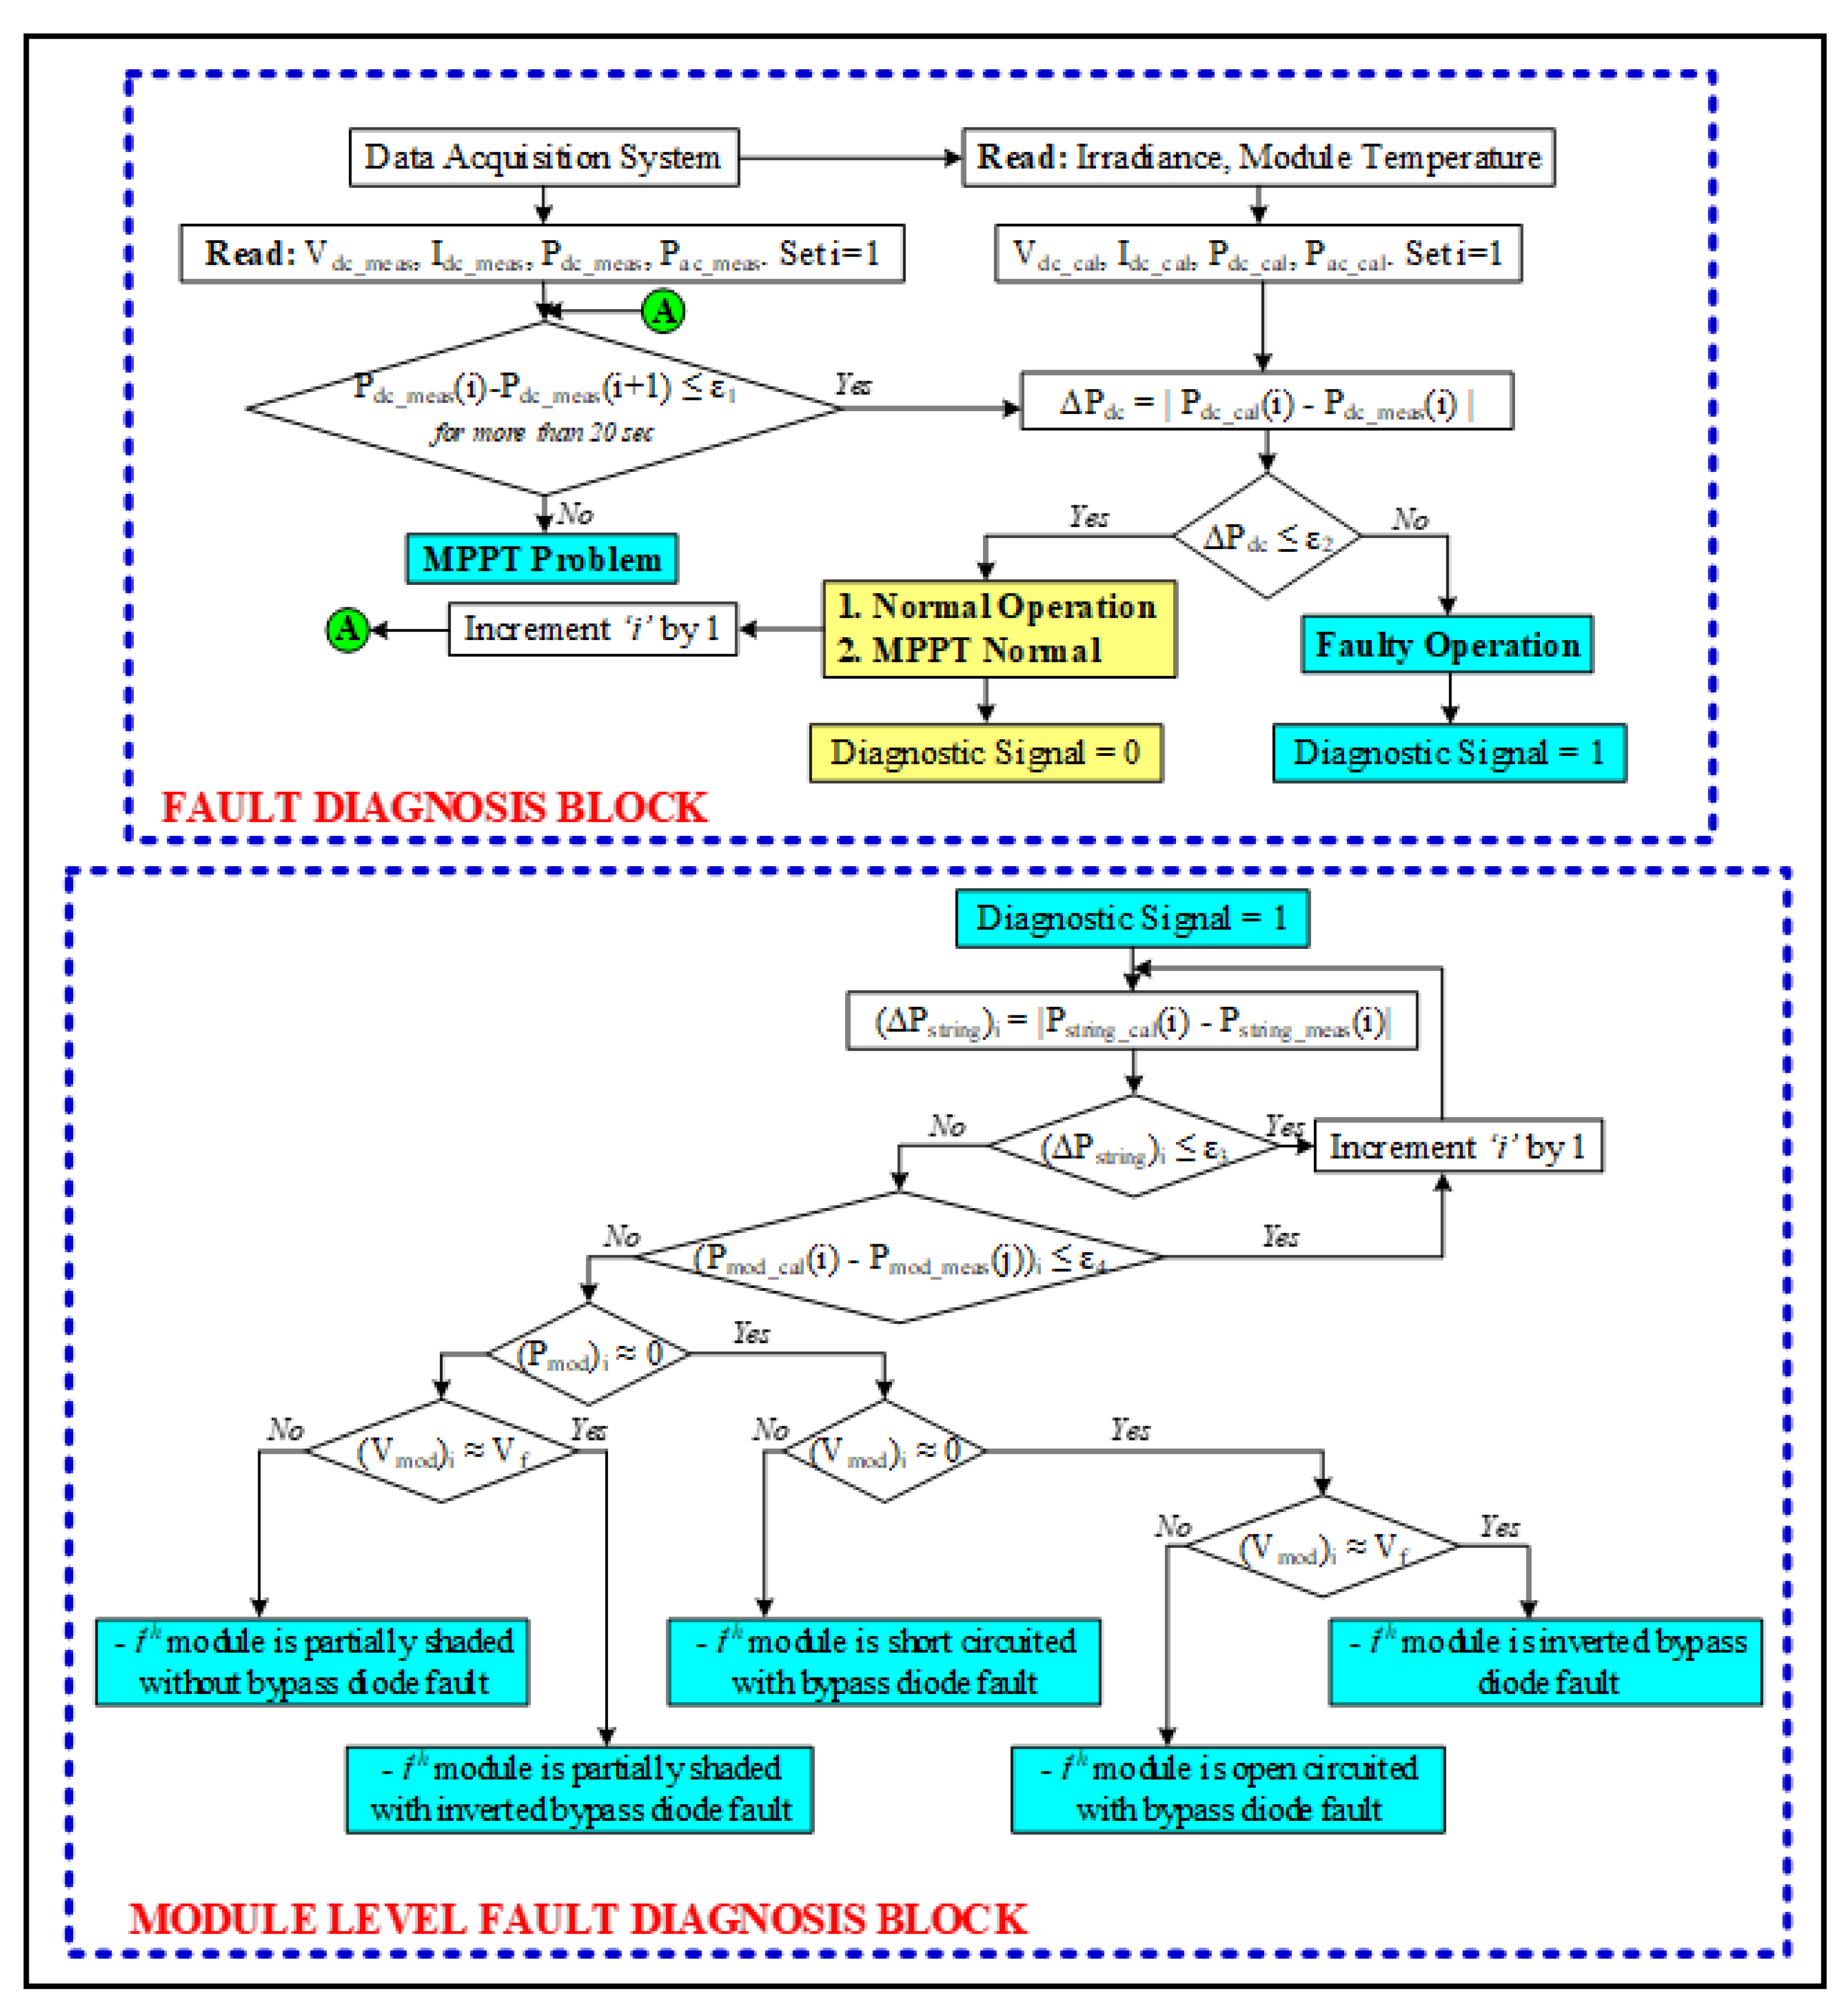
The flowchart shown in Figure 5 illustrates the fault detection and localization process.

4.4. Automated Tool for the Identification of Faults

The graphical representations of this are created using a graphical user interface (GUI) MATLAB/GUI so that the diagnosis process may be made more straightforward and simple. The GUI that was built can monitor the PV plant in real time. Its outputs include the status of the diagnostic signal, the values of Δ P s t r i n g _ string and Δ P m o d . Additionally, it outputs the type of fault that has occurred as well as its location. The measured meteorological and electrical data are imported from the database as inputs, together with the analytically calculated values.

5. Experimental Validation

In this section, the effectiveness of the proposed fault diagnostic procedure is evaluated to verify its performance. To accomplish this goal, the data obtained on three separate days (e.g., 21 July 2022, 18 August 2022, and 29 August 2022) have been taken into consideration. Four case studies were investigated and discussed. The developed GUI that was built can display and store the condition (normal/fault). This is accomplished by performing a comparison between the measured and calculated electrical voltage, current, and power. The GUI also displays the monitored and calculated variables. Additionally, the user may print and see the system’s evolution at the end of the day.

5.1. Case 1: No-Fault

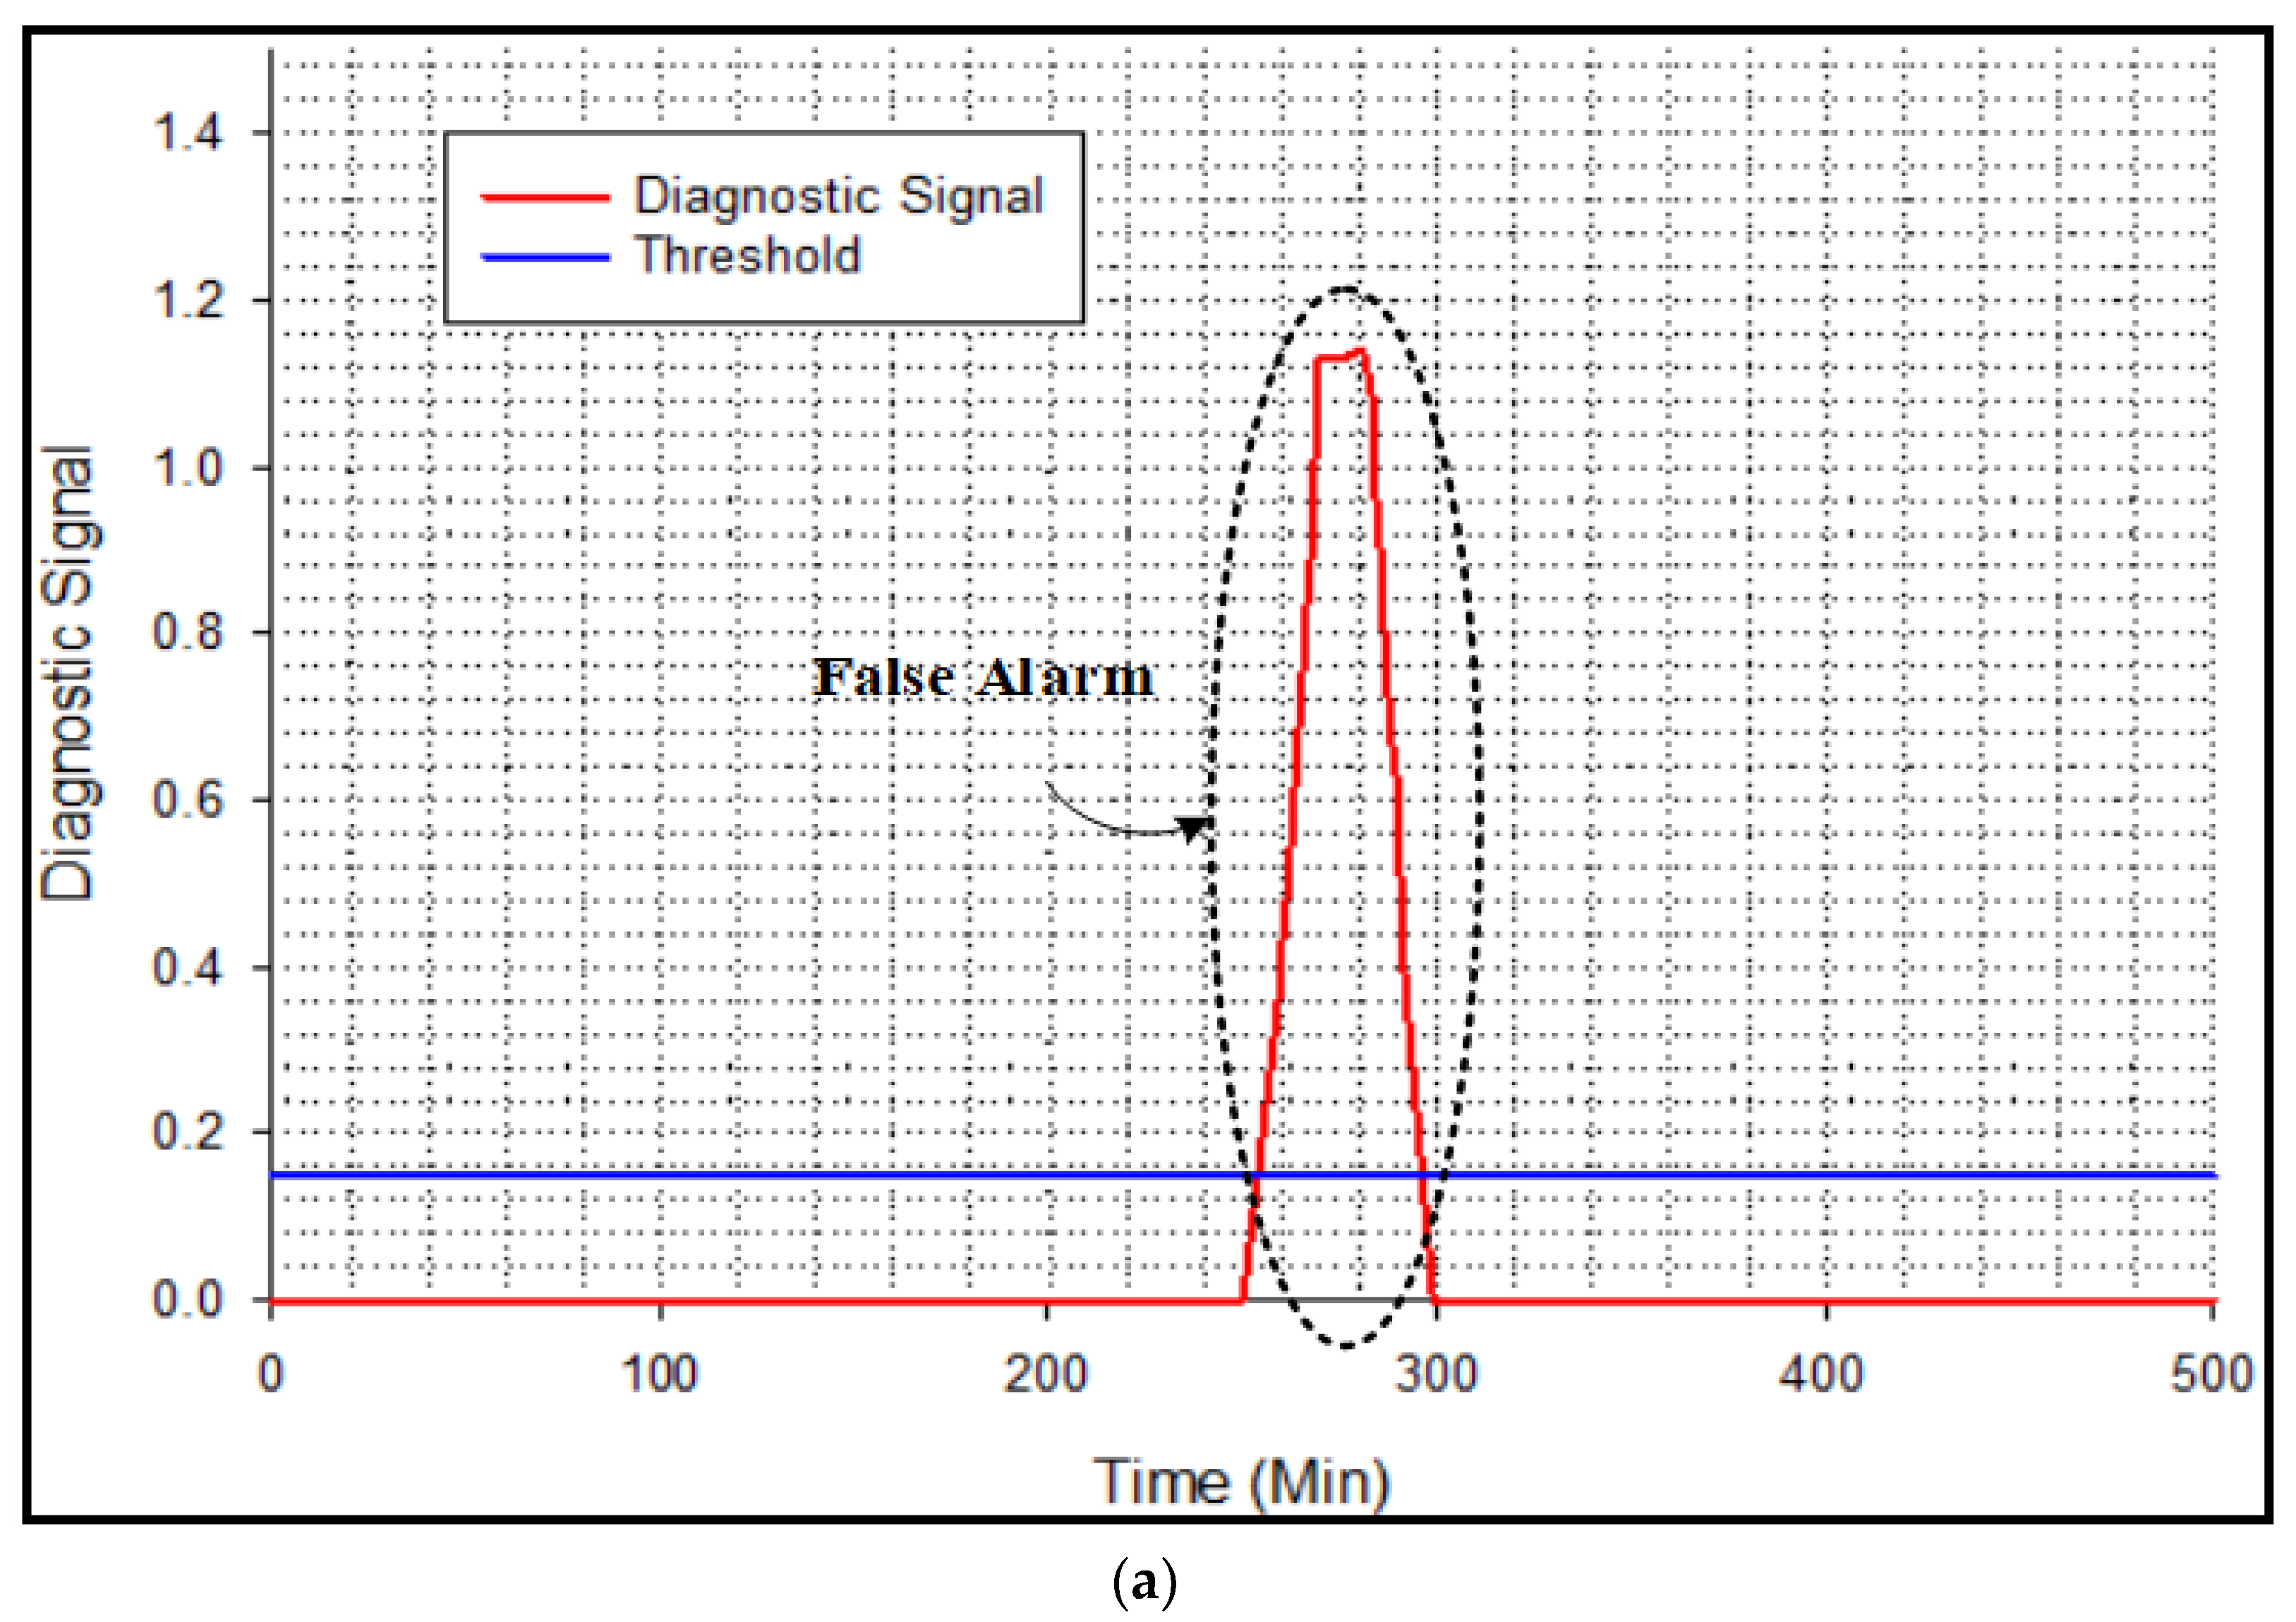
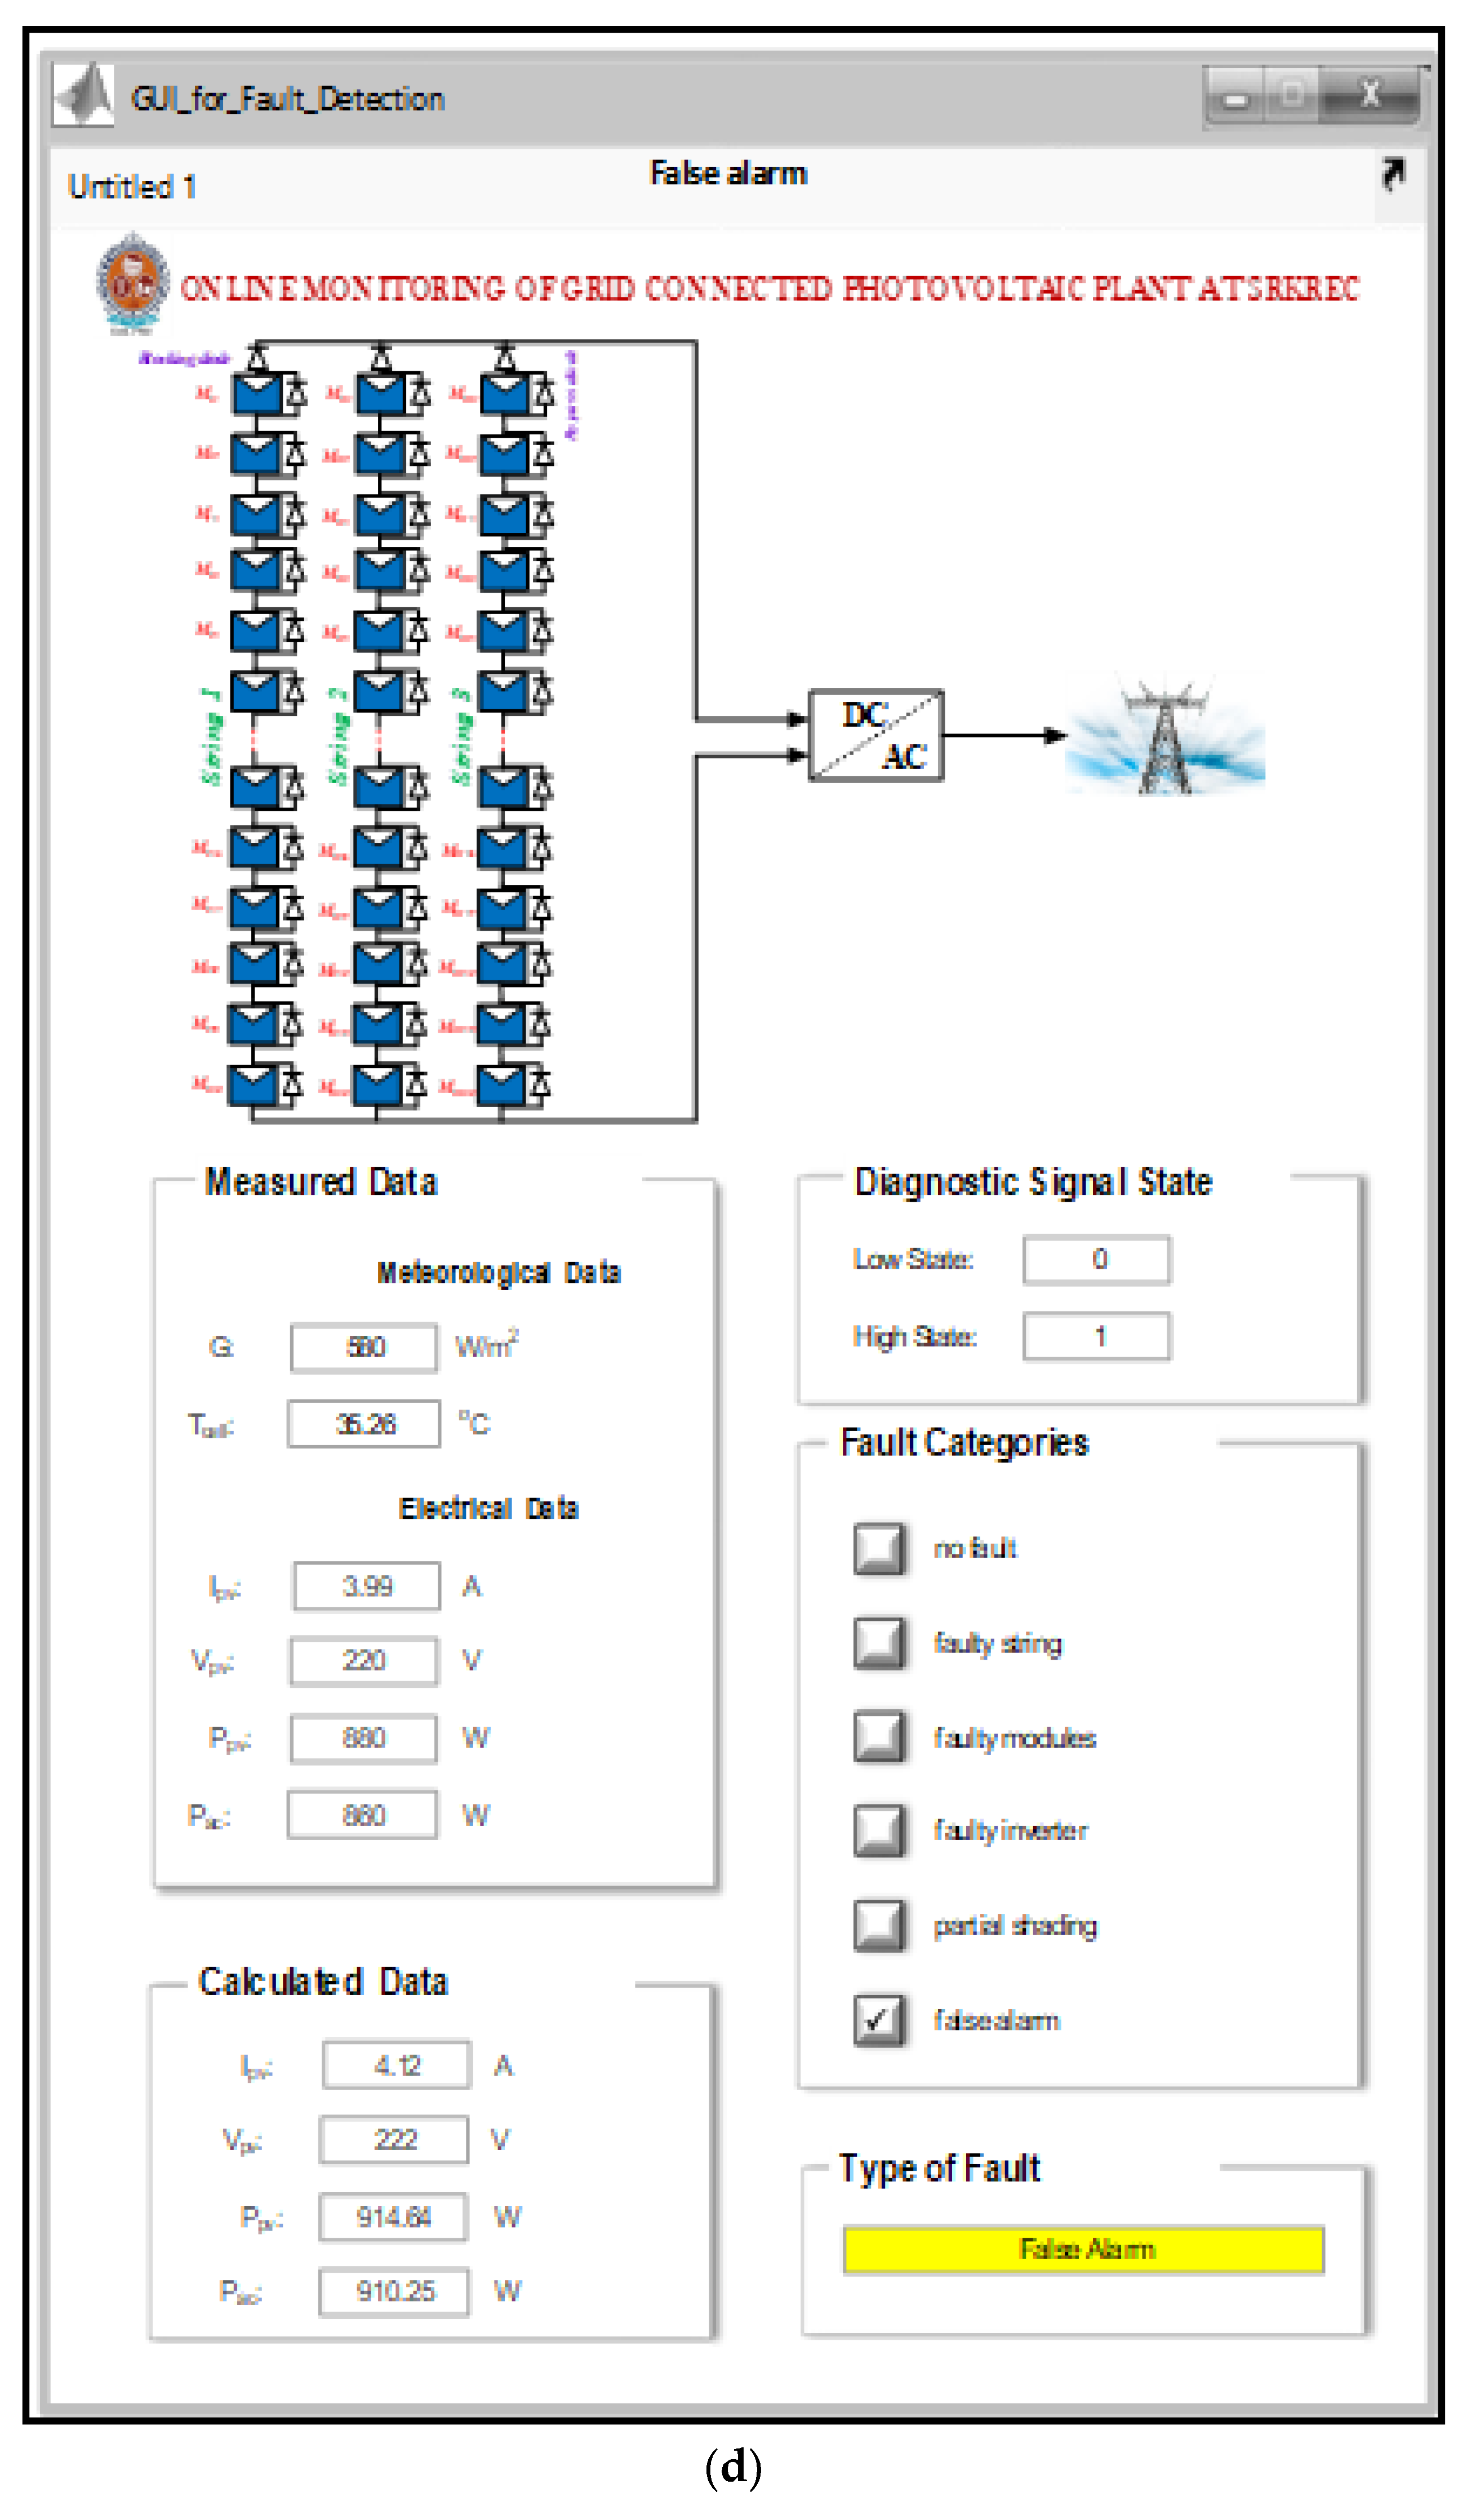
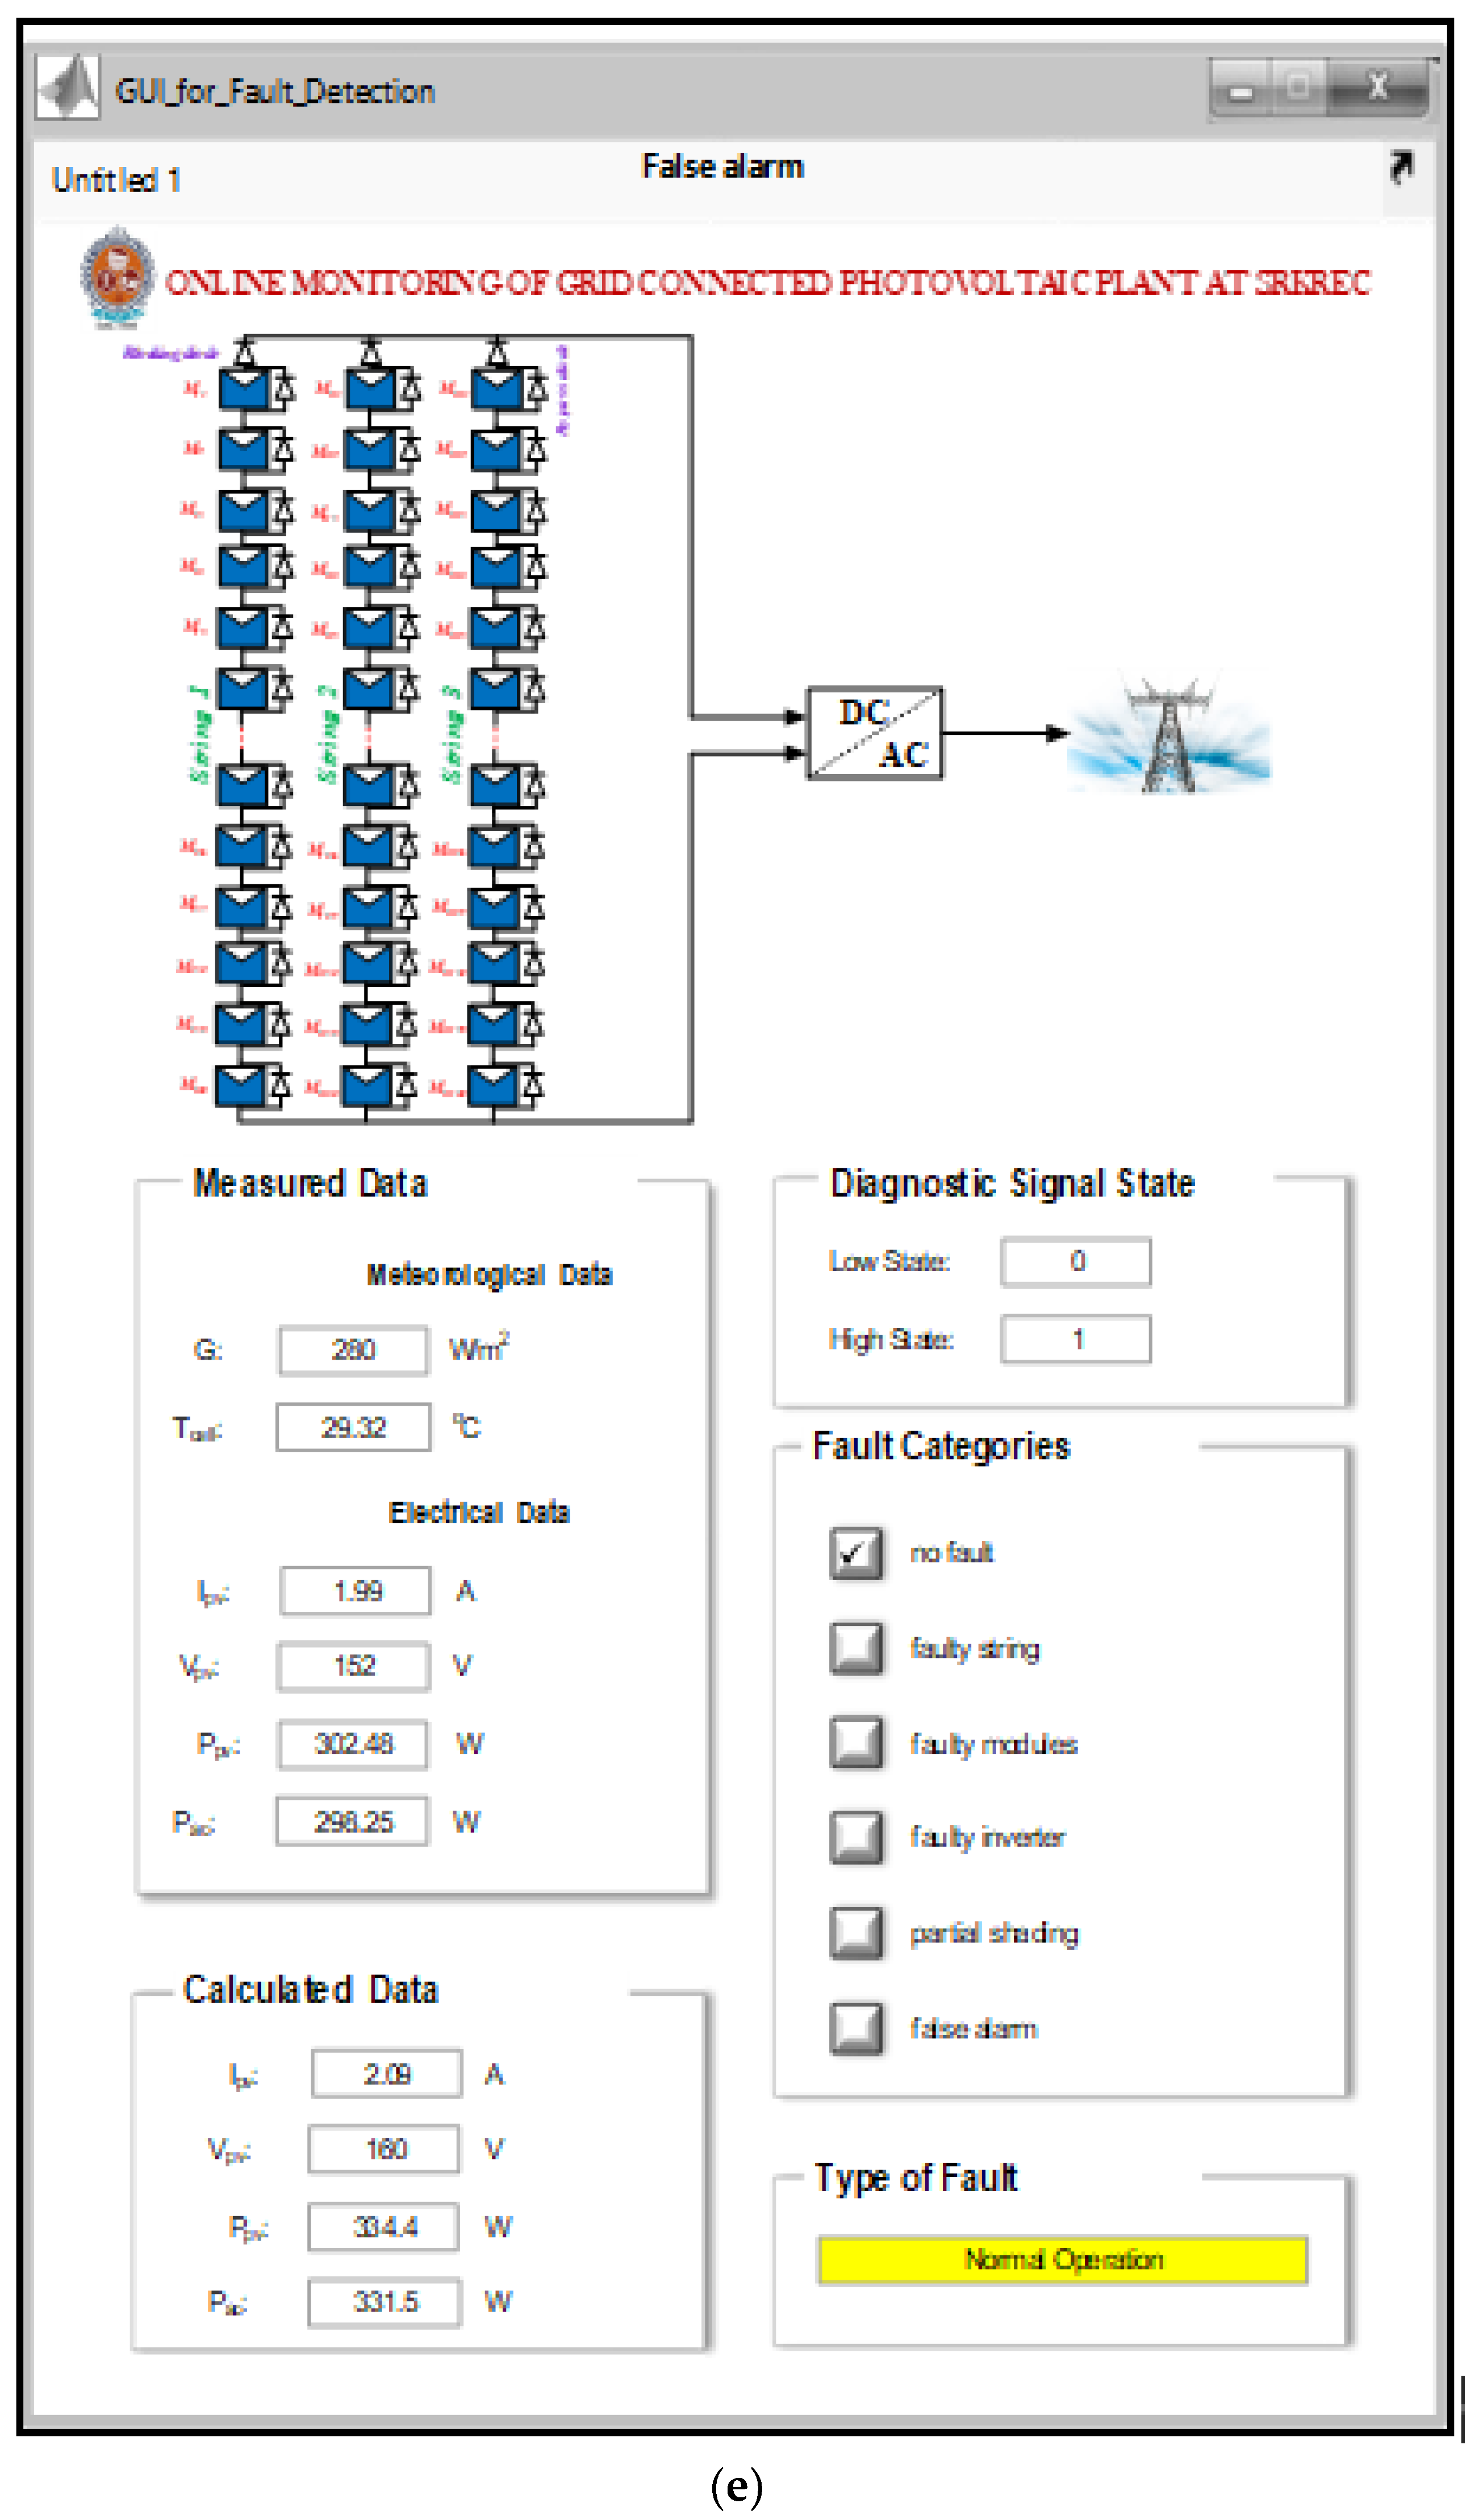
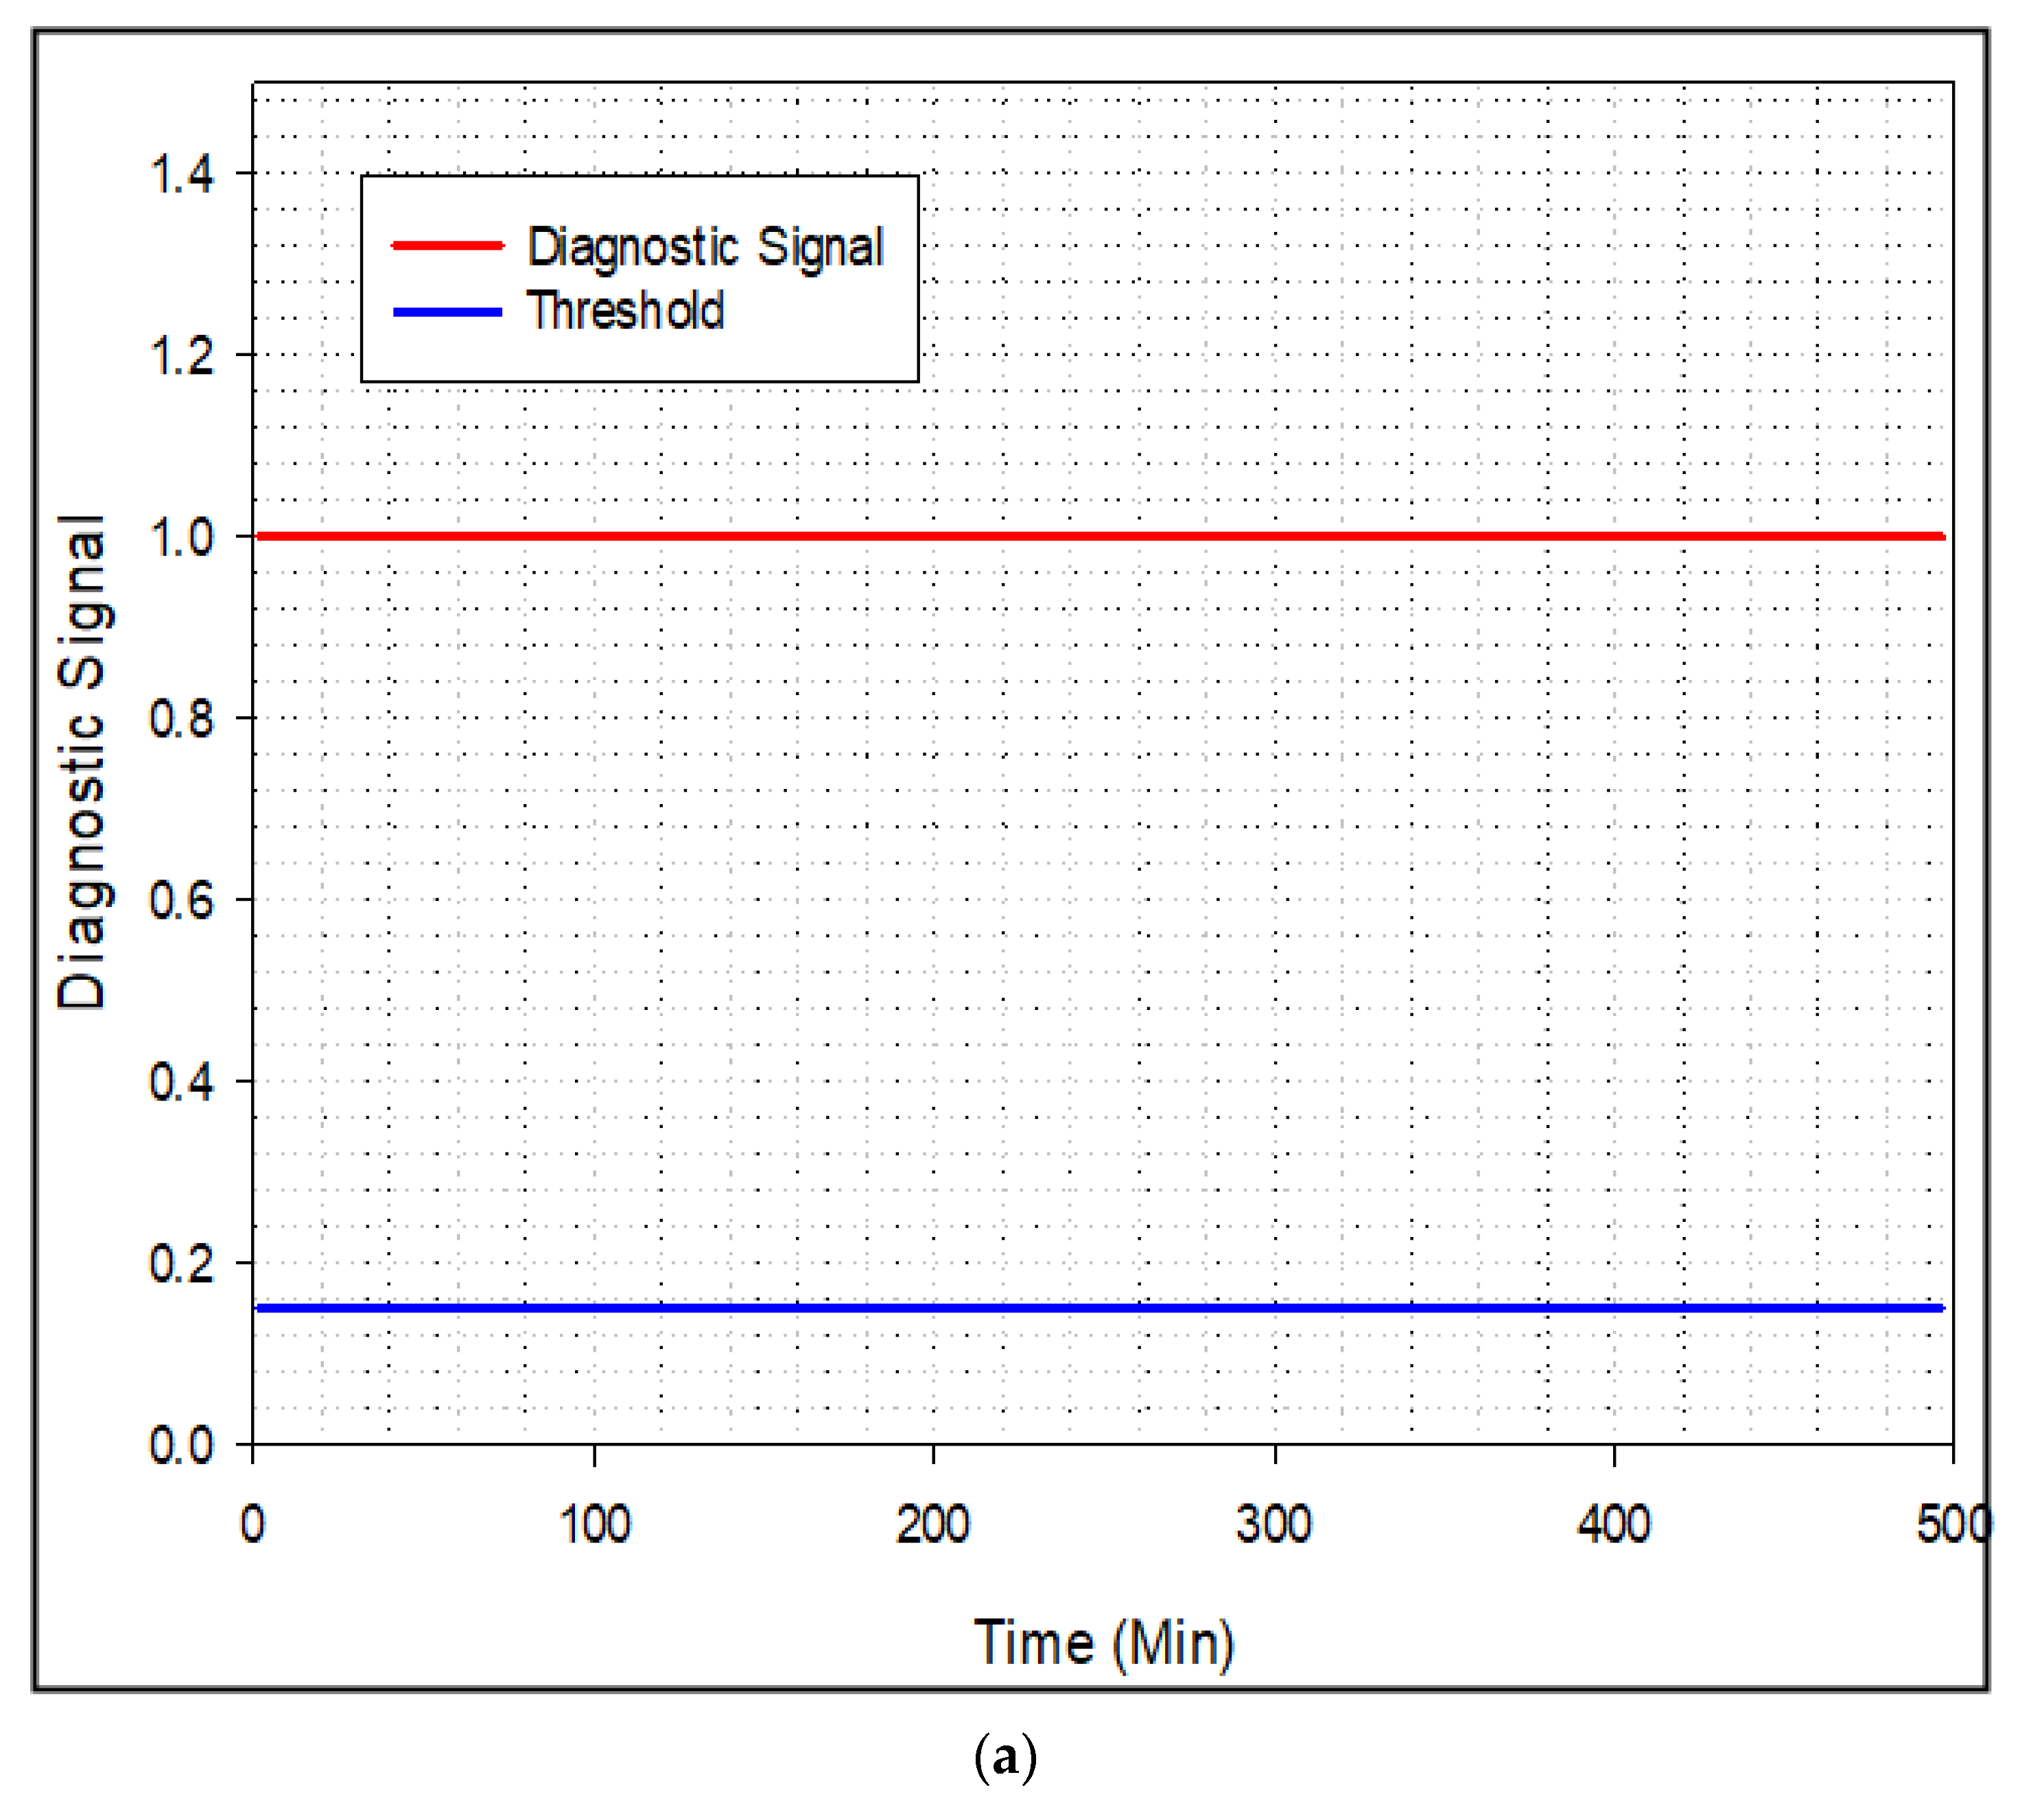
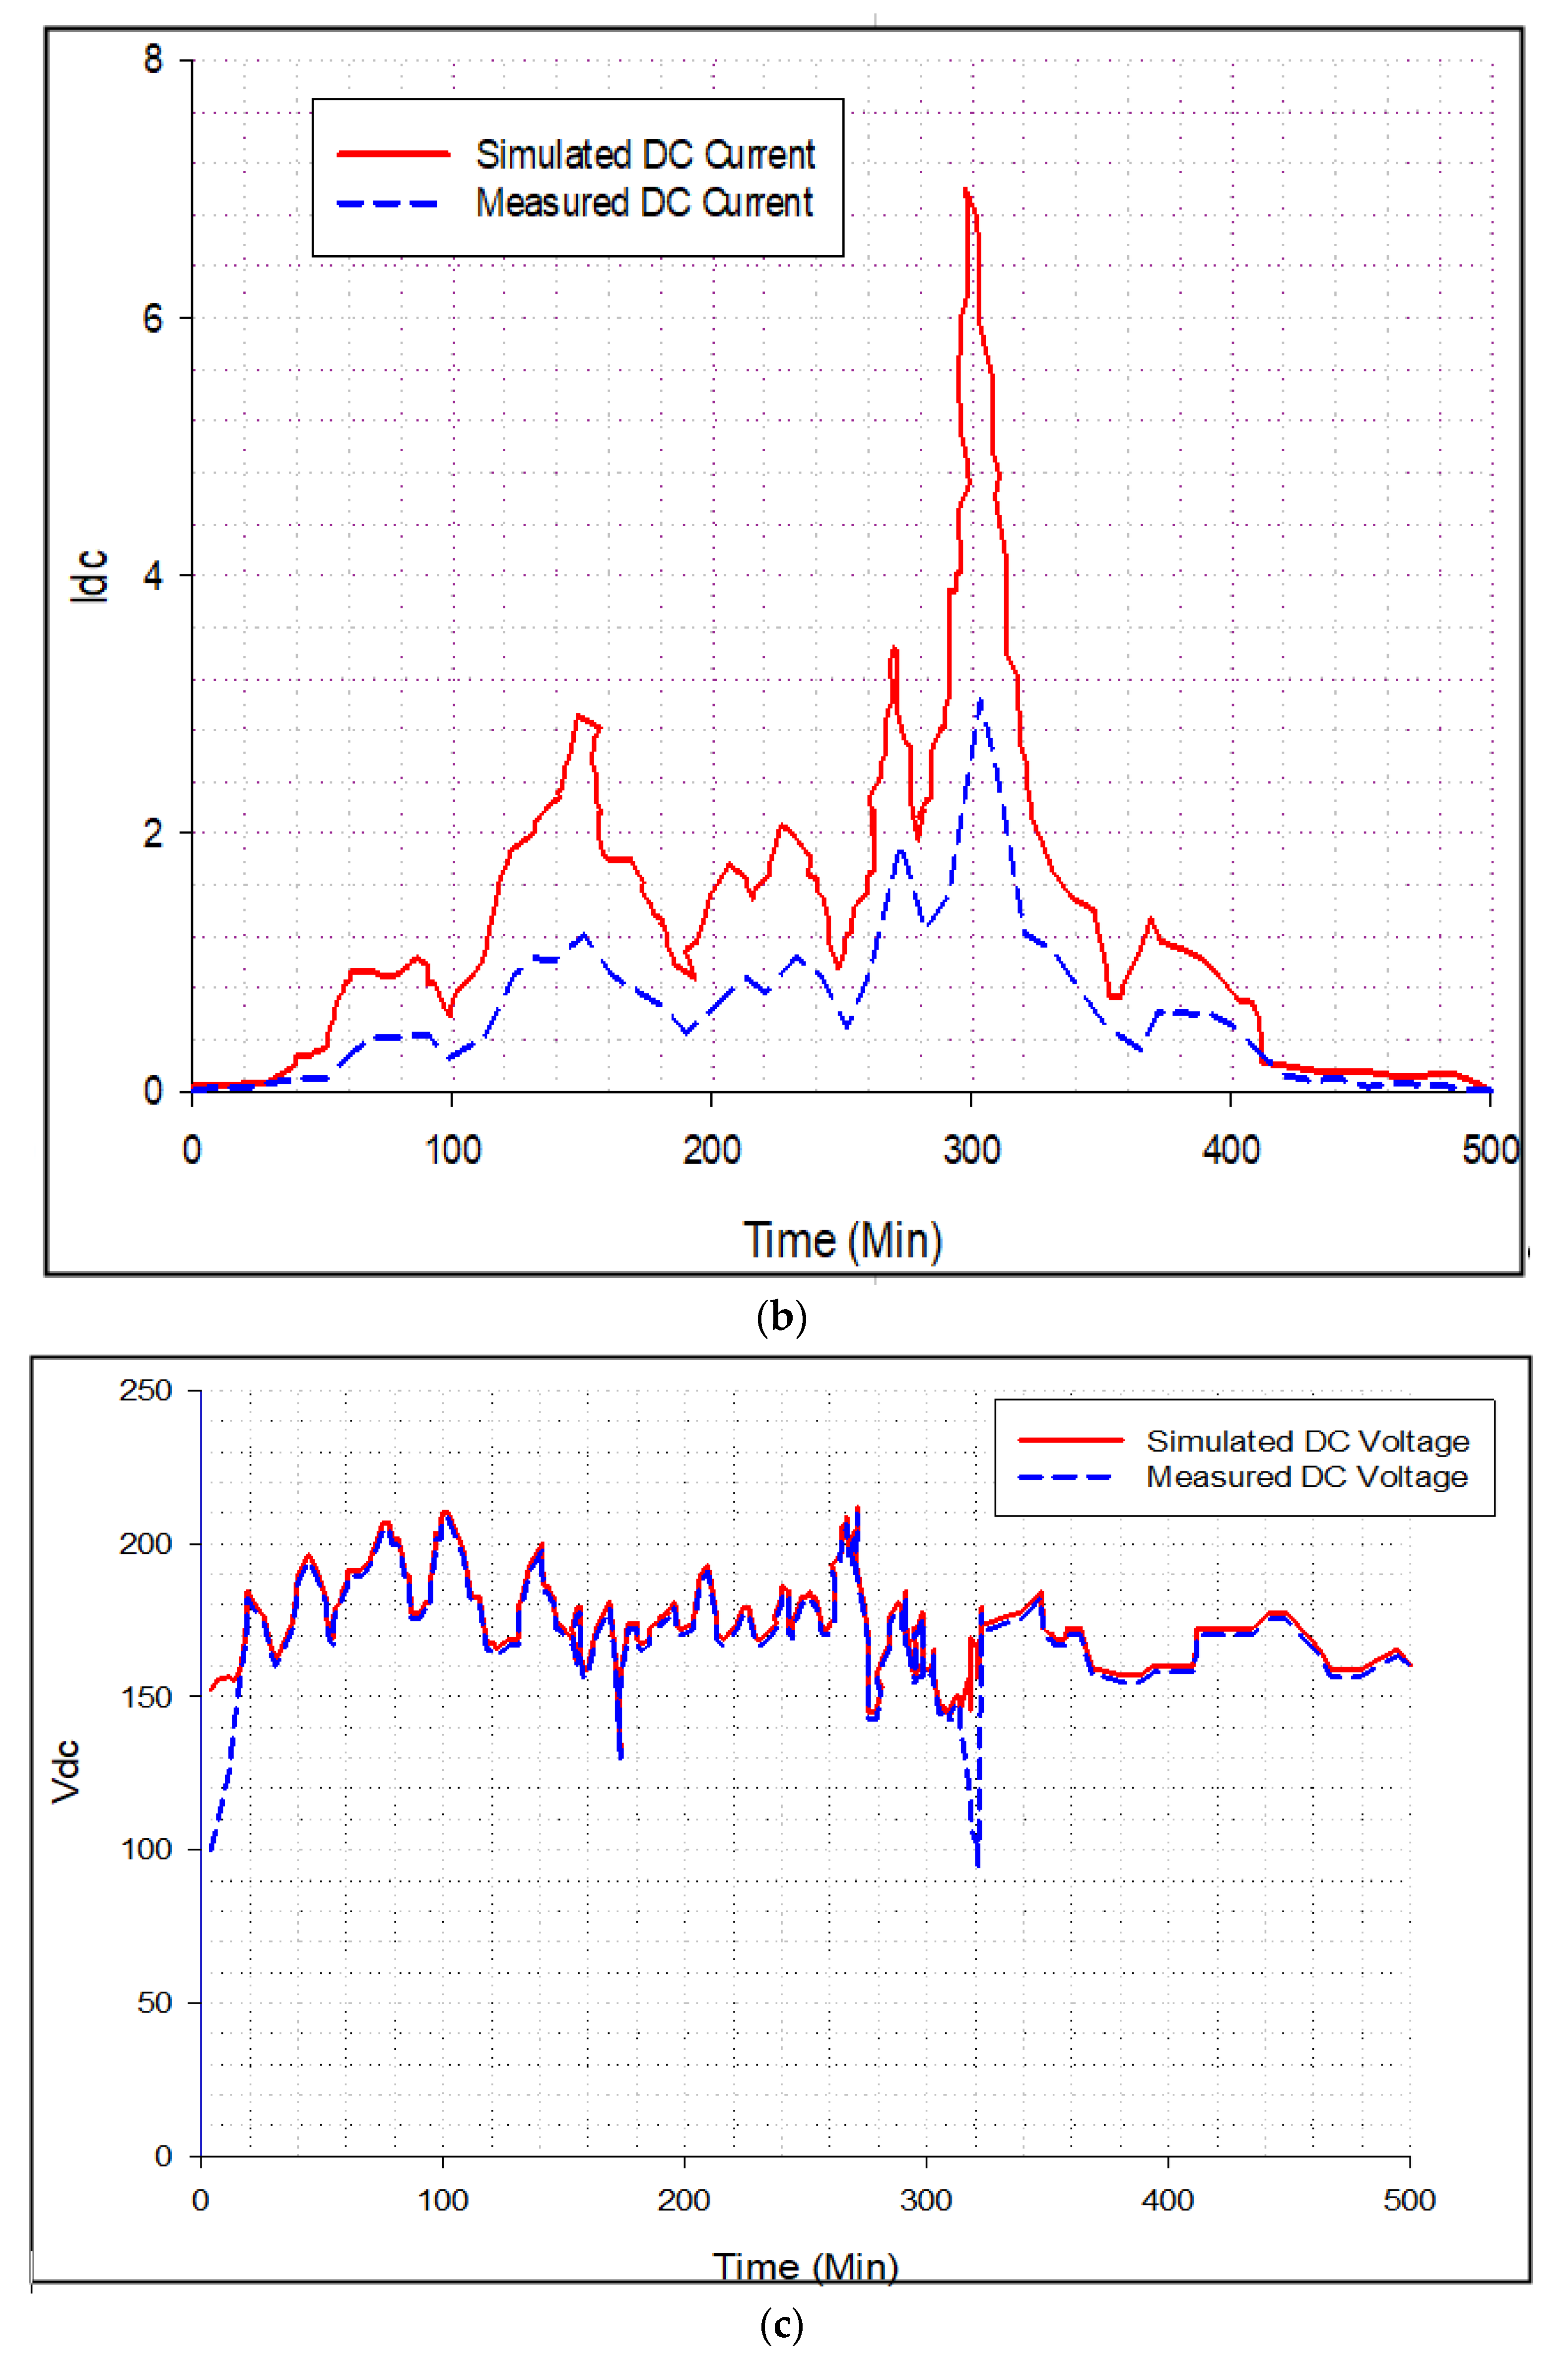
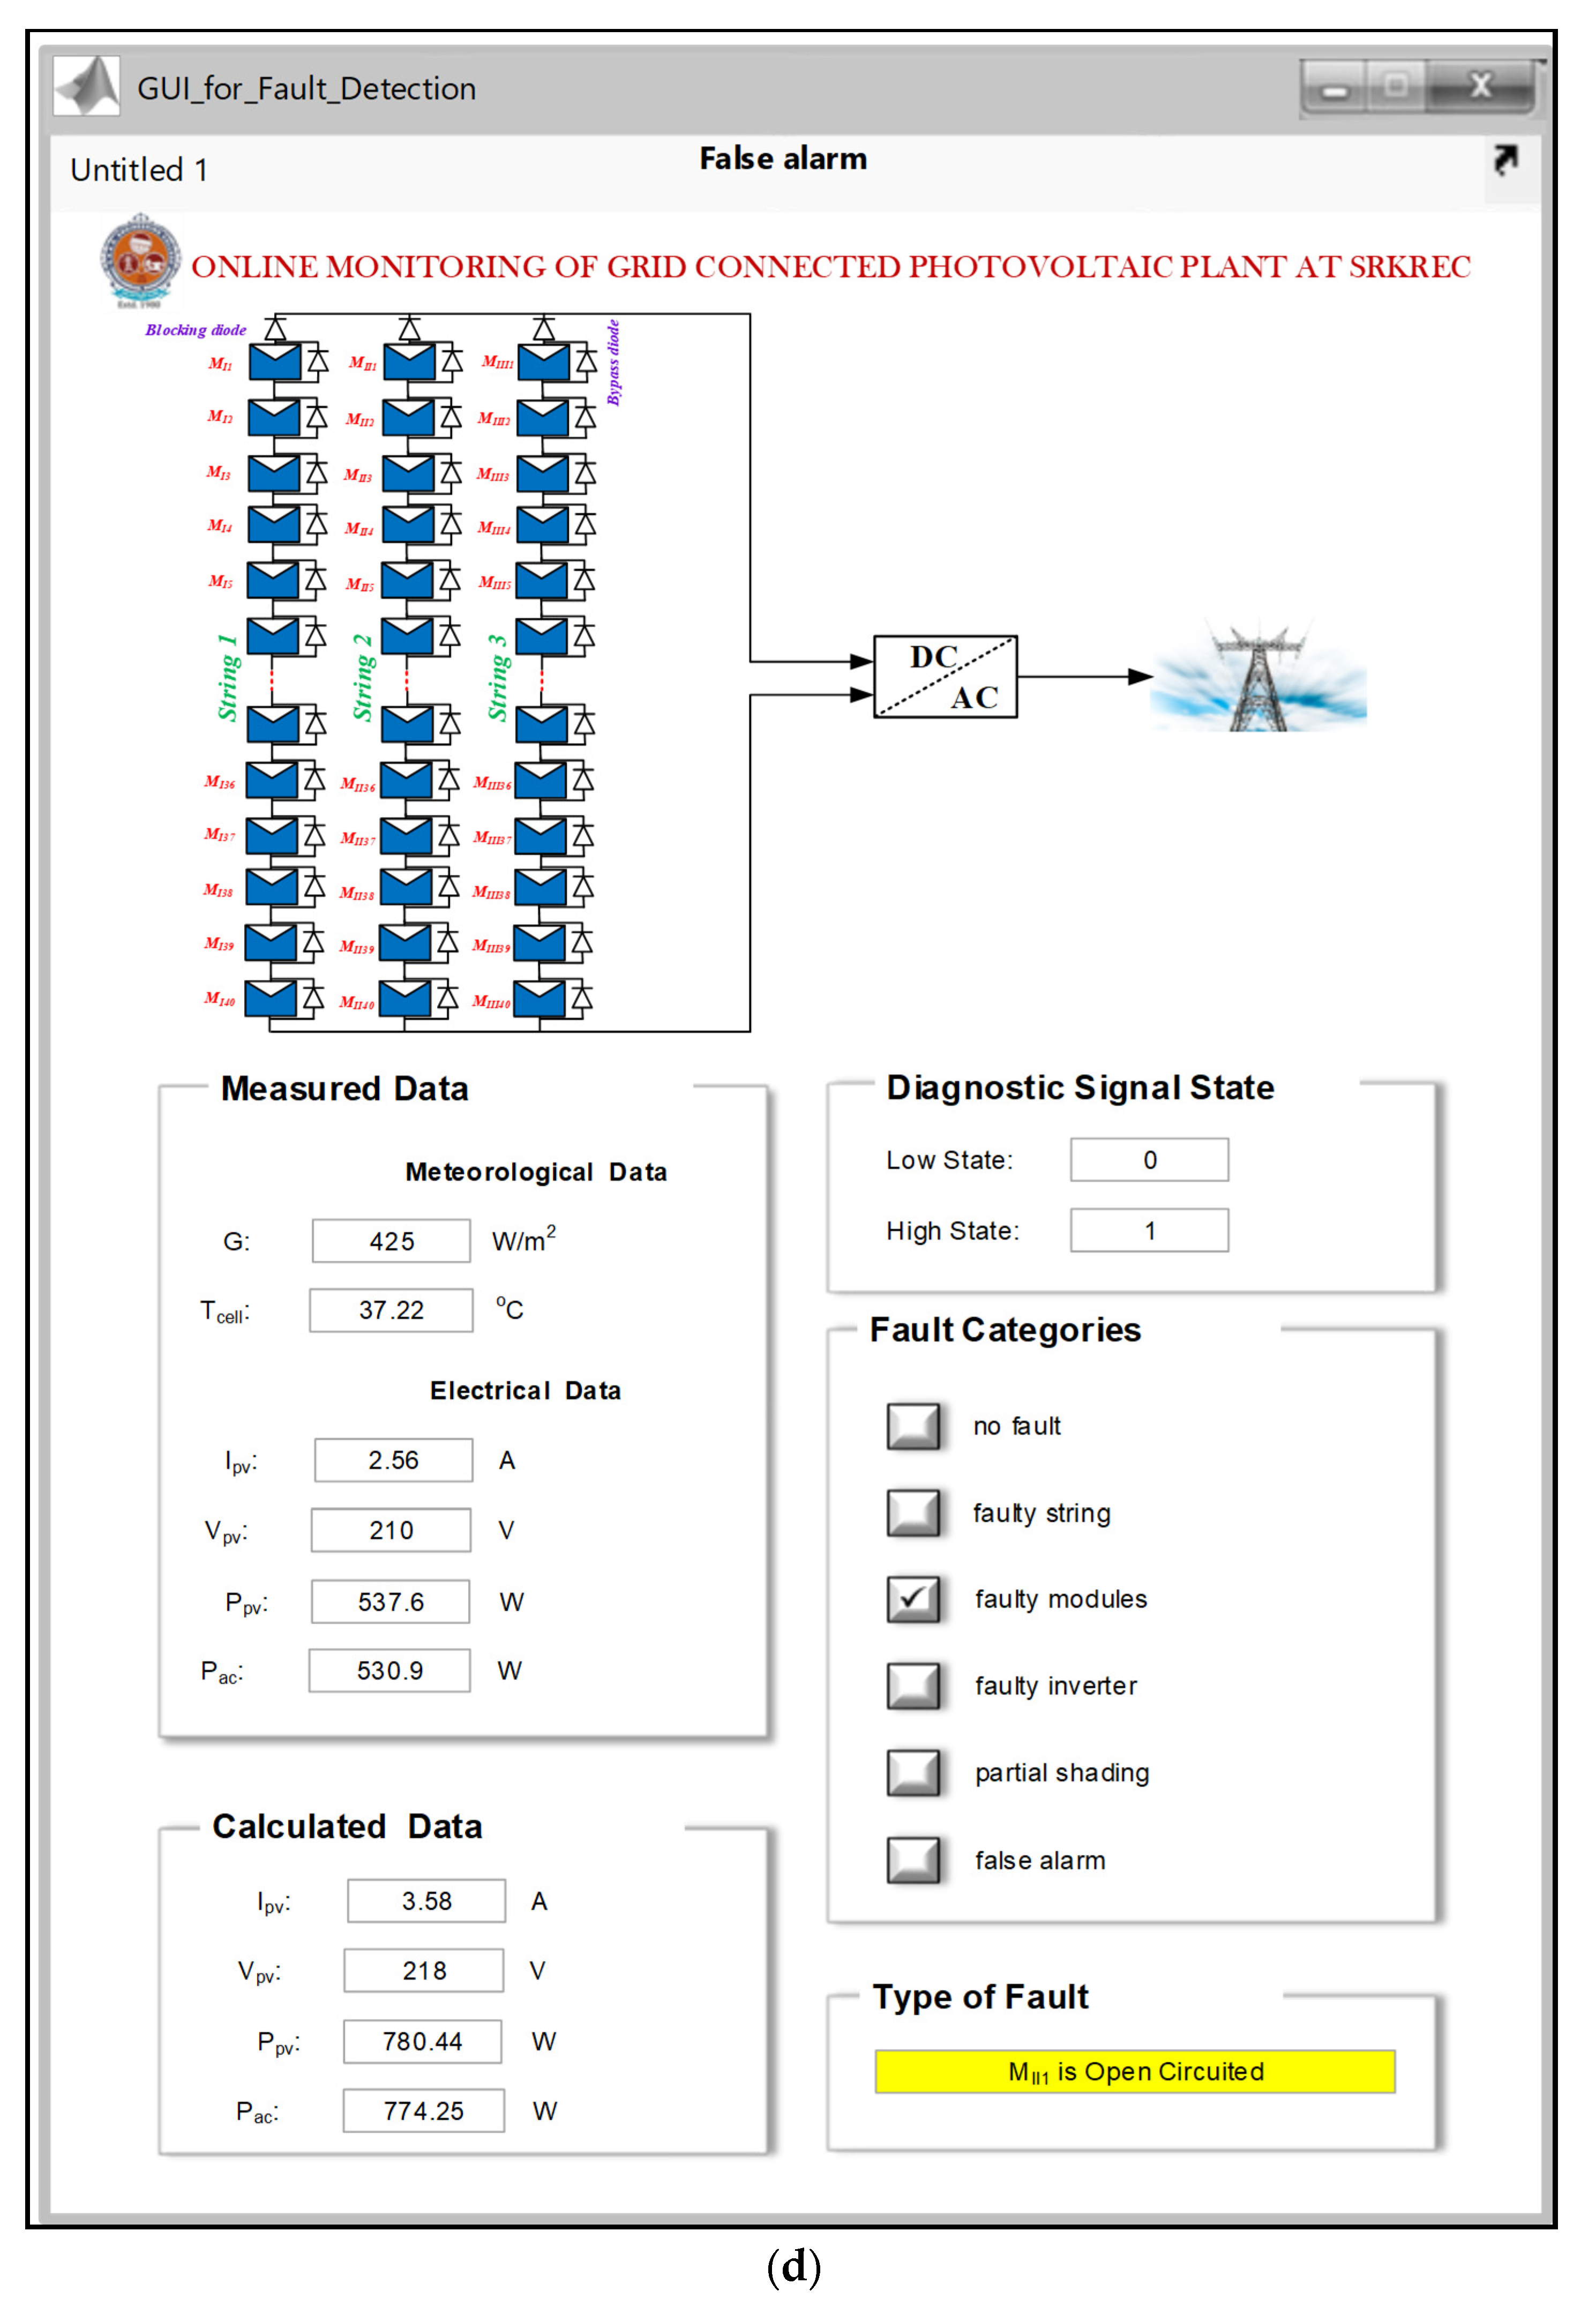
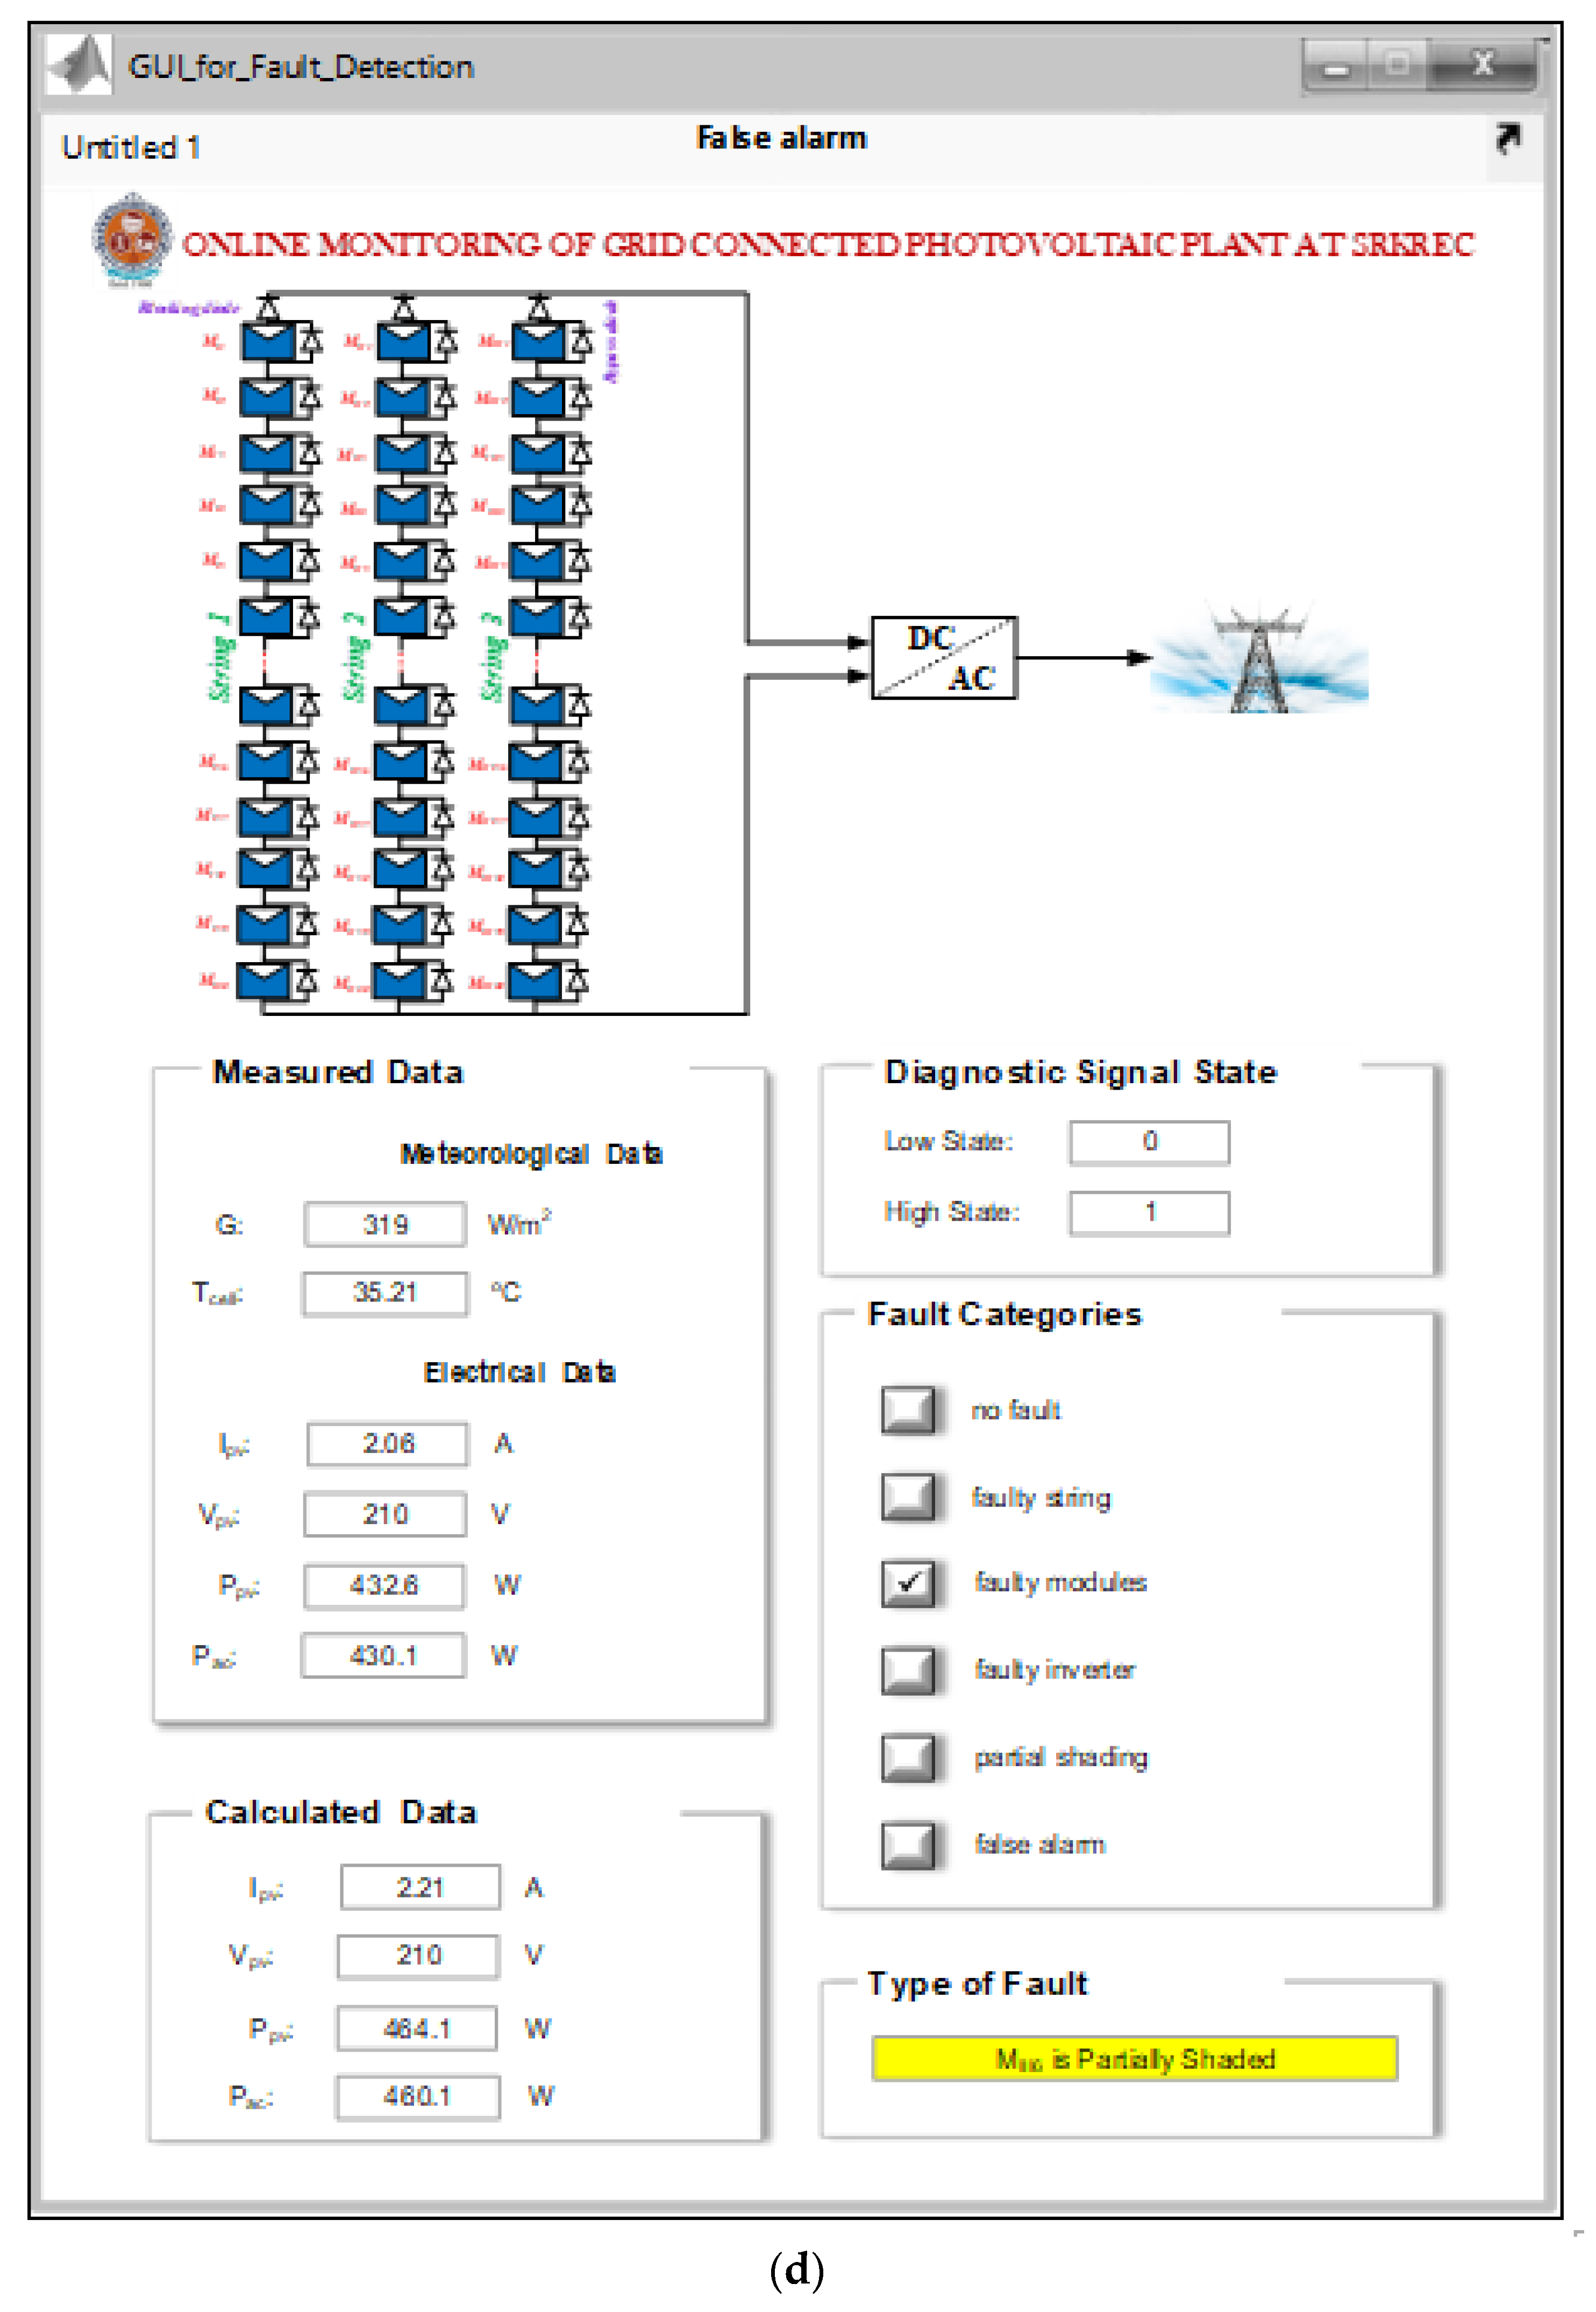
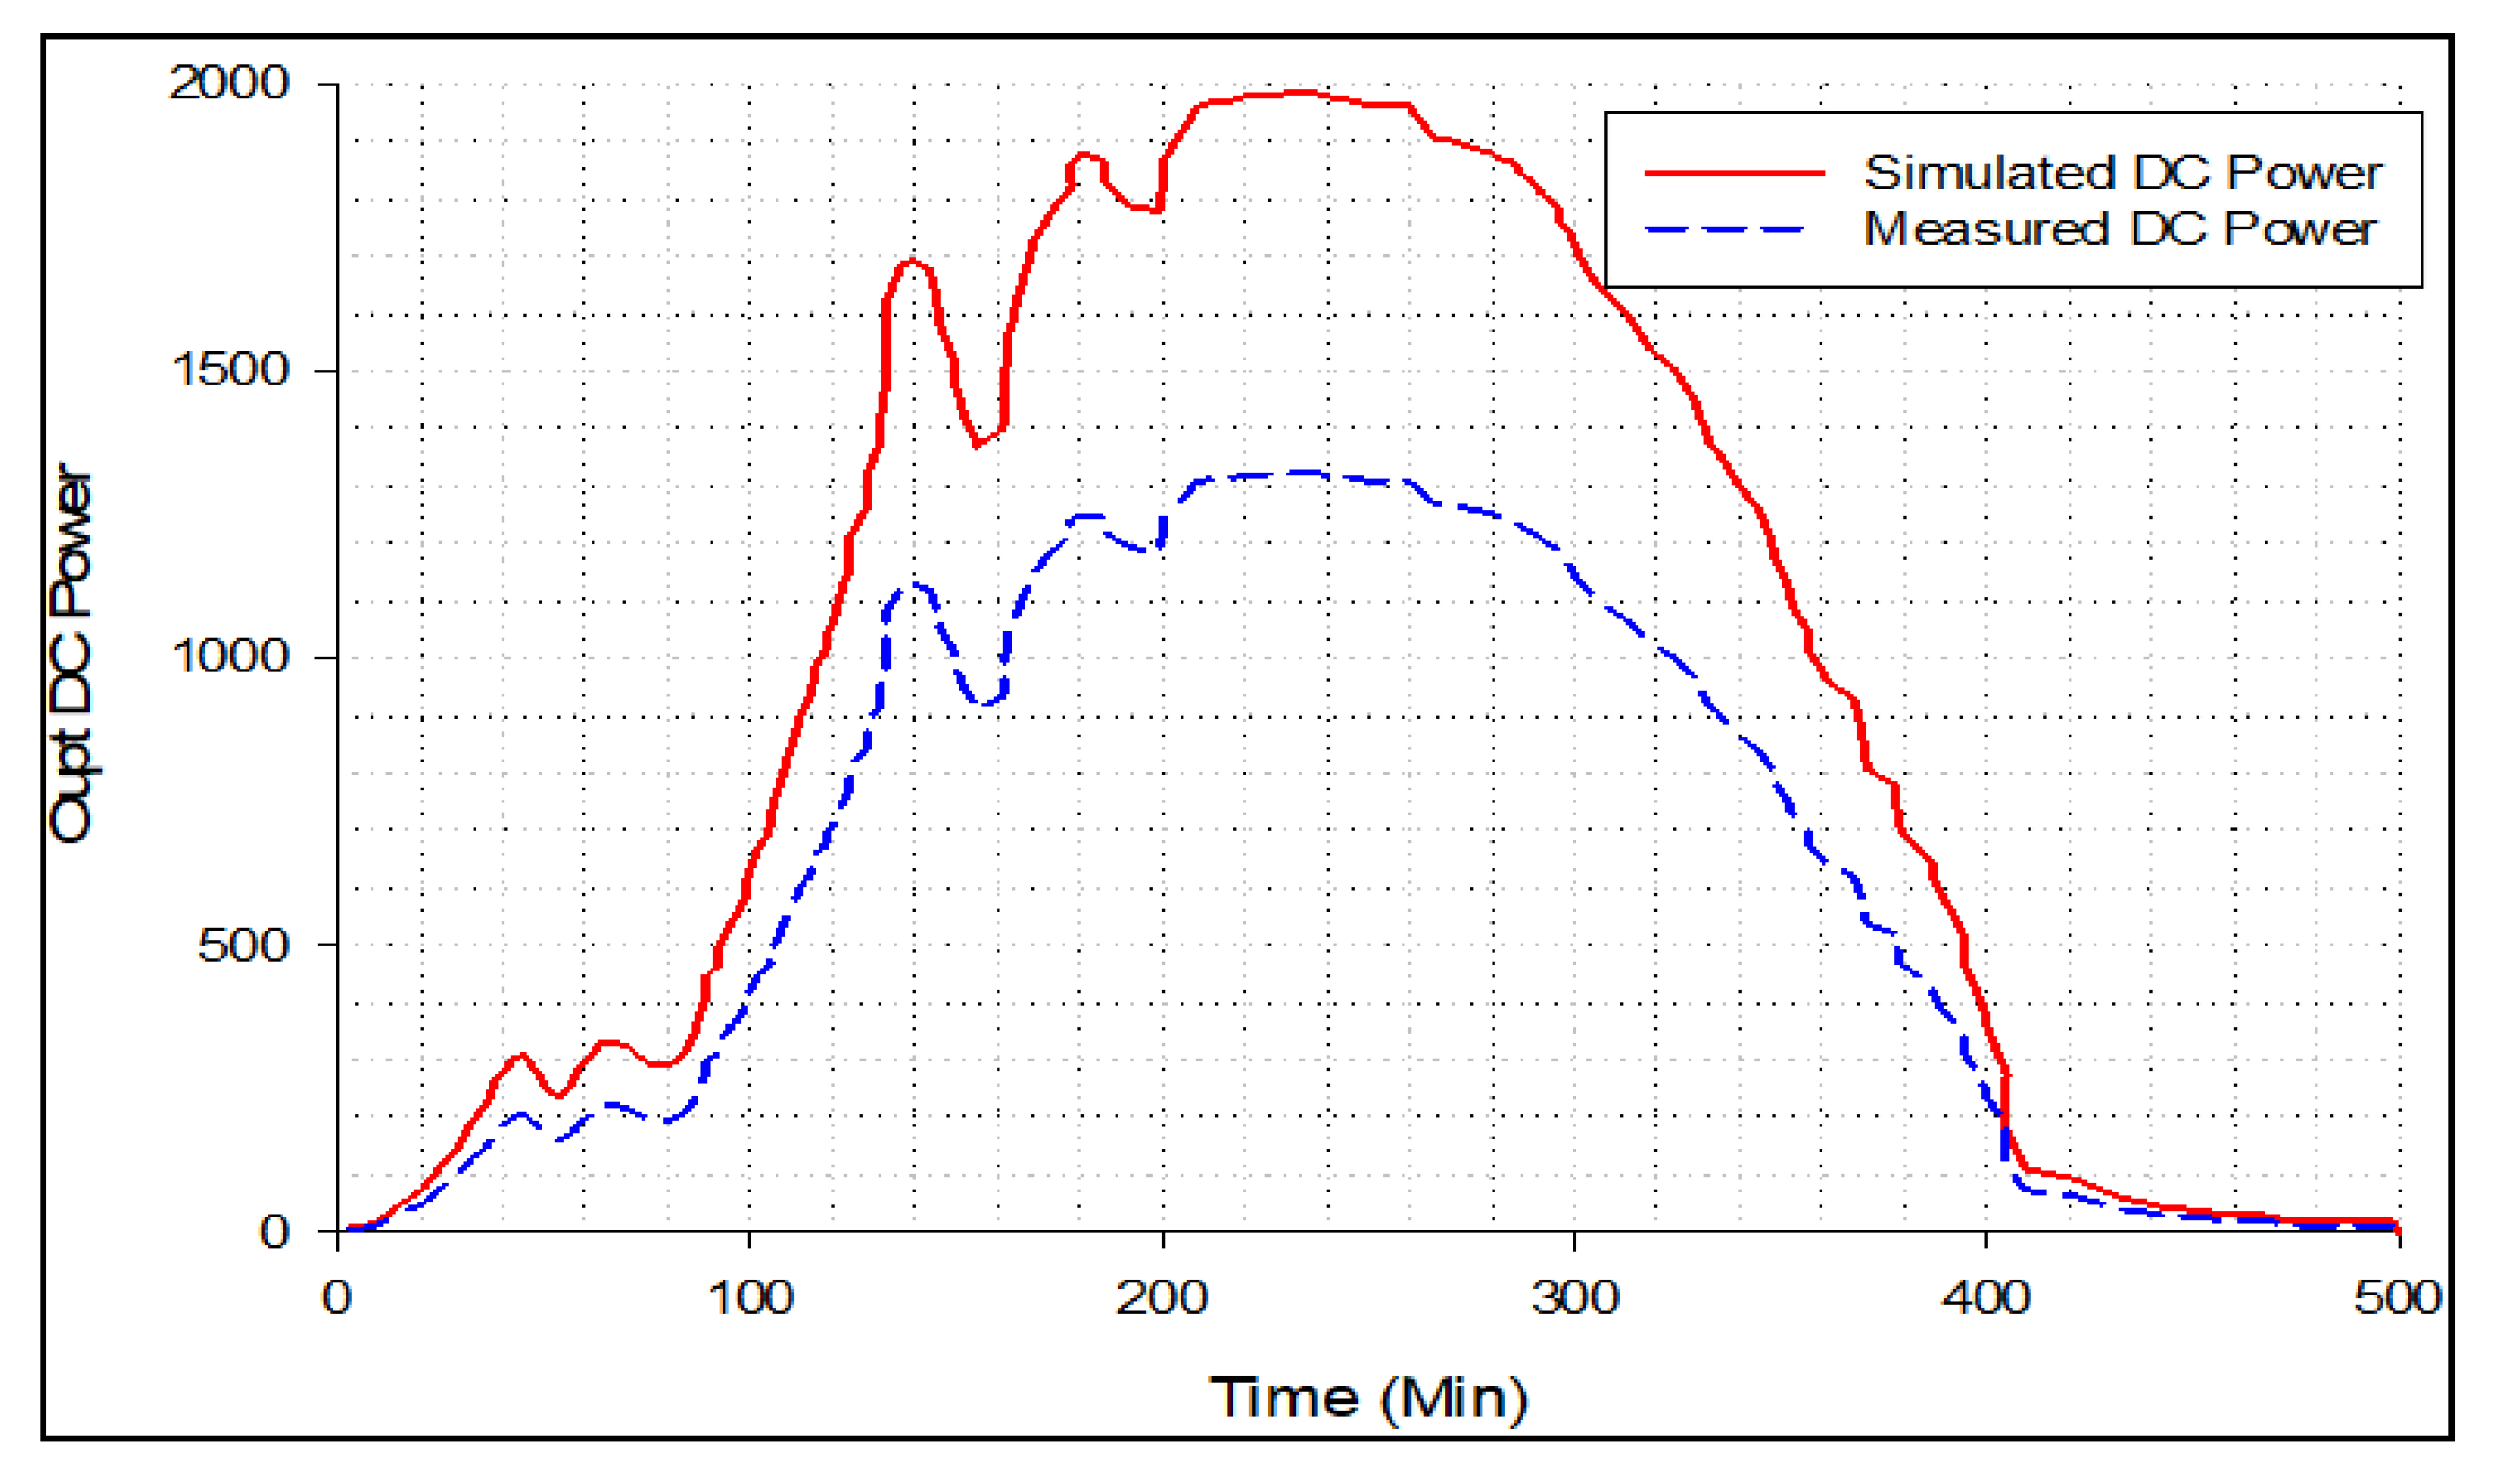
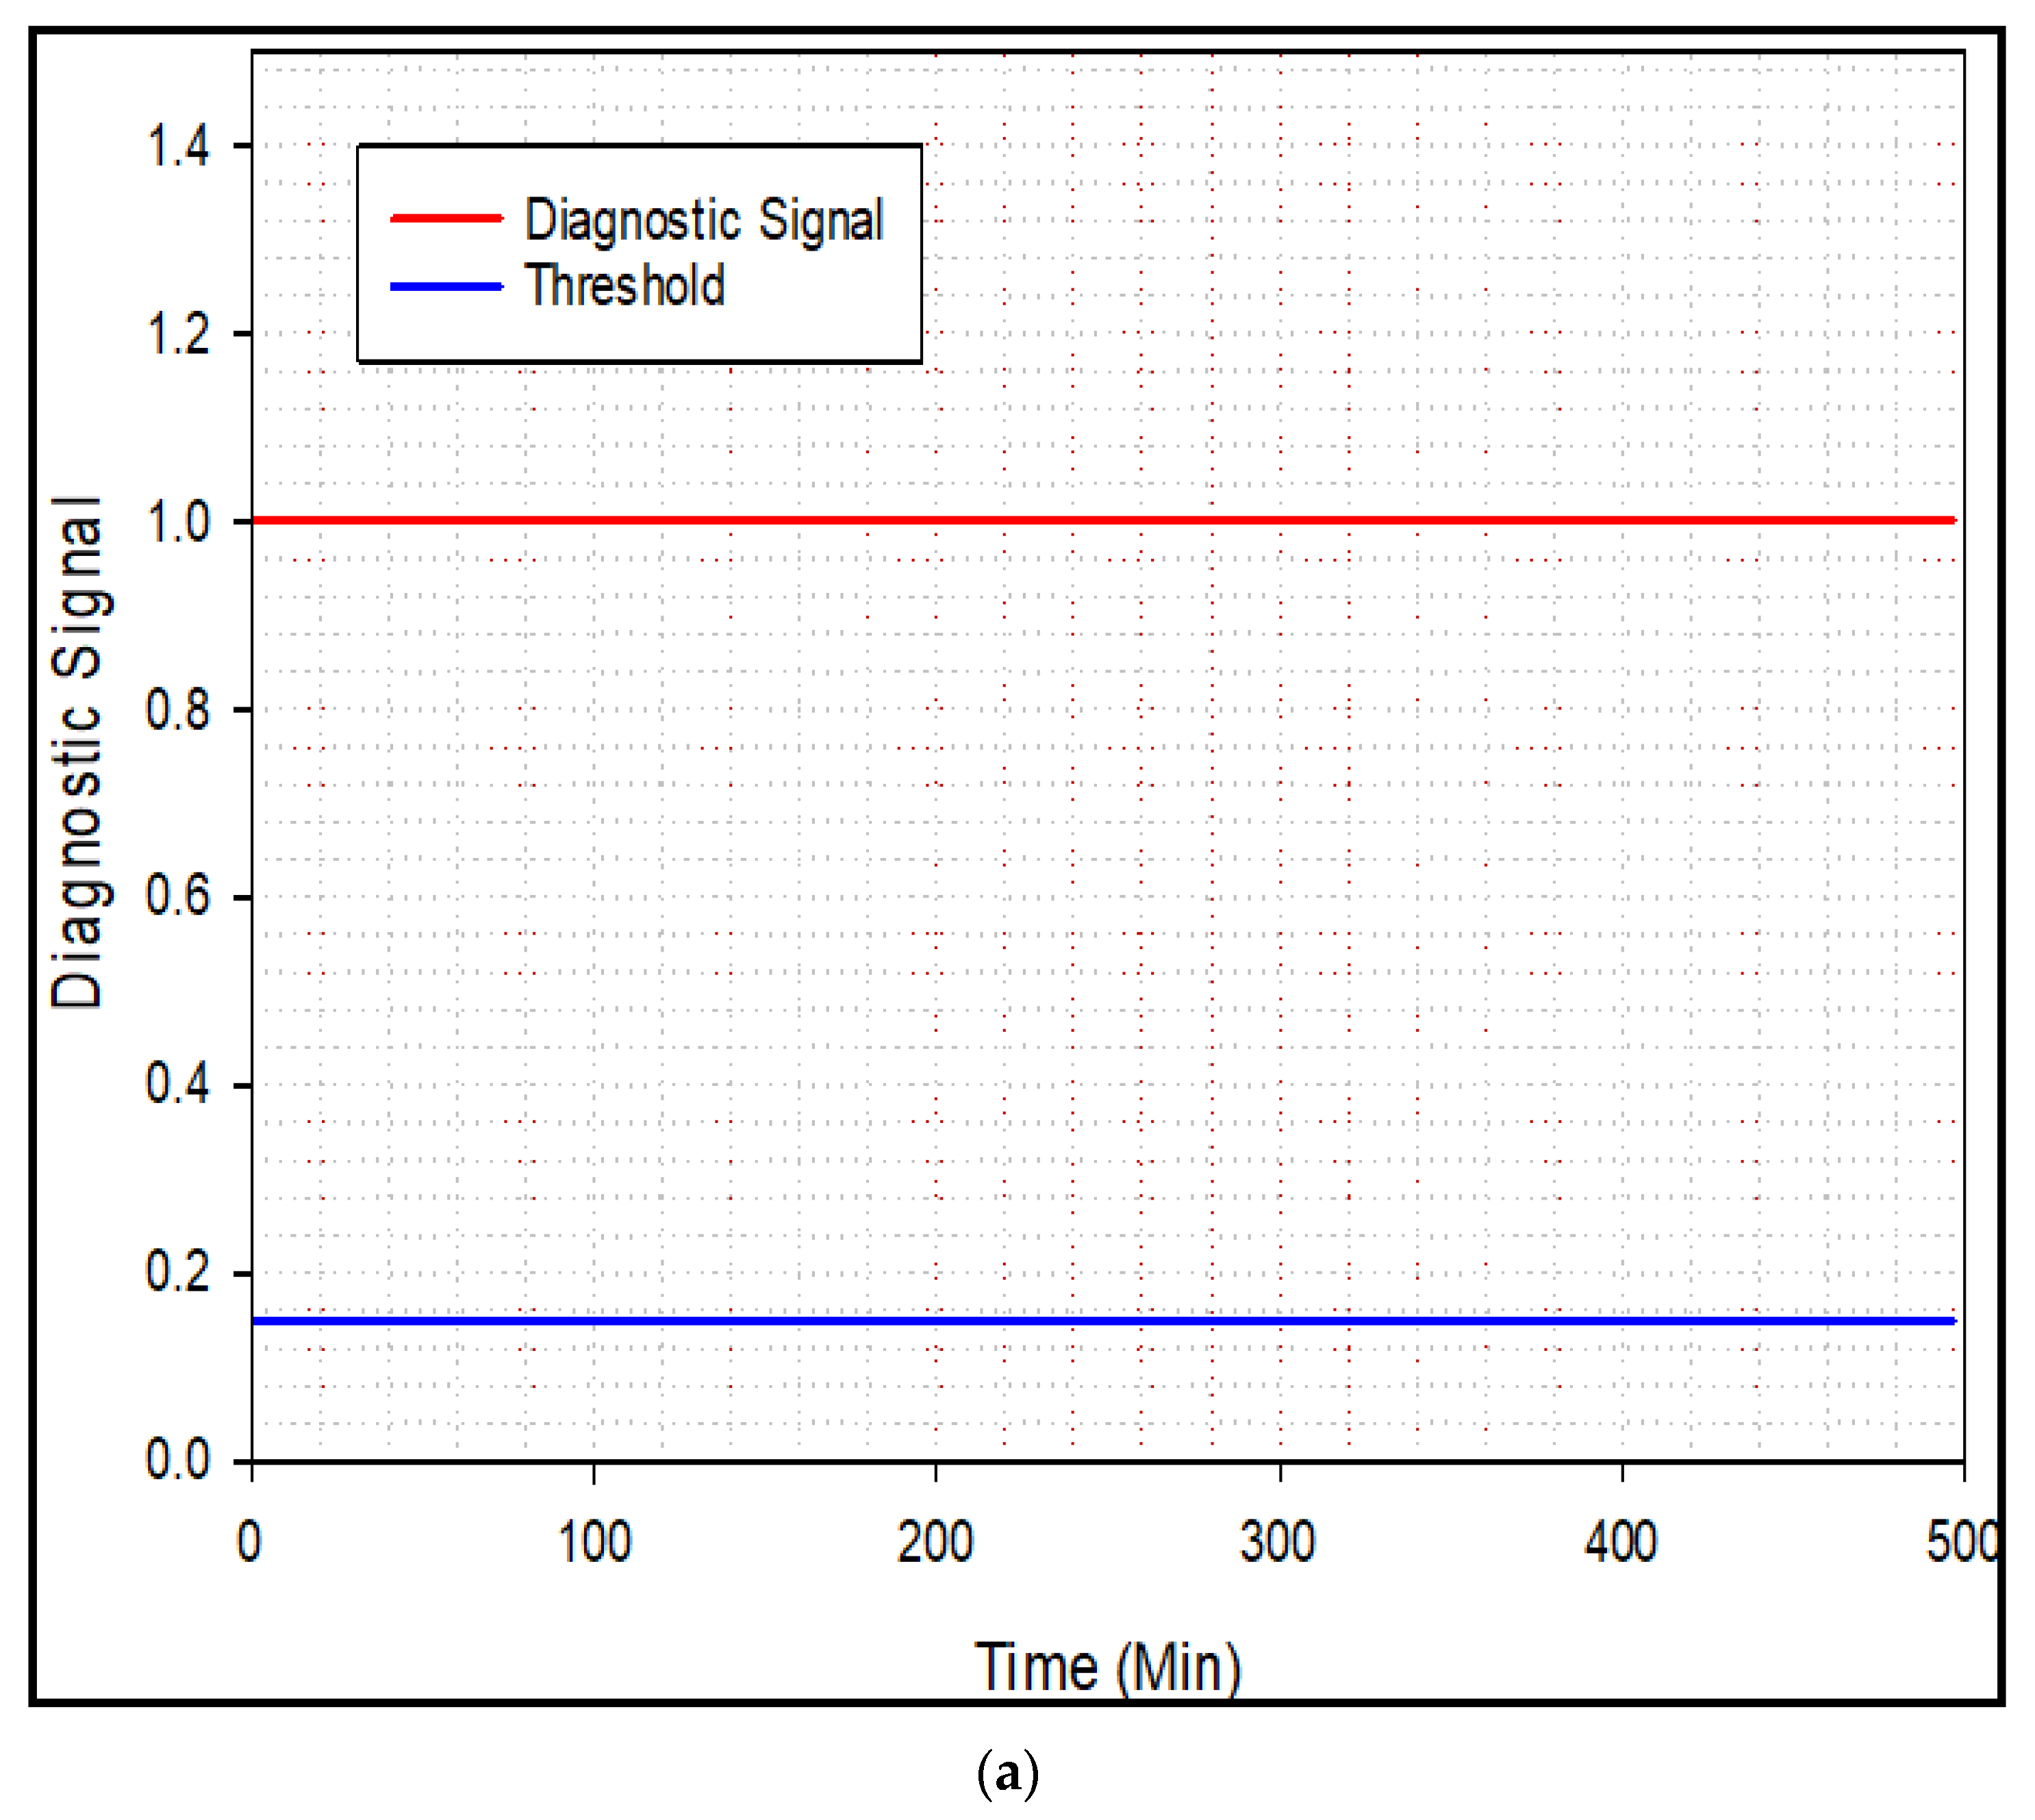
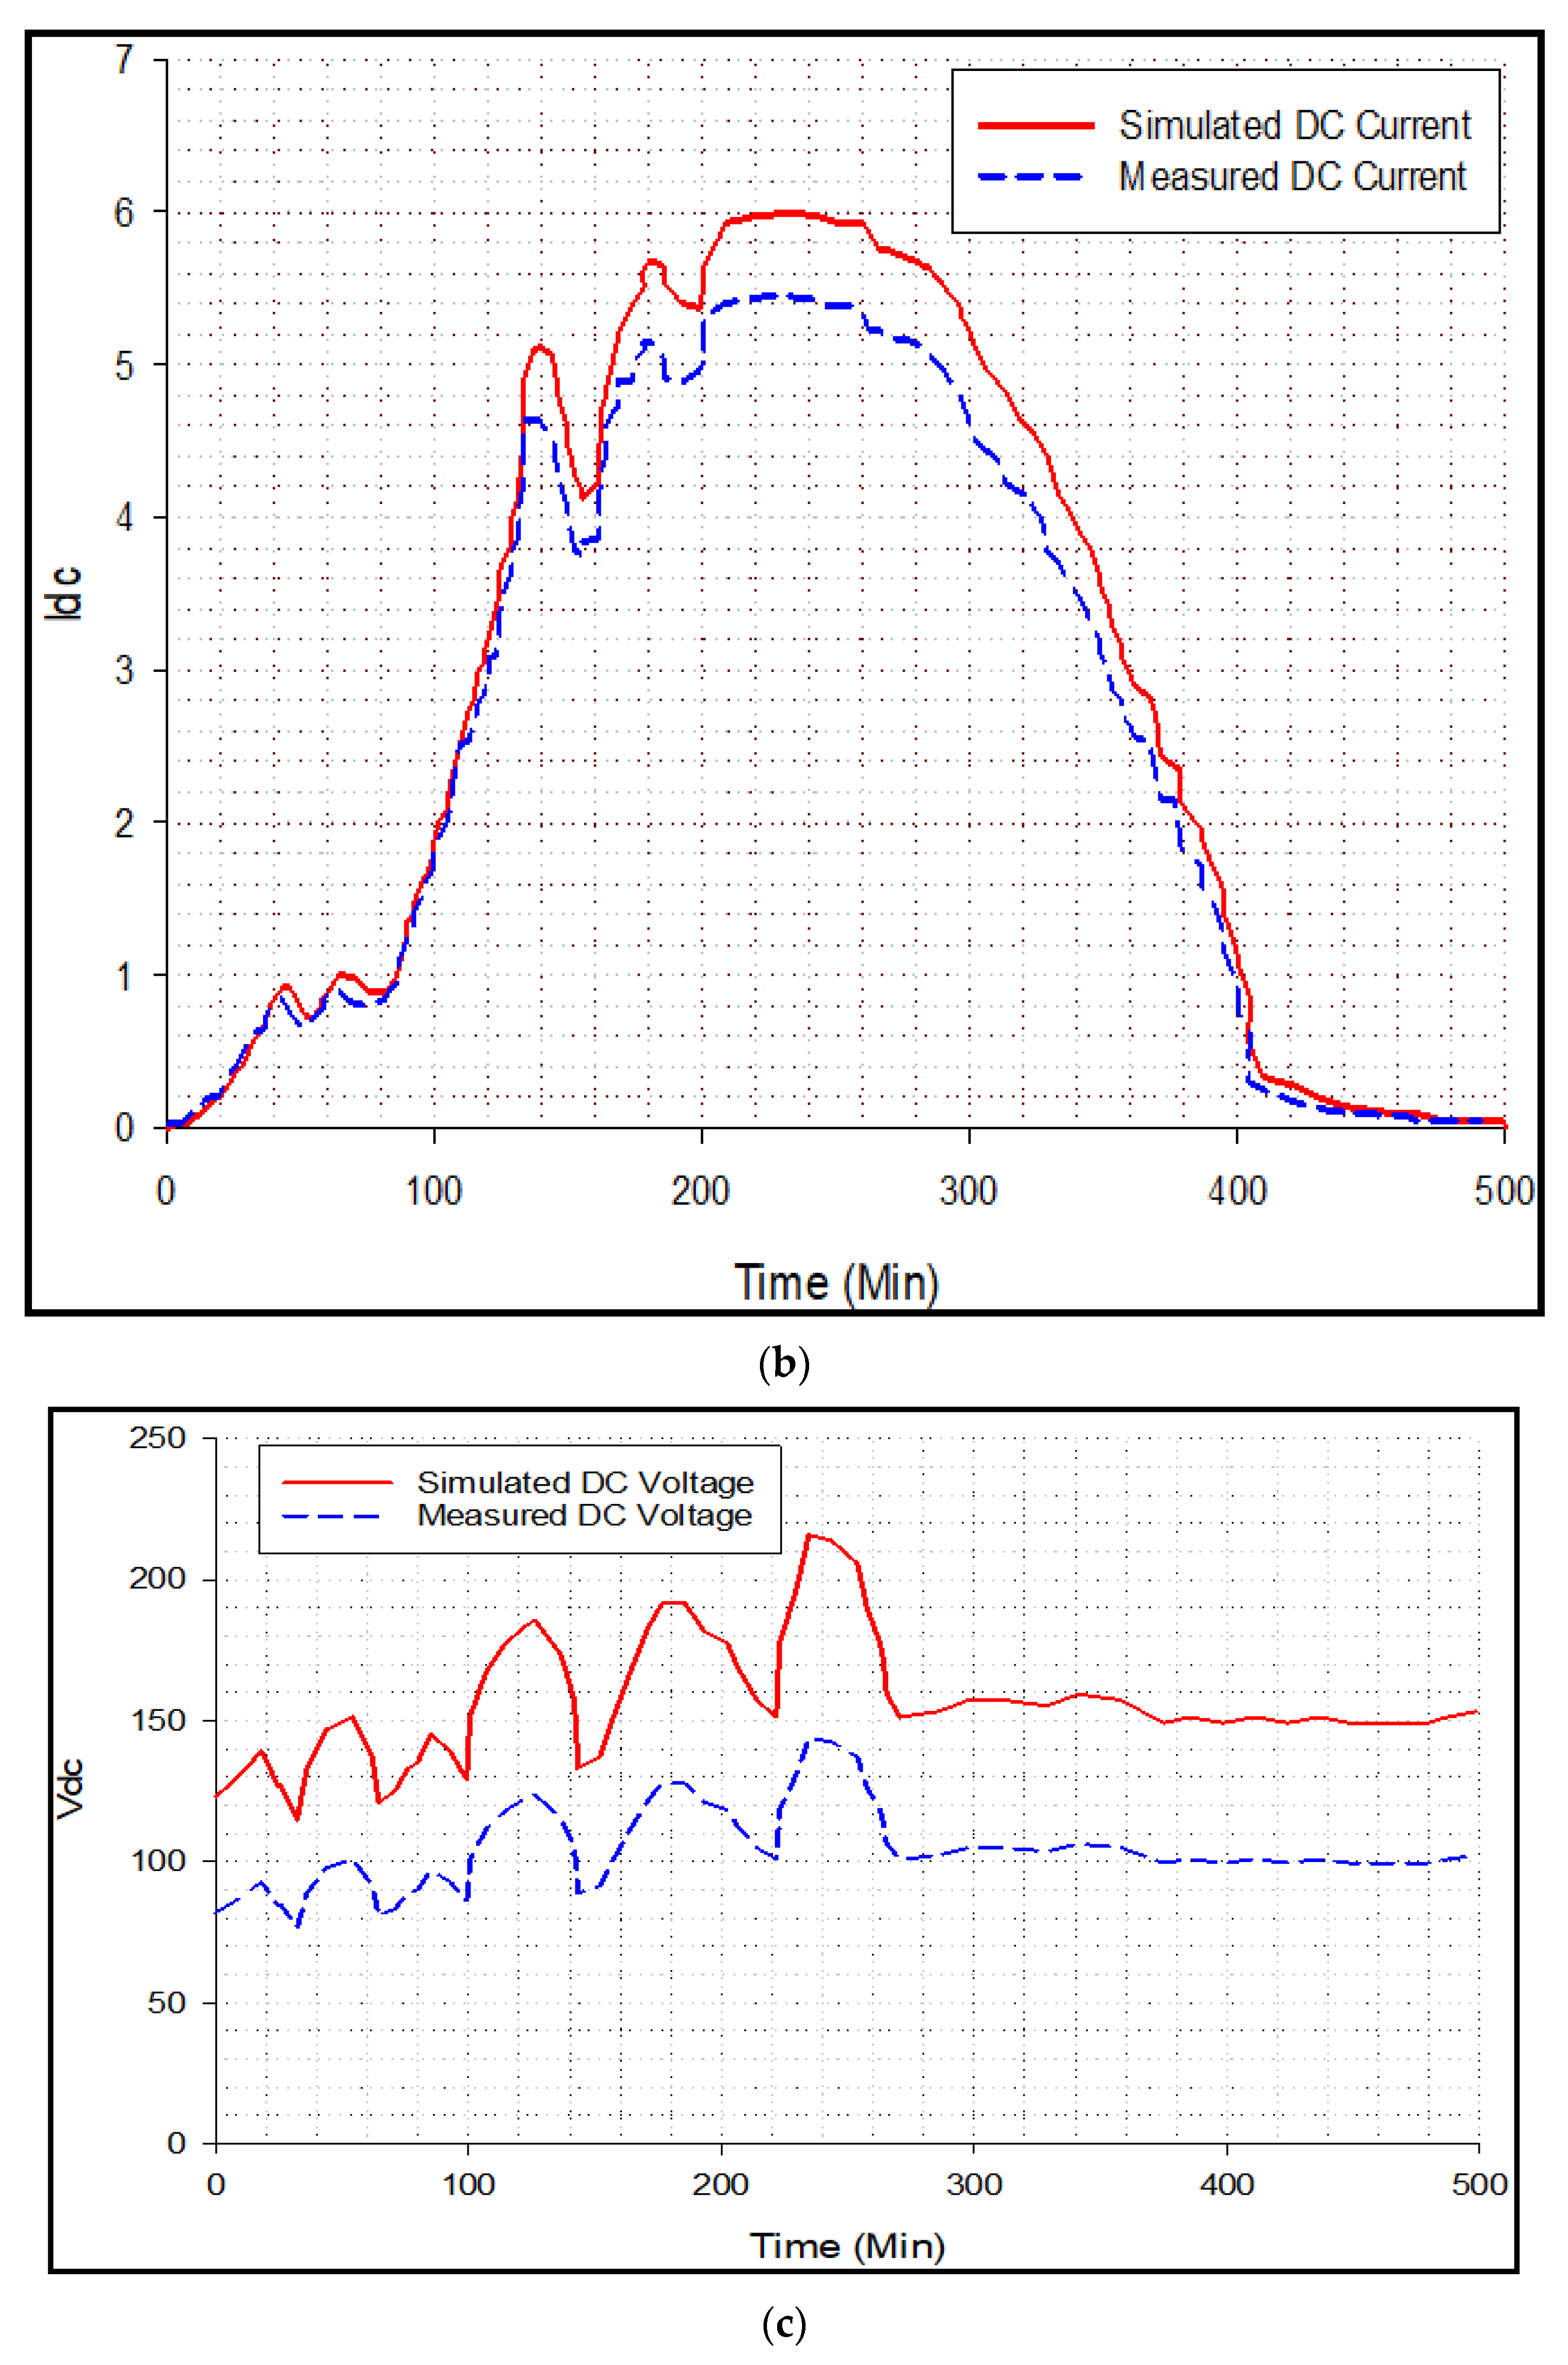
In Figure 6, it is evident that the simulated DC power values are nearly close to the measured ones. Figure 7a illustrates that Δ P D C is below the predetermined threshold. This study shows that the diagnostic signal from the fault detection system is low, meaning that no problems have been found in the GTPV plant (as depicted in Figure 7a), except for the one false alarm shown. More information regarding this fault may be seen in the developed tool shown in Figure 7d, where, even though the diagnostic signal is set to 1, the remaining important parameters such as current and voltage indicate that there is no fault present in the system, as shown in Figure 7b,c, respectively. In the absence of fault, the diagnostic signal is set to 0, and the information of other parameters shown in the tool is coherent, according to the developed tool presented in Figure 7e.

5.2. Case 2: Faulty Modules (Open-Circuit)

To evaluate the effectiveness of the proposed fault diagnosis procedure in identifying the presence of faulty modules, one module in one string has been disconnected from the system. As a result, the string’s voltage drops to an erroneous level, which affects the DC power. In this instance, the diagnostic results are as follows:
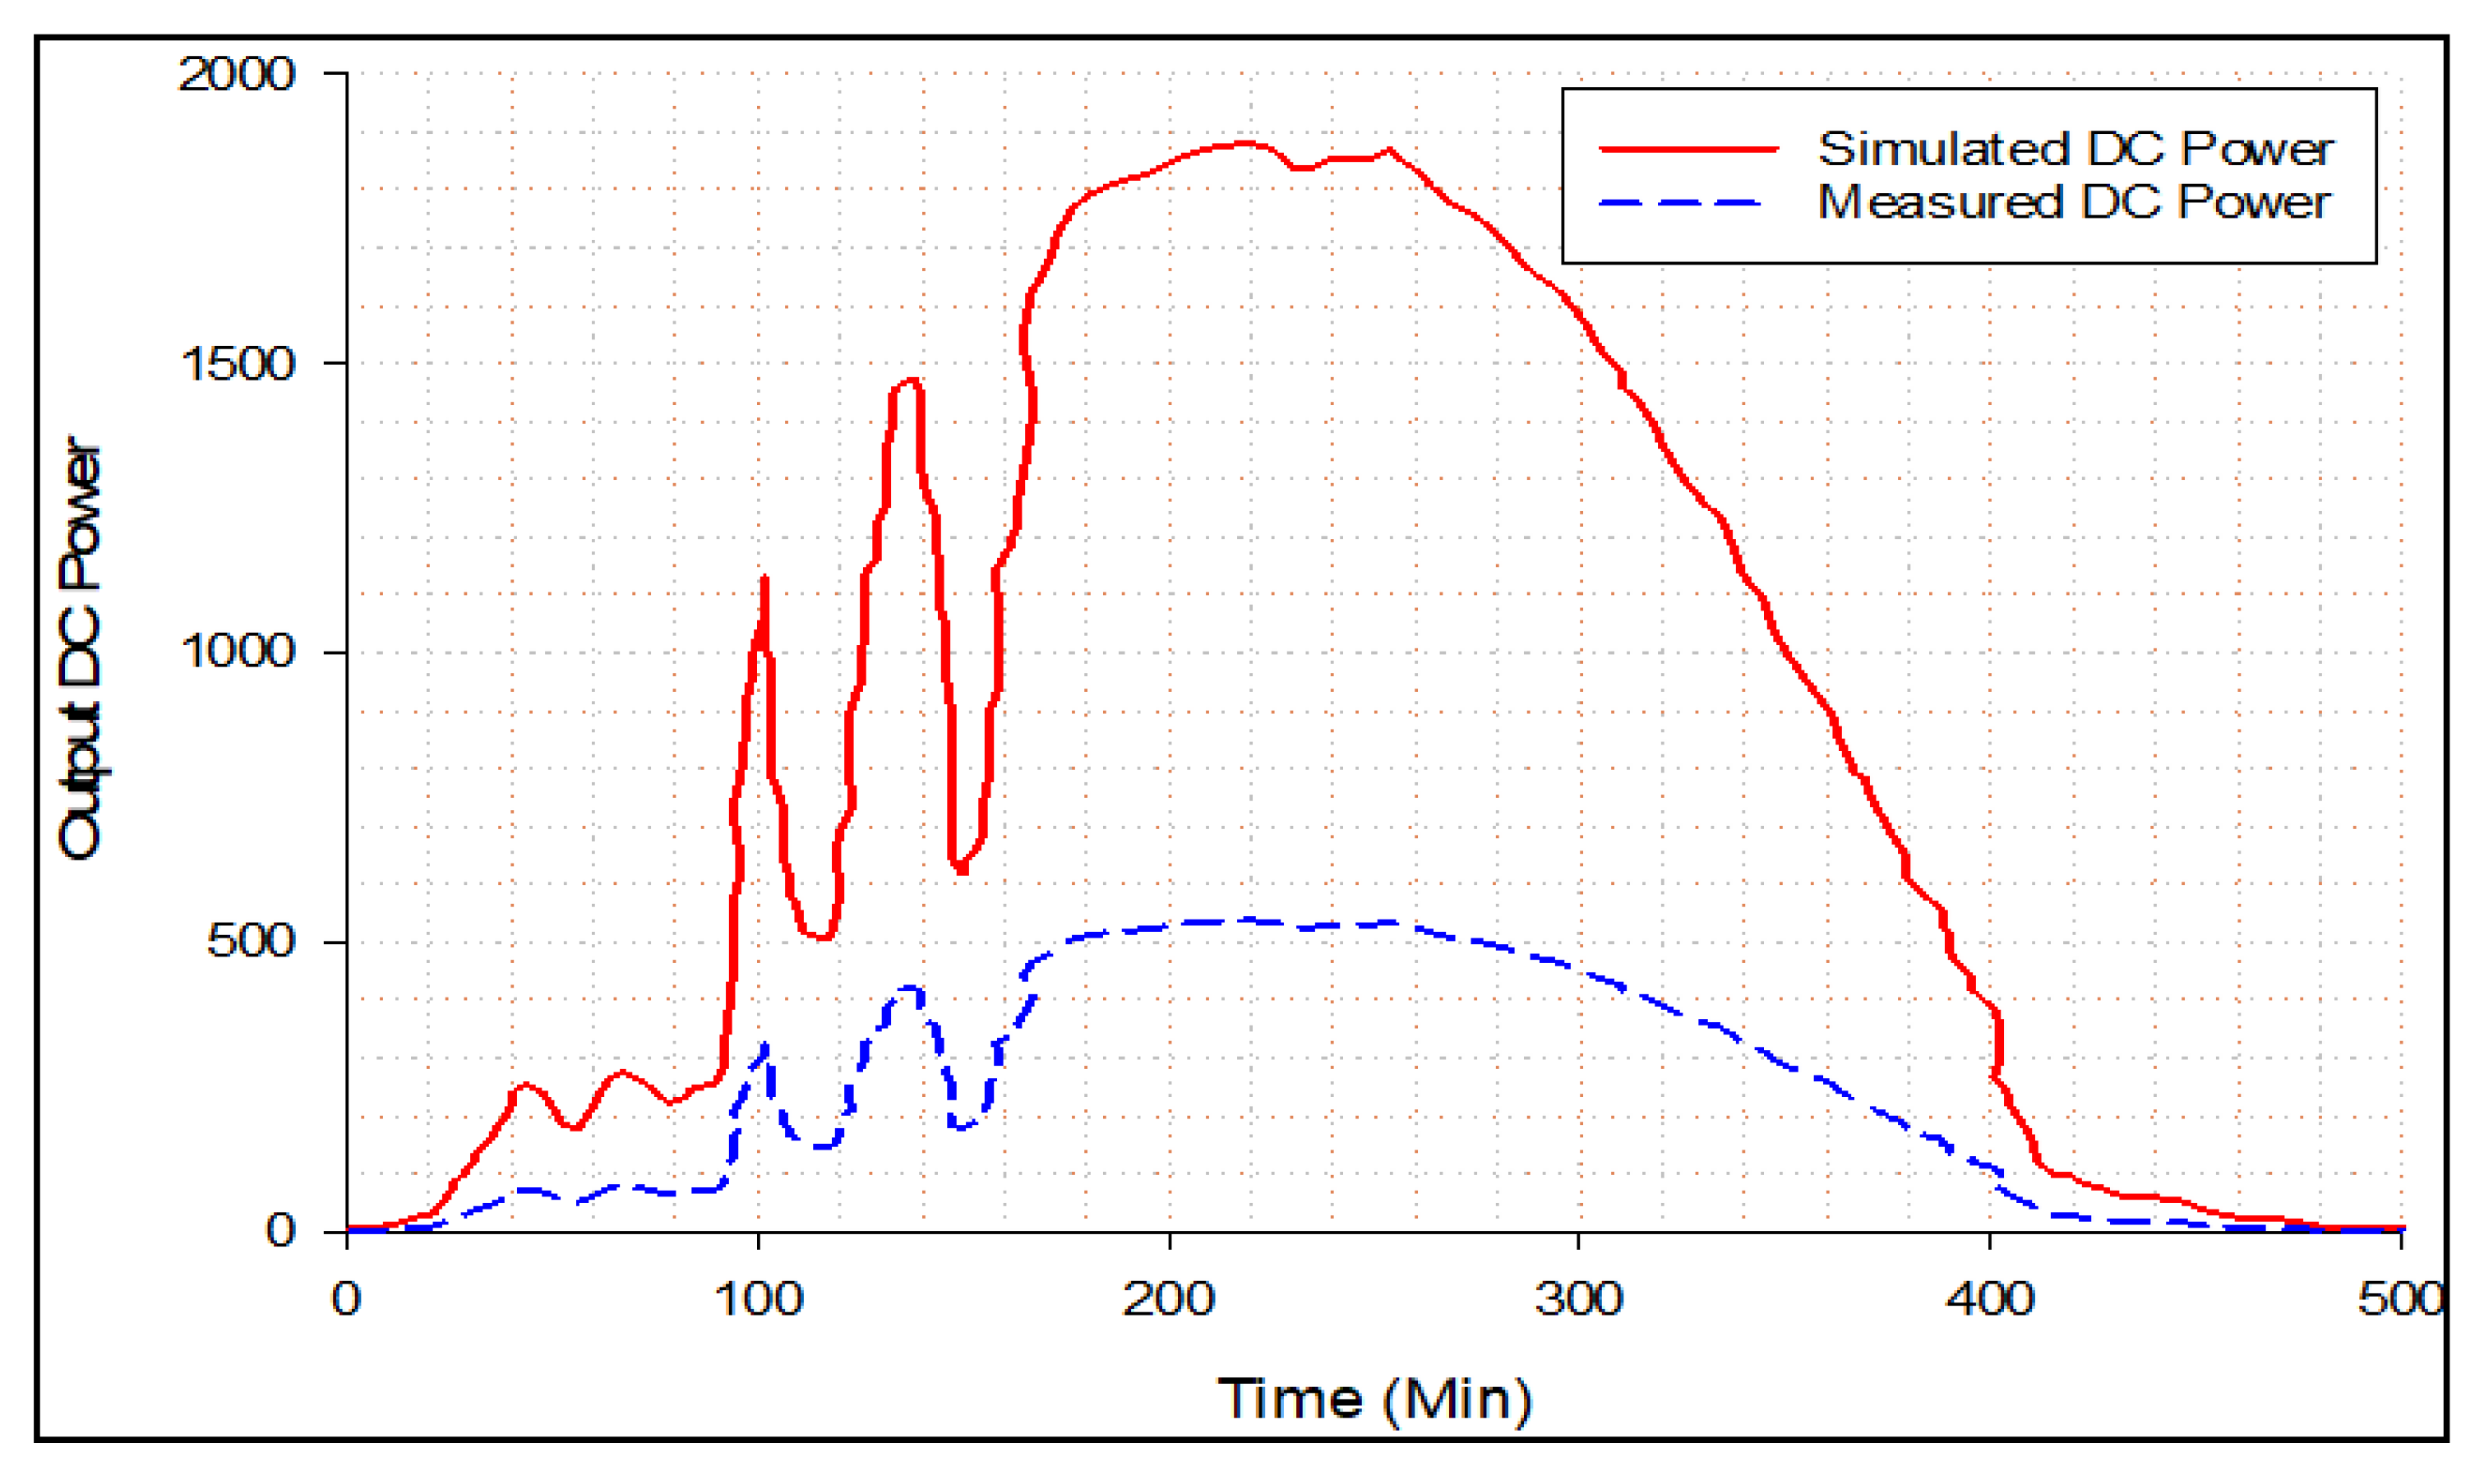
The unexpected DC power in comparison to the simulated ones is shown in Figure 8. The evolution of the diagnostic signal is shown in Figure 9a as a result, Δ P D C   surpasses the prescribed threshold, and the diagnostic signal is 1. The variation of PV current and voltage can be seen in Figure 9b,c, respectively. More information is shown in the designed GUI tool which can be seen in Figure 9d. This fact relates to the string’s modules being disconnected (or the physical module open).

5.3. Case 3: Faulty Modules (Short-Circuit)

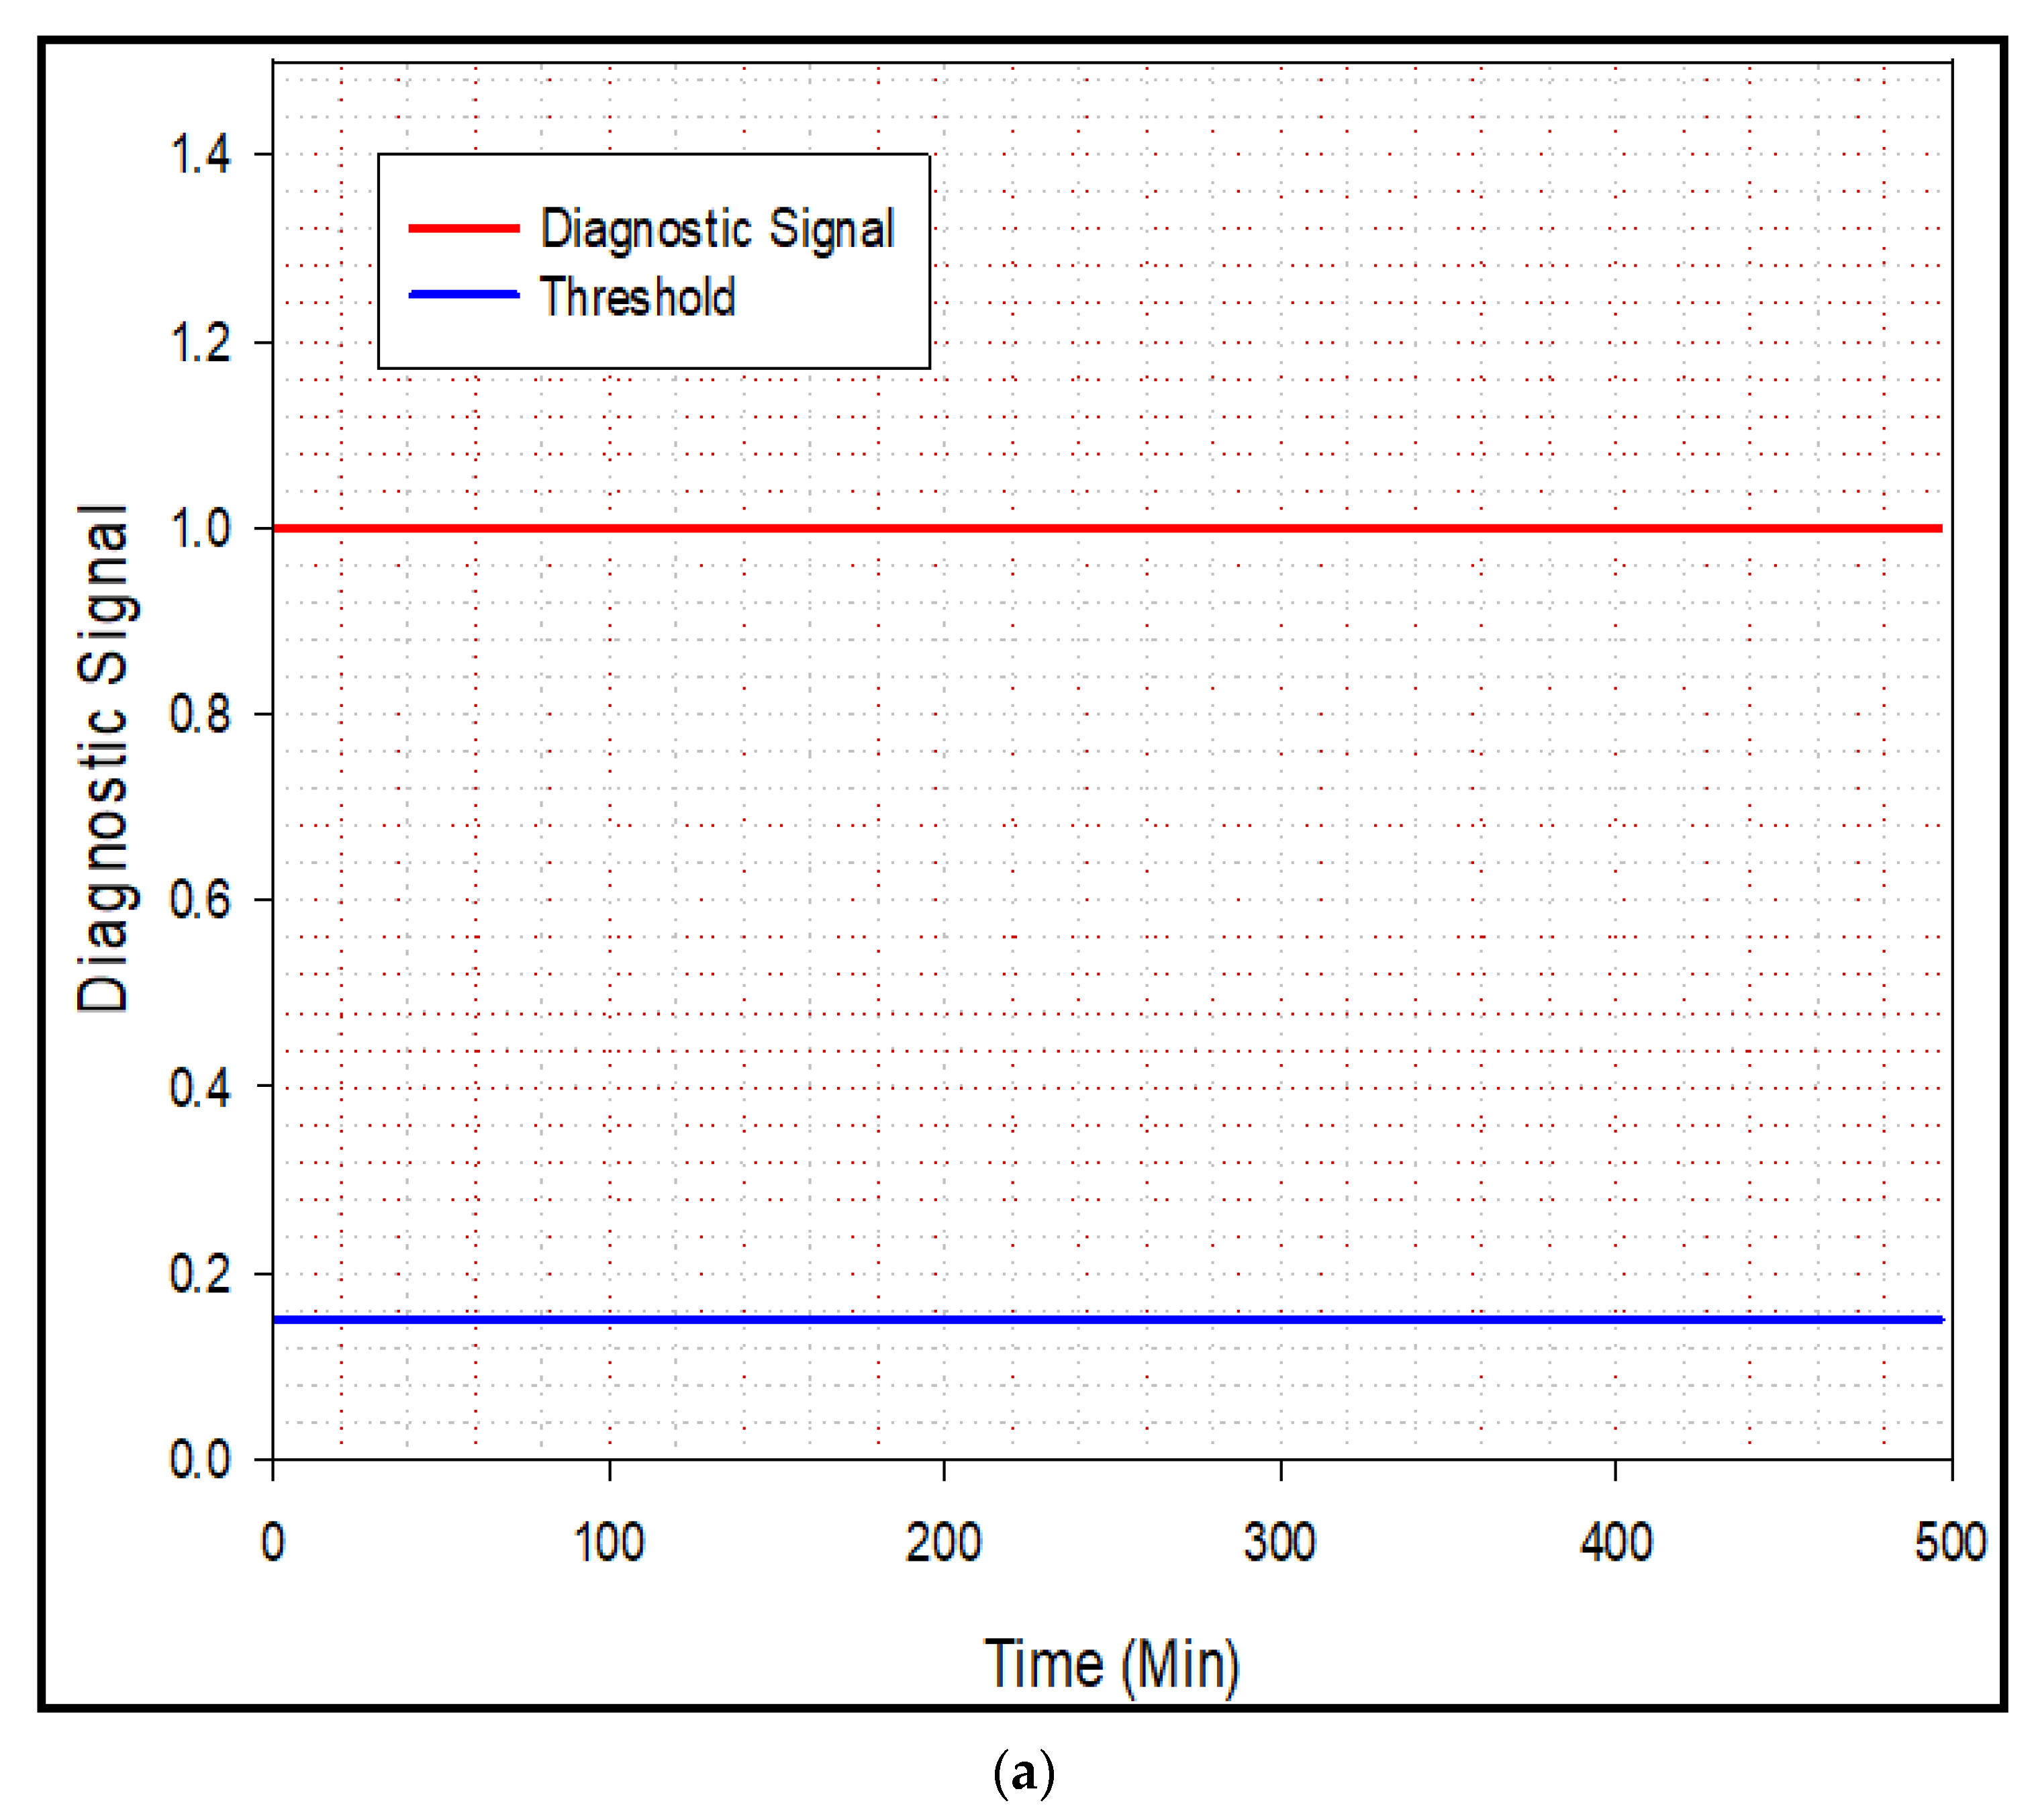
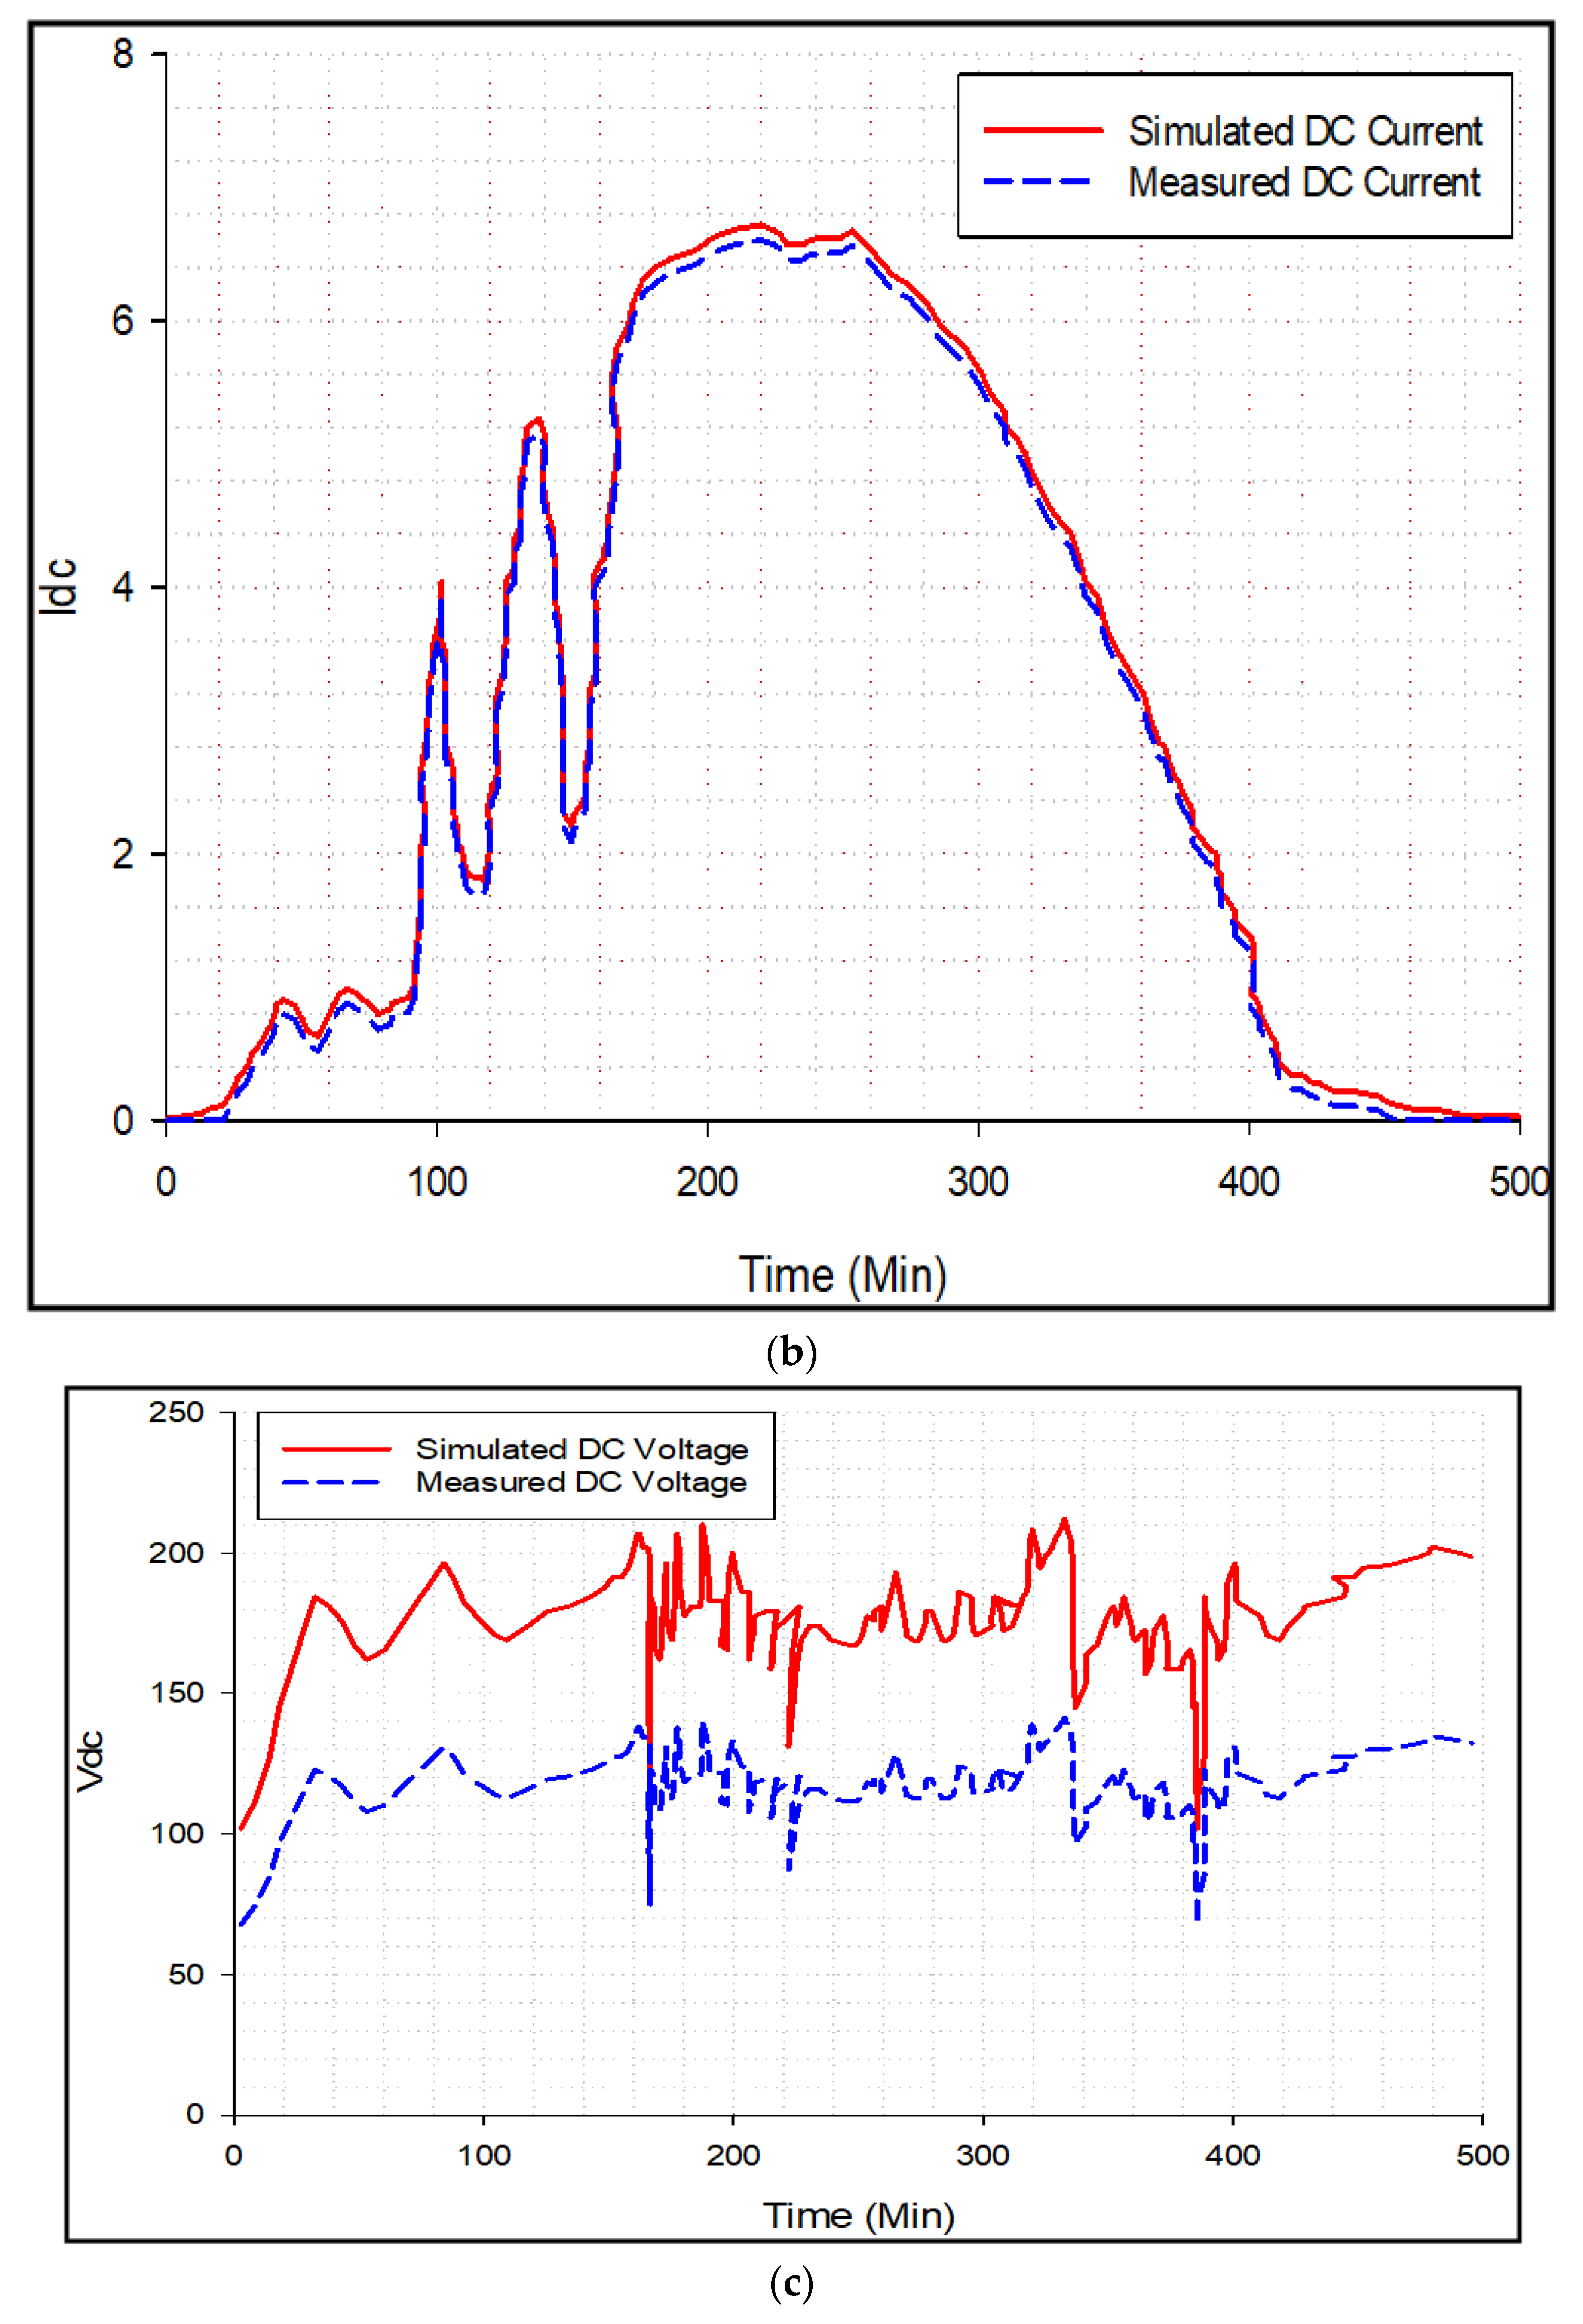
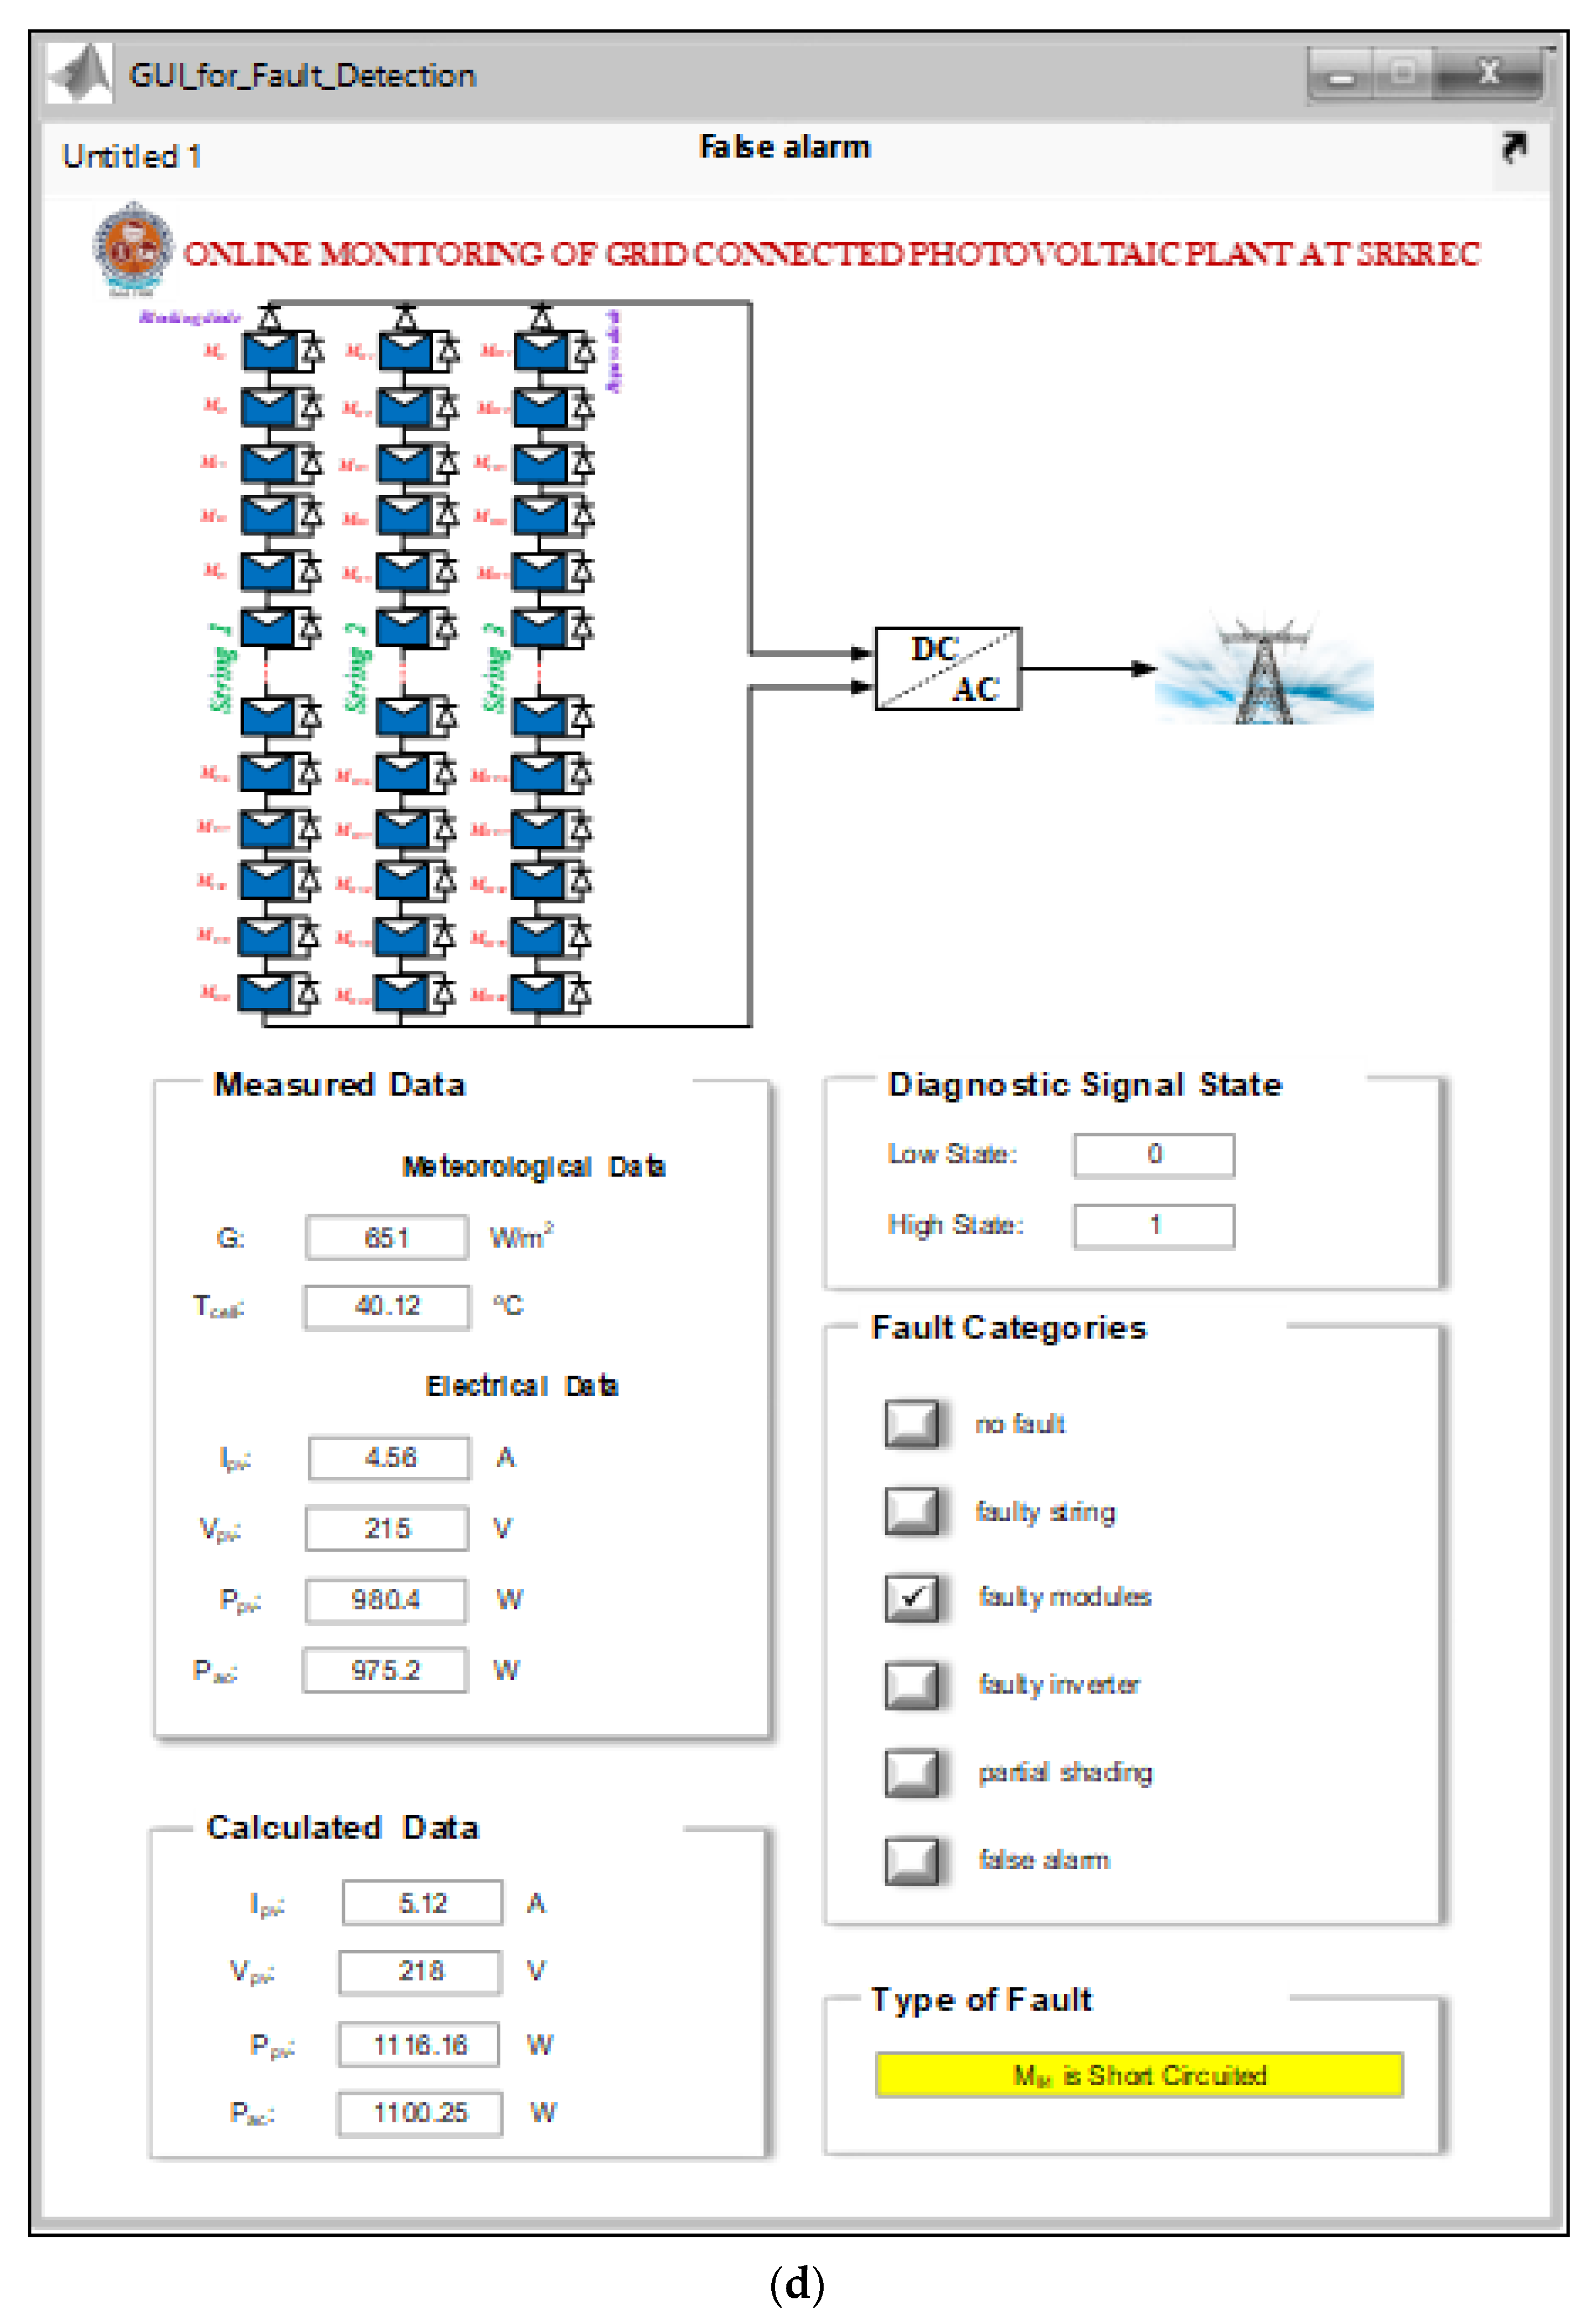
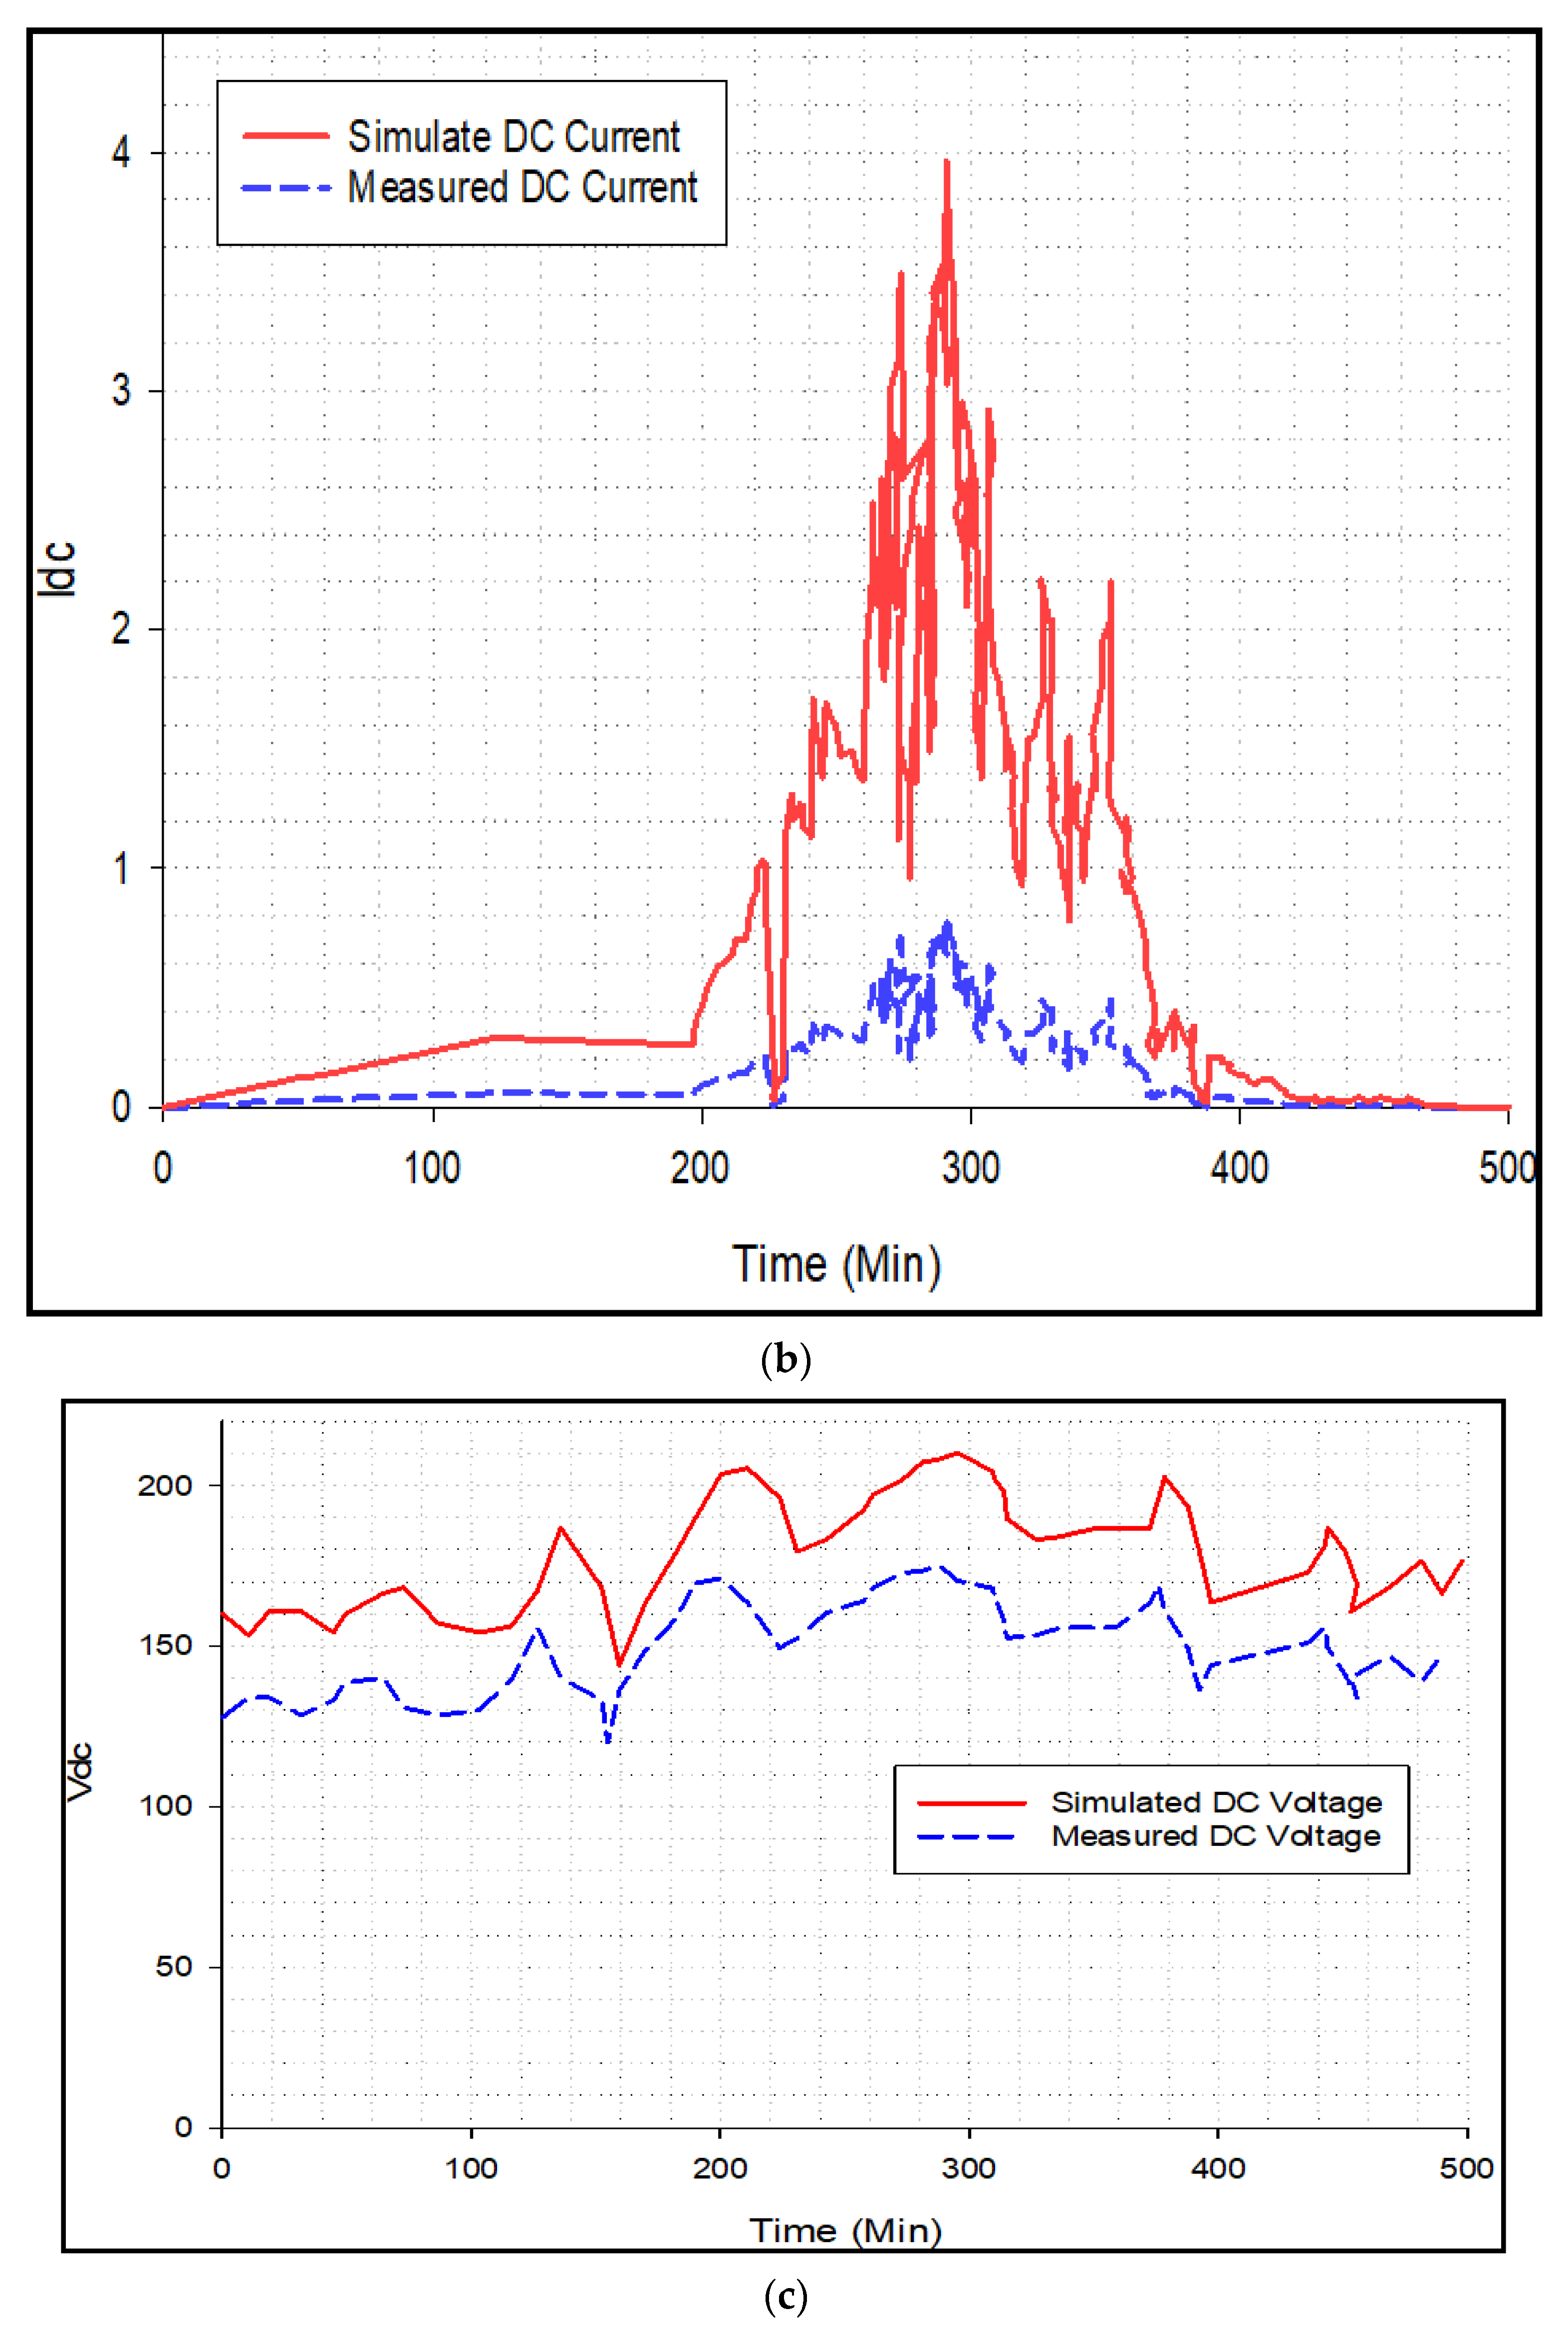
In this scenario, it was simulated that one module in a string was short-circuited, causing the change in output power. The unexpected DC power is shown in Figure 10 in comparison to the simulated ones. As a consequence of this, the voltage output by the GTPV plant has decreased, and no effect on DC, as shown in Figure 11b,c, respectively. The diagnostic indicator turns on when the change in DC voltage exceeds the threshold, as shown in Figure 11a, allowing the fault to be found. More information regarding this issue is presented in the MATLAB/GUI tool, which can be seen in Figure 11d.

5.4. Case 4: Faulty Modules (Partial Shading)

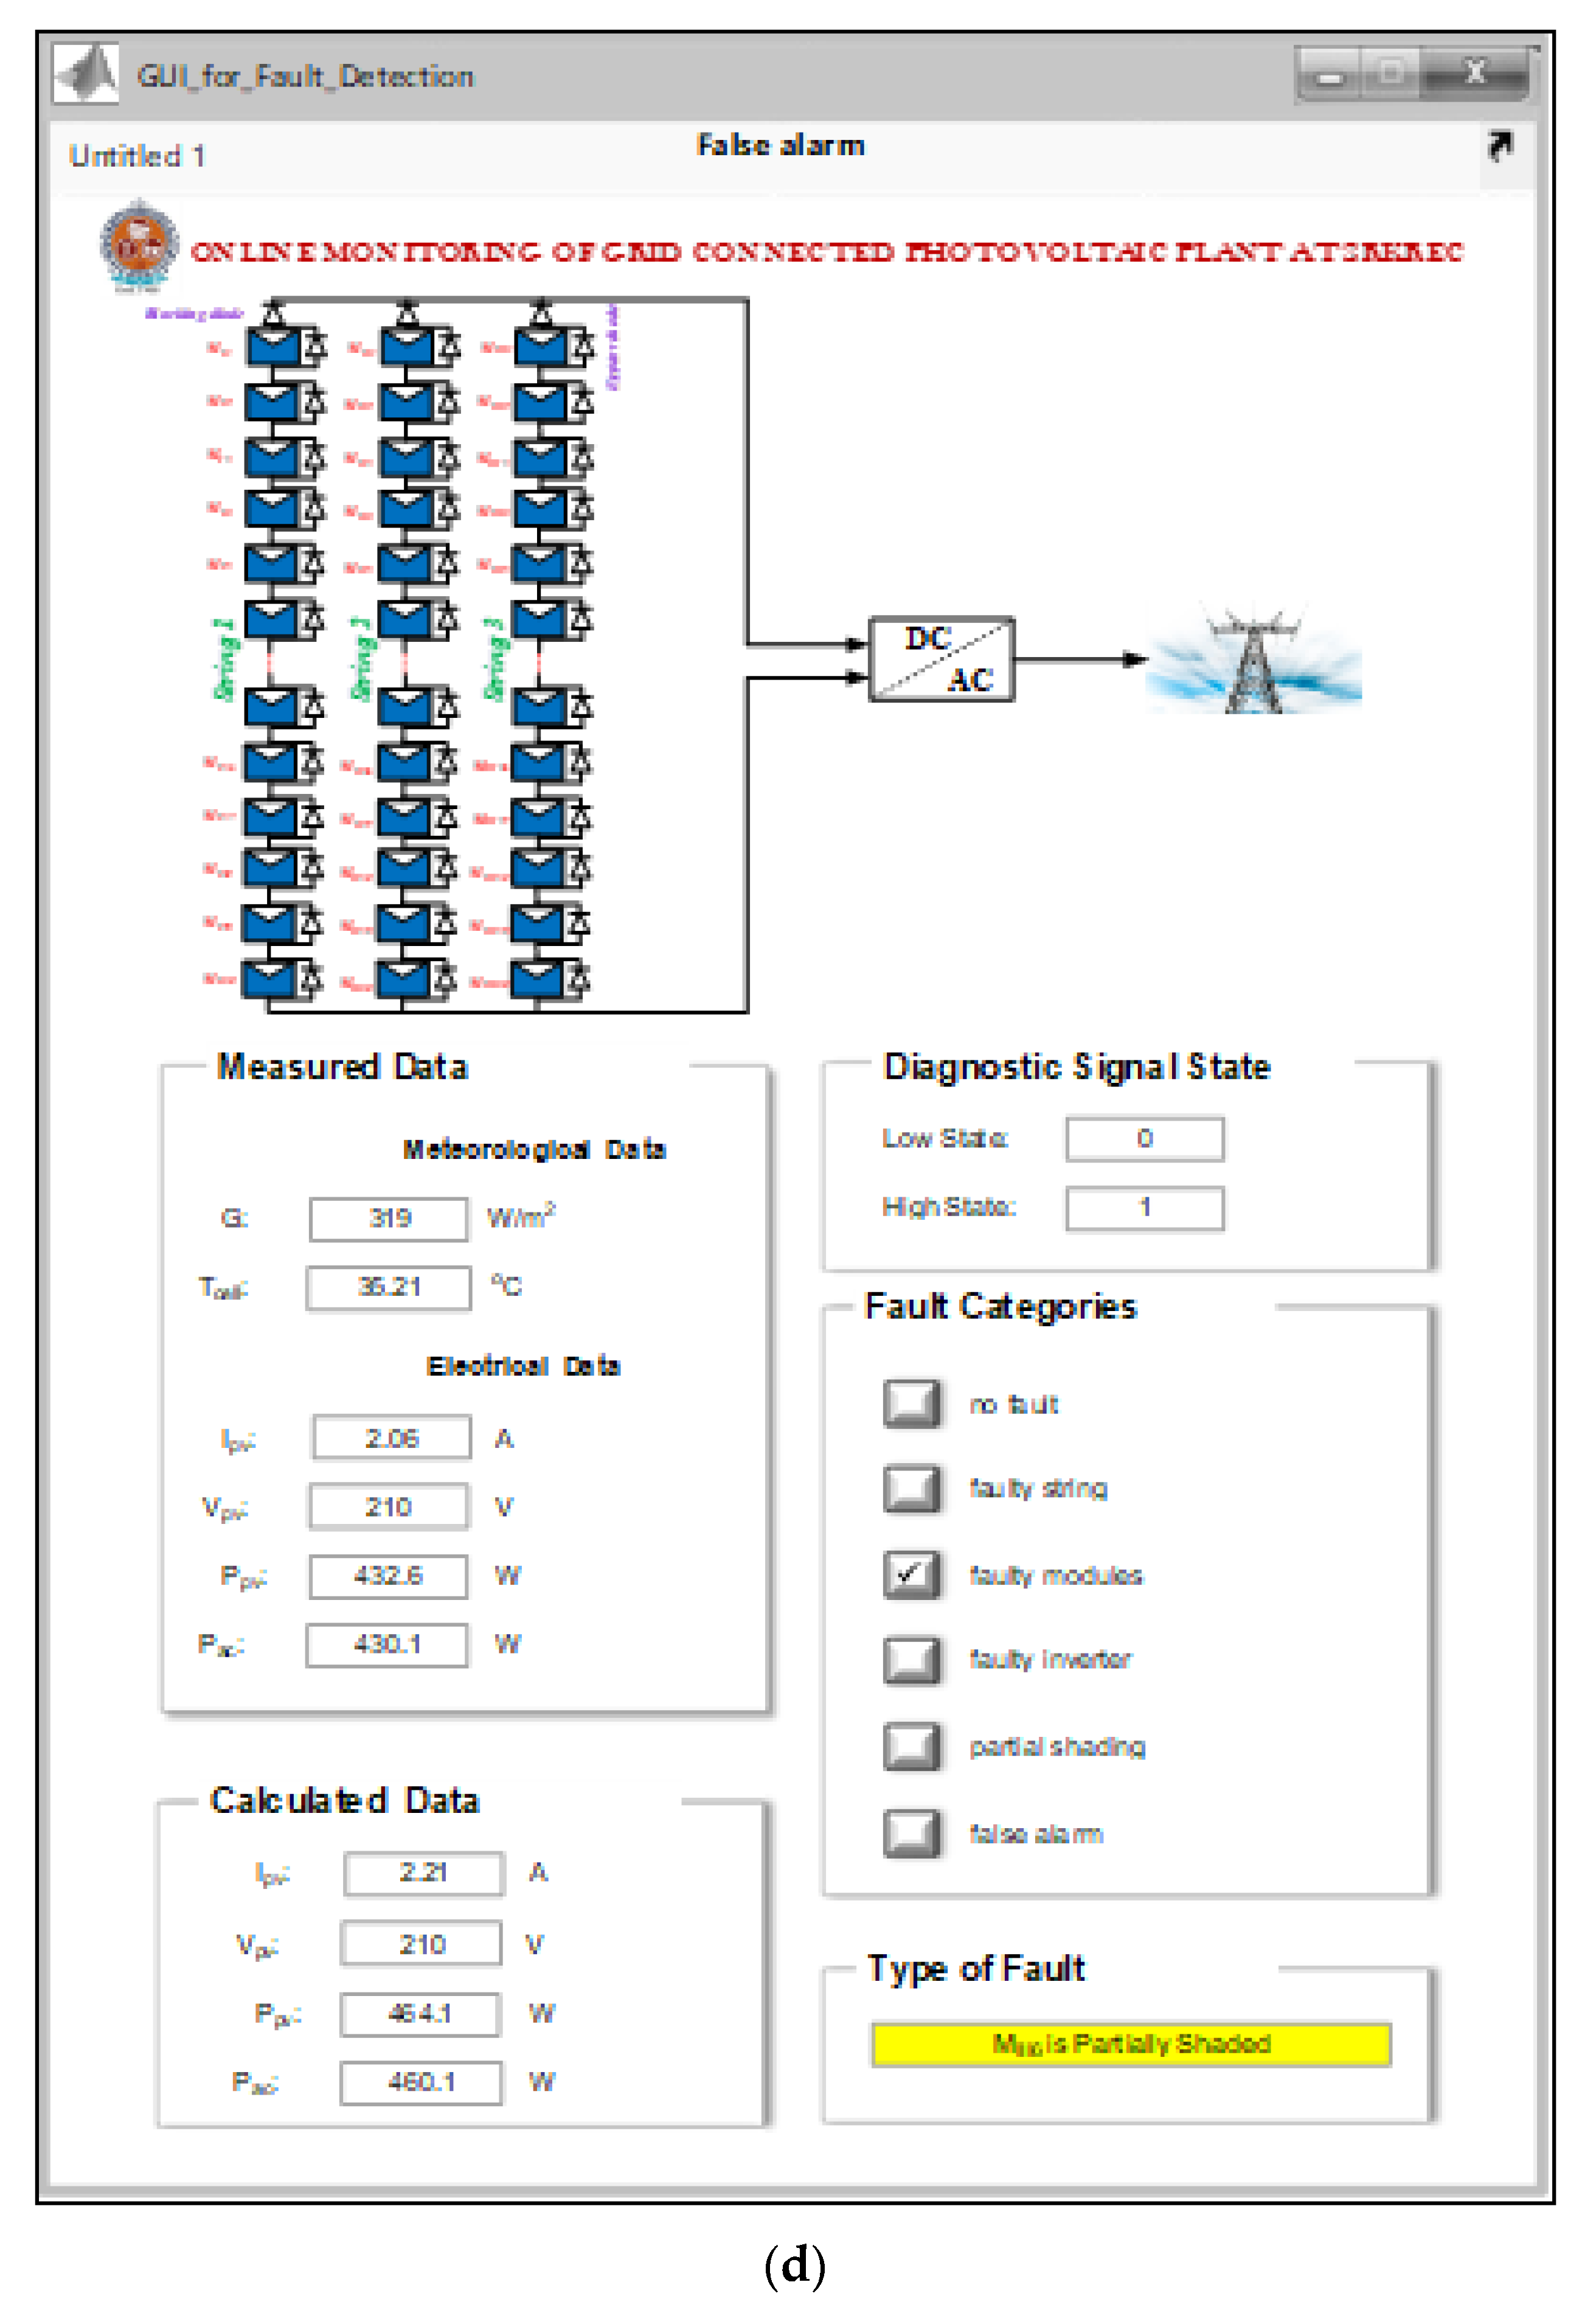
In this case, partial shading faults with bypass diode faults are taken into consideration to demonstrate the efficacy of the suggested fault detection approach. To accomplish this aim, a portion of one module is covered with translucent gelatin paper. Since there is no disruption in the grid voltage, the diagnostic procedure will follow the flow chart that can be seen in Figure 5, to locate the issue. The power differential ( Δ P D C ) is more than the threshold value, as seen in Figure 12. However, in both instances, the inverter continues to inject electricity into the grid. As a result, the condition of the fault diagnostic signal changes to “1”, as seen in Figure 13a. The change in PV voltage and current is depicted in Figure 13b,c, respectively. The examination of various attributes of PV array/module parameters will lead to the identification of the fault. The proposed tool will report the specifics of this defection, as shown in Figure 13d.

5.5. Case 5: Faulty Modules (Inverted Bypass Diode)

To demonstrate the efficiency of the devised approach when an inverted bypass chronic problem is present in the system, the bypass diode of the PV module has been inverted. As can be seen in Figure 14, there has been a noticeable drop in output power. As a result, when an anomaly occurs, the diagnostic signal will go into a “high condition”, as shown in Figure 15a. The examination of various attributes of PV array/module parameters will lead to the identification of the fault. The variation of DC voltage and current can be seen in Figure 15b,c, respectively. The proposed tool will report the specifics of this defect, as shown in Figure 15d.

5.6. Comparative Analysis

To assess the efficacy of the suggested diagnostic approach, we compared the acquired findings to those from the method provided in [31]. In Table 3, four separate case studies with varying outcomes from the two techniques are compared. As can be seen, the power losses analysis approach only identifies the potential faults but not their type and location of the fault.

6. Conclusions

A novel online monitoring and fault detection method for PV systems has been proposed and experimentally verified in this paper. The proposed method employs a low-cost monitoring system architecture placed in each module, making it both cost-effective and scalable in terms of fault diagnosis. The diagnosis part provides the operator with information regarding the nature and location of the fault, allowing the operator to take corrective measures as needed. The fault detection technique is based on the comparison of calculated and measured DC power with a predefined threshold value. It will generate a diagnostic signal to show if the GTPV plant is operating normally or abnormally. This method has been validated by using the monitored data of a 2 kWp GTPV plant. The normal operation with a false signal and faulty module operation are the two case studies that have been given. Results demonstrate that the approach can accurately diagnose faults in GTPV plants. An automated system is created graphically using MATLAB/GUI to show and monitor the PV plant in real time, and so the proposed software has the potential to become a valuable, widely used tool for GTPV plant design engineers, O&M people, and scientists. To alert users of the status of their systems in real time, we want to experimentally integrate the created automated technique into low-cost microcontrollers with LCDs and flash alarms. The requirement of large numbers of sensors, individual health monitoring of PV modules, and the requirement of a higher computing speed controller, which adds to the cost and complexities of the system, can be the potential limitation of this technique. However, it should also be noted that this system is intended for very large-sized plants where the distributed monitoring and diagnosis of PV modules at the modular level could be of great interest for efficient system management. Additionally, reducing the cost and complexities by implementing a lower sensor count, smart microcontrollers, simple detection algorithms, and wide range applications can be the future scope of this study.

Author Contributions

All authors have contributed equally to the idea and the design of the methodology proposed and to the deployment of the research paper. Conceptualization, P.R.S.; methodology, P.R.S.; software, P.R.S. and S.R.K.M.; validation, P.R.S., B.A. and S.B.T.; formal analysis, P.R.S. and B.V.A.; investigation, P.R.S. and S.B.T.; resources, B.A. and S.B.T.; writing—original draft preparation, S.R.K.M.; writing—review and editing, P.R.S. and B.V.A.; visualization, P.R.S. and S.R.K.M.; supervision, S.B.T.; project administration, B.A. and S.B.T. All authors have read and agreed to the published version of the manuscript.

Funding

The authors are thankful to the Deanship of Scientific Research at Najran University for funding this work under the Research Groups funding program grant code (NU/RG/SERC/11/6).

Data Availability Statement

Not applicable.

Conflicts of Interest

The authors declare no conflict of interest.

References

  1. Madeti, S.R.; Singh, S.N. Monitoring system for photovoltaic plants: A review. Renew. Sustain. Energy Rev. 2017, 67, 1180–1207. [Google Scholar] [CrossRef]
  2. Madeti, S.R.; Singh, S.N. A comprehensive study on different types of faults and detection techniques for solar photovoltaic system. Sol. Energy 2017, 158, 161–185. [Google Scholar] [CrossRef]
  3. Madeti, S.R.; Singh, S.N. Online fault detection and the economic analysis of grid-connected photovoltaic systems. Energy 2017, 134, 121–135. [Google Scholar] [CrossRef]
  4. Rezazadeh, S.; Moradzadeh, A.; Pourhossein, K.; Akrami, M.; Mohammadi-Ivatloo, B.; Anvari-Moghaddam, A. Photovoltaic array reconfiguration under partial shading conditions for maximum power extraction: A state-of-the-art review and new solution method. Energy Convers. Manag. 2022, 258, 115468. [Google Scholar] [CrossRef]
  5. Aljafari, B.; Satpathy, P.R.; Thanikanti, S.B. Partial shading mitigation in PV arrays through dragonfly algorithm based dynamic reconfiguration. Energy 2022, 257, 124795. [Google Scholar] [CrossRef]
  6. Satpathy, P.R.; Aljafari, B.; Thanikanti, S.B. Power losses mitigation through electrical reconfiguration in partial shading prone solar PV arrays. Optik 2022, 259, 168973. [Google Scholar] [CrossRef]
  7. Bennani, Y.; Perl, A.; Patil, A.; van Someren, C.; Heijne, L.; van Steenis, M. Power-to-Ammonia: Rethinking the Role of Ammonia–from a Value Product to a Flexible Energy Carrier (FlexNH3); Hanzehogeschool Groningen: Groningen, The Netherlands, 2016. [Google Scholar]
  8. Verma, D.; Nema, S.; Shandilya, A.M.; Dash, S.K. Maximum power point tracking (MPPT) techniques: Recapitulation in solar photovoltaic systems. Renew. Sustain. Energy Rev. 2016, 54, 1018–1034. [Google Scholar] [CrossRef]
  9. Chen, P.C.; Chen, P.Y.; Liu, Y.H.; Chen, J.H.; Luo, Y.F. A comparative study on maximum power point tracking techniques for photovoltaic generation systems operating under fast changing environments. Sol. Energy 2015, 119, 261–276. [Google Scholar] [CrossRef]
  10. Sahnoun, M.A.; Ugalde, H.M.; Carmona, J.C.; Gomand, J. Maximum power point tracking using P&O control optimized by a neural network approach: A good compromise between accuracy and complexity. Energy Procedia 2013, 42, 650–659. [Google Scholar]
  11. Siddiqui, R.; Kumar, R.; Jha, G.K.; Gowri, G.; Morampudi, M.; Rajput, P.; Lata, S.; Agariya, S.; Dubey, B.; Nanda, G.; et al. Comparison of different technologies for solar PV (Photovoltaic) outdoor performance using indoor accelerated aging tests for long term reliability. Energy 2016, 107, 550–561. [Google Scholar] [CrossRef]
  12. Sharma, V.; Chandel, S.S. Performance and degradation analysis for long term reliability of solar photovoltaic systems: A review. Renew. Sustain. Energy Rev. 2013, 27, 753–767. [Google Scholar] [CrossRef]
  13. Pachauri, R.K.; Mahela, O.P.; Sharma, A.; Bai, J.; Chauhan, Y.K.; Khan, B.; Alhelou, H.H. Impact of partial shading on various PV array configurations and different modeling approaches: A comprehensive review. IEEE Access 2020, 8, 181375–181403. [Google Scholar] [CrossRef]
  14. Al-Jumaili, M.H.; Abdalkafor, A.S.; Taha, M.Q. Analysis of the hard and soft shading impact on photovoltaic module performance using solar module tester. Int. J. Power Electron. Dri. Syst. 2019, 2088, 1015. [Google Scholar] [CrossRef]
  15. Kazem, H.A.; Chaichan, M.T.; Al-Waeli, A.H.; Sopian, K. A review of dust accumulation and cleaning methods for solar photovoltaic systems. J. Clean. Prod. 2020, 276, 123187. [Google Scholar] [CrossRef]
  16. Mani, M.; Pillai, R. Impact of dust on solar photovoltaic (PV) performance: Research status, challenges and recommendations. Renew. Sustain. Energy Rev. 2010, 14, 3124–3131. [Google Scholar] [CrossRef]
  17. Andenæs, E.; Jelle, B.P.; Ramlo, K.; Kolås, T.; Selj, J.; Foss, S.E. The influence of snow and ice coverage on the energy generation from photovoltaic solar cells. Sol. Energy 2018, 159, 318–328. [Google Scholar] [CrossRef]
  18. Jelle, B.P. The challenge of removing snow downfall on photovoltaic solar cell roofs in order to maximize solar energy efficiency—Research opportunities for the future. Energy Build. 2013, 67, 334–351. [Google Scholar] [CrossRef] [Green Version]
  19. Syafiq, A.; Pandey, A.K.; Adzman, N.N.; Abd Rahim, N. Advances in approaches and methods for self-cleaning of solar photovoltaic panels. Sol. Energy 2018, 162, 597–619. [Google Scholar] [CrossRef]
  20. Stonier, A.A.; Lehman, B. An intelligent-based fault-tolerant system for solar-fed cascaded multilevel inverters. IEEE Trans. Energy Convers. 2017, 33, 1047–1057. [Google Scholar] [CrossRef]
  21. Dhimish, M.; Holmes, V.; Mehrdadi, B.; Dales, M. Simultaneous fault detection algorithm for grid-connected photovoltaic plants. IET Renew. Power Gener. 2017, 11, 1565–1575. [Google Scholar] [CrossRef]
  22. Krauter, S.C.; Depping, T. Remote PV-system monitored via satellite. Sol. Energy Mater. Sol. Cells 2004, 82, 139–150. [Google Scholar] [CrossRef]
  23. Peters, I.M.; Liu, H.; Reindl, T.; Buonassisi, T. Global prediction of photovoltaic field performance differences using open-source satellite data. Joule 2018, 2, 307–322. [Google Scholar] [CrossRef] [Green Version]
  24. Livera, A.; Theristis, M.; Makrides, G.; Georghiou, G.E. Recent advances in failure diagnosis techniques based on performance data analysis for grid-connected photovoltaic systems. Renew. Energy 2019, 133, 126–143. [Google Scholar] [CrossRef]
  25. Triki-Lahiani, A.; Abdelghani, A.B.; Slama-Belkhodja, I. Fault detection and monitoring systems for photovoltaic installations: A review. Renew. Sustain. Energy Rev. 2018, 82, 2680–2692. [Google Scholar] [CrossRef]
  26. Lu, X.; Lin, P.; Cheng, S.; Lin, Y.; Chen, Z.; Wu, L.; Zheng, Q. Fault diagnosis for photovoltaic array based on convolutional neural network and electrical time series graph. Energy Convers. Manag. 2019, 196, 950–965. [Google Scholar] [CrossRef]
  27. Harrou, F.; Taghezouit, B.; Sun, Y. Robust and flexible strategy for fault detection in grid-connected photovoltaic systems. Energy Convers. Manag. 2019, 180, 1153–1166. [Google Scholar] [CrossRef]
  28. Dhimish, M.; Holmes, V. Fault detection algorithm for grid-connected photovoltaic plants. Sol. Energy 2016, 137, 236–245. [Google Scholar] [CrossRef]
  29. Dhimish, M.; Holmes, V.; Dales, M. Parallel fault detection algorithm for grid-connected photovoltaic plants. Renew. Energy 2017, 113, 94–111. [Google Scholar] [CrossRef]
  30. Ando, B.; Baglio, S.; Pistorio, A.; Tina, G.M.; Ventura, C. Sentinella: Smart monitoring of photovoltaic systems at panel level. IEEE Trans. Instrum. Meas. 2015, 64, 2199. [Google Scholar] [CrossRef]
  31. Silvestre, S.; Chouder, A.; Karatepe, E. Automatic supervision and fault detection of PV systems based on power losses analysis. Energy Convers. Manag. 2010, 51, 1929–1937. [Google Scholar]
  32. Madeti, S.R.; Singh, S.N. Online modular level fault detection algorithm for grid-tied and off-grid PV systems. Sol. Energy 2017, 157, 349–364. [Google Scholar] [CrossRef]
  33. Esram, T.; Chapman, P.L. Comparison of photovoltaic array maximum power point tracking techniques. IEEE Transact. Energy Convers. 2007, 22, 439–449. [Google Scholar] [CrossRef]
  34. Jiang, L.L.; Maskell, D.L. Automatic fault detection and diagnosis for photovoltaic systems using combined artificial neural network and analytical based methods. In Proceedings of the International Joint Conference on Neural Networks (IJCNN), Killarney, Ireland, 12–17 July 2015; Volume 12, pp. 1–8. [Google Scholar]
  35. Chine, W.; Mellit, A.; Lughi, V.; Malek, A.; Sulligoi, G.; Pavan, A.M.A. Novel fault diagnosis technique for photovoltaic systems based on artificial neural networks. Renew. Energy 2016, 90, 501–512. [Google Scholar] [CrossRef]
  36. Esram, T.; Kimball, J.W.; Krein, P.T.; Chapman, P.L.; Midya, P. Dynamic maximum power point tracking of photovoltaic arrays using ripple correlation control. IEEE Trans. Power Electron. 2006, 21, 1282–1291. [Google Scholar] [CrossRef]
  37. Chialastri, A. Testing, Optimization and Design of a BIPV/T Solar Air Collector. Ph.D. Thesis, University of California, Santa Cruz, CA, USA, 2019. [Google Scholar]
  38. Akinyele, D.O.; Rayudu, R.K.; Nair, N.K. Global progress in photovoltaic technologies and the scenario of development of solar panel plant and module performance estimation—Application in Nigeria. Renew. Sustain. Energy Rev. 2015, 48, 112–139. [Google Scholar] [CrossRef]
  39. Manno, D.; Cipriani, G.; Ciulla, G.; Di Dio, V.; Guarino, S.; Brano, V.L. Deep learning strategies for automatic fault diagnosis in photovoltaic systems by thermographic images. Energy Convers.Manag. 2021, 241, 114315. [Google Scholar] [CrossRef]
  40. Spagnuolo, G.; Petrone, G.; Lehman, B.; Paja, C.A.; Zhao, Y.; Gutierrez, M.L. Control of photovoltaic arrays: Dynamical reconfiguration for fighting mismatched conditions and meeting load requests. IEEE Ind. Electron. Mag. 2015, 9, 62–76. [Google Scholar] [CrossRef]
  41. Al-katheri, A.A.; Al-Ammar, E.A.; Alotaibi, M.; Ghazi, G.A. Artificial Neural Network Application for Faults Detection in PV Systems. In Proceedings of the 2022 IEEE Delhi Section Conference (DELCON), New Delhi, India, 11–13 February 2022; IEEE: Piscataway Township, NJ, USA, 2022; pp. 1–6. [Google Scholar]
  42. Akram, M.N.; Lotfifard, S. Modeling and health monitoring of DC side of photovoltaic array. IEEE Trans. Sustain. Energy 2015, 6, 1245–1253. [Google Scholar] [CrossRef]
  43. Bimenyimana, S.; Asemota, G.N.; Kemunto, M.C.; Li, L. Shading effects in photovoltaic modules: Simulation and experimental results. In Proceedings of the 2nd International Conference on Power and Renewable Energy (ICPRE), Chengdu, China, 20–23 September 2017; IEEE: Piscataway Township, NJ, USA, 2017; pp. 904–909. [Google Scholar]
  44. Hariharan, R.; Chakkarapani, M.; Ilango, G.S.; Nagamani, C. A method to detect photovoltaic array faults and partial shading in PV systems. IEEE J. Photovolt. 2016, 6, 1278–1285. [Google Scholar] [CrossRef]
  45. Kurukuru, V.B.; Haque, A.; Khan, M.A.; Blaabjerg, F. Resource management with kernel-based approaches for grid-connected solar photovoltaic systems. Heliyon 2021, 7, e08609. [Google Scholar] [CrossRef]
  46. Dusonchet, L.; Telaretti, E. Economic analysis of different supporting policies for the production of electrical energy by solar photovoltaics in eastern European Union countries. Energy Policy 2010, 38, 4011–4020. [Google Scholar] [CrossRef]
  47. Thirugnanam, K.; El Moursi, M.S.; Khadkikar, V.; Zeineldin, H.H.; Al Hosani, M. Energy Management Strategy of a Reconfigurable Grid-Tied Hybrid AC/DC Microgrid for Commercial Building Applications. IEEE Trans. Smart Grid 2022, 13, 1720–1738. [Google Scholar] [CrossRef]
  48. Yu, H.; Niu, S.; Jian, L. A Multi-Port and Reconfigurable Hybrid AC/DC Microgrid Architecture with Hierarchical Power Control for Nearly/Net Zero Energy Buildings. In Proceedings of the 2020 IEEE 4th Conference on Energy Internet and Energy System Integration (EI2), Wuhan, China, 30 October–1 November 2020; pp. 613–618. [Google Scholar]
  49. Chaker, M.; El Houre, A.; Yousfi, D.; Kourchi, M.; Ajaamoum, M.; Idadoub, H.; Bouchnaif, J. Development of a PV emulator using SMPS converter and a model selection mechanism for characteristic generation. Sol. Energy 2022, 239, 117–128. [Google Scholar] [CrossRef]
  50. Yılmaz, A.; Küçüker, A.; Bayrak, G.; Ertekin, D.; Shafie-Khah, M.; Guerrero, J.M. An improved automated PQD classification method for distributed generators with hybrid SVM-based approach using un-decimated wavelet transform. Int. J. Electr. Power Energy Syst. 2022, 136, 107763. [Google Scholar] [CrossRef]
  51. Gholami, A.; Ameri, M.; Zandi, M.; Ghoachani, R.G. Electrical, thermal and optical modeling of photovoltaic systems: Step-by-step guide and comparative review study. Sustain. Energy Technol. Assess. 2022, 49, 101711. [Google Scholar] [CrossRef]
  52. Wang, C.N.; Dang, T.T.; Bayer, J. A two-stage multiple criteria decision making for site selection of solar photovoltaic (PV) power plant: A case study in Taiwan. IEEE Access 2021, 9, 75509–75525. [Google Scholar] [CrossRef]
  53. Agga, A.; Abbou, A.; Labbadi, M.; El Houm, Y. Short-term self consumption PV plant power production forecasts based on hybrid CNN-LSTM, ConvLSTM models. Renew. Energy 2021, 177, 101–112. [Google Scholar] [CrossRef]
  54. IEC 61215-1-1; Terrestrial Photovoltaic (PV) Modules—Design Qualification and Type Approval—Part 1-1: Special Require-934 Ments for Testing of Crystalline Silicon Photovoltaic (PV) Modules. International Electrotechnical Commission: Geneva, Switzerland, 2016.
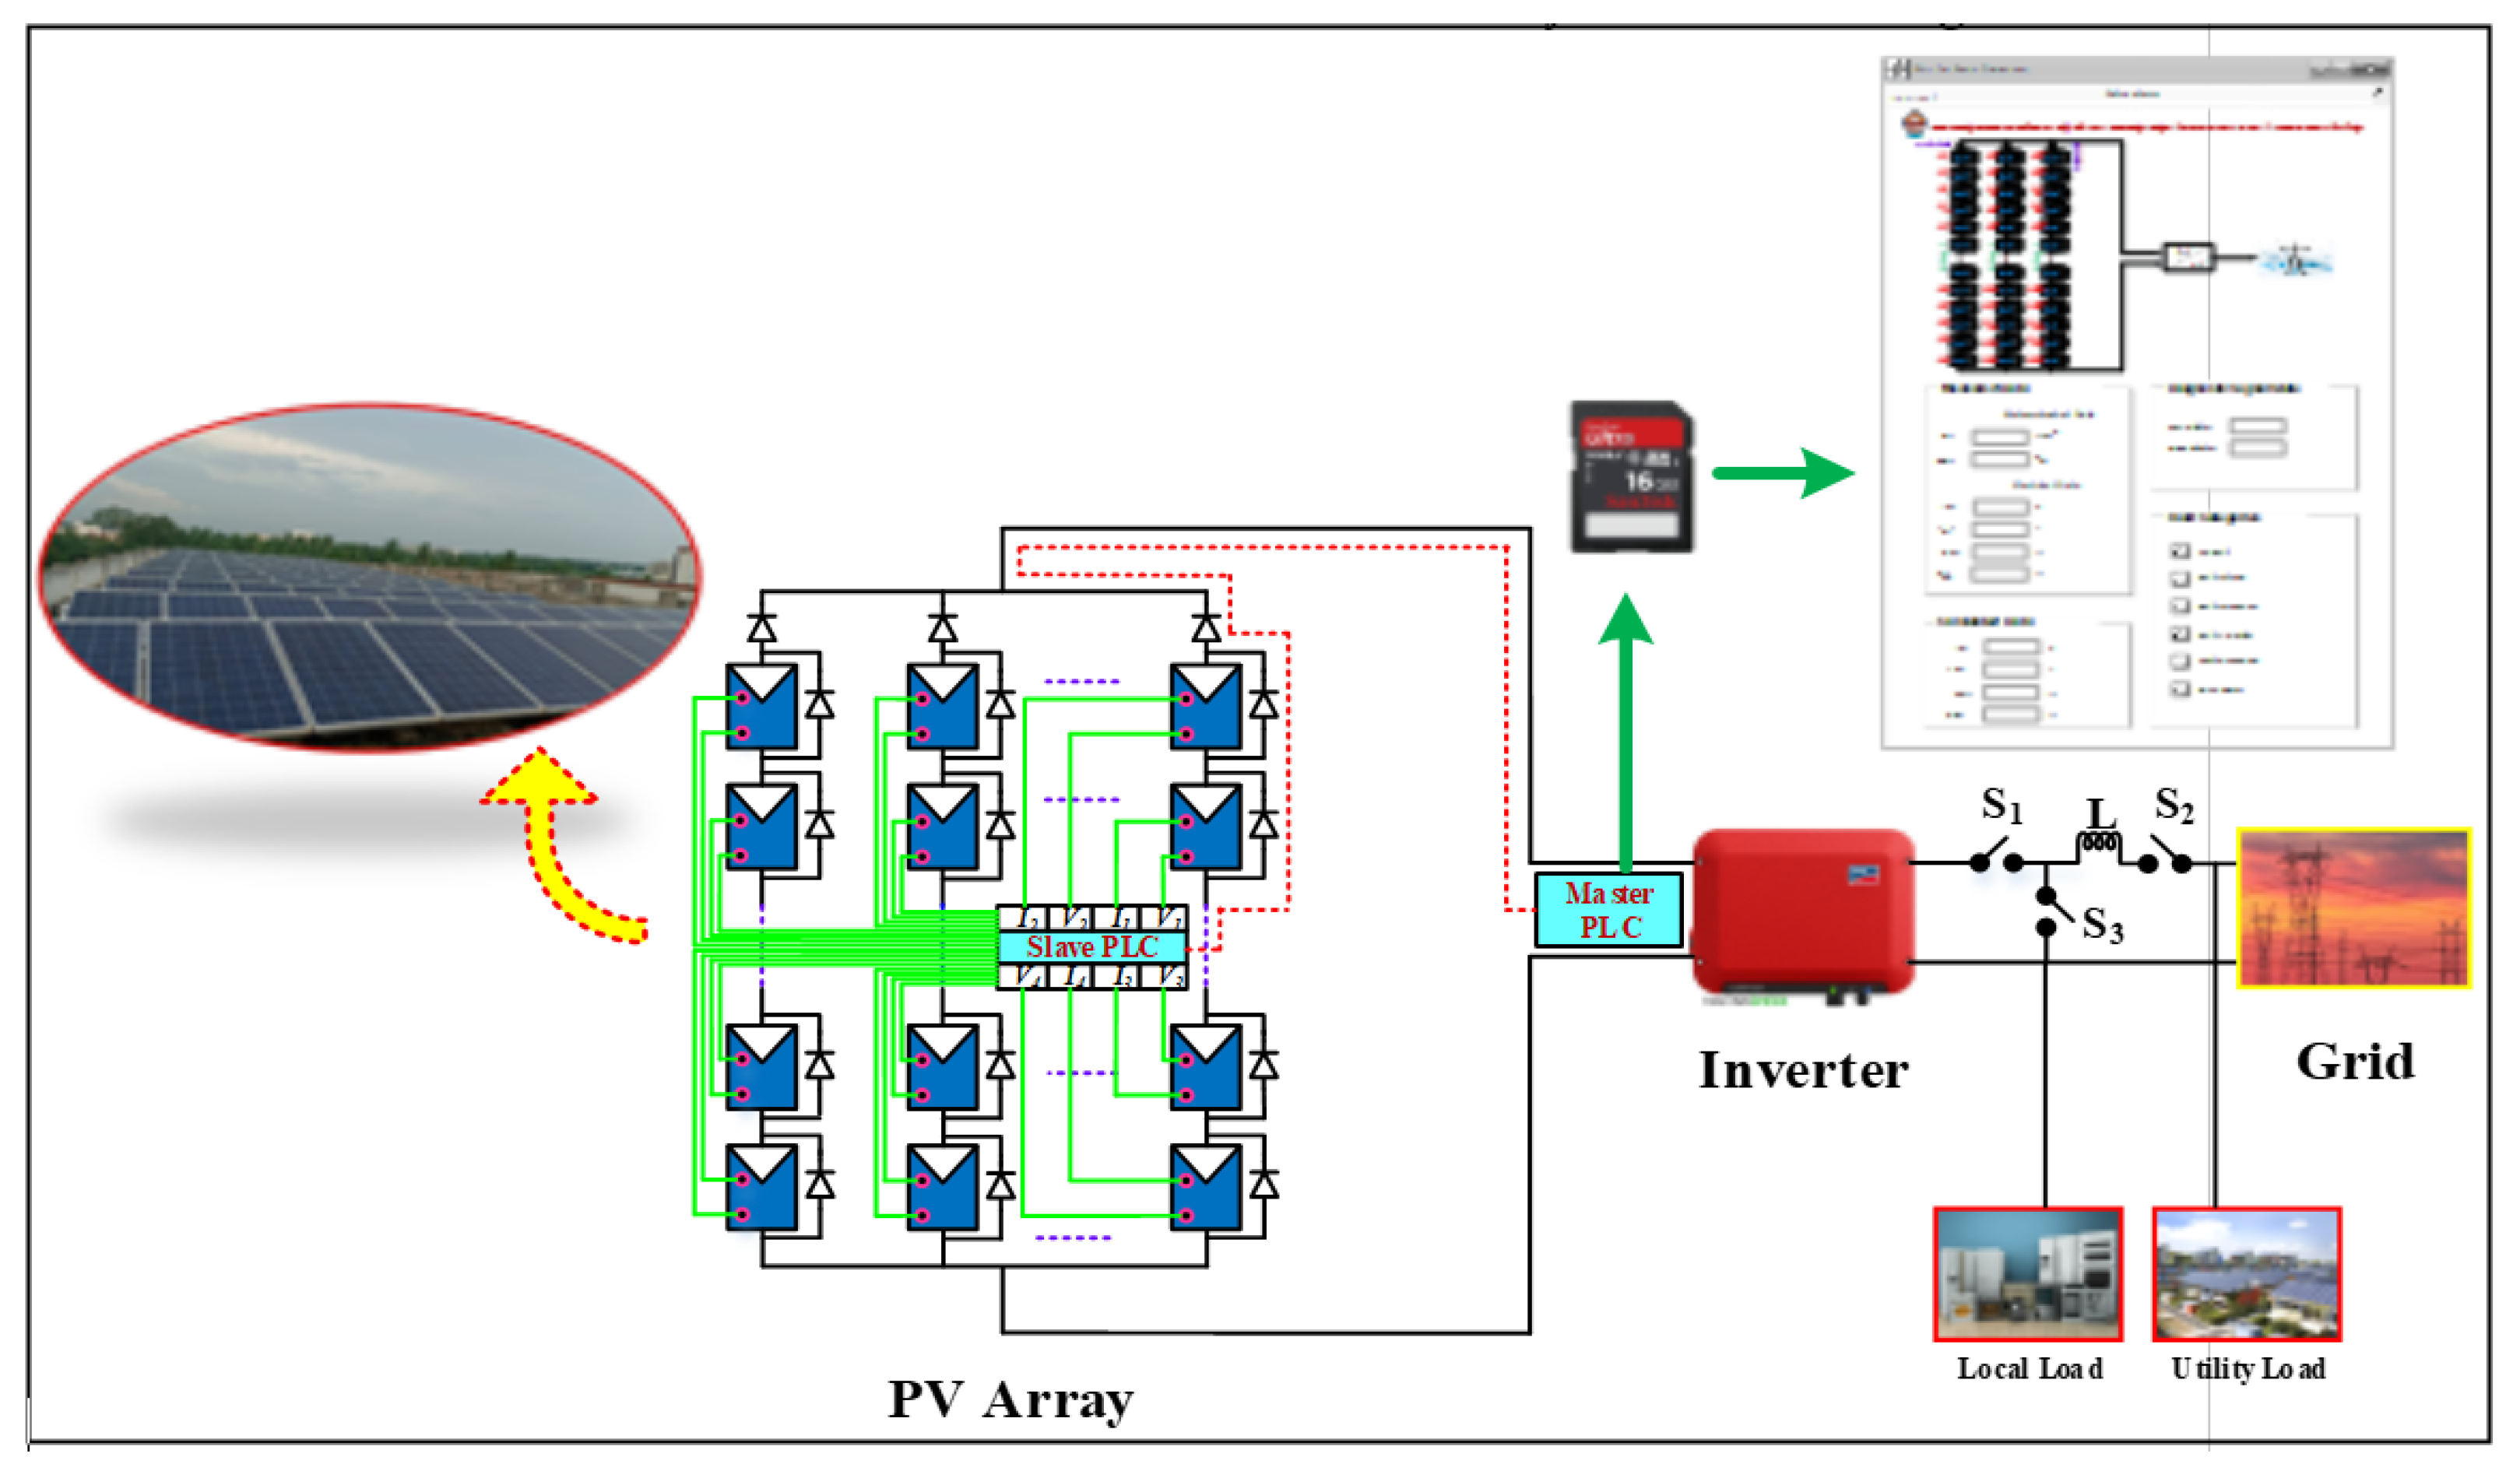
Figure 1. Block diagram of a system for converting solar energy into electricity with a monitoring system.
Energies 15 07789 g001
Figure 2. Malfunctioning PV string that included (a) short-circuit of one PV module, (b) open-circuit of one PV module, (c) partial shading of one PV module, and (d) bypass diode open-circuiting of one PV module.
Energies 15 07789 g002
Figure 3. Locations of various faults created on a 6 × 3 grid-tied PV array.
Energies 15 07789 g003
Figure 4. Measured versus calculated DC power.
Energies 15 07789 g004
Figure 5. Flowchart for fault detection in PV arrays.
Energies 15 07789 g005
Figure 6. DC simulated power versus measured power (normal operation).
Energies 15 07789 g006
Figure 7. (a) Evolution of diagnostic signal during the no-fault condition; (b) false alarms were seen in the software that was designed; (c) measured PV current; (d) measured PV voltage; (e) fault-free operation observed in the designed tool.
Energies 15 07789 g007aEnergies 15 07789 g007bEnergies 15 07789 g007cEnergies 15 07789 g007d
Figure 8. DC simulated power versus measured power (open-circuit fault operation).
Energies 15 07789 g008
Figure 9. (a) Evolution of diagnostic signal during open-circuit fault condition; (b) measured PV current; (c) measured PV current; (d) faulty module observed in designed tool.
Energies 15 07789 g009aEnergies 15 07789 g009bEnergies 15 07789 g009c
Figure 10. DC simulated power versus measured power (short-circuit fault operation).
Energies 15 07789 g010
Figure 11. (a) Evolution of diagnostic signal during short-circuit fault condition; (b) measured PV current; (c) measured PV current; (d) faulty module observed in designed tool.
Energies 15 07789 g011aEnergies 15 07789 g011bEnergies 15 07789 g011c
Figure 12. DC simulated power versus measured power (partial shading operation).
Energies 15 07789 g012
Figure 13. (a) Evolution of diagnostic signal during partial shading condition; (b) measured PV current; (c) measured PV current; (d) faulty module observed in designed tool.
Energies 15 07789 g013aEnergies 15 07789 g013bEnergies 15 07789 g013c
Figure 14. DC simulated power versus measured power (inverted bypass diode fault operation).
Energies 15 07789 g014
Figure 15. (a) Evolution of diagnostic signal during inverted bypass fault condition; (b) measured PV current; (c) measured PV current; (d) faulty module observed in designed tool.
Energies 15 07789 g015aEnergies 15 07789 g015bEnergies 15 07789 g015c
Table 1. Measured climatic and electrical data points.
S. NoData PointUnits
1.Global IrradianceW/m2
2.Cell Temperature°C
3.Array VoltageV
4.Array CurrentA
5.Module VoltageV
6.Module CurrentV
7.Inverter Output Voltage V
8.Inverter Output CurrentA
Table 2. Various types of faults in PV arrays.
Type of FaultReason
Short-circuit
  • An insufficient amount of cross-linking or contamination on the cell surface might lead to delamination of the cell membrane. When an air bubble is formed in the laminate, there is a risk that humidity may build up, which might lead to short circuits. This defect can be severe because of these factors [37,38].
  • Manufacturing flaws or poor solar cell connections [39,40].
Open-circuit
  • Physical failure of panel–panel cables or joints, things falling on PV panels, and loose termination of cables, as well as plugging and unplugging connections at junction boxes [41,42].
Partial Shading (with and without bypass diode)
  • Clouds moving across the area may cast a partial shadow on PV modules, which are located nearby trees and structures [43,44].
Inverted bypass diode
  • Bad connection made by the operator [45,46]
Table 3. Comparative results between the proposed method and the one presented in Ref. [31].
Type of FaultMethod Based on Power Losses AnalysisProposed Method
String-I with module-1 is open-circuitedFaulty stringString-1 MI1 module is open-circuited
String-II with module-4 is short-circuitedFaulty stringString-2 MII4 module is short-circuited
String-III with module-6 is partially shadedFaulty stringString-3 MIII6 module is partially shaded
String-I with module-6 has inverted bypass diodeFaulty stringString-2 MII4 module has inverted bypass diode
Publisher’s Note: MDPI stays neutral with regard to jurisdictional claims in published maps and institutional affiliations.