
The Use of Solar Energy by Households and Energy Cooperatives in Post-War Ukraine: Lessons Learned from Austria


Abstract
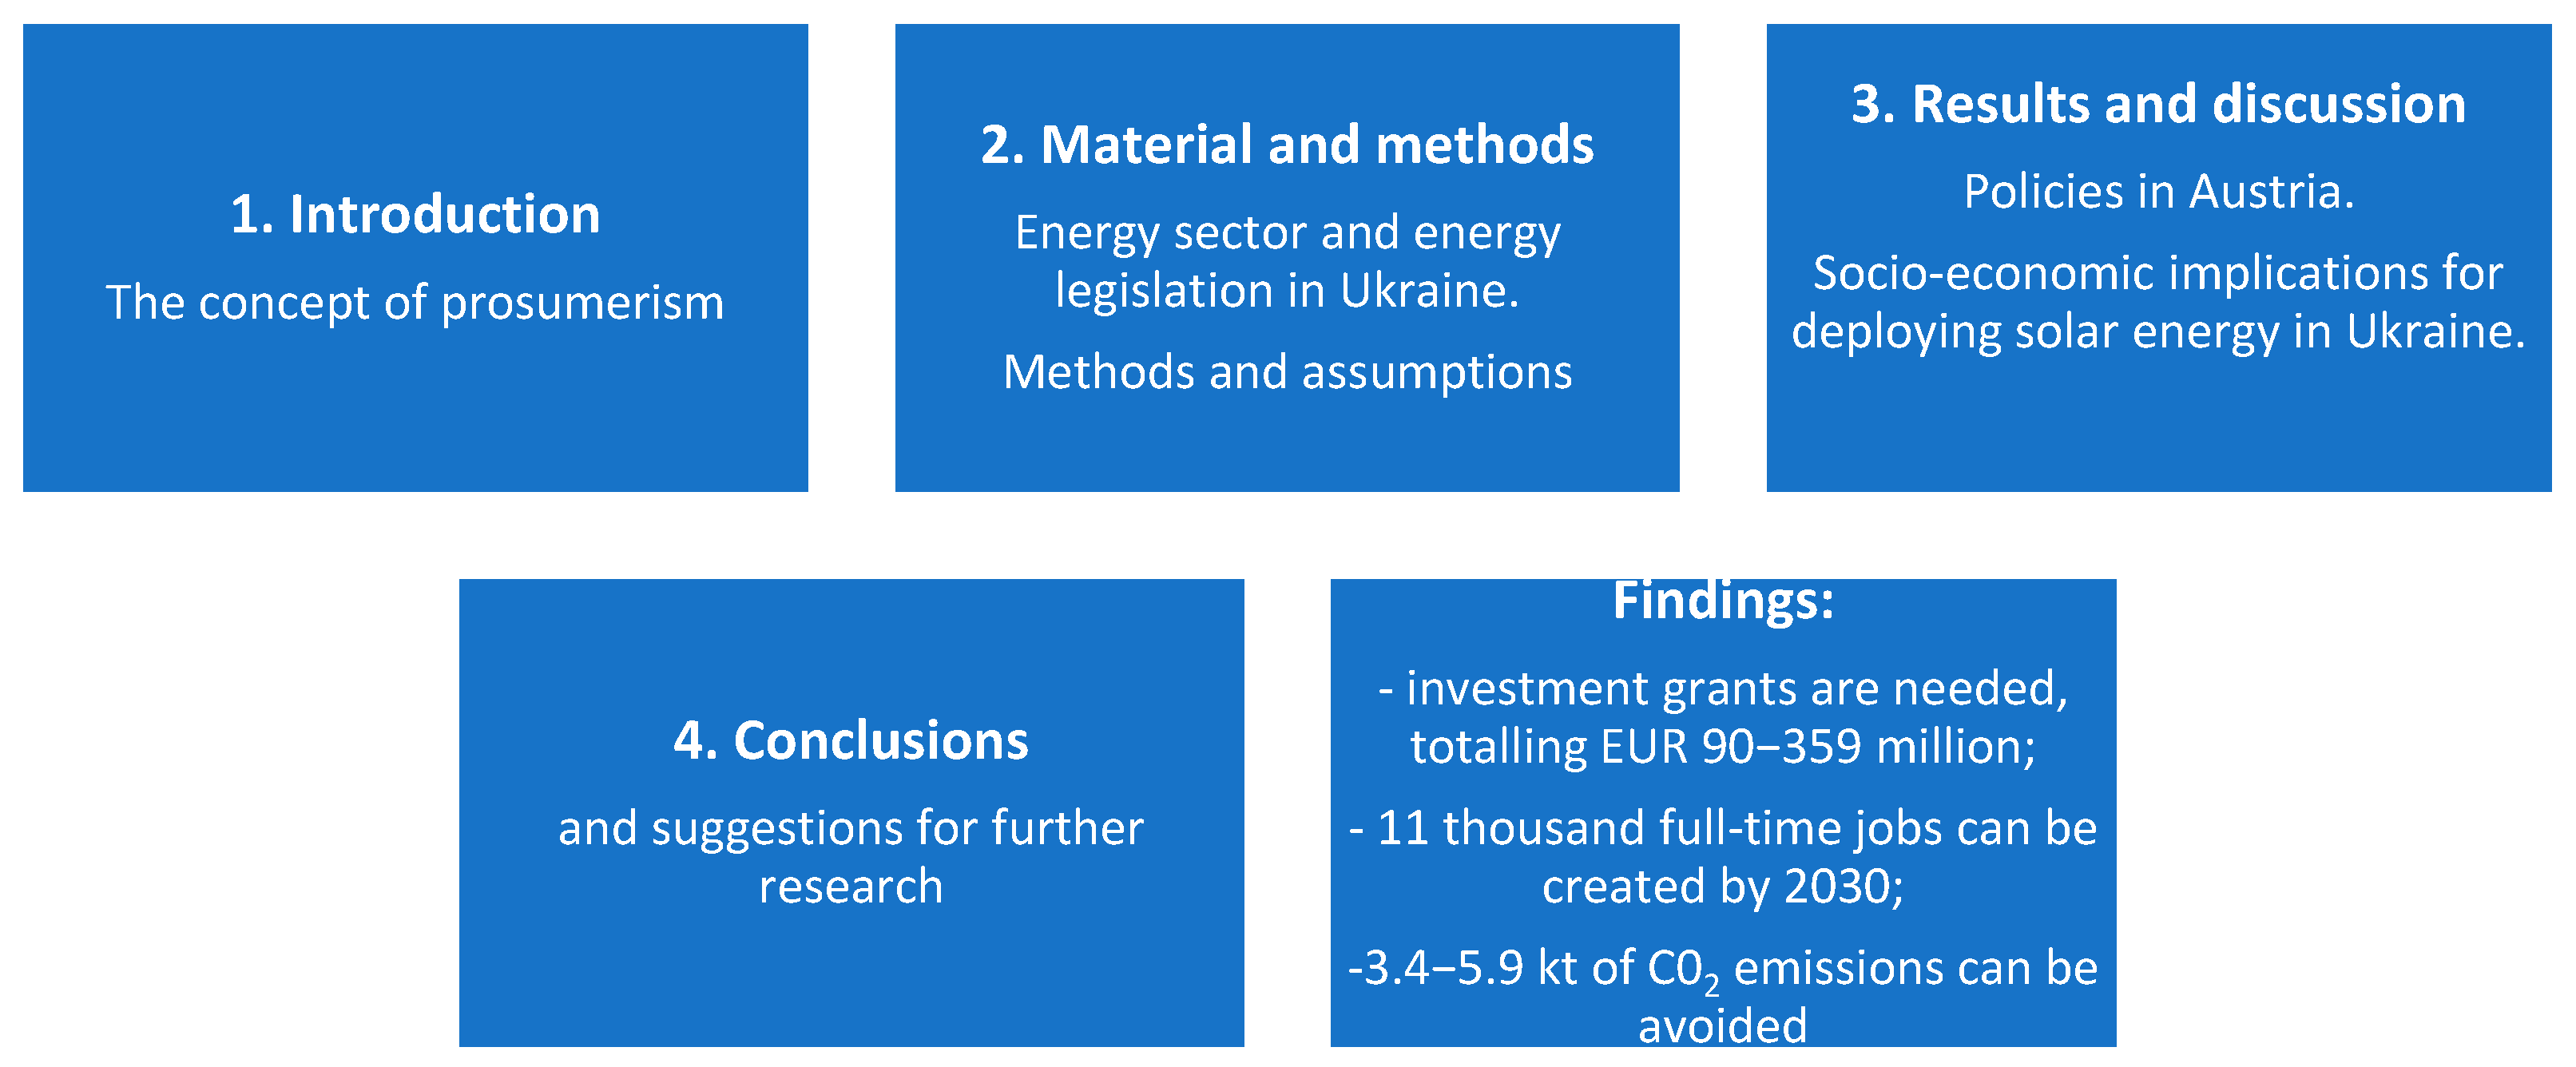
:1. Introduction
- financial, i.e., lack of financial resources or insufficient support programs;
- technical, i.e., inflexible, obsolete, or sometimes even nonexistent energy infrastructure;
- legislative, i.e., poorly tailored or nonexistent legislation;
- social, i.e., insufficient public acceptance due to fear of new technology, “not-in-my-backyard” approach, coupled with insufficient ability to self-organize as a team.
2. Materials and Methods
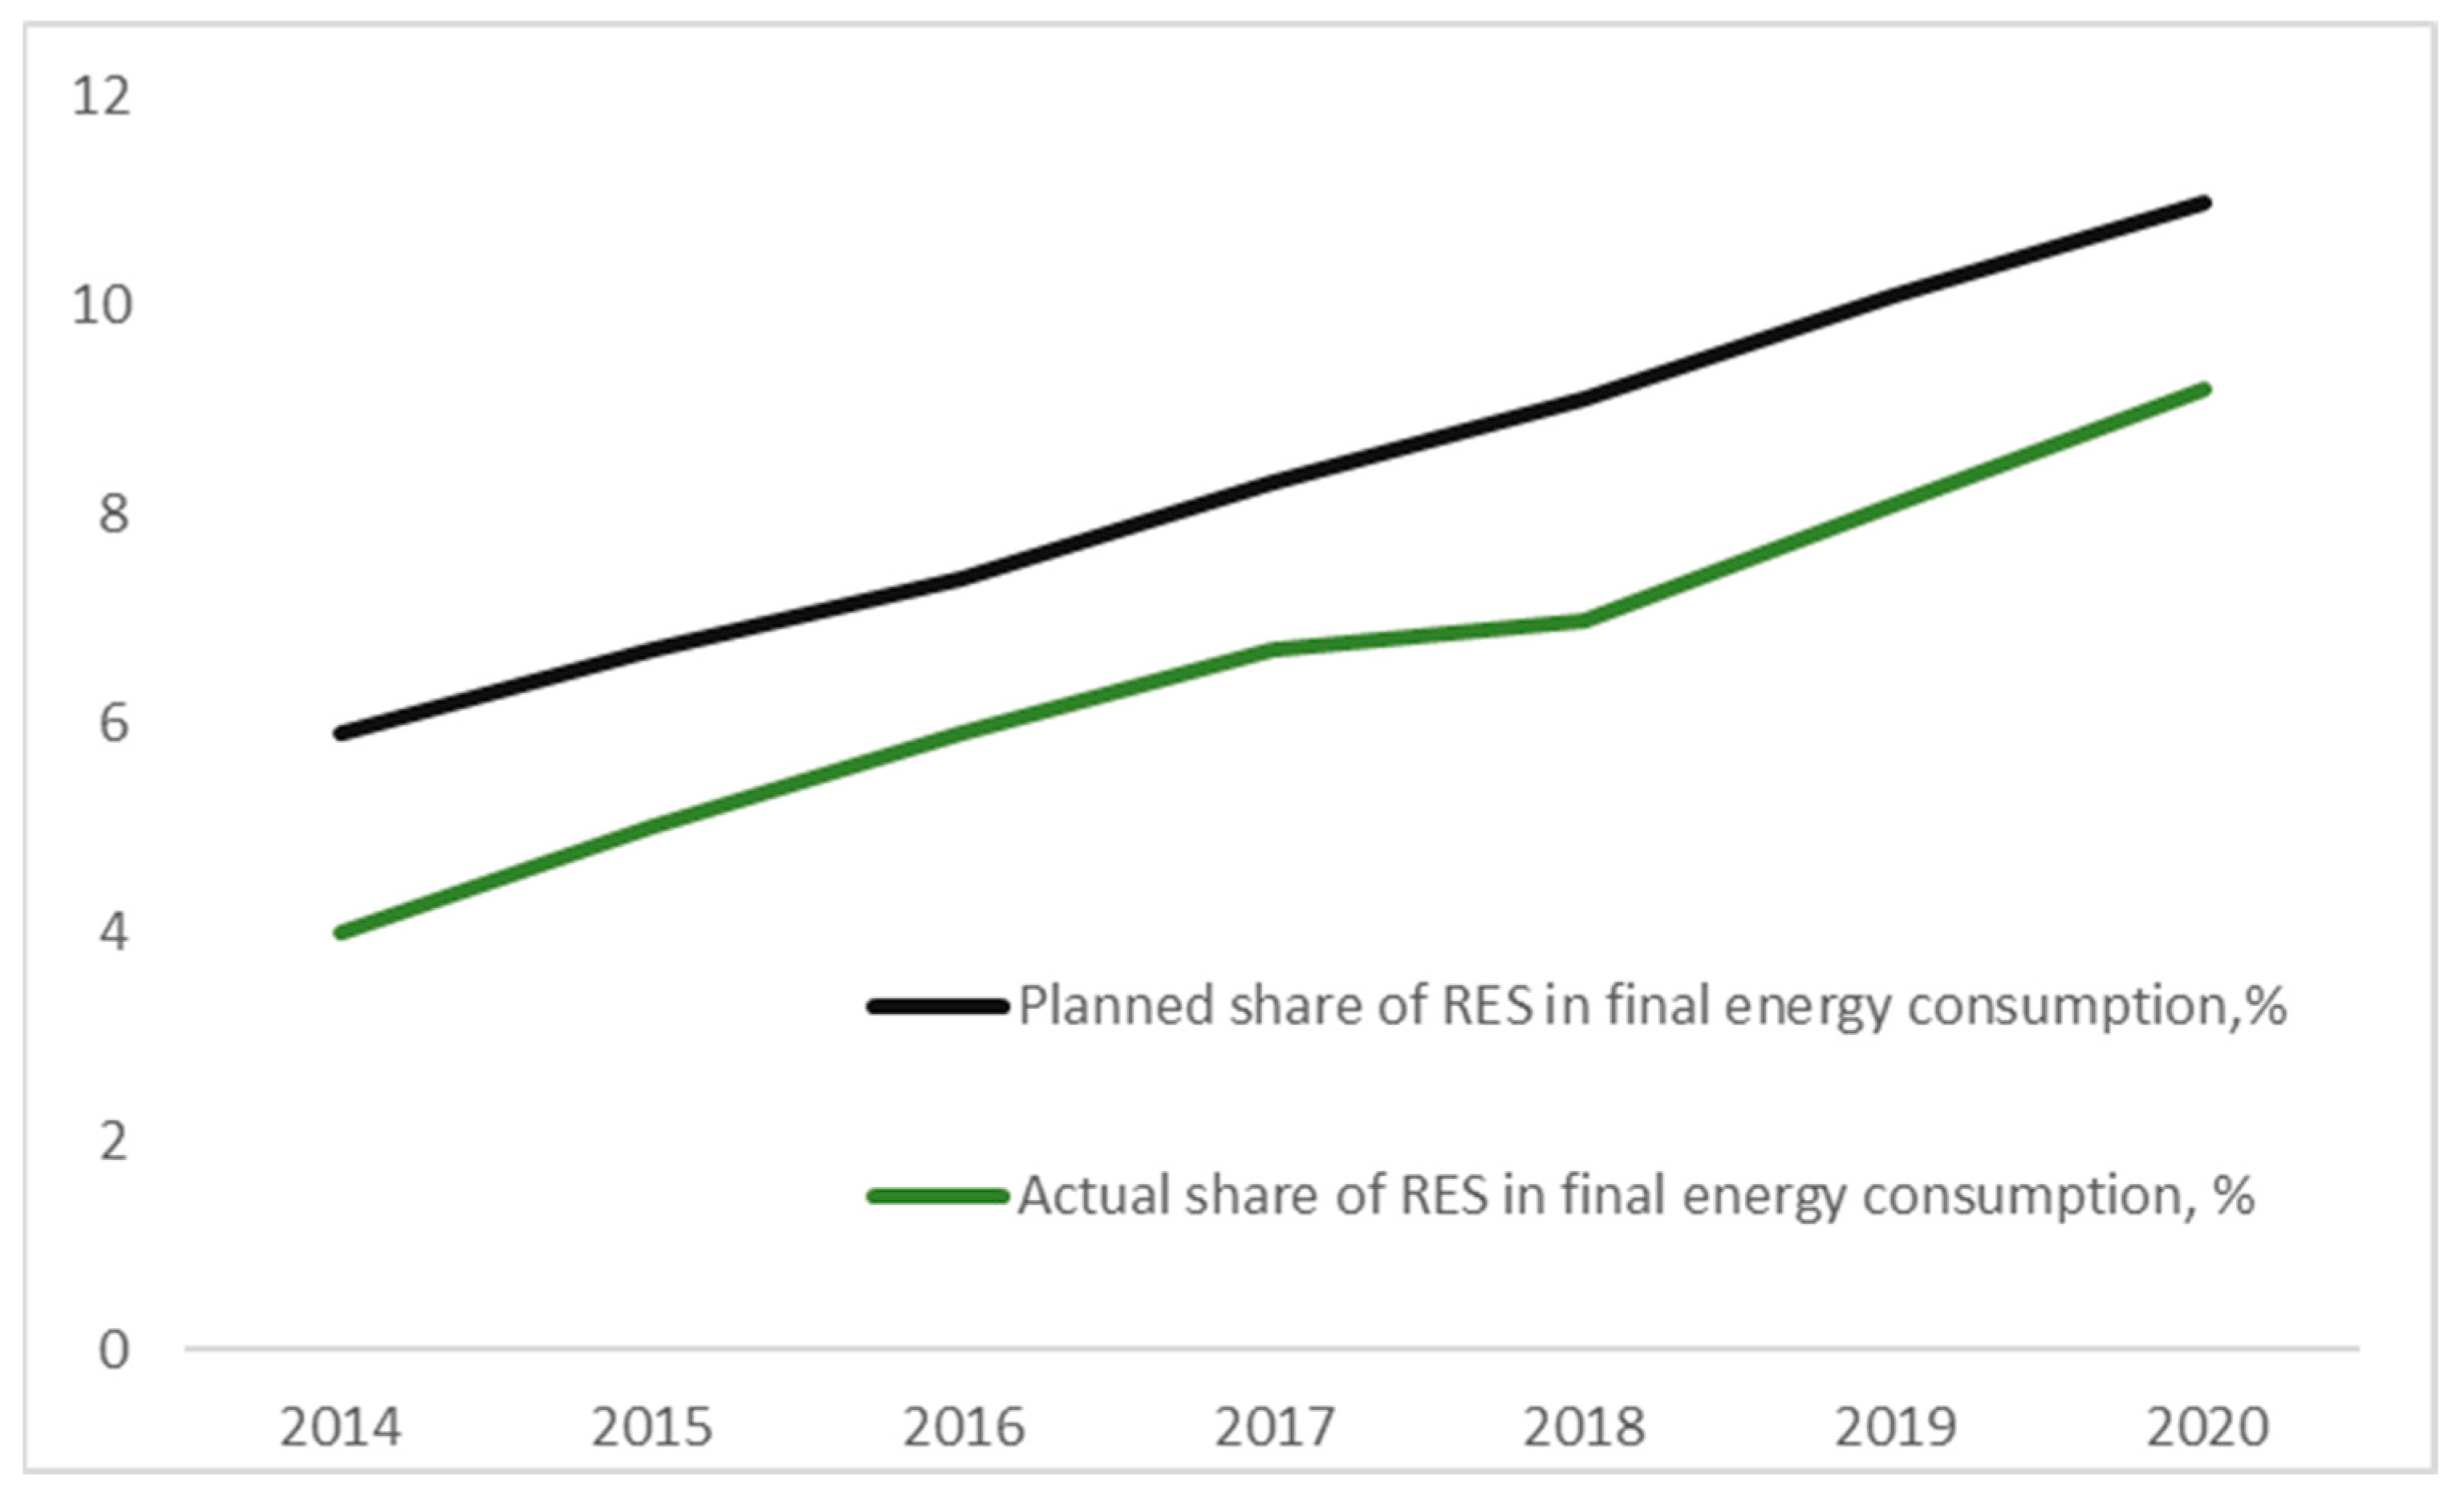
2.1. Energy Sector and Energy Legislation in Ukraine
- National Renewable Energy Action Plan until 2020 (2014) [19];
- Ukraine’s Updated NDC to the UNFCCC (2021) [20];
- State Climate Policy Implementation until 2030 (2016) [21];
- Action Plan to Implement the Concept of State Climate Policy (2017) [22];
- Energy Strategy of Ukraine until 2035 (2017) [23];
- Draft of Ukraine’s National Action Plan for the Development of Renewable Energy until 2030 [24].
2.2. Methods and Assumptions
- The household produces “green” electricity, consumes some part of it, and sells the remainder to the grid against the FIT, i.e., the household is the prosumer. The cost of “gray” electricity is EUR 0.053/kWh as of July 2022.
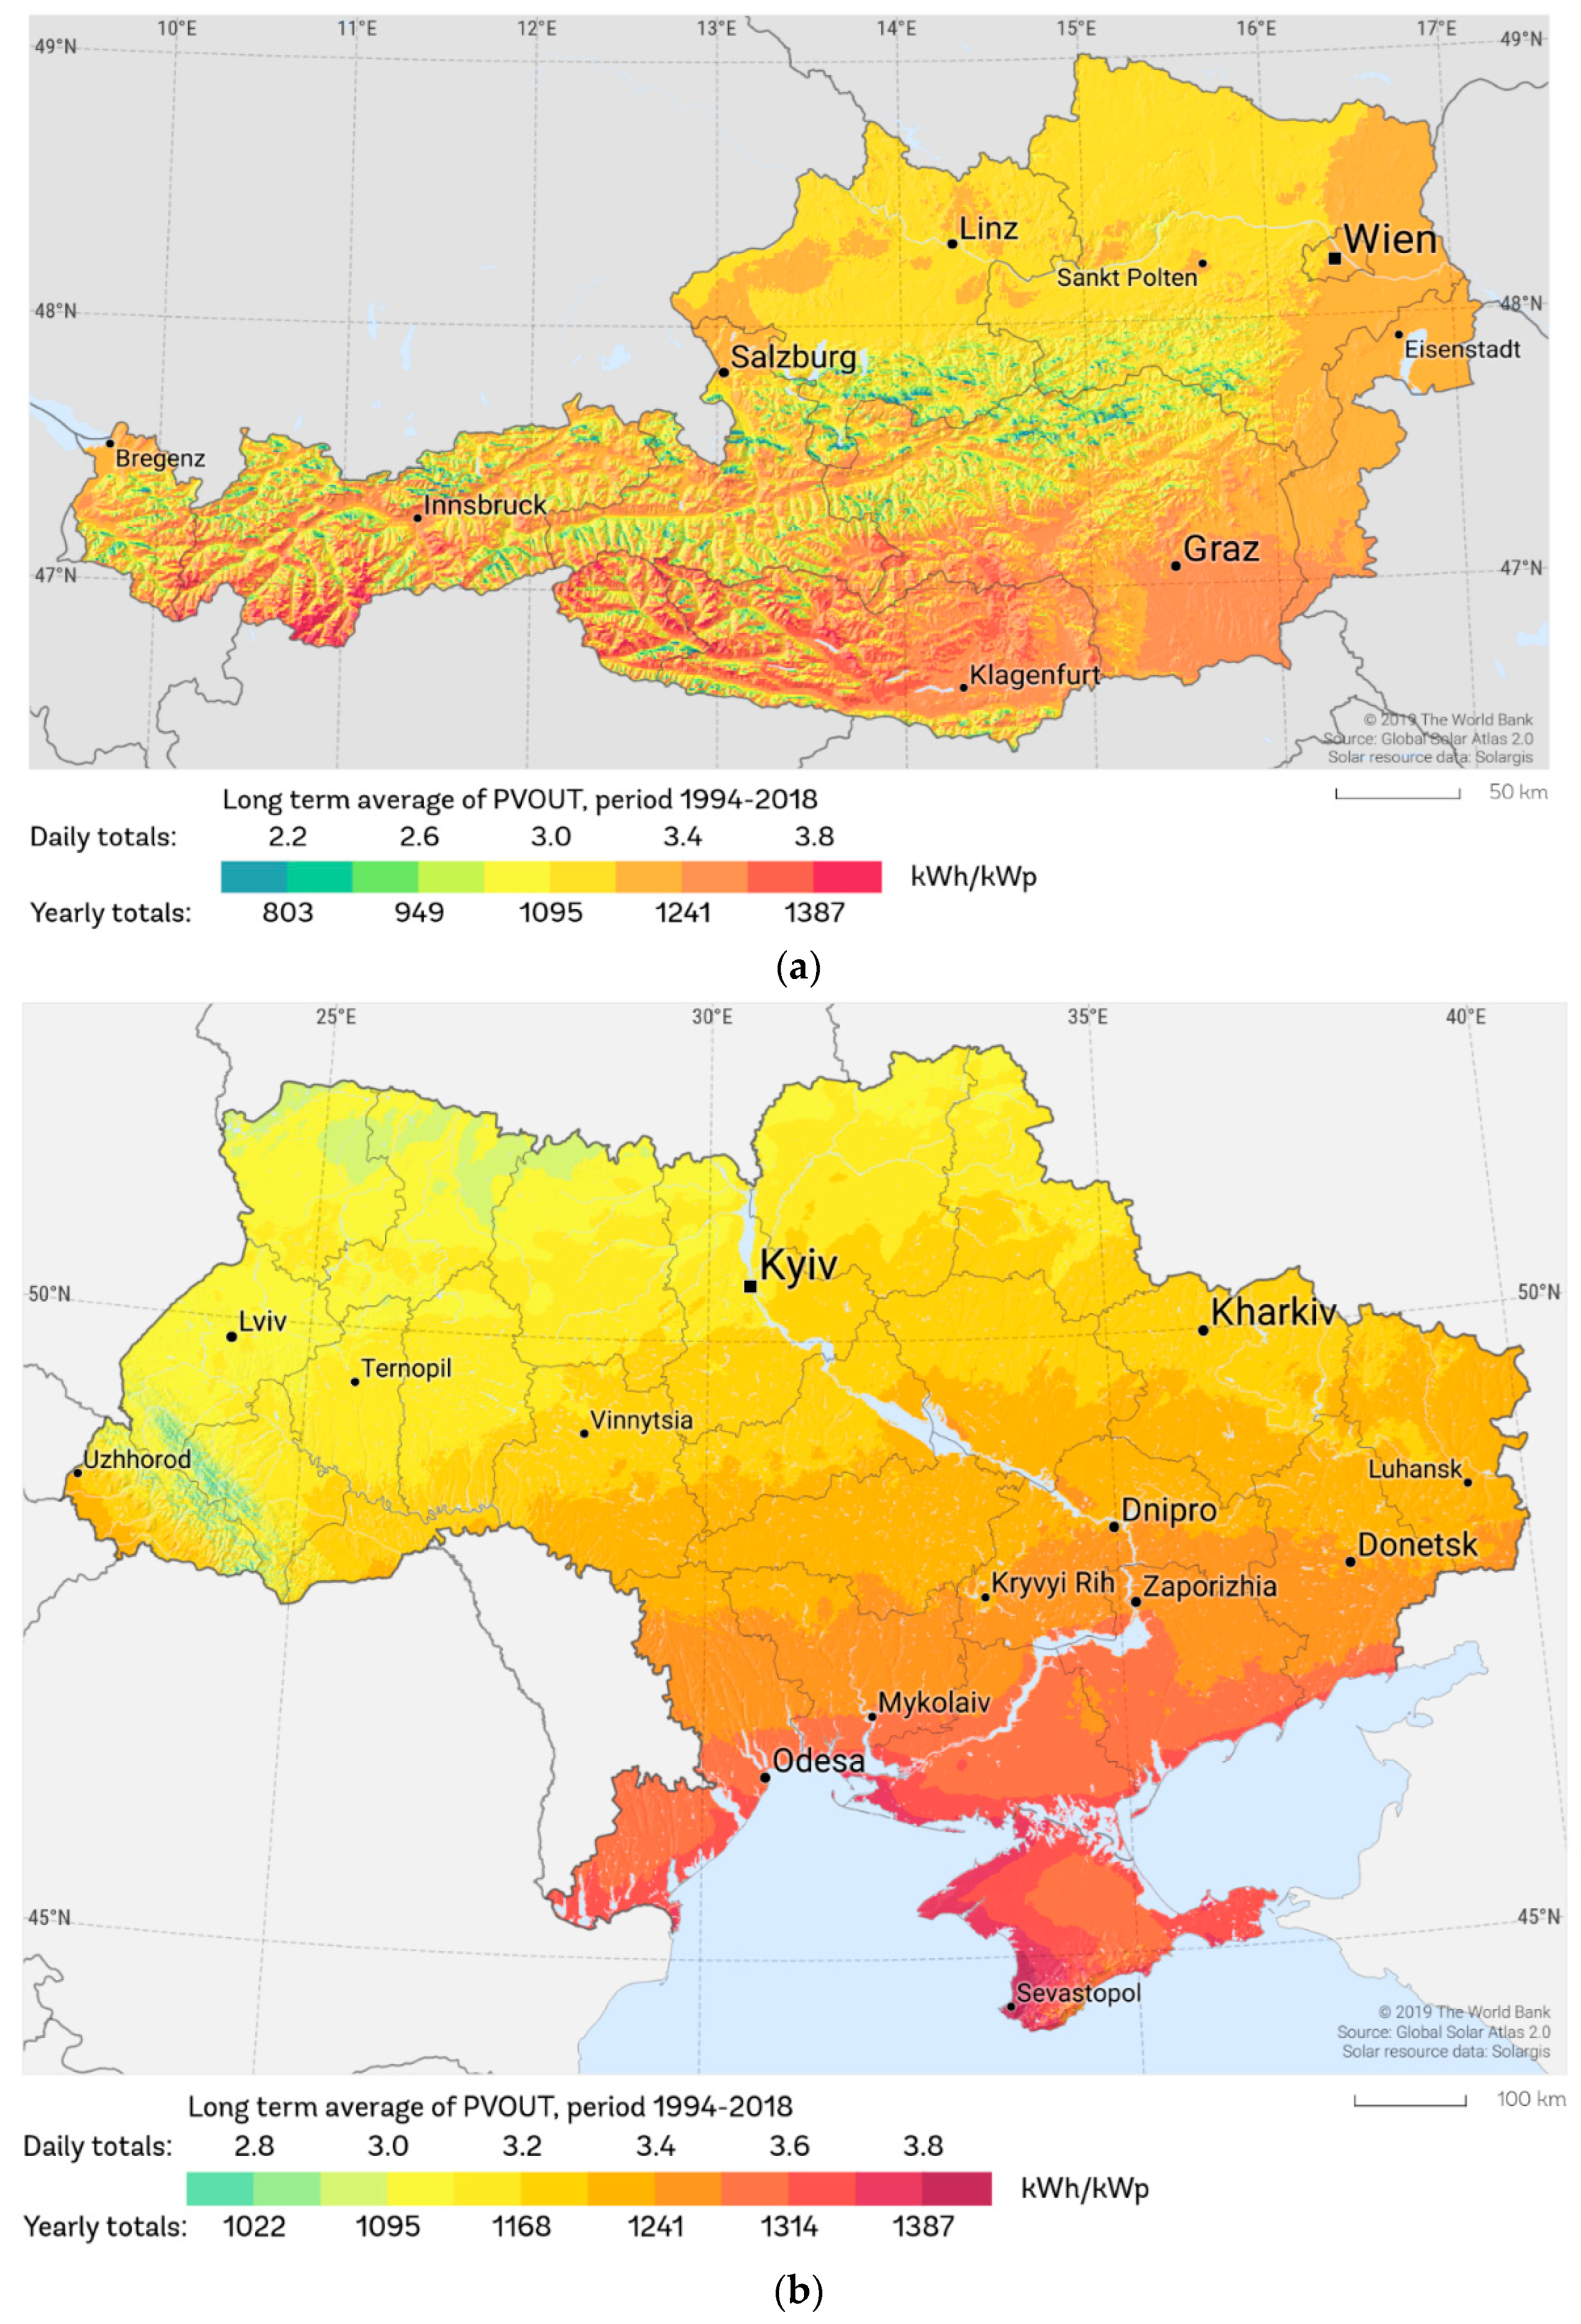
- The average annual capacity factor for rooftop solar PV in conditions in Ukraine is 14.1% (in summer it is 23%, and in winter it is 2–3%) [28]. This capacity factor results in 61,758 kWh of yearly electricity output for a 50 kW PV solar installation in Ukraine. According to IRENA, the global average capacity factor is 24.2%.
- The investment cost is EUR 600/kW.
- The average monthly electricity consumption per household in Ukraine is 168 kWh (compared to the average of 303 kWh in the EU) [29].
3. Results and Discussion
3.1. Policies to Stimulate Development of Household Solar Energy in Austria
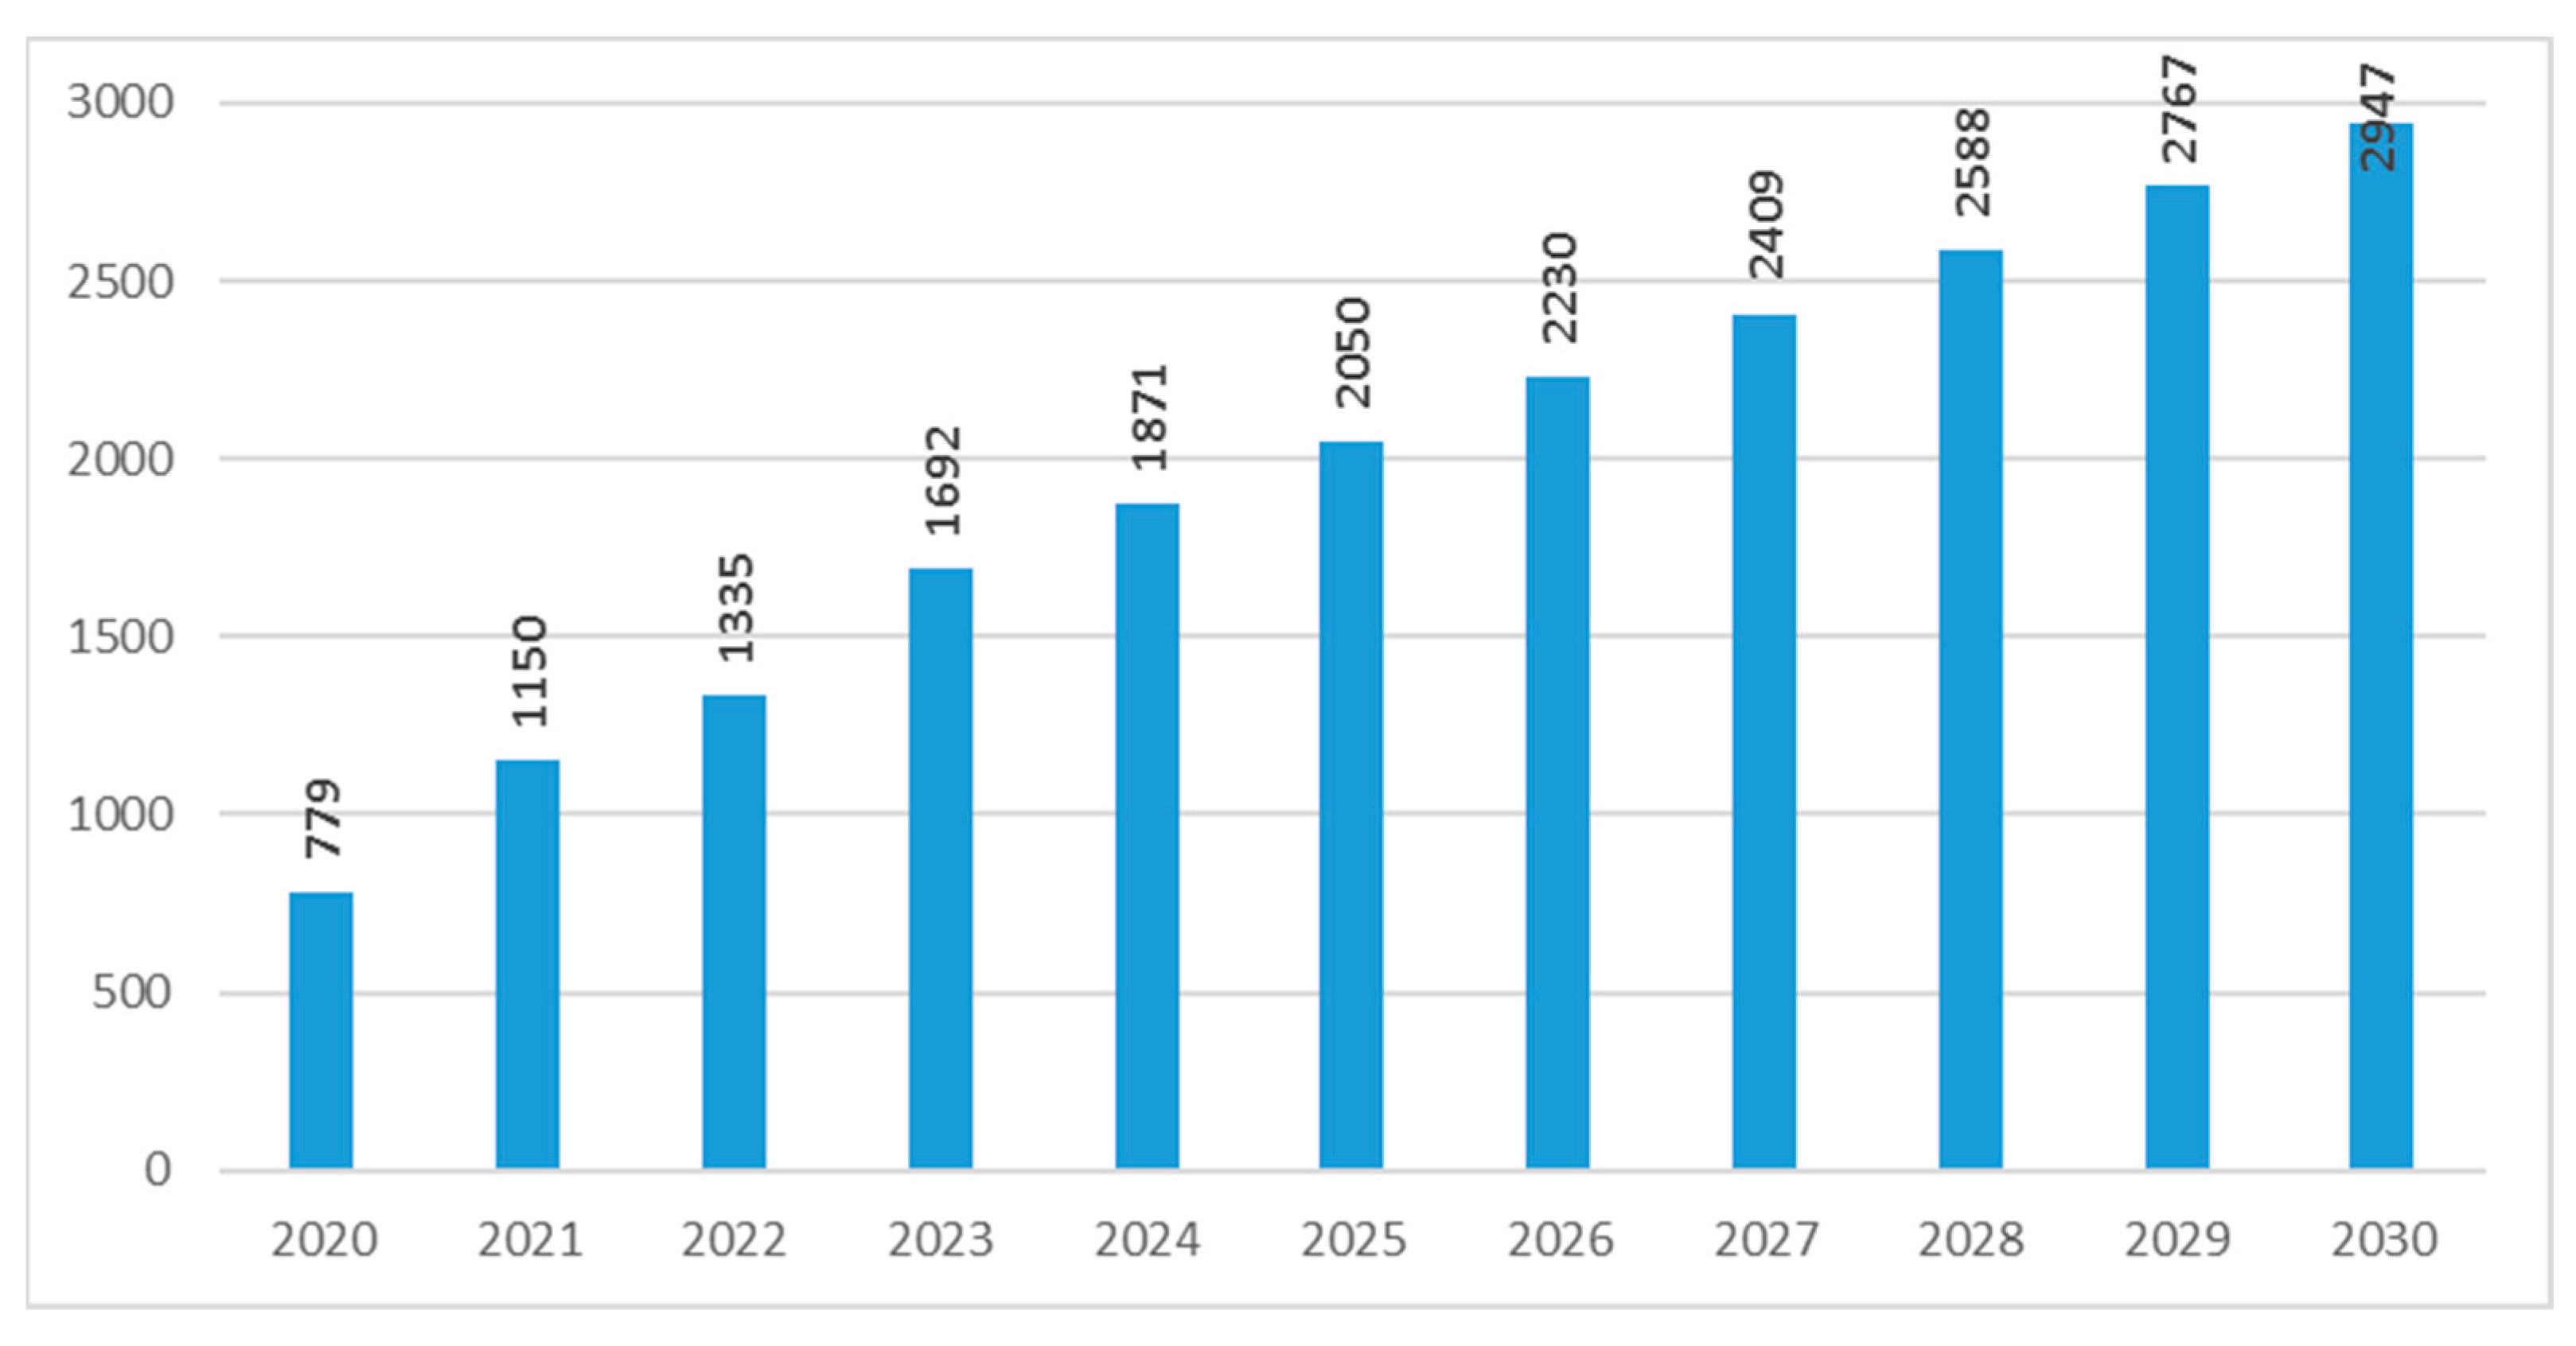
3.2. Socio-Economic Implications for Deploying Solar Energy by Households and Energy Cooperatives in Ukraine
3.3. Potential CO2 Emissions Reductions
4. Conclusions
Author Contributions
Funding
Data Availability Statement
Conflicts of Interest
References
- National Economic Strategy for the Period up to 2030. Available online: https://www.kmu.gov.ua/npas/pro-zatverdzhennya-nacionalnoyi-eko-a179?fbclid=IwAR3UzvCLmYh6rPl7UZFnWvMgHf5XPPctXSFQKEOsBraT1qGph2r7_Vl74eM (accessed on 1 August 2022).
- Toffler, A. The Third Wave; Bantam Books: New York, NY, USA, 1981; ISBN 0-553-24698-4. [Google Scholar]
- European Commission. Clean Energy for all Europeans Package (Winter Package). Available online: https://ec.europa.eu/energy/en/topics/energy-strategy-and-energy-union/clean-energy-all-europeans (accessed on 1 August 2022).
- Zinchenko, A.; Kunbuttayeva, A. Small Participants of RES-Market in Ukraine. Heinrich Boell Schtiftung in Ukraine. Available online: https://ua.boell.org/uk/2020/08/26/mali-uchasniki-vde-rinku-v-ukraini (accessed on 1 August 2022).
- A Fight Over Rooftop Solar Threatens California’s Climate Goals. Available online: https://www.nytimes.com/2022/01/24/business/energy-environment/california-rooftop-solar-utilities.html?fbclid=IwAR34RhAmZnUPJQYnu_zdc5NoCq6fNiM2BPoBBg80lwp7MPFwc1yx78rT0B8 (accessed on 1 August 2022).
- Olkkonen, L.; Korjonen-Kuusipuro, K.; Grönberg, I. Redefining a stakeholder relation: Finnish energy ‘prosumers’ as co-producers. Environ. Innov. Soc. Transit. 2016, 24, 57–66. [Google Scholar] [CrossRef]
- Goulden, M.; Bedwell, B.; Rennick-Egglestone, S.; Rodden, T.; Spence, A. Smart grids, smart users? The role of the user in demand side management. Energy Res. Soc. Sci. 2014, 2, 21–29. [Google Scholar] [CrossRef]
- Prosumers’ Role in the Future Energy System. A Position Paper. FME CenSES. 2018. Available online: https://www.ntnu.edu/documents/1276062818/1283878281/CenSES%2Bposition%2Bpaper%2Bprosumer%2BFINAL%2B-%2BLanguage%2Bchecked.pdf/6a4406de-53ae-753c-24b2-94579cbfb41e?t=1627384005838 (accessed on 1 August 2022).
- Solar Resource Maps and GIS Data for 200+ Countries. Obtained from the “Global Solar Atlas 2.0, A Free, Web-Based Application Is Developed and Operated by the Company Solargis s.r.o. on Behalf of the World Bank Group, Utilizing Solargis Data, with Funding Provided by the Energy Sector Management Assistance Program (ESMAP). Available online: https://solargis.com/maps-and-gis-data/overview (accessed on 1 August 2022).
- State Statistics Service of Ukraine. Number of Population and Average during the Years. Available online: http://www.ukrstat.gov.ua (accessed on 1 August 2022).
- BP Statistical Review of World Energy 2021, 70th ed. Available online: https://www.bp.com/content/dam/bp/business-sites/en/global/corporate/pdfs/energy-economics/statistical-review/bp-stats-review-2021-full-report.pdf (accessed on 1 August 2022).
- Energy Sector of Ukraine 2021. Baker Tilly, CMS. 2022. Available online: https://businessviews.com.ua/energy-of-ukraine-2021-eng/ (accessed on 1 August 2022).
- Invest-Divest 2021: A Decade of Progress Towards a Just Climate Future. Available online: https://divestmentdatabase.org/wp-content/uploads/2021/10/DivestInvestReport2021.pdf (accessed on 26 August 2022).
- State Agency for Energy Efficiency and Energy Saving of Ukraine. Reaching the Targets of National Action Plan on Renewable Energy until 2020. Available online: https://saee.gov.ua/uk/news/4043 (accessed on 1 August 2022).
- Ahamer, G. How to promote renewable energies to the public sphere in Eastern Europe. Int. J. Glob. Energy Issues 2021, 43, 477–503. [Google Scholar] [CrossRef]
- Ahamer, G. Major obstacles for implementing renewable energies in Ukraine. Int. J. Glob. Energy Issues 2021, 43, 664–691. [Google Scholar] [CrossRef]
- Ukrenergo. The Installed Capacity of Energy System of Ukraine as of 01/2022. Available online: https://ua.energy/vstanovlena-potuzhnist-energosystemy-ukrayiny/ (accessed on 1 August 2022).
- Ministry of Environment and Natural Resources of Ukraine. Analytical Review of the Updated Nationally Determined Contribution of Ukraine to the Paris Agreement. 2021. Available online: https://mepr.gov.ua/files/images/2021/29042021/Analytical%20Report_%20Project_EN.PDF (accessed on 1 August 2022).
- National Renewable Energy Action Plan until 2020 (2014). Available online: https://zakon.rada.gov.ua/laws/show/902-2014-p#Text (accessed on 2 August 2022).
- Ukraine’s Updated NDC to the UNFCCC. Available online: https://unfccc.int/NDCREG (accessed on 2 August 2022).
- State Climate Policy Implementation until 2030. Available online: https://zakon.rada.gov.ua/laws/show/932-2016-p#Text (accessed on 2 August 2022).
- Action Plan to Implement the Concept on State Climate Policy. Available online: https://zakon.rada.gov.ua/laws/show/878-2017-p#Text (accessed on 2 August 2022).
- Energy Strategy of Ukraine until 2035. Available online: https://zakon.rada.gov.ua/laws/show/605-2017-p;#Text (accessed on 2 August 2022).
- State Agency for Energy Efficiency and Energy Saving of Ukraine. Draft Order of the Cabinet of Ministers of Ukraine “On the National Action Plan for the Development of Renewable Energy for the Period up to 2030”. 2022. Available online: https://saee.gov.ua/uk/activity/normotvorcha-diyalnist (accessed on 1 August 2022).
- Results of 2020 and Tasks for 2021. Available online: https://www.epravda.com.ua/rus/columns/2020/12/31/669696/ (accessed on 1 August 2022).
- Money from the East, M&A against Inflation and IT Billions. Four Investment Trends in 2022 for Ukraine. Available online: https://forbes.ua/ru/inside/dengi-s-vostoka-mampa-protiv-inflyatsii-i-it-milliardy-chetyre-investtrenda-2022-goda-dlya-ukrainy-17012022-3249 (accessed on 1 August 2022).
- Rasmussen, H.C. System Analysis of a Solar-and Windpower Plant for Nordic Remote Locations. In Energy for Rural and Island Communities; Pergamon: Inverness, UK, 1986; pp. 45–52. [Google Scholar] [CrossRef]
- The Changeable Sun and Fair Wind. Available online: https://e-b.com.ua/izmencivoe-solnce-i-poputnyi-veter-3299 (accessed on 1 August 2022).
- All-Ukrainian Information and Statistical Information of European Institutions in the Field of Electricity, 05.04.2021. Available online: https://www.nerc.gov.ua/sferi-diyalnosti/elektroenergiya/energetichni-pidpriyemstva/zagalnoukrayinska-informaciya-ta-statistichna-informaciya-yevropejskih-institucij-u-sferi-elektrichnoyi-energiyi/zagalnoukrayinska-informaciya-ta-statistichna-informaciya-yevropejskih-institucij-u-sferi-elektrichnoyi-energiyi-05042021 (accessed on 1 August 2022).
- Rutovitz, J.; Dominish, E.; Downes, J. Calculating global energy sector jobs: 2015 methodology. In Prepared for Greenpeace International by the Institute for Sustainable Futures; University of Technology Sydney: Sydney, Australia, 2015. [Google Scholar]
- Ram, M.; Aghahosseini, A.; Breyer, C. Job creation during the global energy transition towards 100% renewable power system by 2050. Technol. Forecast. Soc. Chang. 2020, 151, 119682. [Google Scholar] [CrossRef]
- Order of the National Agency of Environmental Investment of Ukraine Dated 12.05.2011 #75 On Approval of Specific Emissions Indicators Carbon Dioxide in 2011. Available online: https://zakon.rada.gov.ua/rada/show/v0075825-11#Text (accessed on 1 August 2022).
- Zachmann, G. (Ed.) Reaching Ukraine’s Energy and Climate Targets. In Low Carbon Ukraine; Berlin Economics: Berline, Germany, 2021; Available online: https://www.lowcarbonukraine.com/wp-content/uploads/LCU_Reaching-Ukraines-energy-and-climate-targets.pdf?fbclid=IwAR2K8-8-SDD8zO9T24QNBdmzm-gl2MH1HjgLdB0pwybHp5LlBmwrgnW3jc0 (accessed on 1 August 2022).
- Lo Vullo, E.; Muntean, M.; Duerr, M.; Kona, A.; Bertoldi, P.; European Commission, Joint Research Centre (JRC) [Dataset] PID. GHG Emission Factors for Electricity Consumption. 2020. Available online: http://data.europa.eu/89h/919df040-0252-4e4e-ad82-c054896e1641 (accessed on 1 August 2022).
- European Commission, Joint Research Centre (JRC) [Dataset] PID. EC (2022) European Commission, Joint Research Centre: CoM Default Emission Factors. 2022. Available online: http://data.europa.eu/89h/72fac2b2-aa63-4dc1-ade3-4e56b37e4b7c (accessed on 1 August 2022).
- Prosumers for the Energy Union: Mainstreaming Active Participation of Citizens in the Energy Transition D3.3 Report: Principles for Prosumer Policy Options Recommendations to Strengthen Prosumers and Energy Communities in NECPs and other EU, National and Local Policies. Horizon 2020 (H2020-LCE-2017) Grant Agreement N°764056. Available online: https://proseu.eu/sites/default/files/Resources/PROSEU_Task%203.3_Principles%20for%20Prosumer%20Policy%20Options_2019-09-30.pdf (accessed on 1 August 2022).
- Incentives for Small Solar-Plus-Storage in Austria and Italy. Available online: https://www.pv-magazine.com/2020/03/11/incentives-for-small-solar-plus-storage-in-austria-and-italy/ (accessed on 1 August 2022).
- Austrian Government Increases Photovoltaic Subsidies. Available online: https://www.pveurope.eu/financing/policy-austrian-government-increases-photovoltaic-subsidies (accessed on 1 August 2022).
- Elektrizitätswirtschafts- und -Organisationsgesetz, BGBl. I Nr. 108/2017. Österreichische Nationalrat 07 26, 2017. Available online: https://www.ris.bka.gv.at/eli/bgbl/I/2017/108 (accessed on 11 October 2022).
- Auer, H.; Fleischhacker, A.; Lettner, G.; Moisl, F.; Radl, J.; Schwabeneder, D. PV Prosumer Guidelines. Österreich. Project PVP4Grid. Development of Innovative Self-Consumption and Aggregation Concepts for PV Prosumers to Improve Grid Load and Increase Market Value of PV. 2018. Available online: https://cordis.europa.eu/project/id/764786/results (accessed on 26 August 2022).
- PV Austria. Available online: http://pvaustria.at/sonnenklar_rechner/ (accessed on 26 August 2022).
- Austrian Recovery & Resilience Plan/1. Sustainable Construction/Climate Neutral Transformation—Renewable Expansion Act. Available online: https://www.iea.org/policies/12401-austrian-recovery-resilience-plan-1sustainable-construction-climate-neutral-transformation-renewable-expansion-act (accessed on 1 August 2022).
- State Agency for Energy Efficiency and Energy Saving of Ukraine. Solar Power Plants in Private Households: Development Dynamics. Available online: https://saee.gov.ua/uk/content/sesd?fbclid=IwAR2mTZvBesedy8GeLBJI5Q0J11N5q-MIFK2ixOmfn13mhlTCcKDxf31jpnU (accessed on 1 August 2022).
- European-Ukrainian Energy Agency. Renewable Energy of Ukraine: Monthly Monitoring 01/2022. Available online: https://euea-energyagency.org/wp-content/uploads/2022/02/Zvit-VDE-01.02.2022.pdf (accessed on 1 August 2022).
- Solar Stations Tesla Powerwall Were Installed for the Dispensary in Borodyanka. Available online: https://zaxid.net/dlya_ambulatoriyi_v_borodyantsi_vstanovili_sonyachni_stantsiyi_tesla_powerwall_n1543913 (accessed on 1 August 2022).
- Law of Ukraine “On Electricity Market” dated 13 April 2017 #2019-VIII. Available online: https://zakon.rada.gov.ua/laws/show/2019-19#Text (accessed on 1 August 2022).
- Solar Town. Available online: https://solartown.com.ua/about/#about (accessed on 1 August 2022).
- Trypolska, G. Feed-in tariff in Ukraine: The only driver of renewables’ industry growth? Energy Policy 2012, 45, 645–653. [Google Scholar] [CrossRef]
- Sotnyk, I.; Kurbatova, T.; Blumberga, A.; Kubatko, O.; Kubatko, O. Solar energy development in households: Ways to improve state policy in Ukraine and Latvia. Int. J. Sustain. Energy 2022, in press. [Google Scholar] [CrossRef]
- Ukraine Recovery Conference 2022. Available online: https://www.urc2022.com (accessed on 23 September 2022).
- Energy Community Secretariat’s Energy Transition Tracker. Available online: https://www.energy-community.org/regionalinitiatives/energy/Tracker.html (accessed on 23 September 2022).
- Repko, M. Economy of Ukraine during the War: Will There Be Heat and Light in Winter? Center of Economic Strategy, German Economic Team. 2022. Available online: https://ces.org.ua/ukraine-economy-in-war-times-august/ (accessed on 27 August 2022).
- The Economic Implications of Phasing out Coal in Ukraine by 2030. Available online: https://ua.boell.org/sites/default/files/2021-08/21-08_03_Economic%20implications%20of%20Ukrainian%20coal%20exit.pdf (accessed on 1 August 2022).

| 2020 | 2025 | 2030 | |
|---|---|---|---|
| Regional multipliers | 1.08 | 1.10 | 1.13 |
| Share of local manufacturing, % | 50 | 50 | 50 |
| Mfc., Job-yrs /MW | C&I, Job-yrs/MW | O&M, Jobs/MW | |
|---|---|---|---|
| Solar PV | 6.7 | 26 | 1.4 |
| 30 kW | 50 kW | 200 kW | |||||||
|---|---|---|---|---|---|---|---|---|---|
| FIT until 2025 | FIT in 2025–2029 | Net Billing | FIT until 2025 | FIT in 2025–2029 | Net Billing | FIT until 2025 | FIT in 2025–2029 | Net Billing | |
| Investments, EUR thousand | 18 | 30 | 120 | ||||||
| Electricity output, kWh/year | 37,055 | 61,758 | 247,032 | ||||||
| Own consumption, kWh/year | 2016 | 3024 | 8064 | ||||||
| FIT rate, EUR/kWh | 0.163 | 0.146 | 0 | 0.163 | 0.146 | 0 | 0.163 | 0.146 | 0 |
| Electricity rate, EUR/kWh | 0.053 | 0.053 | 0.06 | 0.053 | 0.053 | 0.06 | 0.053 | 0.053 | 0.06 |
| Simple payback period, years | 3.2 | 3.5 | 8.6 | 3.1 | 3.5 | 8.5 | 3.1 | 3.4 | 8.4 |
| Year | Increment of Installed Capacities, MW | Grant Size | |||
|---|---|---|---|---|---|
| 50 EUR/kW | 100 EUR/kW | 150 EUR/kW | 200 EUR/kW | ||
| 2022 | 185 | 9.3 | 18.5 | 27.8 | 37.0 |
| 2023 | 357 | 17.9 | 35.7 | 53.6 | 71.4 |
| 2024 | 179 | 9.0 | 17.9 | 26.9 | 35.8 |
| 2025 | 179 | 9.0 | 17.9 | 26.9 | 35.8 |
| 2026 | 180 | 9.0 | 18.0 | 27.0 | 36.0 |
| 2027 | 179 | 9.0 | 17.9 | 26.9 | 35.8 |
| 2028 | 179 | 9.0 | 17.9 | 26.9 | 35.8 |
| 2029 | 179 | 9.0 | 17.9 | 26.9 | 35.8 |
| 2030 | 180 | 9.0 | 18.0 | 27.0 | 36.0 |
| Total | 89.9 | 179.7 | 269.6 | 359.4 | |
| Year | Increment of Installed Capacities, MW | Grant Size | |||
|---|---|---|---|---|---|
| 50 EUR/kW | 100 EUR/kW | 150 EUR/kW | 200 EUR/kW | ||
| 2022 | 185 | 101.8 | 92.5 | 83.3 | 74.0 |
| 2023 | 357 | 196.4 | 178.5 | 160.7 | 142.8 |
| 2024 | 179 | 98.5 | 89.5 | 80.6 | 71.6 |
| 2025 | 179 | 98.5 | 89.5 | 80.6 | 71.6 |
| 2026 | 180 | 99.0 | 90.0 | 81.0 | 72.0 |
| 2027 | 179 | 98.5 | 89.5 | 80.6 | 71.6 |
| 2028 | 179 | 98.5 | 89.5 | 80.6 | 71.6 |
| 2029 | 179 | 98.5 | 89.5 | 80.6 | 71.6 |
| 2030 | 180 | 99.0 | 90.0 | 81.0 | 72.0 |
| Total | 988.4 | 898.5 | 808.7 | 718.8 | |
Publisher’s Note: MDPI stays neutral with regard to jurisdictional claims in published maps and institutional affiliations. |
© 2022 by the authors. Licensee MDPI, Basel, Switzerland. This article is an open access article distributed under the terms and conditions of the Creative Commons Attribution (CC BY) license (https://creativecommons.org/licenses/by/4.0/).
Share and Cite
Trypolska, G.; Rosner, A. The Use of Solar Energy by Households and Energy Cooperatives in Post-War Ukraine: Lessons Learned from Austria. Energies 2022, 15, 7610. https://doi.org/10.3390/en15207610
Trypolska G, Rosner A. The Use of Solar Energy by Households and Energy Cooperatives in Post-War Ukraine: Lessons Learned from Austria. Energies. 2022; 15(20):7610. https://doi.org/10.3390/en15207610
Chicago/Turabian StyleTrypolska, Galyna, and Andrzej Rosner. 2022. "The Use of Solar Energy by Households and Energy Cooperatives in Post-War Ukraine: Lessons Learned from Austria" Energies 15, no. 20: 7610. https://doi.org/10.3390/en15207610
APA StyleTrypolska, G., & Rosner, A. (2022). The Use of Solar Energy by Households and Energy Cooperatives in Post-War Ukraine: Lessons Learned from Austria. Energies, 15(20), 7610. https://doi.org/10.3390/en15207610