Review

Overview of the Hydrogen Production by Plasma-Driven Solution Electrolysis

by
Sergii Bespalko
1,* and
Jerzy Mizeraczyk
2
1
Research and Innovation Centre Pro-Akademia, Innowacyjna Street 9/11, 95-050 Konstantynów Łódzki, Poland
2
Department of Marine Electronics, Gdynia Maritime University, Morska Street 83, 81-225 Gdynia, Poland
*
Author to whom correspondence should be addressed.
Energies 2022, 15(20), 7508; https://doi.org/10.3390/en15207508
Submission received: 12 September 2022 / Revised: 7 October 2022 / Accepted: 9 October 2022 / Published: 12 October 2022

Abstract

:
This paper reviews the progress in applying the plasma-driven solution electrolysis (PDSE), which is also referred to as the contact glow-discharge electrolysis (CGDE) or plasma electrolysis, for hydrogen production. The physicochemical processes responsible for the formation of PDSE and effects occurring at the discharge electrode in the cathodic and anodic regimes of the PDSE operation are described. The influence of the PDSE process parameters, especially the discharge polarity, magnitude of the applied voltage, type and concentration of the typical electrolytic solutions (K2CO3, Na2CO3, KOH, NaOH, H2SO4), presence of organic additives (CH3OH, C2H5OH, CH3COOH), temperature of the electrolytic solution, the active length and immersion depth of the discharge electrode into the electrolytic solution, on the energy efficiency (%), energy yield (g(H2)/kWh), and hydrogen production rate (g(H2)/h) is presented and discussed. This analysis showed that in the cathodic regime of PDSE, the hydrogen production rate is 33.3 times higher than that in the anodic regime of PDSE, whereas the Faradaic and energy efficiencies are 11 and 12.5 times greater, respectively, than that in the anodic one. It also revealed the energy yield of hydrogen production in the cathodic regime of PDSE in the methanol–water mixture, as the electrolytic solution is 3.9 times greater compared to that of the alkaline electrolysis, 4.1 times greater compared to the polymer electrolyte membrane electrolysis, 2.8 times greater compared to the solid oxide electrolysis, 1.75 times greater than that obtained in the microwave (2.45 GHz) plasma, and 5.8% greater compared to natural gas steam reforming.

1. Introduction

Nowadays, considerable attention is given to developing existing and new technologies for hydrogen production. This is because hydrogen possesses the highest specific energy density of about 121 MJ/kg [1], and it is considered a clean energy carrier [2]. Moreover, due to the frequent discontinuity in the electricity production by the renewable energy sources, such as solar and wind energy, hydrogen offers a continuous way of converting the renewable electricity into so-called renewable hydrogen for fuel cells, vehicles, and industry [2,3]. For these reasons, hydrogen is considered a clean energy carrier of the future [4].
Currently, industrial methods to produce hydrogen, such as steam reforming and partial oxidation, are mainly based on using hydrocarbons (primarily natural gas) as the raw materials. For instance, natural gas steam reforming contributes about 50% of the world’s hydrogen production [5]. However, this method is not cost-effective enough because it requires high heat input. It also produces carbon dioxide (CO2), which is emitted into the atmosphere. Alternatively, hydrogen can be produced using more environmentally friendly technologies, such as electrolysis, and photobiological or thermochemical methods. Even though some of them are pretty mature, such as electrolysis, these alternative methods still need development to decrease the hydrogen production cost and increase the energy yield [3].
Table 1 shows merits and demerits of some of the hydrogen-producing technologies.
Notes: The list of the advantages and disadvantages was prepared based on the information presented in [6,7,8].The most commonly used energy parameters for comparing the hydrogen production methods include the energy efficiency (%) based on the concept of energy consumption (usually in kJ/mol(H2)) and energy yield (g(H2)/kWh). The energy efficiency (%) of specific hydrogen-producing processes is the ratio of the thermodynamically minimal energy consumption to the actual energy consumed in the process. Usually, the thermodynamically minimal energy consumption in the process is the standard enthalpy [9].
The energy yield of hydrogen production determines the process competitiveness, and the unit of g(H2)/kWh is defined as the ratio of the hydrogen product mass to the actual energy consumed in the process [9]. This means that the energy yield (g(H2)/kWh) is a reverse of the energy consumption kJ/mol(H2), i.e., E n e r g y   y i e l d 7200 E n e r g y   c o n s u m p t i o n .
In the different kinds of electrolysis, the Faradaic efficiency (also known as the current efficiency) is additionally used as one of the energy parameters. The Faradaic efficiency of hydrogen production is defined as a ratio of the actual mass of hydrogen evolved from the electrode by the passage of the electric current to the theoretical mass of hydrogen evolved, according to Faraday’s law.
Another parameter, sometimes called the hydrogen yield parameter, characterizes the amount of hydrogen produced in a specific process. In this review, the hydrogen yield parameter is represented by the hydrogen production rate (g(H2)/h). This parameter gives the mass of hydrogen produced in a unit of time (hour).
In recent years, a new type of electrolysis, initially known as the contact glow-discharge electrolysis (CGDE) and, more recently, as the plasma-driven solution electrolysis (PDSE), has attracted attention as an alternative method of hydrogen production [10,11,12]. Literature studies have shown that the Faradaic efficiency of hydrogen production in PDSE is dozens of times higher than that in Faradaic electrolysis [13,14,15].
PDSE is a nontypical electrochemical process in which electric plasma is formed in the glow discharges excited by the direct or pulsed current in a gas–vapor envelope in the vicinity of the discharge electrode immersed in the electrolytic solution. The yield of chemicals in PDSE (i.e., the ratio of the moles of the product formed to the moles of electrons consumed in a chemical reaction) is several times higher than the Faradaic production of chemicals (predicted by Faraday’s law). In PDSE, new chemical compounds can also be synthesized, which does not happen using Faradaic electrolysis [16,17].
This paper is the first comprehensive review of state-of-the-art hydrogen production using PDSE.

2. Physicochemical Processes Leading to PDSE

The studies of the formation of PDSE in the electrolytic solution [10,18,19,20,21] showed that several processes must occur before the plasma is induced at the electrode surface. They are the Faradaic electrolysis, the Joule heating of the electrolytic solution, the solution evaporation at the electrode, the ionization of the gas–vapor mixture within the limited volume (called the envelope) around the discharge electrode, and eventually, the electrical discharges across the envelope.
Next, we will follow the processes leading to the creation of PDSE.

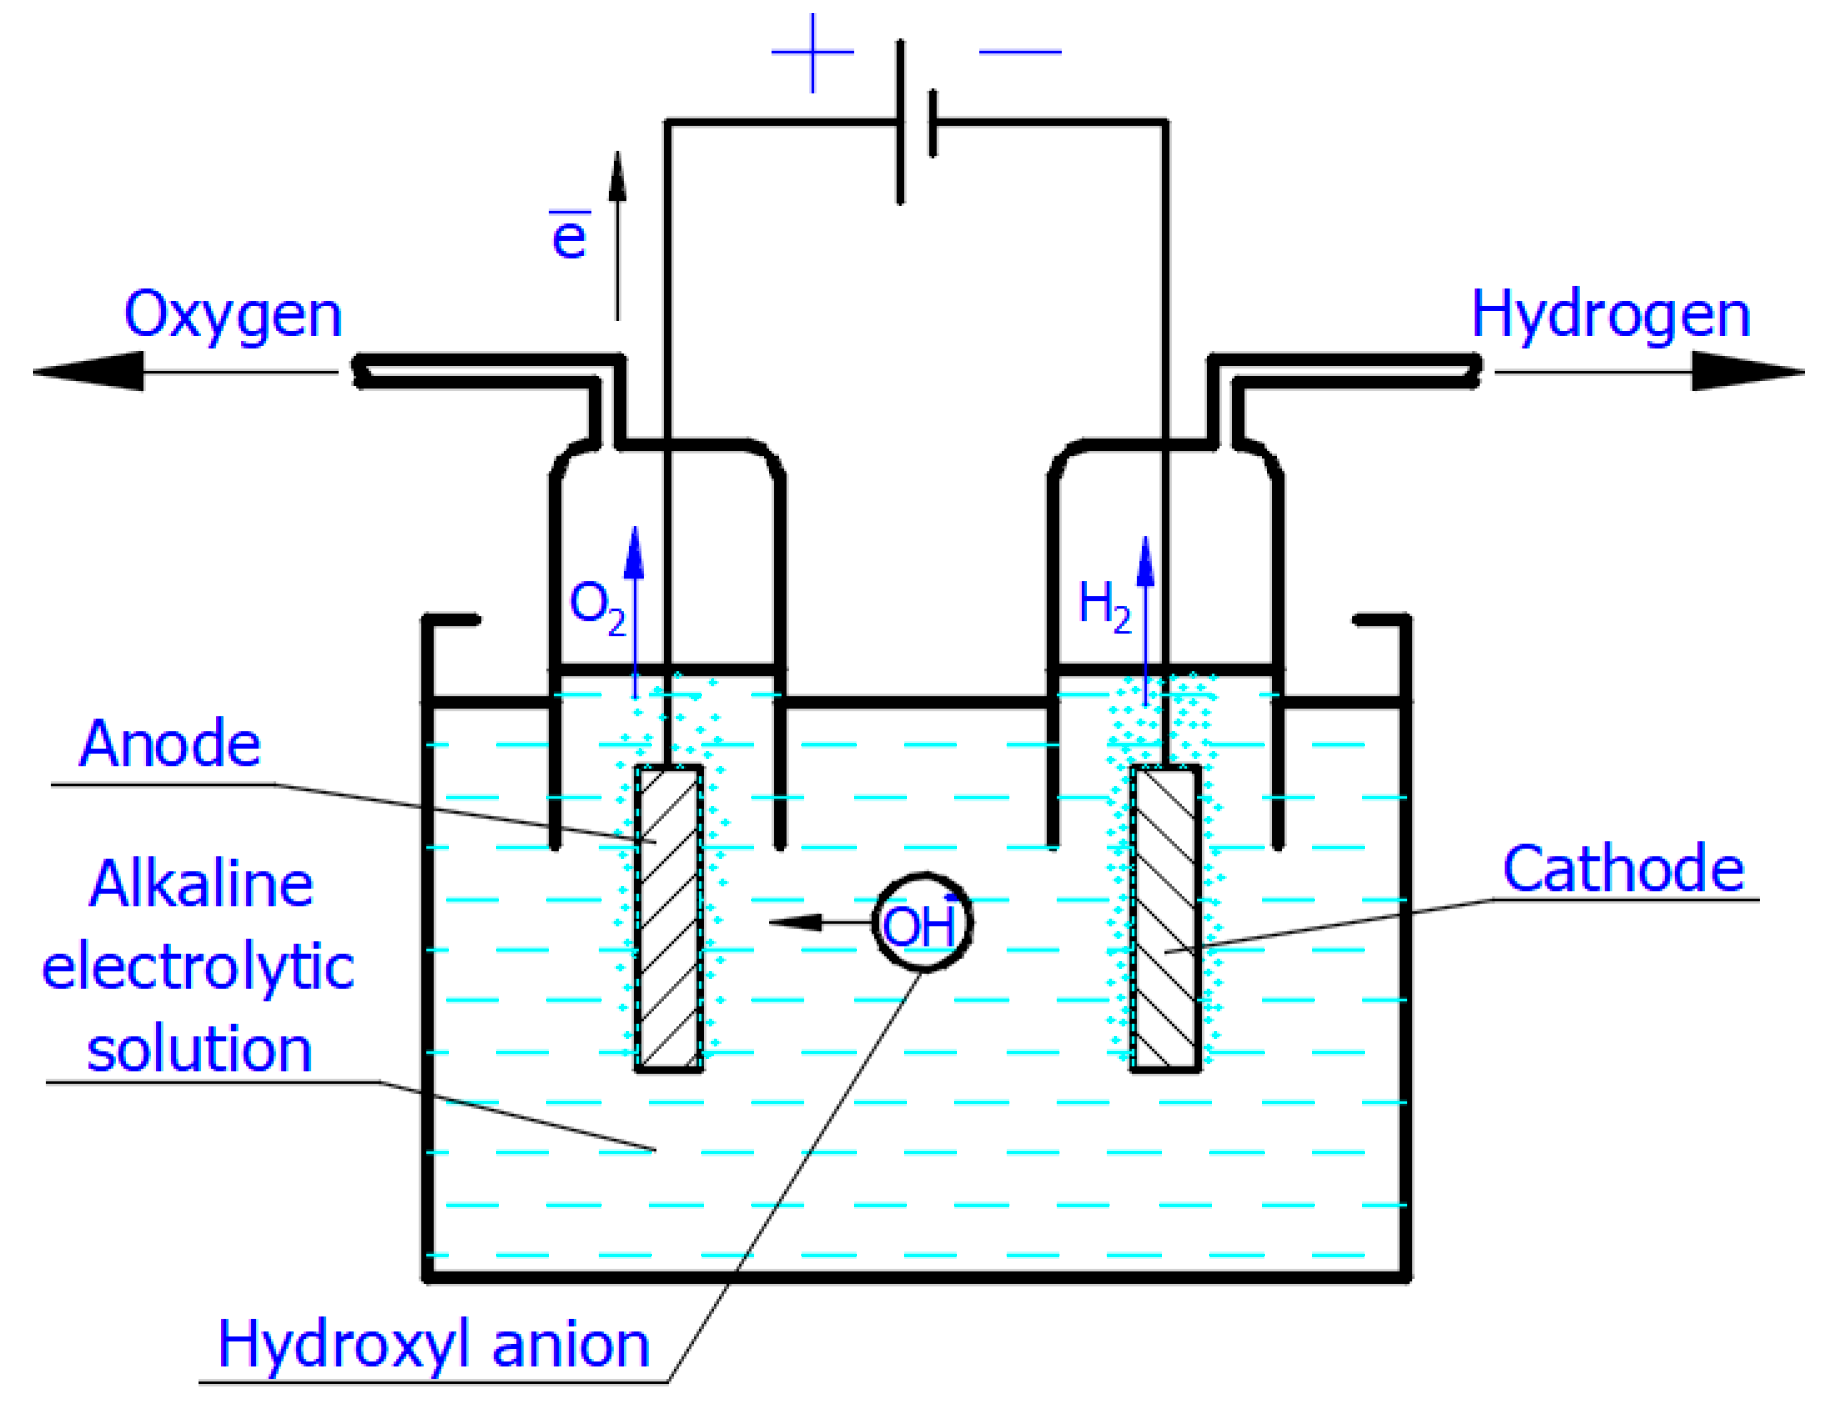
2.1. Faradaic Electrolysis

It is well known that electrolysis is an electrochemical process that occurs when a direct or pulsed current passes through the electrolytic cell. To perform electrolysis, the electrolytic cell must contain the following essential components:
  • An electrolytic solution containing free ions, which can carry an electric current. In the Faradaic electrolysis of acidic and alkaline aqueous solutions, strong acids and alkalis, such as sulfuric acid (H2SO4), potassium (KOH), and sodium (NaOH) hydroxides, are used as electrolytes due to their strong ability to dissociate into positive ions (called cations) and negatively charged ions (called anions), which easily conduct electricity in the electrolytic solution [22,23,24].
  • A direct or pulsed current supply, which provides the necessary energy to create the direct motion of ions in the electrolytic solution.
  • Additionally, two electrodes, which are electrical conductors providing physical contact between the current supply and the electrolytic solution. In alkaline electrolysis, low-cost, non-precious, nickel-based alloys and stainless steel are used as the cathode and anode electrode materials, respectively [25,26].
Figure 1 shows the influence of the weight concentration of KOH and NaOH electrolytes on the specific conductivity of their aqueous solutions.
According to Kohlrausch’s law of independent ionic migration, both cations and anions contribute to the conductivity of the electrolytic solutions. Thus, the specific conductivity of the electrolytic solutions can be estimated using the following formula [28]:
C o n d u c t i v i t y = ( α × c ) × ( u + * + u * ) × F ,   ( S m )
where α is the dissociation degree of the diluted electrolyte, c is the molar concentration of the electrolyte ( mol m 3 ) , u + * and u * are the electrical mobilities of cations and anions, respectively ( m 2 V · s ) , F is the Faraday constant, F = 96485   C mol . Since potassium cations K+ have higher electrical mobility than sodium cations Na+ ( u + * = 7.6 × 10 8   m 2 V · s for K+ cations versus u + * = 5.2 × 10 8   m 2 V · s for Na+ cations [28]), the KOH aqueous solution has higher specific conductivity at the same concentration compared to the NaOH aqueous solution, as can be seen in Figure 1.
To decrease the resistance losses in the electrolytic cell, the electrolyte concentration is selected in the optimal range to have the highest conductivity of the electrolytic solution. For this reason, the optimal range of the concentration for KOH electrolyzers varies between 25–30 wt% [29].
Applying the voltage from the direct current supply to the electrodes immersed in the electrolytic solution causes the motion of free ions (Figure 2). Thus, in the Faradaic electrolysis of aqueous solutions of hydroxides of active metals situated at the top of the reactivity series of metals (from Cesium Cs to Aluminum Al), at the negative electrode called the cathode, the reduction reaction of the water molecules with electrons taken from the cathode occurs only to form hydrogen molecules and negatively charged hydroxyl ions [26]:
4 H 2 O ( a q .   ) + 4 e ¯ 2 H 2 ( g ) + 4 O H ( a q . )
As seen from Equation (2), the cations of active metals do not participate in this electrochemical reaction. However, as recently reported by Monteiro et al. [30], the metal cations in the electrolytic solution have a significant effect on the activity of the cathode reaction (also known as the hydrogen evolution reaction) occurring on different metallic surfaces.
In the electrolysis of aqueous solutions of hydroxides or salts of metals situated in the middle of the reactivity series of metals (from titanium Ti to lead Pb), in addition to the hydrogen-generating reaction (Equation (2)) at the cathode, the reduction reaction of n-fold positively charged metal ions takes place as well [28]:
M e n + + n e ¯ M e .
The solvated hydroxyl ions produced at the cathode (Equation (2)) migrate through the electrolytic solution to the positive electrode called the anode, where they are oxidized into molecular oxygen and water [31]:
4 O H ( a q . ) 4 e ¯ 2 H 2 O ( a q . ) + O 2 ( g ) .
The overall reaction of water decomposition can be described by the following equation [26]:
2 H 2 O ( a q . ) 2 H 2 ( g ) + O 2 ( g )
Thus, in the Faradaic electrolysis of alkaline solutions with the electrodes having an equal surface area, the number of hydrogen moles produced at the cathode doubles the number of oxygen moles produced at the anode.
According to Faraday’s first law of electrolysis, the substance mass evolved at the electrode surface in the electrolysis is proportional to the quantity of electric charge passed through the electrolytic solution, i.e., [28]:
m = Z × q ,
where m is the evolved substance mass, Z is the so-called electrochemical equivalent, and q is the electric charge passed through the electrolytic solution. The electrochemical equivalent Z of a chemical element is the mass of the element transported by an electric charge of one Coulomb. For example, the electrochemical equivalent for hydrogen is 1.044 × 10⁻⁸  kg C [32]. The electric charge passing through the electrolytic solution is given by the formula [28]:
q = I × t
where I is the current flowing through the electrolytic solution, and t is the duration of the electrolysis.
In the standard conditions (p = 101 325 Pa, T = 298 K), the decomposition of each mole of water demands a theoretical minimum of electrical energy input of 237.23 kJ, which is known as the change of the standard Gibbs free energy of water (ΔG). It also demands some external heat input of 48.6 kJ, known as the bound energy (TΔS), which should be delivered to the electrolytic solution at temperature T to raise its entropy by ΔS. Therefore, the water decomposition cannot proceed without supplying the energy of 285.83 kJ per mole of water. This energy is known as the change of the standard enthalpy of water (ΔH). These thermodynamic functions, such as the change of the enthalpy, Gibbs free energy, and bound energy, are known as the thermodynamic potentials. They are interlinked with each other by the equation [33]:
Δ H = Δ G + T Δ S
In the standard conditions, the standard potential of the electrolytic cell can be calculated using the following formula [33]:
E C e l l 0 = Δ G n × F = 1.23   V
where ΔG is the change of the standard Gibbs free energy of water, n is the number of electrons per mole of products (n = 2), and F is the Faraday constant.
However, this value of the standard potential is theoretical, and practically, due to the ohmic losses and other side reactions, the electrolytic cell operates at a certain overpotential. In industrial electrolyzers, the actual potential of the electrolytic cells varies from 1.7 to 2.5 V. This overpotential decreases the energy yield of hydrogen production.
One way to improve the energy yield of hydrogen production is to decrease the electrolytic cell’s overpotential by increasing the electrolytic solution’s temperature. Figure 3 shows the influence of the electrolytic solution temperature on the changes of enthalpy (ΔH), Gibbs free energy (ΔG), and bound energy (TΔS).
As can be seen from Figure 3, an increase in the temperature of the electrolytic solution leads to a decrease in the Gibbs free energy, which results in the decrease in the electrical energy input required to carry out the water decomposition. Performing the electrolysis at an elevated temperature to produce hydrogen is called high-temperature water/steam electrolysis.
At higher temperatures, more expensive electrical energy (attributed to the change of the Gibbs free energy ΔG) needed for the water decomposition can be substituted by less expensive thermal energy (the bound energy TΔS). The thermal energy can be delivered from some waste heat source, which makes the high-temperature water/steam electrolysis attractive from an economic point of view.
Figure 3 also shows values of the cell potentials needed to be applied for the water decomposition at 25 °C and 600 °C. At 25 °C, the cell potential is 1.23 V, whereas at 600 °C, which corresponds to the steam electrolysis, the cell potential is 1.04 V. These values are found as the projections of the intersection points of isotherms (vertical dashed lines in Figure 3) of 25 °C and 600 °C with the electrical energy demand line (ΔG) to the cell potential axis (right-hand vertical axis). Practically, in the high-temperature water/steam electrolysis, the potential of the electrolytic cell can be reduced below 1 V [34,35].

2.2. Transformation of the Faradaic Electrolysis into PDSE Faradaic Electrolysis

The Faradaic electrolysis transforms into PDSE with an increased applied voltage that has a value sufficient to ionize the species in the gas–vapor envelope at the electrode, and subsequently, induce the electrical discharge plasma in the envelope.
Regardless of the electric potential polarity, the plasma is formed at the electrode, which its active surface area (immersed in the electrolytic solution) is smaller than that of the other electrode. The electrode at which the plasma is formed is called the discharge electrode [36]. If the smaller electrode is positively charged (being an anode), the discharge formed around it is called the anodic glow discharge. If the smaller electrode is negatively charged (being a cathode), the discharge around it is called the cathodic glow discharge (see Figure 4). Correspondingly, PDSE is either the anodic or cathodic regime of PDSE. The length of electrodes exposed to the electrolytic solution is called the active length of the electrodes.
In the anodic and cathodic regimes of PDSE, the plasma around the discharge electrode takes over the role of the positive and negative electrode, respectively, whereas the second electrode (larger one) immersed in the electrolytic solution with no plasma formation acts as a counter electrode. In PDSE, the plasma–liquid interaction allows both electrochemical and plasma-chemical synthesis of the substances [10,12].
Figure 4a–e illustrates the transformation of the electrolysis from its Faradaic form into PDSE.
Figure 4a shows a typical electrolytic cell with a smaller and a larger electrode for PDSE before applying DC voltage. Figure 4b,d illustrates the formation of PDSE at the anode with the applied voltage, whereas Figure 4c,e illustrates the formation of PDSE at the cathode.
Figure 4b–e confirms that, regardless of the voltage polarity, both glow discharges, the anodic and cathodic, form at the electrode of a smaller active surface area, i.e., at the tungsten rod whose surface area is about 12 times smaller than that of the stainless-steel plate. In the anodic regime of PDSE, the plasma forms a thin layer around the tungsten rod (Figure 4d). The plasma formed in the cathodic regime of PDSE (Figure 4e) occupies a much larger volume around the tungsten rod than that in the anodic regime of PDSE (Figure 4d). This shows that the cathodic regime of PDSE is more efficient for steam generation. The brightness of the cathodic glow discharges is stronger than that of the anodic glow discharges, although the applied voltage is lower in the cathodic regime of PDSE (120 V in the cathodic regime of PDSE versus 130 V in the anodic regime of PDSE).
Sharma et al. [37] confirmed that the cathodic regime of PDSE can be applied for continuous steam generation with a steam generation efficiency of 80%. Zheng et al. [38] showed that in the cathodic regime of PDSE, the plasma formed around the discharge electrode is highly negative. The above differences in the microscopic appearance of the anodic and cathodic regimes of PDSE are due to the difference in the mechanisms of the formation of the glow discharges at the anode and cathode.
Figure 4. Transformation of the electrolysis from the Faradaic form into the anodic and cathodic regimes of PDSE with increasing applied voltage: (a) the electrolytic cell before applying DC voltage, (b) Faradaic electrolysis at an applied voltage of 20 V (tungsten rod served as an anode), (c) Faradaic electrolysis at an applied voltage of 20 V (tungsten rod served as a cathode), (d) the anodic regime of PDSE at the applied voltage of 130 V (discharge onset voltage was 60 V), (e) the cathodic regime of PDSE at the applied voltage of 120 V (discharge onset voltage was 52 V). The electrolytic solution was 10 wt% Na2CO3 water solution at the initial temperature of 22 °C and atmospheric pressure. The electrodes: a stainless-steel plate with a thickness of 0.4 mm and 2 cm × 2cm active surface area exposed to the electrolytic solution and a tungsten rod with a diameter of 2 mm. The active length of the stainless-steel plate was 2 cm. The active length of the tungsten rod was 1 cm. The ratio of the active surface area of the smaller electrode and that of the larger electrode is about 1/12 [39].
Energies 15 07508 g004
Figure 5 shows typical shapes of the current-voltage characteristics I(V) of the electrolysis comprising the Faradaic, transition, and PDSE phases. The current-voltage characteristics are shown for two cases: when the smaller electrode is positively (marked P) or negatively (marked N) charged. The case of a positively charged smaller electrode terminates with the anodic regime of PDSE, whereas the case of a negatively charged smaller electrode terminates with the cathodic regime of PDSE. Although the I(V) characteristics differ, they have similar shapes, and each has two extremum points, which divide the electrolysis into three phases (Figure 5). The first phase (marked I) is the Faradaic electrolysis. It ends at a breakdown point when the Faradaic electrolysis terminates due to the formation of a stable gas–vapor envelope around the discharge electrode due to the coalescence of gas and vapor bubbles. The gas and vapor bubbles are produced by the Faradaic electrolysis and by evaporation of the electrolytic solution, especially at higher electric current densities, causing higher Joule heating. The value of the electric current density at which the Faradaic electrolysis terminates (i.e., at the breakdown point) depends on the material of the discharge electrode, conductivity of the electrolytic solution, temperature, and surface tension [10].
When increasing the applied voltage above the value defined by the breakdown point, the second phase (marked II) appears. In this phase, the thickness of the gas–vapor envelope around the discharge electrode rises, leading to a decrease in the electric current (as seen in Figure 5) due to the rise in the electrical resistance through the gas and vapor in the envelope. According to the experimental study by Gupta and Singh [10], the electrical resistance of the gas–vapor envelope surrounding the discharge electrode is about 10 000 Ohms, whereas the electrical resistance of the electrolytic solution is a few orders of magnitude smaller. The applied voltage increasing in the second phase becomes high enough to cause the ionization of the gas–vapor envelope. The second phase ends when the ionization of the gas and vapor in the envelope transfers into the electrical discharge. This is marked on the I(V) characteristics by the second extreme point, called the discharge onset point.
At applied voltages higher than that pointed out by the discharge onset point, the electrolysis’s third phase (marked III) exists. This phase is called PDSE. The second phase is a transition between the first phase (the Faradaic electrolysis) and the third phase (PDSE). The second phase is called the transition phase.
Allagui and Elwakil [40] revealed that the transition phase of the current-voltage characteristic, recorded at positive and negative d V d t (increasing- and decreasing-step voltage sweeps) of the cathodic regime of PDSE, contains hysteresis, which is explained by the transitional appearance/disappearance of the space charge structure, composed of the self-organized gas film on the one hand and the glow-discharge volume surrounding the working electrode on the other.
The second extreme point, named the discharge onset point, indicates the initiation of the electrical discharges within the gas–vapor envelope. That is why the third section of the current-voltage characteristic corresponds to the plasma formation in the electrolytic solution.
As shown in [45,46,47], the values of the breakdown and discharge onset voltages strongly depend on the conductivity of the electrolytic solution applied. In general, lower specific conductivities of the aqueous electrolytic solutions result in higher values of the breakdown and discharge onset voltages, e.g., the breakdown at the conductivity of the KCl aqueous solution of 5 mS/cm and discharge onset voltages are equal to 270 V and 310 V, respectively. At higher specific conductivities, both voltages significantly decrease. For example, for the conductivity of a KCl aqueous solution of 600 mS/cm, the breakdown and discharge onset voltages are 30 V and 90 V, respectively [47].
According to the results of the comprehensive investigations carried out by Sengupta et al. [10,18,19,20,21], the discharge onset voltage also depends on the polarity of PDSE. They found that in the anodic regime of PDSE, the discharge onset voltage was 420 V, whereas in the cathodic regime of PDSE, it was only 160 V in the same aqueous K2SO4 electrolytic solution with a 0.05 M concentration. That is why PDSE develops much easier in the cathodic regime than in the anodic regime under the same conditions. The same feature of the plasma formation in the cathodic and anodic regimes of PDSE was observed in our experiment, presented in Figure 4d,e. In the 10 wt% Na2CO3 aqueous solution, the discharge onset voltage was 52 V in the cathodic regime of PDSE, whereas it was 60 V in the anodic regime of PDSE.

2.3. Physicochemical Processes Occurring in the Cathodic and Anodic Regimes of PDSE

Previous studies [10,18,19,20,21,48] showed that in PDSE, the total yields (total amount of all substances produced at the discharge electrode) include chemical yields produced according to Faraday’s first law of electrolysis (Equation (6)), called the Faradaic yield (products), and extra amount of substances, the production of which does not obey Equation (6). This extra amount of substances is called the non-Faradaic yield (products). The non-Faradaic yield of the anodic and cathodic regimes of PDSE is derived from two different reaction regions (Figure 6): i.e., the plasma region around the discharge electrode and the interfacial region (the aqueous electrolytic solution situated close to the plasma interface).
According to Gupta and Singh [10], at the discharge electrode in the cathodic regime of PDSE, the non-Faradaic yield (extra H2 yield over the Faradaic yield of H2, O2, and H2O2 yields) accounts for about 75% of the substances produced in the plasma region and about 25% of the substances produced in the interfacial region (Figure 6). In contrast to the cathodic regime of PDSE, at the discharge electrode in the anodic regime of PDSE, only about 20% of this extra amount of substances (extra O2 yield over the Faradaic yield of O2, H2, and H2O2 yields) are produced in the plasma region, and 80% is derived from the interfacial region.
According to [49,50], four different processes are responsible for the decomposition of the water molecules in the vicinity of the discharge electrode. They are (i) photodecomposition, (ii) ion-impact decomposition, (iii) electron-impact decomposition, and (iv) thermal decomposition (Figure 7).
(i) Photodecomposition: The hydrogen production is the same as the water photolysis when the ultraviolet radiation emitted by the discharge plasma breaks up the hydrogen bonds in the water molecule [51,52].
(ii) Ion-impact decomposition: Ions contribute to the water-vapor decomposition. However, as was shown in [36], the ion-impact decomposition is less significant for hydrogen production than that of the electron-impact decomposition. However, when colliding with a metal surface of the electrode in the cathodic regime of PDSE, positively charged ions are responsible for promoting the emission of the secondary electrons.
(iii) Electron-impact decomposition: High-energy electrons dissociate water-vapor molecules into hydrogen and hydroxyl radicals. Studying the influence of the discharge polarity on hydrogen production, Zonhcheng Yan et al. [36] suggested that electrons are more essential species in initiating the water-vapor decomposition than ions.
(iv) Thermal decomposition: The process is similar to direct thermal water decomposition, which occurs at a high-temperature level, usually higher than 2500 K. For instance, at a temperature of 3000 K and a pressure of 1 bar, the degree of the water-vapor decomposition is around 65 vol% [53,54]. Paulmier et al. [50] suggested that the thermal dissociative process may play a significant role in PDSE. Thus, at a high temperature, the electrolytic solution near the electrode surface is strongly heated and vaporized; then, the water-vapor is thermally dissociated into hydrogen and oxygen.

2.3.1. Water-Vapor Decomposition in the Plasma Region

In the plasma around the discharge electrode, one of the mechanisms of the decomposition of water-vapor molecules into H2 and O2 molecules is a mechanism observed for the water-vapor decomposition in electrical discharges [55]. Mededovic and Locke [56] developed a model of plasma-in-liquid discharges. In this model, the plasma region consists of two subregions: inner and outer. Following up with the model developed by Mededovic and Locke [56], we may also assume the same subregions surrounding the discharge electrode in PDSE (Figure 6): an inner subregion, situated close to the discharge electrode with ionizing plasma, which dissociates water into OH and H radicals by the electron-impact and thermal processes, and an outer subregion, situated close to the plasma interface, in which radicals recombine, producing long-lived molecules such as H2, O2, and H2O2. The modeling results were confirmed experimentally in [56]. The set of the corresponding reactions occurring in those two subregions is presented below.
The water-vapor decomposition in the inner plasma subregion follows the reactions [56,57]:
H 2 O + e H * + O H * + e ,
H 2 O + M H * + O H * + M ,
where M is the water molecule [56] or a third collision body [57].
In the outer plasma subregion, recombination reactions take place, producing hydrogen peroxide H2O2, as well as hydrogen H2 and oxygen O2 [56]:
H * + H * + M H 2 + M ,
O H * + O H * H 2 O 2 ,
O H * + O H * H 2 O + O * ,
O * + O H * O 2 + H *
The overall stoichiometry of the molecular species formed by the pulsed electrical discharge in water follows the overall stoichiometry represented by the reaction given below [56]:
6 H 2 O 4 H 2 + 2 H 2 O 2 + O 2

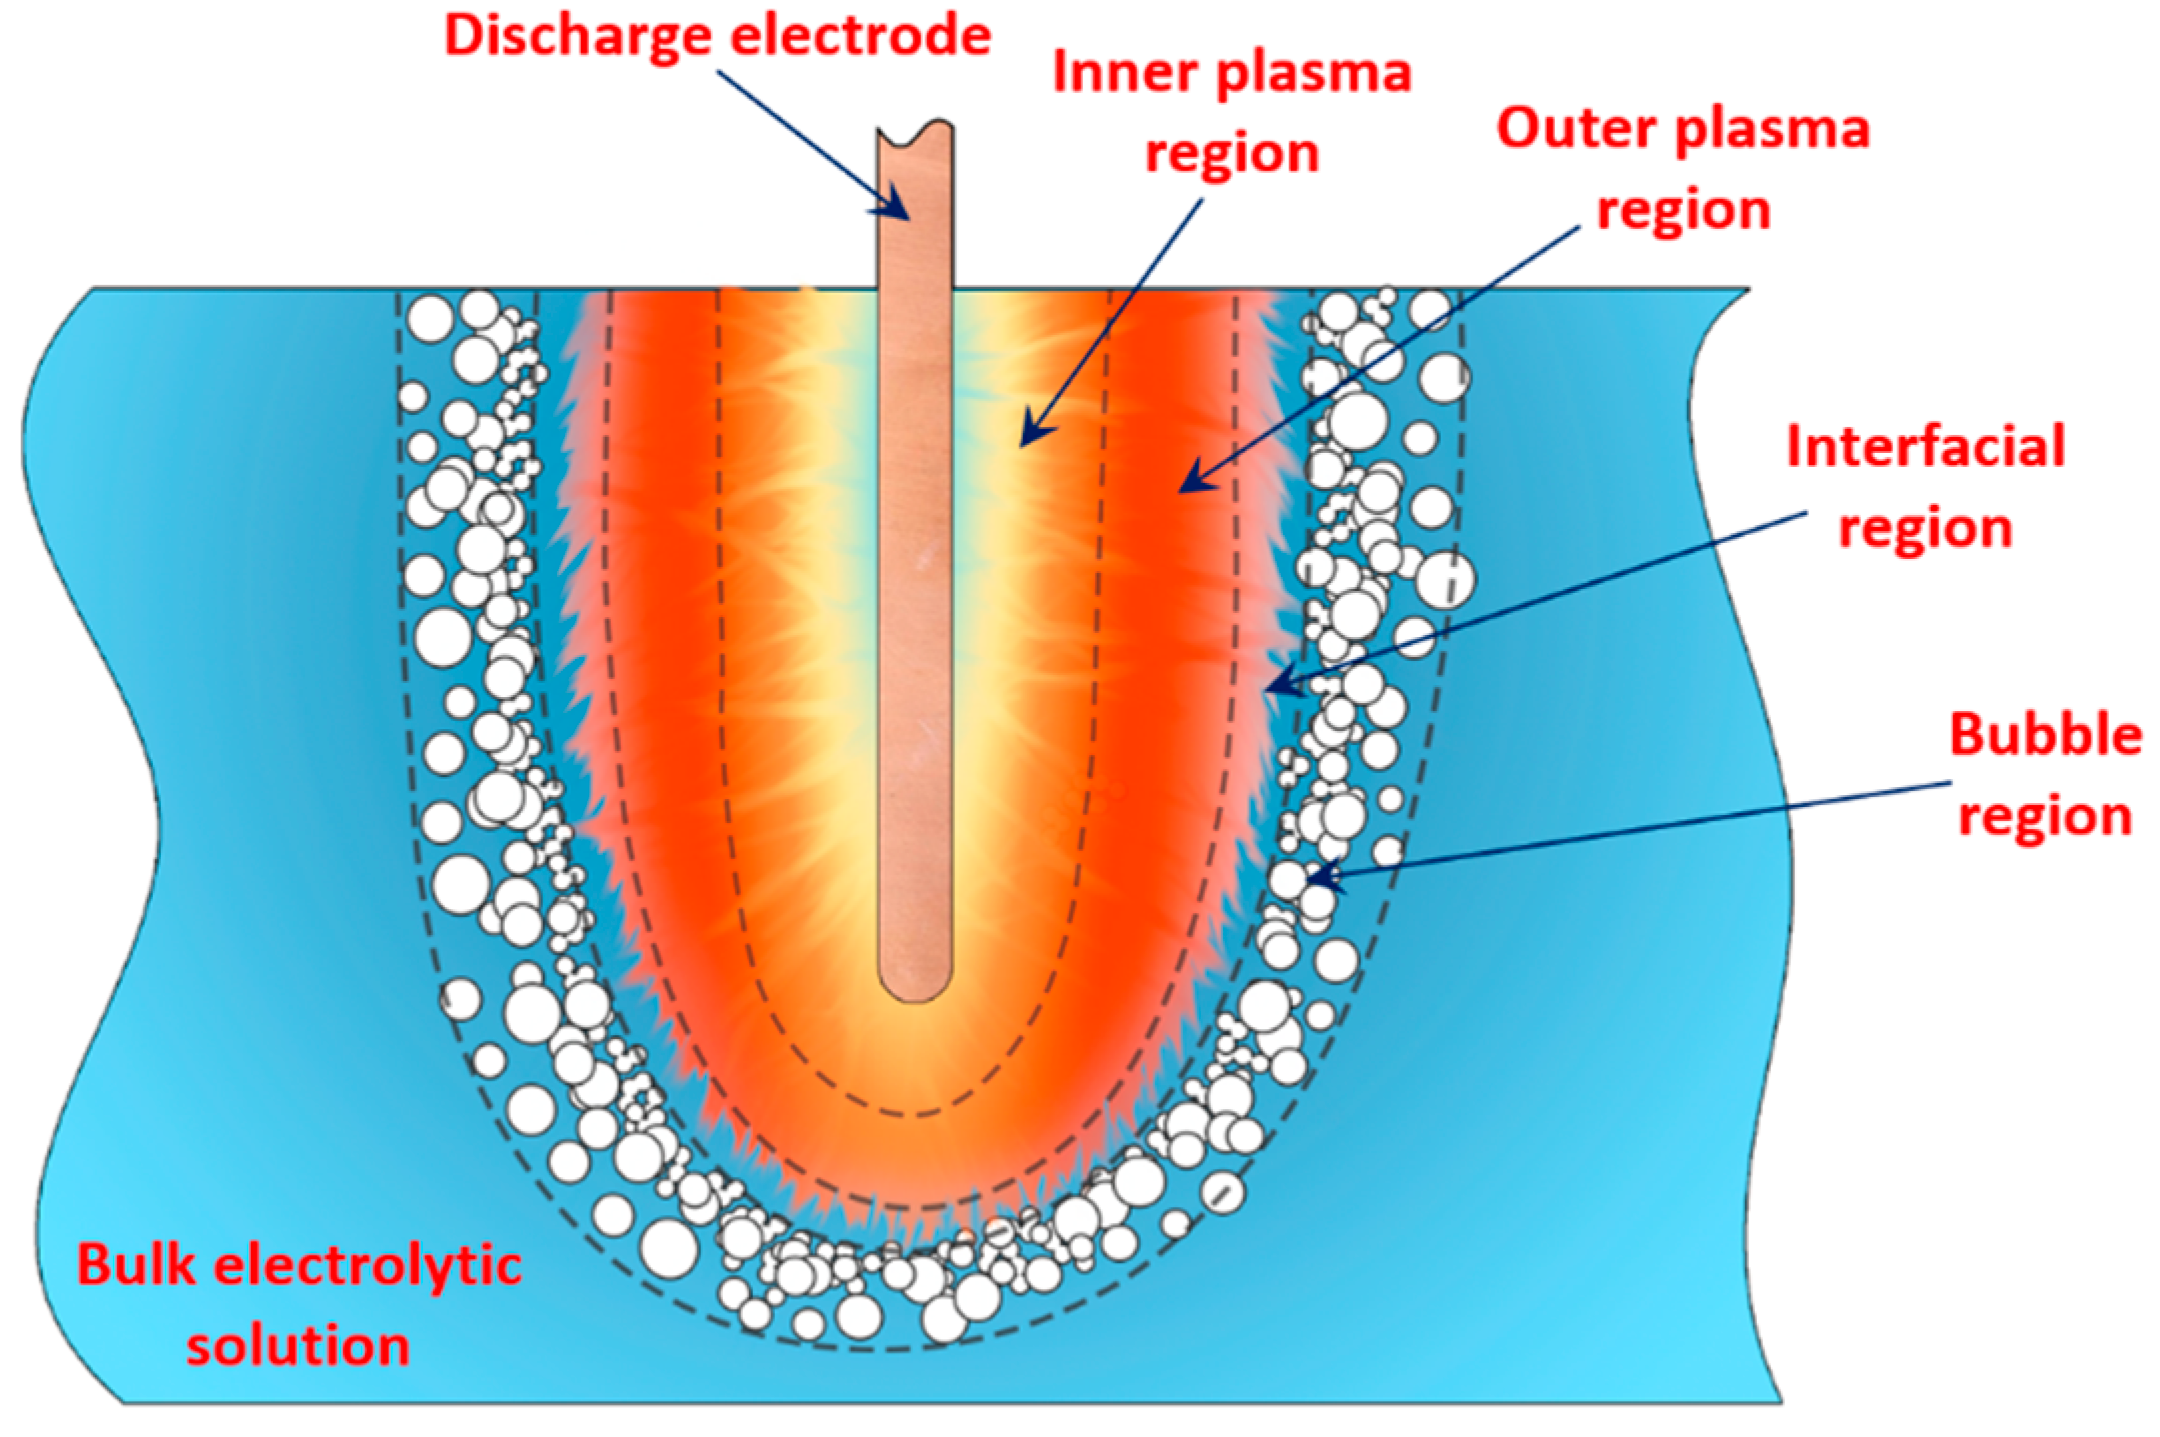
2.3.2. Plasma–Liquid Interaction in the Interfacial Region

Plasma–Liquid Interaction in the Cathodic Regime of PDSE

In the interfacial region (Figure 6), in the liquid-phase reaction zone near the plasma interface, one of the mechanisms responsible for the breakup of liquid H2O molecules into H2, H2O2, and O2 is the radiolysis-based reactions.
As shown by Mota-Lima et al. [11], in the cathodic regime of PDSE, the ballistic electrons are released from the plasma region into the liquid interfacial region at a rate which can be estimated by the following equation [11]:
q e = I F ,   [ mol s ]
where I is the electric current, and F is the Faraday constant.
After injection, the ballistic electrons become the hydrated electrons. The penetration depth into the interfacial region constitutes a few nanometers only [58]. Then, depending on the pH value of the electrolytic solution, the following mechanisms of the hydrogen-producing reactions were proposed [11]:
In the alkaline electrolytic solution, the water reduction via the self-recombination of the hydrated electrons occurs [11]:
2 e a q + 2 H 2 O H 2 + 2 O H
In the electrolytic solution with an acidic nature, the hydrated electrons interact with the hydrogen ions, producing hydrogen radicals before the hydrogen production [11]:
e a q + H a q + H a q * ,
e a q + H a q * + H 2 O H 2 + O H ,
2 H a q * H 2 .
Mota-Lima et al. [11] also proposed the following mechanisms of the side reactions, which reduce hydrogen production in the interfacial region. First, the interaction between the hydrated electrons and the plasma-synthesized species, such as the hydroxyl radicals and hydrogen peroxide, occurs [11]:
e a q + ( O H * ) a q O H ,
e a q + ( H 2 O 2 ) a q ( O H * ) a q + O H .
Second, the interaction between the hydrated electrons and the dissolved gases such as O2, N2, etc. in the interfacial region occurs, which takes over the scavenger role for the hydrated electrons [11]:
e a q + ( O 2 ) a q ( O 2 ) a q ,
e a q + ( O 2 ) a q + H 2 O ( H O 2 ) a q + O H ,
e a q + ( H O 2 ) a q + H 2 O ( O H * ) a q + 2 O H .
Both mechanisms of the side reactions occurring in the interfacial region lead to the formation of the hydroxyl ions, which, additionally, act as the hydrogen scavengers according to the recombination reaction described in Equations (13) and (14).

Plasma–Liquid Interaction in the Anodic Regime of PDSE

In the anodic regime of PDSE, one of the mechanisms of the plasma–liquid interaction follows Hickling’s radiolytic mechanism [41]. According to this mechanism, each H 2 O g a s + ion, after acceleration in the steep anode, falls near the interfacial region and is driven into the aqueous electrolytic solution with energies sufficient to break-up liquid water molecules into H and OH radicals. Then, the formed radicals diffuse into the bulk of the electrolytic solution, where they undergo several reactions which are known to occur in pulse radiolysis.
The relative importance of the two mechanisms occurring in the plasma region (i.e., bombardment of the interfacial region by H 2 O g a s + ions) and the interfacial region (i.e., diffusion of H 2 O g a s + ions into the interfacial region with the subsequent break-up of the liquid water molecules) depends on the magnitude of the applied voltage. At the discharge onset voltage of 420 V, the occurring mechanism is the liquid-phase Hickling’s radiolytic mechanism, accounting for 90% of the non-Faradaic yield. However, with a further rise in voltage, the gas-phase mechanism, described in [21], becomes increasingly important and, at 500 V, accounts for 75% of the non-Faradaic yield.
For more details on the charge-transfer mechanisms in the anodic regime of PDSE, we refer to the recent comprehensive study from Yerokhin et al. [59].
The Faradaic efficiency of hydrogen production in the plasma-driven solution electrolysis (PDSE), which exceeds 100%, is explained by different, in terms of their nature, reactions occurring in the vicinity of the discharge electrode. The first reaction type is based on the charge transfer. According to Faraday’s first law of electrolysis, hydrogen generation is directly proportional to the electric current passed through the electrolytic solution. In contrast to conventional electrolysis, a second mechanism consists of the gas-phase reactions in the plasma region. A solvent (water) and the organic additives, if any, are evaporated by the intense heating effect of the discharge plasma into the plasma region, where they serve as an additional source of hydrogen. The electron-impact decomposition of molecules in the plasma region is not based on the charge transfer and is non-Faradaic.
The two reaction mechanisms, one in the liquid interfacial region and another in the plasma region, produce hydrogen simultaneously. Therefore, the electron-impact decomposition occurring in the plasma region contributes to the Faradaic efficiency of more than 100%.
Moreover, three additional processes are also responsible for decomposing the water molecules and molecules of organic additives, if any, in the interfacial and plasma regions. They are photodecomposition, ion-impact decomposition, and thermal decomposition. These reaction pathways are not based on the charge transfer and they are non-Faradaic as well.
The actual reactions occurring within the plasma and interfacial regions in the anodic and cathodic regimes of PDSE are much more sophisticated than those shown above. Potential mechanisms of these interactions will be discussed in our future research paper dedicated to the fundamentals of PDSE.

3. Hydrogen Production by PDSE

3.1. Influence of the Process Parameters on the Hydrogen Production in PDSE

A summary of our study related to hydrogen production by PDSE is presented in Table 2.
Based on the fact that many authors applied the standard enthalpy of water as a reference to estimate the energy efficiency of hydrogen production for different hydrogen-rich organic compounds (mainly methanol or ethanol of high concentrations) as the additives in their PDSE experiments, we will use the procedure for estimating the energy efficiency as shown in the notes under Table 2. Particularly, in the case of applying methanol and ethanol as the additives, we will compare the actual PDSE energy consumption with the thermodynamically minimal energy consumption for hydrogen production (standard enthalpy) in methanol– and ethanol–water reforming, respectively.
The energy efficiencies of hydrogen production in PDSE of the typical aqueous electrolytic solutions of potassium carbonate (K2CO3), sodium carbonate (Na2CO3), potassium hydroxide (KOH), sodium hydroxide (NaOH), sulfuric acid (H2SO4), and acetic acid (CH3COOH) were calculated as the ratio of the thermodynamically minimal energy consumption (standard enthalpy) for production of one mole of hydrogen in the water decomposition (Equation (28)), i.e., P t h H 2 O = 285.83   kJ mol = 25.19   g ( H 2 ) kWh , to the actual energy consumption in PDSE, i.e., PPDSE:
η = P t h H 2 O P P D S E × 100 % ,
where 285.83 kJ mol is the standard enthalpy of water (the thermodynamically minimal energy consumption for one hydrogen mole formation) according to the following thermochemical reaction:
2 H 2 O l i q u i d 2 H 2 g a s + O 2 g a s ,   Δ H R ,   298 0 = + 571.65   kJ mol .
The energy efficiencies of hydrogen production in PDSE of the electrolytic solutions containing a water–methanol mixture of different concentrations were calculated as the ratio of the thermodynamically minimal energy consumption (standard enthalpy) for the production of one mole of hydrogen in methanol–water reforming (Equation (30)), i.e., P t h C H 3 O H = 43.59   kJ mol = 165.024   g ( H 2 ) kWh to the actual energy consumption in PDSE, i.e., PPDSE:
η = P t h C H 3 O H P P D S E × 100 % ,
where 43.59 kJ mol is the thermodynamically minimal energy consumption for one hydrogen mole formation (the standard enthalpy) in methanol–water reforming, according to the following thermochemical reaction:
C H 3 O H l i q u i d + H 2 O l i q u i d 3 H 2 g a s + C O 2 g a s ,   Δ H R ,   298 0 = + 130.77   kJ mol .
The energy efficiencies of hydrogen production in PDSE of the electrolytic solutions containing a water–ethanol mixture of different concentrations were calculated as the ratio of the thermodynamically minimal energy consumption (standard enthalpy) for the production of one mole of hydrogen in ethanol–water reforming (Equation (32)), i.e., P t h C 2 H 5 O H = 57.93   kJ mol = 124.331   g ( H 2 ) kWh to the actual energy consumption in PDSE, i.e., PPDSE:
η = P t h C 2 H 5 O H P P D S E × 100 % ,
where 57.93 kJ mol is the thermodynamically minimal energy consumption for one hydrogen mole formation (standard enthalpy) in ethanol–water reforming, according to the following reaction:
C 2 H 5 O H l i q u i d + 3 H 2 O l i q u i d 6 H 2 g a s + 2 C O 2 g a s ,   Δ H R ,   298 0 = + 347.58   kJ mol .
The standard enthalpies of the thermochemical reactions (Equations (28), (30), and (32)) were calculated using the standard enthalpies of water (liquid), methanol (liquid), ethanol (liquid), and carbon dioxide (gas) presented in the thermochemical database of the Argonne National Laboratory [66].

3.1.1. Influence of the Discharge Polarity

The data presented in Table 2 indicates that electrode polarity plays a significant role in hydrogen production. The rate of hydrogen production using cathodic plasma is much higher than that in the anodic plasma. This is mainly because of three reasons:
  • When plasma is formed at the cathode, there is an additional hydrogen yield due to Faradaic electrolysis. This value of the additional hydrogen yield can be easily estimated using Faraday’s first law of electrolysis (Equation (6)), and the value of the electric current passed through the electrolytic solution.
  • As shown in [36,42], the number of high-energy electrons in the cathodic discharge is much higher than that in the anodic discharge due to the secondary electrons emitted by the metal cathode. In contrast to the cathodic polarity, in the anodic regime of PDSE, the capability of emitting secondary electrons by the electrolytic solution is far weaker than that of the metal electrode.
  • According to [36,42], the moving direction of high-energy electrons is another essential factor. In the cathodic plasma discharge, high-energy electrons accelerated by the cathode fall collide with the molecules of the electrolytic solution producing hydrogen, whereas in the anodic discharge, electrons collide with the anode surface, leading to a more significant disintegration of the anode. This phenomenon of anode disintegration by electrical discharges is widely used in electrical discharge machining (EDM) [67].
Based on the results presented in [36], the hydrogen production rate was approximately 33.3 times higher in applying cathodic discharge polarity compared to the anodic regime for the NaOH electrolytic solution with am ethanol additive and the same applied voltage. Faradaic and energy efficiencies were also 11 and 12.5 times higher for the cathodic polarity, respectively, compared to the anodic one. For this reason, our further analysis focuses on the cathodic regime of PDSE only.
However, even by applying cathodic polarity in PDSE of the Na2CO3 aqueous solution and a high concentration of the methanol additive (50 vol%), the lowest energy consumption achieved in [16] was 85.37 kJ/mole. This value is almost 2 times higher than the standard enthalpy of methanol–water reforming as given by Equation (30). This means that the highest value of the energy efficiency reported in the literature dedicated to PDSE is only 51.1%.
Table 3 shows the year-wise development of hydrogen production in PDSE of the electrolytic solutions.

3.1.2. Influence of the Applied Voltage in the Cathodic Regime of PDSE

The current analysis of the literature dedicated to hydrogen production in the cathodic regime of PDSE showed that the applied voltage has a significant impact on the energy efficiency, energy yield of hydrogen production, and hydrogen production rate. The effect of the applied voltage on the energy parameters of hydrogen production and the hydrogen production rate depends on the type of electrolytic solutions used, i.e., whether it is a typical aqueous electrolytic solution of salts and hydroxides (K2CO3, Na2CO3, KOH, NaOH) or an electrolytic solution containing hydrogen-rich organic additives (methanol, ethanol, acetic acid). Although, in water, the acetic acid (CH3COOH) dissociates into the acetate anions (CH3CO2) and hydrogen cations (H+), the acetate anions (CH3CO2) containing hydrogen atoms behave as an additional hydrogen supply. Therefore, in our analysis, acetic acid is considered an additive.
Below, we consider two cases: the electrolytic solutions without and with organic additives.

Typical Aqueous Electrolytic Solutions of Salts and Hydroxides (Without Organic Additives)

Figure 8a,b shows dot diagrams with the best results regarding the energy efficiency (%), energy yield (g(H2)/kWh), and hydrogen production rate (g(H2)/h) received in [13,14,15,16,60,61,62] as functions of the applied voltage (V) in the cathodic regime of PDSE in aqueous electrolytic solutions of potassium carbonate (K2CO3), sodium carbonate (Na2CO3), potassium hydroxide (KOH), and sodium hydroxide (NaOH) in various concentrations.
From Figure 8a, it can be seen that in the range of the applied voltage between 200 V and 700 V, the best result on the energy efficiency equal to 12.7% was received by Mizuno et al. [14] at 350 V for a 0.2 M K2CO3 aqueous solution. This value of the energy efficiency corresponds to the energy yield of 3.21 g(H2)/kWh. This is much higher than in the case of the 0.03 M NaOH aqueous solution, even if the applied voltage was greater than in [14]. At 700 V, the energy efficiency for the 0.03 NaOH aqueous solution was only 3% [62].
As seen in Figure 8b, the hydrogen production rate reaches its maximum of 2.73 g(H2)/h at the applied voltage of 350 V for a 0.2 M aqueous electrolytic solution of K2CO3, which shows the highest energy efficiency and energy yield of 12.7% and 3.21 g(H2)/kWh, respectively (see Figure 8a).
The results presented in Figure 8a,b show that the energy efficiency, energy yield of hydrogen production, and hydrogen production rate decrease when increasing the applied voltage.

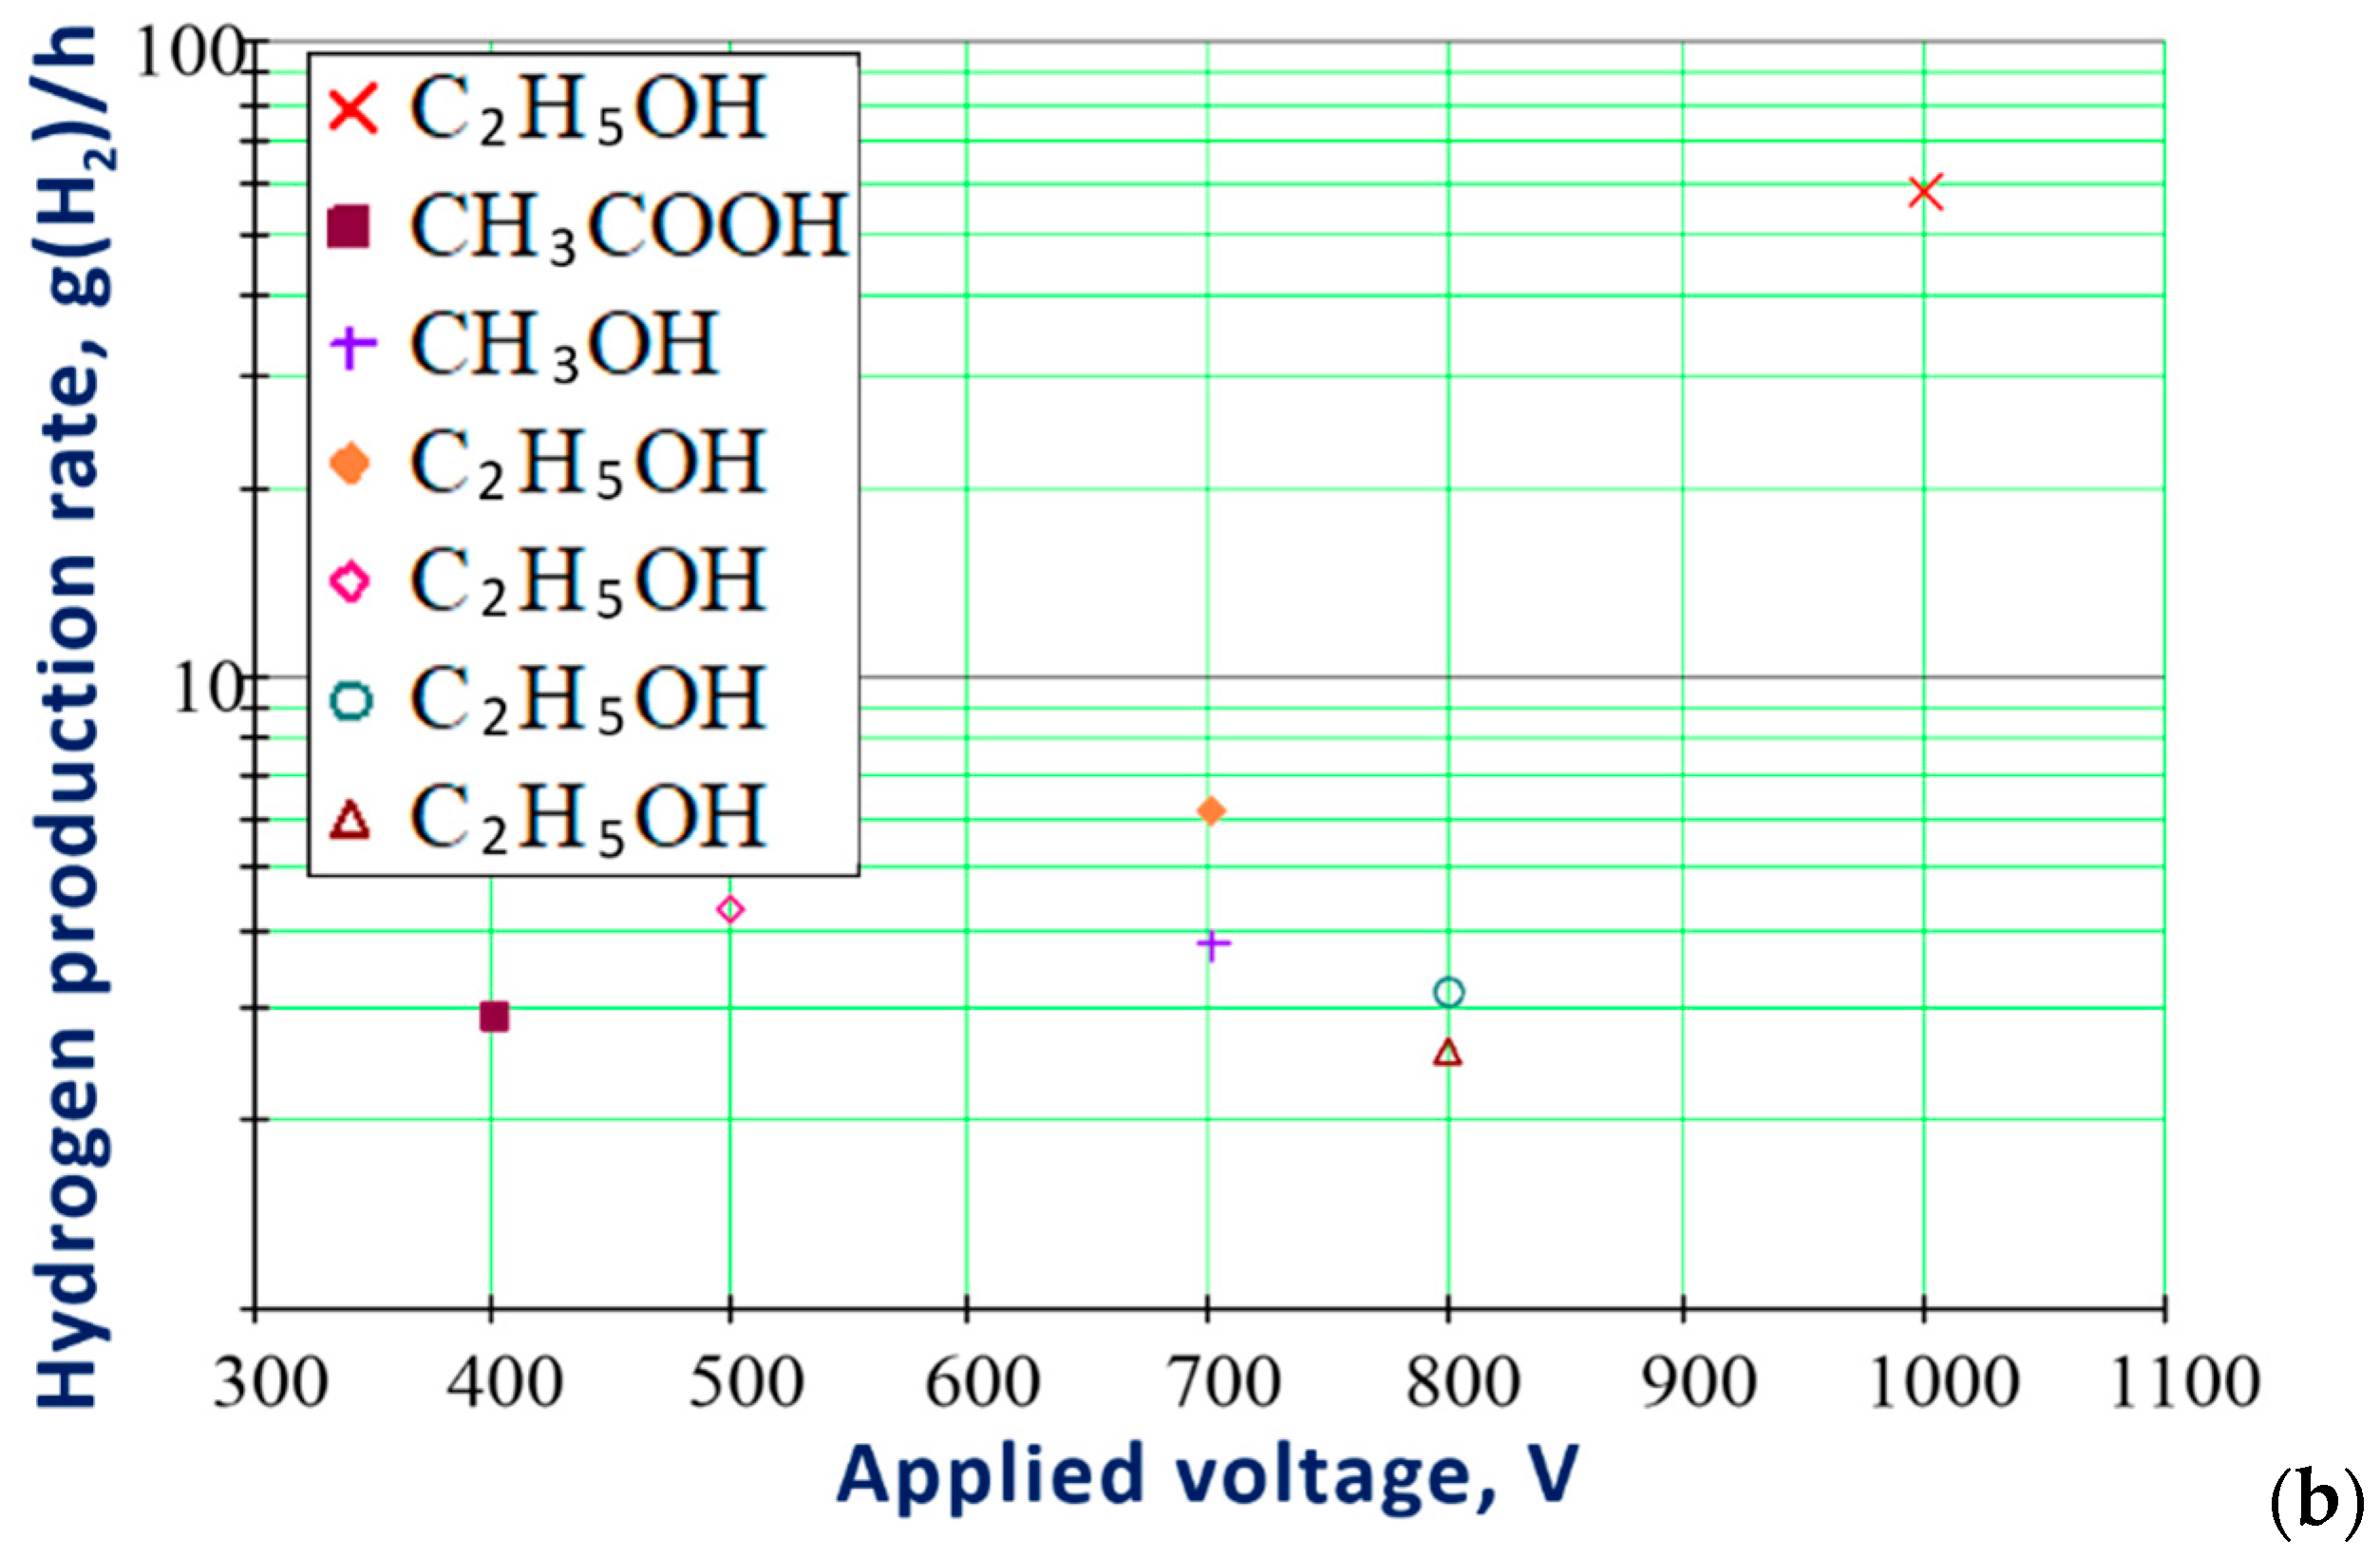
Electrolytic Solutions with Organic Additives

Figure 9a,b shows dot diagrams with the best results received thus far in terms of the energy efficiency (%), energy yield (g(H2)/kWh), and hydrogen production rate (g(H2)/h) as functions of the applied voltage in the cathodic regime of PDSE in the electrolytic solutions with organic additives: methanol (CH3OH), ethanol (C2H5OH), and acetic acid (CH3COOH) in various concentrations.
In the case of methanol and ethanol additives, the energy efficiency and the energy yield increase with the increasing applied voltage (Figure 9a) and, therefore, are unlike the electrolytic solutions with no additives (see Figure 8a). The highest energy efficiency of 46.3% was obtained for almost pure ethanol (with the concentration of 99.5 vol%), but at a very high applied voltage of 1000 V [33]. Lower values of the applied voltage and lower concentrations of the alcohols used in [62,63,64] resulted in the energy efficiencies below 5% (see details in Table 2).
Unlike PDSE in the electrolytic solutions with alcohol additives, the maximum energy efficiency of hydrogen production by PDSE in the electrolytic solutions with acetic acid occurs with a lower applied voltage. As shown in [61], the highest efficiency of 17.9% was achieved at only 400 V. There may be two reasons. First, the addition of acetic acid lowers the pH value of the electrolytic solution. The lower the pH value of the solution, the more hydrogen cations are formed. The second, the acetic acid, being a scavenger of hydroxyl radicals [61], reduces their concentration in the liquid-phase reaction zone near the discharge electrode. As shown above (see the reverse reactions of the hydroxyl radicals in Equations (13) and (14)), the hydroxyl radicals hinder the hydrogen production in PDSE. By lowering the concentration of hydroxyl radicals, the acetic acid enables a relatively high production of hydrogen at lower applied voltages.
The methodology chosen by us for the calculation of the energy efficiency of the hydrogen production by PDSE in the electrolytic solutions with organic additives (see notes below Table 2) resulted, in the case of the ethanol additive, in the overestimated energy efficiency of 46.3% (the highest among other cases shown in the diagram in Figure 9a). On the other hand, the energy yield of 57.59 g(H2)/kWh of the hydrogen production by PDSE in the electrolytic solutions with the ethanol additive is lower than using the methanol additive, with the highest energy yield of 67.32 g(H2)/kWh. This is because of the different values of the standard enthalpies taken into consideration when estimating the energy efficiencies of the hydrogen production by PDSE in the electrolytic solutions with organic additives. Thus, for the electrolytic solutions with the methanol and ethanol additives, the thermodynamically minimal energy consumptions (standard enthalpies) for production of one mole of hydrogen in methanol– (see Equation (30)) and ethanol–water (see Equation (32)) reforming were applied, respectively. In the case of the acetic acid as an additive, the thermodynamically minimal energy consumption (standard enthalpy) for the production of one mole of hydrogen in the water decomposition reaction (see Equation (28)) was considered to calculate the energy efficiency of hydrogen production by PDSE.
As seen from Figure 9b, using the aqueous solution of NaOH with the ethanol additive [36] resulted in the highest hydrogen production rate of 58.35 g(H2)/h, which is 21.4 times higher than that achieved with the typical aqueous electrolytic solution of K2CO3 [14] (see Figure 8b). However, the PDSE in the aqueous solution of NaOH with the ethanol additive operated at the higher applied voltage of 1000 V.

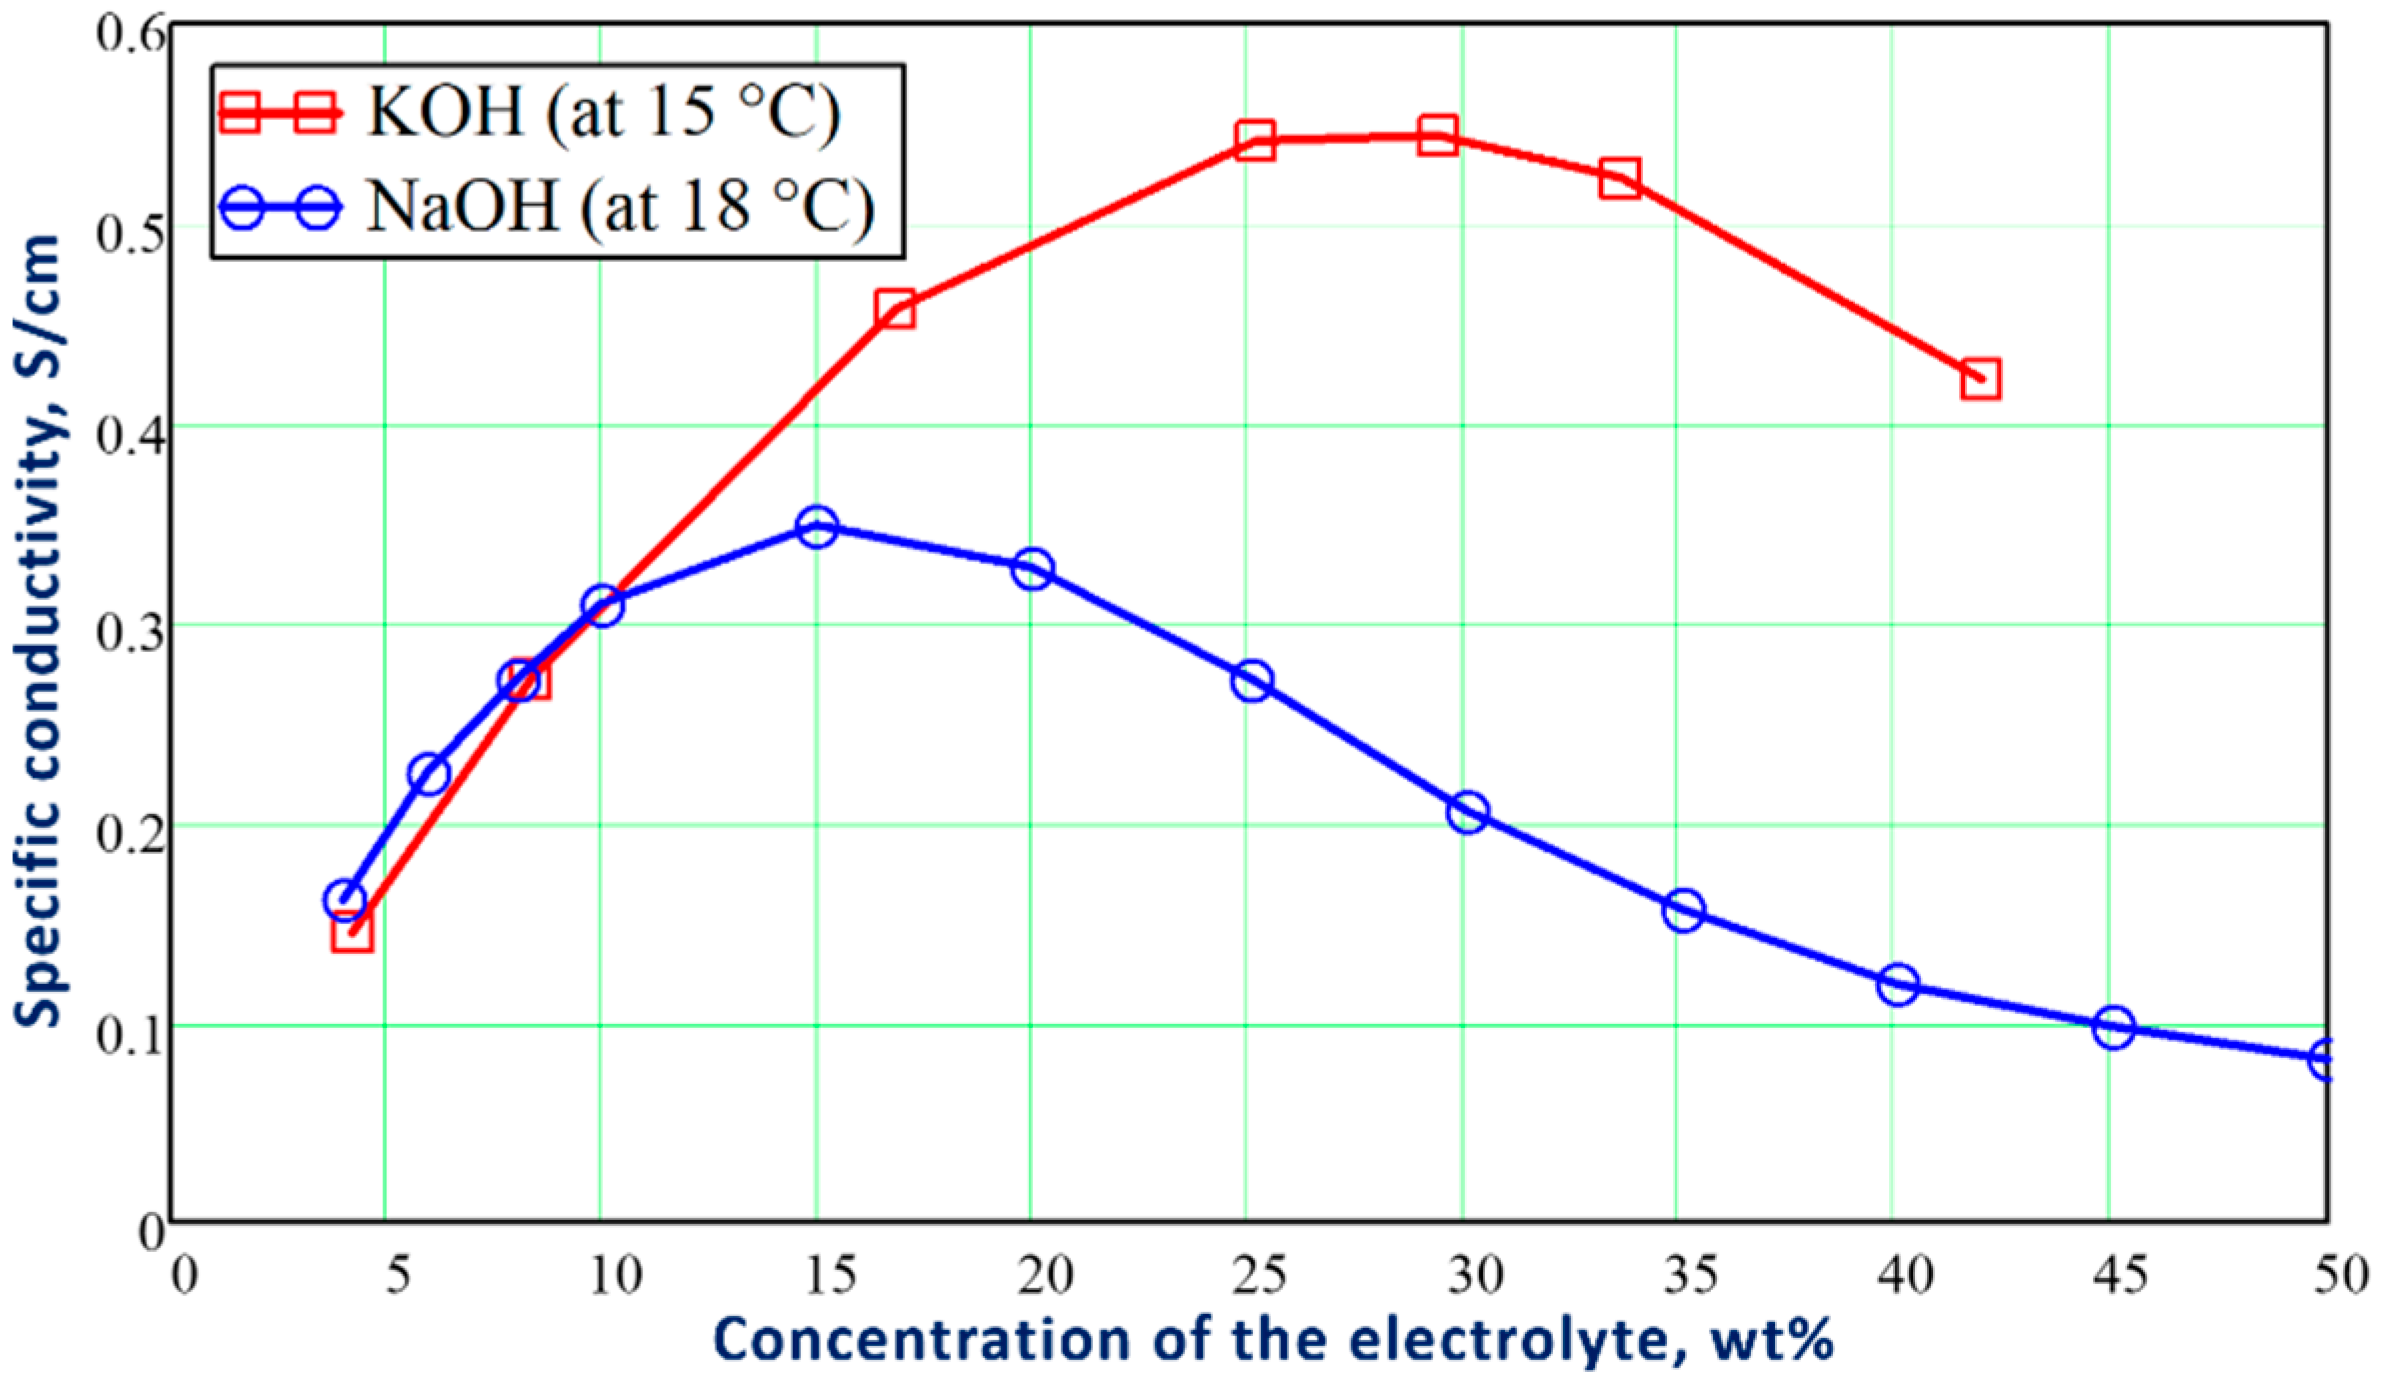
3.1.3. Influence of the Electrolyte Concentration

Zong Cheng Yan et al. [42] investigated the effect of the conductivity of the electrolytic solutions in the range of 3.43–16.68 mS/cm on the Faradaic efficiency and energy consumption for the hydrogen production in the anodic and cathodic regimes of PDSE. In the study, different electrolytes (such as NaOH, KOH, and H2SO4) were used with varying concentrations of the methanol additive in the range from 0 to 99.5 vol%. It was clearly shown that with increasing conductivity of the NaOH solution from 3.43 mS/cm to 16.68 mS/cm with the concentration of a methanol additive of 99.5 vol%, the Faradaic efficiency raised considerably, especially for the cathodic regime of PDSE, from 325 to 850 at 700 V of the applied voltage, whereas energy consumption decreased. A similar effect to that of Zong Cheng Yan et al. [42] of the solution conductivity on the Faradaic efficiency, hydrogen production rate, and energy consumption was also observed by Saksono et al. [60,61,62,63,64].
The above behavior can be explained by two factors. First, the higher conductivity of the electrolytic solution, the lower resistivity, and the lower energy losses are in the electrolytic cell. Second, as shown in [10,45,46,47], an increase in the conductivity of electrolytic solutions always results in a decrease in the discharge onset voltage in PDSE. This means that with higher conductivity of the electrolytic solutions, the plasma is more easily initiated at a lower applied voltage, decreasing the consumed energy.

3.1.4. Influence of the Type of Electrolyte

Previously, the hydrogen production in PDSE was investigated in saline, basic, and acidic electrolytic solutions. The results are presented in Table 2. The comprehensive study carried out by Zong Cheng Yan et al. [42] clearly showed that the most efficient hydrogen production occurred using the KOH electrolytic solution, which resulted in 40.8% of the energy efficiency. The energy efficiency of hydrogen production in PDSE when using the H2SO4 aqueous solution was only 23.8%. It is worth noting that in Faradaic electrolysis in acidic electrolytic solutions, especially in the H2SO4 aqueous solution, the hydrogen production rate is higher than that with alkaline aqueous solutions because of the higher concentration of the hydrogen cations as well as the higher conductivity of the H2SO4 aqueous electrolytic solution.
The lower energy efficiency of hydrogen production in PDSE of the H2SO4 aqueous electrolytic solution can be explained by the reverse reactions of the sulfur oxides [68,69], which, apparently, occur with the water droplets in the vicinity of the discharge plasma. The formation of sulfur oxide molecules near the plasma–liquid interface is likely caused by the decomposition of S O 4 2 ions.
However, the highest energy efficiency of 51.1% in PDSE was achieved when using the Na2CO3 aqueous electrolytic solution [16]. This can be explained by the CO2 and CO gases produced in the vicinity of the discharge plasma acting as the scavengers of the hydroxyl radicals. Unfortunately, the data presented in [16] are insufficient to estimate the maximal hydrogen production rate and Faradaic efficiency in PDSE of the Na2CO3 aqueous solution.

3.1.5. Influence of the Additives

As shown in Table 2, the use of organic additives in PDSE of the electrolytic solutions, such as alcohols and acetic acid, has a significant impact on the Faradaic and energy efficiencies, hydrogen production rate, and energy consumption. Compared to the most successful results received in PDSE thus far in the electrolytic solutions without additives [14], the addition of ethanol to the electrolytic solution [36] resulted in a 21.4-fold increase in the hydrogen production rate, a 15.8-fold increase in the Faradaic efficiency, a 3.6-fold increase in the energy efficiency, and a 17.9-fold decrease in the energy consumption. More promising for future technological implementation is methanol. The highest energy efficiency achieved with a methanol additive is 51.1% compared to 46.3% achieved with an ethanol additive. This increase can be explained by the thermodynamically minimal energy consumption (standard enthalpy) for producing one mole of hydrogen in methanol–water reforming (Equation (30)), which is lower than that in ethanol–water reforming (Equation (32)).
The positive effect of the alcohol presence in the electrolytic solution on the main parameters of hydrogen production in PDSE is a result of such attributes as [70]:
  • The high hydrogen to carbon ratio in alcohol molecules, which makes them a good source of hydrogen;
  • The low boiling point;
  • The low temperature of alcohol conversion into hydrogen;
  • The low heat of alcohol evaporation;
  • The low Gibbs free energy of the formation of alcohols (e.g., compared to water), resulting in low electrical energy input needed for alcohol decomposition.
Besides, CO2 and CO gases produced in the alcohol-water reforming act as scavengers of the hydroxyl radicals. The CO molecules produced in PDSE of the alcohol-water mixture can directly interact with water and water vapor, resulting in hydrogen production.

3.1.6. Influence of the Temperature of the Electrolytic Solution

The influence of the temperature of the electrolytic solution on hydrogen production in PDSE was a subject of investigations in [61,64,65].
Saksono et al. [61] showed that in PDSE of a Na2CO3 aqueous solution with a CH3COOH additive, an increase in the temperature of the electrolytic solution from 65–70 °C to 75–80 °C enabled a 2.2-fold reduction in the electrical energy consumption from 11.8 × 10³ kJ/mol(H2) to 5.3 × 10³ kJ/mol(H2). This corresponds to the increase in the energy yield of hydrogen production from 0.61 g(H2)/kWh to 1.36 g(H2)/kWh. Similar results were obtained by Saksono et al. for a KOH solution with an ethanol additive in [64]. In this case, an increase in the temperature of the electrolytic solution from 70 °C to 90 °C made it possible to increase the hydrogen production rate from 0.71 g(H2)/h to 2.12 g(H2)/h. The reduction in the energy consumption from 37.8 × 10³ kJ/mol(H2) to 2.18 × 10³ kJ/mol(H2) was also observed when the temperature of the electrolytic solution increased from 70 °C to 90 °C. This corresponds to the increase in the energy yield of hydrogen production from 0.19 g(H2)/kWh to 3.3 g(H2)/kWh.
Toth et al. [65] investigated the effect of temperature on the hydrogen production and Faradaic efficiency in PDSE of a H2SO4 aqueous solution in a wider temperature range from 5 °C to 85 °C. By changing the temperature in such PDSE, they found an increase in the hydrogen production rate from 2.47 × 10⁻⁴ g(H2)/h at 5 °C up to 4.56 × 10⁻⁴ g(H2)/h at 85 °C. They also recorded a 2.2-fold increase in the Faradaic efficiency at 85 °C.
Gupta and Singh [10] showed that at 7 °C, by applying a 0.02 M KHSO4 electrolytic solution, no stable plasma discharge was formed.
The effect of the temperature on the increase in hydrogen production and decrease in the energy consumption in PDSE can be explained by a higher water-vapor concentration at an elevated temperature of the electrolytic solution and, at the same time, less electrical energy consumption for heating of the electrolytic solution up to the evaporation temperature in the vicinity of the discharge electrode.

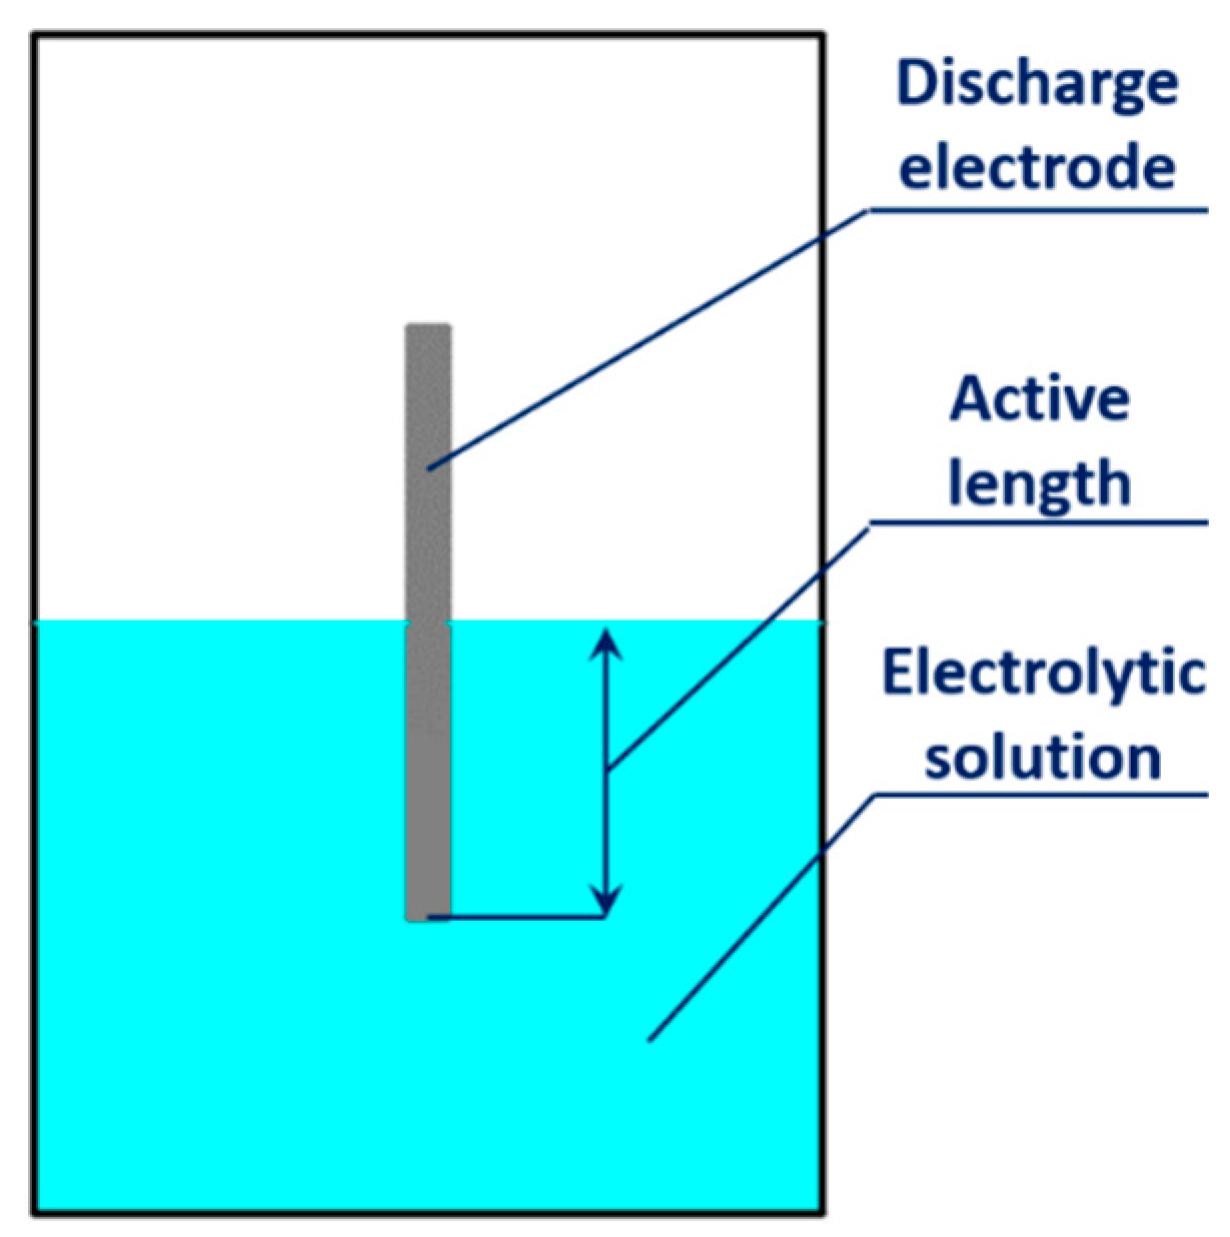
3.1.7. Influence of the Active Length of the Discharge Electrode

Saksono et al. [62,64] studied the hydrogen production in PDSE at different active lengths of a cylindrical discharge electrode. The active length of the discharge electrode is the length of that part of the discharge electrode which is immersed in the electrolytic solution (Figure 10). According to [62], the highest hydrogen production rate of 0.32 g(H2)/h was observed for 10 mm of the active length of the discharge electrode at 700 V of the applied voltage when the investigation was carried out in a 0.03 M NaOH aqueous solution for different active lengths of 5 mm, 10 mm, and 20 mm of the same discharge electrode.
In terms of the highest hydrogen production, the existence of the optimal active length of the discharge electrode results from the competition of several factors. At a constant applied voltage, the longer active length of the discharge electrode causes a higher electric current to flow through its surface exposed to the electrolytic solution. This was shown in [64], where the performance of PDSE in a 0.05 M KOH aqueous solution with 10 vol% of the ethanol additive was studied for the various active lengths of the discharge electrode (0 mm—the case when only the cathode tip touched the electrolytic solution surface; 10 mm; and 20 mm) at a constant applied voltage of 800 V. In these conditions, the higher electric current of 4.713 A passed through the electrolytic solution for an active length of 20 mm. This resulted in a lower hydrogen production rate of 0.62 g(H2)/h and the highest energy consumption of 43,670 kJ/mol(H2). However, the surface area exposed to the electrolytic solution is much less at a shorter active length of the discharge electrode. It acts as a bottleneck for the flow of electric current. It was also found in [64] that at the cathode active length of 0 mm (only the cathode tip touched the electrolytic solution surface), the electric current was 0.562 A, which resulted in 7660 kJ/mol(H2) of energy consumption and the lowest hydrogen production rate of 0.42 g(H2)/h achieved. In [64], the optimal value of the active length of the discharge electrode was found to be 10 mm when the electric current of 0.724 A passed through the electrolytic solution, providing the highest hydrogen production rate of 2.08 g(H2)/h and the lowest energy consumption of approximately 2010 kJ/mol(H2).
An interesting feature of PDSE related to electrode positioning was reported by Chaffin et al. in [71]. They found that PDSE can also be initiated without immersing the discharge electrode in the electrolytic solution. In this case, the plasma discharges are initiated in a gap between the discharge electrode tip and the electrolytic solution surface. However, as shown by Toth et al. [65], placing the cathode 1 mm above the electrolytic solution surface resulted in a hydrogen production rate of 4.56 × 10⁻⁴ g(H2)/h and an energy efficiency of 0.3%, which are the lowest in comparison with the cases where the discharge electrode was immersed in the electrolytic solutions (see Table 2).

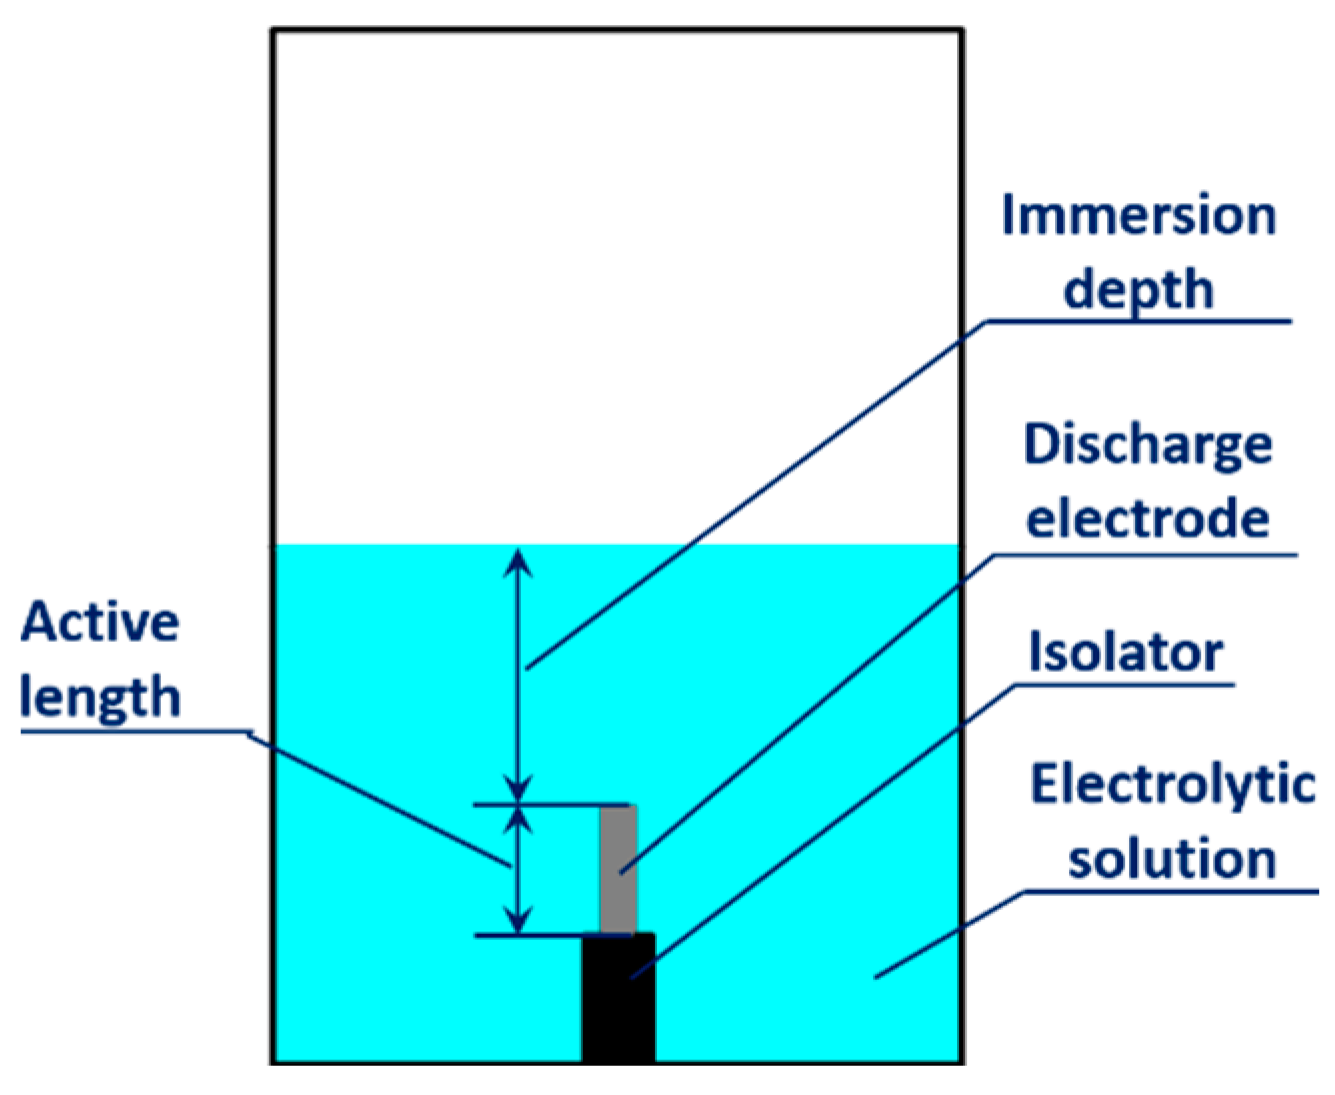
3.1.8. Influence of the Immersion Depth of the Discharge Electrode

The effect of the electrode immersion depth at the constant active surface area of the discharge electrode on the energy consumption for hydrogen production in the cathodic regime of PDSE was studied in [63]. The discharge electrode, fully immersed in the electrolytic solution (Figure 11), was installed vertically at the bottom of the electrolytic cell. The electrode immersion depth was defined as the distance between the discharge electrode tip and the surface of the electrolytic solution. The results showed that the highest hydrogen production rate of 5.32 g(H2)/h was obtained for the immersion depth of 66 mm. This was the deepest possible immersion of the discharge electrode in this electrolytic cell. However, such deep immersion resulted in the highest energy consumption of 2.66 MJ/mol(H2). On the other hand, a shallow immersion, when the distance between the discharge electrode tip and the surface was 0 mm (the tip of the immersed discharge electrode touched the electrolytic solution surface), resulted in the lowest hydrogen production rate of 2.17 g(H2)/h. Such dependences on the hydrogen production rate and the energy consumption on the immersion depth suggest that the abundance of the electrolytic solution above the discharge electrode tip plays an essential role in hydrogen production in PDSE.

3.2. Comparison of PDSE with Other Methods of Hydrogen Production

3.2.1. Comparison of PDSE with Other Plasma-Assisted Methods

Various plasma-assisted methods have been used to produce hydrogen, such as PDSEs, gliding arcs, dielectric-barrier discharges (DBDs), Laval nozzle arc discharges, microwave plasma, spark discharges, and pulsed discharges. Table 4 shows the current potential of the plasma-assisted methods with liquid feedstock for hydrogen production, including the best results achieved using PDSE [14,16,36,42]. This potential is described by two parameters: the hydrogen production rate and the energy yield of hydrogen production.
It can be found in Table 4 that in some papers [82,86,87], surprisingly large values of the energy yield of hydrogen production were reported (marked by asterisks * in Table 4). They are larger than the thermodynamically minimal energy consumption (standard enthalpy) in methanol–water and ethanol–water reforming. We have included these results in Table 4 to ensure the completeness of the review.
If we omit the results of the energy yield marked by asterisks * and that determined based on LHV for ethanol [83], we can summarize the results presented in Table 4 as follows: the energy yield of 84.34 g(H2)/kWh achieved in PDSE of the methanol–water mixture is the highest in comparison to the energy yields obtained with other plasma-assisted methods for hydrogen production. Unfortunately, the second most important parameter, the hydrogen production rate, is not known in this case [16]. However, the hydrogen production rate of 58.35 g(H2)/h, obtained in PDSE of the ethanol–water mixture in [36], may suggest that this parameter may also have a high value (about 50–100 g(H2)/h) in PDSE of the methanol–water mixtures, which would be attractive to the industry.
In summary, Table 4 shows the advantages of PDSE over other plasma-assisted methods in terms of the hydrogen production rate and energy yield. Currently, PDSE offers hydrogen production at a production rate of 50–100 g(H2)/h and an energy yield of around 85 g(H2)/kWh.

3.2.2. Comparison of PDSE with AEL, PEMEL, SOEL, and Natural Gas Reforming

Table 5 presents the values of the hydrogen production rates and energy yields achieved in alkaline electrolysis (AEL), polymer electrolyte membrane electrolysis (PEMEL), solid oxide electrolysis (SOEL), and PDSE in different electrolytic solutions (feedstocks).
  • Hydrogen production by AEL is the most mature technology from those presented in Table 5. The cell operates at a low temperature of 60–90 °C compared to SOEL and may produce hydrogen at the largest production rate of 125.8 kg(H2)/h [31]. However, due to the thermodynamic limit imposed by the standard enthalpy of water (see notes below Table 2) and the cell efficiency, the current energy yield of hydrogen production is in the range of 18.7–21.4 g(H2)/kWh.
  • PEMEL has an advantage over AEL since it needs pure water only as a feedstock. The solid membrane serves as the electrolytic solution, and the electrochemical cell operates at a low temperature of 50–80 °C. On the other hand, the noble metals (Pt, Ir) are required for constructing the electrodes, and PEMEL has a slightly lower energy yield of hydrogen production compared to AEL, which varies in the range of 18–20.4 g(H2)/kWh [31].
  • As can be seen from Table 5, in comparison to AEL, PEMEL, and PDSE of the typical electrolytic solutions, SOEL exhibits a significantly higher energy yield of 30 g(H2)/kWh [31]. However, the proper operation of SOEL requires a very high cell temperature in the range of 700–1000 °C. Additional thermal energy must be supplied to generate steam and maintain the cell temperature at this level. As this additional energy was not taken into account in determining the energy yield in [31], the actual value of the energy yield is lower than 30 g(H2)/kWh.
  • The energy yield in PDSE of a typical electrolytic solution is meager compared to AEL, PEMEL, and SOEL. In [14], it was equal to 3.21 g(H2)/kWh, corresponding to 12.7% of the energy efficiency. This is because of the significant electrical energy consumption for the electrolytic solution evaporation, containing mainly water, and the formation of the gas–vapor envelope around the discharge electrode. In PDSE of the electrolytic solution with a methanol additive [16], the energy yield of hydrogen production is 3.9 times higher compared to AEL, 4.1 times greater compared to PEMEL, and 2.8 times greater than SOEL. This can be explained by four reasons: (i) the boiling point and heat capacity of the methanol–water mixture are much lower than that of water and, whereby, less heat is consumed to reach the boiling point; (ii) the low heat of methanol evaporation, as less energy is consumed to form the gas–vapor envelope around the discharge electrode; (iii) the much higher relative content of hydrogen in a methanol molecule compared to the water molecule; and (iv) the much lower energy consumption for methanol–water reforming (see Equation (30)) compared to water decomposition (see Equation (28)). This makes PDSE of the methanol–water mixture attractive for hydrogen production in the future.
Currently, the most commercially developed method for hydrogen production is natural gas (methane) steam reforming. It is interesting to compare it with PDSE in terms of the energy yield of hydrogen production. In natural gas steam reforming, hydrogen production occurs according to the following thermochemical reaction:
C H 4 g a s + 2 H 2 O l i q u i d 4 H 2 g a s + C O 2 g a s ,   Δ H R ,   298 0 = + 252.71   kJ mol
As seen from Equation (33), in natural gas steam reforming, 4 moles of hydrogen are produced per 1 mole of methane and 2 moles of water consumed. The enthalpy needed for water evaporation is taken into account in Equation (33). The reaction of Equation (33) is endothermic and requires theoretically 252.71 kJ/mol of heat, which means 63.18 kJ of heat per 1 mole of hydrogen produced. This is the thermodynamically minimal energy consumption needed to produce one mole of hydrogen. This value is higher than those in methanol– (43.59 kJ/mol) and ethanol–water (57.93 kJ/mol) reforming, given in Equations (30) and (32), respectively. This suggests that PDSE of alcohol–water mixtures can be competitive in terms of the energy yield of hydrogen production in the future.
Practically, the energy efficiency of natural gas steam reforming, estimated on an HHV basis, is 69.7% [88], which corresponds to the energy yield of hydrogen production of 79.43 g(H2)/kWh. This value is 5.8% lower compared to the best result achieved in the hydrogen production by PDSE of the methanol–water mixture, i.e., 84.34 g(H2)/kWh (Table 5, [16]). However, at the current stage of development of the PDSE method, this comparison is only speculative because, in order to determine the actual competitiveness of the technologically immature PDSE method with the highly developed steam reforming of natural gas, many other factors must be taken into consideration, e.g., the hydrogen separation issue, disintegration of the discharge electrode, etc.

3.3. Advantages and Disadvantages of PDSE as the Hydrogen-Producing Method

Based on our analysis of previously published investigations of hydrogen production, we list some of the advantages of hydrogen production by PDSE of the electrolytic solutions:
  • High Faradaic efficiency. The Faradaic efficiency in PDSE of typical electrolytic solutions is 80 times higher than in AEL and PEMEL, whereas the Faradaic efficiency in PDSE of the KOH electrolytic solution with a 99.5 vol% methanol additive is 2256 times greater than in AEL and PEMEL, as shown in [15] and [42], respectively. AEL and PEMEL have the Faradaic efficiency, which is always less than unity.
  • Low operating current. According to [10], to sustain the plasma state in PDSE in the typical cell with a 0.02 M KHSO4 aqueous solution, the minimum operating current and voltage needed are 70 mA and 280 V, respectively, whereas in AEL, PEMEL, and SOEL in the cell of similar dimensions, the operating current usually is hundreds of amperes or higher. Thus, compared to AEL, PEMEL, and SOEL, a lower operating current in PDSE results in low electrical energy losses due to the Joule heat, which is in direct proportion to the square of the operating current.
  • High diffusion coefficient of hydrogen molecules. The diffusion coefficient of hydrogen molecules in a gas is approximately 25,000 times higher than in water (1.132 × 10⁻⁴ m2/s in gas versus 4.5 × 10⁻⁹ m2/s in water [89]). According to [71], the high velocity of the hydrogen transport through the gas-phase plasma-bounding region might replace the low-speed diffusion of hydrogen molecules through the liquid phase, which is currently used in AEL and PEMEL. This, in turn, increases the hydrogen production rate and energy yield.
  • Fast kinetics of the hydrogen-producing reaction. Hydrogen production based on PDSE provides a unique opportunity to carry out the water decomposition with exceptionally fast kinetics due to the high gas temperature and high-temperature electrons in the plasma region. This can be a new way of developing novel electrochemical cells where electrodes are in the form of a gas-phase plasma, as shown in [12,90].
  • Non-precious hydrogen production. Since in PDSE, the discharge electrode operates at a high temperature, the precious metals as catalysts are not needed as compared to PEMEL.
  • Simultaneous Faradaic hydrogen production. In addition to the water/water-vapor decomposition initiated by the plasma discharges, in PDSE, the Faradaic electrolysis also occurs in the vicinity of the discharge electrode generating some portion of hydrogen, namely, the Faradaic hydrogen yield. This Faradaic hydrogen yield can be easily estimated using Faraday’s first law of electrolysis, and the value of the electric current passed through the electrolytic solution.
  • The high energy yield of hydrogen production. In PDSE of a water–methanol mixture, the energy yield of hydrogen production is higher than those of AEL, PEMEL, SOEL, natural gas steam reforming, and other plasma-assisted methods, as shown in Section 3.2.
  • Onboard hydrogen-on-demand (HOD) production. Hydrogen production by PDSE can be successfully applied in so-called onboard hydrogen-on-demand (HOD) systems, as shown in [91].
We can also list several disadvantages of hydrogen production by PDSE:
  • Disintegration of the discharge electrode. In PDSE, the discharge electrode operates under the hard-thermal conditions, which cause its disintegration. Even a tungsten electrode with a melting temperature of about 3000 K disintegrates.
  • Hydrogen separation. In PDSE, hydrogen and oxygen are produced simultaneously in the same reaction regions of the discharge electrode, as shown in Equation (16). That is why some absorption or membrane separation techniques must be applied to separate hydrogen from other gases produced.
  • Low energy efficiency. The highest energy efficiency reported in PDSE of the typical electrolytic solutions is only 12.7%, whereas in PDSE of the electrolytic solutions with a methanol additive, the highest energy efficiency is 51.1%.
  • Temperature requirements. PDSE can easily be induced in the electrolytic solutions with elevated temperatures rather than at a low temperature of the electrolytic solution, as shown in Section 3.1.6.
  • Conductivity requirements. The conductive type of electrolytic solutions must be used to initiate the Faradaic electrolysis and its further transformation to PDSE by increasing the applied voltage.

4. Conclusions

From the comprehensive analysis of the published results thus far on the hydrogen production by PDSE of the aqueous electrolytic solutions, the following conclusions can be drawn:
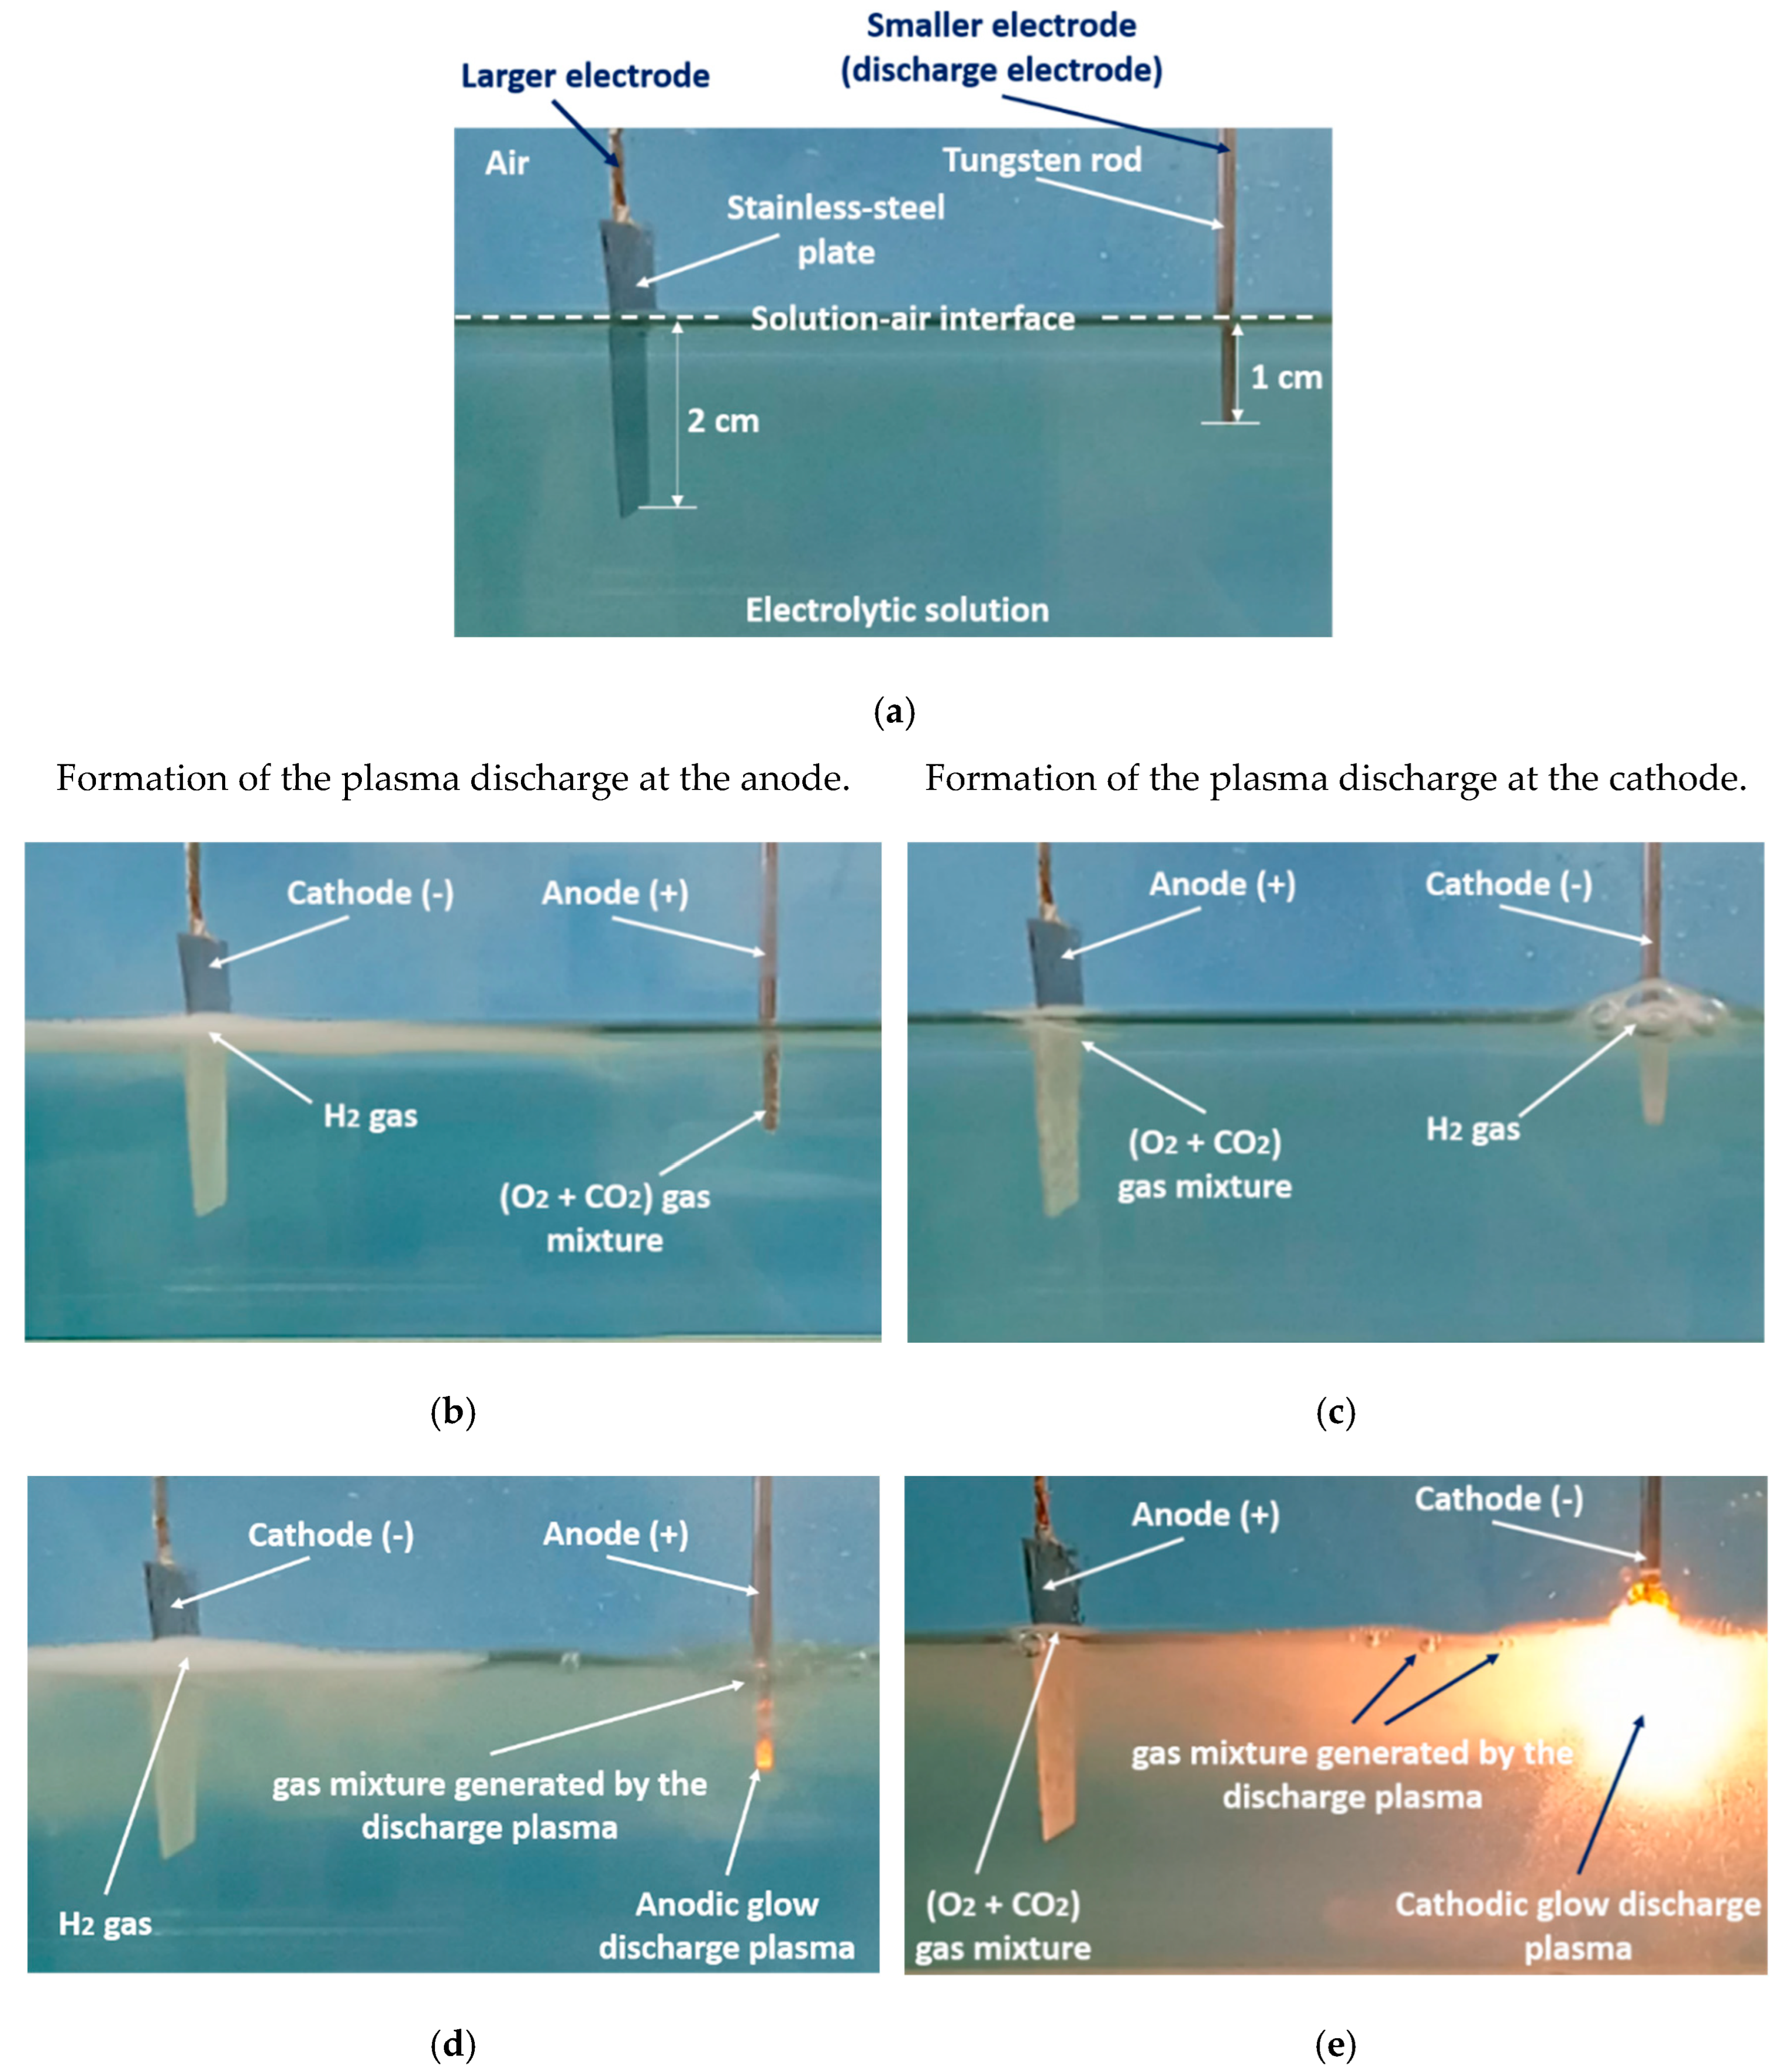
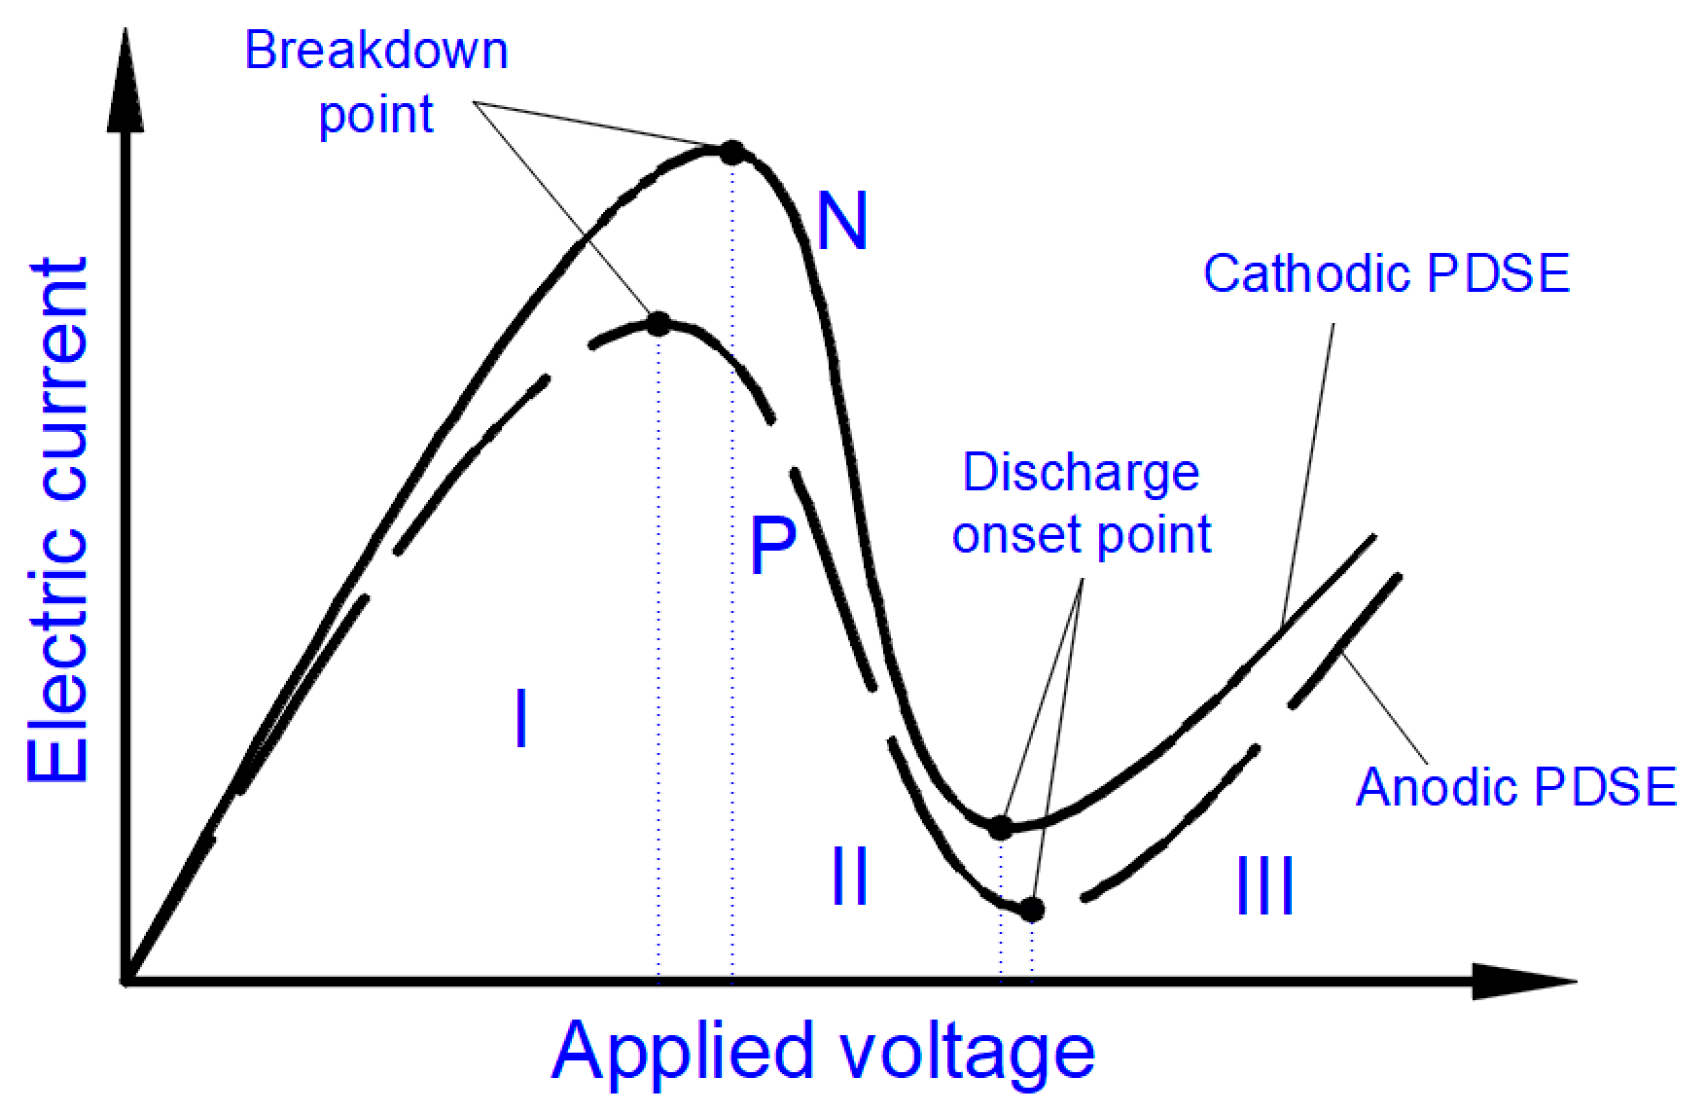
  • Before the formation of PDSE at the smaller electrode immersed in the electrolytic solution, a sequence of physicochemical and physical processes occurs when increasing the applied voltage. These processes are Faradaic electrolysis, the Joule heating of the electrolytic solution, the solvent evaporation and formation of the gas–vapor envelope around the smaller electrode, ionization of the gas–vapor mixture within the envelope, and induction of the electrical discharge plasma in it.
  • PDSE is formed at the electrode of a smaller active surface area regardless of the voltage polarity. If the smaller electrode is positively charged (being an anode), the glow-discharge plasma formed around the electrode is called anodic. Accordingly, the operating regime of PDSE is called anodic. On the other hand, if the smaller electrode is negatively charged (being a cathode), the glow-discharge plasma formed around the electrode and the corresponding operating regime is called cathodic.
  • In the anodic and cathodic regimes of PDSE, the plasma around the discharge electrode acts as the positive and negative electrodes, respectively, whereas the opposite electrode serves as the counter electrode. A lower applied voltage (called the discharge onset voltage) is required to initiate the cathodic regime of PDSE compared to the anodic one. For example, the discharge onset voltage in the cathodic regime of PDSE in a 10 wt% Na2CO3 aqueous solution is 52 V, whereas it is 60 V in the anodic regime of PDSE.
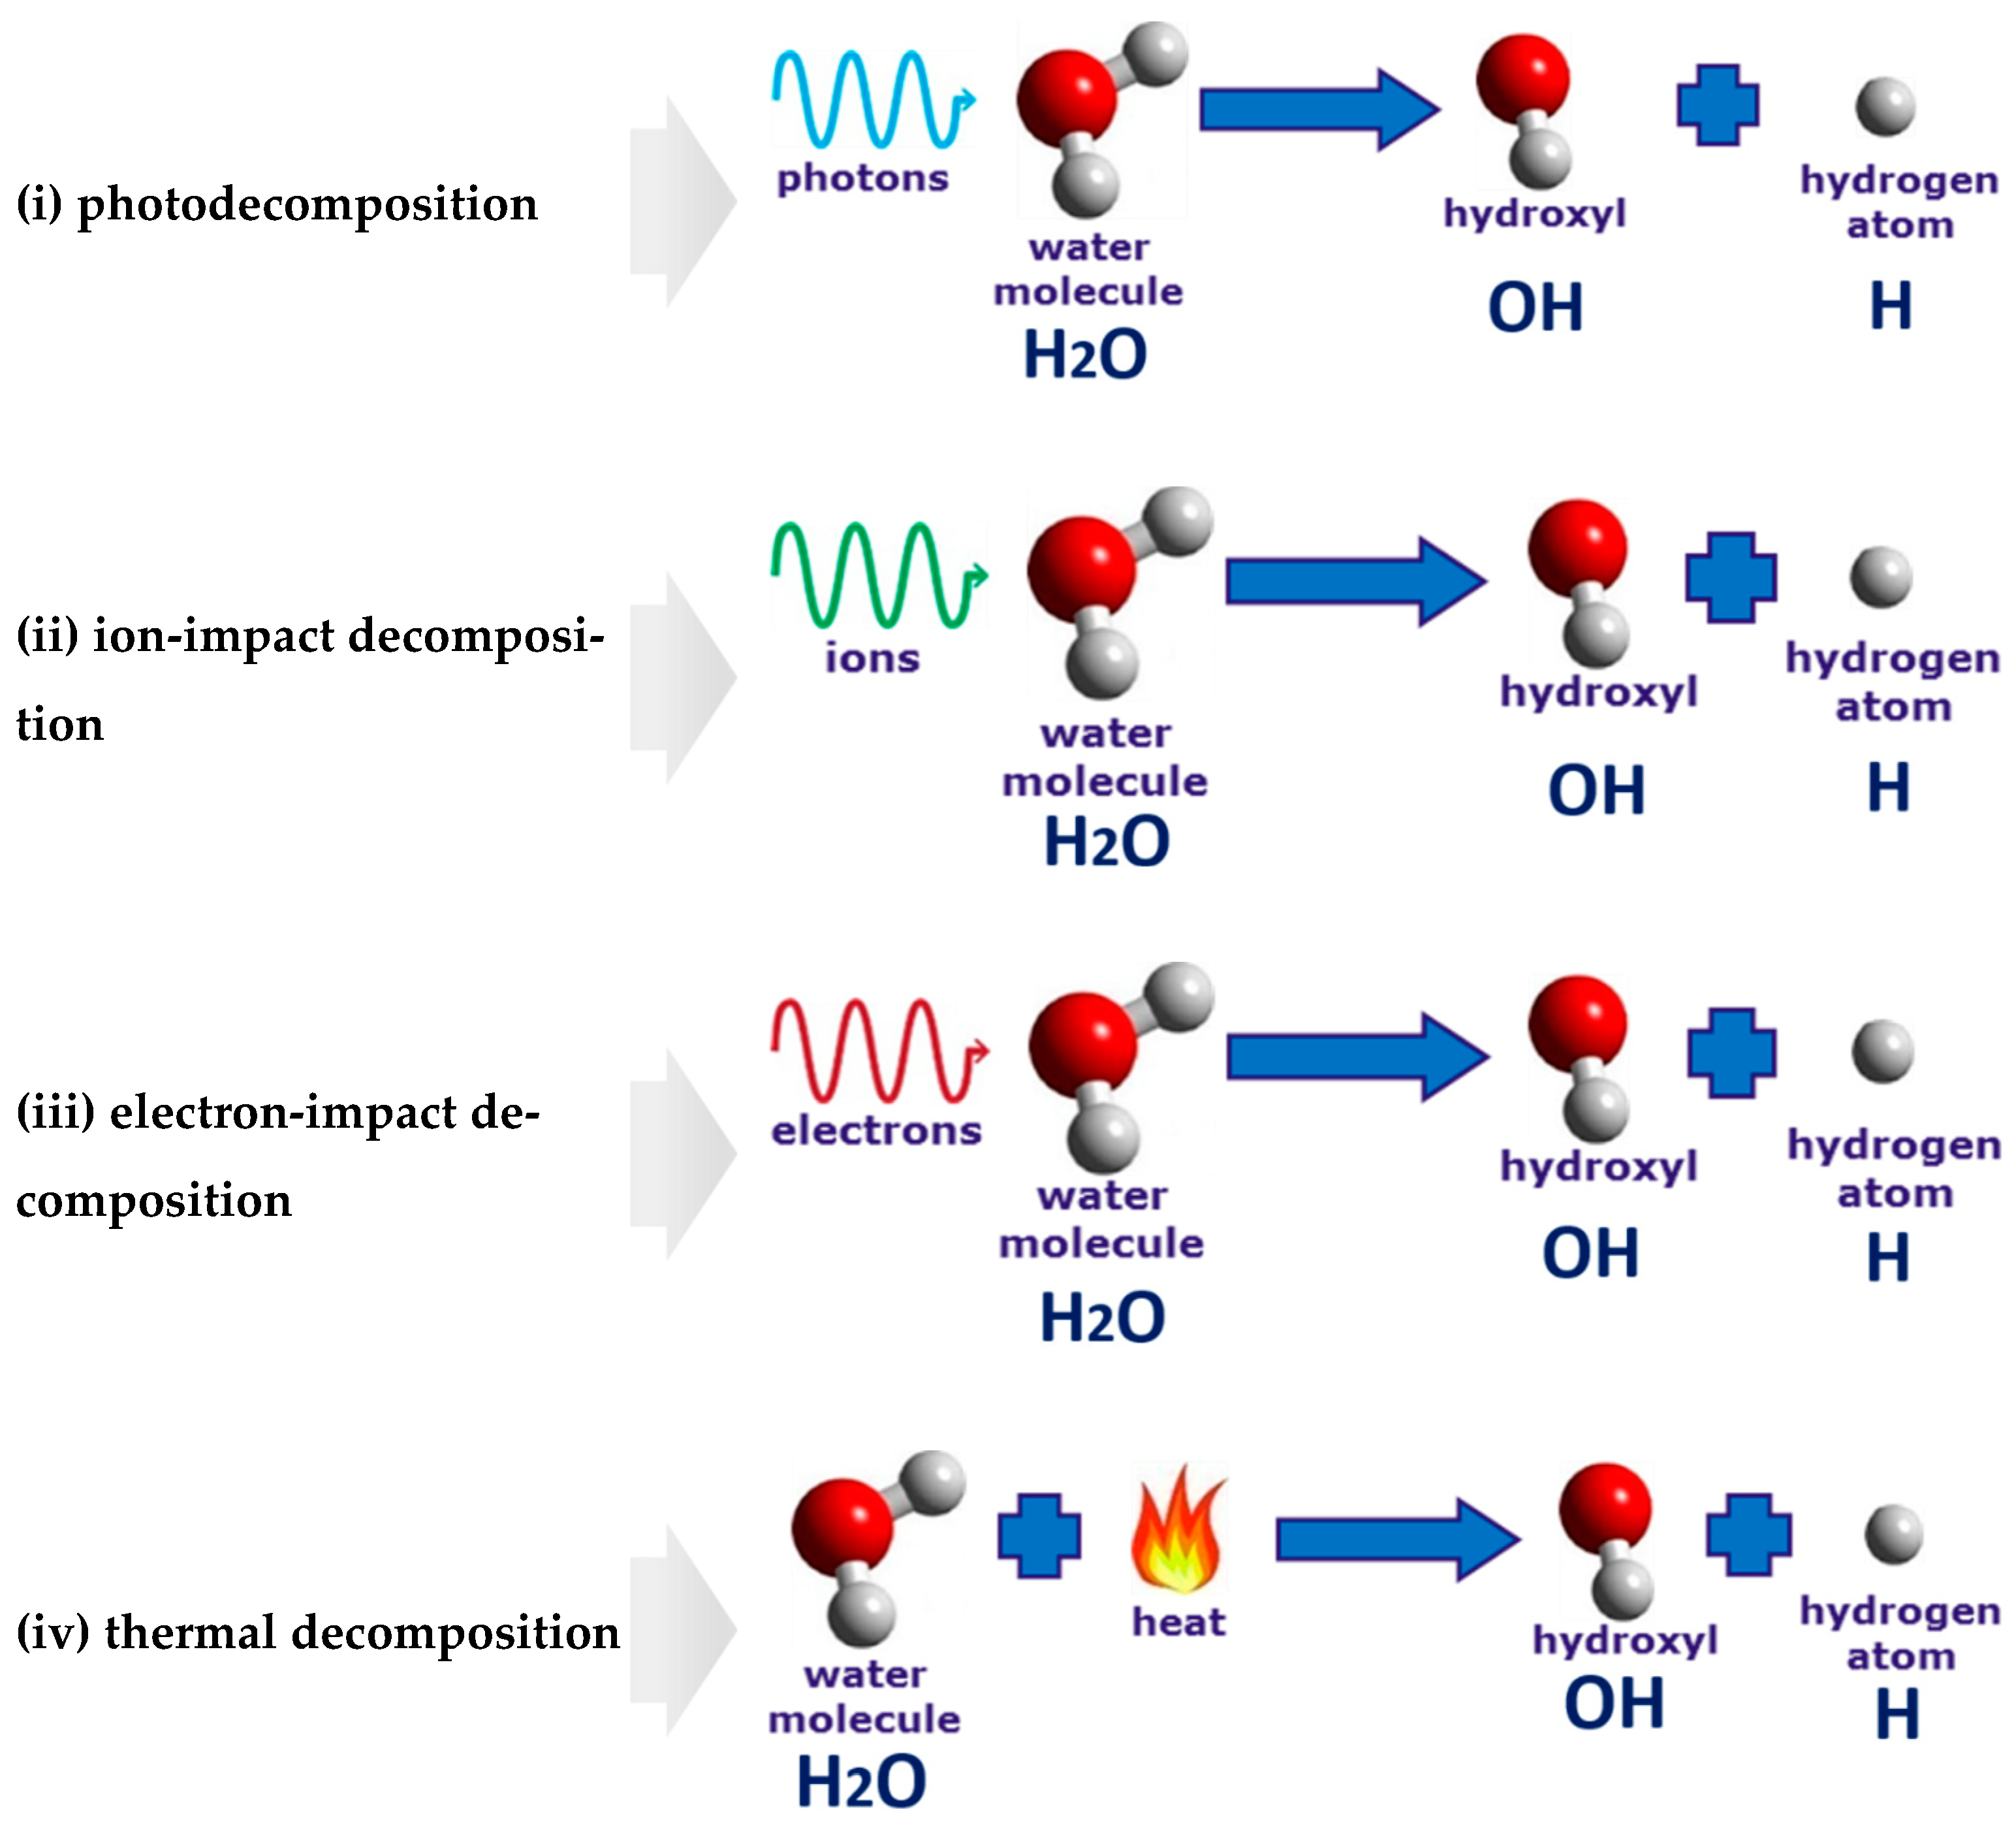
  • In the cathodic and anodic regimes of PDSE, complex physicochemical and physical processes occur in two reaction zones (the plasma region and the interfacial region) around the discharge electrode, leading to the decomposition of water into hydrogen and hydroxyl radicals. These processes are: Faradaic electrolysis, photodecomposition, ion-impact decomposition, electron-impact decomposition, and thermal decomposition. The first process is responsible for producing the Faradaic yield (products), whereas the last four processes are responsible for the production of the non-Faradaic yield (products). The reverse reaction of the hydroxyl radicals (Equations (13) and (14)) results in the formation of hydrogen peroxide, which hinders the hydrogen production in PDSE.
  • In the cathodic regime of PDSE, the non-Faradaic yield (extra H2 yield over the Faradaic yield of H2, O2, and H2O2 yields) accounts for about 75% of the substances produced in the plasma region and about 25% of the substances produced in the interfacial region. In contrast to the cathodic regime of PDSE, at the discharge electrode in the anodic regime of PDSE, only about 20% of this extra amount of substances (extra O2 yield over the Faradaic yield of O2, H2, and H2O2 yields) are produced in the plasma region, and 80% is derived from the interfacial region.
  • The following parameters were found to have a significant impact on the hydrogen production in PDSE of the electrolytic solution: the discharge polarity, applied voltage, concentration of the electrolytic solution, type of the electrolyte, presence of the organic additives, temperature of the electrolytic solution, active length of the discharge electrode exposed to the electrolytic solution, and immersion depth of the discharge electrode. We conclude that:
    • The cathodic discharge polarity in PDSE is more beneficial for hydrogen production than the anodic one since it provides dozens of times higher hydrogen production rates, and Faradaic and energy efficiencies.
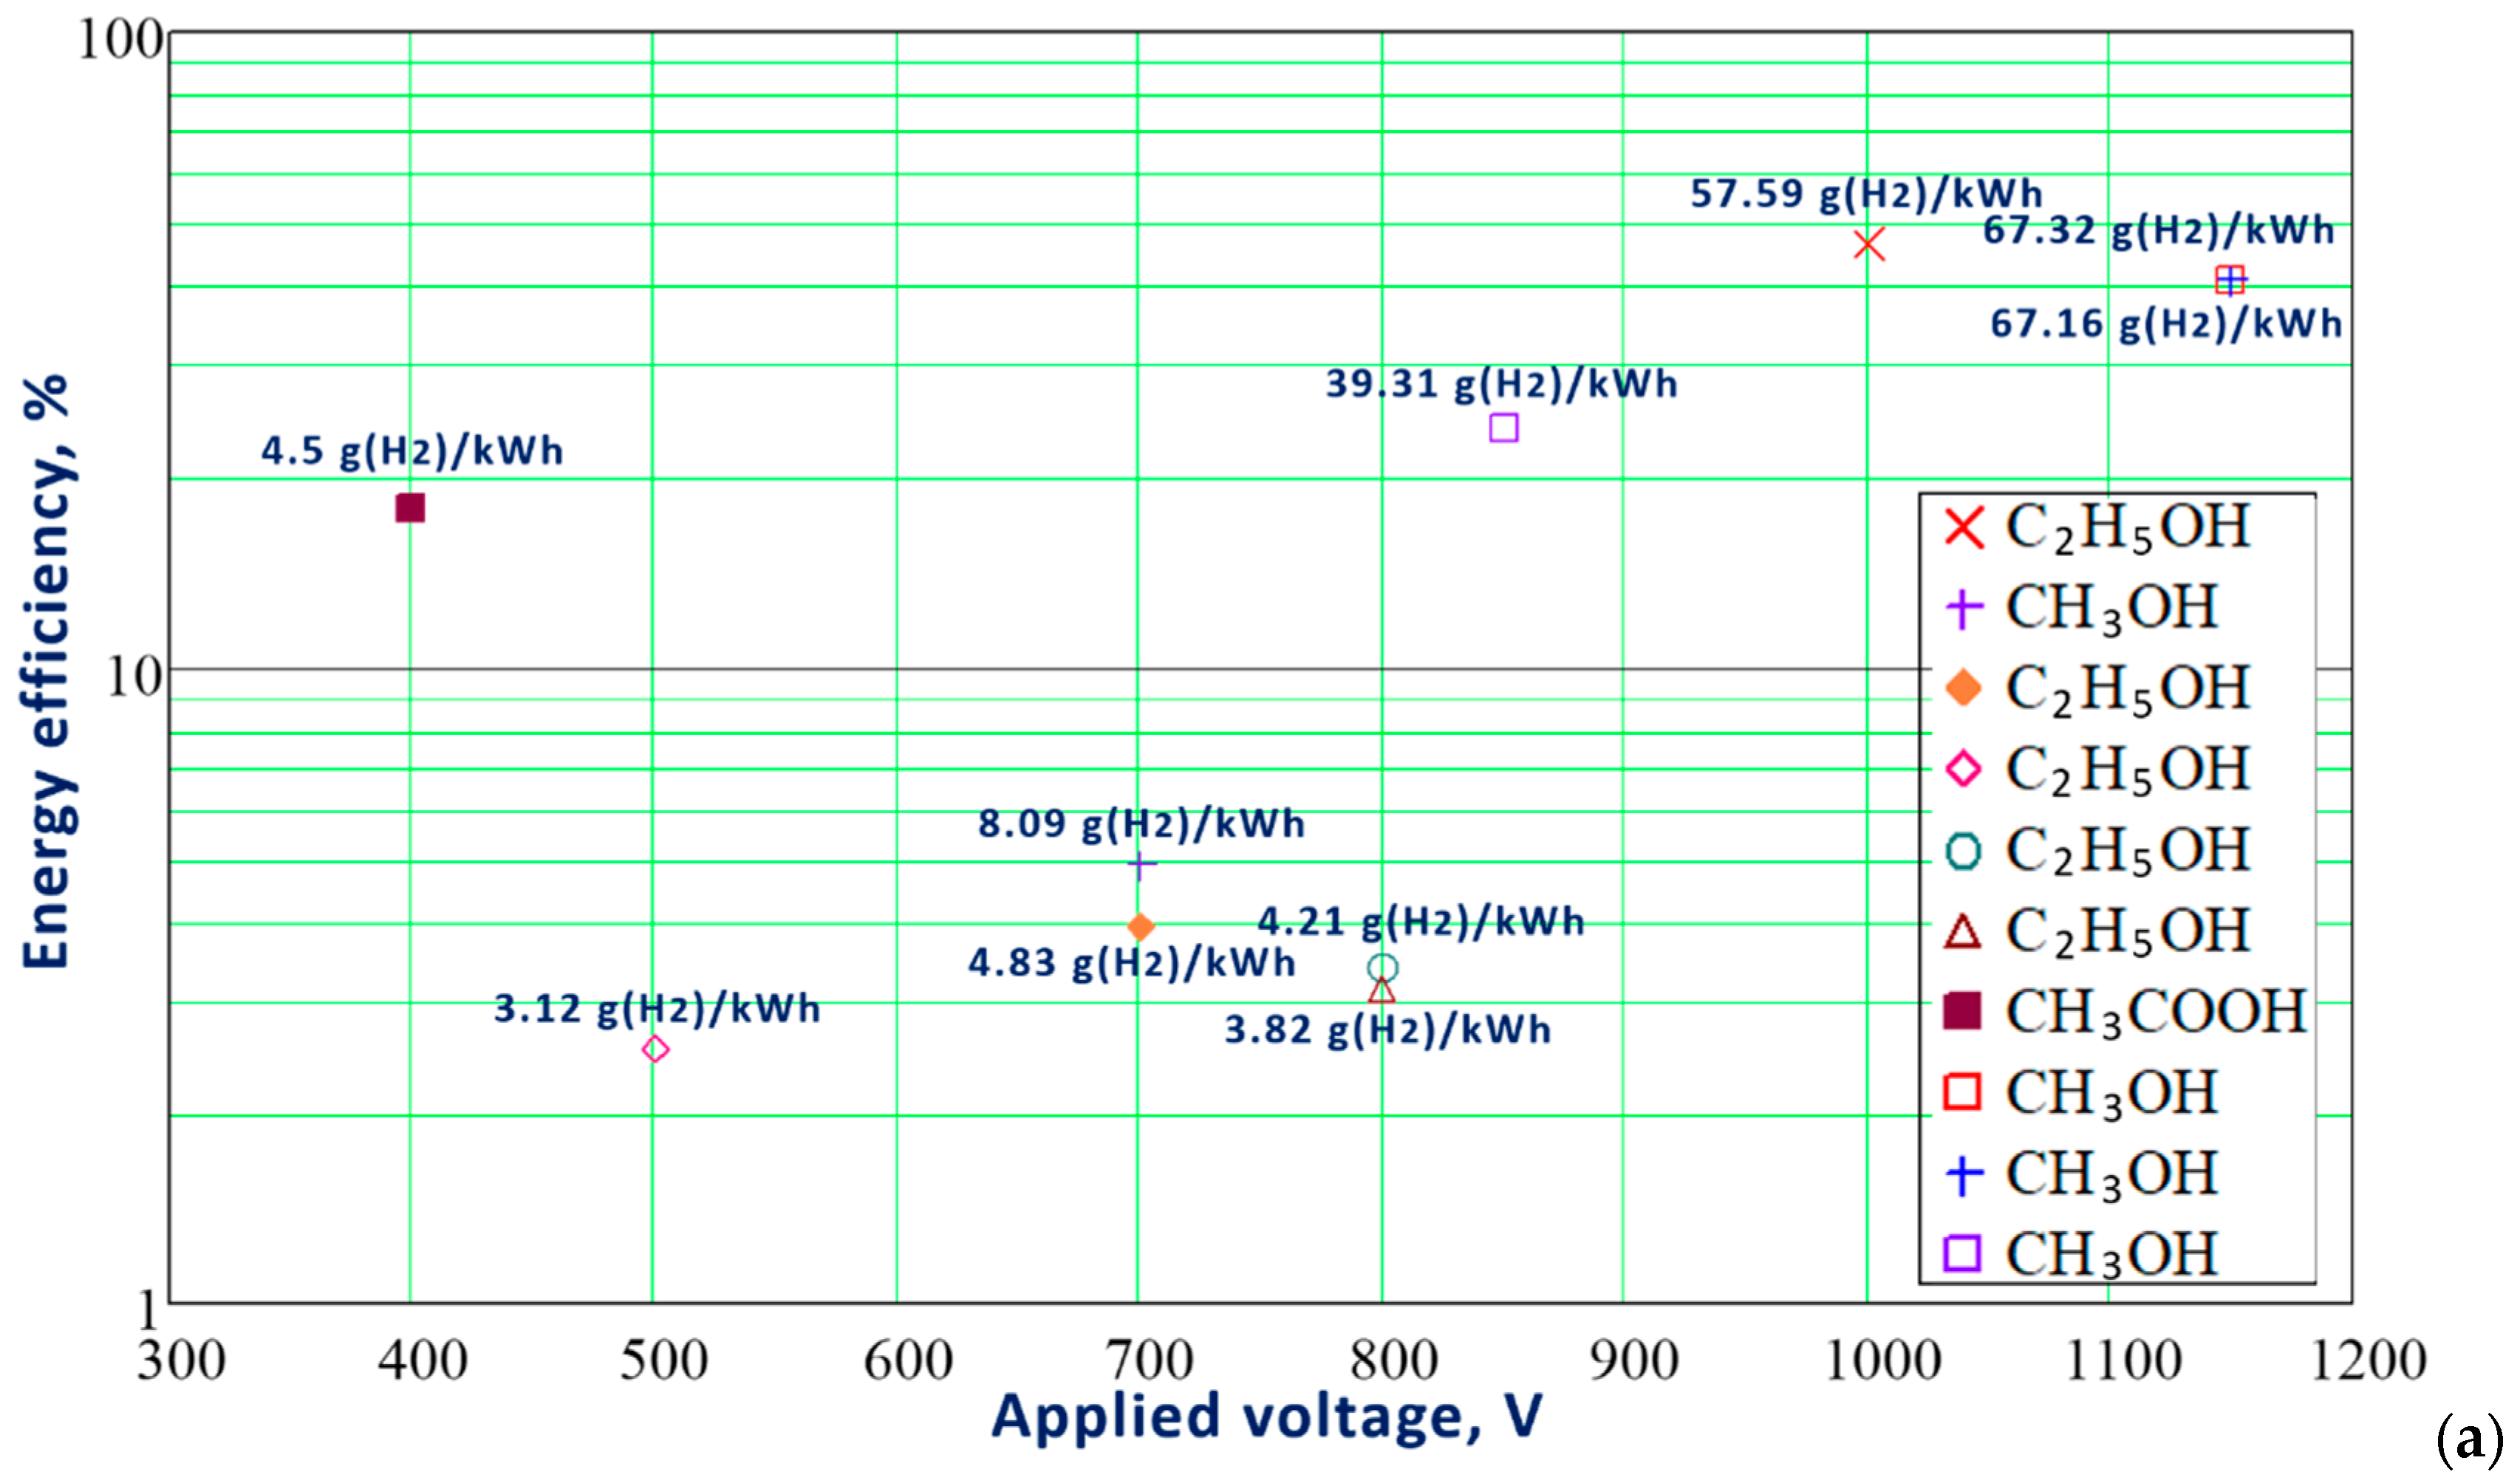
    • In the cathodic regime of PDSE, in the range of the applied voltage between 200 V and 700 V, the best result of the energy efficiency of 12.7% was received by Mizuno et al. [14] in a 0.2 M K2CO3 aqueous solution at 350 V of the applied voltage. This value of the energy efficiency corresponds to the energy yield of hydrogen production of 3.21 g(H2)/kWh.
    • In the cathodic regime of PDSE in the electrolytic solutions with the organic additives (methanol, ethanol) of a high concentration, a relatively high voltage of 1000 V should be applied for efficient hydrogen production. The highest energy efficiency of 46.3% and a hydrogen production rate of 58.35 g(H2)/h were achieved for ethanol.
    • Increasing the electrolyte concentration up to the optimal value, providing the highest electrical conductivity, is recommended. In the optimal concentration of the electrolyte, the electrolytic cell possesses the lowest electrical energy losses and the lowest value of the discharge onset voltage.
    • The presence of organic additives, notably, alcohols of high concentration such as methanol and ethanol, significantly increases the energy efficiency, energy yield of hydrogen production, and hydrogen production rate. This results from: (a) a low boiling point of the electrolytic solutions with high-concentrated alcohols, (b) the low heat of evaporation of the alcohol–water mixtures, (c) a high hydrogen content in the molecules of alcohols, and (d) a low standard Gibbs free energy for the reaction of the alcohols’ decomposition (compared to water decomposition) resulting in a low electrical energy input required to decompose the alcohols and produce hydrogen.
    • A higher temperature of the electrolytic solution results in an increase in the energy yield of hydrogen production and hydrogen production rate. This can be explained by the higher concentration of the water vapor in the vicinity of the plasma-forming region at a higher temperature of the electrolytic solution. Moreover, at a higher temperature, less electrical energy is used for heating the electrolytic solution in the vicinity of the discharge electrode to reach the optimal discharge conditions.
    • The optimal active length of the cylindrical discharge electrode made of tungsten exposed to a 0.03 M NaOH aqueous solution at 700 V and a 0.05 M KOH aqueous solution with 10 vol% of the ethanol additive at 800 V was found to be 10 mm. The plasma discharge can also be formed at the positioning of the discharge electrode above the electrolytic solution surface. However, in such a case, the hydrogen production rate and energy efficiency are the lowest.
  • The comparison of the hydrogen production energy yields achieved in PDSE with those of the alkaline electrolysis (AEL), polymer electrolyte membrane electrolysis (PEMEL), solid oxide electrolysis (SOEL), and other plasma-assisted methods of hydrogen production showed that PDSE of the aqueous electrolytic solutions with alcohol (methanol) provides a 3.9 times greater energy yield compared to that of AEL, is 4.1 times greater compared to that of PEMEL, is 2.8 times greater compared to that of SOEL, is 1.75 times greater than that of the microwave (2.45 GHz) plasma, and is 5.8% greater compared to natural gas steam reforming.
  • The other advantages of PDSE as a hydrogen-producing method are: (a) a very high Faradaic efficiency, (b) low resistance losses, (c) high diffusion of the hydrogen produced, (d) fast kinetics of the water decomposition, (e) the precious metals as catalysts are not needed, (f) Faradaic and non-Faradaic hydrogen production in the vicinity of the discharge electrode, and (g) PDSE can also be applied for on-board hydrogen-on-demand production.
  • PDSE as the hydrogen-producing method also has some disadvantages. The most significant of them are: the disintegration of the discharge electrode, gas separation issues, and, still, low energy efficiency. We conclude that:
    • In PDSE, the discharge electrode operates under the hard-thermal conditions resulting from the plasma discharges. Even the discharge electrode made of tungsten with a melting temperature of around 3 000 K disintegrates.
    • In PDSE, hydrogen and oxygen are produced simultaneously in the vicinity of the discharge electrode. For this reason, some gas separation techniques must be applied in addition to efficiently separate hydrogen from the gas mixture produced.
    • In PDSE of the typical electrolytic solutions, the highest energy efficiency achieved is only 12.7%. In PDSE of the electrolytic solutions with a methanol additive, the highest energy efficiency achieved is 51.1%. This shows that the energy efficiency is still low, and some further efforts can be made to increase it.
Taking into account the promising advantages of PDSE, including the high energy efficiency of hydrogen production achieved in PDSE of the alcohol–water mixtures, we may conclude that PDSE can be considered a feasible way to produce hydrogen. However, it still needs development to overcome some issues. More stable materials must be applied to increase the lifetime of the discharge electrode. A membrane or absorption separation technique must be applied to separate hydrogen efficiently from the produced gas mixture. R&D efforts must be made to increase hydrogen production efficiency, e.g., using catalysis.

Author Contributions

Conceptualization, S.B. and J.M.; methodology, S.B. and J.M; formal analysis, S.B. and J.M.; investigation, S.B. and J.M.; writing—original draft preparation, S.B. and J.M.; writing—review and editing, S.B. and J.M.; visualization, S.B.; supervision, J.M.; project administration, J.M.; funding acquisition, S.B. and J.M. All authors have read and agreed to the published version of the manuscript.

Funding

The project was financed within the program of the Ministry of Science and Higher Education called “Regionalna Inicjatywa Doskonałości”, in the years 2019–2022; the project number was 006/RID/2018/19 and the sum of financing was PLN 11,870,000. Sergii Bespalko would like to thank the Polish National Agency for Academic Exchange (NAWA) for the funding under the Ulam Program—Seal of Excellence (the grant agreement no. PPN/SEL/2020/1/00004/U/00001).

Data Availability Statement

Not applicable.

Acknowledgments

Sergii Bespalko would like to thank Richard Hanke-Rauschenbach from Leibniz University Hannover (Germany) for suggestions regarding the estimation of the energy efficiency of hydrogen production in PDSE of the electrolytic solutions with alcohol additives.

Conflicts of Interest

The authors declare no conflict of interest.

Acronyms

AELalkaline electrolysis
CGDEcontact glow-discharge electrolysis
DBDdielectric-barrier discharge
DCdirect current
EDMelectrical discharge machining
HHVhigher heating value
HODhydrogen-on-demand
LHVlower heating value
PDSEplasma-driven solution electrolysis
PEMELpolymer electrolyte membrane
sccmstandard cubic centimeter per minute
SOELsolid oxide electrolysis

References

  1. Rivard, E.; Trudeau, M.; Zaghib, K. Hydrogen Storage for Mobility: A Review. Materials 2019, 12, 1973. [Google Scholar] [CrossRef] [Green Version]
  2. Jovan, D.J.; Dolanc, G. Can Green Hydrogen Production Be Economically Viable under Current Market Conditions. Energies 2020, 13, 6599. [Google Scholar] [CrossRef]
  3. Rosen, M.A.; Koohi-Fayegh, S. The prospects for hydrogen as an energy carrier: An overview of hydrogen energy and hydrogen energy systems. Energy Ecol. Environ. 2016, 1, 10–29. [Google Scholar] [CrossRef] [Green Version]
  4. Kulagin, V.A.; Grushevenko, D.A. Will Hydrogen Be Able to Become the Fuel of the Future? Therm. Eng. 2020, 67, 189–201. [Google Scholar] [CrossRef]
  5. Basile, A.; Liguori, S.; Iulianelli, A. Membrane Reactors for Methane Steam Reforming (MSR); Elsevier: Amsterdam, The Netherlands, 2015; pp. 31–59. [Google Scholar] [CrossRef]
  6. El-Shafie, M.; Kambara, S.; Hayakawa, Y. Hydrogen Production Technologies Overview. J. Power Energy Eng. 2019, 7, 107–154. [Google Scholar] [CrossRef] [Green Version]
  7. Poudyal, R.; Tiwari, I.; Koirala, A.; Masukawa, H.; Inoue, K.; Tomo, T.; Najafpour, M.; Allakhverdiev, S.; Veziroğlu, T. 10-Hydrogen production using photobiological methods. In Compendium of Hydrogen Energy; Subramani, V., Basile, A., Veziroğlu, T.N., Eds.; Woodhead Publishing: Sawston, UK, 2015; pp. 289–317. [Google Scholar] [CrossRef]
  8. Mehrpooya, M.; Habibi, R. A review on hydrogen production thermochemical water-splitting cycles. J. Clean. Prod. 2020, 275, 123836. [Google Scholar] [CrossRef]
  9. Mizeraczyk, J.; Jasiński, M. Plasma processing methods for hydrogen production. Eur. Phys. J. Appl. Phys. 2016, 75, 24702. [Google Scholar] [CrossRef]
  10. Gupta, S.K.S.; Singh, R. Cathodic contact glow discharge electrolysis: Its origin and non-faradaic chemical effects. Plasma Sources Sci. Technol. 2016, 26, 015005. [Google Scholar] [CrossRef]
  11. Mota-Lima, A.; Nascimento, J.F.D.; Chiavone-Filho, O.; Nascimento, C.A.O. Electrosynthesis via Plasma Electrochemistry: Generalist Dynamical Model To Explain Hydrogen Production Induced by a Discharge over Water. J. Phys. Chem. C 2019, 123, 21896–21912. [Google Scholar] [CrossRef]
  12. Bruggeman, P.J.; Frontiera, R.R.; Kortshagen, U.R.; Kushner, M.J.; Linic, S.; Schatz, G.C.; Andaraarachchi, H.; Exarhos, S.; Jones, L.O.; Mueller, C.M.; et al. Plasma-driven solution electrolysis. J. Appl. Phys. 2021, 129, 200902. [Google Scholar] [CrossRef]
  13. Mizuno, T.; Aoki, Y.; Chung, D.Y.; Sesftel, F.; Biberian, J.-P. Generation of heat and products during plasma electrolysis. In Proceedings of the 11th International Conference on Cold Fusion, Marseilles, France, 31 October–5 November 2004; pp. 161–177. [Google Scholar] [CrossRef] [Green Version]
  14. Mizuno, T.; Akimoto, T.; Ohmori, T. Confirmation of anomalous hydrogen generation by plasma electrolysis. In Proceedings of the 4th Meeting of Japan CF Research Society, Iwate, Japan, 17–18 October 2002; Available online: https://www.lenr-canr.org/acrobat/MizunoTconfirmatib.pdf (accessed on 12 September 2022).
  15. Mizuno, T.; Akimoto, T.; Azumi, K.; Ohmori, T.; Aoki, Y.; Takahashi, A. Hydrogen Evolution by Plasma Electrolysis in Aqueous Solution. Jpn. J. Appl. Phys. 2005, 44, 396–401. [Google Scholar] [CrossRef] [Green Version]
  16. Zongcheng, Y.; Li, C.; Honglin, W. Experimental study of plasma under-liquid electrolysis in hydrogen generation. Chin. J. Process Eng. 2006, 6, 396–401. Available online: https://cybercemetery.unt.edu/archive/brc/20120621021503/http:/www.jproeng.com/qikan/manage/wenzhang/206517.pdf (accessed on 12 September 2022).
  17. Mills, R.; Dayalan, E.; Ray, P.; Dhandapani, B.; He, J. Highly stable novel inorganic hydrides from aqueous electrolysis and plasma electrolysis. Electrochim. Acta 2002, 47, 3909–3926. [Google Scholar] [CrossRef]
  18. Sengupta, S.K.; Singh, O.P. Contact glow discharge electrolysis: A study of its chemical yields in aqueous inert-type electrolytes. J. Electroanal. Chem. 1994, 369, 113–120. [Google Scholar] [CrossRef]
  19. Sengupta, S.K.; Srivastava, A.K.; Singh, R. Contact glow discharge electrolysis: A study on its origin in the light of the theory of hydrodynamic instabilities in local solvent vaporization by Joule heating during electrolysis. J. Electroanal. Chem. 1997, 427, 23–27. [Google Scholar] [CrossRef]
  20. Sengupta, S.K.; Singh, R.; Srivastava, A.K. A Study on the Origin of Nonfaradaic Behavior of Anodic Contact Glow Discharge Electrolysis: The Relationship Between Power Dissipated in Glow Discharges and Nonfaradaic Yields. J. Electrochem. Soc. 1998, 145, 2209–2213. [Google Scholar] [CrossRef]
  21. Gangal, U.; Srivastava, M.; Gupta, S.K.S. Mechanism of the Breakdown of Normal Electrolysis and the Transition to Contact Glow Discharge Electrolysis. J. Electrochem. Soc. 2009, 156, F131. [Google Scholar] [CrossRef]
  22. Schalenbach, M.; Tjarks, G.; Carmo, M.; Lueke, W.; Mueller, M.; Stolten, D. Acidic or Alkaline? Towards a New Perspective on the Efficiency of Water Electrolysis. J. Electrochem. Soc. 2016, 163, F3197–F3208. [Google Scholar] [CrossRef]
  23. Carmo, M.; Fritz, D.L.; Mergel, J.; Stolten, D. A comprehensive review on PEM water electrolysis. Int. J. Hydrogen Energy 2013, 38, 4901–4934. [Google Scholar] [CrossRef]
  24. Lei, Q.; Wang, B.; Wang, P.; Liu, S. Hydrogen generation with acid/alkaline amphoteric water electrolysis. J. Energy Chem. 2019, 38, 162–169. [Google Scholar] [CrossRef] [Green Version]
  25. Colli, A.N.; Girault, H.H.; Battistel, A. Non-Precious Electrodes for Practical Alkaline Water Electrolysis. Materials 2019, 12, 1336. [Google Scholar] [CrossRef] [PubMed] [Green Version]
  26. Scott, K. Chapter 1 Introduction to Electrolysis, Electrolysers and Hydrogen Production. In Electrochemical Methods for Hydrogen Production; Royal Society of Chemistry: London, UK, 2019; pp. 1–27. [Google Scholar] [CrossRef]
  27. New Handbook of Chemist and Process Engineer. Chemical Equilibrium. Properties of Solutions; Elsevier: Saint Petersburg, Russia, 2004.
  28. Atkins, P.; de Paula, J. Atkin’s Physical Chemistry; W.H. Freeman and Company: New York, NY, USA, 2006. [Google Scholar] [CrossRef]
  29. Coutanceau, C.; Baranton, S.; Audichon, T. Chapter 3-Hydrogen Production From Water Electrolysis. Hydrogen Electrochemical Production; Academic Press: Cambridge, MA, USA, 2017; pp. 17–62. [Google Scholar] [CrossRef]
  30. Monteiro, M.C.O.; Goyal, A.; Moerland, P.; Koper, M.T.M. Understanding Cation Trends for Hydrogen Evolution on Platinum and Gold Electrodes in Alkaline Media. ACS Catal. 2021, 11, 14328–14335. [Google Scholar] [CrossRef] [PubMed]
  31. Keçebaş, A.; Kayfeci, M.; Bayat, M. Chapter 9-Electrochemical hydrogen generation. In Solar Hydrogen Production; Calise, F., D’Accadia, M.D., Santarelli, M., Lanzini, A., Ferrero, D., Eds.; Academic Press: Cambridge, MA, USA, 2019; pp. 299–317. [Google Scholar] [CrossRef]
  32. Available online: https://de.wikipedia.org/wiki/Elektrochemisches_%C3%84quivalent (accessed on 12 September 2022).
  33. Klein, S.; Nellis, G. Thermodynamics; Cambridge University Press: Cambridge, MA, USA, 2012. [Google Scholar] [CrossRef]
  34. Buttler, A.; Spliethoff, H. Current status of water electrolysis for energy storage, grid balancing and sector coupling via power-to-gas and power-to-liquids: A review. Renew. Sustain. Energy Rev. 2018, 82, 2440–2454. [Google Scholar] [CrossRef]
  35. Badwal, S.P.; Giddey, S.; Munnings, C. Hydrogen production via solid electrolytic routes. WIREs Energy Environ. 2012, 2, 473–487. [Google Scholar] [CrossRef]
  36. Yan, Z.; Chen, L.; Wang, H. Hydrogen generation by glow discharge plasma electrolysis of ethanol solutions. J. Phys. D Appl. Phys. 2008, 41, 155205. [Google Scholar] [CrossRef]
  37. Sharma, N.; Diaz, G.; Leal-Quirós, E. Evaluation of contact glow-discharge electrolysis as a viable method for steam generation. Electrochim. Acta 2013, 108, 330–336. [Google Scholar] [CrossRef]
  38. Zheng, B.; Wang, K.; Shrestha, M.; Schuelke, T.; Fan, Q.H. Understanding the chemical reactions in cathodic plasma electrolysis. Plasma Sources Sci. Technol. 2019, 28, 085016. [Google Scholar] [CrossRef]
  39. Bespalko, S.; Mizeraczyk, J. The plasma discharges in the anodic and cathodic regimes of plasma driven solution electrolysis for hydrogen production. Przegląd Elektrotechniczny 2022, 1, 124–127. [Google Scholar] [CrossRef]
  40. Allagui, A.; Elwakil, A.S. On the N-shaped Conductance and Hysteresis Behavior of Contact Glow Discharge Electrolysis. Electrochim. Acta 2015, 168, 173–177. [Google Scholar] [CrossRef]
  41. Hickling, A.; Ingram, M.D. Contact glow-discharge electrolysis. Trans. Faraday Soc. 1964, 60, 783–793. [Google Scholar] [CrossRef]
  42. Yan, Z.C.; Li, C.; Lin, W.H. Hydrogen generation by glow discharge plasma electrolysis of methanol solutions. Int. J. Hydrogen Energy 2009, 34, 48–55. [Google Scholar] [CrossRef]
  43. Jinzhang, G.; Aixiang, W.; Yan, F.; Jianlin, W.; Dongping, M.; Xiao, G.; Yan, L.; Wu, Y. Analysis of Energetic Species Caused by Contact Glow Discharge Electrolysis in Aqueous Solution. Plasma Sci. Technol. 2008, 10, 30–38. [Google Scholar] [CrossRef]
  44. Saito, G.; Nakasugi, Y.; Akiyama, T. Generation of solution plasma over a large electrode surface area. J. Appl. Phys. 2015, 118, 023303. [Google Scholar] [CrossRef]
  45. Jin, X.-L.; Wang, X.-Y.; Zhang, H.-M.; Xia, Q.; Wei, D.-B.; Yue, J.-J. Influence of Solution Conductivity on Contact Glow Discharge Electrolysis. Plasma Chem. Plasma Process 2010, 30, 429–436. [Google Scholar] [CrossRef]
  46. Jin, X.; Wang, X.; Yue, J.; Cai, Y.; Zhang, H. The effect of electrolyte constituents on contact glow discharge electrolysis. Electrochim. Acta 2010, 56, 925–928. [Google Scholar] [CrossRef]
  47. Alteri, G.B.; Bonomo, M.; Decker, F.; Dini, D. Contact Glow Discharge Electrolysis: Effect of Electrolyte Conductivity on Discharge Voltage. Catalysts 2020, 10, 1104. [Google Scholar] [CrossRef]
  48. Jin-Zhang, G.; Xiao-Yan, W.; Zhong-Ai, H.; Jing-Guo, H.; Quan-Fang, L. A Review on Chemical Effects in Aqueous Solution induced by Plasma with Glow Discharge. Plasma Sci. Technol. 2001, 3, 765–774. [Google Scholar] [CrossRef]
  49. Chang, J.-S.; Kelly, A.J.; Crowley, J.M. Handbook of Electrostatic Processes; Marcel Dekker Inc.: New York, NY, USA, 1995. [Google Scholar]
  50. Paulmier, T.; Bell, J.; Fredericks, P. Development of a novel cathodic plasma/electrolytic deposition technique: Part 2: Physico-chemical analysis of the plasma discharge. Surf. Coatings Technol. 2007, 201, 8771–8781. [Google Scholar] [CrossRef] [Green Version]
  51. Gamburg, D.Y.; Semenov, V.P.; Dubovkin, N.F. Hydrogen: Properties, Production, Storage, Transportation, and Applications; Khimiya: Moscow, Russia, 1989. [Google Scholar]
  52. Kudo, A.; Miseki, Y. Heterogeneous photocatalyst materials for water splitting. Chem. Soc. Rev. 2008, 38, 253–278. [Google Scholar] [CrossRef]
  53. Vargaftic, N.B. Handbook on Thermal Properties of Gases and Liquids; Nauka: Moscow, Russia, 1972. [Google Scholar]
  54. Acar, C.; Dincer, I. 3.1 Hydrogen Production. Compr. Energy Syst. 2018, 3, 1–40. [Google Scholar] [CrossRef]
  55. von Engel, A. Ionized Gases, 2nd ed.; Clarendon Press: Oxford, UK, 1965. [Google Scholar]
  56. Mededovic, S.; Locke, B. Primary chemical reactions in pulsed electrical discharge channels in water. J. Phys. D Appl. Phys. 2007, 40, 7734–7746. [Google Scholar] [CrossRef]
  57. Locke, B.R.; Thagard, S.M. Analysis and Review of Chemical Reactions and Transport Processes in Pulsed Electrical Discharge Plasma Formed Directly in Liquid Water. Plasma Chem. Plasma Process 2012, 32, 875–917. [Google Scholar] [CrossRef]
  58. Rumbach, P.; Bartels, D.M.; Sankaran, R.M.; Go, D.B. The solvation of electrons by an atmospheric-pressure plasma. Nat. Commun. 2015, 6, 7248. [Google Scholar] [CrossRef] [Green Version]
  59. Yerokhin, A.; Mukaeva, V.R.; Parfenov, E.V.; Laugel, N.; Matthews, A. Charge transfer mechanisms underlying Contact Glow Discharge Electrolysis. Electrochim. Acta 2019, 312, 441–456. [Google Scholar] [CrossRef]
  60. Saksono, N.; Feryansyah, R.; Bismo, S. Hydrogen production using non-thermal plasma electrolysis in KOH solution. In Proceedings of the 12th International Conference on QiR (Quality in Research), Bali, Indonesia, 4–7 July 2011; pp. 112–118. [Google Scholar]
  61. Saksono, N.; Ma’arif, M.F.; Faiz, M.B.; Bismo, S. Hydrogen production system with plasma electrolysis method in na-trium carbonate-acetate acid solution. In Proceedings of the Regional Conference on Chemical Engineering, Yogyakarta, Indonesia, 2–3 December 2014; pp. 1–10. [Google Scholar]
  62. Saksono, N.; Kartohardjono, S.; Yuniawati, T. High Performance Plasma Electrolysis Reactor for Hydrogen Generation using a NaOH-Methanol Solution. Int. J. Technol. 2016, 7, 1421. [Google Scholar] [CrossRef] [Green Version]
  63. Saksono, N.; Batubara, T.; Bismo, S. Hydrogen Production by Plasma Electrolysis Reactor of KOH-Ethanol Solution. In Proceedings of the IOP Conference Series: Materials Science and Engineering, Bandung, Indonesia, 26–27 October 2016; Volume 162, p. 012010. [Google Scholar] [CrossRef]
  64. Saksono, N.; Sasiang, J.; Rosalina, C.D.; Budikania, T. Hydrogen Generation by Koh-Ethanol Plasma Electrolysis Using Double Compartement Reactor. In Proceedings of the IOP Conference Series: Materials Science and Engineering, Bali, Indonesia, 24–27 July 2017; Volume 316, p. 0120112018. [Google Scholar] [CrossRef] [Green Version]
  65. Toth, J.R.; Hawtof, R.; Matthiesen, D.; Renner, J.; Sankaran, R.M. On the non-faradaic hydrogen gas evolution from electrolytic reactions at the interface of a cathodic atmospheric-pressure microplasma and liquid water surface. J. Electrochem. Soc. 2020, 167, 116504. [Google Scholar] [CrossRef]
  66. Active Thermochemical Tables. Argonne National Laboratory. Available online: https://atct.anl.gov/Thermochemical%20Data/version%201.118/index.php (accessed on 12 September 2022).
  67. Uno, Y.; Nakajima, T.; Okada, M. The effect of electrode polarity on electrical discharge machining performance in water. Mem. Fac. Eng. Okayama Univ. 1991, 26, 9–20. [Google Scholar]
  68. Saeid, A.; Chojnacka, K. Sulfuric Acid. In Encyclopedia of Toxicology, 3rd ed.; Wexler, P., Anderson, B.D., Gad, S.C., Peyster, A.D., Eds.; Academic Press: Cambridge, MA, USA, 2014; pp. 424–426. [Google Scholar] [CrossRef]
  69. Moeller, T.; Bailar, J.C.; Kleinberg, J.; Guss, C.O.; Castellion, M.E.; Metz, C. (Eds.) 22-Nonmetals: Nitrogen, Phosphorus, and Sulfur & Inorganic Qualitative Analysis: Anions; Chemistry, Academic Press: Cambridge, MA, USA, 1980; pp. 659–711. [Google Scholar] [CrossRef]
  70. Mizeraczyk, J.; Urashima, K.; Jasiński, M.; Dors, M. Hydrogen production from gaseous fuels by plasmas-A review. Int. J. Plasma Environ. Sci. Technol. 2014, 8, 89–97. [Google Scholar]
  71. Chaffin, J.H.; Bobbio, S.M.; Inyang, H.I.; Kaanagbara, L. Hydrogen production by plasma electrolysis. J. Energy Eng.-Asce 2006, 132, 104–108. [Google Scholar] [CrossRef]
  72. Sarmiento, B.; Brey, J.; Viera, I.G.; Gonzalez-Elipe, A.; Cotrino, J.; Rico, V.J. Hydrogen production by reforming of hydrocarbons and alcohols in a dielectric barrier discharge. J. Power Sources 2007, 169, 140–143. [Google Scholar] [CrossRef]
  73. Panda, N.R.; Sahu, D. Enhanced hydrogen generation efficiency of methanol using dielectric barrier discharge plasma methodology and conducting sea water as an electrode. Heliyon 2020, 6, e04717. [Google Scholar] [CrossRef] [PubMed]
  74. Ulejczyk, B.; Nogal, L.; Młotek, M.; Falkowski, P.; Krawczyk, K. Hydrogen production from ethanol using a special multi-segment plasma-catalytic reactor. J. Energy Inst. 2021, 95, 179–186. [Google Scholar] [CrossRef]
  75. Henriques, J.; Bundaleska, N.; Tatarova, E.; Dias, F.; Ferreira, C. Microwave plasma torches driven by surface wave applied for hydrogen production. Int. J. Hydrogen Energy 2011, 36, 345–354. [Google Scholar] [CrossRef]
  76. Tsyganov, D.; Bundaleska, N.; Tatarova, E.; Ferreira, C. Ethanol reforming into hydrogen-rich gas applying microwave ‘tornado’-type plasma. Int. J. Hydrogen Energy 2013, 38, 14512–14530. [Google Scholar] [CrossRef]
  77. Bundaleska, N.; Tsyganov, D.; Saavedra, R.; Tatarova, E.; Dias, F.; Ferreira, C. Hydrogen production from methanol reforming in microwave “tornado”-type plasma. Int. J. Hydrogen Energy 2013, 38, 9145–9157. [Google Scholar] [CrossRef]
  78. Czylkowski, D.; Hrycak, B.; Miotk, R.; Jasiński, M.; Mizeraczyk, J.; Dors, M. Microwave plasma for hydrogen production from liquids. Nukleonika 2016, 61, 185–190. [Google Scholar] [CrossRef] [Green Version]
  79. Wang, B.; Sun, B.; Zhu, X.; Yan, Z.; Liu, Y.; Liu, H.; Liu, Q. Hydrogen production from alcohol solution by microwave discharge in liquid. Int. J. Hydrogen Energy 2016, 41, 7280–7291. [Google Scholar] [CrossRef]
  80. Sun, B.; Zhao, X.; Xin, Y.; Zhu, X. Large capacity hydrogen production by microwave discharge plasma in liquid fuels ethanol. Int. J. Hydrogen Energy 2017, 42, 24047–24054. [Google Scholar] [CrossRef]
  81. Burlica, R.; Shih, K.-Y.; Locke, B.R. Formation of H2 and H2O2 in a Water-Spray Gliding Arc Nonthermal Plasma Reactor. Ind. Eng. Chem. Res. 2010, 49, 6342–6349. [Google Scholar] [CrossRef]
  82. Burlica, R.; Shih, K.-Y.; Hnatiuc, B.; Locke, B.R. Hydrogen Generation by Pulsed Gliding Arc Discharge Plasma with Sprays of Alcohol Solutions. Ind. Eng. Chem. Res. 2011, 50, 9466–9470. [Google Scholar] [CrossRef]
  83. Du, C.; Li, H.; Zhang, L.; Wang, J.; Huang, D.; Xiao, M.; Cai, J.; Chen, Y.; Yan, H.; Xiong, Y.; et al. Hydrogen production by steam-oxidative reforming of bio-ethanol assisted by Laval nozzle arc discharge. Int. J. Hydrogen Energy 2012, 37, 8318–8329. [Google Scholar] [CrossRef]
  84. Xin, Y.; Sun, B.; Zhu, X.; Yan, Z.; Liu, Y.; Liu, H. Characteristics of hydrogen produced by pulsed discharge in ethanol solution. Appl. Energy 2016, 168, 122–129. [Google Scholar] [CrossRef]
  85. Bardos, L.; Baránková, H.; Bardos, A. Production of Hydrogen-Rich Synthesis Gas by Pulsed Atmospheric Plasma Submerged in Mixture of Water with Ethanol. Plasma Chem. Plasma Process 2016, 37, 115–123. [Google Scholar] [CrossRef] [Green Version]
  86. Xin, Y.; Sun, B.; Zhu, X.; Yan, Z.; Zhao, X.; Sun, X.; Ohshima, T. Characteristics and pathways of hydrogen produced by pulsed discharge in ethanol-water mixtures. Int. J. Hydrogen Energy 2019, 45, 1588–1596. [Google Scholar] [CrossRef]
  87. Zhou, R.; Zhou, R.; Xian, Y.; Fang, Z.; Lu, X.; Bazaka, K.; Bogaerts, A.; Ostrikov, K. Plasma-enabled catalyst-free conversion of ethanol to hydrogen gas and carbon dots near room temperature. Chem. Eng. J. 2019, 382, 122745. [Google Scholar] [CrossRef]
  88. Muradov, N. 17-Low-Carbon Production of Hydrogen from Fossil Fuels; Subramani, V., Basile, A., Veziroğlu, T.N., Eds.; Woodhead Publishing: Sawston, Cambridge, UK, 2015; pp. 489–522. [Google Scholar] [CrossRef]
  89. Kikoin, I.K. (Ed.) Tables of Physical Constants; Atomizdat: Moscow, Russia, 1976. [Google Scholar]
  90. Bruggeman, P.J.; Kushner, M.J.; Locke, B.R.; Gardeniers, J.G.E.; Graham, W.G.; Graves, D.B.; Hofman-Caris, R.C.H.M.; Maric, D.; Reid, J.P.; Ceriani, E.; et al. Plasma–liquid interactions: A review and roadmap. Plasma Sources Sci. Technol. 2016, 25, 053002. [Google Scholar] [CrossRef] [Green Version]
  91. Goldman, J.A.; Suggs, S.; Sharma, S.K. Transportation Applications Using Practical Hydrogen-On-Demand Systems. In Proceedings of the 2010 IEEE Energy Conversion Congress and Exposition, Atlanta, GA, USA, 12–16 September 2010; pp. 4593–4598. [Google Scholar] [CrossRef]
Figure 1. Influence of the weight concentration of KOH and NaOH on the specific conductivity of their aqueous solutions at 15 °C and 18 °C, respectively. The diagram was built based on the tabular data presented in [27].
Energies 15 07508 g001
Figure 2. Scheme of the simplest alkaline electrolytic cell illustrating production of H2 and O2 according to Equations (2) and (4). The scheme shows only hydroxyl anions participating in the charge transport.
Energies 15 07508 g002
Figure 3. Influence of the temperature of the electrolytic solution on the energy demands for water decomposition. Reprinted from [34] with permission from Elsevier. Changes in the cell potential for 25 °C and 600 °C of the electrolytic solution temperatures are also shown.
Energies 15 07508 g003
Figure 5. A typical shape of the current-voltage characteristics of the electrolysis. The characteristics shown correspond to two cases: positively (P) and negatively (N) charged smaller electrode. The first case terminates with the anodic regime of PDSE. The second terminates with the cathodic regime of PDSE. Voltage regions: I—the Faradaic electrolysis (starting from 0 V and terminating at the breakdown point), II—the transition region (starting from the breakdown point and terminating at the discharge onset point), III—the anodic and cathodic regimes of PDSE (initiating at the discharge onset point). The experimental current-voltage characteristics can be found in [20,36,38,40,41,42,43,44].
Energies 15 07508 g005
Figure 6. Illustration of the regions at the discharge electrode.
Energies 15 07508 g006
Figure 7. Illustration of the four processes leading to the water decomposition in the vicinity of the discharge electrode.
Energies 15 07508 g007
Figure 8. (a) Selective results regarding the energy efficiency (%) as a function of the applied voltage (V) in the cathodic regime of PDSE in the aqueous electrolytic solutions of potassium carbonate (K2CO3), sodium carbonate (Na2CO3), potassium hydroxide (KOH), and sodium hydroxide (NaOH) in various concentrations without organic additives (see details in Table 2). The numbers show the energy yields (g(H2)/kWh) of hydrogen production. (b) Selective results regarding the hydrogen production rate (g(H2)/h) as a function of the applied voltage (V) in the cathodic regime of PDSE in the aqueous electrolytic solutions of potassium carbonate (K2CO3), sodium carbonate (Na2CO3), potassium hydroxide (KOH), and sodium hydroxide (NaOH) in various concentrations without organic additives (see details in Table 2). Energies 15 07508 i001 [14], Energies 15 07508 i002 [13], Energies 15 07508 i003 [15], Energies 15 07508 i004 [16], Energies 15 07508 i005 [60], Energies 15 07508 i006 [61], Energies 15 07508 i007 [62].
Energies 15 07508 g008
Figure 9. (a) Selective results regarding the energy efficiency (%) as a function of the applied voltage (V) in the cathodic regime of PDSE in the electrolytic solutions with organic additives such as methanol (CH3OH), ethanol (C2H5OH), and acetic acid (CH3COOH) in various concentrations (see details in Table 2). The numbers show the energy yields (g(H2)/kWh) of hydrogen production. (b) Selective results regarding the hydrogen production rate (g(H2)/h) as a function of the applied voltage (V) in the cathodic regime of PDSE in electrolytic solutions with organic additives such as methanol (CH3OH), ethanol (C2H5OH), and acetic acid (CH3COOH) in various concentrations (see details in Table 2). Energies 15 07508 i001 [36], Energies 15 07508 i008 [62], Energies 15 07508 i009 [63], Energies 15 07508 i010 [63], Energies 15 07508 i011 [64], Energies 15 07508 i012 [64], Energies 15 07508 i013 [61], Energies 15 07508 i014 [42], Energies 15 07508 i002 [42], Energies 15 07508 i015 [42].
Energies 15 07508 g009aEnergies 15 07508 g009b
Figure 10. Scheme of the discharge electrode (cathode) positioning in the electrochemical cell applied in [62,64]. Illustration of the active length of the discharge electrode.
Energies 15 07508 g010
Figure 11. Schemes of the discharge electrode (cathode) positioning in the electrochemical cell applied in [63]. The immersion depth is the distance between the discharge electrode tip and the surface of the electrolytic solution.
Energies 15 07508 g011
Table 1. Merits and demerits of some of the hydrogen-producing technologies.
Name of the TechnologyAdvantagesDisadvantages
Natural gas steam reformingThe most commercially used method for large-scale hydrogen production.
Higher H2/CO2 ratio compared to partial oxidation (4 moles of H2 over 1 mole of CO2).
Higher H2/CH4 ratio compared to partial oxidation (4 moles of H2 over 1 mole of CH4).
CO2 emission.
Natural gas is used as a feedstock.
High heat input at high temperatures of 800–900 °C is required.
The necessity to use high-temperature materials for the reactor design.
Usually, the process requires the presence of a catalyst.
A high surplus of steam is required
Desulfurization of the natural gas is needed before entering the reformer to prevent poisoning of the catalyst.
A large volume of the reactor is needed.
Gas separation techniques must be applied to purify hydrogen.
Partial oxidationNo heat input is needed.
Fast kinetics of the reaction compared to natural gas steam reforming.
A smaller volume of the reactor is needed compared to natural gas steam reforming.
CO2 emission.
Lower H2/CO2 ratio compared to natural gas steam reforming (3 moles of H2 over 1 mole of CO2).
Hydrocarbons are used as feedstock.
Lower H2/CH4 ratio compared to natural gas steam reforming (3 moles of H2 over 1 mole of CH4 if it is used as a feedstock).
Typical process temperature is about 1200 °C; to decrease the process temperature, catalyst is needed.
In the case of applying catalyst, desulfurization of the natural gas is needed to prevent poisoning of the catalyst.
Gas separation techniques must be applied to purify hydrogen.
ElectrolysisNo CO2 emission.
99.8% pure hydrogen is produced.
Water is used as a feedstock (source of hydrogen).
Oxygen as a valuable byproduct is also produced (1 mole of O2 over 2 moles of H2).
Fluctuating renewable electricity can be used to power electrolysis.
Low cell temperature of 60–80 °C (in case of alkaline electrolysis).
Electricity is needed to power electrolyzer.
Low cost of electricity is required to produce hydrogen at low cost.
Typically, catalysts are used in the electrolyzers to promote hydrogen evolution reaction.
Electrolyte is needed to be dissolved in the water to conduct electrical current.
Photobiological methodsPhotobiological hydrogen production uses microorganisms to convert solar energy into hydrogen gas.
These methods use only water and sunlight for hydrogen production.
Photobiological hydrogen production does not emit environmentally polluting gases and toxic compounds.
Photobiological methods can produce pure and clean hydrogen.
During photobiological hydrogen production, many photosynthetic bacteria can use wide-spectrum light energy and organic waste.
Photobiological hydrogen production by micro-organisms under anaerobic conditions produces valuable metabolites such as lactic acid, butyric acid, and acetic acid as byproducts.
The photon conversion efficiency to produce hydrogen from sunlight is high: ~10–16%.
Solar-powered hydrogen production by microorganisms has a unique process for CO2 sequestration. In the aerobic phase, CO2 is converted into biomass; in the anaerobic phase, hydrogen is subsequently produced.
Biohydrogen production by photosynthetic micro-organisms requires the use of a simple solar reactor, such as a transparent closed box with a low-energy requirement.
Hydrogenase is inactivated in the presence of molecular oxygen in microorganisms.
In green algae, the simultaneous production of oxygen and hydrogen inhibits hydrogenase activity by oxygen. The presence of uptake hydrogenase in cyanobacteria and photosynthetic bacteria also decreases hydrogen production.
The presence of uptake hydrogenase in cyanobacteria and photosynthetic bacteria also decreases hydrogen production.
Production of hydrogen by photofermentation is low.
The exact metabolic pathway for hydrogen production by micro-organisms is not clear. In addition, there is no clear contender for a robust, industrially capable micro-organism that can be metabolically engineered to produce more hydrogen. Several engineering issues need to be addressed, including an appropriate bioreactor design for hydrogen production.
Mass cultivation of green algae and cyanobacteria is difficult because it may require a large surface area. Additionally, the yield of hydrogen production by these microorganisms is not high.
Scaling up and materials for the construction of several photobioreactors are costly, and there are many disadvantages.
The construction of artificial leaves for artificial photosynthesis is an expensive method for generating hydrogen.
Thermochemical methodsNo CO2 emission.
Renewable heat and electricity can be applied to power the cycles.
Significantly lower process temperature compared to the direct thermal water decomposition.
The complexity of the water decomposition because a thermochemical cycle may include a high number of reactions (e.g., the Zn-S-I cycle consists of 6 reactions).
Low durability of the reactant materials for realizing the thermochemical cycles.
The necessity to use high temperature and chemically resistant materials for the reactor design.
In some cycles, catalysts are needed to decrease the decomposition temperature of the compounds used in thermochemical cycles.
High cost of the compounds needed for some of the cycles.
Some of the cycles need electricity to power the electrolysis involved in the cycle (e.g., the Cu-Cl cycle).
Some of the cycles still require high temperature (e.g., the S-I cycle requires up to 1273 K).
Table 2. Review of research on the production of hydrogen by PDSE and its characteristics.
ElectrolyteSolventOrganic AdditiveConcentration of the Organic AdditiveConcentration of the Organic Additive at the Highest Energy YieldConcentration of the Electrolytic Solution/Conductivity/pHConcentration of the Electrolytic Solution/Conductivity/pH at the Highest Energy YieldDischarge PolarityAmbient GasRange of the Applied Voltage, VDischarge Onset Voltage, VApplied Voltage at the Highest Efficiency of H2 Production, VOperating Current at the Highest Efficiency of H2 Production, ACurrent Density at the Discharge Electrode, A/cm2Bulk Temperature of the Electrolytic Solution, °CMaterial of the Discharge ElectrodeActive Length of the Discharge Electrode, mmMaximal H2 Production Rate, g(H2)/hThe Highest Faradaic EfficiencyEnergy Efficiency of H2 Production, %Lowest Energy Consumption, kJ/mol(H2)Energy yield of H2 Production, g(H2)/kWhReference
K2CO3H2O---0.2 M-Cn/a0–3501203502.232.32 *80W202.738012.7 *2242.24 *3.21 *[14]
K2CO3---0.2 M-Cn/a0–2301202301,21.25 *80W200.485.2 *5462.75 *1.32 *[13]
K2CO3---0.2 M-Cn/a0–3501203502.252.344 *75W202.737012.6 *2262.51 *3.18 *[15]
Na2CO3-- 2 mS/cm-Cn/a0–6504405500.950.538 *80W100.45 *173.2 *9045.170.8 *[16]
methanol0–100 vol%50 vol%n/an/aC0–650n/an/an/an/a80W10n/an/a51.1 *85.3784.34 *
NaOHethanol0–99.5 vol%99.5 vol%5.6 mS/cm-CAr10–100050510000.93n/a30Wn/a58.35 *110446.3 *125.0357.59 *[36]
A54010000.351.75 *1003.7 *1573.874.58 *
NaOHmethanol0–99.5 vol%99.5 vol%3.43–16.68 mS/cm16.68 mS/cm (although Faradaic efficiency and energy consumption are given for 11.55 mS/cm)CAr10–11506381150n/an/a64Wn/an/a224740.7 *107.267.16 *[42]
methanol0–99.5 vol%A0–1150700700n/an/a64Wn/an/a91n/an/an/a
KOHmethanol0–99.5 vol%C0–1150n/a1150n/an/a64Wn/an/a2256 **40.8 *106.9667.32 *
methanol0–99.5 vol%A0–1150n/an/an/an/a64Wn/an/an/an/an/an/a
H2SO4methanol0–99.5 vol%C0–1150n/a850n/an/a64Wn/an/a79623.8 *183.1539.31 *
methanol0–99.5 vol%A0–1150n/a700n/an/a64Wn/an/a54n/an/an/a
KOH---0.05–0.15 M0.15 MCn/a150–300200200n/an/a90Wn/a0.6816.66.6 *43001.67 *[60]
Na2CO3---0.01–0.05 M0.05 MCn/a300–550n/a4003.56n/a65–80Wn/a1.43n/a4.1 *70501.02 *[61]
acetic acid0.5–1.5 M1.5 M0.02 M-4004001.632.914817.916004.5 *
NaOH---0.005–0.03 M0.03 MCn/a0–7004407000.55n/an/an/a5–200.3215.083.0 *89600.8 *[62]
methanol0–15 vol%15 vol%0.01 M-n/a700n/a103.77151.884.9 *8908.09 *
KOHethanol10 vol%-0.03–0.1 M0.05 MCn/a500–700n/a700n/an/a80–85Wn/a6.08149.683.9 *14904.83 *[63]
ethanol5–15 vol%10 vol%0.05 M-500n/a4.25100.532.5 *23103.12 *
KOHethanol10 vol%-0.05–0.1 M0.1 MCn/a600–800n/a800n/an/a70–90W0–203.1890.053.4 *17104.21 *[64]
ethanol10–20 vol%15 vol%0.05 M-n/a8000.84n/a2.5782.83.1 *1884 *3.82 *
H2SO4---pH 3.5-CAr2360–470n/a4708 × 10−3n/a5–85SS1 ***4.56 × 10−42.20.394,187.940.08 *[65]
Notes: C—cathodic, A—anodic, W—tungsten, SS—stainless steel, Ar1—argon at 150 sccm, Ar2—argon at 50 sccm. *— It was calculated based on the experimental data presented in the paper. **—The value of the Faradaic efficiency is given for the applied voltage of 1000 V. ***—The cathode was installed 1 mm above the electrolytic solution surface. n/a—data are neither reported nor sufficient to estimate a value of the parameter. Process cell pressure is not given in any paper. The energy efficiency was calculated on an HHV basis. The values of energy consumption are presented at the standard conditions (p = 101 325 Pa, T = 298 K). The current density is defined as a ratio of the input electric current to the active surface area of the discharge electrode exposed to the electrolytic solution ( A cm 2 ) .
Table 3. Year-wise development of hydrogen production in PDSE of the electrolytic solutions.
YearCountryContributorsDescriptionReference
2002–2005JapanMizuno, T.; Aoki, Y.; Chung, D.Y.; Sesftel, F.; Akimoto, T.; Ohmori, T.; Azumi, K.; Takahashi, A.Results of hydrogen production in the cathodic regime of PDSE of K2CO3 aqueous electrolytic solution are presented and discussed.
Variables: applied voltage.
[13,14,15]
2006ChinaZongcheng, Y.; Li, C.; Honglin, W.Results of hydrogen production in the cathodic regime of PDSE of Na2CO3 aqueous electrolytic solution without and with methanol additive are presented and discussed.
Variables: applied voltage, concentration of methanol as an additive.
[16]
2008ChinaYan, Z.; Chen, L.; Wang, H.Results of hydrogen production in the anodic and cathodic regimes of PDSE of NaOH aqueous electrolytic solution with ethanol additive are presented and discussed.
Variables: applied voltage, polarity of the discharge electrode, concentration of ethanol as an additive.
[36]
2009ChinaYan, Z.; Li, C.; Lin, W.The most comprehensive study of hydrogen production in the anodic and cathodic regimes of PDSE of NaOH, KOH, and H2SO4 aqueous electrolytic solutions with methanol additive.
Variables: applied voltage, polarity of the discharge electrode, type of the electrolyte, and concentration of methanol as an additive.
[42]
2011IndonesiaSaksono, N.; Feryansyah, R.; Bismo, S.Results of hydrogen production in the cathodic regime of PDSE of KOH aqueous electrolytic solution are presented and discussed.
Variables: applied voltage, concentration of the electrolytic solution.
[60]
2014IndonesiaSaksono, N; Ma’arif, M.F; Faiz, M.B.; Bismo, S.Results of hydrogen production in the cathodic regime of PDSE of Na2CO3 aqueous electrolytic solution without and with acetic acid additive are presented and discussed.
Variables: applied voltage, concentration of the electrolytic solution, concentration of acetic acid as an additive, temperature of the electrolytic solution.
[61]
2016IndonesiaSaksono, N.; Kartohardjono, S.; Yuniawati, T.Results of hydrogen production in the cathodic regime of PDSE of NaOH aqueous electrolytic solution without and with methanol additive are presented and discussed.
Variables: applied voltage, concentration of the electrolytic solution, concentration of methanol as an additive, and active length of the discharge electrode.
[62]
2016IndonesiaSaksono, N.; Batubara, T.; Bismo, S.Results on hydrogen production in the cathodic regime of PDSE of KOH aqueous electrolytic solution with ethanol additive are presented and discussed.
Variables: applied voltage, concentration of the electrolytic solution, concentration of ethanol as an additive, temperature of the electrolytic solution.
[63]
2018IndonesiaSaksono, N.; Sasiang, J.; Rosalina, C.D.; Budikania, T.Results of hydrogen production in the cathodic regime of PDSE of KOH aqueous electrolytic solution with ethanol additive in the double-compartment reactor are presented and discussed.
Variables: applied voltage, concentration of the electrolytic solution, concentration of ethanol as an additive, temperature of the electrolytic solution, and active length of the discharge electrode.
[64]
2020The USAToth, J.R.; Hawtof, R.; Matthiesen, D.H.; Renner, J.N.; Sankaran, R.M.Results of hydrogen production in the cathodic regime of PDSE of H2SO4 aqueous electrolytic solution are presented and discussed.
Variables: applied voltage, temperature of the electrolytic solution.
[65]
Notes: We did not include in this table studies such as [10,11,12,18,19,20,21,38,40,41,43,44,45,46,47,48,50,59] dedicated to the fundamentals of the anodic and cathodic regimes of PDSE.
Table 4. Comparison of hydrogen production in PDSE of different types of the electrolytic solutions with hydrogen production by other plasma-assisted methods.
Production MethodInitial Composition of the Liquid FeedstockCarrier GasProduction Rate, g(H2)/hEnergy Yield, g(H2)/kWhReferences
Plasma electrolysis (PDSE)H2O (97.3 wt%) +K2CO3 (2.7 wt%)n/a2.733.21[14]
Plasma electrolysis (PDSE)Methanol (50 vol%) + H2O (50 vol%)n/an/a84.34[16]
Plasma electrolysis (PDSE)Ethanol (99.5 vol%) + H2O (0.5 vol%)Ar at 150 sccm58.3557.59[36]
Plasma electrolysis (PDSE)Methanol (99.5 vol%) + H2O (0.5 vol%)Ar at 150 sccmn/a67.32[42]
DBD plasmaEthanolCO2/H2O carrier gas was added to maintain 1:1 mole ratio with ethanoln/a6.7[72]
DBD plasmaMethanol (pure)Air ***0.0782.4[73]
DBD plasmaEthanol (25 mol%) + H2O (75 mol%)-0.915.4[74]
Microwave (2.45 GHz) plasmaMethanol at 90 sccm + H2O–Ar mixture at 3910 sccm with majority of ArAr, the total volume flow rate of Ar–methanol–water mixture was 4000 sccm0.671.34[75]
Ethanol at 30 sccm + H2O–Ar mixture at 1970 sccm with majority of ArAr, the total volume flow rate of Ar–methanol–water mixture was 2000 sccm0.310.52
Microwave (2.45 GHz) plasmaEthanol (96 vol%) + H2O (4 vol%)Ar at 1000 sccm0.250.55[76]
Microwave (2.45 GHz) plasmaMethanol (pure)Ar at 1000 sccm0.1310.29[77]
Methanol (90.9 vol%) + H2O (9.1 vol%)Ar at 1000 sccm0.1860.41
Microwave (915 MHz) plasmaEthanol (pure)CO2 at 45 NL/min64.2812.86[78]
Isopropanol (pure)CO2 at 45 NL/min100.3320.04
Kerosene (pure)CO2 at 45 NL/min40.188.0
Microwave (2.45 GHz) plasmaEthanol (8 vol%) + H2O (92 vol%)-2.16312.37[79]
Microwave (2.45 GHz) plasmaEthanol (70 vol%) + H2O (30 vol%)-72.4848.33[80]
Gliding arc (water spray)H2O (pure)Ar at 2000 sccm0.00413[81]
Gliding arc (alcohol spray)Methanol (pure)Ar at 2000 sccm0.08176 *[82]
Laval nozzle arc dischargeEthanol (39.1 wt%) + H2O (60.9 wt%)Air at 0.629 g/s13.6898.73 **[83]
Spark dischargeEthanol (50 vol%) + H2O (50 vol%)-2.27653.18[84]
Nanosecond pulsed dischargeEthanol (26 vol%) + H2O (74 vol%)-0.80980.89[85]
Pulsed dischargeEthanol (50 vol%) + H2O (50 vol%)n/a5.932141.3 *[86]
Multiple spark dischargesEthanol (pure)-0.58393.63[87]
Gliding spark dischargeEthanol (pure)-1.78179.76 *
Notes: * The reported values of the energy yields of hydrogen production are surprisingly large and higher than the thermodynamically minimal energy consumption for one mole of hydrogen production in methanol–water and ethanol–water reforming. ** Energy consumption was estimated based on LHV of ethanol. *** Flow rate of the air as a carrier gas is not mentioned in the paper.
Table 5. Comparison of hydrogen production by alkaline electrolysis (AEL), polymer electrolyte membrane electrolysis (PEMEL), solid oxide electrolysis (SOEL), and plasma-driven solution electrolysis (PDSE).
Production MethodElectrodeFeedstockCell Temperature, °CTypical Pressure, BarH2 Production Rate per Stack, kg(H2)/hEnergy Yield, g(H2)/kWhReferences
AELNi/FeH2O (70–75 wt%) + KOH (30–25 wt%)60–9010–30125.818.73–21.4[31]
PEMELNoble metals
(Pt, Ir)
H2O50–8020–503617.98–20.43[31]
SOELNi-doped ceramicH2O/(H2O + CO2)700–10001–15<0.929.96 *[31]
PDSE of the typical electrolytic solutionTungstenH2O (97.3 wt%) +K2CO3 (2.7 wt%)80n/a2.73 × 10−33.21 **[14]
PDSE of the electrolytic solution with alcoholTungstenMethanol (50 vol%) + H2O (50 vol%)80n/an/a84.34 **[16]
Notes: * Thermal energy consumption for the steam generation is not taken into account. ** Gas separation is not taken into consideration.
Publisher’s Note: MDPI stays neutral with regard to jurisdictional claims in published maps and institutional affiliations.

