

Vibration and Noise Optimization of Variable-Frequency-Driven SPMSM Used in Compressor Based on Electromagnetic Analysis and Modal Characteristics
 ,
,  ,
,
Abstract
:1. Introduction
2. Research on Air-Gap Magnetic Field of SPMSM Powered by Frequency Converter
2.1. Analytical Analysis of Air-Gap Magnetic Field Driven by Frequency Conversion
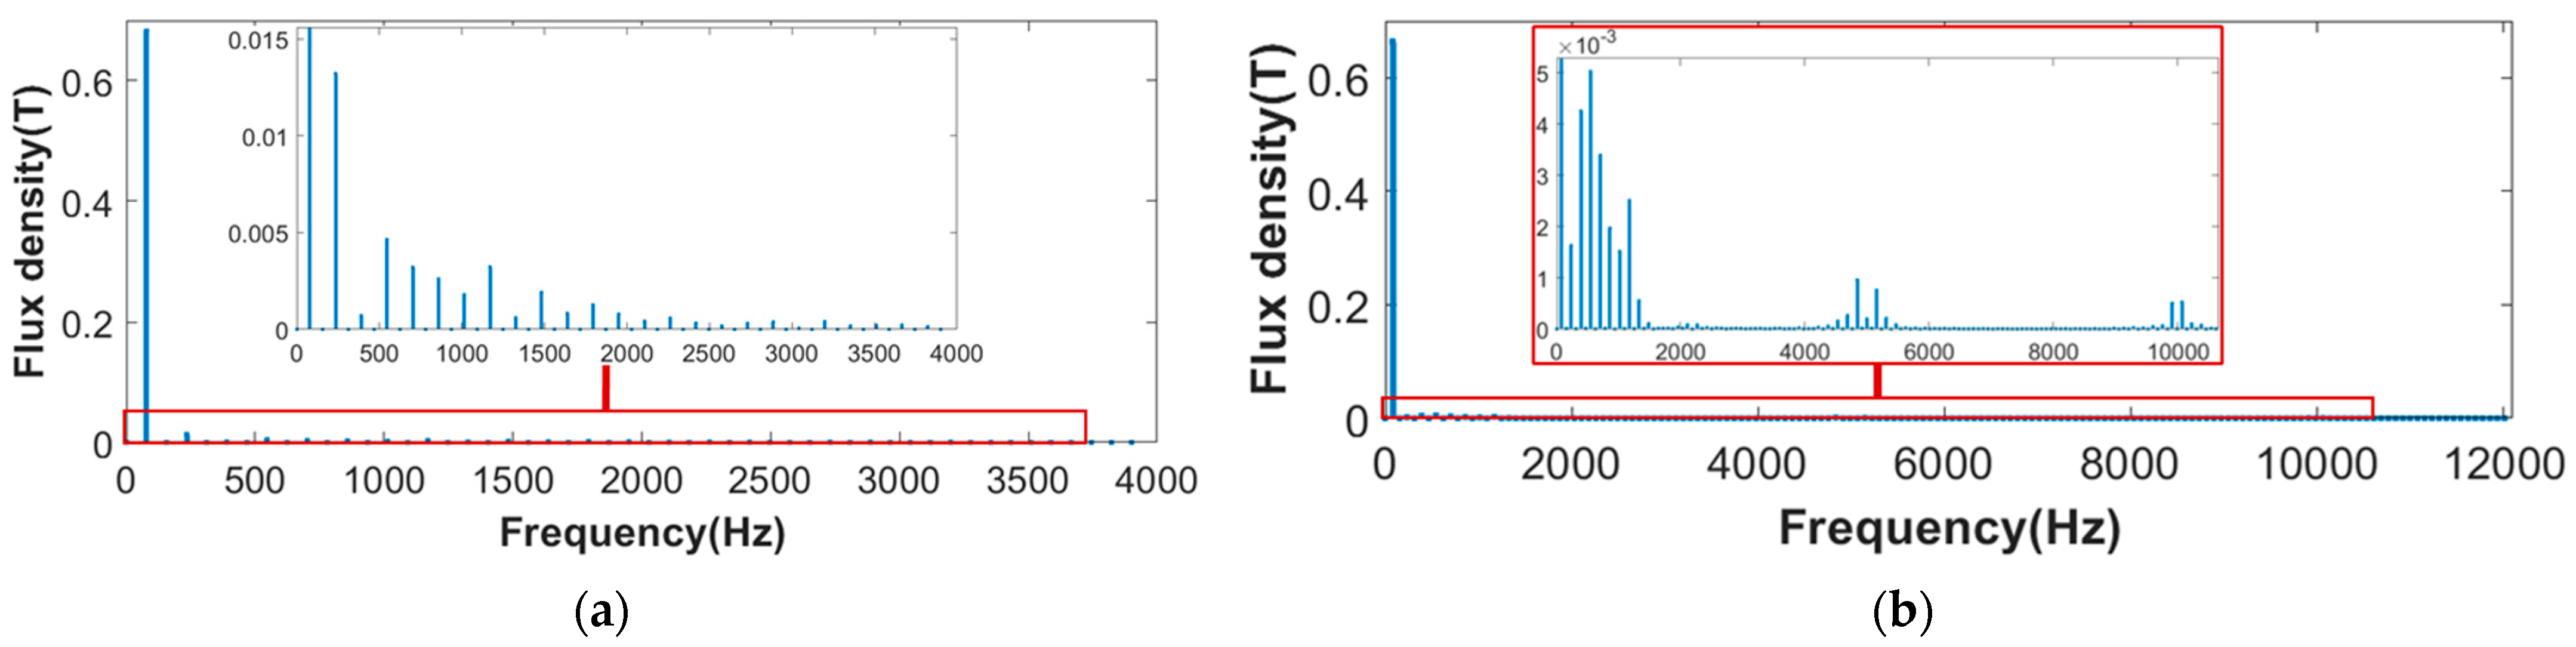
2.2. Simulation Verification of Air-Gap Flux Density Driven by Frequency Conversion
3. Research on Electromagnetic Excitation Force of PMSM Powered by Frequency Converter
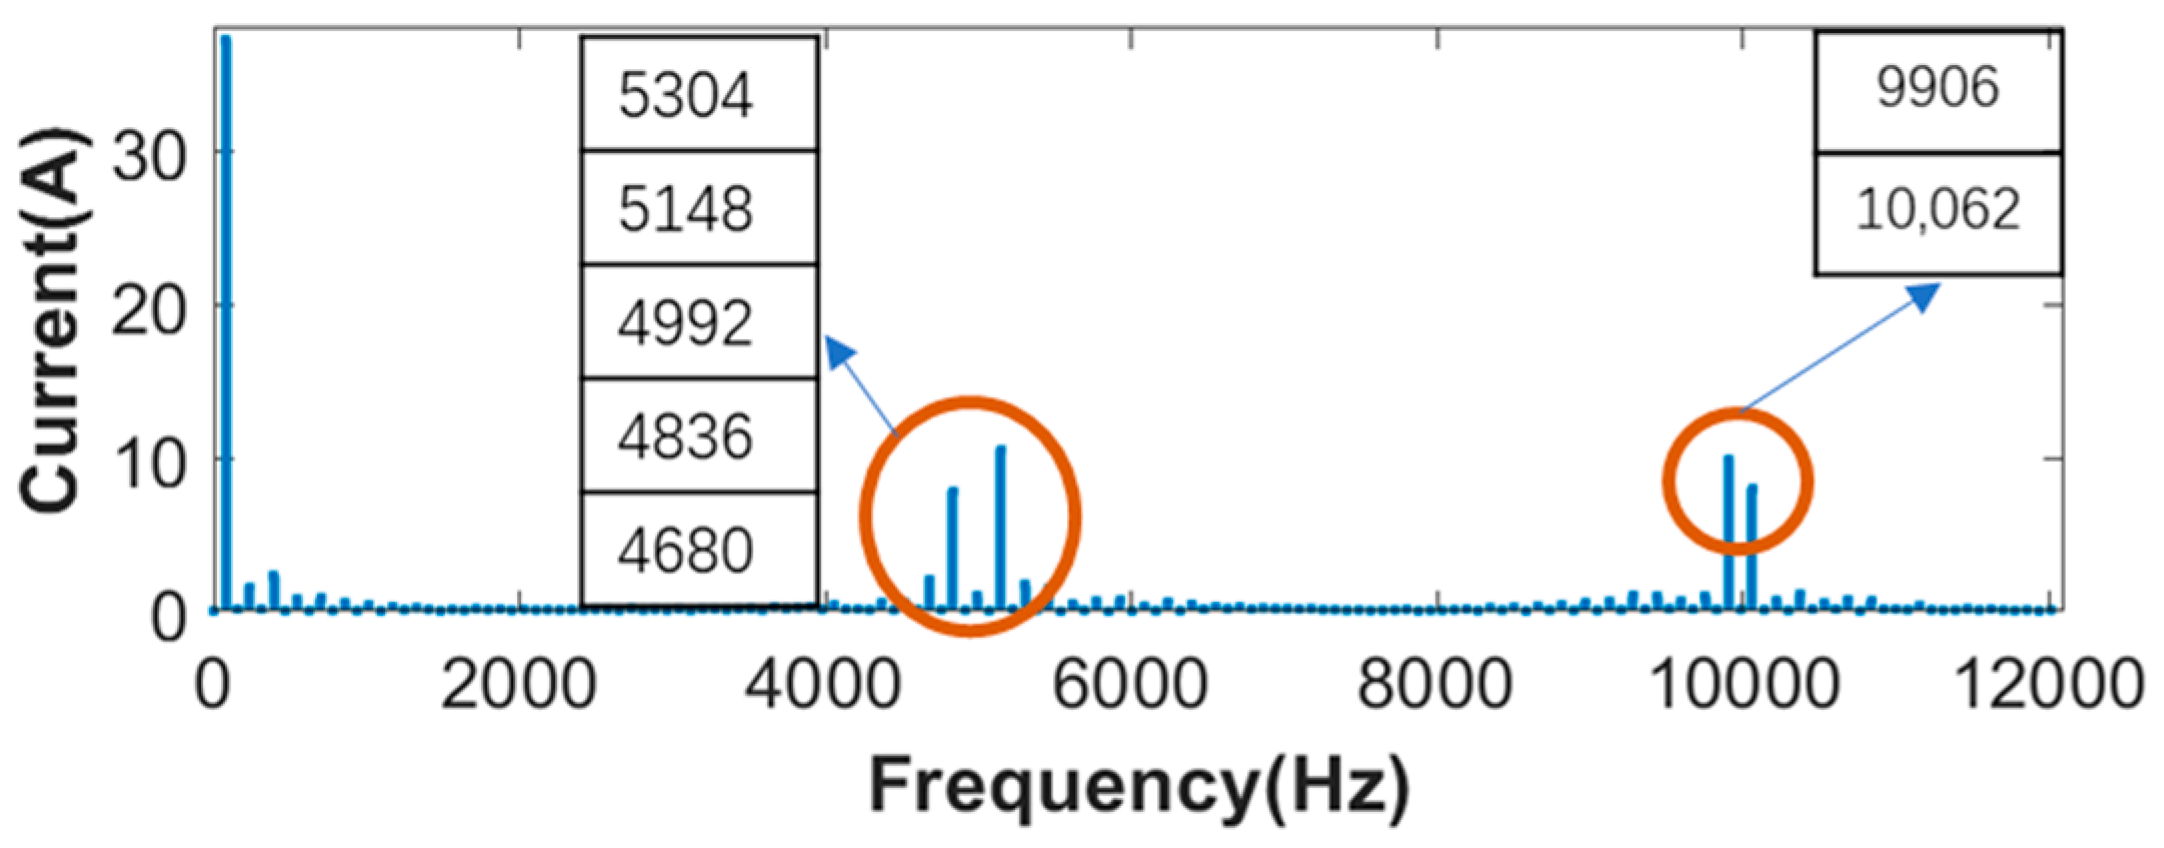
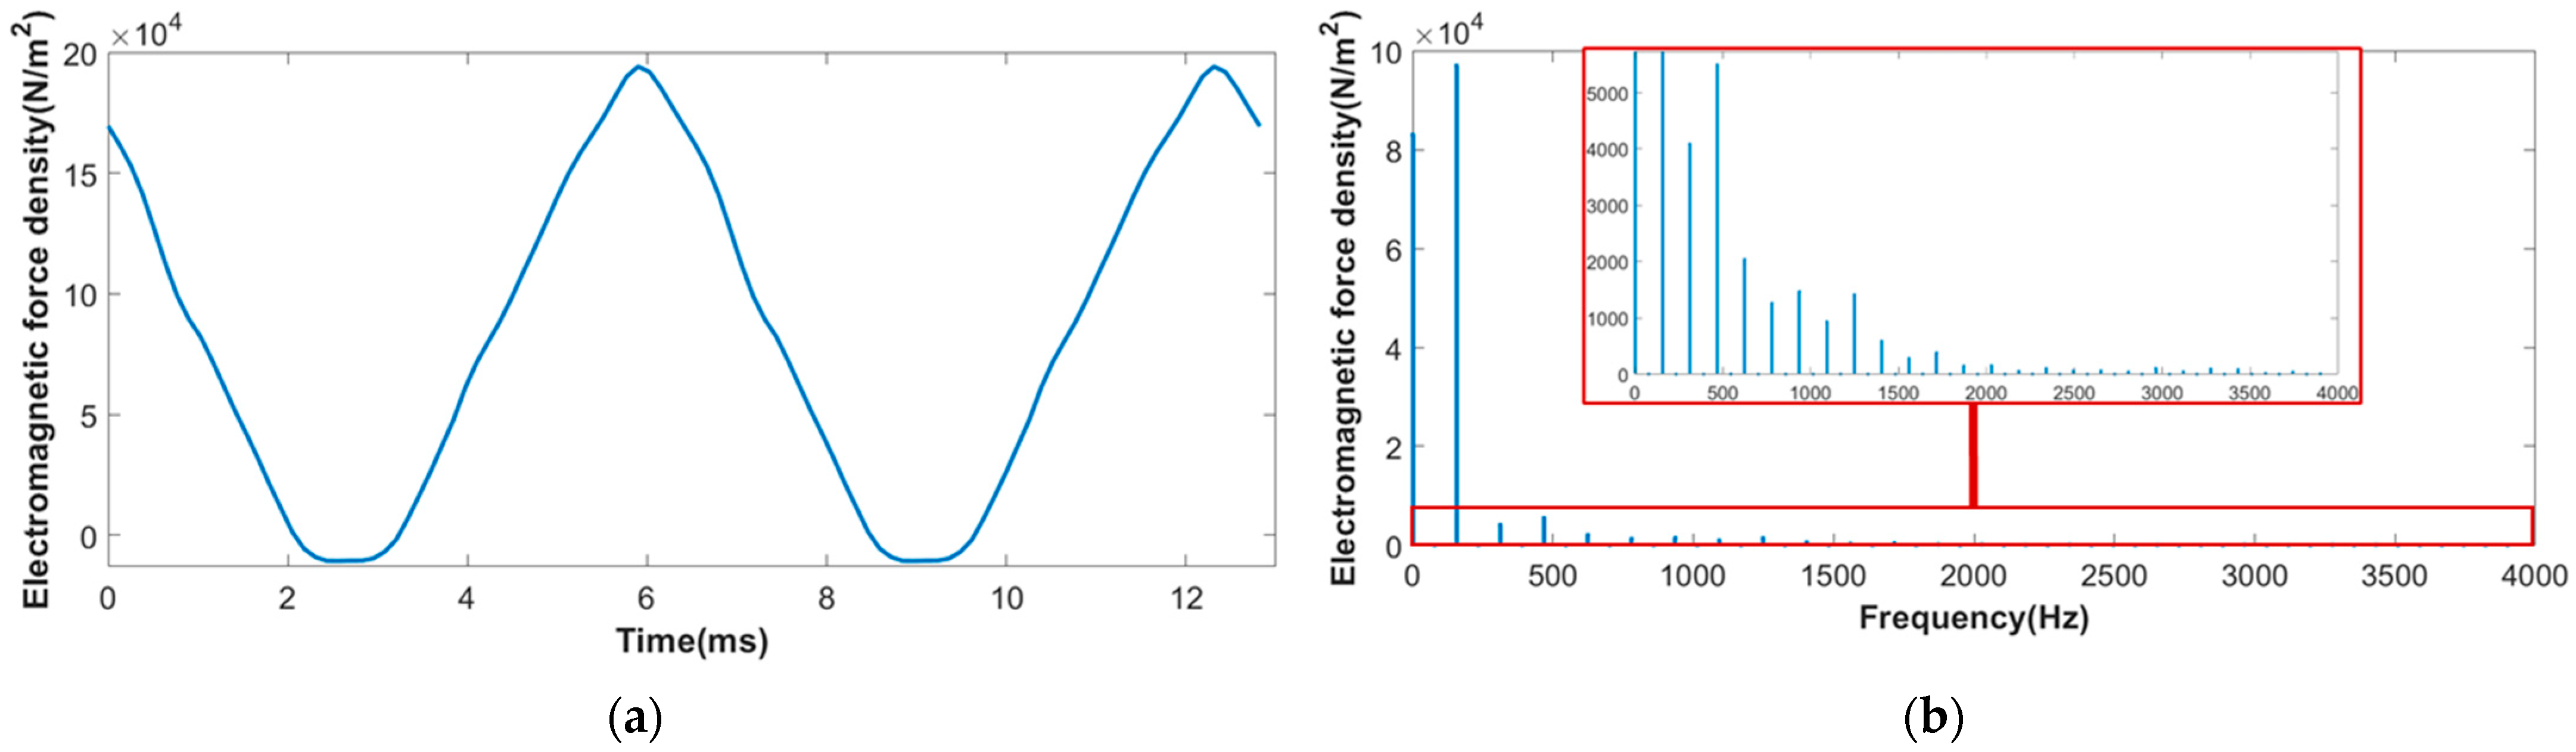
3.1. Analysis of Frequency Characteristics of High-Frequency Electromagnetic Force
3.2. Simulation and Verification of Frequency Characteristics of High-Frequency Electromagnetic Force
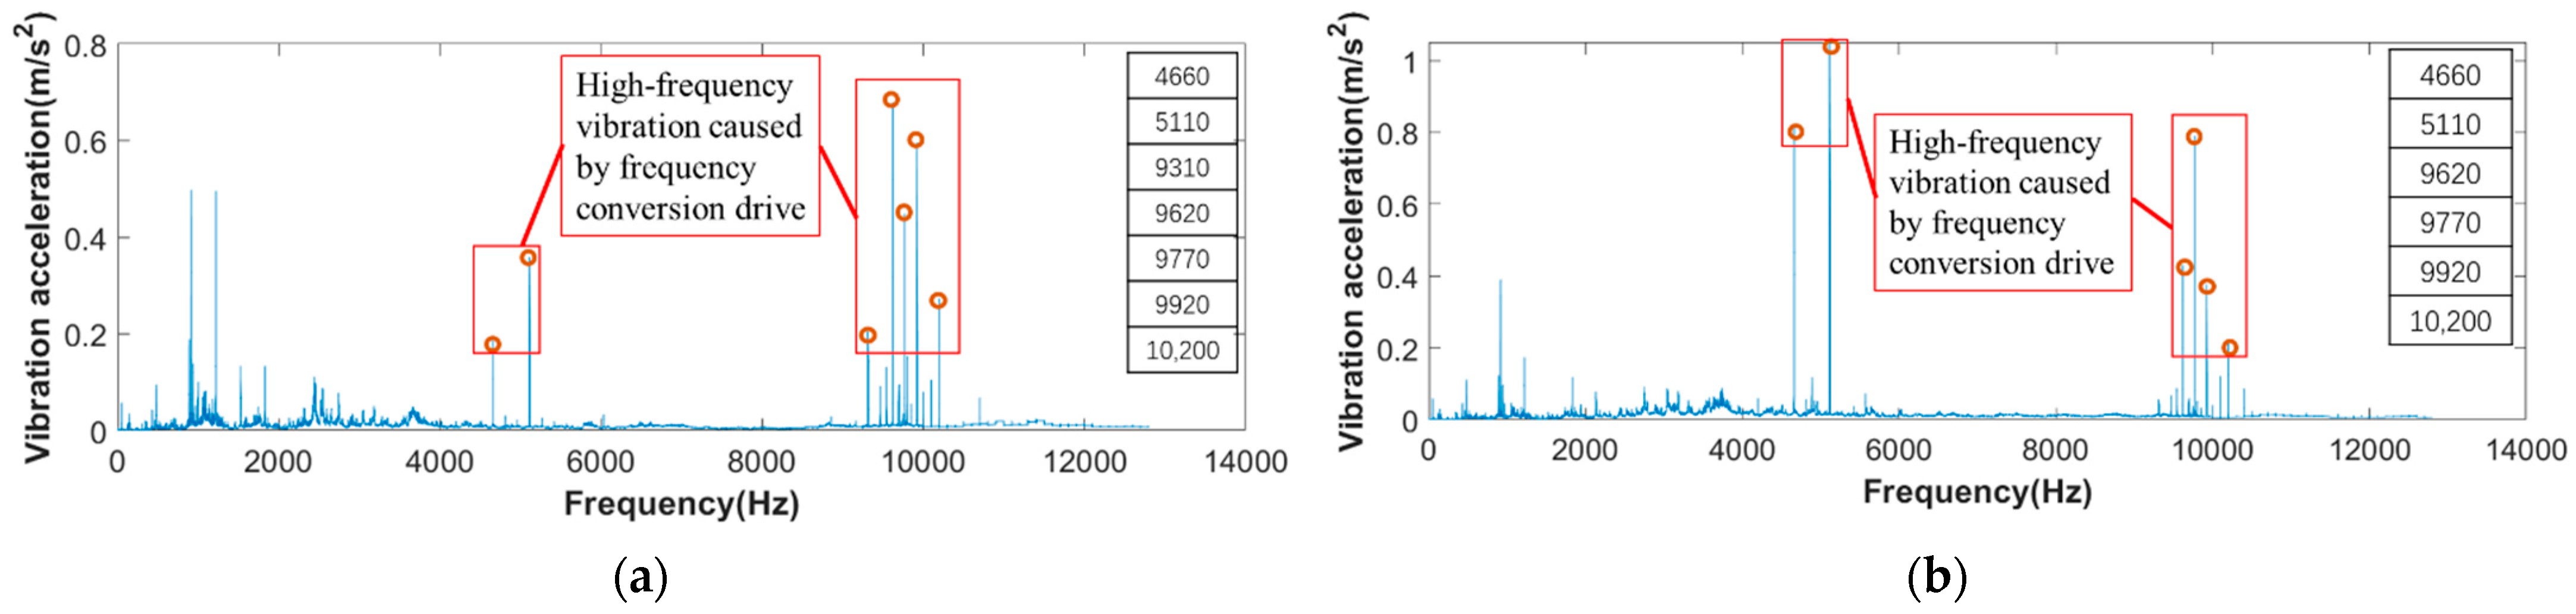
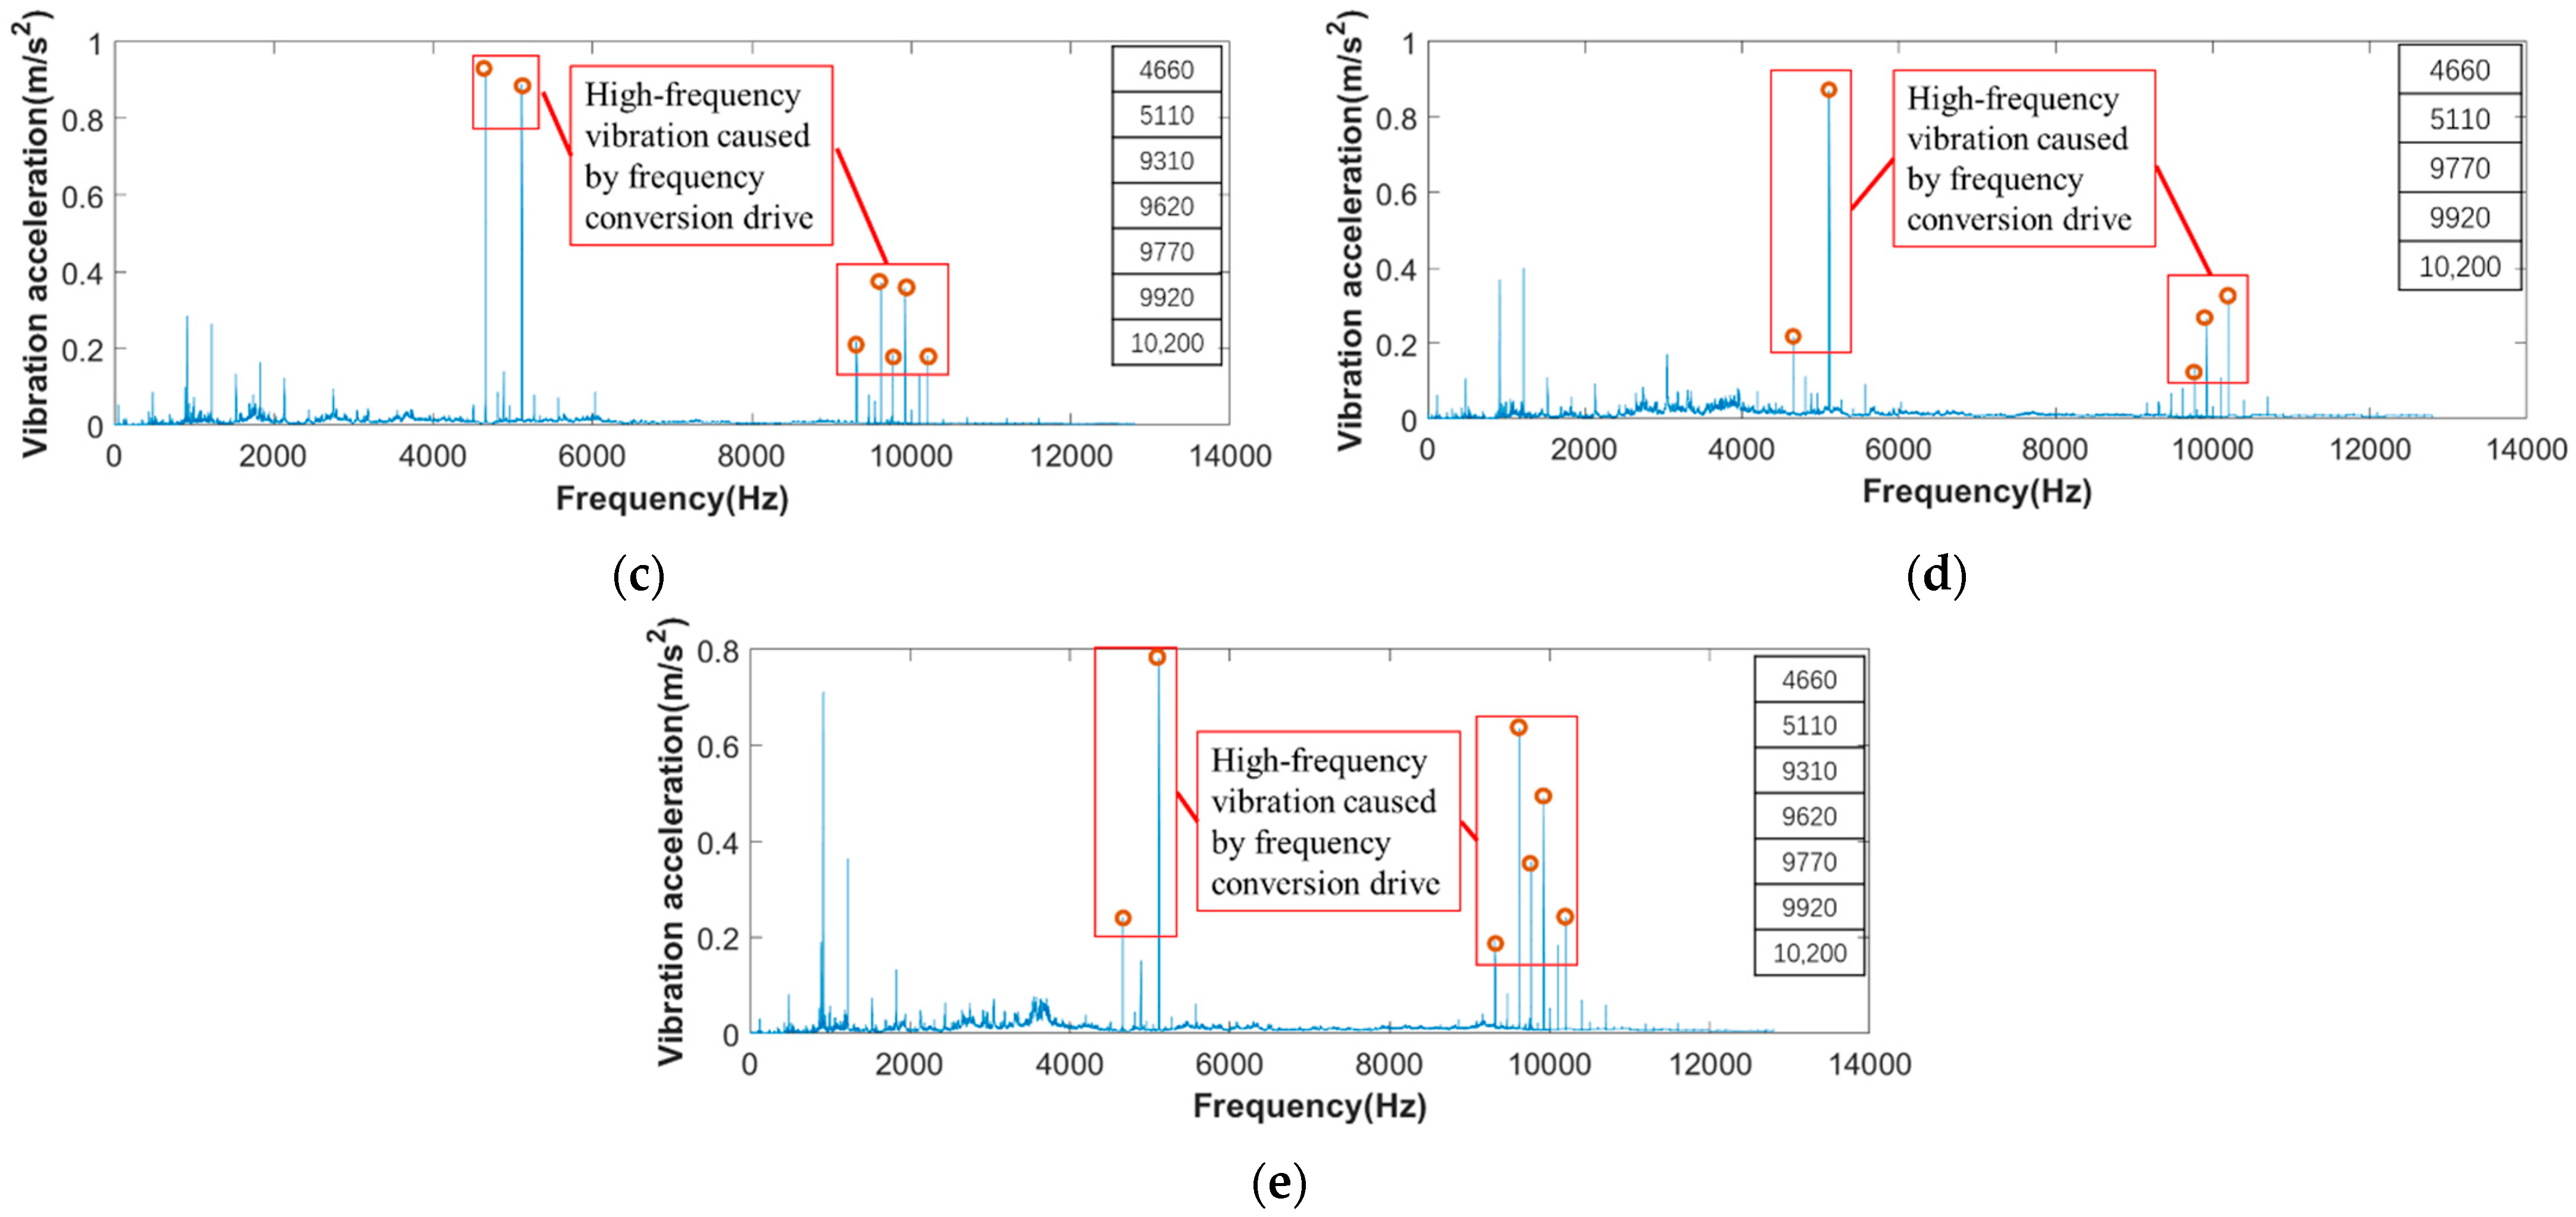
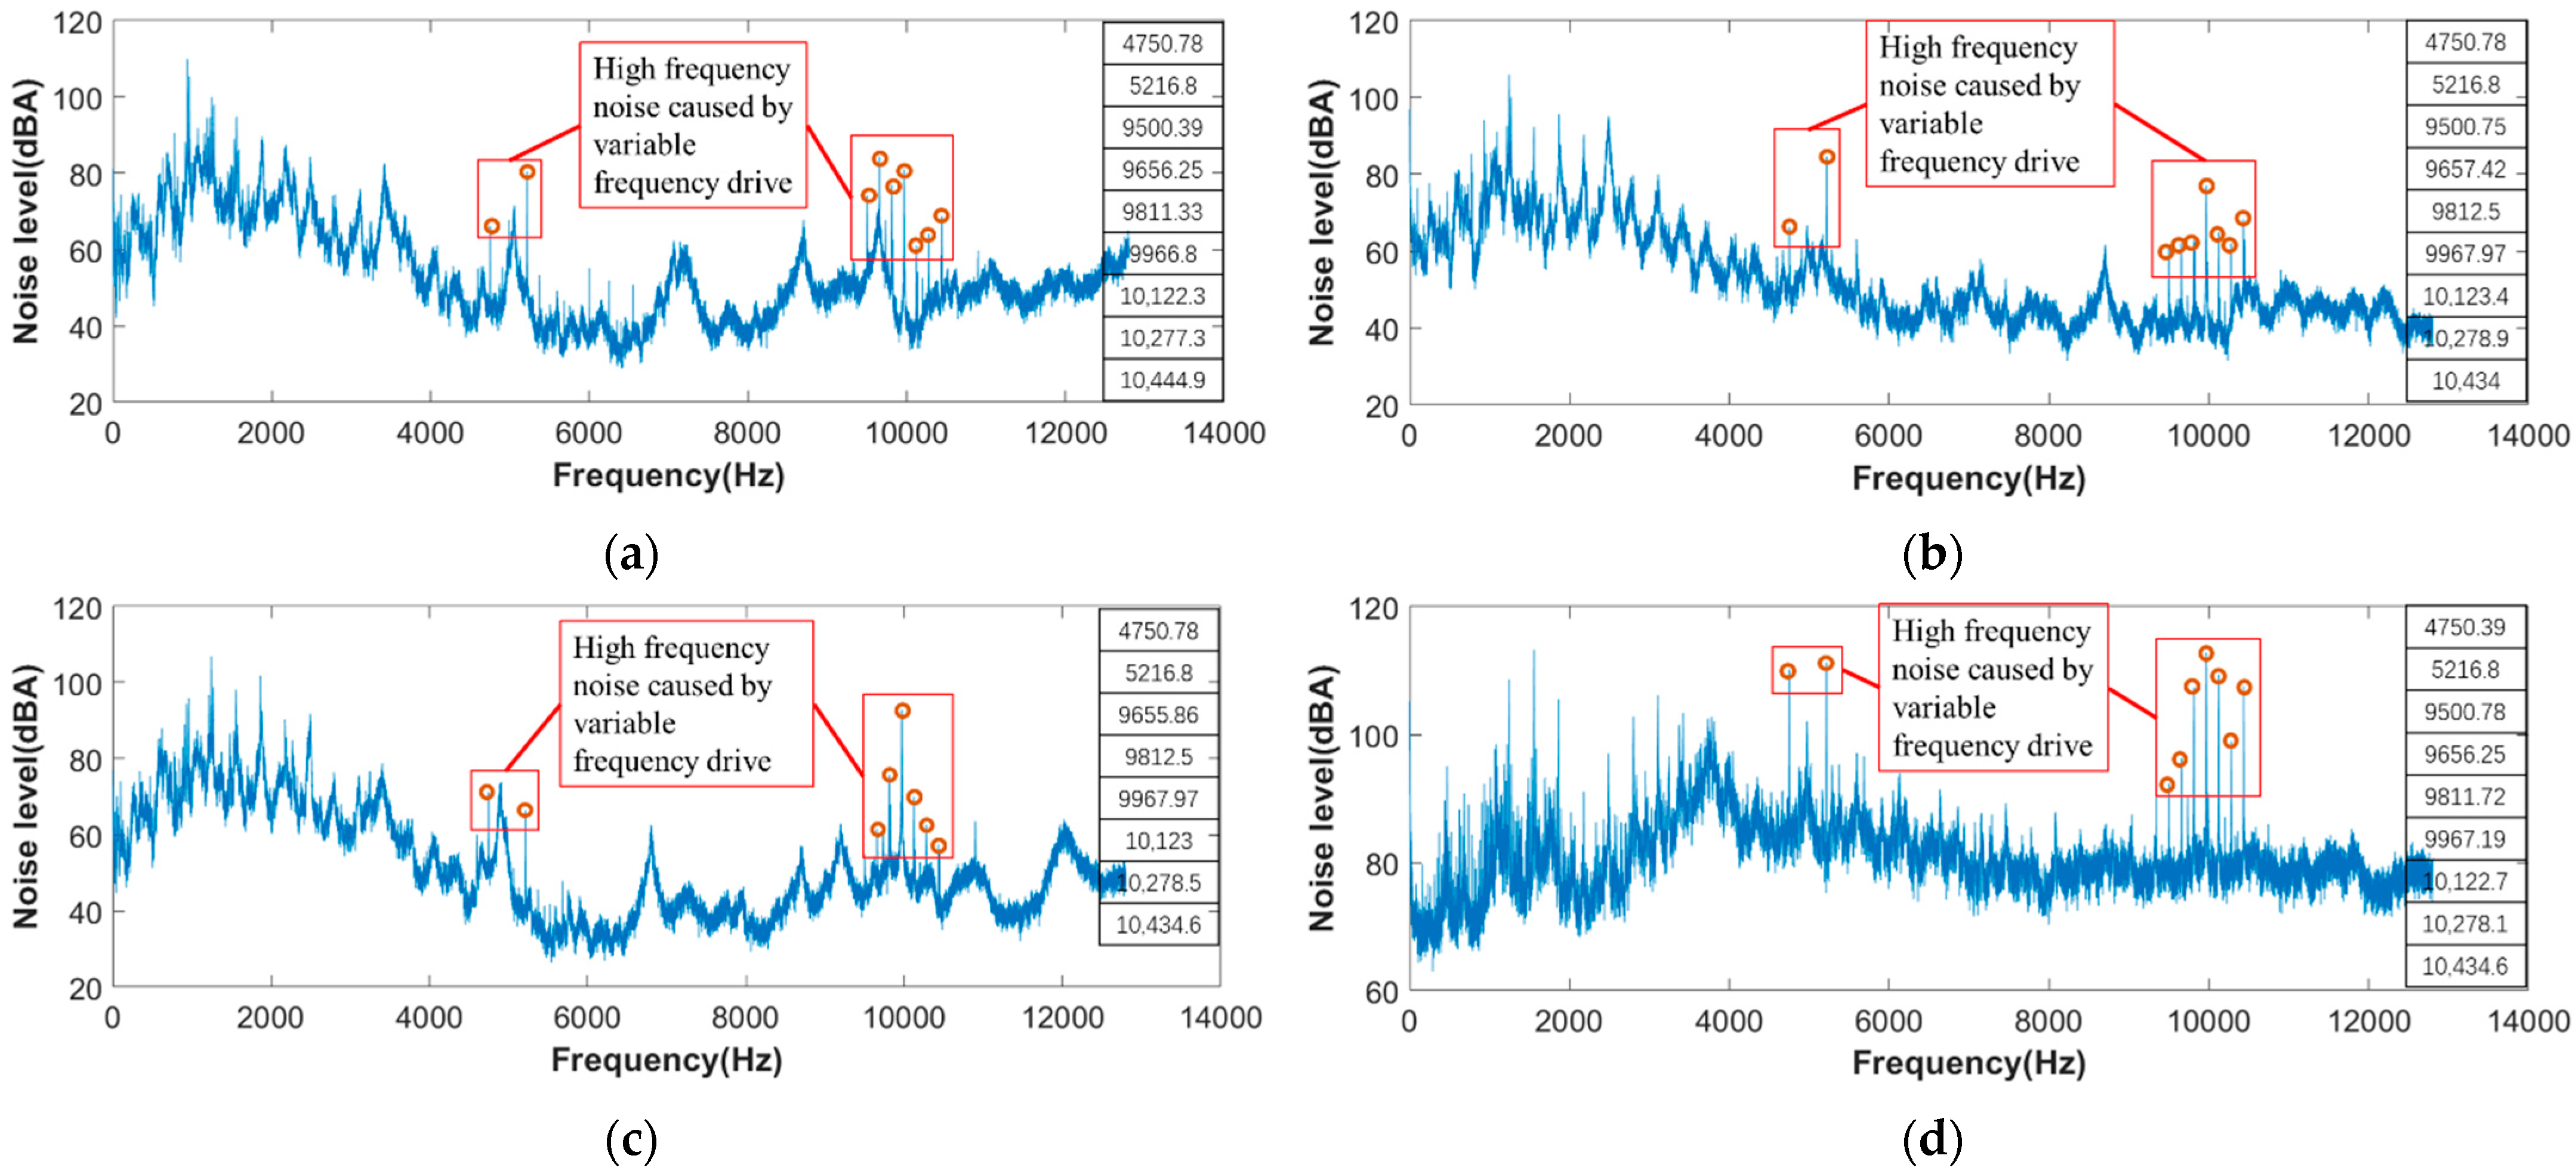
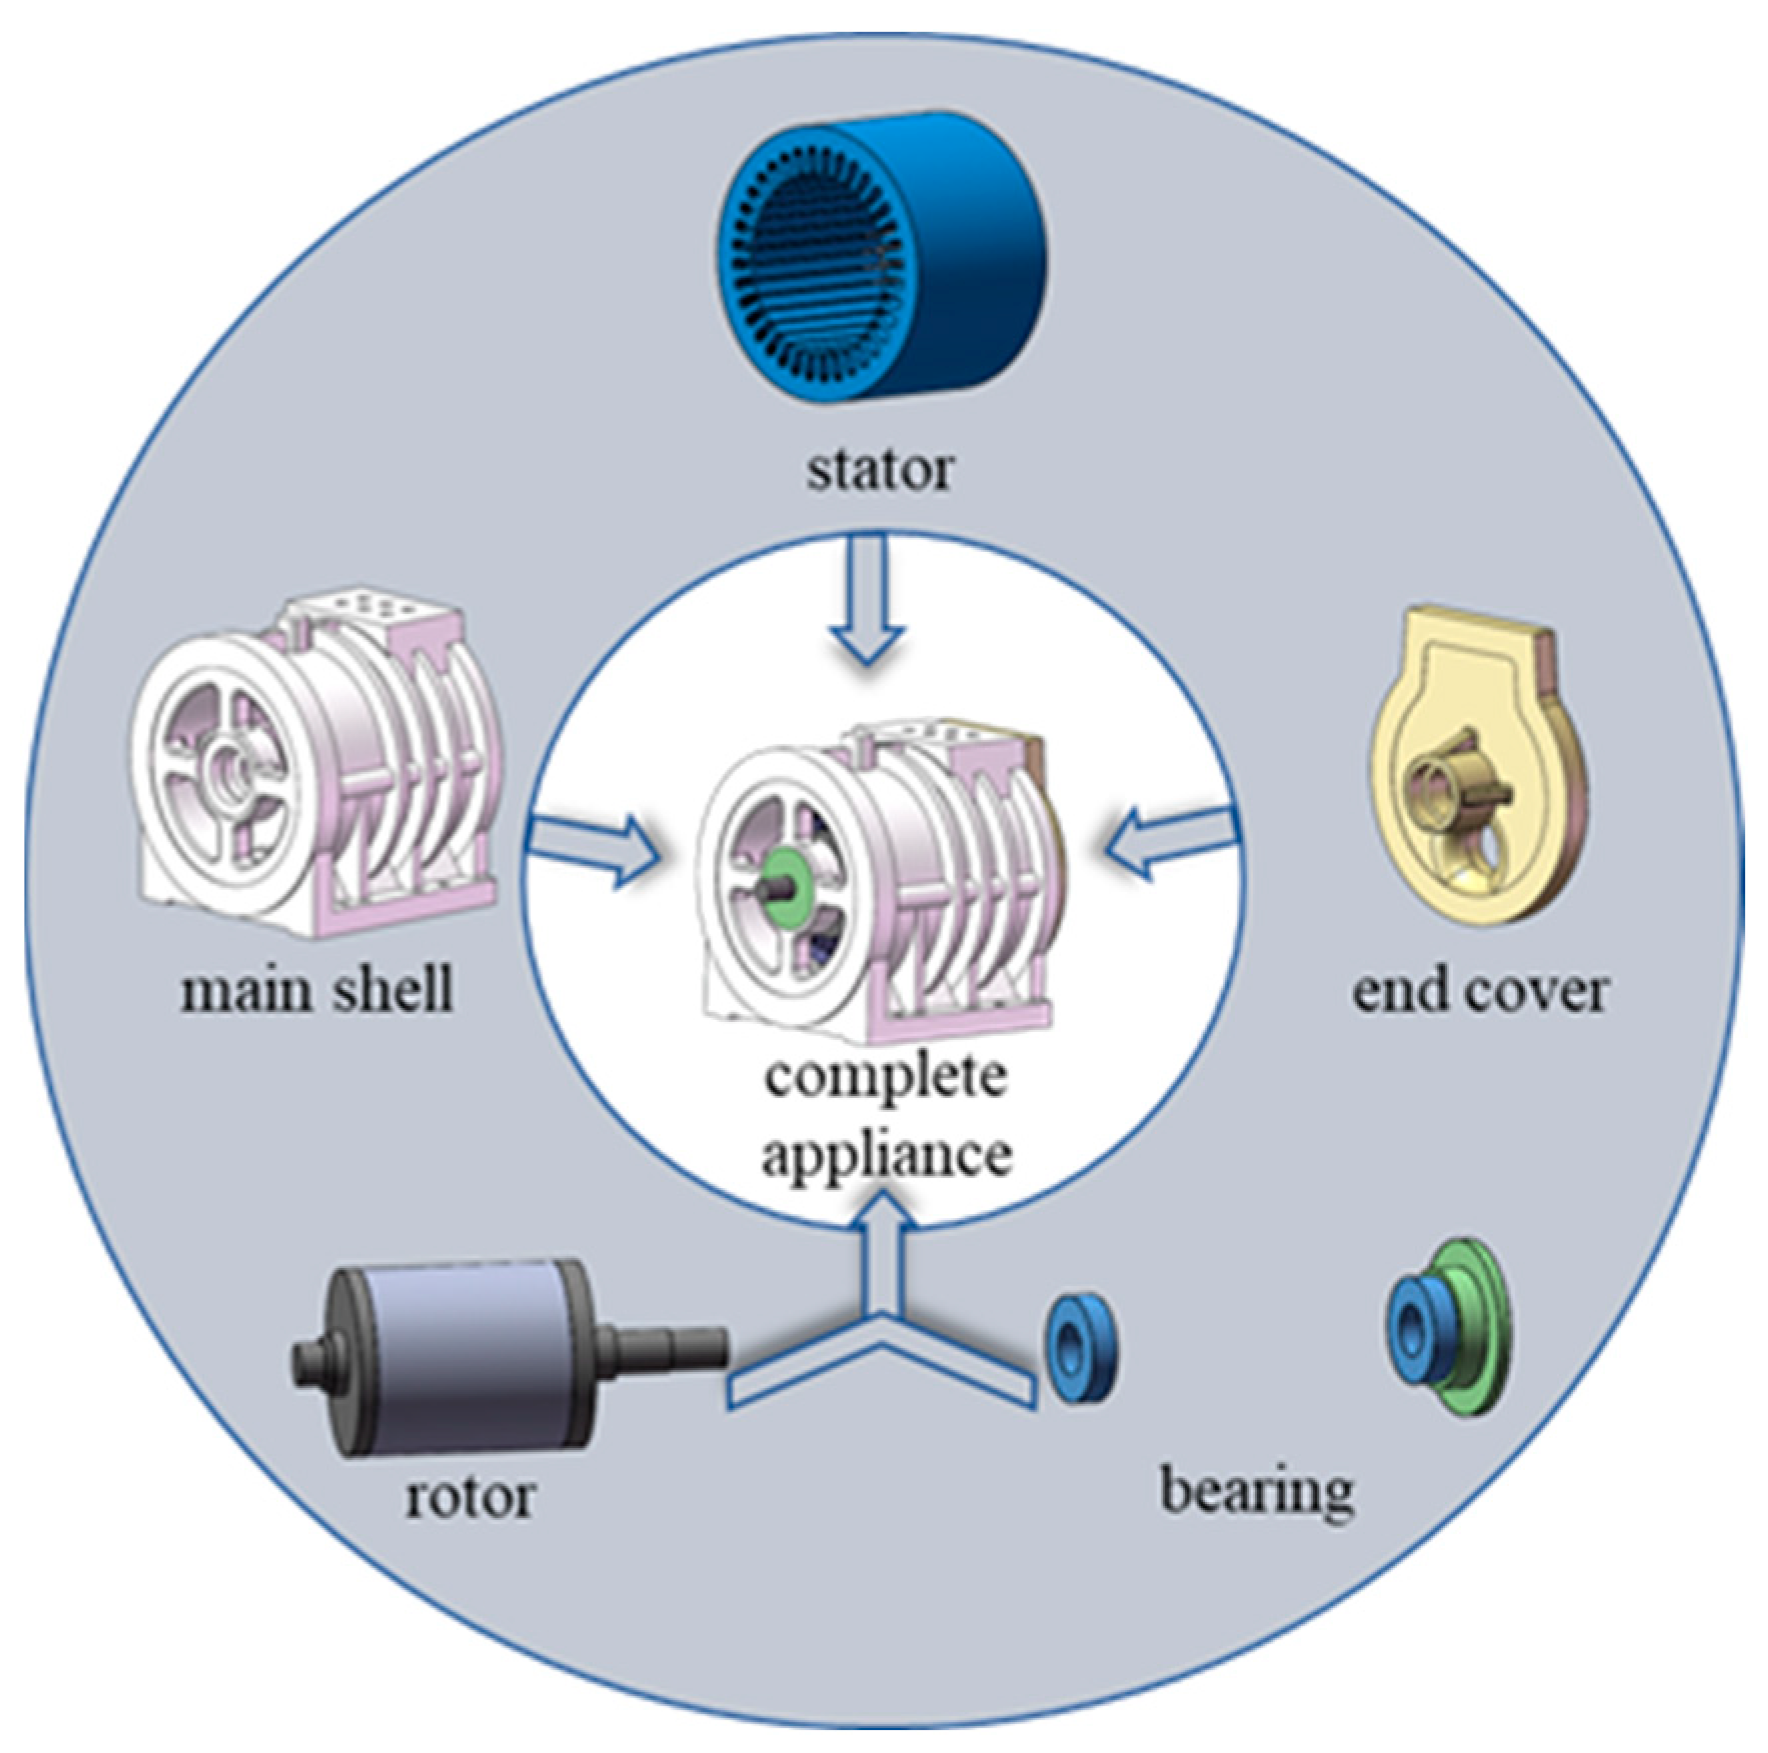
4. Experimental Analysis of Vibration and Noise of Permanent Magnet Motor Used in Compressor
5. Structural Modal Analysis and Optimization of PMSM in Compressor
5.1. Finite Element Theory of Structural Mode
5.2. Vibration Modal Characteristics of PMSM in Compressor
5.3. Simulation Calculation and Optimization of Natural Frequency
6. Summary
- (1)
- The air-gap flux density harmonics of an SPMSM driven by SVPWM are mainly caused by the sideband harmonic current. The frequencies of the harmonic components of these air-gap flux densities are the same as those of the sideband harmonic current, which can be expressed as , where is the switching frequency, is the fundamental frequency, is a positive integer, is a non-negative integer, and and have different parity.
- (2)
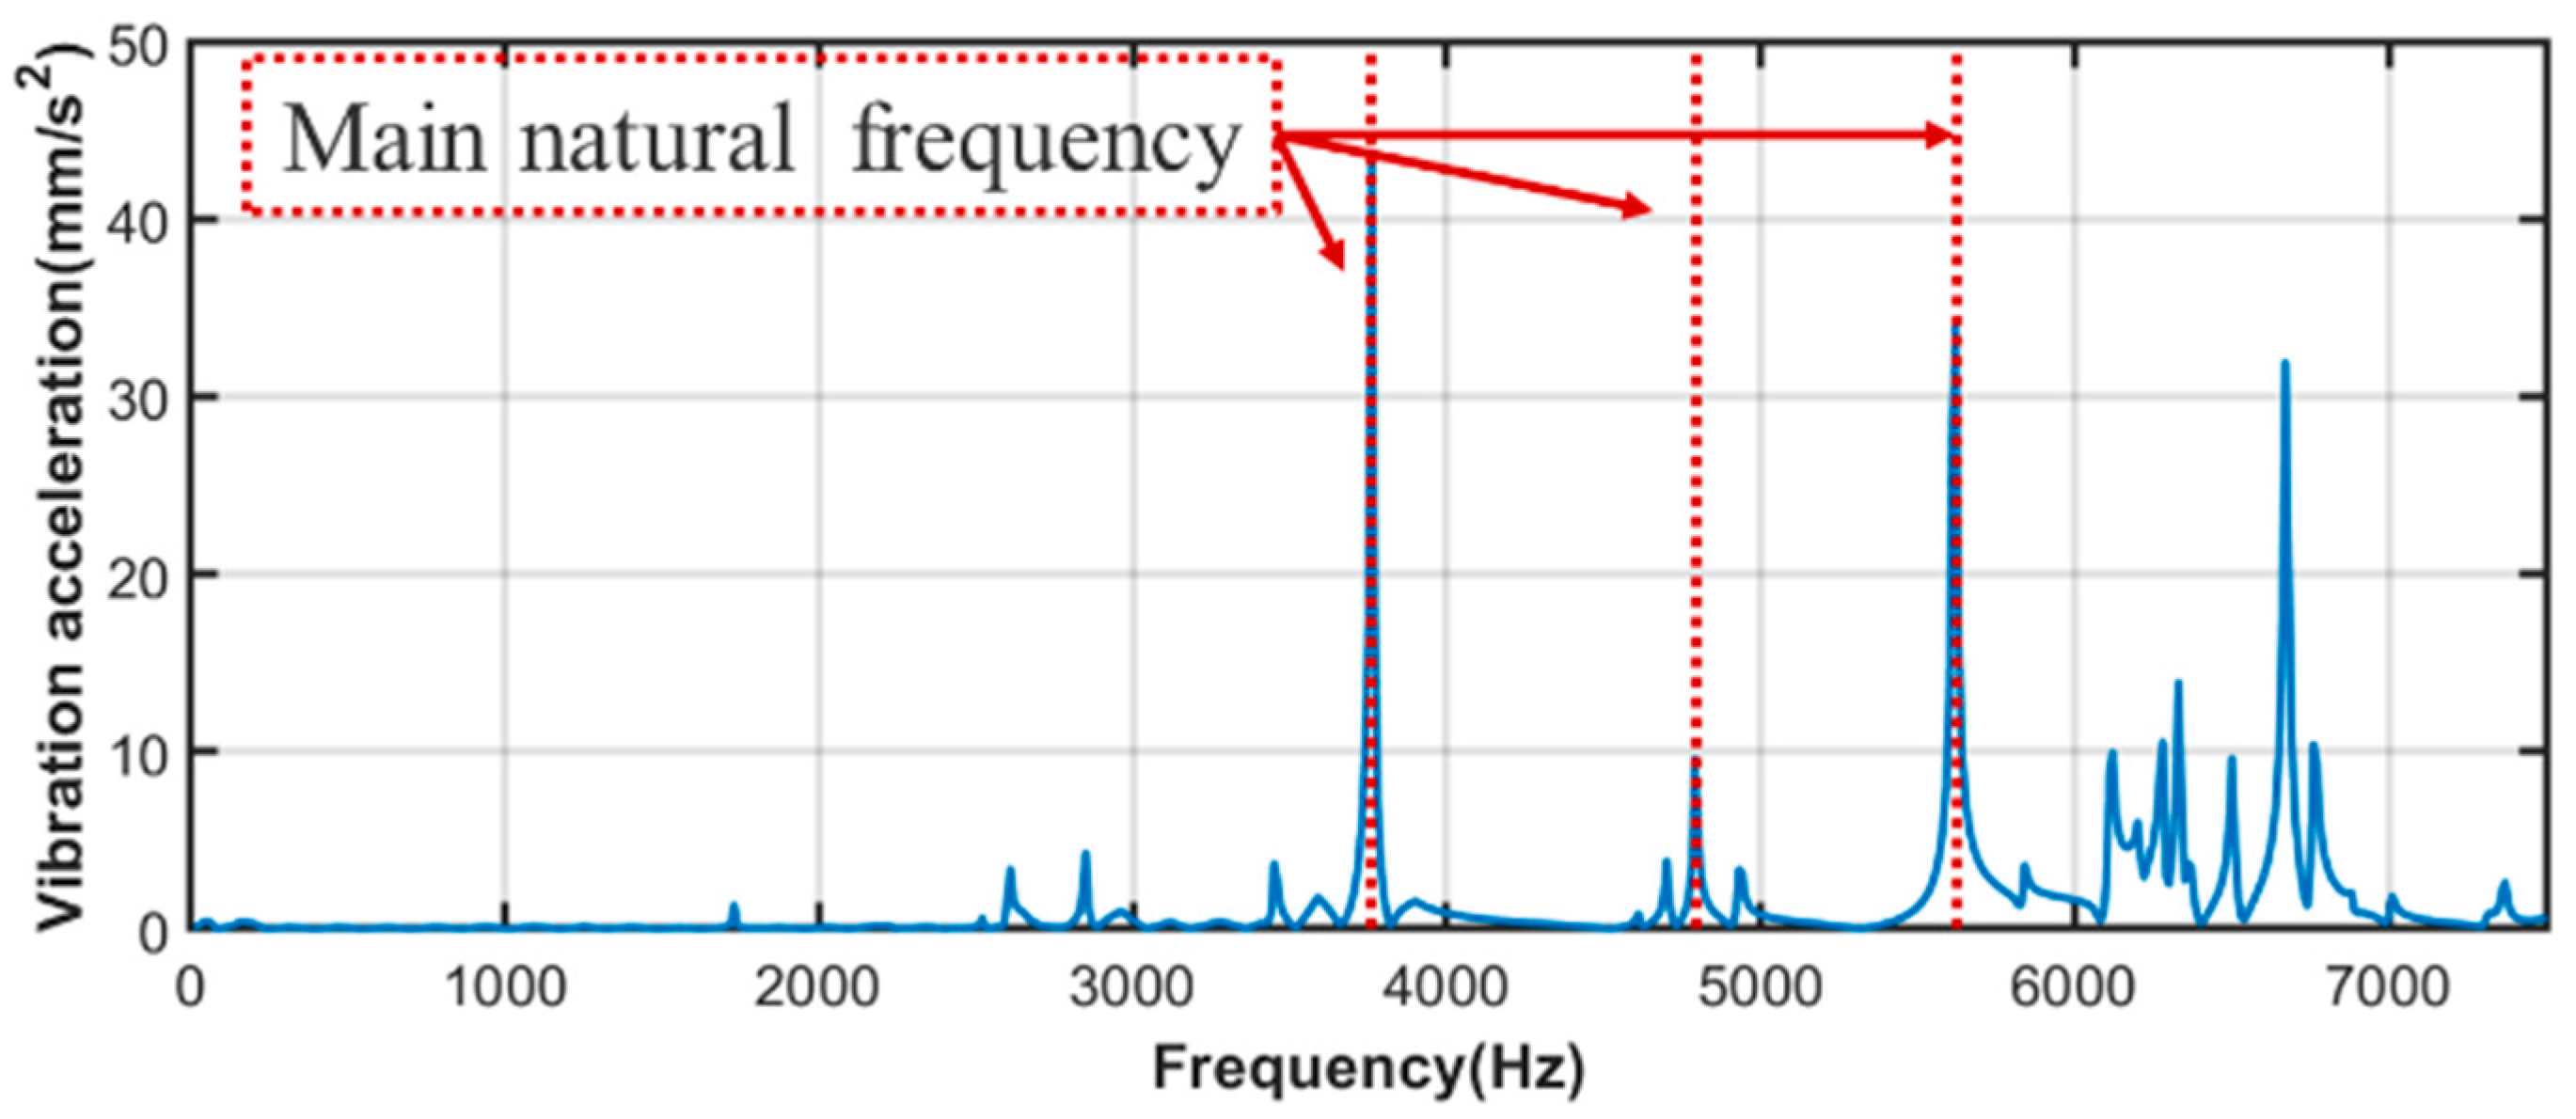
- When the SPMSM is powered by the frequency converter, there is a large high-frequency vibration noise near the switching frequency and its frequency doubling. The main vibrational noise frequency can be expressed as , where is a positive integer, is a non-negative integer, and and have the same parity.
- (3)
- The mechanical vibration characteristics of the whole motor can be determined by the noise spectrum obtained from the experiment. Cooperating with the harmonic response simulation and modal simulation, the main modal shapes can be determined, and their natural frequency ranges can be basically located from the noise spectrum.
- (4)
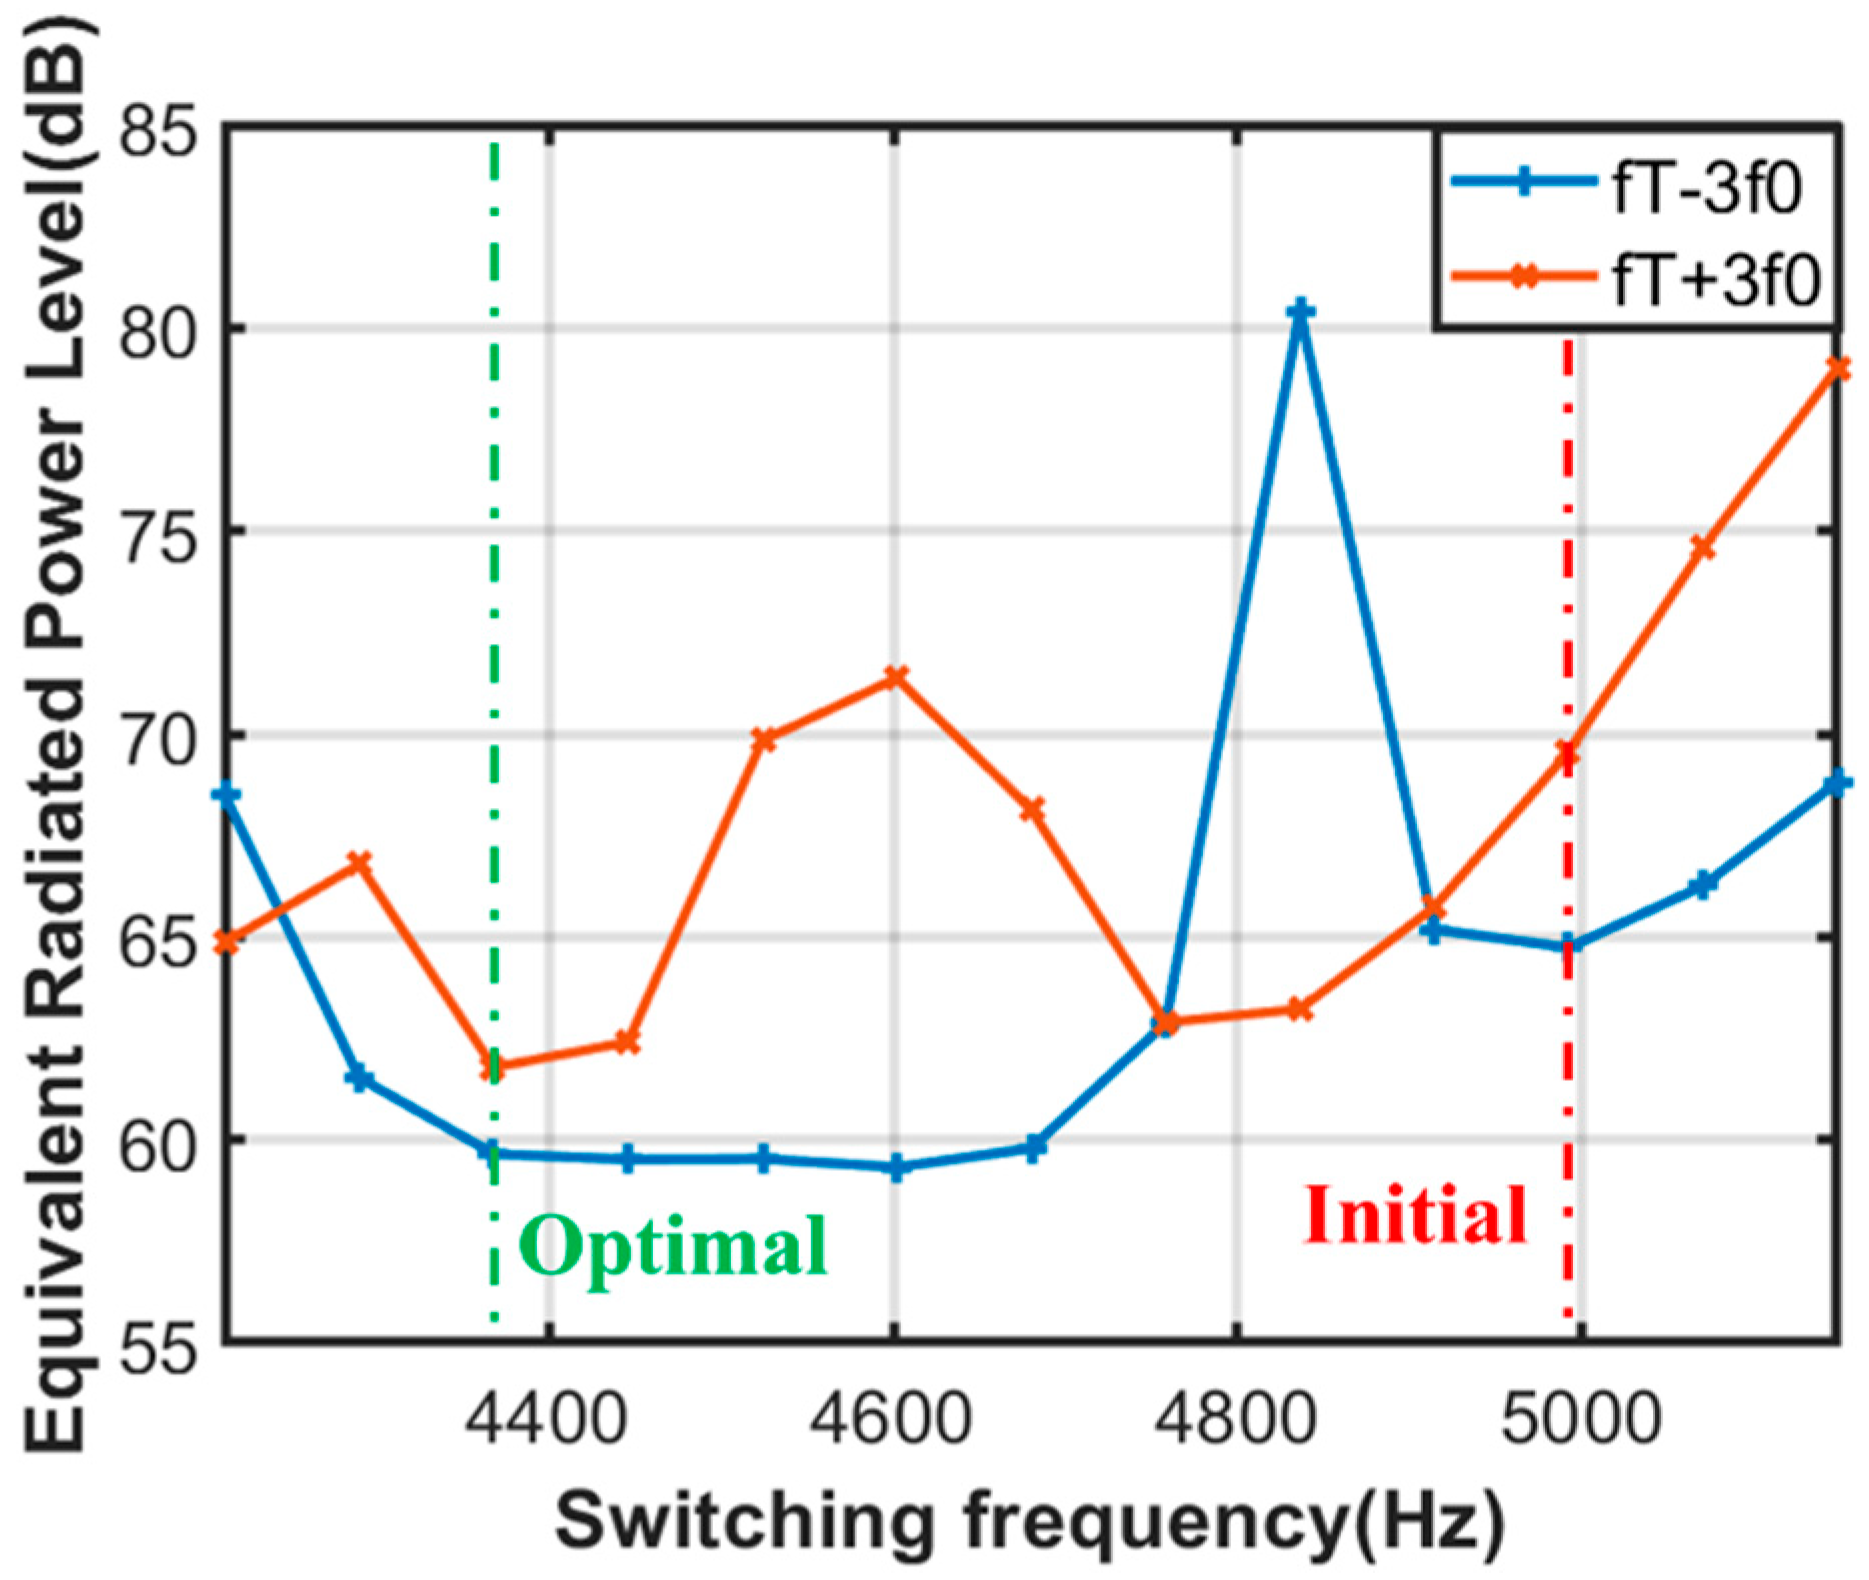
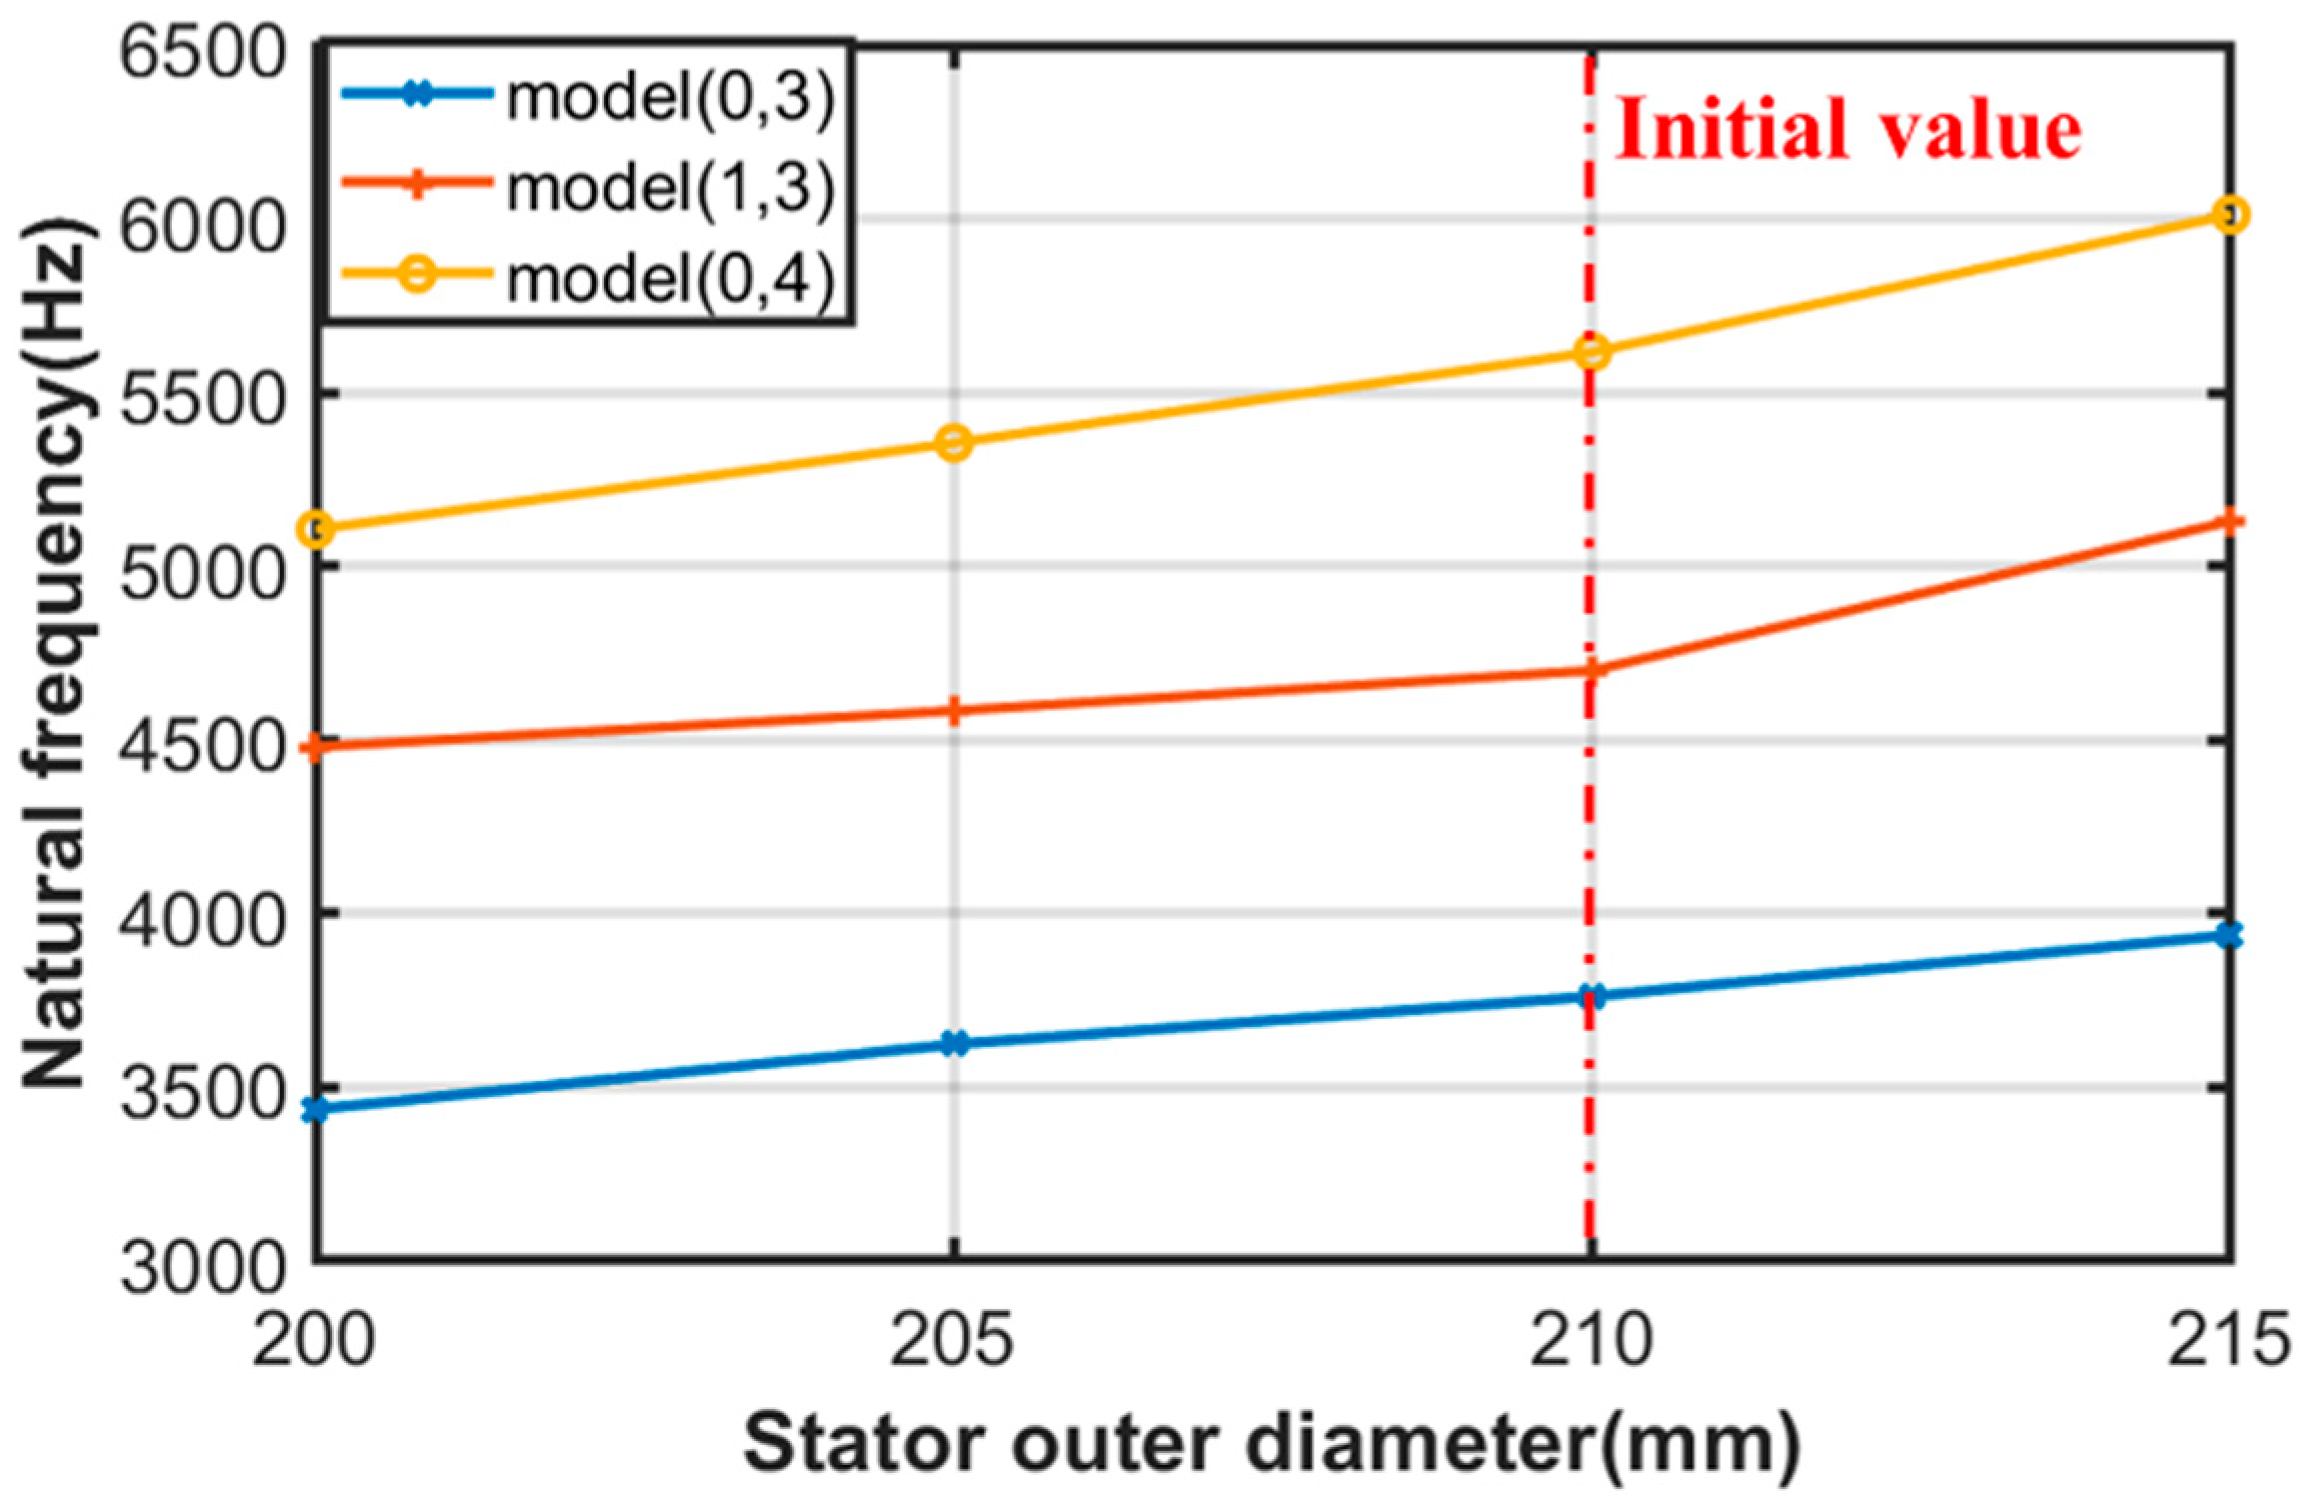
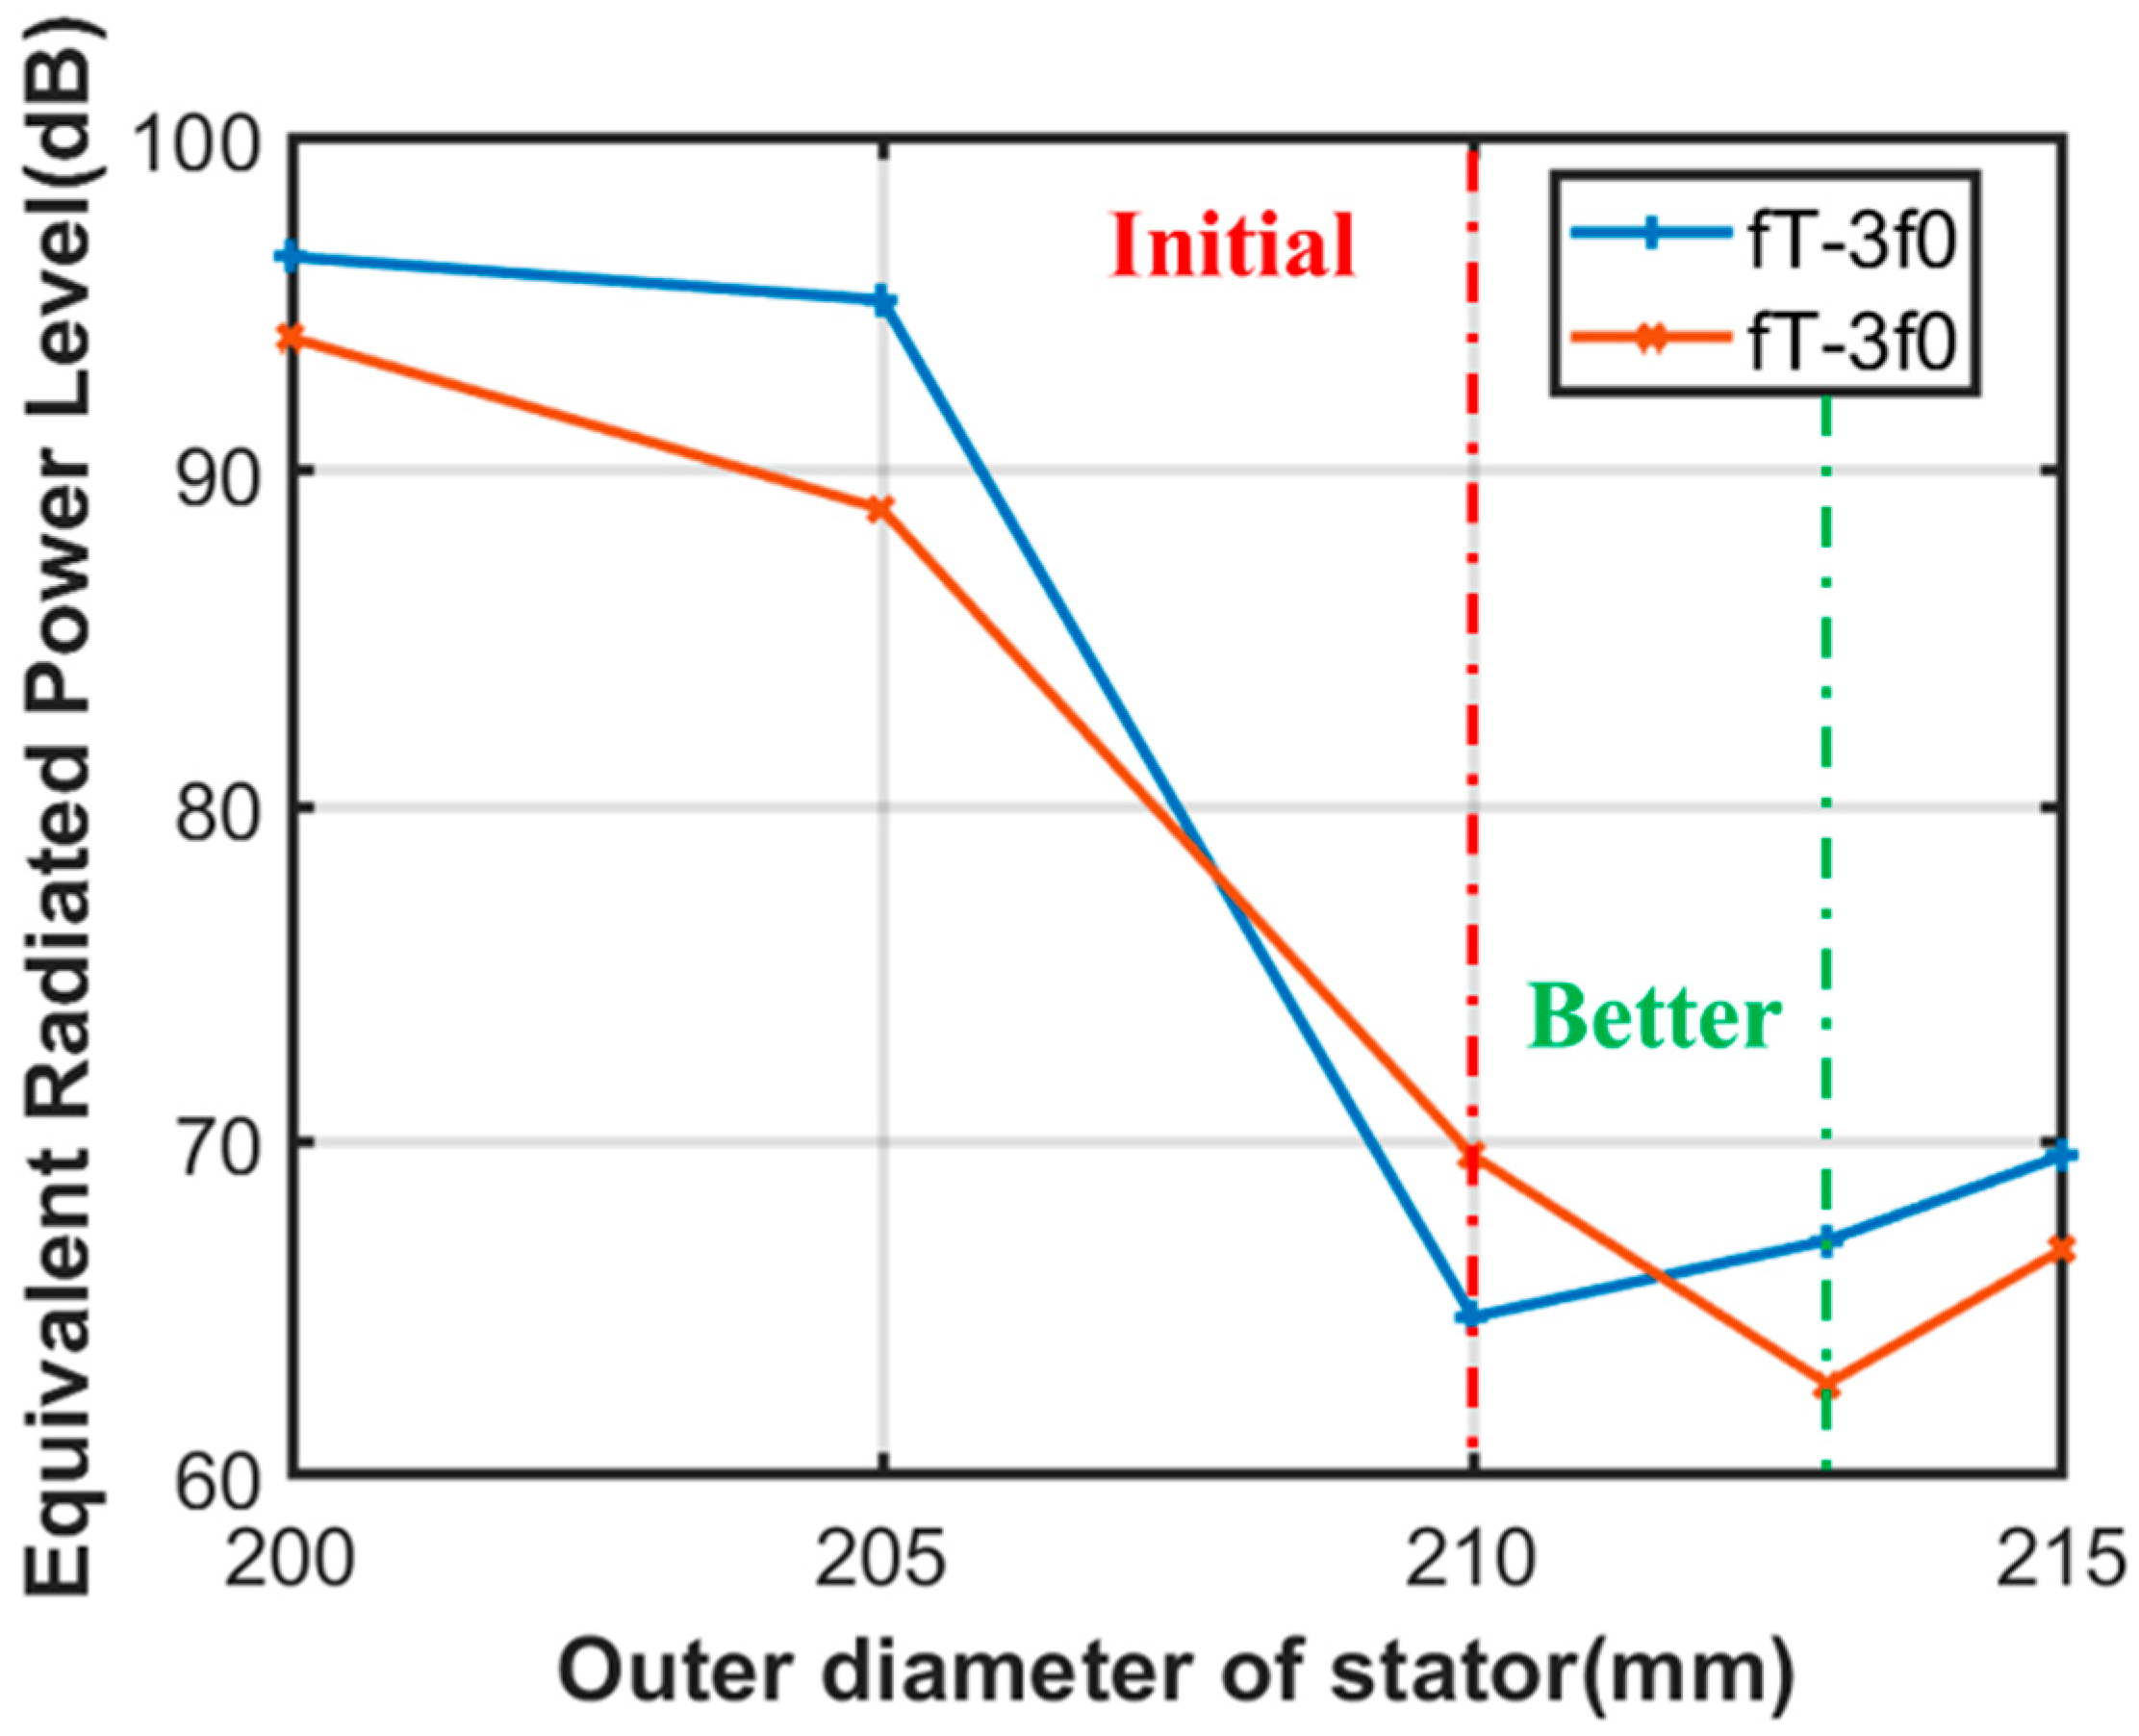
- According to the response spectrum of the motor vibration, the high-frequency sideband noise near the switching frequency can be improved by optimizing the switching frequency. Considering that the stator has a great influence on the modes of the whole motor, the high-frequency sideband noise near the switching frequency can also be improved by optimizing the stator outer diameter.
Author Contributions
Funding
Data Availability Statement
Conflicts of Interest
References
- Liao, C.; Jiang, W.; Zhang, Z. Analysis of Electromagnetic Vibration Characteristics of an Interior Permanent Magnet Synchronous Motor. In Proceedings of the 2019 22nd International Conference on Electrical Machines and Systems (ICEMS), Harbin, China, 11–14 August 2019; pp. 1–5. [Google Scholar] [CrossRef]
- Lu, Y.; Li, J.; Qu, R.; Ye, D.; Lu, H.; Sun, J.; Ge, M.; Xu, H. Electromagnetic Force and Vibration Analysis of Permanent-Magnet-Assisted Synchronous Reluctance Machines. IEEE Trans. Ind. Appl. 2018, 54, 4246–4256. [Google Scholar] [CrossRef]
- Zhang, Y.; Geng, H.; Zhou, J.; Yu, L. Analysis of Electromagnetic Force Waves of Solid Cylindrical Permanent Magnet Synchronous Motors. In Proceedings of the 2018 IEEE International Conference on Mechatronics and Automation (ICMA), Changchun, China, 5–8 August 2018; pp. 689–694. [Google Scholar] [CrossRef]
- Lugand, T.; Schwery, A. Comparison between the Salient-Pole Synchronous Machine and the Doubly Fed Induction Machine with Regard to Electromagnetic Parasitic Forces and Stator Vibrations. IEEE Trans. Ind. Appl. 2017, 53, 5284–5294. [Google Scholar] [CrossRef]
- Chai, F.; Li, Y.; Pei, Y.; Yu, Y. Analysis of Radial Vibration Caused by Magnetic Force and Torque Pulsation in Interior Permanent Magnet Synchronous Motors Considering Air-Gap Deformations. IEEE Trans. Ind. Electron. 2019, 66, 6703–6714. [Google Scholar] [CrossRef]
- Ting, D.; Ruiqing, W.; Jicheng, Z.; Kun, L. Influence of auxiliary slot on electromagnetic vibration in PMSM with similar slot and pole number. In Proceedings of the 2017 20th International Conference on Electrical Machines and Systems (ICEMS), Sydney, Australia, 11–14 August 2017; pp. 1–5. [Google Scholar] [CrossRef]
- Zhu, Z.Q.; Xia, Z.P.; Wu, L.J.; Jewell, G.W. Analytical Modeling and Finite-Element Computation of Radial Vibration Force in Fractional-Slot Permanent-Magnet Brushless Machines. IEEE Trans. Ind. Appl. 2010, 46, 1908–1918. [Google Scholar] [CrossRef]
- Min, S.G.; Sarlioglu, B. Modeling and Investigation on Electromagnetic Noise in PM Motors with Single- and Double-Layer Concentrated Winding for EV and HEV Application. IEEE Trans. Transp. Electrif. 2018, 4, 292–302. [Google Scholar] [CrossRef]
- Chen, S.; Ding, S.; Shen, S.; Dai, Y.; Yang, Z.; Zhang, J. Influence of Field Weakening Control on Electromagnetic Force and Electromagnetic Vibration of SPMSMs. In Proceedings of the 2021 IEEE 12th Energy Conversion Congress & Exposition—Asia (ECCE-Asia), Singapore, 24–27 May 2021; pp. 221–225. [Google Scholar] [CrossRef]
- Han, Z.; Liu, J. Comparative Analysis of Vibration and Noise in IPMSM Considering the Effect of MTPA Control Algorithms for Electric Vehicles. IEEE Trans. Power Electron. 2021, 36, 6850–6862. [Google Scholar] [CrossRef]
- Deng, W.; Huang, J.; Qian, Z.; Qian, C.; Zhong, D. A Random Pulse Position-Based Selective Noise Cancellation Modulation Method for SVPWM Driven PMSMs. IEEE Trans. Energy Convers. 2022, 37, 2190–2198. [Google Scholar] [CrossRef]
- Deng, W.; Zuo, S. Analysis of the Sideband Electromagnetic Noise in Permanent Magnet Synchronous Motors Generated by Rotor Position Error. IEEE Trans. Ind. Electron. 2022, 69, 4460–4471. [Google Scholar] [CrossRef]
- Pindoriya, R.M.; Rajpurohit, B.S.; Kumar, R. A Novel Application of Harmonics Spread Spectrum Technique for Acoustic Noise and Vibration Reduction of PMSM Drive. IEEE Access 2020, 8, 103273–103284. [Google Scholar] [CrossRef]
- Pindoriya, R.M.; Gautam, G.; Rajpurohit, B.S. A Novel Application of Pseudorandom-Based Technique for Acoustic Noise and Vibration Reduction of PMSM Drive. IEEE Trans. Ind. Appl. 2020, 56, 5511–5522. [Google Scholar] [CrossRef]
- Pindoriya, R.M.; Yadav, A.K.; Rajpurohit, B.S.; Kumar, R. A Novel Application of Random Hysteresis Current Control Technique for Acoustic Noise and Vibration Reduction of PMSM Drive. In Proceedings of the 2020 IEEE Industry Applications Society Annual Meeting, Detroit, MI, USA, 10–16 October 2020; pp. 1–8. [Google Scholar] [CrossRef]
- Xu, J.; Zhang, H. Random Asymmetric Carrier PWM Method for PMSM Vibration Reduction. IEEE Access 2020, 8, 109411–109420. [Google Scholar] [CrossRef]
- Zhang, W.; Xu, Y.; Huang, H.; Zou, J. Vibration Reduction for Dual-Branch Three-Phase Permanent Magnet Synchronous Motor with Carrier Phase-Shift Technique. IEEE Trans. Power Electron. 2020, 35, 607–618. [Google Scholar] [CrossRef]
- Jiang, D.; Liu, K.; Liu, Z.; Wang, Q.; He, Z.; Qu, R. Four-Module Three-Phase PMSM Drive for Suppressing Vibration and Common-Mode Current. IEEE Trans. Ind. Appl. 2021, 57, 4874–4883. [Google Scholar] [CrossRef]
- Ji, Z.; Cheng, S.; Lv, Y.; Wang, D.; Sun, W.; Li, X. The Mechanism for Suppressing High-Frequency Vibration of Multiphase Surface Permanent Magnet Motors via PWM Carrier Phase Shifting. IEEE Trans. Power Electron. 2021, 36, 10504–10513. [Google Scholar] [CrossRef]
- Mu, Y. Study on Influence of Harmonic Suppression and Spread Spectrum Modulation on Vibration and Noise of PMSM. Master’s Thesis, Harbin Institute of Technology, Harbin, China, 2021. [Google Scholar]
- Wang, S.; Hong, J.; Sun, Y.; Cao, H. Exciting Force and Vibration Analysis of Stator Permanent Magnet Synchronous Motors. IEEE Trans. Magn. 2018, 54, 8108205. [Google Scholar] [CrossRef]
- Timar, P.; Fazekas, A.; Kiss, J.; Miklos, A.; Yang, S. Noise and Vibration of Electrical Machines; Elsevier: New York, NY, USA, 1989. [Google Scholar]


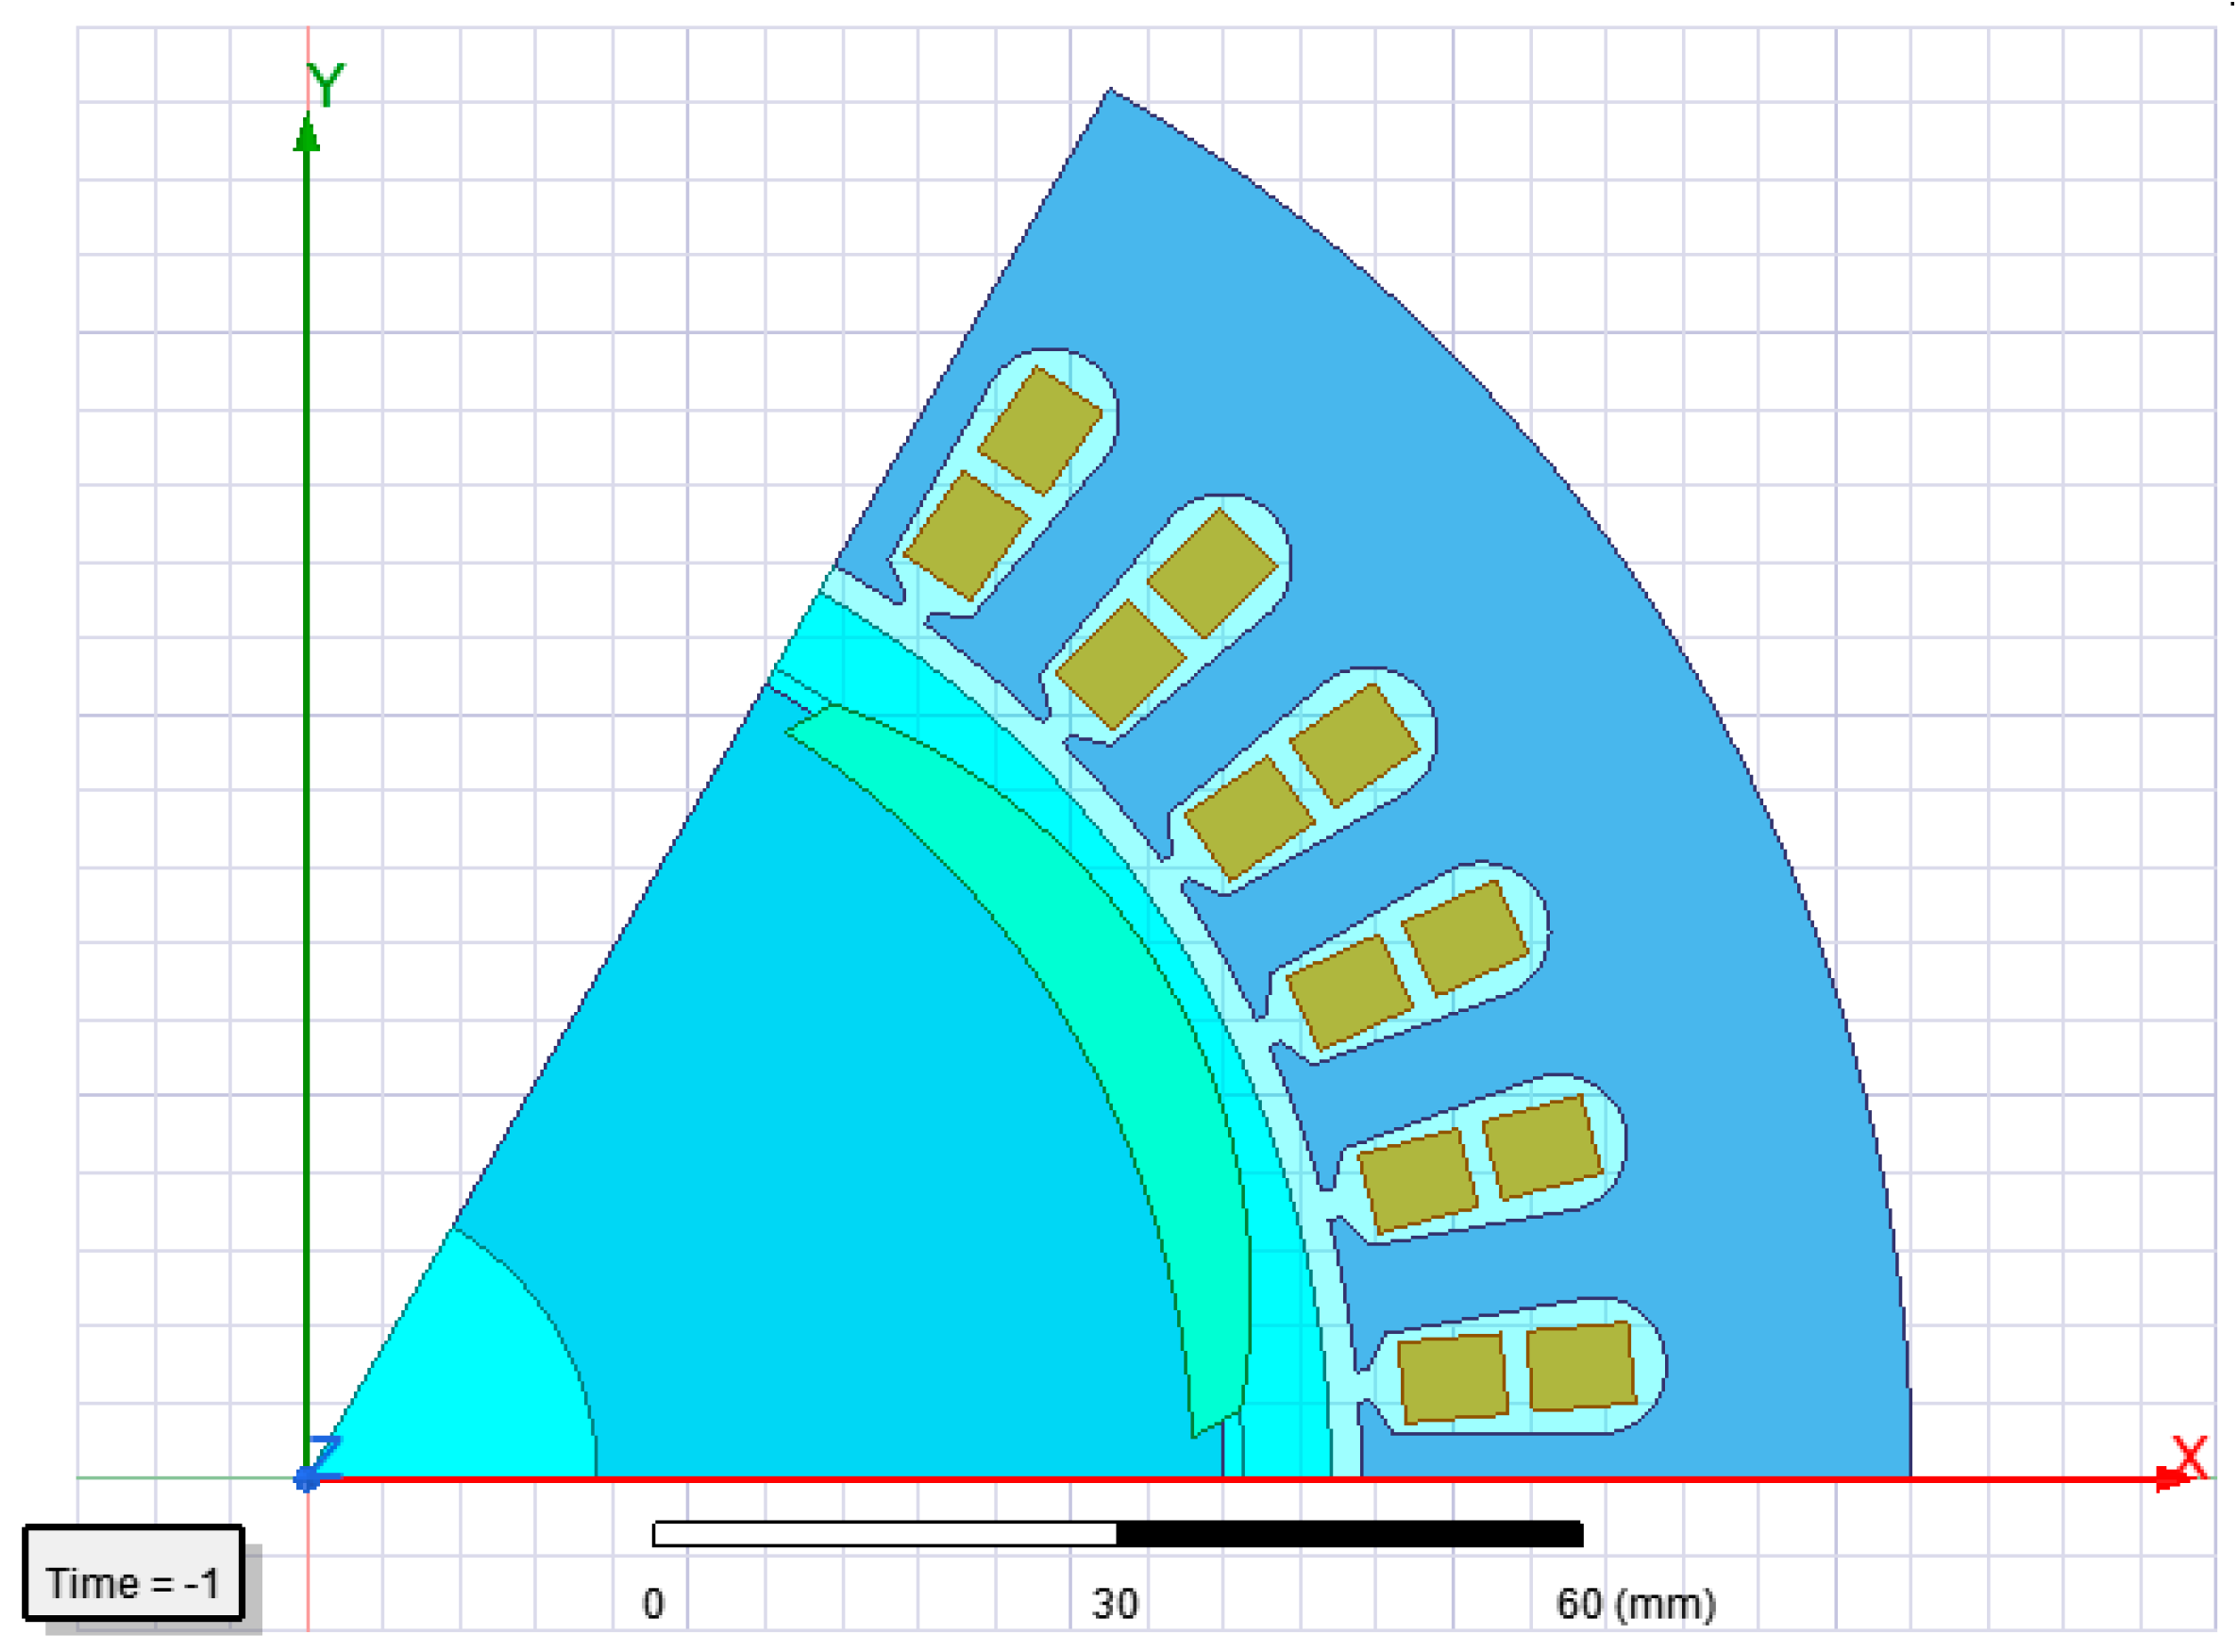
| Rated power | P = 25 kW | The number of stator slots | Z = 36 |
| Rated frequency | F = 78 Hz | Stator inner diameter | Di1 = 138 mm |
| Rated speed | n = 1560 r/min | Stator outer diameter | D1 = 210 mm |
| Pole pairs | P = 3 | ||
| Composition | Theoretic Frequency (Hz) | Measured Frequency (Hz) | Error (%) |
|---|---|---|---|
| 4758 | 4660 | −2.05969 | |
| 5226 | 5110 | −2.21967 | |
| 9516 | 9310 | −2.16478 | |
| 9828 | 9620 | −2.1164 | |
| 9984 | 9770 | −2.14343 | |
| 10,140 | 9920 | −2.16963 | |
| 10,452 | 10,200 | −2.41102 |
| Composition | Theoretic Frequency (Hz) | Measured Frequency (Hz) | Error (%) |
|---|---|---|---|
| 4758 | 4750.68 | −0.15385 | |
| 5226 | 5216.8 | −0.17604 | |
| 9516 | 9500.64 | −0.16141 | |
| 9672 | 9656.45 | −0.16077 | |
| 9828 | 9812.01 | −0.1627 | |
| 9984 | 9967.48 | −0.16546 | |
| 10,140 | 10,122.9 | −0.16864 | |
| 10,297 | 10,278.2 | −0.18258 | |
| 10,452 | 10,436.5 | −0.1483 |
| Order | Natural Frequency | Mode Shape of Motor | Mode Shape of Stator |
|---|---|---|---|
| Model (0,3) | 3762 Hz | 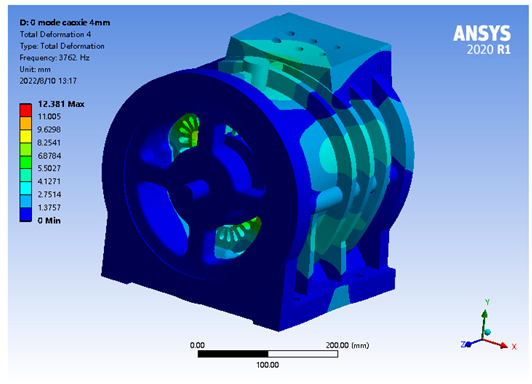 | 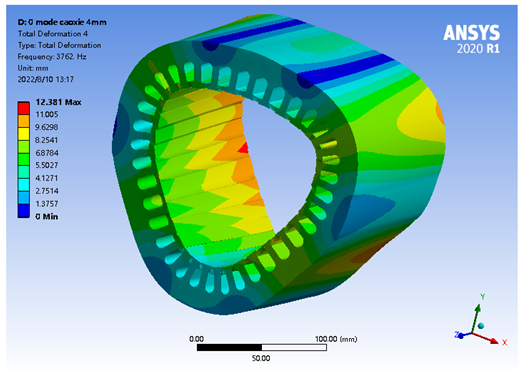 |
| Model (1,3) | 4700 Hz |  | 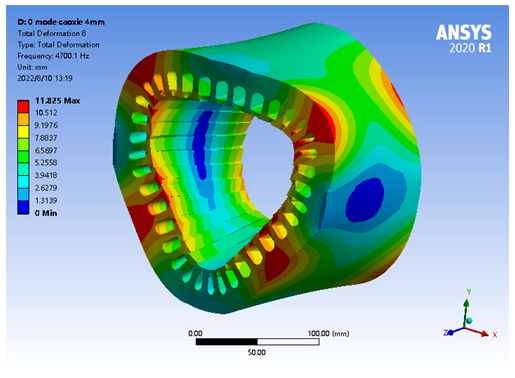 |
| Model (0,4) | 5616 Hz |  | 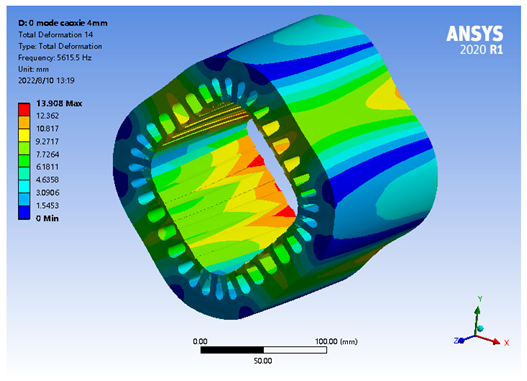 |
Publisher’s Note: MDPI stays neutral with regard to jurisdictional claims in published maps and institutional affiliations. |
© 2022 by the authors. Licensee MDPI, Basel, Switzerland. This article is an open access article distributed under the terms and conditions of the Creative Commons Attribution (CC BY) license (https://creativecommons.org/licenses/by/4.0/).
Share and Cite
Shou, J.; Ma, J.; Zhang, Z.; Qiu, L.; Xu, B.; Luo, C.; Li, B.; Fang, Y. Vibration and Noise Optimization of Variable-Frequency-Driven SPMSM Used in Compressor Based on Electromagnetic Analysis and Modal Characteristics. Energies 2022, 15, 7474. https://doi.org/10.3390/en15207474
Shou J, Ma J, Zhang Z, Qiu L, Xu B, Luo C, Li B, Fang Y. Vibration and Noise Optimization of Variable-Frequency-Driven SPMSM Used in Compressor Based on Electromagnetic Analysis and Modal Characteristics. Energies. 2022; 15(20):7474. https://doi.org/10.3390/en15207474
Chicago/Turabian StyleShou, Jiabo, Jien Ma, Zhiping Zhang, Lin Qiu, Bowen Xu, Chao Luo, Binqi Li, and Youtong Fang. 2022. "Vibration and Noise Optimization of Variable-Frequency-Driven SPMSM Used in Compressor Based on Electromagnetic Analysis and Modal Characteristics" Energies 15, no. 20: 7474. https://doi.org/10.3390/en15207474
APA StyleShou, J., Ma, J., Zhang, Z., Qiu, L., Xu, B., Luo, C., Li, B., & Fang, Y. (2022). Vibration and Noise Optimization of Variable-Frequency-Driven SPMSM Used in Compressor Based on Electromagnetic Analysis and Modal Characteristics. Energies, 15(20), 7474. https://doi.org/10.3390/en15207474