
Effects of Future Climate Change and Adaptation Measures on Summer Comfort of Modern Homes across the Regions of the UK


Abstract
:1. Introduction
1.1. Reasons for Overheating
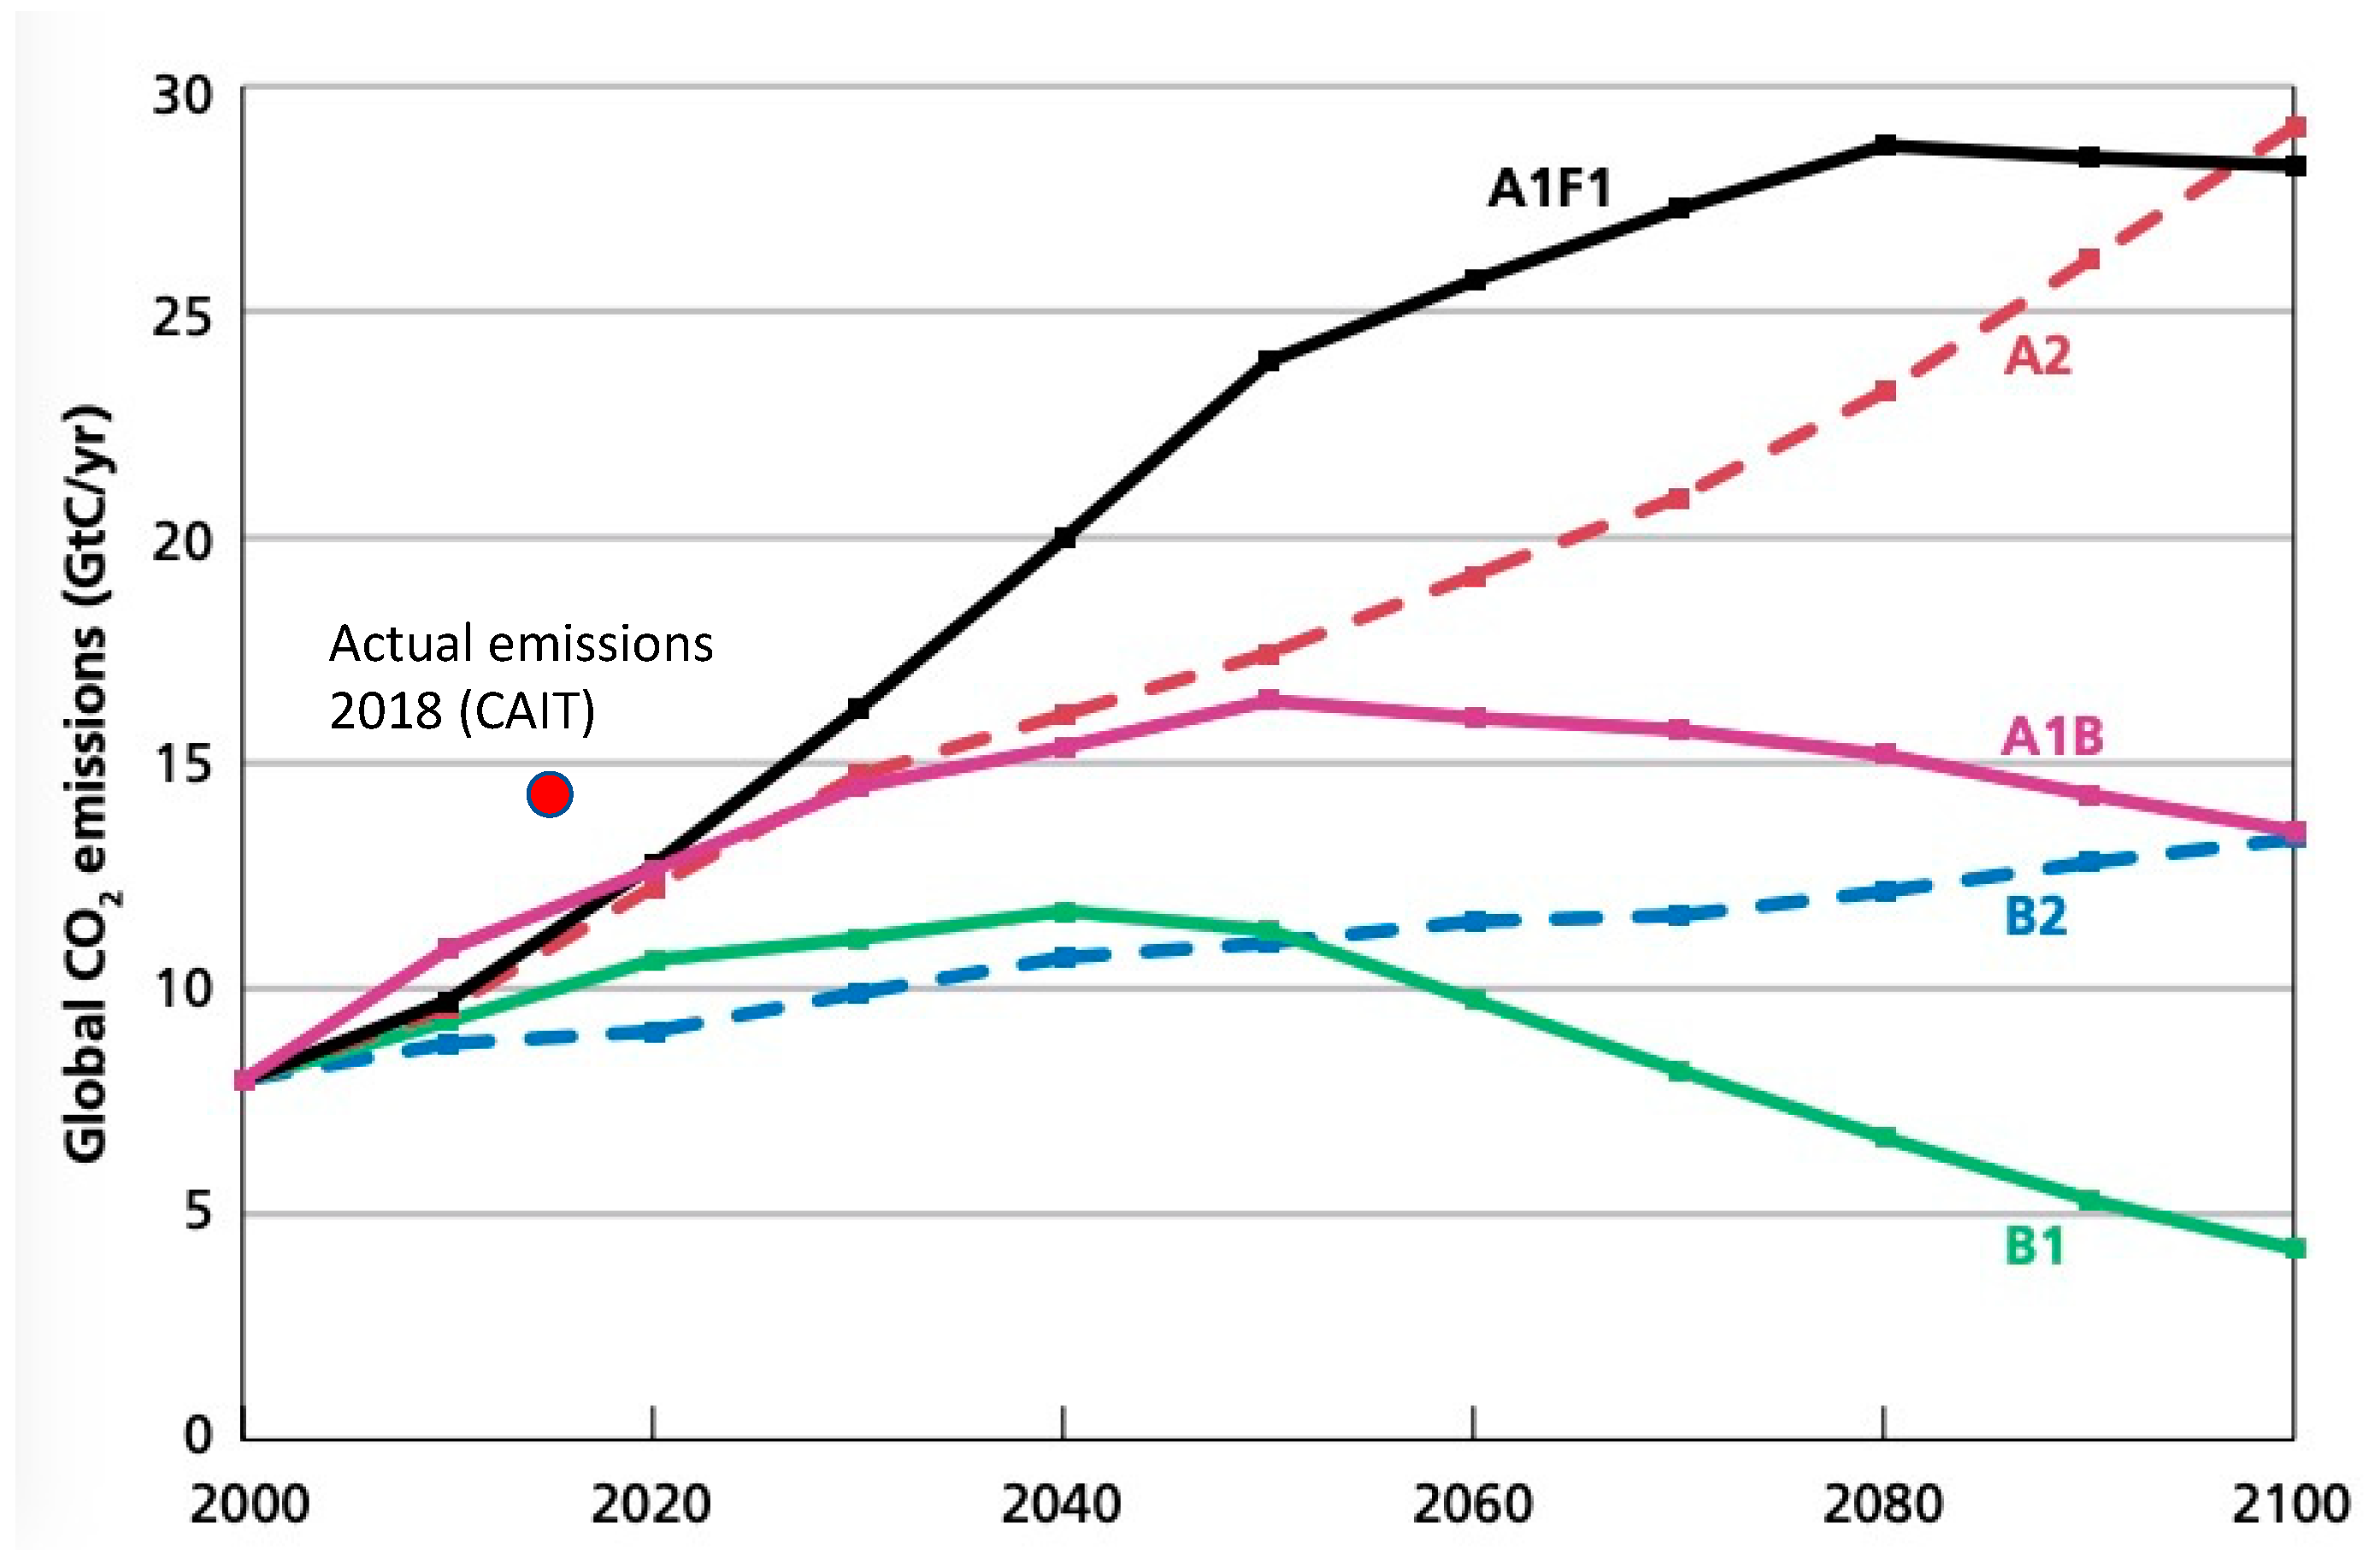
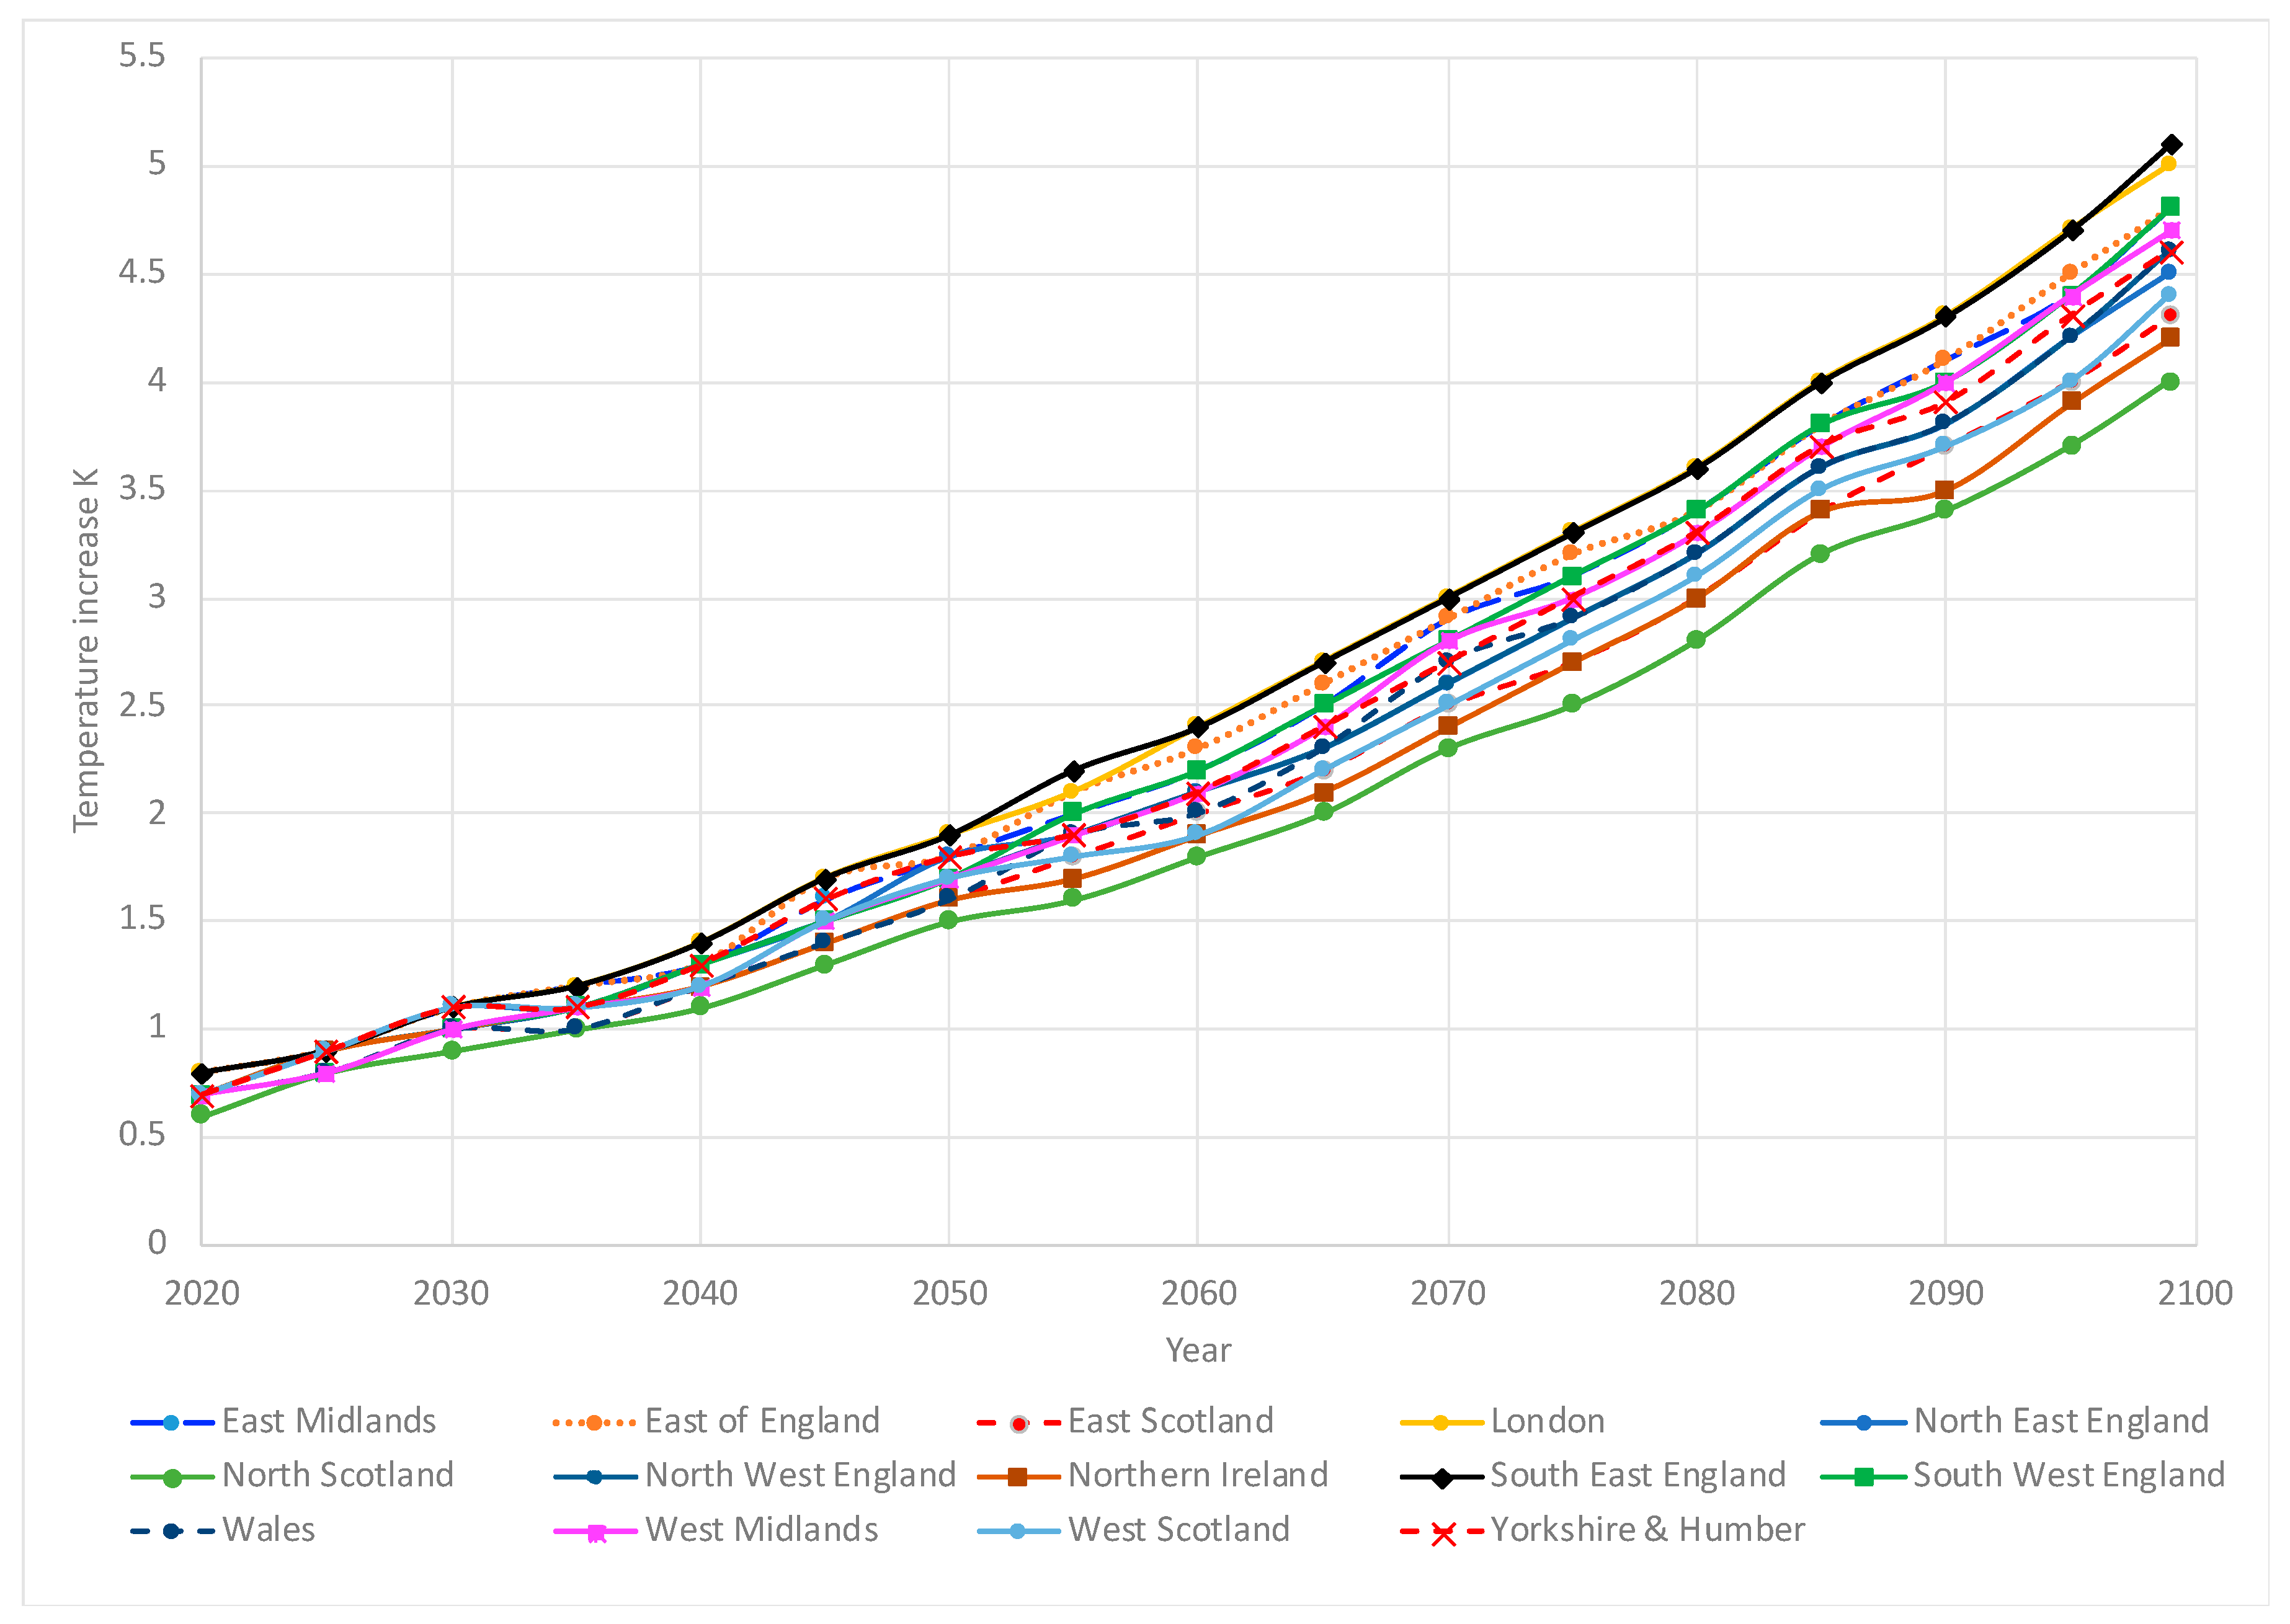
1.2. Future Climate Data for Simulation
1.3. Previous Studies of Future Climate Impacts

| Study | Built Form | Climate Scenarios | Temporal | Spatial |
|---|---|---|---|---|
| A—Climate change and the indoor environment: impacts and adaptation (CIBSE TM 36); 2005 [38] | 19th C semi-detached house; new-build house with 3 levels of thermal mass; 1960s flat; new-build flat. | UKCIP02: A2, A1F1, B2, B1; morphed design summer years (DSY) | 2020s 2050s 2080s | London Manchester Edinburgh |
| B—Changes in internal temperatures within the built environment as a response to a changing climate; 2010 [22] | Many combinations of future weather, ventilation, thermal mass, glazing, U-values, for house, school, apartment, office. | UKCIP02: low, medium–low, medium–high, and high emissions; morphed design summer years (DSY) | 2080s | London |
| C—Building characteristics as determinants of propensity to high indoor summer temperatures in London dwellings; 2012 [19] | 15 London dwelling archetypes, with 27 variants, different orientations, etc., 3456 combinations in total. | UKCP09, PROMETHEUS weather generator: 50th percentile of external temperature, 2050s, medium-emission scenario. | 2050s | London |
| D—Assessing energy use and overheating risk in net zero energy dwellings in UK; 2010 [14] | Detached and semi-detached dwellings; variants from typical stock 2010, to near zero carbon with renewable energy. | UKCP09, PROMETHEUS weather generator: high emissions, 50% probability (median) | 2030s 2050s 2080s | York |
| E—Preventing the overheating of English suburban homes in a warming climate, 2013 [39] | Detached, semi-detached, mid-terrace, flat typical of local stock in each area | UKCP09, PROMETHEUS weather generator: medium emissions 50% probability (median) and high emissions 90% probability [not exceeded]. | 2030s 2050s | Bristol, Oxford, Stockport. |
| F—Using UK climate change projections to adapt existing English homes for a warming climate, 2012 [40] | Detached, semi-detached, mid-terraced, and purpose-built flat, typical 1919–1980 England stock. | UKCP09, PROMETHEUS weather generator: high emissions, 90% probability. | 2030s 2050s 2080s | Oxford |
| G—Optimization of dwelling design under current and future climates using parametric simulations in EnergyPlus [41] | Detached, semi-detached, end- and mid-terraced, modern homes optimised for CO2 and overheating. | UKCP09, PROMETHEUS weather generator: medium (A1B) and high (A1F1) 50% probability (median). | 2050s | London (Heathrow) |
| H—Effect of window opening on summer comfort in UK dwellings in future climates [24] | Semi-detached. | UKCP09, PROMETHEUS weather generator: no more details. | 2030s 2050s 2080s | London Manchester Edinburgh Birmingham Belfast |
2. Methods
2.1. Climate Data
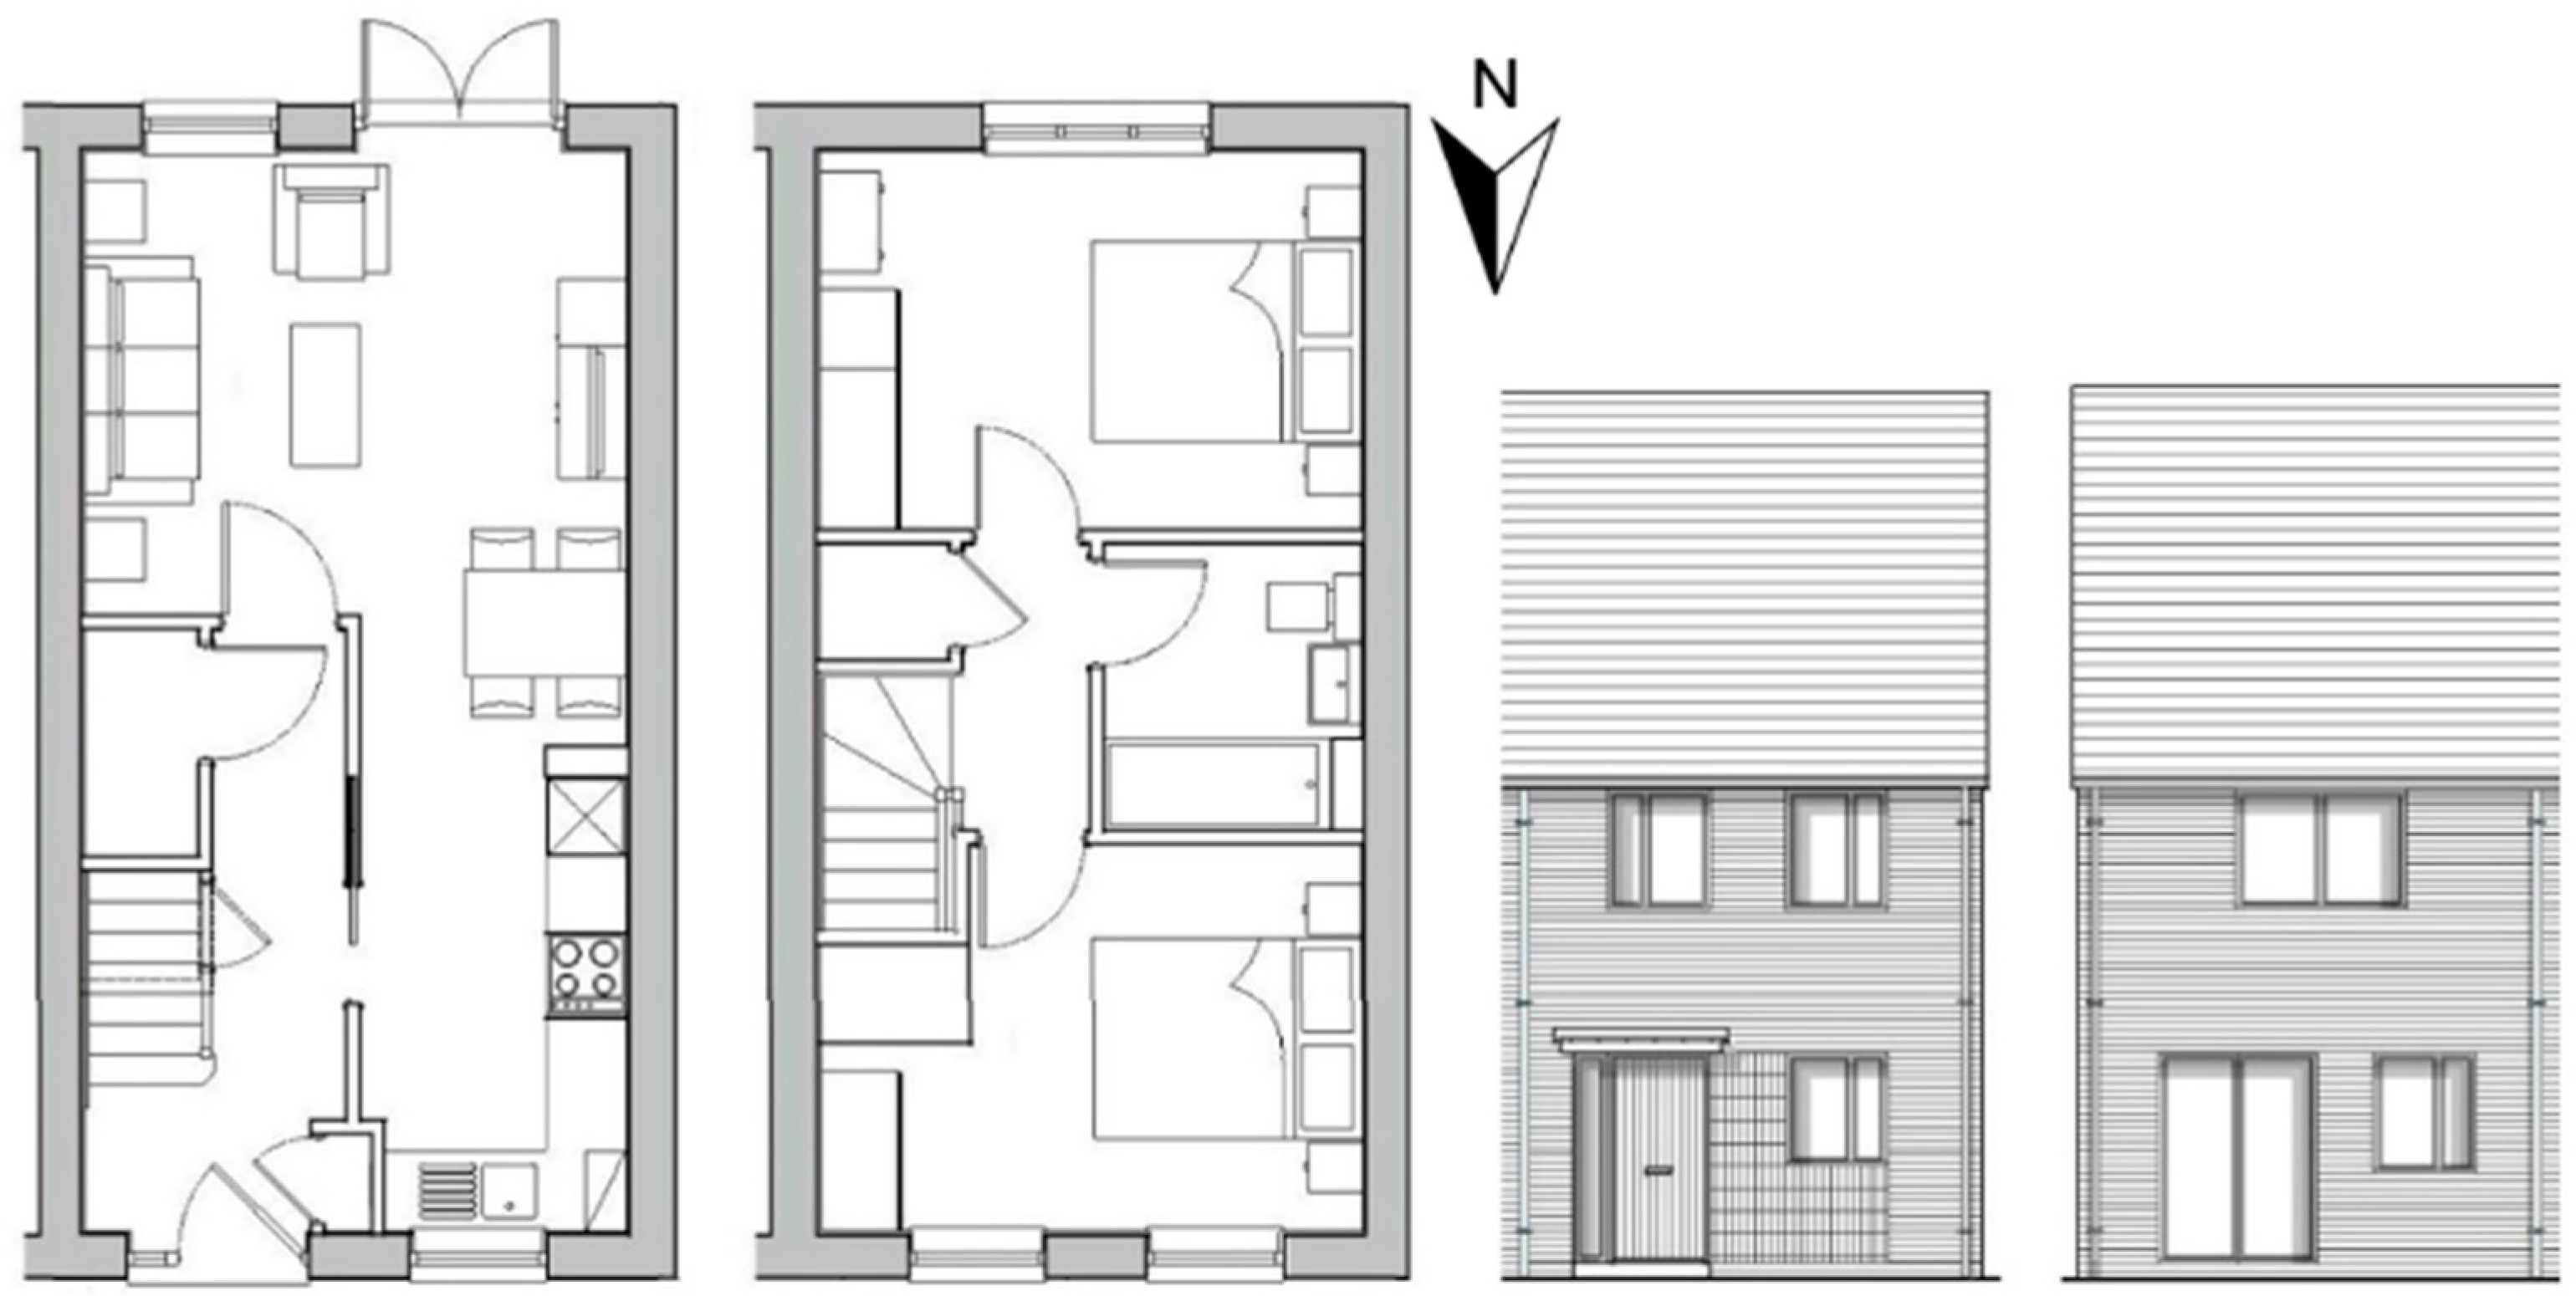
2.2. Building Models
2.3. Constructions
2.4. Internal Heat Gains
- People: 115 W per person (70 W sensible and 45 latent), from Table 6.3, CIBSE Guide A 2015, 24 h/day.
- Lighting: 10 W m−2 sensible heat gain, from Table 6.2, CIBSE Guide A 2015.
- General equipment and cooking: 5 W m−2 sensible heat gain for internal equipment (incl. cooking appliances) from Table 6.2, CIBSE Guide A 2015.
- Computer: 55 W sensible heat gain for personal computer and 70 W for PC monitor, from Tables 6.7 and 6.8, CIBSE Guide A 2015.
2.5. Infiltration and Ventilation
2.6. Solar Shading
2.7. Thermal Comfort Analysis
- (a)
- For living rooms, kitchens, and bedrooms: the number of hours during which ΔT is greater than or equal to one degree (K) during the period May to September inclusive shall not be more than 3% of occupied hours. (CIBSE TM52 Criterion 1: Hours of exceedance).
- (b)
- For bedrooms only: to guarantee comfort during the sleeping hours the operative temperature in the bedroom from 10 pm to 7 am shall not exceed 26 °C for more than 1% of annual hours. (Note: annual hours between 22:00 and 07:00 for bedrooms is 3285 h, so 1% is 32.85 h; hence, 33 or more hours above 26 °C will be recorded as a fail).
- Number of hours that either bedroom exceeds 26 °C (if both, still counts as 1 h);
- Hours over 28 °C for the single living room, or either bedroom;
- Highest temperature recorded in either bedroom and living room.
2.8. Simulation Permutations
3. Results
3.1. Base Case Fabric
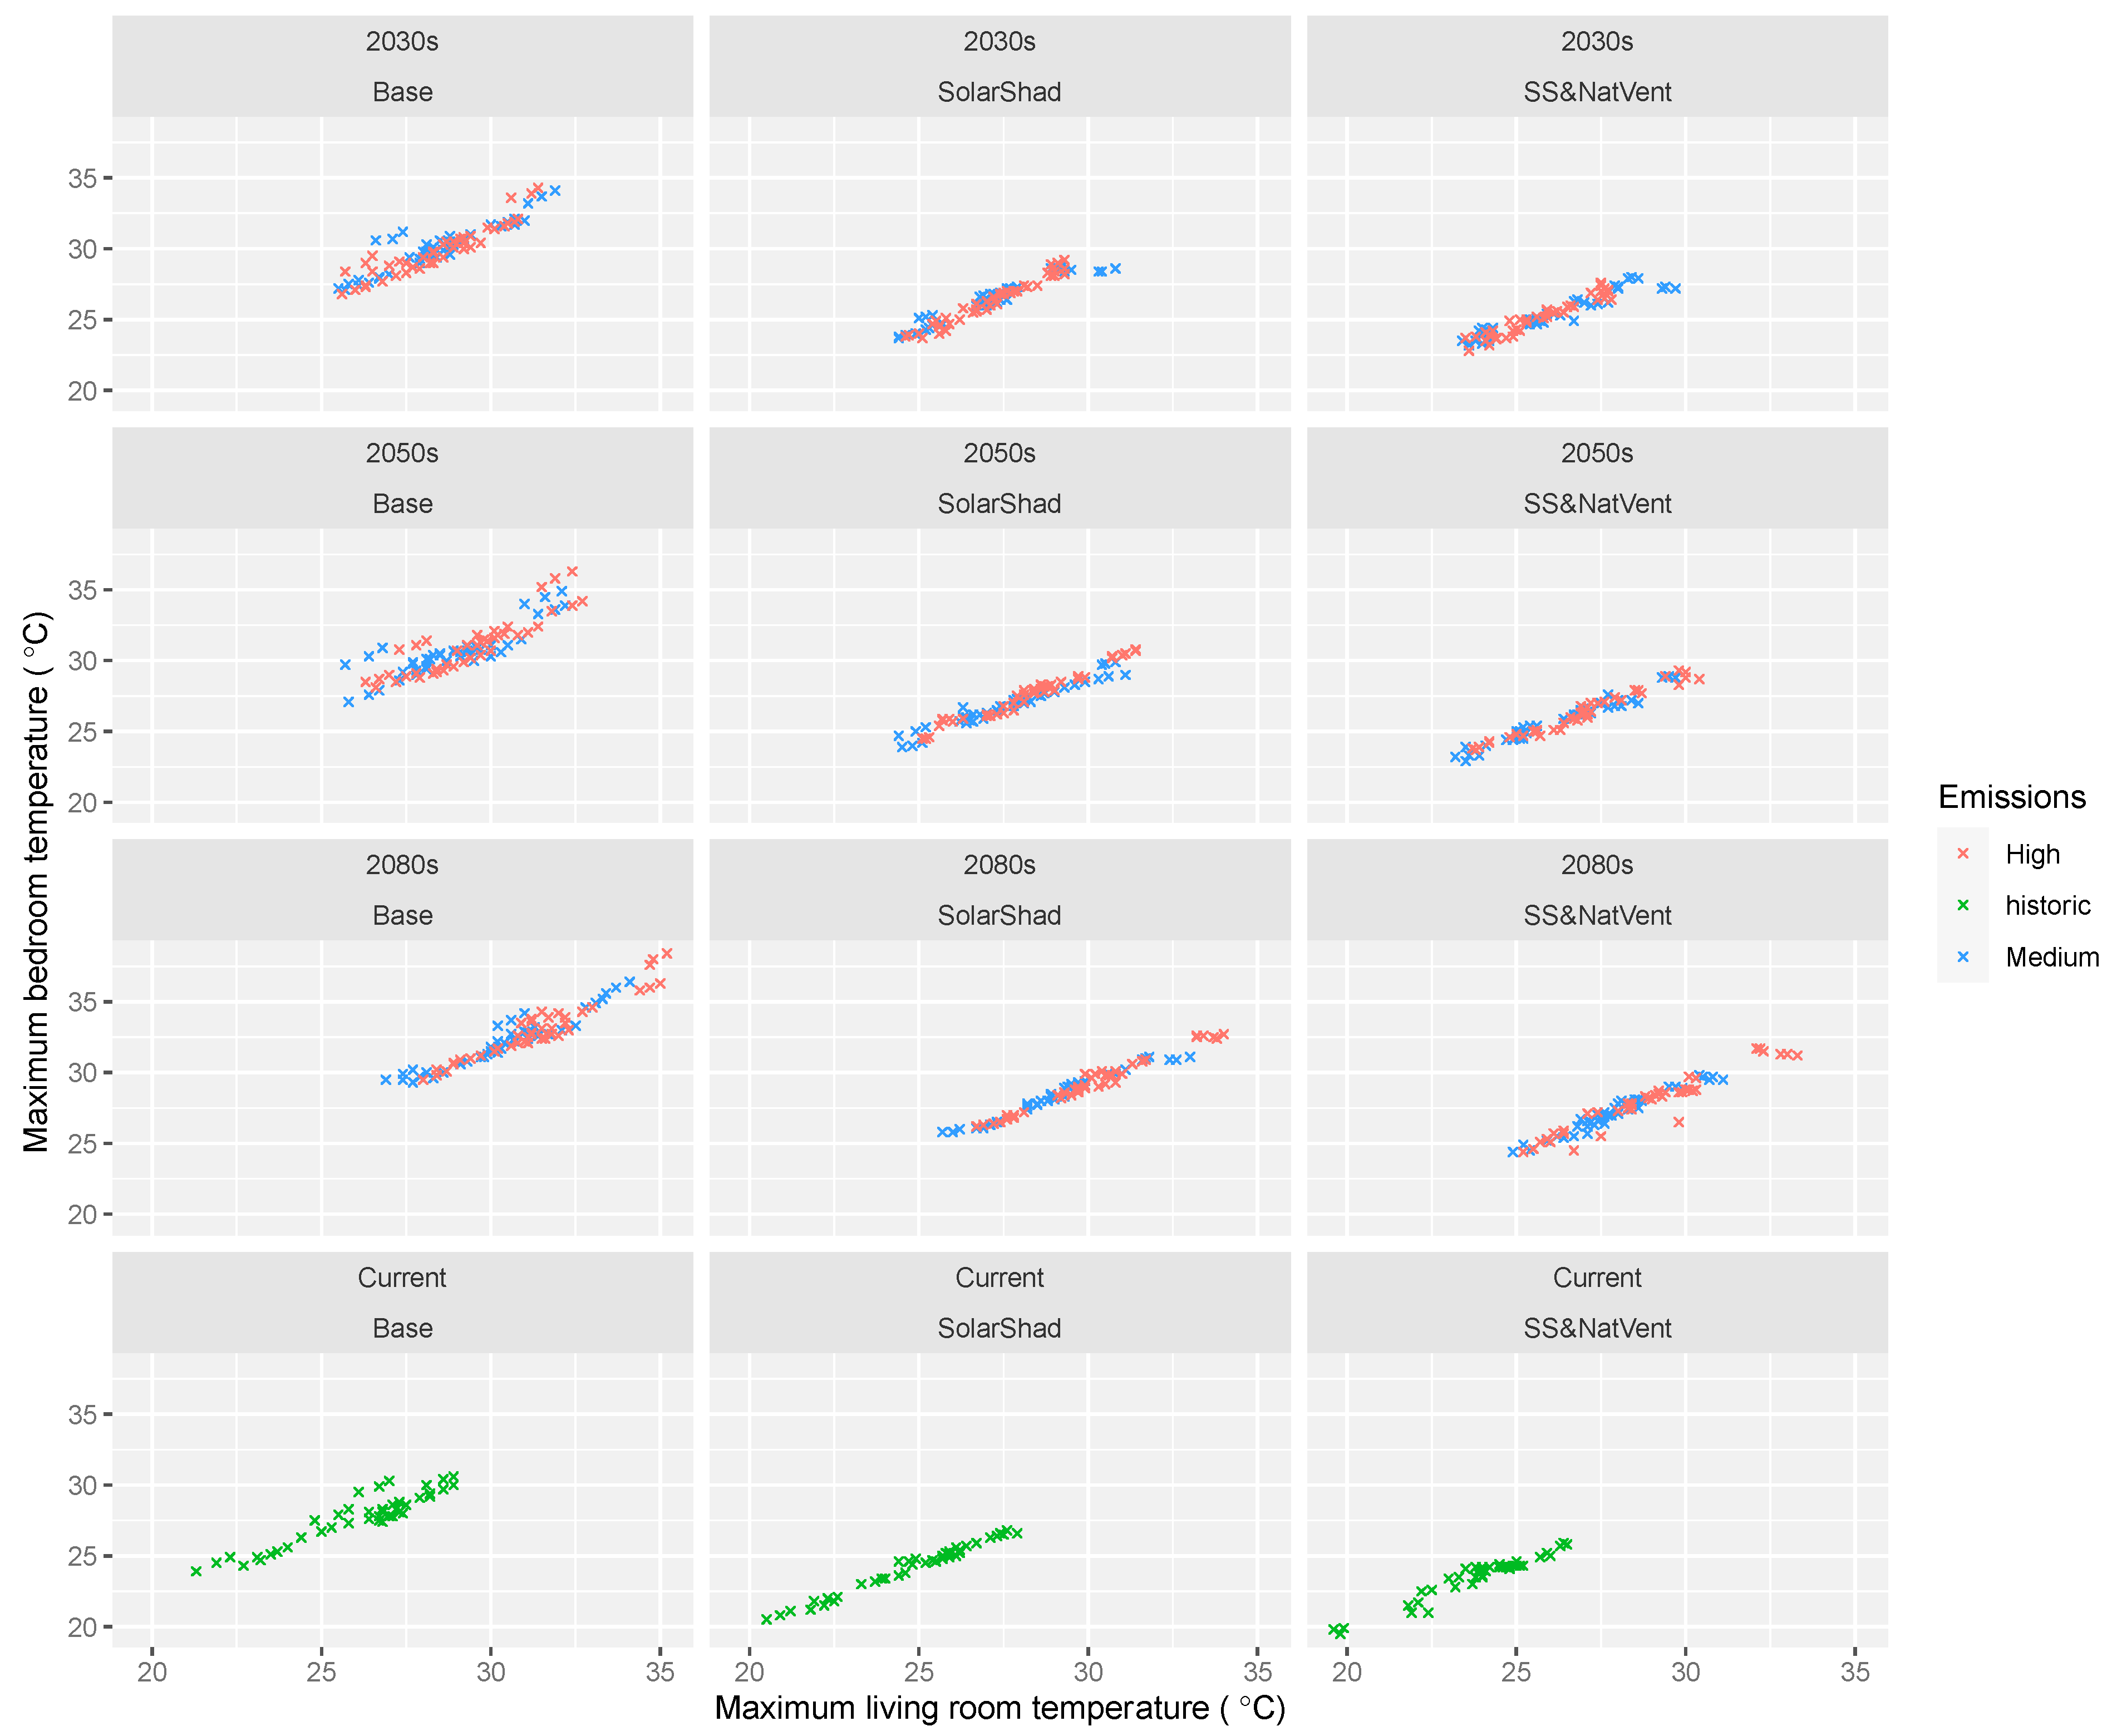
3.2. Results with Solar Shading and Ventilation
- As would be expected, the temperatures are strongly correlated in a linear way.
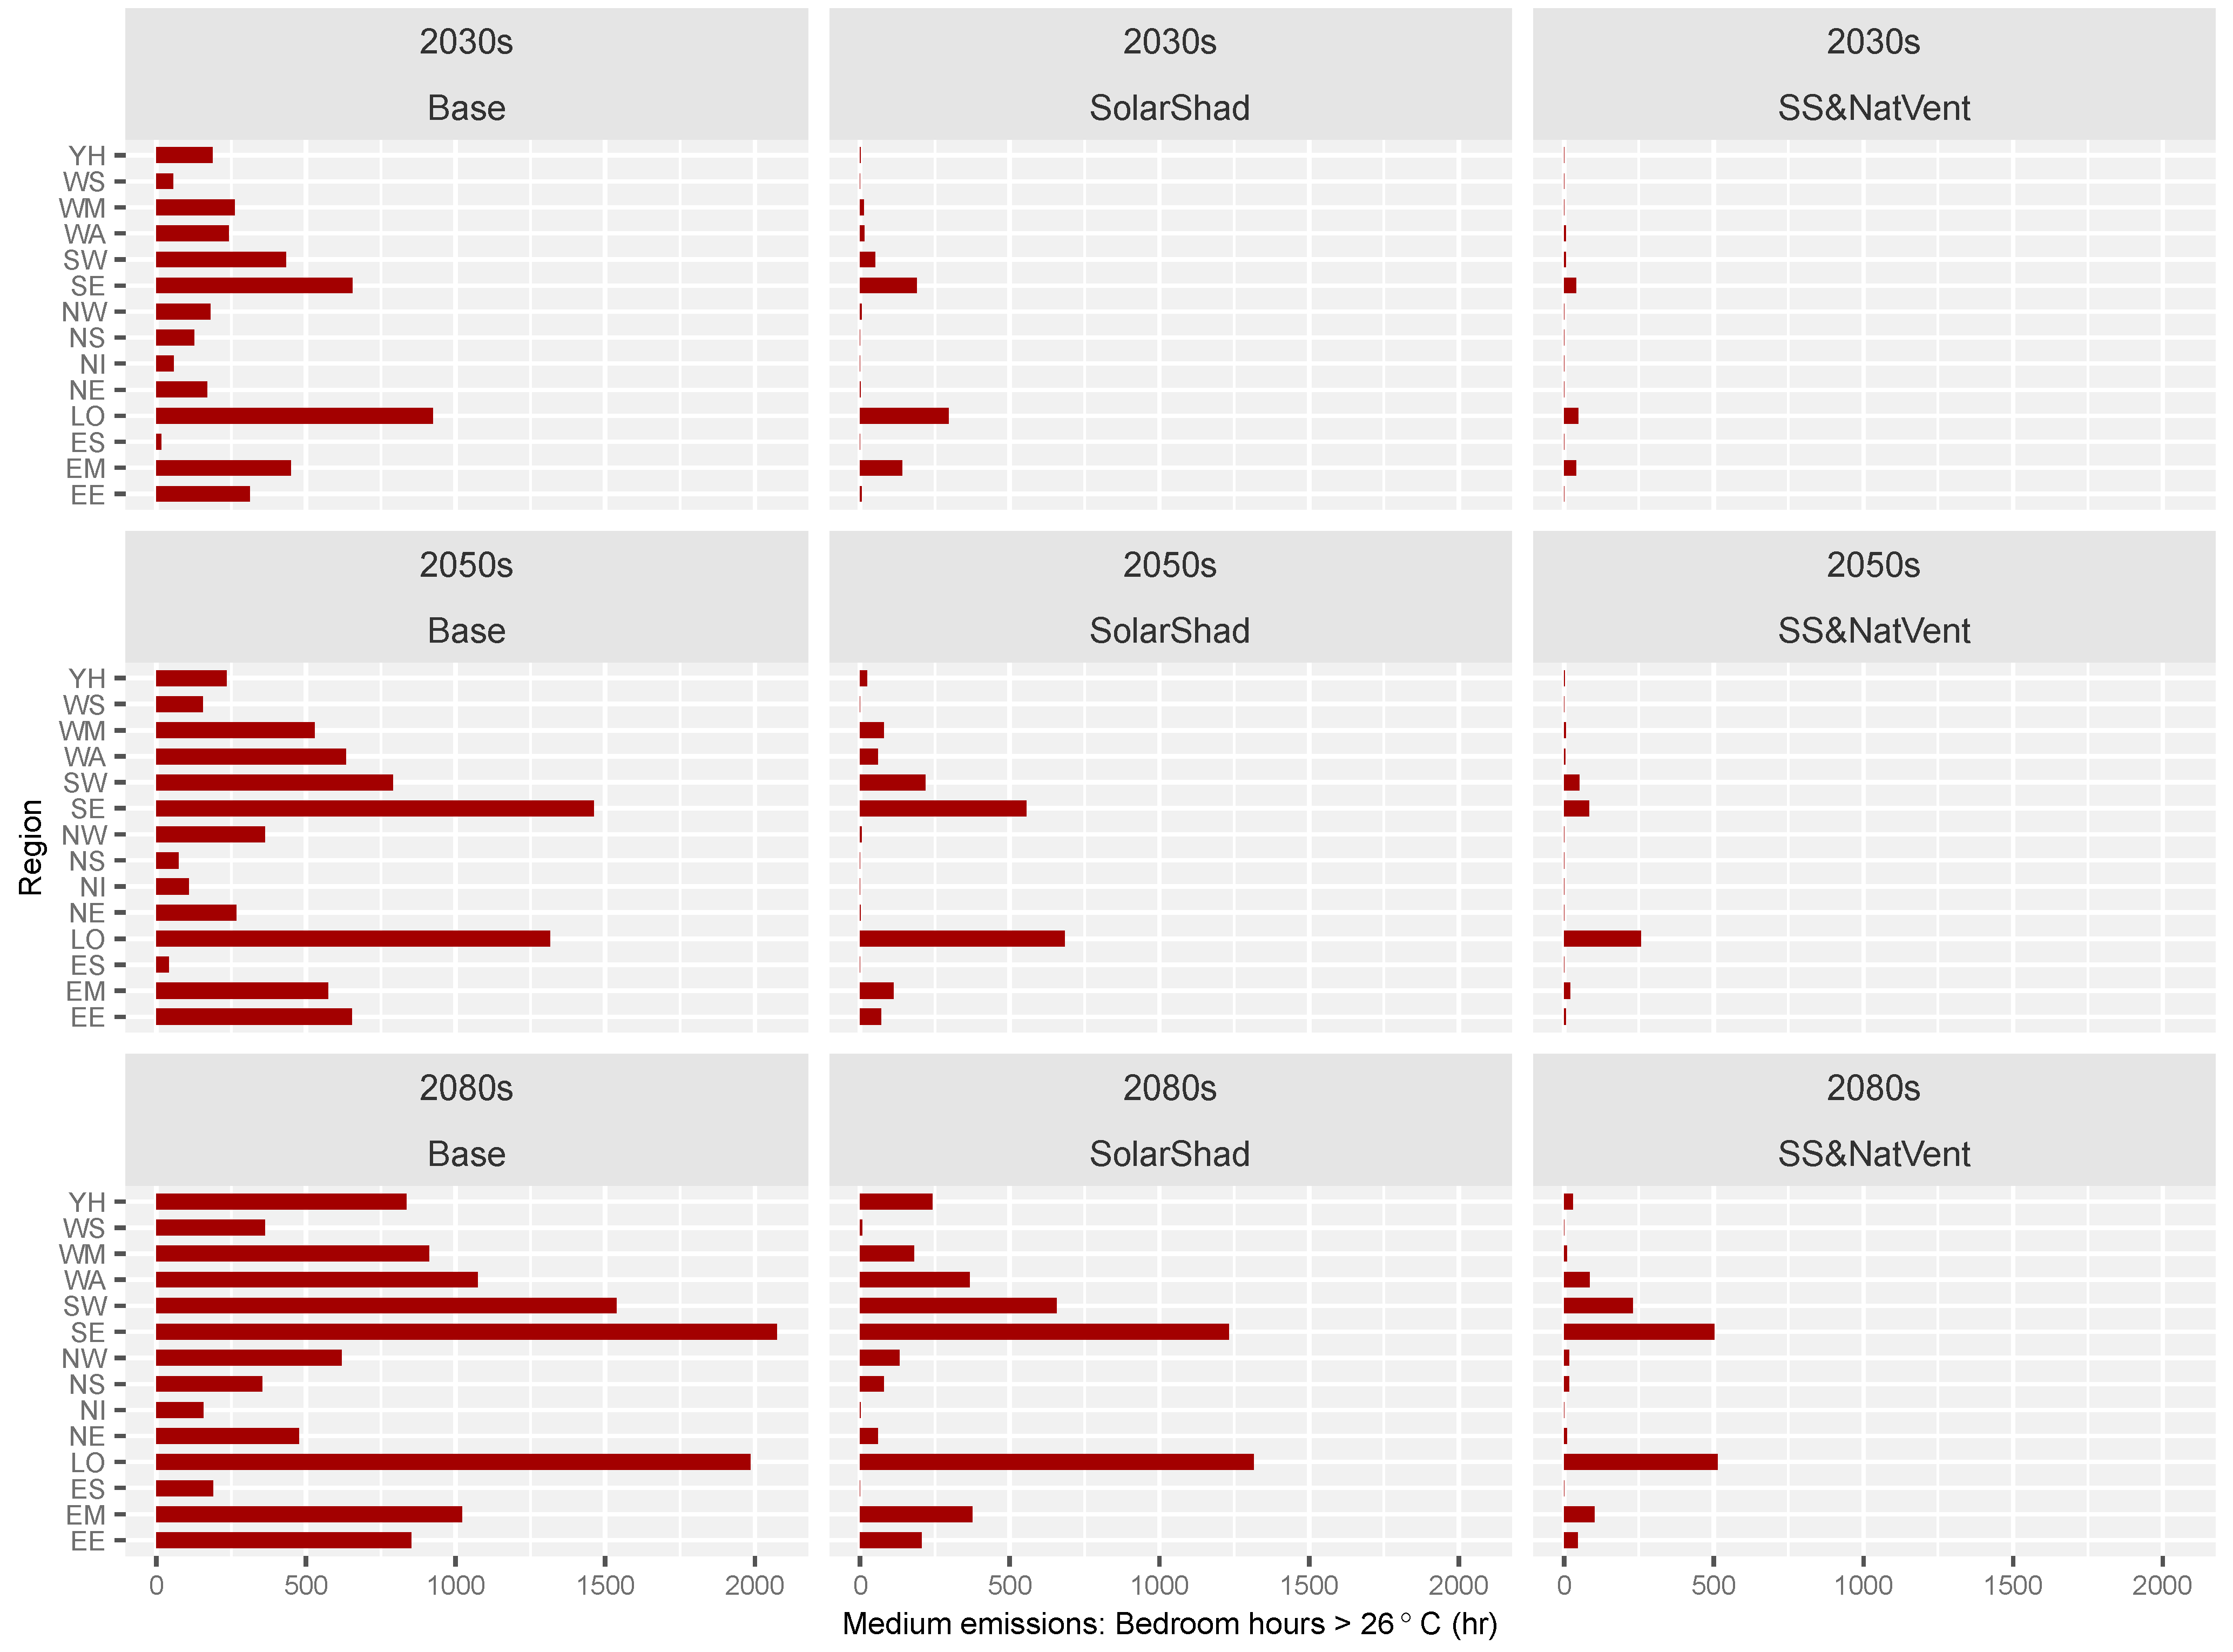
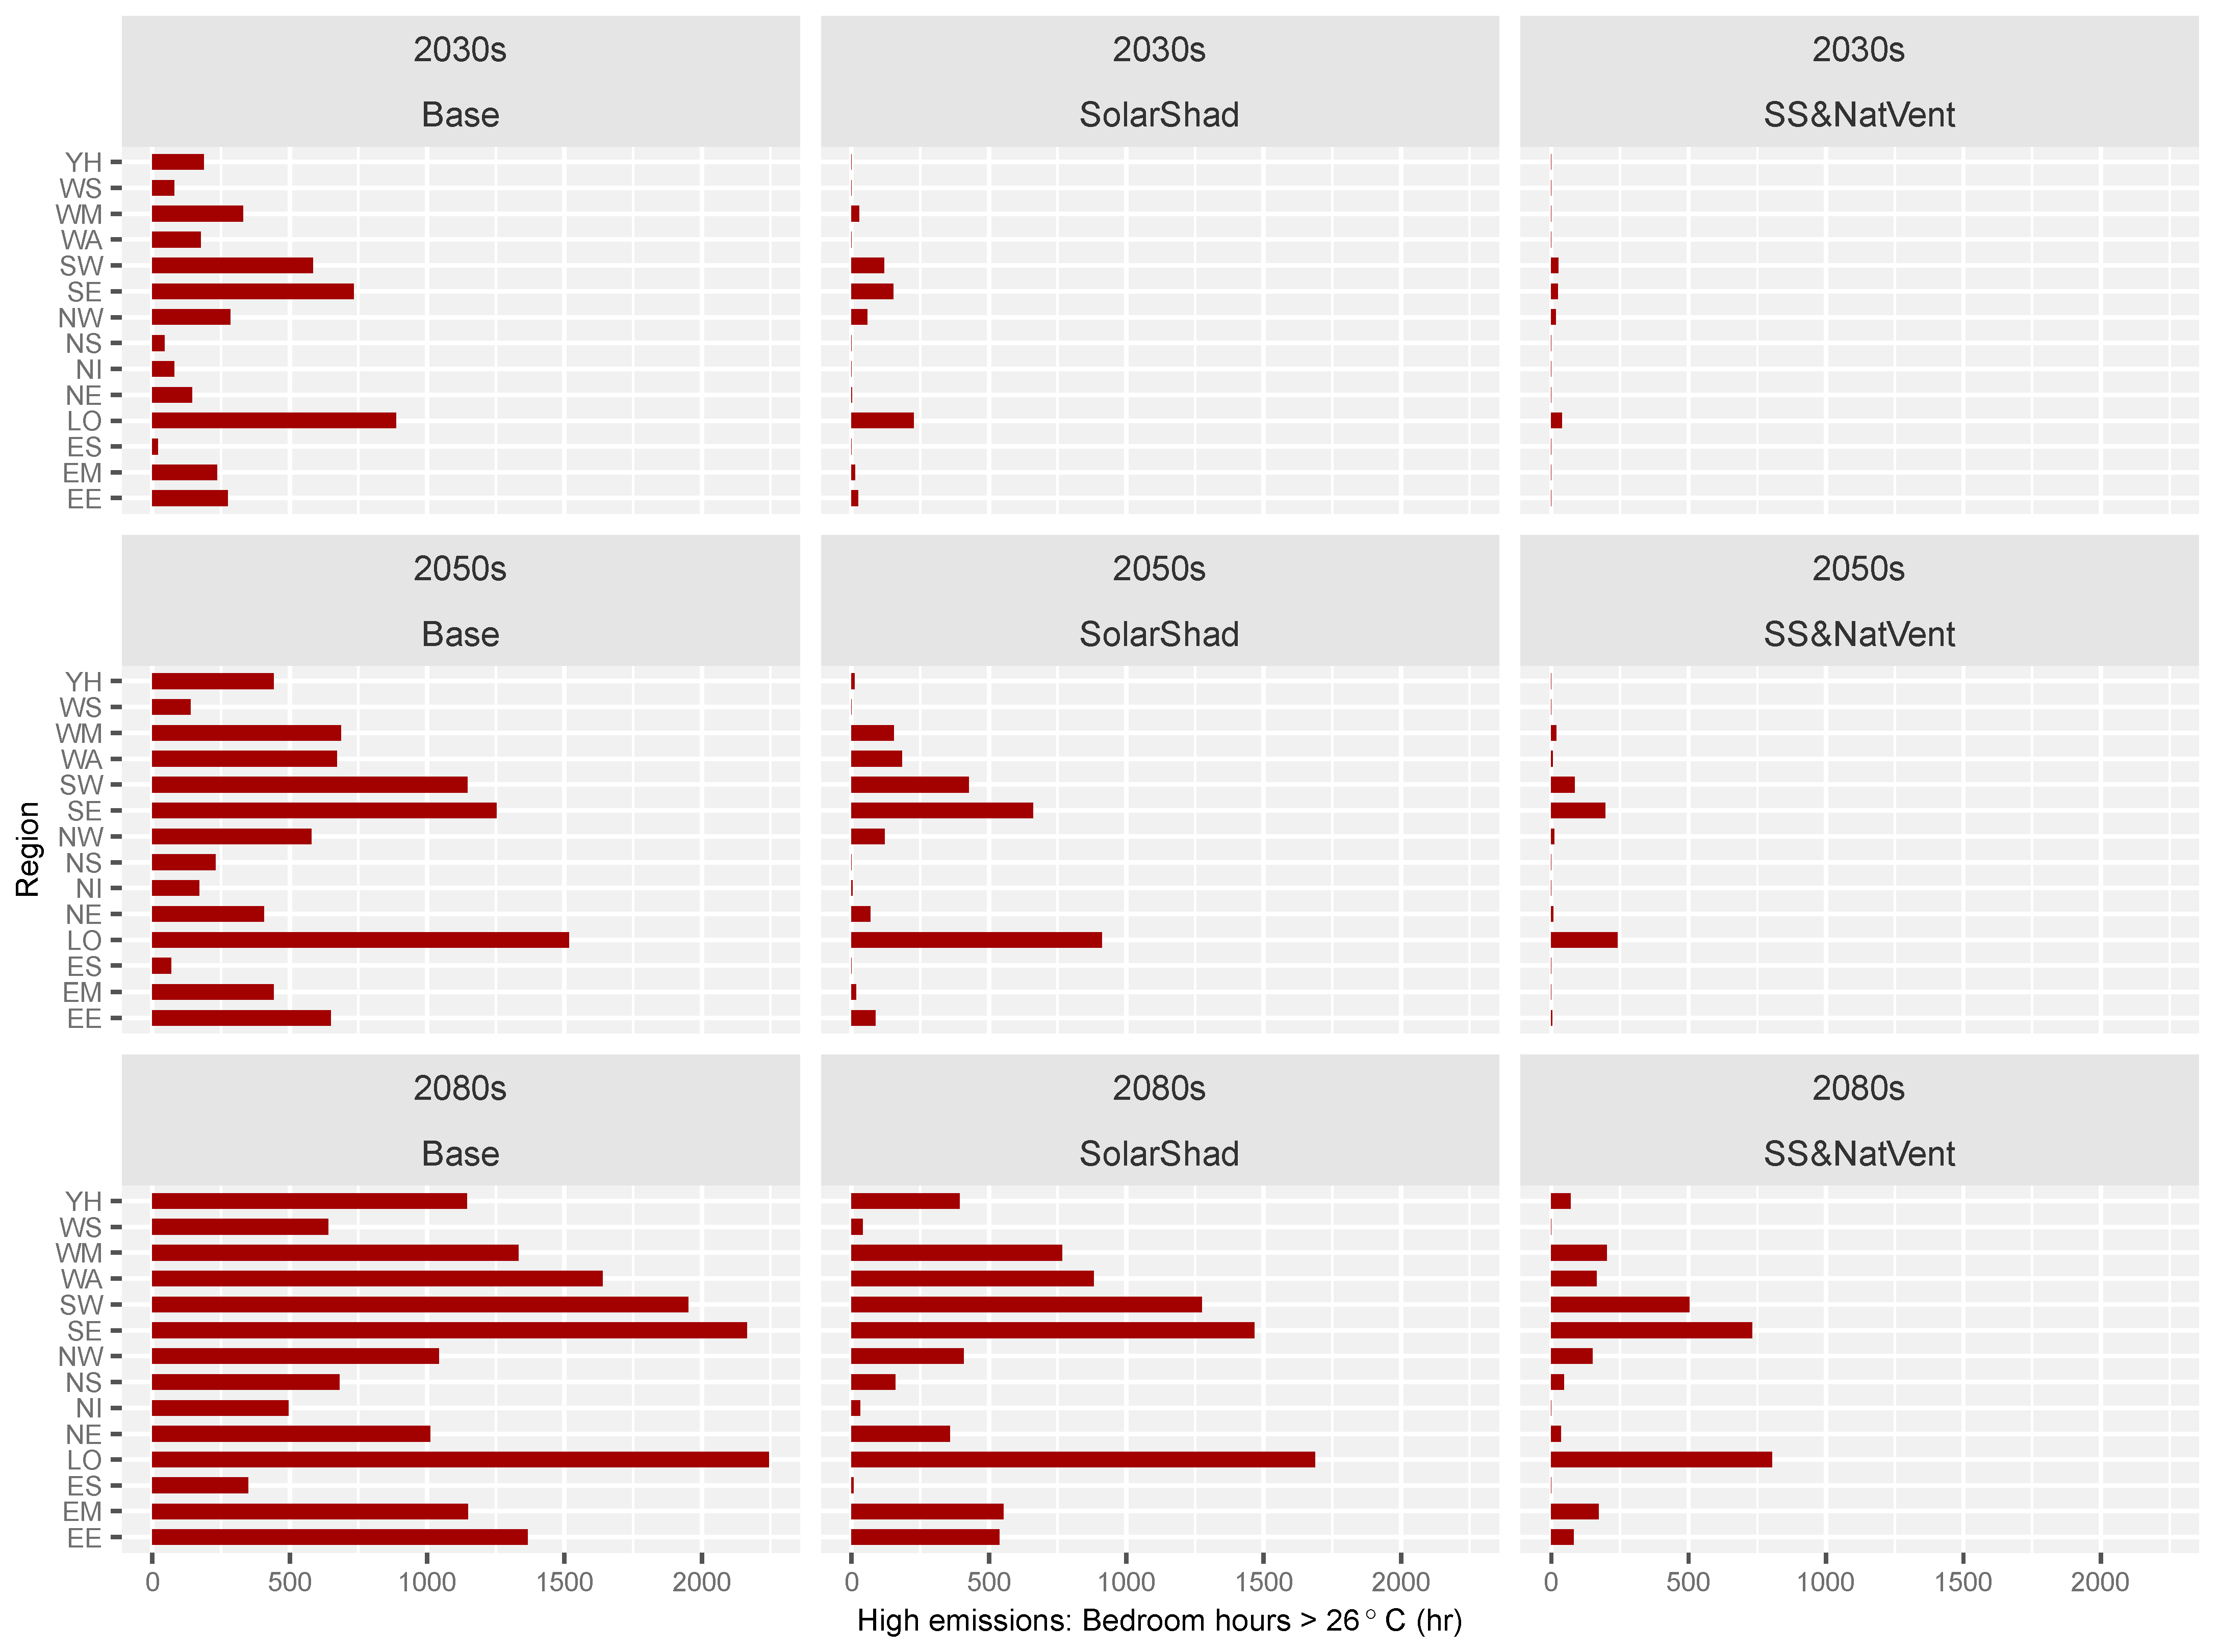
- Temperatures increase considerably in future decades (rows).
- Solar shading alone, and more so in combination with ventilation, produces a large reduction in temperatures compared with the base case in all scenarios (columns).
- The differences between medium (blue) and high (red) emissions are quite modest, and most noticeable in terms of the highest values
- In the base case (left column), for the current climate, all living room and almost all bedroom temperatures are below 30 °C, while for the 2080s, almost all bedroom values exceed 30 °C and almost all living rooms exceed 28 °C, with several values over 35 °C.
- For shading and ventilation (right column), for the current climate, all temperatures are below 27.5 °C, while for the 2080s, almost all exceed 25 °C, but there are few values over 30 °C.
4. Discussion
5. Conclusions
Author Contributions
Funding
Data Availability Statement
Acknowledgments
Conflicts of Interest
Abbreviations
| CAIT | Analysis Indicators Tool |
| CIBSE | Chartered Institution of Building Services Engineers |
| DSY | Design summer year (a “hot” summer, UK) |
| IPCC | Intergovernmental Panel on Climate Change (UN) |
| PROMETHEUS | Name of project to create future weather years, University of Exeter |
| RCP | Representative concentration pathway |
| SRES | Special Report on Emission Scenarios |
| TM | Technical Memorandum (CIBSE publication series) |
| TRY | Test reference year (an “average” year, UK) |
| UKCIP02 | UK Climate Impacts Programme 2002 |
| UKCIP09 | UK Climate Impacts Programme 2009 |
| UKCP18 | UK Climate Projections 2018 |
| WG | Weather generator |
References
- Stocker, T.F.; Qin, D.; Plattner, G.-K.; Tignor, M.; Allen, S.K.; Boschung, J.; Nauels, A.; Xia, Y. Assessment Report 5: Summary for Policymakers; Cambridge University Press: Cambridge, UK; New York, NY, USA, 2018. [Google Scholar]
- Ciavarella, A.; Cotterill, C.; Stott, P.; Kew, S.; Philip, S.; van Oldenborgh, G.J.; Skålevåg, A.; Lorenz, P.; Robin, Y.; Otto, F.; et al. Prolonged Siberian Heat of 2020; World Weather Attribution: Oxford, UK, 2020. [Google Scholar]
- Rösner, B.; Benedict, I.; van Heerwaarden, C.C.; Weerts, A.H.; Hazeleger, W.; Bissolli, P.; Trachte, K. Sidebar 7.3: The long heat wave and drought in Europe in 2018. In State of the Climate in 2018; American Meteorological Society: Boston, MA, USA, 2019; pp. S222–S237. [Google Scholar]
- Nauslar, N.; Brown, T.J.; McEvoy, D.J.; Lareau, N. State of the Climate in 2018; American Meteorological Society: Boston, MA, USA, 2019. [Google Scholar] [CrossRef] [Green Version]
- Kendon, M.; McCarthy, M.; Jevrejeva, S.; Matthews, A.; Sparks, T.; Garforth, J. State of the UK Climate 2019. Int. J. Climatol. 2020, 40, 1–69. [Google Scholar] [CrossRef]
- WMO. June Ends with Exceptional Heat. 2021. Available online: https://public.wmo.int/en/media/news/june-ends-exceptional-heat (accessed on 9 September 2021).
- Cornwall, W. Europe’s deadly floods leave scientists stunned. Science 2021, 373, 372–373. [Google Scholar] [CrossRef] [PubMed]
- Chik, H.; Xue, M. China floods: How Zhengzhou’s ‘once in a thousand years’ rainfall compares. South China Morning Post. 2021. Available online: https://flipboard.com/@SCMPNews/china-floods-how-zhengzhou-s-once-in-a-thousand-years-rainfall-compares/a-x7EuEfXaSeCCkSSeD3nivg%3Aa%3A2290161508-845d32bd09%2Fscmp.com (accessed on 9 September 2021).
- Committee on Climate Change. UK Climate Change—Risk Assessment 2017; HM Government: London, UK, 2016; p. 24.
- Committee on Climate Change. Reducing UK Emissions: 2018 Progress Report to Parliament; HM Government: London, UK, 2018.
- Dengel, A.; Swainson, M. Overheating in New Homes: A Review of the Evidence; NHBC Foundation: Milton Keynes, UK, 2012. [Google Scholar]
- Wright, D.L.; Haines, V.J.; Lomas, K.J. Overheating in UK homes: Adaptive opportunities, actions and barriers. In Proceedings of the 10th Windsor Conference: Rethinking Comfort, Windsor, UK, 12–14 April 2018; pp. 400–417. [Google Scholar]
- DCLG. Investigation into Overheating in Homes: Literature Review; DCLG: London, UK, 2012.
- Gupta, R.; Gregg, M. Assessing energy use and overheating risk in net zero energy dwellings in UK. Energy Build. 2018, 158, 897–905. [Google Scholar] [CrossRef] [Green Version]
- Fletcher, M.J.; Johnston, D.K.; Glew, D.W.; Parker, J.M. An empirical evaluation of temporal overheating in an assisted living Passivhaus dwelling in the UK. Build. Environ. 2017, 121, 106–118. [Google Scholar] [CrossRef]
- Porritt, S.M.; Cropper, P.C.; Shao, L.; Goodier, C.I. Ranking of interventions to reduce dwelling overheating during heat waves. Energy Build. 2012, 55, 16–27. [Google Scholar] [CrossRef]
- Taylor, M. Preventing Overheating, Investigating and Reporting on the Scale of Overheating in England, Including Common Causes and an Overview of Remediation Techniques; Good Homes Alliance: London, UK, 2014. [Google Scholar]
- Fosas, D.; Coley, D.A.; Natarajan, S.; Herrera, M.; Fosas de Pando, M.; Ramallo-Gonzalez, A. Mitigation versus adaptation: Does insulating dwellings increase overheating risk? Build. Environ. 2018, 143, 740–759. [Google Scholar] [CrossRef]
- Mavrogianni, A.; Wilkinson, P.; Davies, M.; Biddulph, P.; Oikonomou, E. Building characteristics as determinants of propensity to high indoor summer temperatures in London dwellings. Build. Environ. 2012, 55, 117–130. [Google Scholar] [CrossRef] [Green Version]
- Vandentorren, S.; Bretin, P.; Zeghnoun, A.; Mandereau-Bruno, L.; Croisier, A.; Cochet, C.; Ribéron, J.; Siberan, I.; Declercq, B.; Ledrans, M. August 2003 heat wave in France: Risk factors for death of elderly people living at home. Eur. J. Public Health 2006, 16, 583–591. [Google Scholar] [CrossRef] [PubMed] [Green Version]
- De Grussa, Z.; Andrews, D.; Lowry, G.; Newton, E.J.; Yiakoumetti, K.; Chalk, A.; Bush, D. A London residential retrofit case study: Evaluating passive mitigation methods of reducing risk to overheating through the use of solar shading combined with night-time ventilation. Build. Serv. Eng. Res. Technol. 2019, 40, 389–408. [Google Scholar] [CrossRef]
- Coley, D.; Kershaw, T. Changes in internal temperatures within the built environment as a response to a changing climate. Build. Environ. 2010, 45, 89–93. [Google Scholar] [CrossRef] [Green Version]
- Vardoulakis, S.; Dimitroulopoulou, C.; Thornes, J.; Lai, K.M.; Taylor, J.; Myers, I.; Heaviside, C.; Mavrogianni, A.; Shrubsole, C.; Chalabi, Z.; et al. Impact of climate change on the domestic indoor environment and associated health risks in the UK. Environ. Int. 2015, 85, 299–313. [Google Scholar] [CrossRef] [PubMed] [Green Version]
- Weng, K. Performance of UK Dwellings in Projected Future Climates. Energy Procedia 2017, 105, 3727–3732. [Google Scholar] [CrossRef]
- Building Regulations 2010: Approved Document K, Protection from Falling, Collision and Impact; HM Government: London, UK, 2013.
- Hulme, M.; Turnpenny, J.; Jenkins, G.J. Climate Change Scenarios for the United Kingdom: The UKCIP02 Scientific Report; Tyndall Centre, School of Environmental Sciences: Norwich, UK, 2002. [Google Scholar]
- IPPC. Special Report on Emission Scenarios (SRES): A Special Report of Working Group III of the Intergovernmental Panel on Climate Change; Cambridge University Press: Cambridge, UK, 2000; 599p. [Google Scholar]
- Murphy, J.M.; Sexton, D.M.H.; Jenkins, G.J.; Booth, B.B.; Brown, C.C.; Clark, R.T.; Collins, M.; Harris, G.R.; Kendon, E.J.; Betts, R.A.; et al. Climate Change Projections; Exeter, UK,, 2009; Available online: https://ueaeprints.uea.ac.uk/id/eprint/24961/ (accessed on 14 December 2021).
- Solomon, S.; Qin, D.; Manning, M.; Chen, Z.; Marquis, M.; Averyt, K.B.; Tignor, M.; Miller, H.L. (Eds.) Summary for Policymakers. In Climate Change 2007: The Physical Science Basis. Contribution of Working Group I to the Fourth Assessment Report of the Intergovernmental Panel on Climate Change; Cambridge University Press: Cambridge, UK; New York, NY, USA, 2007. [Google Scholar] [CrossRef]
- Met Office. UKCP18 Guidance: UKCP18 for UKCP09 Users; Met. Office: Exeter, UK, 2018.
- Belcher, S.E.; Hacker, J.N.; Powell, D.S. Constructing design weather data for future climates. Build. Serv. Eng. Res. Technol. 2005, 26, 49–61. [Google Scholar] [CrossRef]
- Levermore, G.J.; Parkinson, J.B. Analyses and algorithms for new Test Reference Years and Design Summer Years for the UK. Build. Serv. Eng. Res. Technol. 2006, 27, 311–325. [Google Scholar] [CrossRef]
- Mylona, A. The use of UKCP09 to produce weather files for building simulation. Build. Serv. Eng. Res. Technol. 2012, 33, 51–62. [Google Scholar] [CrossRef]
- World Resources Institute. Climatewatch. 2021. Available online: https://www.climatewatchdata.org/ (accessed on 22 September 2021).
- Eames, M.; Kershaw, T.; Coley, D. On the creation of future probabilistic design weather years from UKCP09. Build. Serv. Eng. Res. Technol. 2011, 32, 127–142. [Google Scholar] [CrossRef] [Green Version]
- Lowe, J.A.; Bernie, D.; Bett, P.; Bricheno, L.; Brown, S.; Calvert, D.; Clark, R.; Eagle, K.; Edwards, T.; Fosser, G.; et al. UKCP18 Science Overview Report. Met Off. 2019, 2, 1–73. [Google Scholar]
- CIBSE. Technical Memorandum 52: The Limits of Thermal Comfort: Avoiding Overheating in European Buildings; CIBSE: London, UK, 2013; pp. 1–25. [Google Scholar] [CrossRef]
- Hacker, J.; Holmes, M.; Belcher, S.; Davies, G. Climate Change and the Indoor Environment: Impacts and Adaptation (TM 36); Technical Memorandum, Chartered Institution of Building Services Engineers: London, UK, 2005. [Google Scholar]
- Gupta, R.; Gregg, M. Preventing the overheating of English suburban homes in a warming climate. Build. Res. Inf. 2013, 41, 281–300. [Google Scholar] [CrossRef]
- Gupta, R.; Gregg, M. Using UK climate change projections to adapt existing English homes for a warming climate. Build. Environ. 2012, 55, 20–42. [Google Scholar] [CrossRef]
- Wright, A.J.; Korolija, I.; Zhang, Y. Optimization of dwelling design under current and future climates using evolutionary algorithms in EnergyPlus. In CIBSE Technical Symposium 2013; Chartered Institution of Building Services Engineers: London, UK; Liverpool, UK, 2013. [Google Scholar]
- University of Exeter. Prometheus Downloads. Available online: https://emps.exeter.ac.uk/engineering/research/cee/research/prometheus/downloads/ (accessed on 23 September 2021).
- HM Government. Building Regulations: Approved Document L1A Conservation of Fuel and Power in New Dwellings (2013 Edition Incorporating 2016 Amendments—For Use in England); HM government: London, UK, 2017; pp. 16.1–16.128. [CrossRef]
- DCLG. English Housing Survey: Floor Space in English Homes—Main Report. Available online: https://assets.publishing.service.gov.uk/government/uploads/system/uploads/attachment_data/file/725085/Floor_Space_in_English_Homes_main_report.pdf (accessed on 26 November 2021).
- Garber, S. Shrinking Homes: The Average British House 20% Smaller than in 1970s. 2018. Available online: https://www.which.co.uk/news/2018/04/shrinking-homes-the-average-british-house-20-smaller-than-in-1970s/ (accessed on 14 December 2021).
- CIBSE. CIBSE Guide A: Environmental Design, 8th ed.; Chartered Institution of Building Services Engineers: London, UK, 2015. [Google Scholar] [CrossRef]
- CIBSE. Technical Memorandum 59: Design Methodology for the Assessment of Overheating Risk in Homes; CIBSE: London, UK, 2017. [Google Scholar]
- Lombrana, L.; Warren, H.; Sullivan, B. Heat, Floods, Fires: Jet Stream is Key Link in Climate Disasters. Available online: https://phys.org/news/2021-07-jet-stream-key-link-climate.html (accessed on 30 July 2021).
- McSweeney, R. Jet stream: Is climate change causing more ‘blocking’ weather events? (onlione). Carbon Brief 2020. Available online: https://www.carbonbrief.org/jet-stream-is-climate-change-causing-more-blocking-weather-events (accessed on 9 September 2021).
- HM Government. Energy White Paper: Powering Our Net Zero Future; HM Government: London, UK, 2020.


| Factor | Mechanisms |
|---|---|
| Area of glazing and shading | Large areas of glazing, other than north facing, collect solar gain. UK homes generally have no window shading, which can cause excessive solar gain [21]. |
| Built form and surroundings | Building shape, orientation, and surroundings will affect solar gain, natural ventilation, and shading. Shading from trees or other buildings will reduce overheating. |
| Thermal mass | In general, thermal mass at internal surfaces will reduce peak daytime temperatures. However, it also tends to maintain higher night-time temperatures. Can be effective in conjunction with night cooling [22,23]. |
| Ventilation: Openable windows/area openable Ability to cross ventilate Noise Safety/security limited opening | Larger openable area increases ventilation for cooling; many homes have limited opening area, sometimes for safety reasons. Wind-driven ventilation is much more effective across different façades; natural ventilation is, thus, reduced in homes with only one façade (typically flats). Even where windows can be physically opened, they may be kept shut due to external noise or security concerns [24] Windows may have restrictors limiting opening to 100 mm in some settings [25], severely limiting ventilation, though this is not required for UK homes in general. |
| Airtightness (infiltration) | Air-tight dwellings will lose less heat, particularly at night; typically associated with modern homes, so hard to separate from higher levels of insulation. |
| Insulation | As noted, this has been linked to overheating. However, it is strongly correlated with air tightness and in some cases modern lightweight construction, so hard to separate out effects. It can of course also reduce heat gain from outside, so reduce overheating. |
| Heat gain from communal heating/hot water pipes | Linked to significant heat gains particularly in some apartment blocks and communal corridors. |
| Internal gains | High internal gains from occupants, appliances, and lighting; more efficient appliances and lights will reduce this. |
| SRES Storyline/CO2 ppm in 2100/est. Temperature Rise | UKCIP02/Label | UKCP09/Label | Outline |
|---|---|---|---|
| A1F1 *: A1 variant F1, reliance on fossil fuel 920 ppm, 4.0 K | ✓ High emissions | ✓ High [this study] | Very rapid economic growth, a global population that peaks in mid-21st century then declines, and rapid introduction of new and efficient technologies. Increased cultural and social interaction, with a convergence of regional per capita income. |
| A1B: A1 variant B, balanced across all fuel sources, 2.8 K | ✓ Medium [this study] | Very rapid economic growth, a global population that peaks in mid-21st century then declines, and rapid introduction of new and efficient technologies. Increased cultural and social interaction, with a convergence of regional per capita income. | |
| A2: 820 ppm, 3.4 K | ✓ Medium–high Emissions | A very heterogeneous world characterised by self-reliance and preservation of local identities. Population continues to grow but economic growth and technological change are slower than other storylines. | |
| B2 #: 605 ppm, 2.4 K | ✓ Medium–low Emissions | A world with lower population growth than A2, accompanied by intermediate levels of economic development, with less rapid and more diverse technological change than in B1 and A1. | |
| B1 †: 540 ppm, 1.8 K | ✓ Low emissions | ✓ Low | The same population dynamics as A1, but a transition toward service and information economies, with lower material consumption and widespread introduction of clean and efficient technologies. |
| East Midlands—Leicester | Northern Ireland—Belfast |
| East of England—Norwich | South East England—Portsmouth |
| East Scotland—Aberdeen | South West England—Bristol |
| London | Wales—Cardiff |
| North East England—Newcastle upon Tyne | West Midlands—Birmingham |
| North Scotland—Fort William | West Scotland—Glasgow |
| North West England—Manchester | Yorkshire and Humber—Leeds |
| Fabric | U Value (W m−2 K−1) Part L. | U Value (W m−2 K−1) in Model |
|---|---|---|
| Roof | 0.20 | 0.195 |
| Wall | 0.30 | 0.299 |
| Floor | 0.25 | 0.249 |
| Windows | 2.00 | 2.00 |
| Construction/Material | Thickness mm | Conductivity W m−1K−1 | Density kg m−3 | Spec. Heat Capacity J kg−1 K−1 | Resistance m2 K W−1 |
|---|---|---|---|---|---|
| Ground floor construction | |||||
| Insulation | 85 | 0.025 | 700 | 1000 | 3.4 |
| Reinforced concrete | 100 | 2.3 | 2300 | 1000 | 0.0435 |
| Cavity | 50 | - | - | - | 0.21 |
| Chipboard flooring | 20 | 0.13 | 500 | 1600 | 0.1538 |
| External wall construction | |||||
| Brickwork | 112.5 | 0.84 | 1700 | 800 | 0.1339 |
| Cavity | 50 | - | - | - | 0.18 |
| Polyurethane board | 50 | 0.025 | 30 | 1400 | 2 |
| Concrete block | 150 | 0.19 | 600 | 1000 | 0.7895 |
| Gypsum/plasterboard | 12 | 0.16 | 801 | 837 | 0.075 |
| Roof construction | |||||
| Roofing felt | 20 | 0.19 | 960 | 837 | 0.1053 |
| Insulation | 140 | 0.03 | 40 | 1450 | 4.6667 |
| Membrane | 0.1 | 1 | 1100 | 1000 | 0.0001 |
| Cavity | 50 | - | - | - | 0.16 |
| Plasterboard | 12.5 | 0.21 | 700 | 1000 | 0.0595 |
| External window construction | |||||
| Pilkington K 6 mm | 6 | 1.06 | 0.0057 | 0.69 | 1.526 |
| Cavity | 12 | - | 0.3247 | - | - |
| Pilkington K 6 mm | 6 | 1.06 | 0.0057 | 0.69 | 1.526 |
| External door construction | |||||
| Plywood | 45 | 0.13 | 500 | 1500 | 0.3462 |
| Type and Condition | Details | +Infiltration 0.15 ach = 6.2 l s−1 | Total House Airflow |
|---|---|---|---|
| Louvres open, 24 l s−1 both floors when Tout < 25 °C | 48 ls−1 | 6.2 l s−1 | 54.2 l s−1 |
| Windows closed, trickle vents, 10 l s−1 per person, when Tout ≥ 25 °C | 20 l s−1 (2 people) | 6.2 l s−1 | 26.2 l s−1 |
| Dwelling Type | Region, Location, and [Two Letter Abbreviation for Plots] * | Decade | Emission Scenarios | Heat Reduction |
|---|---|---|---|---|
| Detached Semi-detached Terrace (3) | London (Heathrow) [LO]; South East England (Portsmouth) [SE]; South West England (Bristol) [SW]; West Midlands (Birmingham) [WM]; East Midlands (Leicester) [EM]; east of England (Norwich) [EE]; Wales (Cardiff) [WA]; North West England (Manchester) [NW]; North East England (Newcastle) [NE]; Yorkshire and Humber (Leeds) [YH]; west Scotland (Glasgow) [WS]; east Scotland (Aberdeen) [ES]; north Scotland (Fort William) [NS]; Northern Ireland (Belfast) [NI] (14) | Baseline 1981–2000 2030s 2050s 2080s (4: 1 baseline, 3 future) | Historic/baseline Future: Medium High (3: 1 baseline, 2 future) | Baseline With window ventilation With window ventilation and solar shading (3) |
| Average Overheating Hours | |||
|---|---|---|---|
| Current | 65 | ||
| Emissions, future | Medium | High | Ratio |
| 2030s | 288 | 285 | 99% |
| 2050s | 506 | 590 | 117% |
| 2080s | 877 | 1212 | 138% |
| Ratio periods | Time period ratios | ||
| 2030/current | 441% | 436% | |
| 2050/2030 | 176% | 207% | |
| 2080/2050 | 173% | 205% | |
| 2080/2030 | 304% | 426% | |
| Region | Emissions | Operation | Bed Hr > 26 °C | Max T Beds 1 | Max T Living Room 2 | Hours > 28 °C 3 | Criterion (b) Met |
|---|---|---|---|---|---|---|---|
| East Scotland (Aberdeen) [ES] | Medium | Shade | 0 | 25.8 | 26.0 | 0 | ✓ |
| Northern Ireland (Belfast) [NI] | Medium | Shade | 2 | 26.1 | 26.9 | 0 | ✓ |
| West Scotland (Glasgow) [WS] | Medium | Shade | 6 | 26.3 | 27.1 | 0 | ✓ |
| North East England (Newcastle) [NE] | Medium | Shade | 59 | 28.0 | 28.6 | 14 | |
| North Scotland (Fort William) [NS] | Medium | Shade | 79 | 28.4 | 29.1 | 21 | |
| North West England (Manchester) [NW] | Medium | Shade | 131 | 27.8 | 28.5 | 23 | |
| West Midlands (Birmingham) [WM] | Medium | Shade | 180 | 27.7 | 28.5 | 18 | |
| East Scotland (Aberdeen) [ES] | Medium | Shade and nat. vent | 0 | 24.9 | 25.2 | 0 | ✓ |
| Northern Ireland (Belfast) [NI] | Medium | Shade and nat. vent | 0 | 26.7 | 26.9 | 0 | ✓ |
| West Scotland (Glasgow) [WS] | Medium | Shade and nat. vent | 0 | 25.5 | 26.2 | 0 | ✓ |
| North East England (Newcastle) [NE] | Medium | Shade and nat. vent | 10 | 27.0 | 27.4 | 0 | ✓ |
| West Midlands (Birmingham) [WM] | Medium | Shade and nat. vent | 10 | 26.5 | 27.2 | 0 | ✓ |
| North West England (Manchester) [NW] | Medium | Shade and nat. vent | 16 | 26.6 | 27.4 | 0 | ✓ |
| North Scotland (Fort William) [NS] | Medium | Shade and nat. vent | 17 | 27.5 | 27.9 | 0 | ✓ |
| Yorkshire and Humber (Leeds) [YH] | Medium | Shade and nat. vent | 30 | 27.2 | 27.6 | 0 | |
| East of England (Norwich) [EE] | Medium | Shade and nat. vent | 46 | 27.9 | 28.5 | 8 | |
| Wales (Cardiff) [WA] | Medium | Shade and nat. vent | 85 | 28.0 | 28.1 | 3 | |
| East Midlands (Leicester) [EM] | Medium | Shade and nat. vent | 101 | 28.1 | 28.6 | 16 | |
| East Scotland (Aberdeen) [ES] | High | Shade | 6 | 26.3 | 26.9 | 0 | ✓ |
| Northern Ireland (Belfast) [NI] | High | Shade | 30 | 27.0 | 27.8 | 0 | ✓ |
| West Scotland (Glasgow) [WS] | High | Shade | 40 | 26.7 | 27.6 | 0 | |
| North Scotland (Fort William) [NS] | High | Shade | 158 | 28.8 | 29.7 | 30 | |
| East Scotland (Aberdeen) [ES] | High | Shade and nat. vent | 0 | 24.6 | 25.5 | 0 | ✓ |
| Northern Ireland (Belfast) [NI] | High | Shade and nat. vent | 0 | 25.9 | 26.4 | 0 | ✓ |
| West Scotland (Glasgow) [WS] | High | Shade and nat. vent | 0 | 25.3 | 25.9 | 0 | ✓ |
| North East England (Newcastle) [NE] | High | Shade and nat. vent | 35 | 27.2 | 27.4 | 0 | |
| North Scotland (Fort William) [NS] | High | Shade and nat. vent | 47 | 28.2 | 28.9 | 13 | |
| Yorkshire and Humber (Leeds) [YH] | High | Shade and nat. vent | 71 | 27.5 | 28.3 | 6 | |
| East of England (Norwich) [EE] | High | Shade and nat. vent | 83 | 27.8 | 28.4 | 8 | |
| North West England (Manchester) [NW] | High | Shade and nat. vent | 151 | 28.8 | 30.1 | 34 | |
| Wales (Cardiff) [WA] | High | Shade and nat. vent | 165 | 28.8 | 30.0 | 38 | |
| East Midlands (Leicester) [EM] | High | Shade and nat. vent | 173 | 28.7 | 29.2 | 19 |
Publisher’s Note: MDPI stays neutral with regard to jurisdictional claims in published maps and institutional affiliations. |
© 2022 by the authors. Licensee MDPI, Basel, Switzerland. This article is an open access article distributed under the terms and conditions of the Creative Commons Attribution (CC BY) license (https://creativecommons.org/licenses/by/4.0/).
Share and Cite
Wright, A.; Venskunas, E. Effects of Future Climate Change and Adaptation Measures on Summer Comfort of Modern Homes across the Regions of the UK. Energies 2022, 15, 512. https://doi.org/10.3390/en15020512
Wright A, Venskunas E. Effects of Future Climate Change and Adaptation Measures on Summer Comfort of Modern Homes across the Regions of the UK. Energies. 2022; 15(2):512. https://doi.org/10.3390/en15020512
Chicago/Turabian StyleWright, Andrew, and Eduardas Venskunas. 2022. "Effects of Future Climate Change and Adaptation Measures on Summer Comfort of Modern Homes across the Regions of the UK" Energies 15, no. 2: 512. https://doi.org/10.3390/en15020512
APA StyleWright, A., & Venskunas, E. (2022). Effects of Future Climate Change and Adaptation Measures on Summer Comfort of Modern Homes across the Regions of the UK. Energies, 15(2), 512. https://doi.org/10.3390/en15020512