Article

Research on Value-Seeking Calculation Method of Icing Environmental Parameters Based on Four Rotating Cylinders Array

1
Xuefeng Mountain Energy Equipment Safety National Observation and Research Station of Chongqing University, Chongqing 400044, China
2
School of Mechatronics and Vehicle Engineering, Chongqing Jiaotong University, Chongqing 400074, China
*
Author to whom correspondence should be addressed.
Energies 2022, 15(19), 7242; https://doi.org/10.3390/en15197242
Submission received: 6 July 2022 / Revised: 24 September 2022 / Accepted: 28 September 2022 / Published: 2 October 2022
(This article belongs to the Section F: Electrical Engineering)

Abstract

:
This paper calculates and analyzes the collision and freezing characteristics of water droplets on the cylindrical conductors with different diameters and deduces the variation law of icing weight change rate on different diameters rotating cylindrical conductors with wind speed, ambient temperature, liquid water content, and median volume diameter. Then, a prediction and value-seeking method of icing environment parameters based on rotating circular conductors is determined. The laboratory test results show that the measured values of ambient temperature T, wind speed U, liquid water content w and median volume diameter MVD are in good conformity with the reference values measured by other instruments, and the average errors of each parameter are 3.41%, 5.44%, 6.08% and 7.20%, respectively. The field natural experiment was carried out at Hunan Xuefengshan Energy Equipment Safety National Observation and Research Station. The obtained icing environmental parameters were substituted into the icing simulation calculation model of the LDQ-100 glass insulator. Compared with the field experiment results, the simulated ice shape and the field ice shape were in good agreement. The error between the numerical calculation results of the icing weight and the field icing weight of the experimental insulator was less than 6%.

1. Introduction

With the acceleration of the world modernization process, the radiation range of the power grid is expanding, and the transmission capacity is gradually increasing. The importance of safe transmission of electric power is increasingly prominent. Affected by the conditions of macroclimate, microtopography, and micrometeorology, ice disaster accidents occur from time to time, which brings great challenges to the reliability of the power grid. Many accidents are caused by freezing rain and icing in many areas, including icing flashover of insulator, conductor galloping and even conductor breaking, pole collapse, etc. [1,2,3,4,5,6].
Icing is a process in which water in the air solidifies on the surface of objects in various forms. It is affected by a variety of environmental factors, including wind speed, the liquid water content in the air, median volume diameter (MVD), ambient temperature, etc. The types of icing are various, and the process is complex [7,8].
Dong et al. [9] point out that wind speed is an important factor affecting the icing thickness, while the ambient temperature and liquid water content determine the change of conductor icing degree. The accretion coefficient of conductor icing can be derived from the ambient temperature, wind speed, liquid water content, and other conditions, and determine the way of conductor icing (dry growth, wet growth) and the type of conductor icing (hard rime, soft rime or glaze ice).
Cherney et al. [10,11,12,13] conducted the icing process of insulators through manual icing or an artificial climate chamber to control meteorological conditions. The results show that the variation of environmental parameters also affects the development of icing on different types of insulators. The decrease in ambient temperature accelerates the growth rate of the ice edge on the insulator surface and makes it thicker, within limits. The increase in median volume diameter will also increase the icing velocity of the insulator. In the same environment, the icing velocity of composite insulators with different structures is different [14,15,16,17].
To further study the growth process of conductor icing, scholars such as Finstad, Makkonen, and Fu established and improved the numerical model of conductor icing based on environmental parameters [18,19,20]. The research shows that knowing all environmental parameters, the water drop collision coefficient on the conductor surface can be obtained by empirical formula, while the real-time numerical simulation of the conductor icing shape and thickness needs to rely entirely on the accurately collected environmental parameters.
Pedersen, Makkonen, and other scholars analyzed and calculated the water droplet collision and capture process on the insulator surface based on hydrodynamics and different environmental conditions [21,22,23,24]. The results show that wind speed, median volume diameter, and other environmental parameters are important factors affecting the water drop collision coefficient on the surface of atmospheric structures.
Therefore, it is of great significance to obtain complete and accurate atmospheric parameters of the icing environment for simulating and monitoring the icing development of atmospheric structures. However, general meteorological sensors face the problem of freezing failure under icing conditions, and it is difficult to measure MVD, and liquid water content in the air. To accurately obtain the time-varying environmental parameters, Han et al. designed and manufactured the rotating multi-conductor device and established the calculation model of insulator icing parameters based on the empirical formula of the water drop collision coefficient of the cylindrical conductor [25]. However, because the algorithm used in the device has a complex calculation process, long calculation time, large overall volume, and difficult installation, it is not suitable for practical projects.
To study the method for obtaining the icing environmental parameters of the power grid with extensive application value, the paper analyzes the cylinder uniform icing model and the influencing factors of icing growth in the second section and clarifies the relationship between the icing growth of rotating cylinder and the icing environmental parameters. In the third section, a value-seeking method based on the icing environment parameter matrix database is proposed to obtain the icing environment parameters. The four rotating cylinders array device was designed independently. In the fourth and fifth sections, the method was verified by laboratory experiments and field natural experiments, respectively. The experimental results show that the method can meet the requirements of engineering application and has good application prospects.

2. The Cylindrical Icing Growth Model

2.1. The Collision Characteristics of Water Droplets on the Cylinder Conductors

Under the condition of the icing environment, the air contains supercooled water droplets. The air and water droplets form a gas–liquid two-phase, and the water droplets move together with the airflow. When water drops in the air encounter a fixed structure, some water droplets will collide, adhere and freeze on the surface of the structure, and finally form icing. Because of the difference in external airflow field, the collision characteristics of water droplets on cylindrical conductors with different diameters are different, resulting in obvious differences in icing velocity. The potential flow around the surface of a standard cylindrical conductor can be expressed as the following potential function [26].
ψ = U x + R 2 U x x 2 + y 2
where U is the initial air velocity; R is the radius of the cylindrical conductor; x and y represent the coordinates of the two-dimensional coordinate system with the center of the cylinder as the origin. By taking the derivative of the potential function, the formula for calculating the velocity component of the airflow in the x and y axes is
u x = U [ 1 x 2 y 2 ( x 2 + y 2 ) 2 ] ,   u x = U [ 2 x y ( x 2 + y 2 ) 2 ]
It is assumed that water droplets in the air have the same velocity as the airflow before encountering structure. After encountering a structure, the airflows around the surface of the structure. At this time, the acting force on the water drop includes its gravity G, gas buoyancy Fb, pressure difference resistance Fp before and after water drops, apparent mass force FM, and viscous resistance Fd of air [27]. In the process of the water droplet flow around the surface of the structure, the main acting force is considered the viscous resistance of air.
F d = 1 2 ρ a S w C a | u v | ( u v )
where ρ a is the air density, kg/m3; S w = π R d 2 is the maximum cross-sectional area of the water droplet, m2; C a is the air resistance coefficient; u and v represent the air and water droplets’ flow velocities, respectively. Then the formula that the water drops motion satisfies is:
F d = m w d v d t = 1 2 ρ a S w C a | u v | ( u v ) = m w 1 K C a R e 24 ( u v )
K = 2 R d 2 ρ d U 9 μ R , R e = 2 R d ρ a | u v | μ
where K is the Stokes number of the inertia of the moving water drop; Re is the Reynolds number of the relative motion of water droplets in the gas flow; Rd is the radius of a water droplet; mw is the mass of water droplets; ρ d is the water droplets density; μ is the kinematic viscosity of air, m2/s. Substituting Equations (2) and (5) into Equation (4) to obtain the solution equation of water drop velocity. Then, the velocity equation is transformed into the position coordinate equation by the difference method, and the trajectory of airflow and water droplets can be obtained [28]. In the process of writing the MATLAB calculation program, the trajectory of water droplets is specially treated: at time t + dt, if the water droplet coordinates x, y satisfy x2 + y2R2, it is considered that the water droplet collides with the cylinder surface at time t.
As shown in Figure 1, the water drop trajectory and airflow trajectory begin to separate near the cylinder surface, and some water droplets collide with the cylinder surface. Assuming that the water droplets with an initial height of S0 can reach the limit collision points at both ends of the circle, the calculation formula of the collision efficiency α1 of water droplets on a cylinder surface is:
α 1 = S 0 R
The collision efficiency α1 of water droplets on a cylinder surface is mainly affected by three factors, including wind speed U, median volume diameter MVD, and cylinder radius R. Under different MVD and different wind speeds, the paper calculates the collision efficiency α1 on the surface of four conductors with different radii by the method. The results are shown in Figure 2.
Under the condition of constant radius of cylinder conductor, the larger the wind speed is, the larger MVD is, and the greater the collision efficiency of water droplets on the surface of the conductor is. When the radius of a conductor is increased, the collision efficiency decreases with the increase in wind speed and MVD. The greater the difference between the radii of different circular conductors, the greater the difference between the collision efficiency and the environmental parameters, but the larger the radius of the cylinder conductor can also cause α1 to be smaller, which is not conducive to the measurement of icing amount. Therefore, the cylinder radius used in this model is 10~50 mm.

2.2. The Freezing Characteristics of Water Droplets on the Cylinder Conductors

According to the method above, the collision efficiency α1 of water droplets on a cylinder surface can be calculated iteratively when MVD, wind speed U and radius R of the cylinder conductor are known. After the water droplets collide with the surface of the cylinder conductor, ignoring the water loss caused by its splitting and splashing, the sticking efficiency of the water droplet on the surface of the cylinder conductor is α2 ≈ 1. By solving the mass of this part of water droplets completely frozen into ice through the heat balance equation, the freezing ratio of water droplets, namely the accretion efficiency α3, can be obtained. The heat balance equation is expressed as follows [29]:
q e + q c + q l + q r + q s = q v + q f + q d + q k
where qe is the heat loss of evaporation sublimation; qc represents the convective heat transfer loss with air; ql is the heat consumed by heating water droplets to freezing temperature; qr is the heat loss of longwave radiation; qs is the heat carried away by unfrozen water droplets. qv represents friction heating of cylinder conductor by airflow; qf is the latent heat released by water freezing; qd is the heat released when the freezing at 0 °C reaches the steady-state temperature on the surface of the cylinder conductor; qk represents collision kinetic energy of supercooled water. When there is a water film on the surface of the cylinder conductor, qd is 0. When the ambient temperature is low and there is no water film on the surface of the cylinder conductor, the steady-state temperature is the ambient temperature and qd is not zero, the accretion efficiency here is α3 = 1.
Neglecting the minor term qv, the substitution expression of the heat balance equation is as follows [28].
S b h ( T s T ) + S b χ ( e ( T s ) e ( T ) ) + D α 1 α 2 w U C w ( T s T ) + 4 S b ε σ R T 3 ( T s T ) + D α 1 α 2 w U C w ( 1 α 3 ) ( T s T ) = D α 1 α 2 w U L f + 1 2 D α 1 α 2 w U 3
where Sb and D are the surface area and radius of the cylinder conductor, respectively; h is the convective heat transfer coefficient; χ is the evaporation coefficient [20]; e(T) is the saturated water vapor pressure on the surface of the cylinder conductor when the temperature is T; Emissivity is ε = 0.95; σR is Stephen–Boltzmann constant; w is the liquid water content in the air, g/m3; Ts and T are, respectively, freezing point temperature and ambient temperature, °C; Cw is the specific heat capacity of water, J/(kg·°C); Lf is the latent heat of ice melting, J/kg. By simplifying the formula above, the freezing coefficient expression can be obtained:
α 3 = S b [ χ ( e ( T s ) e ( T ) ) + ( h + 4 ε σ R T 3 ) ( T s T ) ] D α 1 α 2 w U [ L f + C w ( T s T ) ] + 2 C w ( T s T ) 1 2 U 2 L f + C w ( T s T )
During the icing process of the rotating cylinder conductor, the icing rate is determined by the collision efficiency, accretion efficiency, wind speed, liquid water content in the air, and other environmental conditions, and its expression is [30]:
d M d x = D L α 1 α 2 α 3 U w
where L is the length of the cylinder conductor. Under the same icing environmental conditions, the icing rates of cylinder conductors with different diameters are different because of the differences in surface area, collision coefficient, accretion coefficient, etc.
As shown in Figure 3, under the designed icing environment, the icing rate of rotating cylinder conductors with different diameters increases with the increase in wind speed and MVD. As shown in Figure 3a, when the wind speed is less than 4 m/s, the smaller the diameter of the rotating cylinder conductors, the greater the icing rate. This is because the water droplet collision rate of the small-diameter cylinder conductor is significantly greater than that of the large-diameter cylinder conductor. However, when the wind speed is greater than 6 m/s, the water droplet collision rate of cylinder conductors of all diameters is increasing, and the cylinder conductors with larger surface area capture more water droplets, which makes the water droplet capture become the dominant factor for icing, resulting in its icing rate gradually exceeding that of small-diameter cylinder conductors. Therefore, under high wind speed, the icing rate of large-diameter cylinder conductors is greater. Similarly, as shown in Figure 3b, the icing rate of cylinder conductors with different diameters under different MVD also shows the same change trend. At MVD ≤ 25 μm, the icing rate of the large-diameter cylinder conductor is small, when MVD > 25 μm, the icing growth rate of the large-diameter cylinder conductor is significantly higher than that of the small-diameter cylinder conductor, and finally, the icing rate exceeds that of the small-diameter circular conductor.

2.3. Equation of Relationship between Icing and Environmental Parameters

According to the water drop collision and freezing characteristics of the cylindrical conductor mentioned above, the icing rate of the cylindrical conductor can be obtained under the condition that the environmental parameters and the diameter of the cylindrical conductor are known. Considering that the diameter of the iced cylindrical conductor increases with the increase in the amount of icing, the input value of the diameter of the iced cylindrical conductor needs to be updated continuously in the iterative process. Different icing growth processes lead to different icing densities. In this paper, the dry and wet icing densities are calculated according to the Jones π theory [31] and the Lewice formula [32].
Jones π theory:
ρ i = 249 84 ln π 6.24 ( ln π a ) 2 + 135 π k + 18.5 ln π k ln π a 33.9 ( ln π k ) 2
{ π c = k a × 10 4 / ( D w U L f ) π a = 9 D d U ρ a 2 × 10 2 / ( μ ρ w ) π k = 4 D d 2 U ρ w × 10 6 / ( 9 μ D )
where ka is the thermal conductivity of air, and Dd is the MVD; ρ w is the water drop density.
Lewice density formula:
ρ i = 917 ( 1 α 3 ) + 840 α 3
Equation (13) shows that the density of ice in the process of wet growth is a function of the accretion coefficient of the cylinder array and is inversely proportional to the accretion coefficient of the cylinder array.
Knowing the wind speed U, the liquid water content w in the air, the ambient temperature T, the median volume diameter MVD, and the initial diameter D of the cylinder, the cylinder icing velocity can be expressed as:
d M / d t = f ( U , M V D , w , T , D )

3. Value Seeking Method

It can be seen from Equation (14) that the icing rate of the rotating cylinder is a function related to the environmental parameters. When the initial diameter D of the rotating cylinder is fixed, its icing increment is only related to four environmental parameters. If the initial diameter D and the exact icing increment are known, there are four specific icing environmental parameters corresponding to them. Based on this, this paper proposes a method which is called the value-seeking method for short to calculate the icing environmental parameters according to the initial diameter of the rotating cylinder and the icing increment.
Based on the matrix database established in advance, the value-seeking method is a calculation method that matches the data in the database according to the known parameters to obtain the relevant data. According to the actual working conditions, the range and value interval of the four icing environment parameters are selected, and the values of each parameter are combined to form a 4-dimensional discrete data point [T, U, w, MVD]. Through the cylinder icing theory and MATLAB simulation, the collision coefficient α1, accretion efficiency α3, and icing mass increment dM corresponding to each discrete data point are calculated. All data is combined as a matrix database in the form of row vectors. Finally, the actual measured icing mass increment is compared with each row of data in the database to obtain the icing environmental parameters under the measurement conditions.
The matrix database is built as Figure 4 below:
The final calculated database A is a matrix with n rows and eight columns, and its expression is as follows:
A = ( D T U w M V D α 1 α 3 d M a 21 a 28 a n 1 a n 8 )
For the icing rotating cylinder with diameter D and icing mass increment M0 within time step dt, search the value through column 8 of the database to find the term ai8 with the smallest difference from the database. Row i where this value is located is the result of the final value finding, namely:
Y = ( T U w M V D )
To reduce the measurement error and avoid the influence caused by the excessive icing thickness of a single cylinder, the cylinder array with different diameters can be considered in the construction of the matrix database. The arithmetic mean of the value-seeking data of each cylinder is calculated to obtain the environmental parameters with higher reliability. The specific process is shown in Figure 5. Assuming that there are m (m ≥ 1, m  N *) rotating cylinders, the final value-seeking result is:
Y ¯ = 1 m k = 1 m Y k
The first column of the matrix database needs to add the initial diameters of other cylinders and the corresponding data. In this paper, four cylinders are selected for research. The calculation process of icing environment parameters based on four rotating cylinders is shown in Figure 5.

4. Laboratory Test Verification
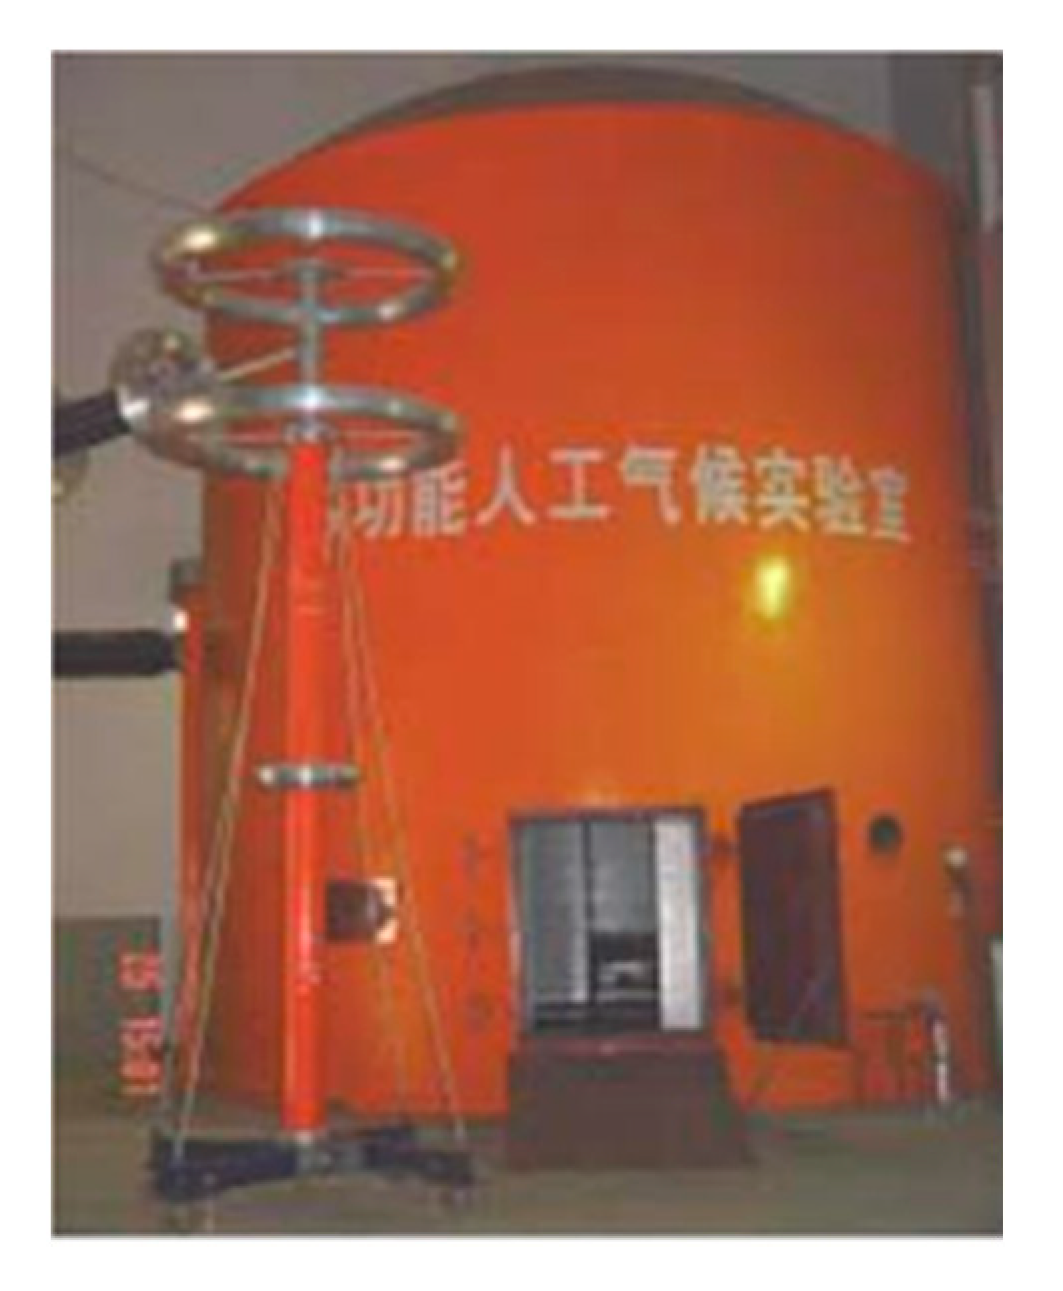
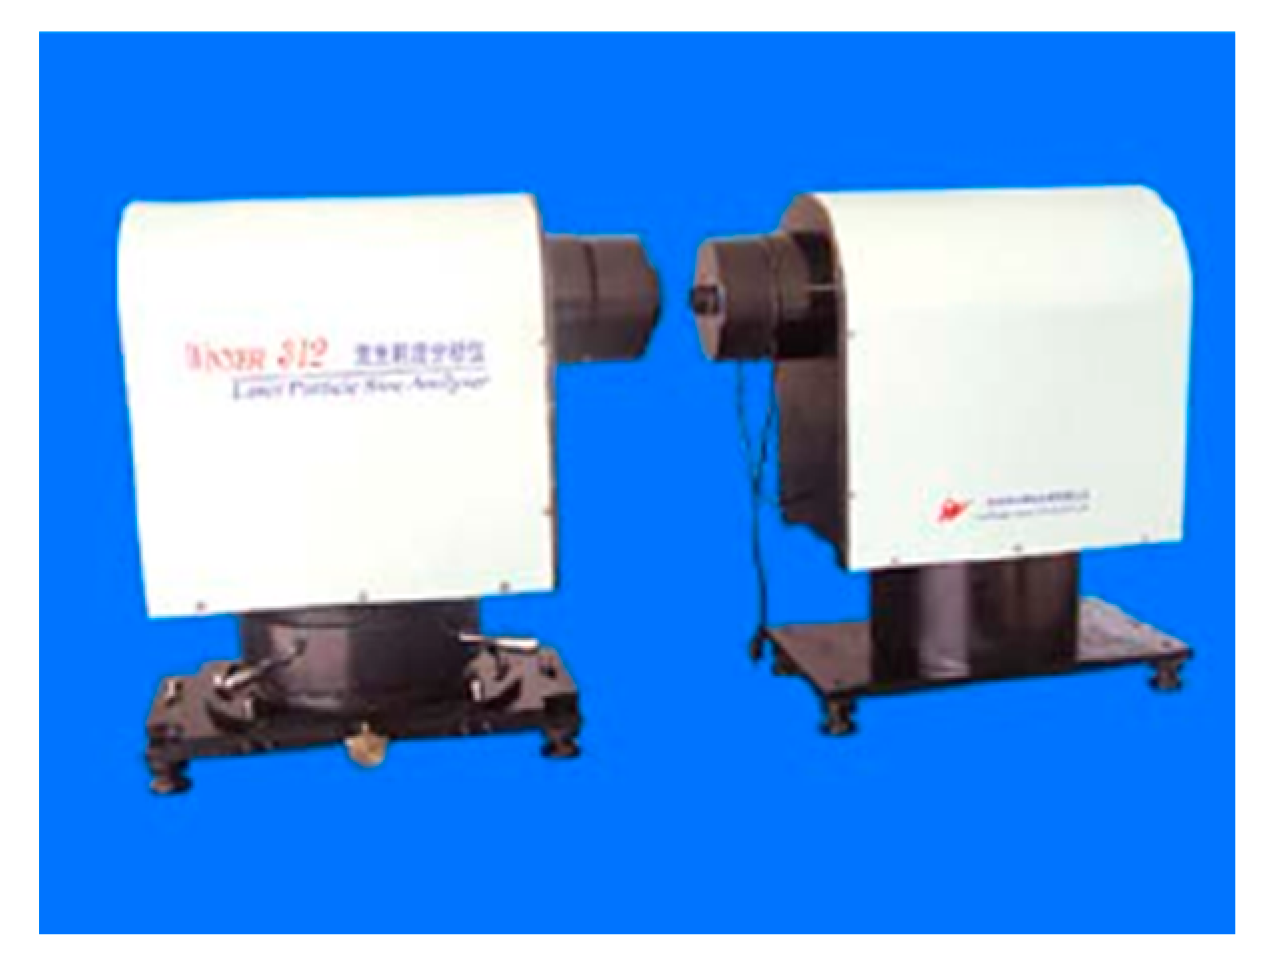
4.1. Test Equipment

To verify the accuracy of calculating the icing parameters using the value-seeking method, this paper firstly conducts a laboratory icing test in the artificial climate chamber of Chongqing University (as shown in Figure 6) with a diameter of 7.8 m and a height of 11.6 m, the temperature can be adjusted to −45 ± 1 °C. The chamber is shown in Figure 7. The wind speed varies between 1 and 12 m/s, and its atomizing nozzle can control MVD between 15 and 200 μm, which meets the requirements in [33].
The test object is an ice accretor composed of four rotating cylinders with different diameters, as shown in Figure 7. The diameter of each cylinder is 10 mm, 20 mm, 30 mm, and 40 mm, respectively, and the length of each cylinder is 200 mm. The assembly diagram is shown in Figure 7a. ① Is four ice accumulation cylinders with different diameters; ② is an icing increment sensor, which is connected with the bottom of the icing conductor, and can realize the automatic measurement and continuous transmission of real-time icing increment through the built-in control circuit system; ③ is the motor that drives the icing cylinder to rotate. Four icing incremental sensors are connected with four motors of the same type successively through the connecting shaft. The motor speed is 2 r/min, and the four motors are built in the sealed ice accretor tank; ④ is the intelligent control circuit of the four cylinders array ice accretor, which can collect and transmit the icing increment, analyze the collected icing increment and other data, monitor the icing parameters through the built-in icing parameter matrix database using the value seeking method, and realize the self-melting of the icing conductor without manual intervention under the control of the intelligent control analysis circuit; ⑤ is a sealing disc; ⑥ is an anti-ice housing, which together with ⑤ forms a protective box containing the core components of the four cylinders array ice accretor to prevent the circuit elements in ice accretor from being damaged by water ingress, icing, etc. At the same time, it is equipped with a self-melting ice module. When the thickness of icing reaches 10 mm, the ice can be melted without manual intervention to ensure the accuracy of data measurement. In addition, the thickness of the self-melting ice also limits the maximum diameter of each cylinder after icing, which is D (their initial diameter) + 10 mm, and also indirectly reduces the data storage capacity of each cylinder in the matrix database.
The laser particle size analyzer can measure the median volume diameter (MVD) and the liquid water content w in the artificial climate chamber, as shown in Figure 8. Ambient temperature and wind speed are measured by temperature and humidity sensor and anemometer, respectively, as shown in Figure 9 and Figure 10. To obtain representative data and adapt to the needs of the natural environment and engineering practice, environmental temperature, wind speed, and other icing parameters will be manually adjusted during the test.

4.2. Test Method

As shown in Figure 11, ice will grow on the four cylinders, and the icing environment parameters will transport to the computer via wireless. At the same time, these parameters will be gathered by other equipment as mentioned above. During the experiment, the icing environment parameters were controlled randomly by the artificial climate chamber.

4.3. Analysis of Test Results

Figure 12 shows the icing of the rotating cylinder array. The icing thickness on the radial section at the middle of the cylinder is evenly distributed, and the icing surface is smooth and flat. At the top and bottom of the cylinder, due to the change of airflow, the icing shape is slightly different from the middle position. However, considering the small amount of icing, the impact on the prediction results of environmental parameters can be ignored.
Post-processing the weight change data of the tension sensor, the weight of the circular conductor itself is removed, and the results are shown in Figure 13. The values measured by the instrument were taken as a reference and compared with the four icing parameters obtained by the value-seeking method. The results are shown in Figure 14.
The results of laboratory tests show that the measured values of wind speed U, ambient temperature T, liquid water content w, and median volume diameter MVD are in good agreement with the reference values measured by other instruments. The maximum prediction error of wind speed is less than 1.0 m/s, the maximum prediction error of ambient temperature is less than 1 °C, the maximum prediction error of liquid water content in the air is less than 0.2 g/m3, and the median volume diameter error is less than 4 μm. The average error of each parameter is 3.41%, 5.44%, 6.08%, and 7.20%, respectively, which are all within the acceptable engineering range.
However, the results obtained in the artificial climate chamber are not completely equivalent to the natural environment. Therefore, it is necessary to conduct icing experiments under field conditions to further verify the accuracy of the calculation method of icing parameters proposed in this paper.

5. Field Natural Experiment Verification

5.1. Test Method

The natural icing environment is different from that of the laboratory, and many instruments cannot be used in the ice and snow environment, so it is impossible to experiment completely in the way of the laboratory.
At present, the research on the insulator icing model is relatively mature. Many scholars have obtained the functional relationship between insulator icing increment, ice type and four icing parameters in Equation (14) through research and verified the conclusion through a large number of experiments. In this paper, the insulator icing model of Han [25] is adopted, and the measured icing parameters are substituted into the above model. The icing increment and ice shape are calculated by means of numerical simulation and compared with the field icing situation of insulators.

5.2. Test Equipment

The experiment was conducted in Hunan Xuefengshan Energy Equipment Safety National Observation and Research Station (the annual average precipitation is 1500 mm, the maximum wind speed is 35 m/s, the minimum temperature is −15 °C, and the maximum icing thickness is 500 mm) of Chongqing University.
The equipment used in the test is the same as that used in the laboratory, as shown in Figure 15, the cylinder array is arranged on the roof of the observation station so that there is no obvious shelter around to affect the airflow field and ice accretion process. Turn on the power supply and ensure that the module function starts normally. During the test, the ice mass increment is automatically recorded and searched in the database by the built-in program of the cylindrical array. Finally, the obtained icing parameters are transmitted to the mobile terminal and stored by wireless signals.
In addition, insulators are arranged simultaneously in areas with the same conditions to verify the accuracy of the median volume measured by the cylindrical array. The reference insulator string and the 50 kg tension sensor are hung in series on the rime tower, as shown in Figure 16. In the control room, the sensor information is transmitted to the terminal and user interface through the data acquisition board, so that the continuous and time-varying insulator icing weight data can be obtained.

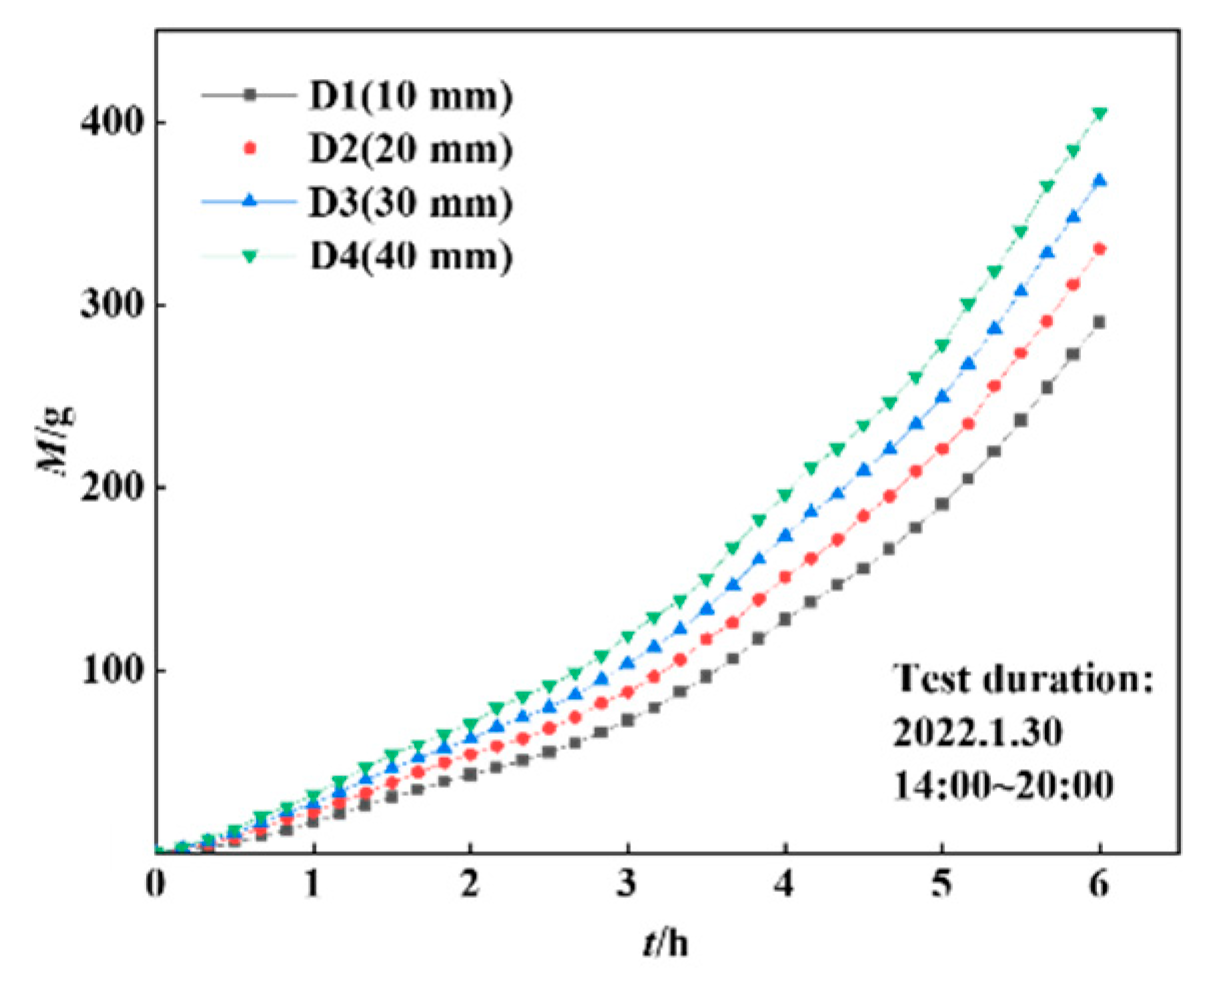
5.3. Experimental Results and Analysis

This verification test takes the 6-h icing period of Xuefeng mountain as an example on 3 February 2022, 14:00–20:00. Figure 16 shows the four icing environmental parameters obtained by the value-seeking method through the icing weight of rotating multi-cylindrical conductors.
Considering that the time step adopted for the simulation of insulator icing growth is Δ t = 20 min, the average values of wind speed, median volume diameter, liquid water content, and temperature are calculated in 20 min steps, which are used as the input values of environmental parameters for the numerical simulation of insulator icing. The specific values are shown in the red dotted line in Figure 17. At the end of each time step, the insulator icing shape is updated, to continuously iterate to obtain the six hours three-dimensional icing shape of the control insulator. Three time points are selected for comparison, and the results are shown in Figure 18.
Figure 19 shows the comparison between the icing weight of the control insulator measured by the tension sensor and the icing weight obtained by numerical simulation in this icing test. It is worth noting that the data, often and for various reasons, can be affected by uncertainties and/or inaccuracies. In these cases, a fuzzy preprocessor should be used in further studies [34].
The test results show that the numerical simulation results of the parameters measured by the cylindrical array are close to the measured values when the icing test is carried out in field natural conditions. At 8:00 p.m., the icing weight of the control insulator and that of the numerical simulation were 3.01 kg and 3.05 kg, respectively, with a relative error of 1.3%. Without taking into account interference, the maximum error occurred at about 18:20, while the icing weight of the control insulator was 2.69 kg. Compared with the simulation results, the relative error was 8.0%. The average error of the whole period is 6.8%, which shows that the calculation method of icing parameters proposed in this paper has certain accuracy and engineering applicability.

6. Conclusions

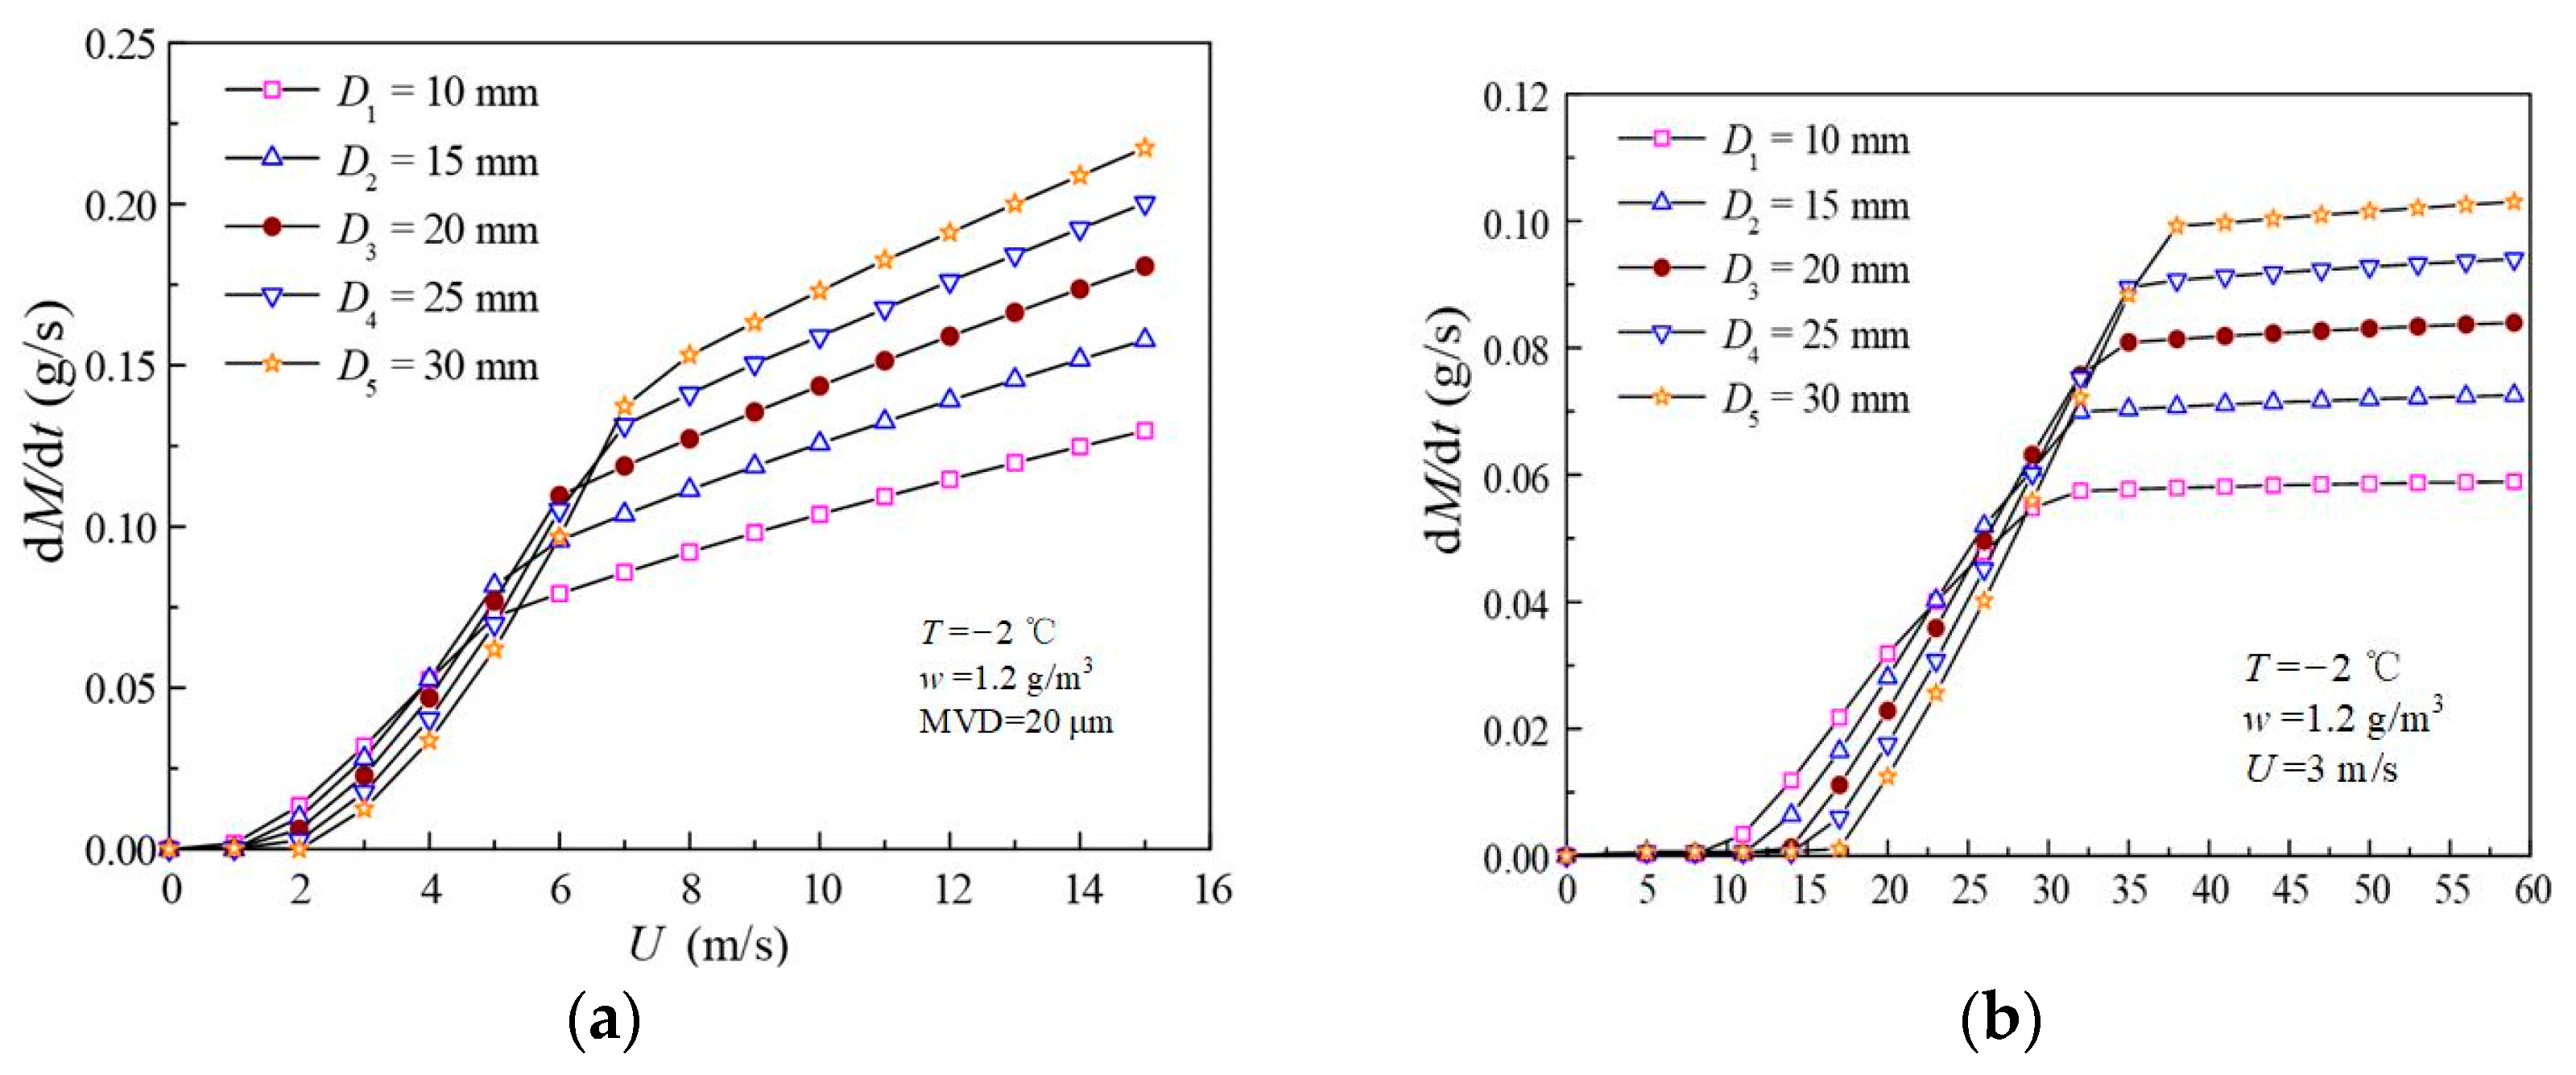
  • Because of the difference in droplet collision efficiency, the icing velocity of the rotating cylinder conductor with a small diameter is higher than that of the conductor with a large diameter when the wind speed is low and the liquid water content in the air is small. When the wind speed is fast and the liquid water content in the air is high, the icing velocity of a large-diameter cylindrical conductor is higher because of the advantage of surface area.
  • The four rotating cylinders array realizes the automatic data acquisition of icing weight, solves the shortcomings of high error and discontinuity of manual measurement, and provides the possibility for real-time monitoring of icing parameters under natural conditions.
  • According to the relationship between the icing increment of the rotating cylinder and the icing environment parameters, the value-seeking calculation method of icing environmental parameters is proposed.
  • Under laboratory icing and natural icing conditions, the environmental parameters change in real-time, and the icing velocity of the distributed rotating multicylinder conductors can change sensitively with the change of environmental parameters. In the laboratory test, the prediction errors of the four environmental parameters (wind speed, ambient temperature, liquid water content, median volume diameter) were less than 8%. In the field natural test, the icing weight average error between the numerical calculation results and the control insulator is less than 9%. The results show that it is feasible and accurate to use the value-seeking method to measure the icing environmental parameters, which is conducive to the ice disaster prediction and prevention of the power grid.

Author Contributions

G.Y.: Methodology, Software, Investigation, Writing—original draft, Writing—review & editing, Conceptualization, Funding acquisition, Validation, Resources. Y.L.: Conceptualization, Funding acquisition, Validation, Resources. X.J.: Writing—original draft. X.H. (Xingbo Han): Writing—review & editing. X.H. (Xiangshuai Han): Writing—original draft, Data curation. J.D.: Supervision, Data curation. Y.C.: Data curation, Formal analysis. Z.Z.: Conceptualization, Data curation, Methodology. All authors have read and agreed to the published version of the manuscript.

Funding

This research was supported by [the National Natural Science Foundation of China], grant number [52077018].

Data Availability Statement

Not applicable.

Conflicts of Interest

The authors declare no conflict of interest.

References

  1. Zhao, N.; Yu, X.; Hou, K.; Liu, X.; Mu, Y.; Jia, H.; Wang, H.; Wang, H. Full-time scale resilience enhancement framework for power transmission system under ice disasters. Int. J. Electr. Power Energy Syst. 2021, 126, 106609. [Google Scholar] [CrossRef]
  2. Jabbari, M.; Volat, C.; Fofana, I. Numerical modelling of ice-covered insulator flashover: The influence of arc velocity and arc propagation criteria. Energies 2018, 11, 2807. [Google Scholar] [CrossRef] [Green Version]
  3. Lu, J.; Guo, J.; Jian, Z.; Yang, Y.; Tang, W. Resilience assessment and its enhancement in tackling adverse impact of ice disasters for power transmission systems. Energies 2018, 11, 2272. [Google Scholar] [CrossRef] [Green Version]
  4. Zhu, Y.; Zhou, R.; Zhang, Y.; Dong, X.; Huang, X. Review on flashover risk prediction method of iced insulator based on icing monitoring technology. Cold Reg. Sci. Technol. 2021, 185, 103252. [Google Scholar] [CrossRef]
  5. Luo, D.; Mao, W.X.; Sun, H.F. Risk assessment and analysis of ice disaster in Ning-Meng reach of Yellow River based on a two-phased intelligent model under grey information environment. Nat. Hazards 2017, 88, 591–610. [Google Scholar] [CrossRef]
  6. Lu, J.; Xie, P.; Jiang, Z.; Fang, Z.; Wu, W. Voltage distribution and flashover performance of 220 kV composite insulators under different icing conditions. Energies 2018, 11, 632. [Google Scholar] [CrossRef] [Green Version]
  7. Han, X.B.; Jiang, X.L. Effect of DC electric field on water droplets’ movement and icing process on insulator. Cold Reg. Sci. Technol. 2019, 164, 102780. [Google Scholar] [CrossRef]
  8. Huang, W.; Hu, B.; Shahidehpour, M.; Sun, Y.; Sun, Q.; Yan, M.; Shao, C.; Xie, K. Preventive scheduling for reducing the impact of glaze icing on transmission lines. IEEE Trans. Power Syst. 2022, 37, 1297–1310. [Google Scholar] [CrossRef]
  9. Dong, B.B.; Jiang, X.L.; Xiang, Z. Calculation model and experimental verification of equivalent ice thickness on overhead lines with tangent tower considering ice and wind loads. Cold Reg. Sci. Technol. 2022, 200, 103588. [Google Scholar] [CrossRef]
  10. Dong, B.; Zhang, Z.; Xiang, N.; Gao, C.; Song, J.; Gu, Y. Studying ac flashover performance of suspension insulators under natural cold fog and wet deposition conditions. IEEE Access 2020, 8, 224588–224595. [Google Scholar] [CrossRef]
  11. Hu, Q.; Shu, L.; Jiang, X.; Sun, C.; Zhang, Z.; Hu, J. Effects of shed configuration on ac flashover performance of ice-covered composite long-rod insulators. IEEE Trans. Dielectr. Electr. Insul. 2012, 19, 200–208. [Google Scholar]
  12. Cherney, E.A. Flashover performance of artificially contaminated and iced long-rod transmission-line insulators. IEEE Trans. Power Appar. Syst. 1980, 99, 46–52. [Google Scholar] [CrossRef]
  13. Charneski, M.D.; Gaibrois, G.L.; Whitney, B.F. Flashover tests of artificially iced insulators. IEEE Trans. Power Appar. Syst. 1982, 101, 2429–2433. [Google Scholar] [CrossRef]
  14. Zhang, Z.; Yang, S.; Jiang, X.; Qiao, X.; Xiang, Y.; Zhang, D. DC Flashover dynamic model of post insulator under non-uniform pollution between Windward and Leeward sides. Energies 2019, 12, 2345. [Google Scholar] [CrossRef] [Green Version]
  15. Ibrahim, M.E.; Abd-Elhady, A.M.; Sabiha, N.A.; Izzularab, M.A. Dynamic flashover model considering pollution layer resistance variation for fixed washed high voltage insulators. IEEE Trans. Dielectr. Electr. Insul. 2017, 24, 2960–2967. [Google Scholar] [CrossRef]
  16. Yang, Z.; Jiang, X.; Huang, Y.; Hu, J.; Han, X. Influence of electric field on the ice-coating process of insulators with a different dielectric surface. IET Sci. Meas. Technol. 2020, 14, 585–592. [Google Scholar] [CrossRef]
  17. Zong, C.; Hu, Y.; Jiang, X.; Xian, R.; Liu, Z.; Sun, J. AC flashover characteristics and arc development process of glaze ice-covered insulators in natural environment. Int. J. Electr. Power Energy Syst. 2022, 135, 107559. [Google Scholar] [CrossRef]
  18. Makkonen, L. Models for the growth of rime, glaze, icicles and wet snow on structures. Philos. Trans. Math. Phys. Eng. Sci. 2000, 1776, 2913–2939. [Google Scholar] [CrossRef]
  19. Finstad, K.J.; Lozowski, E.P.; Gates, E.M. A computational investigation of water droplet trajectories. J. Atmos. Ocean. Technol. 1988, 1, 160–170. [Google Scholar] [CrossRef]
  20. Fu, P.; Farzaneh, M.; Bouchard, G. Two-dimensional modelling of the ice accretion process on transmission line wires and conductors. Cold Reg. Sci. Technol. 2006, 2, 132–146. [Google Scholar] [CrossRef]
  21. Sommerwerk, H.; Luplow, T.; Horst, P. Numerical simulation and validation of electro-impulse de-icing on a leading edge structure. Theor. Appl. Fract. Mech. 2020, 105, 102392. [Google Scholar] [CrossRef]
  22. Makkonen, L.; Zhang, J.; Karlsson, T.; Tiihonen, M. Modelling the growth of large rime ice accretions. Cold Reg. Sci. Technol. 2018, 151, 133–137. [Google Scholar] [CrossRef]
  23. Pedersen, M.C.; Sorensen, H.; Swytink-Binnema, N.; Condra, T. Computational fluid dynamics analysis and field measurements on ice accretion on a cup anemometer support arm. Appl. Therm. Eng. 2018, 135, 530–536. [Google Scholar] [CrossRef]
  24. Jin, J.Y.; Virk, M.S.; Hu, Q.; Jiang, X. Study of ice accretion on horizontal axis wind turbine blade using 2D and 3D numerical approach. IEEE Access 2020, 8, 166236–166245. [Google Scholar] [CrossRef]
  25. Han, X.; Jiang, X.; Yang, Z.; Bi, C. A predictive model for dry-growth icing on composite insulators under natural conditions. Energies 2018, 11, 1339. [Google Scholar] [CrossRef] [Green Version]
  26. Hu, Y.; Jiang, X.; Yang, Z.; Han, X. Influence of crystallization effect during icing water phase transition on the flashover characteristics of ice-covered insulators. IEEE Access 2020, 8, 176521–176529. [Google Scholar] [CrossRef]
  27. Pinsky, M.; Khain, A.; Korolev, A. Theoretical analysis of liquid-ice interaction in the unsaturated environment with application to the problem of homogeneous mixing. J. Atmos. Sci. 2018, 75, 1045–1062. [Google Scholar] [CrossRef]
  28. Farzaneh, M.; Savadjiev, K. Statistical analysis of field data for precipitation icing accretion on overhead power lines. IEEE Trans. Power Deliv. 2005, 20, 1080–1087. [Google Scholar] [CrossRef]
  29. Jiang, X.; Han, X.; Hu, Y.; Yang, Z. Model for ice wet growth on composite insulator and its experimental validation. IET Gener. Transm. Distrib. 2018, 12, 556–563. [Google Scholar] [CrossRef]
  30. Jiang, X.; Xiang, Z.; Zhnag, Z.; Hu, J.; Hu, Q.; Shu, L. Predictive Model for Equivalent Ice Thickness Load on Overhead Transmission Lines Based on Measured Insulator String Deviations. IEEE Trans. Power Deliv. 2014, 29, 1659–1665. [Google Scholar] [CrossRef]
  31. Jones, K.F. The density of natural ice accretions related to nondimensional icing parameters. Q. J. R. Meteorol. Soc. 1990, 116, 477–496. [Google Scholar] [CrossRef]
  32. Han, Y.Q.; Palacios, J. Surface roughness and heat transfer improved predictions for aircraft ice-accretion modeling. AIAA J. 2017, 55, 1318–1331. [Google Scholar] [CrossRef]
  33. P1783/D2.1; IEEE Draft Guide for Test Methods and Procedures to Evaluate the Electrical Performance of Insulators in Freezing Conditions. Institute of Electrical and Electronics Engineers: Piscataway, NY, USA, 2008.
  34. Versaci, M.; Calcagno, S.; Cacciola, M.; Morabito, F.; Palamara, I.; Pellicanò, D. Innovative Fuzzy Techniques for Characterizing Defects in Ultrasonic Nondestructive Evaluation. In Ultrasonic Nondestructive Evaluation Systems; Burrascano, P., Callegari, S., Montisci, A., Ricci, M., Versaci, M., Eds.; Springer: Cham, Switzerland, 2015. [Google Scholar]
Figure 1. The trajectories of water drops and airflow around the conductor.
Energies 15 07242 g001
Figure 2. Collision efficiencies of four conductors with different radii under different median volume diameters (MVD) and wind speeds.
Energies 15 07242 g002
Figure 3. The icing rates of five conductors (L = 1 m) with different diameters under different U and MVD: (a) Different wind speeds U; (b) Different MVD.
Energies 15 07242 g003
Figure 4. Flow chart of matrix database construction.
Energies 15 07242 g004
Figure 5. The icing environment parameters value seeking calculation process (when the number of cylinders is 4).
Energies 15 07242 g005
Figure 6. Artificial climate laboratory.
Energies 15 07242 g006
Figure 7. Ice Accretor: (a) Schematic diagram of assembly; (b) Physical structure.
Energies 15 07242 g007
Figure 8. Laser particle size analyzer.
Energies 15 07242 g008
Figure 9. Temperature and humidity sensor.
Energies 15 07242 g009
Figure 10. Anemometer.
Energies 15 07242 g010
Figure 11. The layout of the experiment.
Energies 15 07242 g011
Figure 12. Diagram of icing shape of multi-conductors: (a) t = 0.5 h; (b) t = 1.5 h; (c) t = 3 h.
Energies 15 07242 g012
Figure 13. Icing weight of four rotating conductors.
Energies 15 07242 g013
Figure 14. The comparison of measured with reference values.
Energies 15 07242 g014
Figure 15. The ice accretor in Hunan Xuefengshan Energy Equipment Safety National Observation and Research Station.
Energies 15 07242 g015
Figure 16. Field ice accretion figure of the rotating cylinder array.
Energies 15 07242 g016
Figure 17. Environment parameters measured by multiple cylinders.
Energies 15 07242 g017
Figure 18. Comparison between test and simulation.
Energies 15 07242 g018
Figure 19. The measured time-varying icing weights of test and simulations.
Energies 15 07242 g019
Publisher’s Note: MDPI stays neutral with regard to jurisdictional claims in published maps and institutional affiliations.

