2. The Concept of Reducing CO2 Emissions in the Literature and in Regulations
The trend is such that almost all major players in the industry market consider themselves adherents of the ESG (Environmental, Social and Corporate Governance) principles [
16,
17,
18]. Russian companies are no exception. The paper presents data from the annual reports of several major Russian industrial companies that seek to reduce their CO
2 emissions. Thus, Rosneft, in its annual report [
19], states that the reduction of greenhouse gas emissions is part of its 2022 strategy as part of the Company’s commitment to the UN Sustainable Development Goals and contribution to the implementation of the priority goal “Combating Climate Change”. In June 2019, Rosneft joined the initiative of leading international oil and gas companies and signed the Guidelines for Reducing Methane Emissions in the Natural Gas Supply Chain [
20].
Gazprom claims in its annual report [
21] that reducing CO
2 emissions is part of its corporate strategy. Measures are being taken to minimize the negative impact of climate change on production activities. Energy efficiency and energy saving programs, effective technological processes for various climatic conditions are being developed and implemented; Programs are being implemented to improve the efficiency of the system of production, transportation and operation of the gas transmission network, a program to adapt the production activities of PJSC Gazprom to changing climatic and geocryological conditions. In 2021, Gazprom Group companies were recognized as the best Russian oil and gas companies in the CDP rating. According to the totality of the disclosed indicators, they were assigned a climate rating of “B”, while in four categories out of 11 (“Emissions coverage 1 and 2”, “Management”, “Initiatives to reduce emissions” and “Disclosure of opportunities”), PJSC Gazprom received the maximum rating of “A”. Experts of the CDP partnership once again recognized that Gazprom is taking all possible and coordinated actions to protect the climate, disclose complete and reliable information on climate issues, conduct full-scale work on planning and resolving issues on climate change.
Severstal also adheres to the principles of reducing the carbon footprint. Chairman of the Board of Directors of the company A. Mordashov in his address to shareholders [
22] says that “based on the goals announced in 2020, in 2021 we set a new task for the medium term—to reduce specific carbon dioxide emissions per ton of steel by 10% by 2030”. This is one example of Severstal’s commitment to reducing its environmental impact and contributing to global efforts to achieve the goals of the Paris Agreement. In the reporting year, Severstal received the award of the World Steel Manufacturers Association as a leader in the field of sustainable development among the largest steel producers in the world. Severstal became the first Russian company to join the ResponsibleSteel global standardization and certification initiative aimed at ensuring the maximum contribution of steel producers to the implementation of sustainable development goals. Climate change entails not only risks, but also new opportunities, such as an increase in demand for eco-friendly products”. Severstal’s annual report [
23] also states that in order to increase interest in solving the tasks of the Company’s climate agenda, targets for reducing greenhouse gas emissions were included in the KPIs of the 11 top managers. All targets for reducing greenhouse gas emissions for 2021 are set at 5%. In addition, KPIs on carbon intensity and energy efficiency were established for Severstal CEO, Director of Occupational Safety and Industrial Safety and Chief Power Engineer. There are also mechanisms for encouraging other employees of the Company who are directly involved in projects aimed at solving the tasks of the climate agenda and reducing greenhouse gas emissions [
24].
According to the company, Norilsk Nickel [
25] focuses on the production of low-carbon products. The company occupies a strong starting position in the market in terms of absolute and specific greenhouse gas emissions, maintaining one of the lowest indicators in terms of absolute and specific greenhouse gas emissions among comparable international companies in the mining and metallurgical sector. In 2021, Norilsk Nickel, for the first time, assessed the specific carbon footprint of all manufactured products by developing a calculation methodology in accordance with international standards for the product life cycle assessment (LCA ISO 14040/14044). The methodology was certified by the international company in the field of product life trace assessment (LCA) Sphera Solutions GmbH—a recognized expert in this matter in the mining and metallurgical sector, the results of quantitative calculation of the carbon footprint of the Company’s products for 2020 were certified by the auditor EY. The carbon footprint of refined nickel produced by the Company amounted to 8.1 tons of CO
2-eq. per ton, which is significantly lower than the industry average [
25].
Rusal, another major Russian metallurgical company indicates in its report [
26] that disclosure of information in accordance with the TCFD recommendations is part of the climate change management mechanism. To assess the effectiveness of the management approach in this area, the Company conducts internal and external audits and verification, uses data assessment and monitoring systems, participates in external ratings, benchmarking competitors’ indicators and collects feedback from customers by conducting surveys. In 2021, Rusal participated in more than 10 large-scale surveys in the field of ESG factors, responded to more than 200 requests sent by customers related to the carbon footprint. The methodology for calculating greenhouse gas emissions in the metallurgical segment is certified by the independent organization TÜV Austria as part of the audit and verification of greenhouse gas emissions data.
Thus, all of the above indicates the strict commitment of the main manufacturing giants of Russia to reduce CO2 emissions, which means that they are potentially ready to introduce mandatory tax regulation of emissions by the state and the importers of their products.
The statistics on the global dynamics of emissions are well reflected in the BP company report [
27], which shows the dynamics of emissions of the main regions, as well as the countries included in these regions. Unfortunately, we cannot observe a clear positive trend in reducing CO
2 emissions, which is largely due to an increase in global production. For example, China has shown a significant increase in its carbon footprint since 2016. There are no prerequisites for reducing such a trace at the moment.
The Ecosystem Marketplace website [
28], as well as the World Bank website [
29], provides statistics on the volume of voluntary trade in carbon units; as well as prices to the countries issuing carbon units. Based on the statistics provided, we can observe a significant increase in the voluntary market for trading carbon units. Additionally, the Ecosystem Marketplace website presents various international mechanisms for accounting for greenhouse gas emissions that have received international recognition. Among the listed mechanisms, the leader is Verified Carbon Standard, which covers about 69% of all existing carbon units.
In many works [
30,
31,
32,
33,
34,
35,
36,
37], the field of the green economy as the basic policy of further development of states is investigated. The impact of the green economy on society, as well as on the agrarian and industrial system of states is investigated. The instruments of financing the green economy, which for the most part are “green” bonds, are considered.
The UNFCCC Sites and platforms [
38] and United Nations Web Page [
39] information portals present declarations, conventions and other regulatory documents that relate to the topic of our research. First of all, we will be interested in the Paris Agreement on Climate Change and the Kyoto Protocol, since they are the basic documents regulating activities to reduce CO
2 emissions.
In our research, we will use the main document regulating taxation in the Russian Federation—the Tax Code of the Russian Federation [
40]. Based on the existing developed taxation mechanisms, we will create a new mechanism capable of regulating taxation in the field of CO
2 emissions.
Alternative using of CO
2, its storage, chemical reactions using CO
2 are described by researchers in investigations [
41,
42,
43,
44,
45,
46,
47,
48].
3. Data and Methods
To determine the mechanism of cross-border carbon regulation, data were taken from the published annual reports of the main Russian companies in the oil and gas industry and metallurgy, since these industries are defined in the CBAM concept approved in the EU. Based on the companies’ reports, data on actual greenhouse gas emissions by year were selected. We need the amount of greenhouse gas emissions to determine the tax base of companies. Additionally, to assess the impact of the introduction of a carbon tax on companies in the oil and gas and metallurgical industries, the main financial indicators from the published financial statements of the studied companies by year were used. The initial data were processed on the basis of methods of comparison, modeling, analysis and deduction.
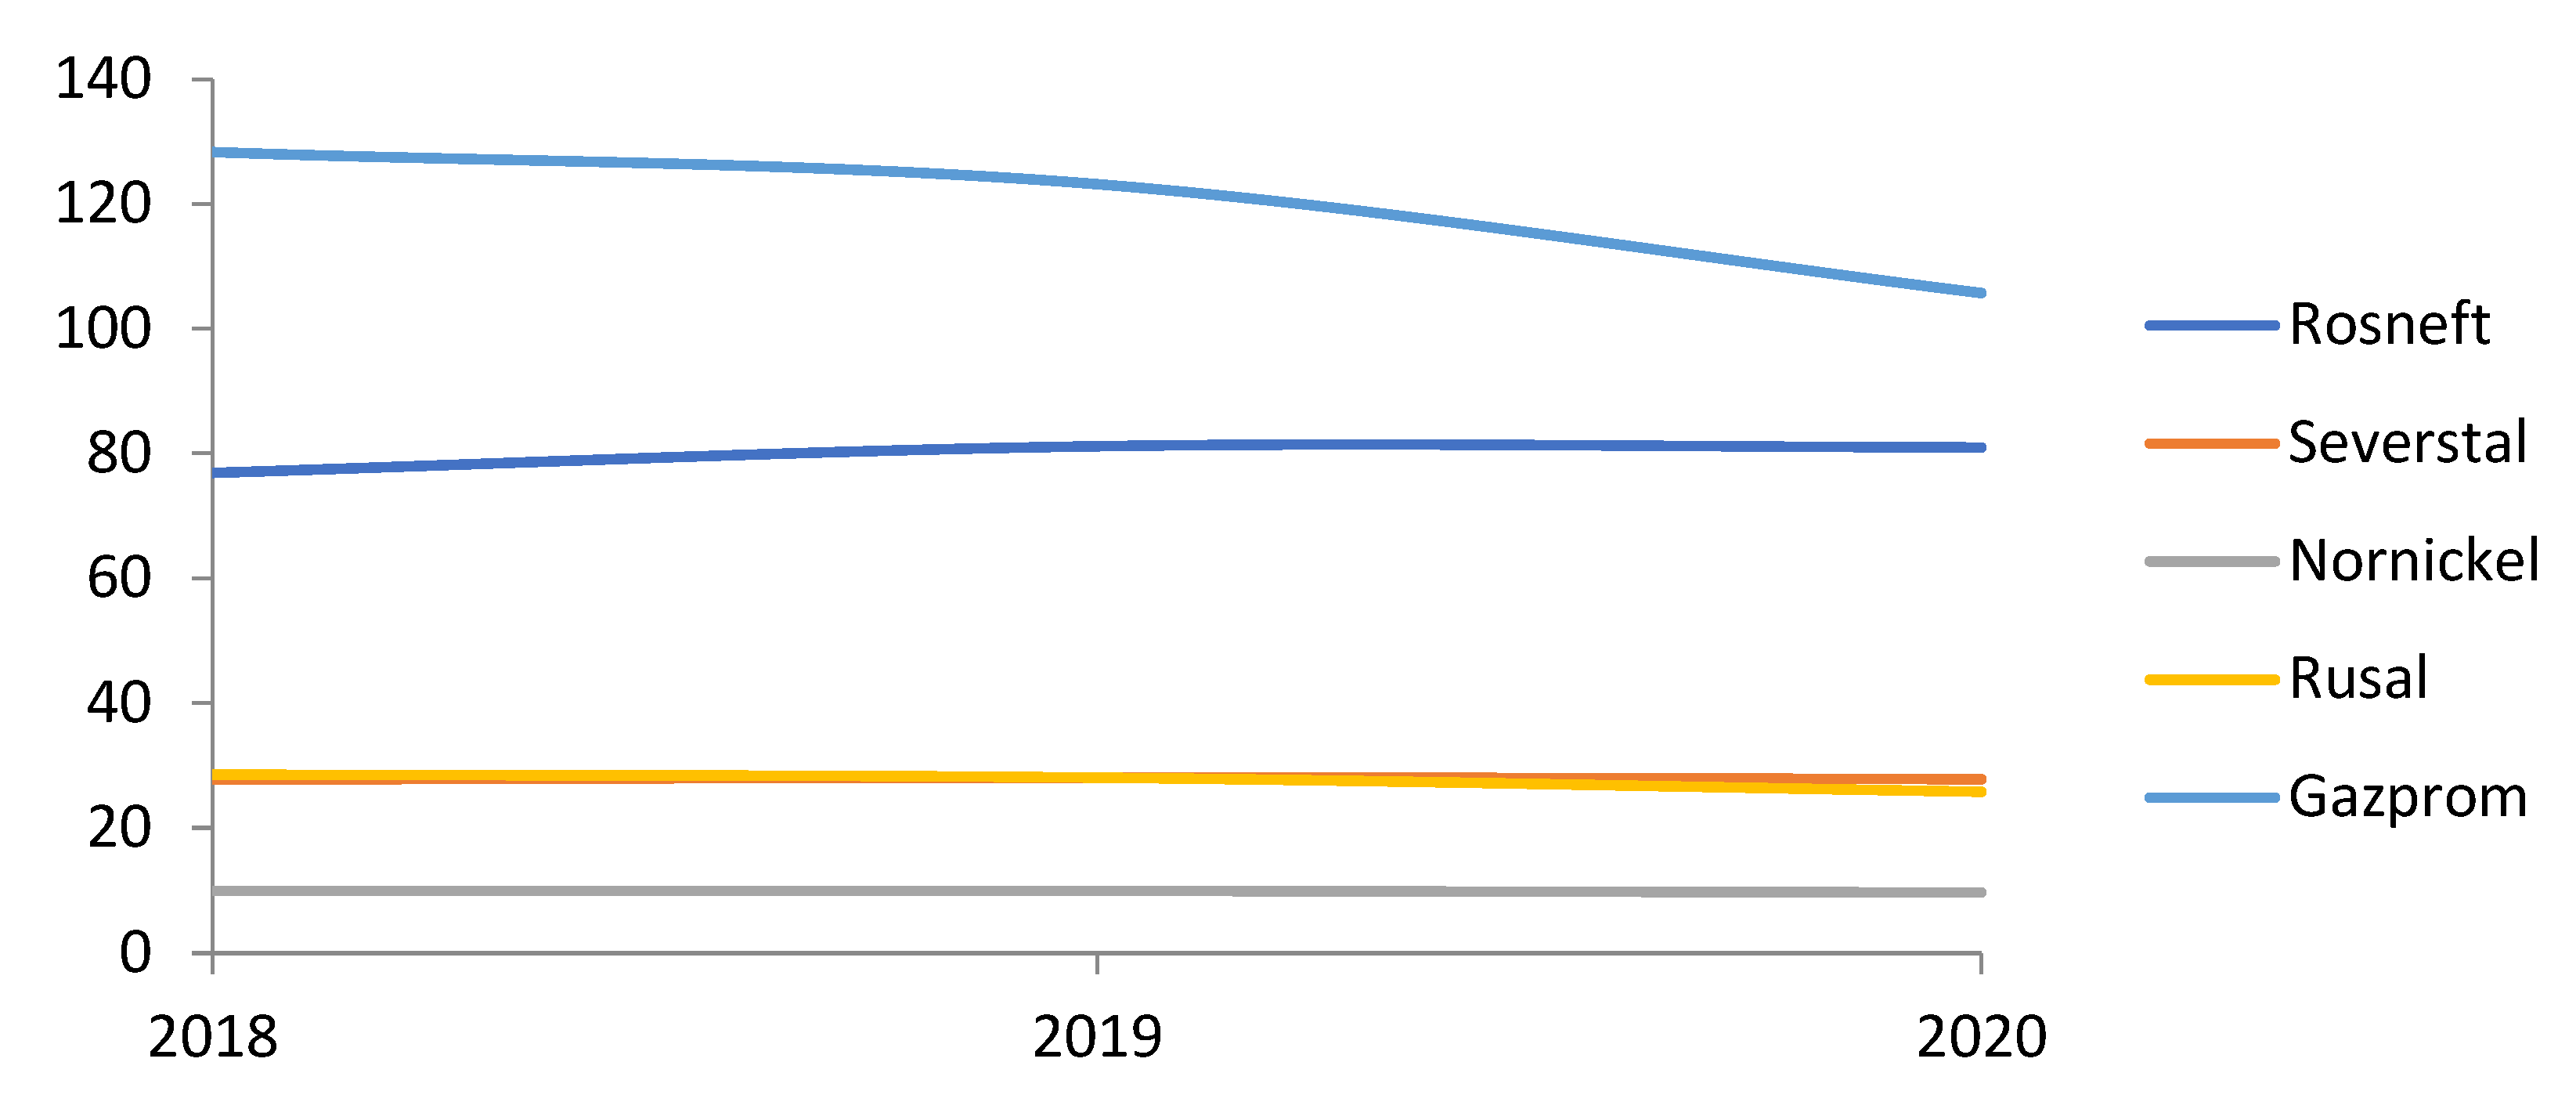
Consider the carbon emissions of some backbone enterprises for 2018, 2019, 2020. Consider emissions in Scope 1, direct emissions, and Scope 2, indirect emissions (
Table 1 and
Figure 1).
The overall dynamics of carbon emissions in the chart below.
Figure 1.
The graph of CO2 emissions shows that the dynamics of the main companies is stable, with the exception of Gazprom, which shows the dynamics of reducing CO2 emissions from 2019 to 2020. The data are given in million tons. The data are taken from the sustainability reports of companies for 2021.
From the dynamics above, it is obvious that oil and gas companies (Gazprom, Rosneft) have significantly higher emissions compared to metallurgical companies. In addition, for the period 2018–2020, we do not see positive dynamics in reducing greenhouse gas emissions, with the exception of Gazprom. However, it should be taken into account here that this company has the largest amount of emissions among those considered, therefore, apparently, it has the potential for reduction.
To assess the possible impact on government revenues, as well as to determine the level of cost of carbon units, we will conduct some research on some backbone enterprises of the Russian Federation. At the moment, the Russian Federation is considering the following rate for a carbon unit equivalent to 1 ton of greenhouse gas emissions: 2000 rubles per unit. This rate is uniform and does not have diversification depending on the type of activity of the enterprise. Thus, having data on emissions and the cost of a carbon unit, we will evaluate possible budget revenues in retrospect for 2018–2020 (
Table 2).
In total, for five companies, additional budget revenue from carbon dioxide emissions will amount to about 500 billion rubles in 2020. Obviously, such a size of payments by companies will create significant budget revenues, but there are significant risks for both the companies themselves and for buyers of products, since it is obvious that manufacturers will pass on additional costs to buyers, which will lead to price increases and inflation may increase.
The financial performance of selected companies for 2020 and evaluate their ability to pay a carbon tax are shown below (
Table 3).
It is clear from the analysis that the companies have different levels of EBITDA margin. The highest level of profitability is shown by Norilsk Nickel and Severstal, the lowest among the studied companies is Rusal.
Evaluation of the impact of an additional carbon tax on the EBITDA margin of companies with unchanged prices for manufactured products is shown below (
Table 4).
Based on the table above, we see that Rusal without state emission quotas or without increasing the cost of products has a minimum return on sales of 2%, which is significantly lower than the market. The carbon tax has the greatest impact on EBITDA on steel companies Severstal and Rusal. Companies in the oil and gas industry (Rosneft, Gazprom) are minimally affected by the carbon tax.
Based on the observation made, the impact of an additional tax on greenhouse gas emissions can be optimized for the carbon tax rate to encourage oil and gas companies to reduce emissions. A 7–8% reduction in companies’ margins will have a significant impact on companies (
Table 5 and
Table 6).
Thus, the table above shows that potentially with an increase in the carbon unit rate from 2000 thousand rubles to 5000 rubles for oil and gas producing companies, the additional state income only at the expense of Rosneft and Gazprom can amount to 560 billion rubles in 2020.
Taking into account the tax rates and the additional income of the state, the most important factor is the sources of formation of the company’s revenue, namely the price for the domestic consumer. If the state does not develop an effective system for regulating and monitoring domestic prices, then the introduction of an additional tax may be a blow to the well-being of citizens.
4. Results
Consider the process of verification and trading in the international market for carbon credits.
According to the national accreditation system, as of 22 December 2021, Rosaccreditation receives applications from organizations for accreditation as greenhouse gas verification bodies. When accrediting organizations, it is important to understand that accredited organizations must be recognized abroad and have a transparent international system of assessment and verification.
Accreditation is voluntary, therefore Rosakkreditatsiya cannot predict the number of applicants, however, by now they declare about ten companies. Currently, Rosaccreditation together with the National Accreditation Institute have trained independent accreditation experts.
The introduction of a new area of accreditation plays a crucial role in the recognition of Russian carbon reporting in foreign countries. Since only in this case, manufacturers will be able to avoid double taxation. At the beginning of 2022, Roascreditation plans to apply for mutual recognition of reporting under the International Accreditation Forum (IAF) system. Thus, in case of successful recognition of accredited Russian organizations for the validation and verification of greenhouse gas emissions, they will be able to use the international IAF mark, which will allow them to receive recognition of the activities of such organizations abroad.
Within the framework of the 26th UN Climate Conference, the system of international trading in carbon units was approved. According to the approved rules, participating countries can buy carbon units from countries that have reduced their greenhouse gas emissions below their obligations, i.e., countries with unused carbon credits. Currently, there are international mechanisms for accounting for greenhouse gases, which have international recognition. These are mechanisms such as:
- -
Verified Carbon Standard;
- -
Gold Standart;
- -
Clean Development Mechanism;
- -
American Carbon Registry;
- -
Climate Action Reserve;
- -
Plan Vivo.
Among these mechanisms, the leader is the Verified Carbon Standard, which covers about 69% of all existing carbon units.
European transboundary carbon regulation is another step towards reducing greenhouse gas emissions and improving natural conditions. However, even in such a mechanism, one can count on additional state revenues. On the one hand, this is a challenge for companies, and on the other hand, it is an opportunity for further economic growth, since the sustainable development policy is currently highly valued by investors. Additionally, the policy of the “green” economy generates new financial instruments that allow you to attract borrowed capital. With balanced state regulation, Russian producers will be able to pay tax not in favor of the European Union, but in favor of the budgets of the budget system of the Russian Federation. Of course, the main agenda for Russia is the applicable tax rates, as well as the verification of carbon units according to international standards (
Table 7).
Given the current trends and the established trend in ESG, many corporations are heading for environmentally friendly development, and in order to confirm the policy of sustainable development, attract additional investment in projects, they voluntarily participate in paid programs to reduce harmful emissions.
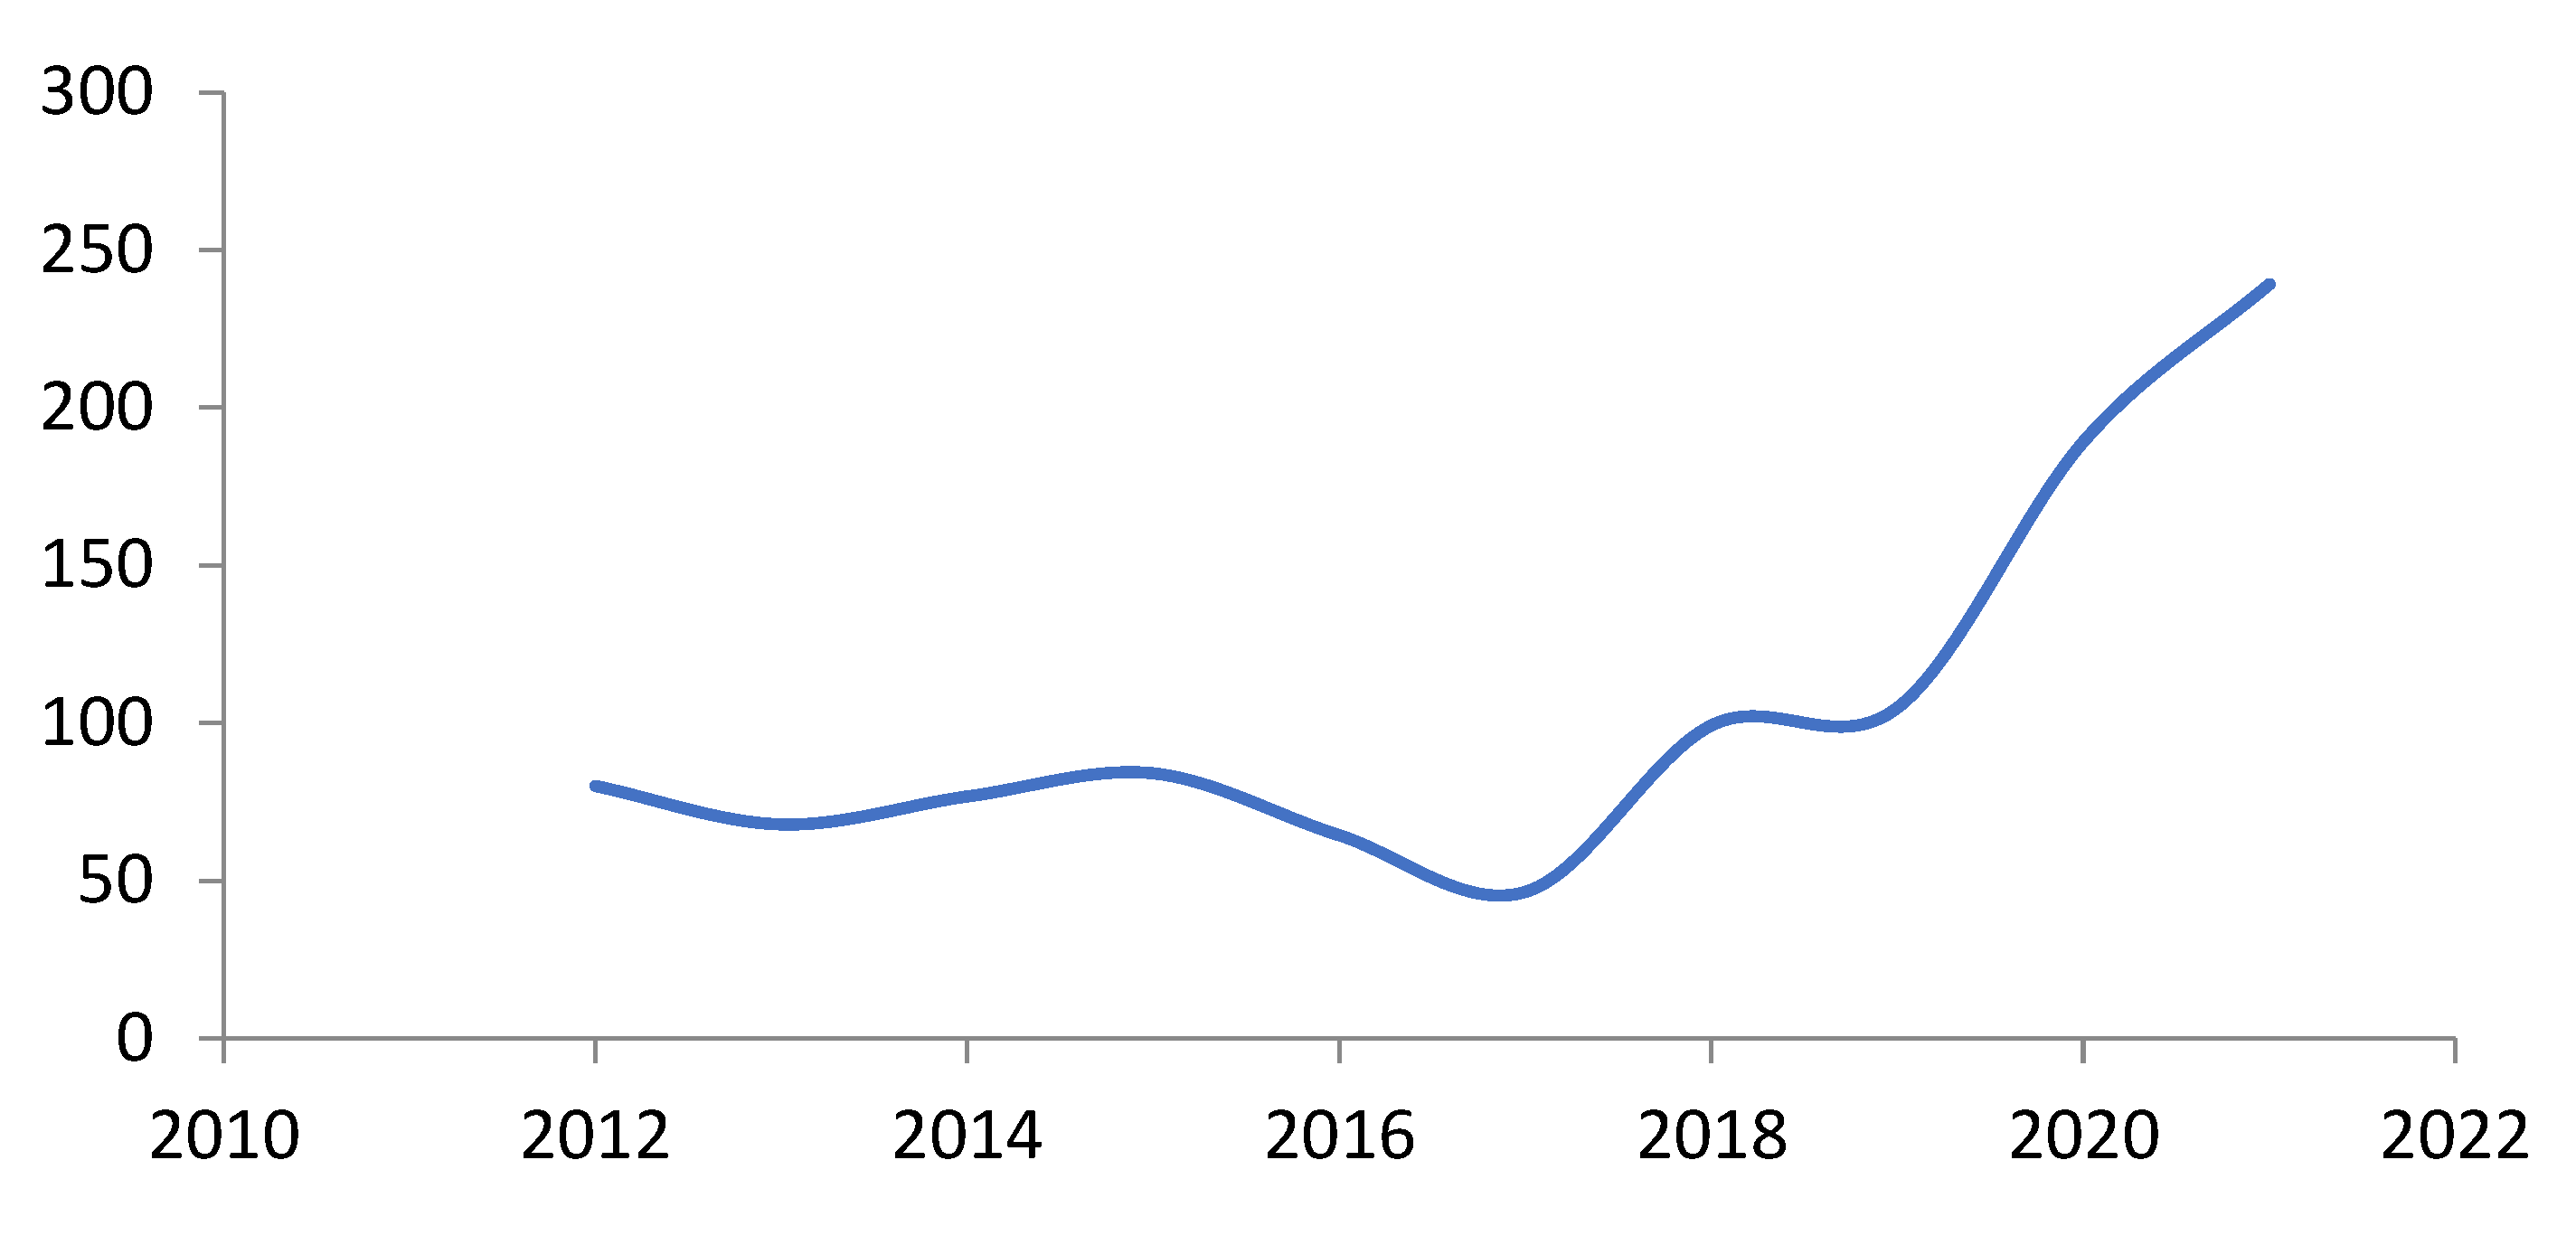
According to the Ecosystem Marketplace, the volume of CO
2 trading on the voluntary market is (
Figure 2).
We have seen a significant increase in the volume of voluntary trading in carbon units since 2017. Given the current trend towards decarbonization of their products, large enterprises will continue to support this trend in the future.
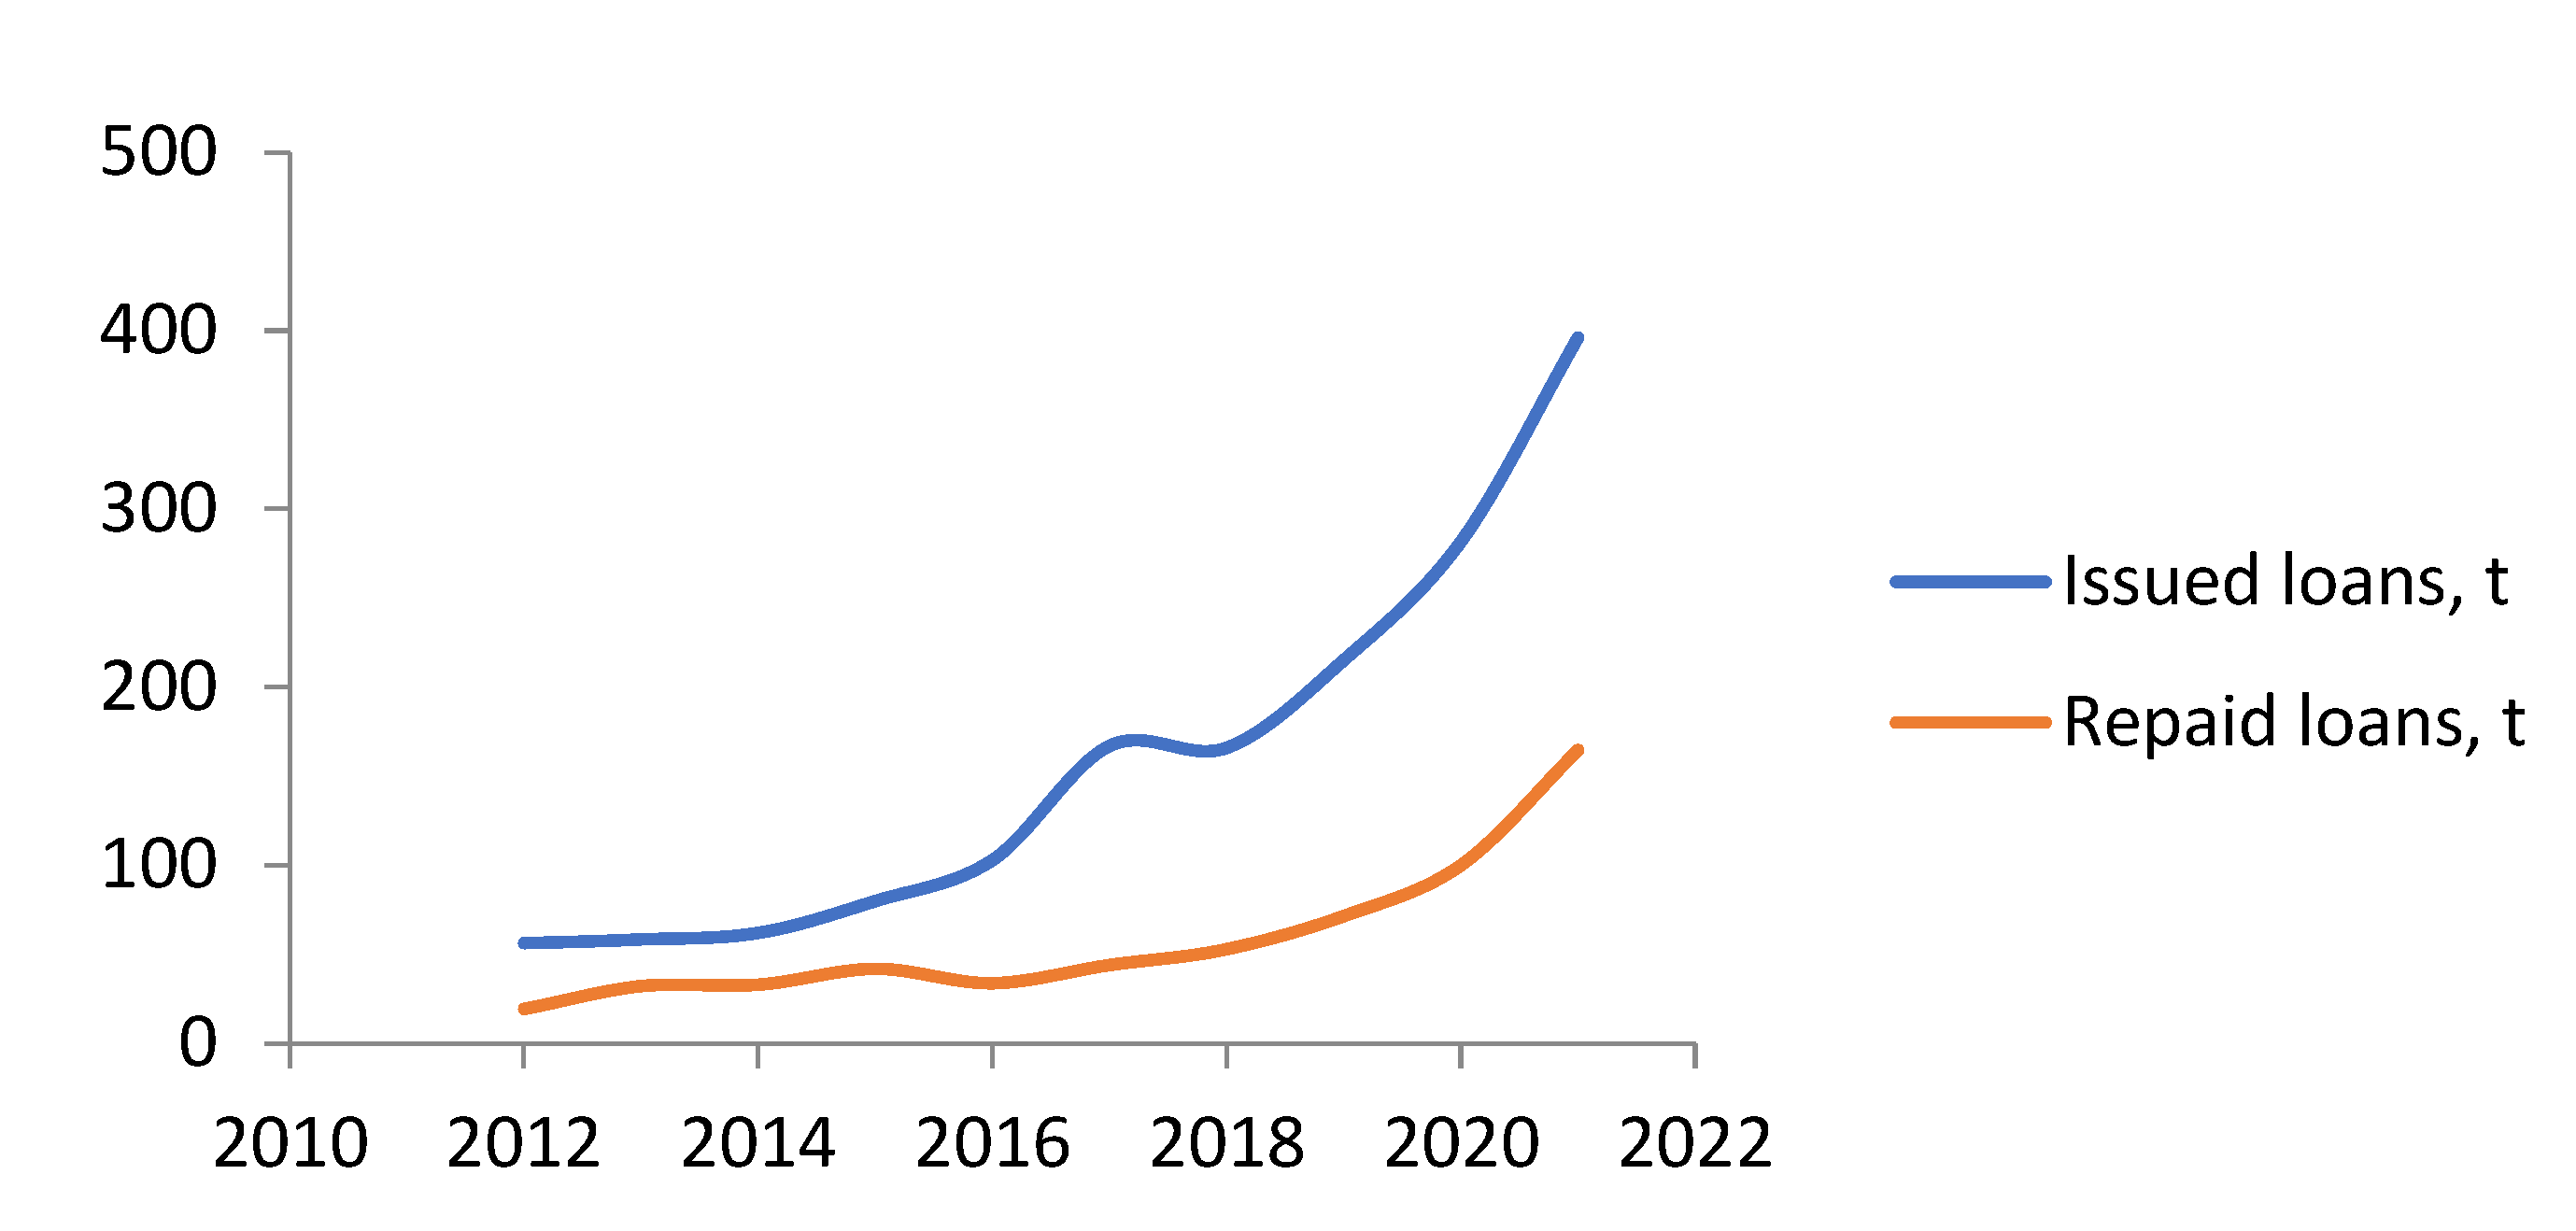
Issuance and repayment of carbon credits (independent and compliance standards) by year are from 2004 to present. Issuance and write-off of credits are reported by the American Carbon Registry (ACR), ART TREES, the Climate Action Reserve (CAR), California Air Resources Board (CARB), CDM (for credits issued after 2016), City Forest Credits, Climate Forward, Coalition for Rainforest Nations, EcoRegistry, Global Carbon Council, Gold Standard, Plan Vivo, ProClima and Verified Carbon Standard (VCS).
The world creates a turnover of carbon credits (carbon credits) using carbon credits. Carbon credits are permits for emissions into the atmosphere. Companies have quotas for emissions into the atmosphere, their dynamics is shown below (
Figure 3).
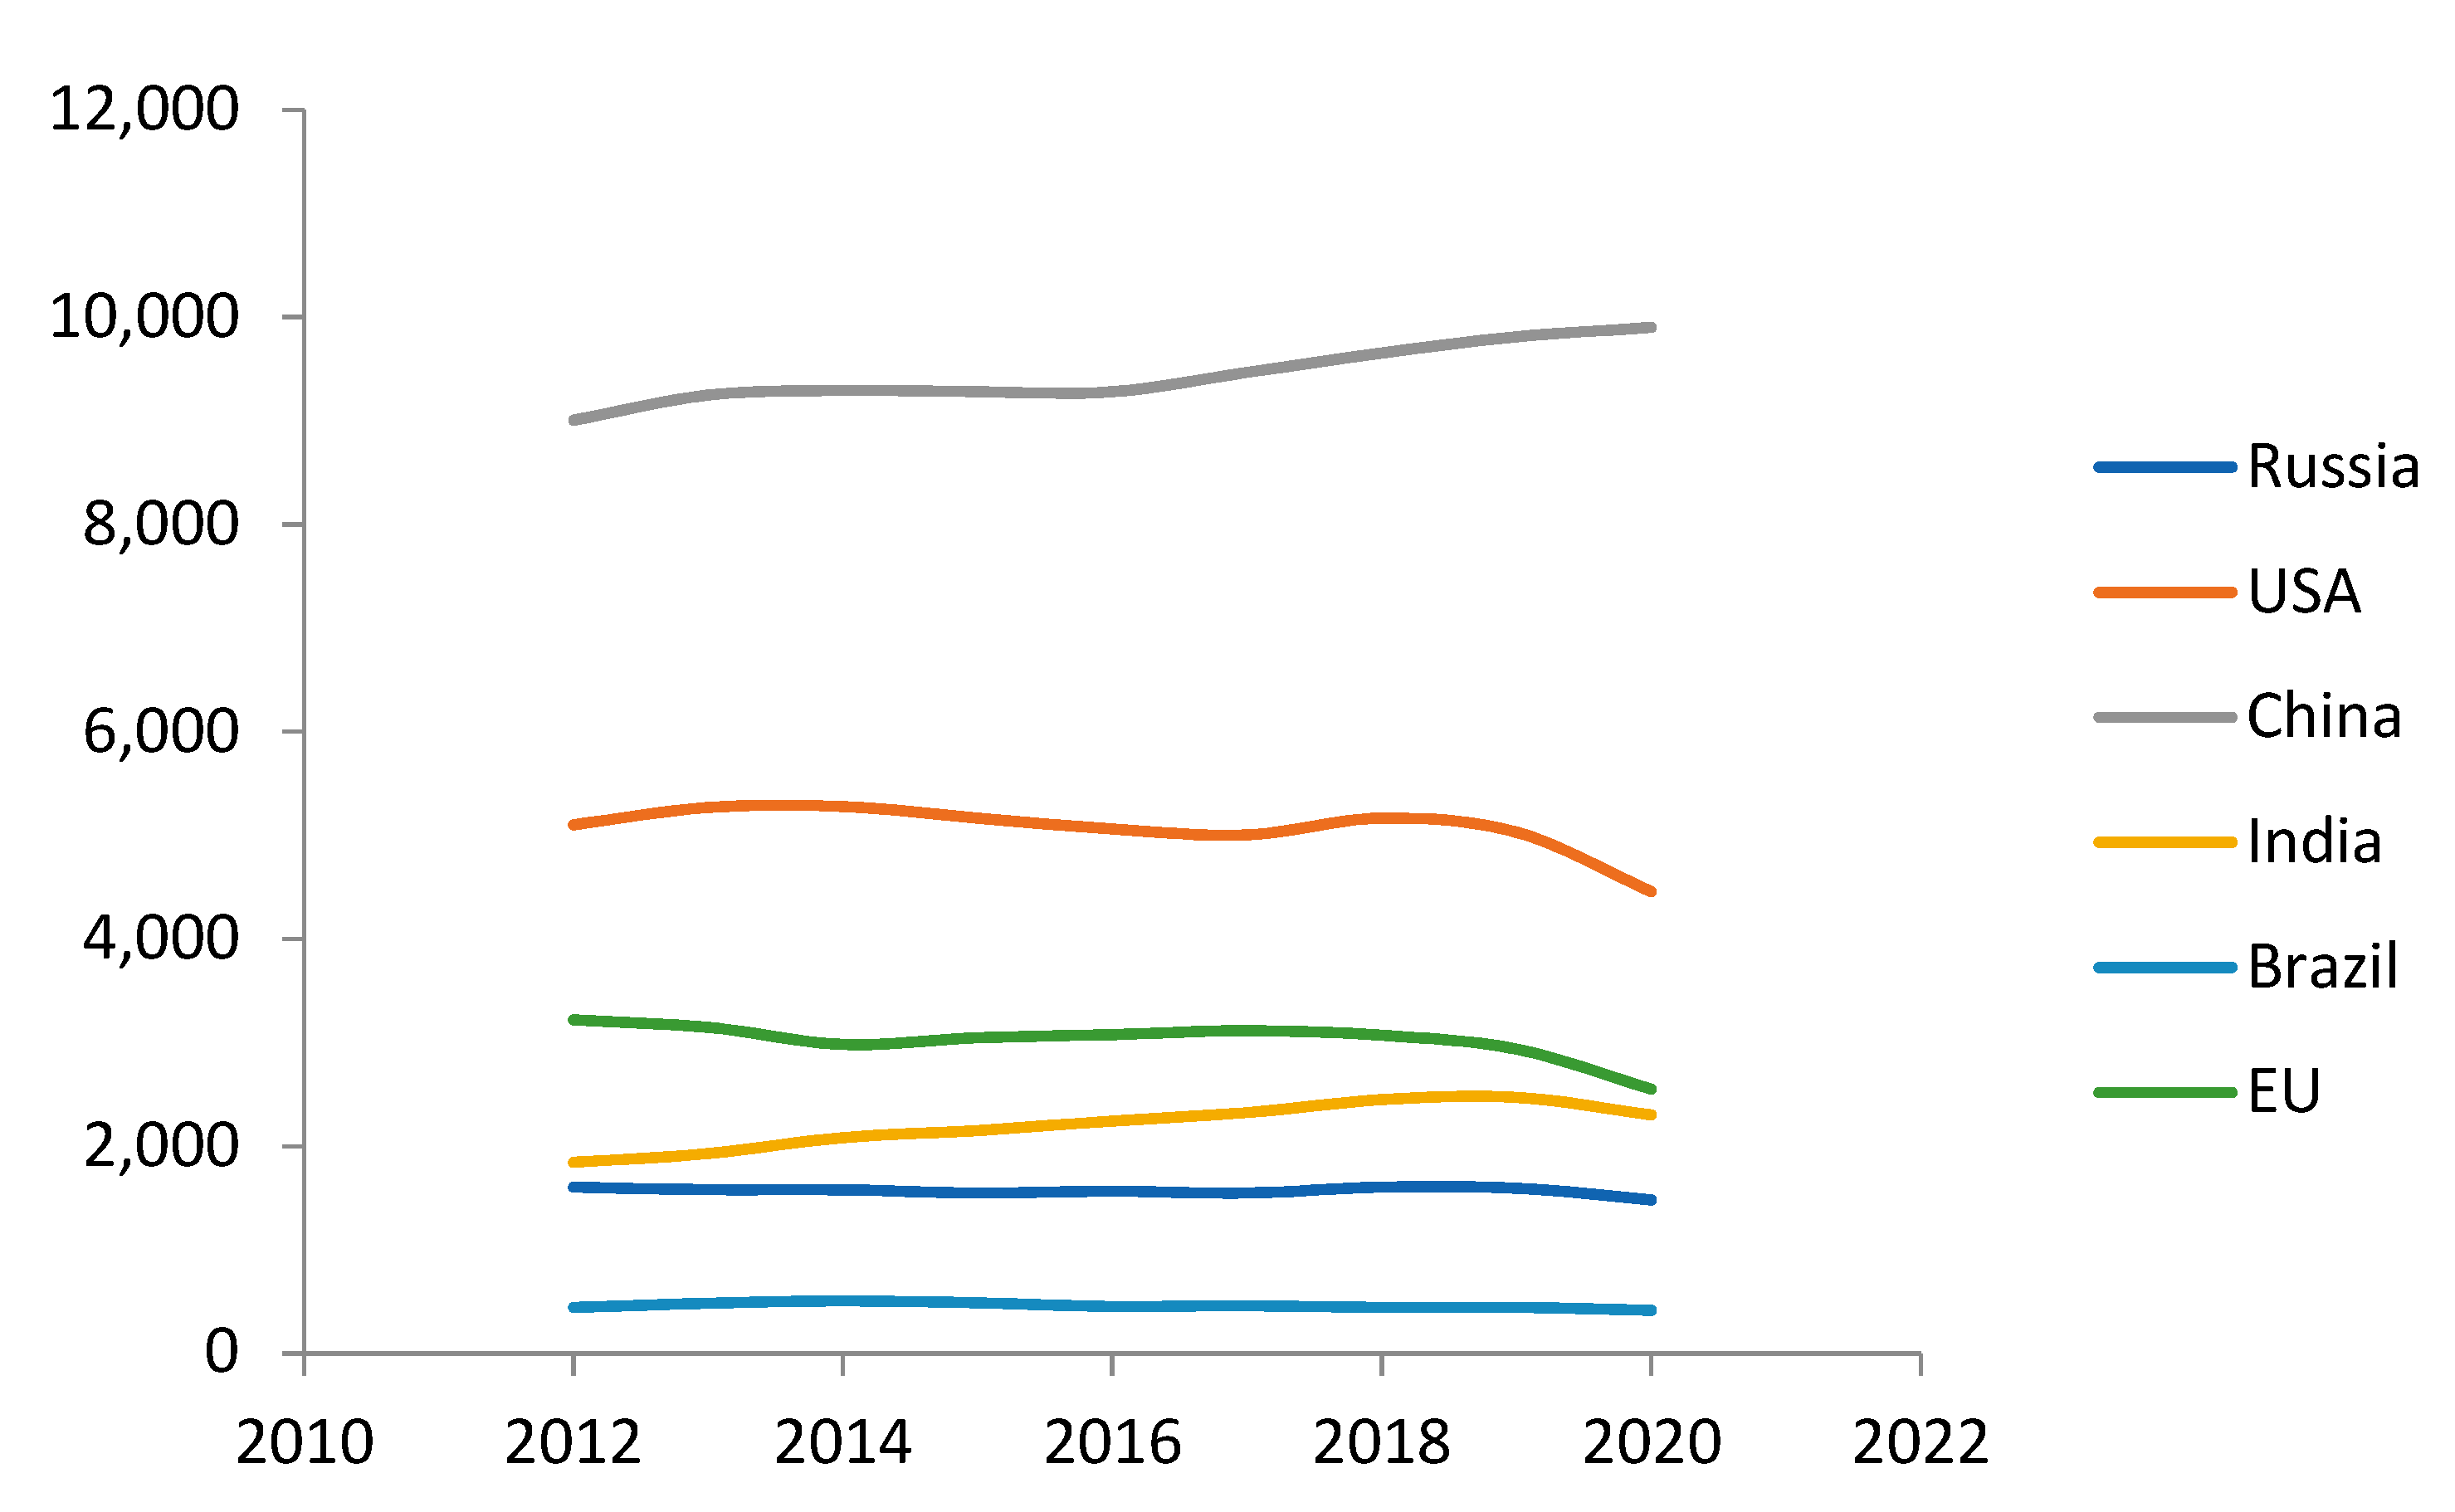
In order to evaluate the overall emissions market by leading manufacturing countries, as well as the global market, we present the following data according to a BP study (
Figure 4).
Using the example of the main countries with the highest CO2 emissions, we see that Russia is not the country with the highest carbon dioxide emissions, and China is the undisputed leader among polluting countries, followed by the USA and the countries of the European Union. At the same time, over the past 10 years, the dynamics of emissions of many countries has not changed, with the exception of the USA and the EU, which, as can be seen in the graph above, have been reducing their CO2 emissions since 2018. China, on the other hand, has been increasing carbon emissions since 2016. In Russia and other countries, a weak dynamics of emissions can be traced, we can say that the volume of emissions does not change.
The supply and supply prices of carbon unit futures in involuntary and regulated markets have a significant difference in value. This is due to the fact that, of course, companies, although they want to maintain the status of “green” and follow the principles of sustainable development, but at the same time, if possible, do not spend big money on maintaining such a status.
Below are the values of carbon units in the voluntary and regulated markets (
Table 8).
At the same time, the prices on the voluntary market in the period from 2016 to 2020 are in US dollars (
Table 9).
From the graphs above, in 2020, the cost of a carbon unit in Europe in 2020 is $6.1, and in the regulated market it is $68 as of 2021.
Russia is a party to the Paris Agreements of 12 December 2015 and the Kyoto Protocol of 4 November 2004. According to these documents, the countries participating in the agreements should strive to reduce anthropogenic greenhouse gas emissions, as well as create conditions for their capture and disposal. Create voluntary projects to achieve emission reduction goals. In order for the measurement of the amount of emissions to be comparable and the same in all countries, the so-called concept of a carbon unit is introduced, which is equivalent to one ton of CO2 emissions. Verification procedures are carried out and records are posted in special registers. The carbon unit is currently a universal instrument of legal relations related to greenhouse gas emissions. It is by verified carbon units that the existing carbon footprint is determined and reports are created.
To date, the circulation of carbon units takes place on voluntary and regulated markets in accordance with applicable international standards in the field of climate projects.
For the first time, the “emissions market” reached the international level in 2005 after the start of the Kyoto Protocol, which provides for the following regulatory mechanisms for the participating countries:
- -
greenhouse gas emissions trading.
- -
a mechanism that allows the acquisition of carbon units in case of successful implementation of environmentally friendly projects in developing countries (clean development).
- -
joint implementation of climate projects, as a result of which the resulting carbon units are distributed among the participants of such projects.
Up until 2012, Russia implemented about 108 environmentally friendly development projects on its territory, as a result of which about 300 million carbon units were put into circulation. After 2012, Russia has not used the existing mechanisms of the Kyoto Protocol.
In addition to the projects existing under the Kyoto Protocol, voluntary climate projects have become widespread. Thus, thanks to the implementation of such projects, about 1.2 billion carbon units have been introduced in the world, most of which fall on the international standards VCS (Verified Carbon Standard), which is usually applied simultaneously with the CCB standard (Climate, Community and Biodiversity Standards) and the GS standard (Gold Standard).
The implementation of climate projects and participation in voluntary national accounting and verification standards allow companies to demonstrate their commitment to sustainable development, in turn, the results of such projects can be used for their own corporate development, attracting investors and the production of carbon units.
At the current moment, Russia is facing certain problems in the implementation of environmentally friendly projects, since national systems for accounting and verification of carbon units have not yet been created. When creating national systems, an important factor is the compliance of such systems with international standards and accreditation abroad, otherwise Russian enterprises will not be able to operate carbon units on world markets.
The main purpose of the formation and implementation of the Russian system of verification of climate projects is to create mechanisms through which sustainable development in the field of ecology becomes possible, as well as attracting so-called “green” investments in the economy.
Important principles of the formation of the Russian system of climate projects are:
- -
recognition and implementation of standards according to voluntary international standards.
- -
transparency of the mechanism and exclusion of the possibility of double accounting of carbon units (for example, on the territory of the Russian Federation and on the territory of the EU).
- -
absence of corruption component (personal interest, conflict of interests) between verifiers of carbon units and companies participating in the implementation of projects.
- -
recognition of carbon units by the civil code, as well as all possible operations, contracts with their participation.
- -
the possibility of state incentives for the implementation of climate projects.
The main issues to be determined are the definition of the tax base and the system of tax calculation. The tax base of the mineral extraction tax according to Article 338 of the Tax Code of the Russian Federation [
20] can be defined as the value of extracted minerals, or as the amount of extracted minerals in kind. For greenhouse gas emissions, the tax base is applied as the number of tons of carbon dioxide equivalent emissions. The next even more significant issue is the tax rate. Since the tax base is calculated as the amount of CO
2 emissions, interest rates on the cost will not be suitable for calculation.
The basis for calculating the MET rate for natural gas production is clause 11 clause 2 of Article 342 of the Tax Code of the Russian Federation.
According to the Tax Code of the Russian Federation, the MET rate for natural gas production is calculated as:
where
NS—the basic tax rate equal to 35 rubles per 1000 cubic meters of gas.
Eut—a unit of conventional fuel.
Cs is a coefficient that characterizes the complexity of mining.
Tg is an indicator that characterizes the costs of transporting combustible gas.
The proposed calculation formula has some similarities with the calculation of the MET rate.
The rate for emissions of 1 ton of CO
2-eq.
where
BNS is the basic tax rate, which is approved by law.
Eug—a unit of conditional equivalent.
Kk is the coefficient characterizing the component composition of the gas.
Eug is determined by the following formula:
where
Cevr—the average price of futures on European regulated markets for carbon units.
Devr—the share of products supplied to the European market.
Csrv is the average price of carbon units for the period in the international voluntary markets Verified Carbon Standard (VCS) and China GHG Voluntary Emission Reduction Program.
P—the average exchange rate of the US dollar to the ruble for the billing period.
For example, we will calculate the cost of 1 ton of CO2-eq emissions.
As the value of the base tax rate, we take the 2000 rubles available in the draft regulatory documents for 1 ton of emissions.
The value of the methane content in the emissions will be taken to calculate the following: up to 1%—the value of Kks = 1, the methane content up to 5%—Kks = 1.3, the methane content over 5%—a coefficient of 1.5.
To calculate, we will take the average European price of futures for carbon units of 70 US dollars, the share of exported products to the European Union countries of 40%, the average price of carbon units on the voluntary market of 10%, the exchange rate is 100 rubles per US dollar.
With the accepted macroparameters, we obtain a coefficient of Eug = 1.19.
In total, the tax rate on CO2 emissions is equal to 2000 × 1.19 × 1 = 2380 for greenhouse gas emissions with a methane content of up to 1%, 3094 for emissions with a methane content of up to 5%, 3570 for emissions with a methane content of over 5%.
The proposed formula is more elastic, since it allows taking into account the share of exported products, world quotations for carbon units, the ruble exchange rate, the component composition of emissions. Taking into account the proposed formula will stimulate supply in the domestic market, as well as provide additional revenues to the budget of the budgetary system.
Thus, having studied the available information on the effect of carbon units on the world stage, the state should work out in detail and carefully the issue of verification and accounting of carbon units. Because in any case, in addition to voluntary standards, the countries participating in the Paris Agreements, in particular the countries of the European Union, will introduce national mechanisms to regulate the carbon footprint, and charge an additional tax on products that produced carbon dioxide emissions. All this will lead to significant additional revenues to the budget. However, the existing draft laws provide for the possibility of mutual accounting of carbon units with countries where verification of carbon units takes place according to accepted international standards. Thus, Russia has a chance to receive additional substantial budget revenues due to the carbon tax. Additionally, an important area for attracting investments is the possibility of attracting so-called “green” investments, which are aimed at implementing environmentally friendly projects. The participation of companies in improving the environmental friendliness of their products and reducing greenhouse gas emissions can provide a significant boost to the development of the economy. When determining the taxation mechanism, it is important to take into account the specifics of greenhouse gas emissions, namely the content of methane and other related gases. Taxation needs to be made flexible and understandable for businesses, taking into account global carbon unit futures quotes, including quotes on mandatory payments in the European Union, as well as quotes on voluntary global carbon unit markets. Different quotes should be taken into account, since there is a significant difference in the value of futures on regulated and voluntary markets. It is also necessary to take into account the share of exported products with the help of appropriate coefficients, which will help support the supply in the domestic market.


 ,
, 


