Abstract
The rubber ring is an essential component of high-pressure hydrogen storage systems. However, the fretting damage can lead to the seal failure of the rubber ring, which may cause hydrogen leakage. Rubber X-ring has been proven to own excellent static sealing performance, while its fretting characteristics under high-pressure hydrogen remain unclear. In this study, a numerical model is developed to explore the fretting characteristics of the X-ring combined seal, in which the effect of hydrogen swelling is well considered. The stress distribution of the fretting seal and the effects of fretting amplitude, friction coefficient, hydrogen pressure, and pre-compression ratio on the fretting behavior of the X-ring are investigated. Moreover, the similarities and differences in the fretting performance of X-ring and O-ring under high-pressure hydrogen are discussed. It is shown that the evolution of the stress concentration zone inside the X-ring is closely linked to the cover’s drag direction and the wedge-ring’s blocking action. The X-ring enters the fretting cycle earlier with increased fretting amplitude, whereas the fretting period remains unchanged. Furthermore, increasing the hydrogen pressure and pre-compression ratio could enhance the fretting sealing performance. The friction coefficient and hydrogen pressure increase the possibility of failure due to cracks or elasticity. The fretting characteristics of the X-ring are superior to those of the O-ring, denoting that X-ring may be an alternative to the O-ring in the fretting seal structure. This work is of theoretical importance for the quantitative evaluation and reliable prevention of fretting damage to rubber rings and improving the safety of high-pressure hydrogen storage systems.
1. Introduction
Hydrogen storage is mainly divided into three types: gaseous hydrogen storage, liquid hydrogen storage, and solid hydrogen storage [1,2,3]. High-pressure gaseous hydrogen storage is the most widely used method [4,5]. Rubber O-ring is a reliable seal in high-pressure hydrogen storage systems because of its unique merits of low manufacturing cost and good sealing performance [6]. Nonetheless, some drawbacks limit its application (e.g., longitudinal twisting and spiral failure) [7]. Therefore, it is urgent to develop new shapes of rubber rings with a superb performance to meet application requirements. Under this consideration, a rubber X-ring with a four-lobed seal is well designed to improve seal lubrication. It is better suited for efficiently sealing high-pressure fluids in static applications [8], with numerous irreplaceable advantages over O-ring, including a lower friction coefficient and better torsion resistance [9]. Furthermore, our group’s [10] investigation of the static sealing behavior of the X-ring exposed to gaseous hydrogen shows that the X-ring has a higher contact pressure than the O-ring under 0–100 MPa. It suggests the feasibility of X-ring replacing O-ring in static seal structure.
Although X-ring shows slightly better performance in the static seal, the non-uniform distribution stress of the X-ring due to fretting may lead to seal failure, resulting in hydrogen leakage in gaseous hydrogen storage [11]. Worse still, previous studies pay much attention to the fretting behavior of the O-ring [12,13,14,15,16,17,18] and the static sealing performance of the X-ring [7,10,19]. However, the fretting characteristics of the X-ring are rarely reported. Liu et al. [20] conclude that the rubber X-ring is subject to tremendous Mises stress in the fretting seal than in the static seal. Nevertheless, the current studies are restricted to the fretting behavior of X-ring in a low-pressure (less than 15 MPa) environment. More importantly, the rubber X-ring is exposed to high-pressure (up to 35 MPa) hydrogen, and the swelling caused by the solute hydrogen may strongly affect the fretting sealing characteristics of the X-ring, even resulting in seal failure [18]. Therefore, the swelling behavior of the X-ring is non-ignorable when studying the fretting characteristics. Unfortunately, reports on the fretting performance of rubber X-rings exposed to high-pressure hydrogen concerning the swelling effect are scarce. The influence of critical parameters on fretting behavior under high-pressure hydrogen remains unclear. Besides, it has not been confirmed whether the fretting characteristics of the X-ring are also superior to O-ring under high-pressure hydrogen.
Herein, a finite element analysis (FEA) model considering the swelling due to dissolved hydrogen is developed to investigate the fretting characteristics of the rubber X-ring combined seal used for high-pressure hydrogen storage vessels. The stress distribution of the fretting seal and the effects of critical parameters (fretting amplitude (Af), friction coefficient (Cf), hydrogen pressure (Ph), and pre-compression ratio (Rp)) on the fretting behavior of the combined seal structure are further analyzed. Furthermore, the similarities and differences in the fretting performance of X-ring and O-ring under high-pressure hydrogen are explored.
2. Theoretical Equations
2.1. Hydrogen Diffusion Equation
According to Fick’s second law, the governing equation for hydrogen diffusion in rubber materials can be expressed as [21]:
where , and refers to the time derivative, the hydrogen diffusion coefficient, and the hydrogen content, respectively.
2.2. Mechanical Equation
Rubber can be modeled as a kind of incompressible hyperelastic material that deforms under the action of external force. In this paper, the Mooney-Rivlin model with double parameters is adopted to describe the hyperelastic characteristics of rubber X-ring. The function can be expressed as follows [22]:
where is the strain energy density, , , are Mooney-Rivlin coefficients, and and are the first and second strain tensor invariants, respectively.
The hydrogen-induced strain should be taken into account in the hydrogen environment. Then the overall strain can be expressed as [23]:
where , , and denote the overall strain, the hyperelastic strain, and the strain induced by hydrogen swelling, respectively. Since the relationship between the increase in volume by swelling and the hydrogen content is linear [24], can be written as follows:
where , , and represent the change in hydrogen content, the proportional coefficient, and Kronecker’s delta, respectively.
3. Finite Element Model
3.1. Geometric Construction
Figure 1 reflects the cross-section of the seal component. It consists of an X-ring and a wedge-ring. The X-ring is installed in the groove and compressed along the x-axis by the cover. The wedge-ring is used to prevent the rubber X-ring from extruding through a gap between the groove and the cover. The seal structure is designed in this way to avoid the leakage of hydrogen.
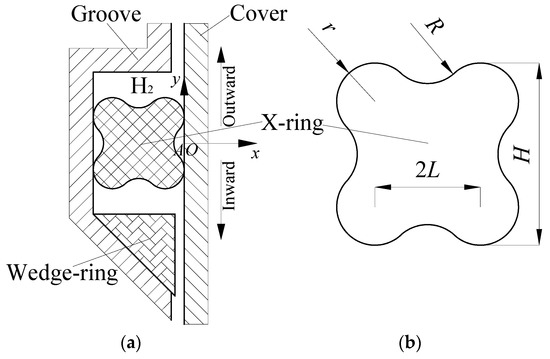
Figure 1.
Details of the seal component. (a) Schematic of the rubber X-ring seal structure; (b) Geometric parameters of X-ring.
The cross-section height and the four-lobed radius of the X-ring are set to 5.7 mm and 1.0 mm, respectively. The relationship between the various basic geometric parameters of an X-ring can be expressed as follows [8]:
where , , and are four variables defined in Figure 1b.
3.2. Model Assumptions
The following assumptions are used in the analysis to simplify the numerical model:
(1) A 2D axisymmetric model is performed regarding the axisymmetric feature of this combined seal structure.
(2) Since the elastic modulus of rubber material is far lower than steel’s, the groove and cover are considered rigid bodies.
3.3. Model Set-Up
3.3.1. Meshing
As the groove and cover can be treated as a rigid body, there is no need to mesh them. Therefore, the solution process can be simplified by meshing only the rubber X-ring and wedge-ring. Rubber is a hyperelastic material and approximately incompressible, so the axisymmetric hybrid elements with mixed formulation are applied in meshing the X-ring. The wedge-ring is meshed with reduced-integration axisymmetric elements. The mesh model is illustrated in Figure 2.
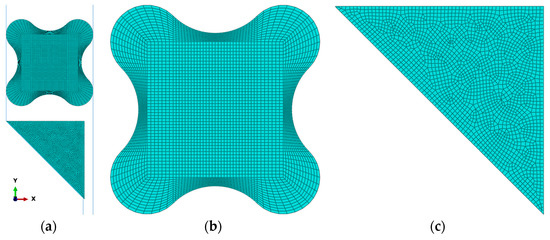
Figure 2.
The FEA model of the combined seal. (a) General view; (b) Partial view of X-ring; (c) Partial of wedge-ring.
3.3.2. Material Properties
The material of the X-ring is selected as ethylene propylene diene monomer (EPDM), which is widely used for sealing in high-pressure hydrogen systems. The Mooney-Rivlin coefficients (, , ) of the X-ring are obtained based on the experimental data performed in hydrogen at a pressure of 35 MPa [24]. It is found that the hydrogen swelling hardly changes both the tensile strength and elastic modulus of this material. As the experiment [24] manifests, the volume increase of this EPDM material in 35 MPa hydrogen is about 7%, can be set as 0.07. Additionally, the wedge-ring is made of polyether ether ketone material, and the true stress-strain relationship is adopted.
3.3.3. Load and Boundary Conditions
This simulation develops five contact pairs among the parts (X-ring, wedge-ring, groove, and cover). The node-to-surface contact type is conducted, and the penalty contact model with Coulomb friction formulation is employed. The Cf between the contact surfaces is 0.05 [25]. Five load steps are set as follows:
- (1)
- Firstly, the designed pre-compression along the x-axis is performed on the cover to achieve the installation of this seal component. The Rp of the X-ring is 10%.
- (2)
- Secondly, the Ph (35 MPa) is gradually applied on the working surface of the X-ring, where it is exposed to hydrogen.
- (3)
- Thirdly, the hydrogen transport at a steady state is conducted in this step.
- (4)
- Based on the distribution of hydrogen content in the third step, the strain induced by hydrogen swelling can be acquired. Then the stress field relating to the swelling effect can be calculated.
- (5)
- The reciprocating motion along the y-axis with Af (1.2 mm) is exerted on the cover to simulate the fretting process.
An entire cycle of the fretting process includes both inward and outward strokes. Take the first fretting period (0–1 T) as an example: the cover at the origin (0 T)—along the negative direction of the y-axis (−y) to the lowest point (0.25 T)—along the positive direction of the y-axis (+y) to the origin (0.5 T)—along +y to the highest point (0.75 T)—along −y to the origin (1 T). 0–0.5 T is called inward stroke, and 0.5–1 T is called outward stroke.
3.4. Model Validation
A comparison with theoretical calculations and similar simulations is conducted to validate the accuracy of numerical models and simulation results.
A comparison with the results of theoretical calculation is conducted first. The peak contact pressure of the X-ring under Ph can be obtained [20]:
where is the peak contact pressure of the X-ring under certain Ph, is the peak contact pressure of the X-ring in the pre-compression state, and is the linear scaling factor of contact pressure to Ph. The theoretical value of can be obtained [20]:
where is the Poisson’s ratio of the rubber material and equal to 0.05 [20]. Thus, is equal to 1.
In the model validation process, Ph of 25, 30, 35, 40, and 45 MPa are selected. The and are extracted in FEA. Theoretical calculation results and FEA results of linear scaling factor are shown in Table 1, which is obtained by Equations (7) and (8). It can be seen from Table 1 that the maximum deviation is 7.30%. Therefore, the deviation between the theoretical calculation and FEA results is minimal, which verifies that the FEA results are reliable.

Table 1.
Theoretical and FEA results of the linear scaling factor.
Then a comparison with similar simulations is conducted. Liu et al. [20] analyze the fretting sealing performance of rubber X-rings based on FEA. In the main parts of their paper, the X-ring is made of rubber material, the Mooney-Rivlin two-parameter method is selected as the constitutive model, and the cover and groove are modeled with a displacement boundary condition. Similarly, the same method is adopted in this paper. Although this paper additionally considers the effect of the swelling due to dissolved hydrogen, the accuracy of the simulation results can be indirectly verified by the study of Liu et al. [20].
4. Results and Discussion
The contact pressure on the contact surface between the rubber ring and the cover and the Mises stress inside the rubber ring are essential indicators of the fretting characteristics of the rubber ring. Hydrogen leakage will occur in the combined seal structure when the peak contact pressure is less than the Ph [10]. Besides, the possibility of crack or elasticity loss in the rubber ring increases with Mises stress [26]. Therefore, a focus on the contact pressure and Mises stress will be conducted to analyze the fretting characteristics of the X-ring in this work.
4.1. Stress Distribution of Fretting Seal
The X-ring’s stress distribution and variation rule can be directly reflected by the contact pressure corresponding to the continuous node elements of the contact surface between the X-ring and cover and the Mises stress distribution diagram of the X-ring. The distribution of contact pressure and Mises stress of the X-ring during the first two fretting periods (0–2 T) will be investigated in this section. The Af is 1.2 mm, the Cf is 0.05, the Ph is 35 MPa, and the Rp is 10%.
Figure 3 and Figure 4 show contact pressure distribution corresponding to the continuous node elements on the contact surface between the X-ring and the cover during 0–1 T and the second fretting period (1–2 T), respectively. At any location during 0–2 T, there are two continuous segments of node elements with contact pressure higher than Ph (35 MPa), signifying that the X-ring can function as a seal in the fretting seal structure. It is worth mentioning that the peak contact pressures for 0.25 T, 1 T, 1.25 T, and 2 T are almost identical, and for 0.5 T, 0.75 T, 1.5 T, and 1.75 T, as will be elaborated below.
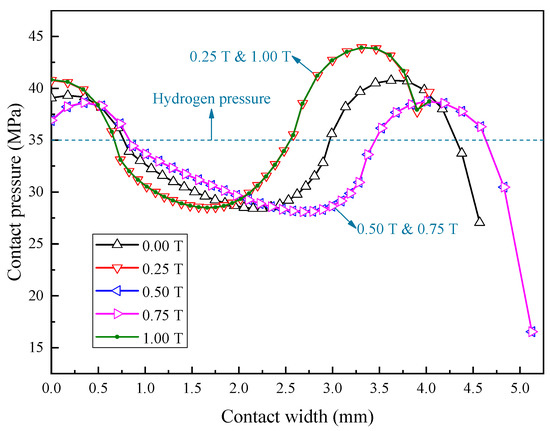
Figure 3.
Contact pressure distribution during 0–1 T.
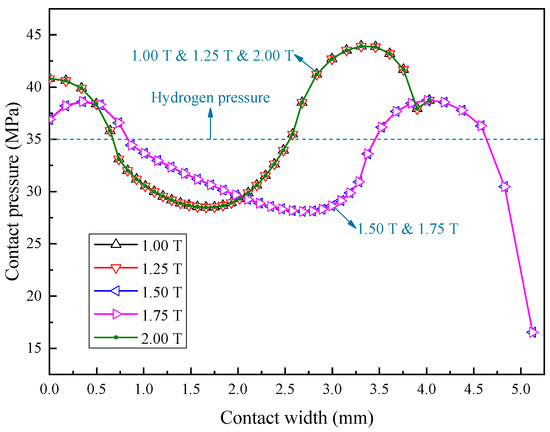
Figure 4.
Contact pressure distribution during 1–2 T.
Figure 5 displays the Mises stress distribution of the X-ring during 0–2 T. At 0 T, the Mises stress is symmetrically distributed. There are grain-shaped stress concentration zones in the X-ring’s lower left and right corners. The peak Mises stress is located in the lower right corner of the X-ring, and the height of the upper left and right sealing lip (h0 and h1) of the X-ring is the same. Starting at 0.25 T, the Mises stress of the X-ring is no longer symmetrically distributed. During 0–0.25 T, the cover moves along −y, generating −y friction on the X-ring. Depending on the friction, the cover drags the X-ring to move together along −y. Due to the dragging effect of the cover, the upper right sealing lip of the X-ring moves down slightly, and the angle between the stress concentration zone in the lower right corner of the X-ring and the upper surface of the wedge-ring (θ2) decreases slightly. As the wedge-ring firmly blocks the X-ring, the −y displacement of the area in the lower right corner of the X-ring is 0. Since the rubber material is approximately incompressible, the area in the lower right corner of the X-ring is squeezed by the upper area, resulting in a significant increase in the Mises stress values of the stress concentration zone in the lower right corner.
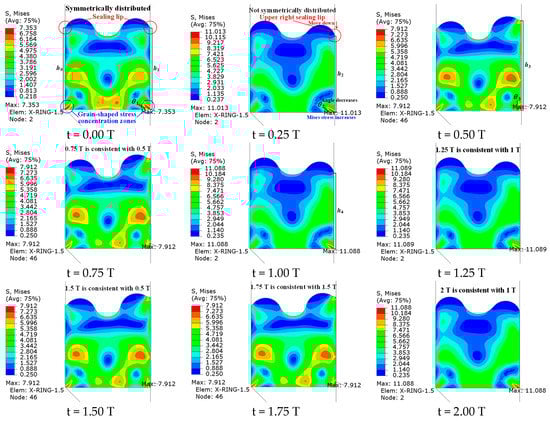
Figure 5.
Mises stress distribution during 0–2 T. In 0.25–0.5 T, the cover moves along +y, creating +y friction on the X-ring and dragging the X-ring to move together along +y. As the X-ring moves upward, the height increment of the upper right sealing lip during 0.25–0.5 T (h3−h2) exceeds the height reduction during 0–0.25 T (h1−h2) due to the weakening of the blocking effect of the wedge-ring. Accordingly, the height of the upper right sealing lip at 0.5 T (h3) is significantly higher than the initial height at 0 T (h1). At the same time, due to the weakening of the blocking effect of the wedge-ring, the angle increment of the lower right stress concentration zone with the upper surface of the wedge-ring during 0.25–0.5 T (θ3−θ2) exceeds the angle reduction during 0–0.25 T (θ1−θ2). Therefore, at 0.5 T, the angle between the grain-shaped stress concentration zone in the lower right corner and the upper surface of the wedge-ring (θ3) is substantially more significant than the initial angle at 0 T (θ1). Consequently, the grain-shaped stress concentration zone is almost close to the surface of the cover.
Mises stress distribution at 0.75 T is consistent with that at 0.5 T, meaning that the fretting of the X-ring is in the gross slip region during 0.5–0.75 T. In this process, the cover moves along +y, the X-ring stops motionless, and the relative slip is generated in X-ring and cover. Accordingly, it is speculated that the X-ring fretting starts to run in the gross slip region at a specific location of 0.25–0.5 T. The following section will discuss the critical fretting displacement into the gross slip region. It can be preliminarily determined that the critical fretting displacement into the gross slip region is less than or equal to 1.2 mm. Consequently, the height reduction of the upper right sealing lip (h1−h2) and the angle reduction of the lower right stress concentration zone with the upper surface of the wedge-ring (θ1−θ2) during 0–0.25 T, and the height increment of the upper right sealing lip (h3−h2) and the angle increment of the lower right stress concentration zone with the upper surface of the wedge-ring (θ3−θ2) during 0.25–0.5 T, have reached the limit value during the corresponding fretting stage. The influence of the wedge-ring’ blocking effect on the X-ring’s fretting characteristics is further verified.
In 0.75–1 T, the cover moves along −y, produces a −y friction on the X-ring, and drags the X-ring to move together along −y. At 1 T, the fretting is already in the gross slip region. Consequently, the height of the upper right sealing lip (h4) and the Mises stress value in the lower right corner of the X-ring at 1 T are similar to those at 0.25 T. During 1–1.25 T, the Mises stress distribution of 1.25 T is consistent with that of 1 T because the fretting is still in the gross slip region. During 1.25–1.5 T, the Mises stress distribution of 1.5 T is consistent with that of 0.5 T, as both 0.25 T and 1.25 T are the limit locations of the inward stroke. It can be inferred that the Mises stress distribution of 1.75 T is consistent with that of 0.75 T and 1.5 T. The Mises stress distribution of 2 T is uniform with that of 1 T. These inferences can be verified by the Mises stress patterns in Figure 5 and the contact pressure distribution in Figure 3 and Figure 4.
In summary, the X-ring can play a sealing role in the fretting seal structure. The Mises stress is asymmetrically distributed during fretting. The peak Mises stress is consistently located in the stress concentration zone in the lower right corner of the X-ring. The variation tendency of the angle between the stress concentration zone in the lower right corner of the X-ring and the upper surface of the wedge-ring and the height of the upper right sealing lip of the X-ring are directly affected by the drag direction of the cover. The variation quantity of this angle and height are directly affected by the blocking effect of the wedge-ring. When the fretting displacement is large enough (such as ≥1.2 mm), the fretting of the X-ring runs in the gross slip region, and the fretting cycle starts at 0.5 T with a period of 1 T.
4.2. Effect of Fretting Amplitude
Af directly affects the fretting region of the rubber ring. With the increase of Af, the fretting of rubber O-ring runs in the sticking region, the mixed slip region, and the gross slip region successively [18]. This section will further verify whether this rule also applies to X-ring. In addition, as described in the previous section, when the Af is 1.2 mm, the fretting cycle starts from 0.5 T. Whether there is a similar rule when the Af is more minor will be discussed in this section. The influence of Af on the fretting characteristics of X-ring will be explored in this section. The Cf is 0.05, the Ph is 35 MPa, and the Rp is 10%.
Figure 6 manifests the relationship between the peak Mises stress of the X-ring and Af during 1–2 T. The peak Mises stress of 1 T and 2 T is always equal, verifying the reciprocating periodicity of the X-ring fretting seal with a period of 1 T. Furthermore, when the Af increases from 0.1 mm to 0.4 mm, the peak Mises stress of 1 T, 1.25 T, and 2 T increases sharply, and the peak Mises stress of 1.5 T and 1.75 T increases slightly, representing that the fretting runs in the sticking region. When the Af increases from 0.4 mm to 1.2 mm, the peak Mises stress at all locations increases slowly, denoting that the fretting runs in the mixed slip region. When the Af increases from 1.2 mm to 2 mm, the peak Mises stress at all locations does not change, indicating that fretting runs in the gross slip region. It can be concluded that the critical fretting displacement of the X-ring running into the mixed slip region is 0.4 mm, and that of the X-ring running into the gross slip region is 1.2 mm. Moreover, the peak Mises stress of the X-ring running in the gross slip region is equal at 1 T, 1.25 T, and 2 T, and at 1.5 T and 1.75 T. This rule is in complete agreement with the peak Mises stress variation rule in Section 4.1.
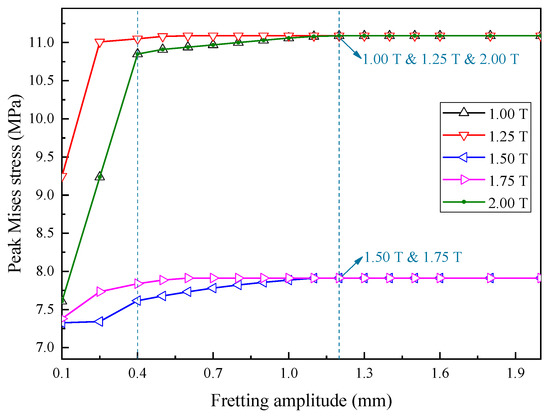
Figure 6.
Relationship between peak Mises stress and Af during 1–2 T.
When the fretting displacement is less than 0.4 mm, the fretting runs in the sticking region. To further clarify the influence of Af on the fretting characteristics of the X-ring, it is urgent to compare the fretting periodicity of the X-ring running in the sticking and gross slip regions. The X-ring’s change of the peak contact pressure and the peak Mises stress (collectively referred to as “peak stress”) during 0–3 T are investigated when Af is 0.2 mm, as shown in Figure 7. At 0.75 T, the peak stress of the X-ring begins to change periodically with a period of 1 T. During each fretting period, taking 0.75–1.75 T as an example, the peak stress values of adjacent locations are different, which further verifies that the X-ring runs in the sticking region when the Af is 0.2 mm.
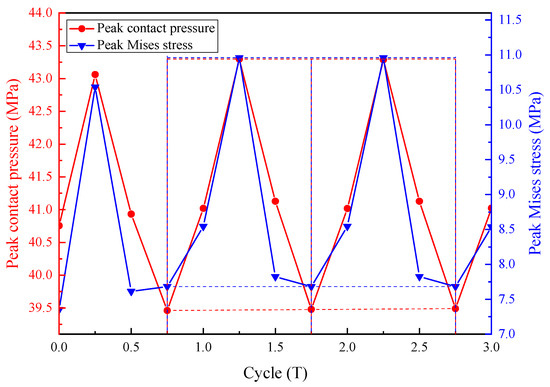
Figure 7.
The peak contact pressure and peak Mises stress changes during 0–3 T (Af = 0.2 mm).
Additionally, Figure 8 reflects the change in the peak stress of the X-ring during 0–3 T when Af is 1.2 mm. At 0.5 T, the peak stress of the X-ring begins to change periodically with a period of 1 T. During each fretting period, taking 0.5–1.5 T as an example, the peak stress of 0.5 T is equal to 0.75 T. During 0.75–1 T, the peak stress increases significantly. The peak stress of 1.25 T equals that of 1 T. During 1.25–1.5 T, the peak stress decreases substantially. Eventually, the peak stress of 1.5 T equals the peak stress of 0.5 T. These rules are entirely consistent with the peak Mises stress variation rule in Section 4.1.
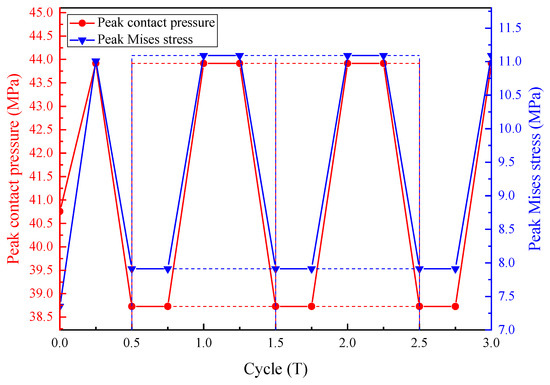
Figure 8.
The peak contact pressure and peak Mises stress changes during 0–3 T (Af = 1.2 mm).
In conclusion, when the Af increases from 0 mm to 2 mm, the fretting of the X-ring runs in the sticking region, the mixed slip region, and the gross slip region successively. The critical fretting displacements into the mixed slip region and the gross slip region for the inward and outward strokes are all the same, 0.4 mm and 1.2 mm, respectively. The larger the Af is within a specific range, the earlier the X-ring enters the fretting cycle. The fretting period of the X-ring is not affected by the Af and always remains 1 T.
4.3. Effect of Friction Coefficient
The Cf directly affects the contact surface friction between the X-ring and cover. As the Cf increases, so does the friction, which in turn aggravates the surface damage of the X-ring, thus worsening the fretting performance of the X-ring and reducing the service life of the combined seal structure. The influence of Cf on the fretting characteristics of X-ring will be investigated in this section. The Af is 1.2 mm, the Ph is 35 MPa, and the Rp is 10%.
Figure 9 demonstrates the relationship between the peak contact pressure of the X-ring and Cf during 1–2 T. When the Cf increases from 0.03 to 0.07, the peak contact pressure of 1 T, 1.25 T, and 2 T increases significantly. In comparison, the peak contact pressure of 1.5 T and 1.75 T decreases substantially. The main reason is that during 1–1.25 T and 1.75–2 T, the friction of the cover on the X-ring is along −y. Furthermore, the Ph is always along −y, and its value remains constant. As the Cf increases, friction increases, increasing the net force exerted on the X-ring along −y. Consequently, the squeezing effect along −y on the X-ring is enhanced, so the peak contact pressure of 1 T, 1.25 T, and 2 T increases. During 1.25–1.75 T, the friction of the cover on the X-ring is along +y. When the Cf increases, the friction increases, decreasing the net force exerted on the X-ring along −y. Consequently, the squeezing effect along −y on the X-ring is weakened, so the peak contact pressure of 1.5 T and 1.75 T decreases. Besides, when the Cf is 0.06, the peak contact pressure of 1.25 T is slightly greater than 1 T, and that of 1.75 T is slightly less than 1.5 T. When the Cf is 0.07, the peak contact pressure of 1.25 T is significantly greater than 1 T, and that of 1.75 T is substantially less than 1.5 T. This result implies that changes in the Cf may alter the fretting running region of the X-ring. Specifically, the critical fretting displacement of the X-ring running into the gross slip region increases with the increase of Cf.
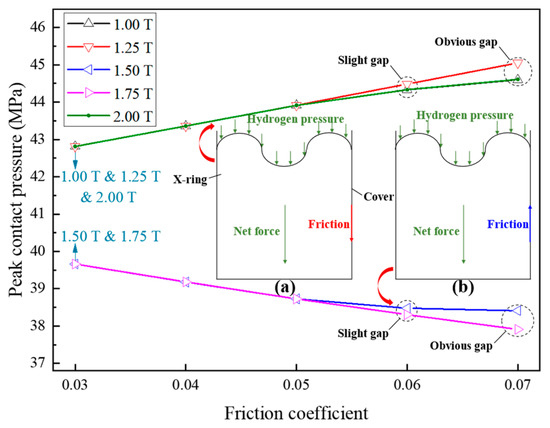
Figure 9.
Relationship between peak contact pressure and Cf during 1–2 T. (a) Schematic diagram of the forces on the X-ring during 1–1.25 T and 1.75–2 T; (b) Schematic diagram of the forces on the X-ring during 1.25–1.75 T.
Figure 10 reflects the relationship between the peak Mises stress of X-ring and Cf during 1–2 T. When the Cf increases from 0.03 to 0.07, the peak Mises stress increases at most locations. Therefore, the peak Mises stress of the X-ring could be reduced by decreasing the Cf appropriately, thus reducing the possibility of failure due to crack or elasticity loss.
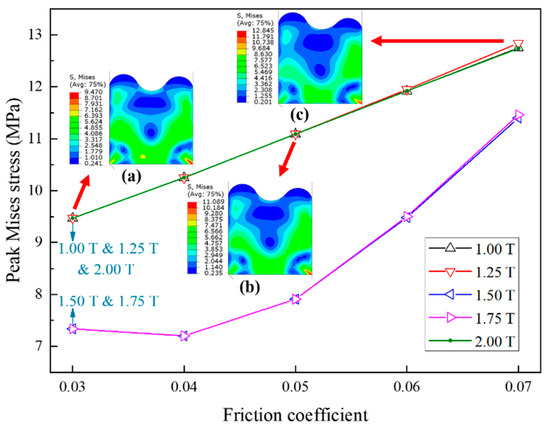
Figure 10.
Relationship between peak Mises stress and Cf during 1–2 T. (a) Mises stress diagram of X-ring at 1.25 T when Cf is 0.03; (b) Mises stress diagram of X-ring at 1.25 T when Cf is 0.05; (c) Mises stress diagram of X-ring at 1.25 T when Cf is 0.07.
As the O-ring also has a reciprocating periodicity of fretting [18], the minimum (Min) peak contact pressure, as well as the maximum (Max) peak Mises stress of the X-ring and O-ring during 1–2 T, can be used as the primary basis for determining the similarities and differences in the fretting characteristics of these two types of rubber rings. Figure 11 shows the Min peak contact pressure and Max peak Mises stress of X-ring and O-ring at various Cf during 1–2 T. When the Cf increases from 0.03 to 0.06, the decreasing trend in the Min peak contact pressure of the X-ring is more significant than that of the O-ring. The Min peak contact pressure of the X-ring is always higher than that of the O-ring. These imply that the fretting sealing characteristics of the X-ring are more excellent than those of the O-ring. When the Cf is 0.07, the Min peak contact pressure of the X-ring is slightly lower than that of the O-ring, which can be inferred that the O-ring may have better fretting sealing characteristics in a higher Cf. In addition, the increasing trend of the Max peak Mises stress of the X-ring is weaker than that of the O-ring. The Max peak Mises stress of the X-ring is always lower than that of the O-ring. These signify that crack or elasticity loss inside the X-ring is less likely to occur.
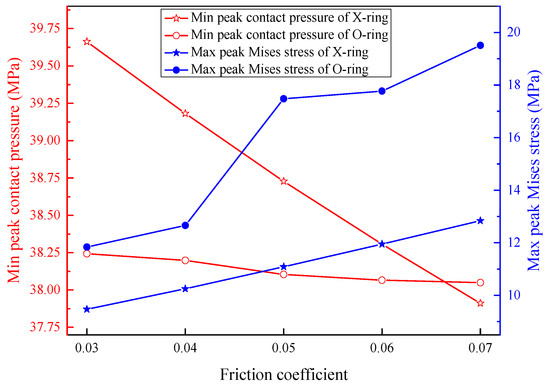
Figure 11.
Min peak contact pressure and Max peak Mises stress of X-ring and O-ring at various Cf during 1–2 T.
To sum up, during 1–2 T, when the Cf increases from 0.03 to 0.07, the peak contact pressure at 1.25 T increases substantially and is always the Max. In comparison, that at 1.75 T decreases significantly and is always the Min, which means that the hydrogen leak is more likely to occur at the limit location of the outward stroke. Moreover, the peak Mises stress increases at most locations. Thus, the Cf should be controlled at a smaller value. Additionally, the fretting characteristics of the X-ring are generally better than those of the O-ring when Cf is in the range of 0.03–0.07.
4.4. Effect of Hydrogen Pressure
In practical applications, the rubber X-ring directly interacts with high-pressure hydrogen gas. With the increase of Ph, the effect of hydrogen swelling on rubber X-ring becomes more significant, thus affecting the fretting characteristics of the X-ring. Therefore, the fretting characteristics of the X-ring are closely related to Ph. The effect of Ph on the fretting characteristics of the X-ring will be explored in this section. The Af is 1.2 mm, the Cf is 0.05, and the Rp is 10%.
Figure 12 displays the relationship between the peak contact pressure of the X-ring and Ph during 1–2 T. When the Ph increases from 25 MPa to 45 MPa, the peak contact pressure increases at all locations. Specifically speaking, the five curves are almost parallel to each other with equal spacing, indicating that the X-ring’s peak contact pressure increases linearly with increasing Ph, and the direct proportionality coefficient is approximately equal to 1. It signifies that the difference between the peak contact pressure and Ph does not vary with Ph. For example, when Ph is 30 MPa, the difference between the two pressure is 4.0544 MPa at 1.5 T. When Ph is 35 MPa, the difference between the two pressure is 3.9161 MPa at 1.25 T. These two numbers are very close. As a consequence, if the fretting sealing performance of the X-ring is evaluated only from the difference between the peak contact pressure and Ph, it can be considered that the fretting sealing performance of these five groups of X-rings is similar under 25–45 MPa. In addition, the peak contact pressure at 1.75 T is always minimal, representing that hydrogen leakage is most likely to occur at the limit location of the outward stroke.
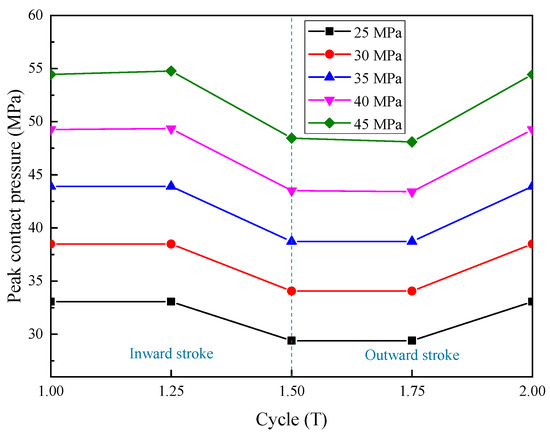
Figure 12.
Relationship between peak contact pressure and Ph during 1–2 T.
Figure 13 exhibits the relationship between the peak Mises stress of X-ring and Ph during 1–2 T. When the Ph increases from 25 MPa to 45 MPa, the peak Mises stress increases at most locations. It suggests that high-pressure hydrogen intensifies the possibility of crack or elasticity loss in the X-ring. In particular, the peak Mises stress at 1.5 T and 1.75 T of the X-ring is close to coincidence when Ph is 25 MPa and 30 MPa, respectively. Because at lower Ph values, the degree of swelling due to dissolved hydrogen of the X-ring is diminished, thus weakening the effect of hydrogen pressure on the Mises stress of the X-ring.
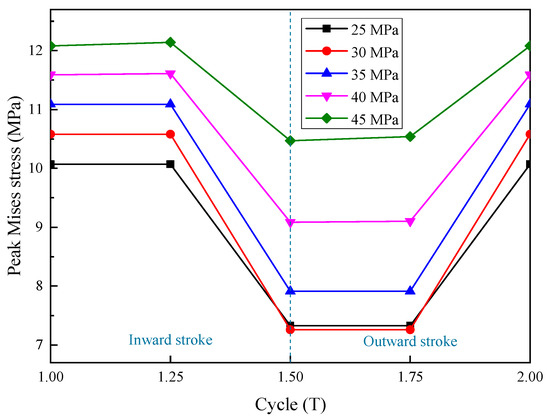
Figure 13.
Relationship between peak Mises stress and Ph during 1–2 T.
Figure 14 manifests the Min peak contact pressure and Max peak Mises stress of X-ring and O-ring at various Ph during 1–2 T. When the Ph increases from 15 MPa to 35 MPa, the linear increase in the Min peak contact pressure of the X-ring is similar to that of the O-ring. When the Ph is 25 MPa, the Min peak contact pressure of the X-ring and O-ring is equal. These results mean that the fretting sealing characteristics of the X-ring and O-ring are similar under 15–35 MPa. Additionally, at lower pressures (such as 15 MPa), the Max peak Mises stress of the X-ring is similar to that of the O-ring. In comparison, at higher pressures (such as 35 MPa), the Max peak Mises stress of the O-ring is much greater than that of the X-ring. It implies that the failure behavior of forming cracks or elasticity loss inside the O-ring is more likely to occur under high-pressure conditions.
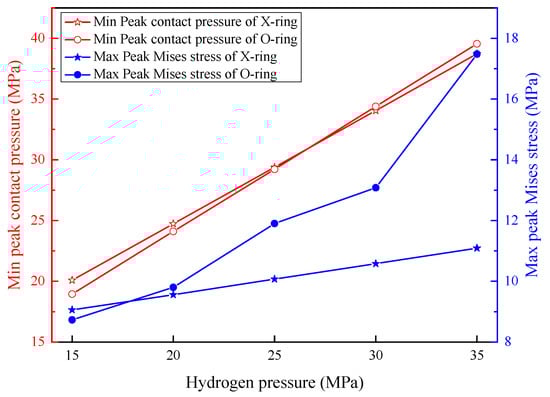
Figure 14.
Min peak contact pressure and max peak Mises stress of X-ring and O-ring during 1–2 T in various Ph.
On balance, during 1–2 T, when Ph is in the range of 25–45 MPa, the peak contact pressure of the X-ring increases linearly with the rise in Ph, and the direct proportionality coefficient is approximately equal to 1. The X-ring is more susceptible to crack or elasticity loss under a higher Ph, such as 45 MPa. The effect of Ph on the peak Mises stress decreases when Ph is lower, such as 25 MPa. Furthermore, when the Ph is in the range of 15–35 MPa, the fretting characteristics of the X-ring are slightly superior to those of the O-ring.
4.5. Effect of Pre-Compression Ratio
Pre-compression is necessary to ensure the sealing function of the combined seal structure. Choosing an appropriate Rp can effectively improve the fretting characteristics of the rubber ring. Generally speaking, the Rp of the rubber ring in the static seal is between 10% and 20%, and the Rp allowed in the fretting seal is slightly lower than that in the static seal. Rp’s influence on the X-ring’s fretting characteristics will be investigated in this section. The Af is 1.2 mm, the Cf is 0.05, and the Ph is 35 MPa.
Figure 15 shows the relationship between the peak contact pressure of the X-ring and Rp during 1–2 T. As the Rp increases from 10% to 14%, the peak contact pressure increases at all locations. The peak contact pressure at 1 T, 1.25 T, and 2 T increases substantially, while at 1.5 T and 1.75 T increases slightly. This indicates that increasing the Rp can effectively improve the fretting sealing performance of the X-ring, especially during the inward stroke. Additionally, the peak contact pressure at 1.75 T is always minimal, denoting that hydrogen leakage is most likely to occur at the limit location of the outward stroke. Rp andPh’s effect on the X-ring’s fretting sealing characteristics is similar.
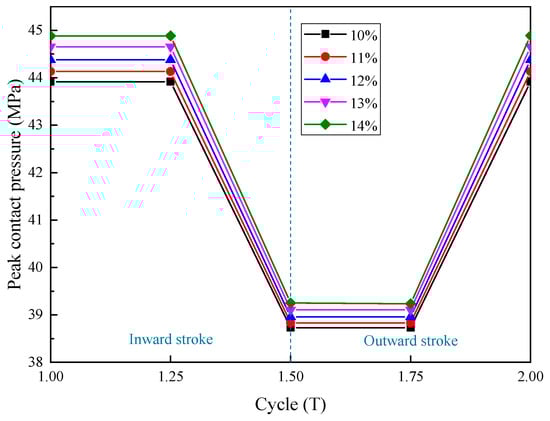
Figure 15.
The relationship between peak contact pressure and Rp during 1–2 T.
Figure 16 demonstrates the relationship between the peak Mises stress of the X-ring and Rp during 1–2 T. The peak Mises stress of 1 T, 1.25 T, and 2 T decrease slightly, while the peak Mises stress of 1.5 T and 1.75 T increases significantly when the Rp increases from 10% to 14%. It implies that decreasing Rp can effectively reduce the possibility of crack or elasticity loss in the X-ring at the limit location of the outward stroke.
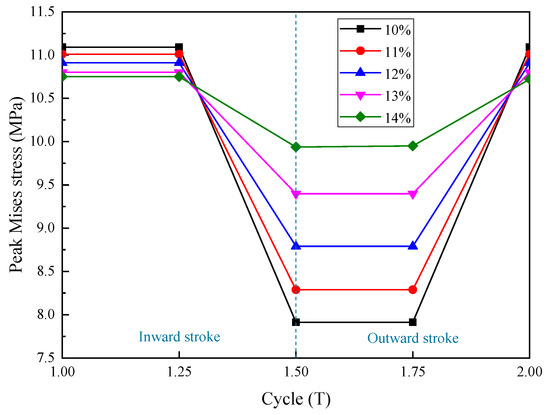
Figure 16.
The relationship between peak Mises stress and Rp during 1–2 T.
Figure 17 displays the Min peak contact pressure and Max peak Mises stress for X-ring and O-ring at various Rp during 1–2 T. When the Rp increases from 10% to 14%, the increasing trend of the Min peak contact pressure of the X-ring is similar to that of the O-ring. The Min peak contact pressure of the X-ring is always higher than that of the O-ring, signifying that the fretting sealing characteristics of the X-ring are superior to those of the O-ring. In addition, the decreasing trend of Max peak Mises stress of the X-ring is similar to that of the O-ring. The Max peak Mises stress of the X-ring is always lower than that of the O-ring, indicating that crack or elasticity loss inside the X-ring is less likely to occur.
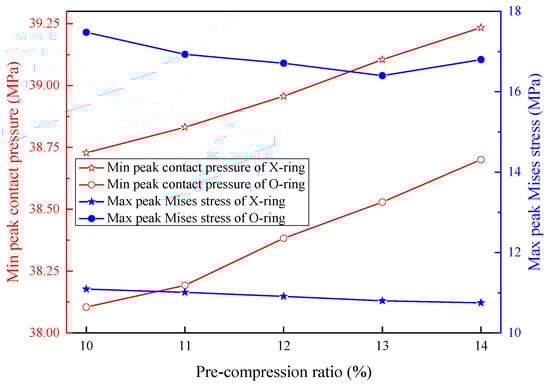
Figure 17.
Min peak contact pressure and max peak Mises stress of X-ring and O-ring during 1–2 T in various Rp.
To summarize, during 1–2 T, when the Rp is in the range of 10–14%, the peak contact pressure of the X-ring increases with the Rp, thus improving the fretting sealing characteristics. Furthermore, the X-ring’s peak Mises stress at the outward stroke’s limit location increases with Rp, aggravating the degree of crack or elasticity loss. Besides, with Rp in 10–14%, the X-ring has better fretting characteristics than the O-ring.
5. Conclusions
In this paper, a numerical model is proposed to study the fretting behavior of the rubber X-ring in a high-pressure hydrogen environment by incorporating the influence of swelling induced by the solute hydrogen. Further investigation discloses the stress distribution of the fretting seal and the influence of various factors (Af, Cf, Ph, and Rp) on the fretting characteristics of the X-ring. Moreover, the similarities and differences in the fretting characteristics of the X-ring and O-ring are also summarized. Overall, the following conclusions can be drawn:
- (1)
- It is found that the contact surface of the X-ring and cover has two segments of continuous node elements with contact pressure higher than Ph during 0-2 T, indicating the X-ring can play a fretting sealing role in the seal component. The Mises stress is asymmetrically distributed during the fretting with a cyclic period of 1 T. The stress concentration zone’s evolution inside the X-ring is closely related to the cover’s drag direction and the wedge-ring’s blocking effect.
- (2)
- As the Af increases from 0 mm to 2 mm, the fretting of the X-ring runs sequentially in the sticking region, the mixed slip region, and the gross slip region. The critical fretting displacements of the X-ring running into the mixed slip region and the gross slip region are 0.4 mm and 1.2 mm, respectively. Within certain limits, the X-ring’s location starting to enter the fretting cycle advances as the Af increases, and the fretting period remains constant.
- (3)
- In a specific range, the peak contact pressure of the X-ring could be enhanced with the increase of the Ph and Rp, leading to the better fretting sealing performance of the combined seal structure. Compared with the inward stroke, the hydrogen leak is more likely to occur on the outward stroke during X-ring fretting. Meanwhile, with the increase of the Cf and Ph, the peak Mises stress of the X-ring increases considerably, exacerbating the possibility of failure due to crack or elasticity loss.
- (4)
- The similarities and differences in the effect of Cf, Ph, and Rp on the fretting behavior of these two types of rubber rings show that rubber X-ring has better fretting characteristics than rubber O-ring. This result implies that the X-ring may be an alternative to the O-ring in high-pressure hydrogen storage systems’ static and fretting seal structure.
Author Contributions
Conceptualization, resources, supervision, project administration and funding acquisition, C.Z.; methodology and visualization, Y.Z. and X.L.; software, validation, formal analysis, investigation, data curation and writing—original draft preparation, Y.Z.; writing—review and editing, C.Z. and Y.Z. All authors have read and agreed to the published version of the manuscript.
Funding
This research was supported by the National Natural Science Foundation of China (No. 52075183), Key-Area Research and Development Program of Guangdong Province (No. 2020B0404020004), Guangdong Basic and Applied Basic Research Foundation (No. 2019A1515011157), Science and Technology Program of Guangzhou (No. 202002030275), National Foreign Expert Program (No. G2022163005L), and Science and Technology Program of Guangdong Administration for Market Regulation (No. 2020CT02).
Data Availability Statement
Not applicable.
Conflicts of Interest
The authors declare no conflict of interest.
References
- Zhou, C.; Liu, X.; Zhang, Y.; Wu, H.; Yang, Y. Numerical study on the effect of inclusions on hydrogen segregation in steel under stress conditions. Int. J. Hydrogen Energy 2022, 47, 20310–20322. [Google Scholar] [CrossRef]
- Shadidi, B.; Najafi, G.; Yusaf, T. A Review of Hydrogen as a Fuel in Internal Combustion Engines. Energies 2021, 14, 6209. [Google Scholar] [CrossRef]
- Ingaldi, M.; Klimecka-Tatar, D. People’s Attitude to Energy from Hydrogen—From the Point of View of Modern Energy Technologies and Social Responsibility. Energies 2020, 13, 6495. [Google Scholar] [CrossRef]
- Pawelczyk, E.; Łukasik, N.; Wysocka, I.; Rogala, A.; Gębicki, J. Recent Progress on Hydrogen Storage and Production Using Chemical Hydrogen Carriers. Energies 2022, 15, 4964. [Google Scholar] [CrossRef]
- Free, Z.; Hernandez, M.; Mashal, M.; Mondal, K. A Review on Advanced Manufacturing for Hydrogen Storage Applications. Energies 2021, 14, 8513. [Google Scholar] [CrossRef]
- Zheng, J.; Liu, X.; Xu, P.; Liu, P.; Zhao, Y.; Yang, J. Development of high pressure gaseous hydrogen storage technologies. Int. J. Hydrogen Energy 2012, 37, 1048–1057. [Google Scholar] [CrossRef]
- Lee, H.S.; Lee, Y.S.; Chun, B.S.; Kim, S.Y.; Baek, J.H. Contact stress analysis on the X-shape ring. Mater. Werkst. Entwickl. Fert. Prüfung Eig. Anwend. Tech. Werkst. 2008, 39, 193–197. [Google Scholar] [CrossRef]
- Shin, D.C.; Hawong, J.S.; Lee, S.W.; Bernard, A.O.; Lim, H.S. Contact behavior analysis of X-ring under internal pressure and uniformsqueeze rate using photoelastic experimental hybrid method. J. Mech. Sci. Technol. 2014, 28, 4063–4073. [Google Scholar] [CrossRef]
- Bernard, A.O.; Hawong, J.S.; Shin, D.C.; Lim, H.S. Internal stress distribution of X-ring using photoelastic experimental hybrid method. J. Mech. Sci. Technol. 2014, 28, 1697–1708. [Google Scholar] [CrossRef]
- Zhou, C.; He, M.; Chen, G.; Jiang, S. Numerical study on sealing characteristic of rubber X-ring exposed to high-pressure hydrogen by considering swelling effect. Ind. Lubr. Tribol. 2019, 71, 133–138. [Google Scholar] [CrossRef]
- Wang, B.; Yu, S.; Meng, X.; Li, Y.; Li, J. Sealing performance analysis of high pressure star seal ring. Fluid Mach. 2017, 45, 37–42+63. (In Chinese) [Google Scholar]
- Zhou, Z.; Zhang, K.; Li, J.; Xu, T. Finite element analysis of stress and contact pressure of O-shaped rubber seal Ring. Lubr. Eng. 2006, 86–89. (In Chinese) [Google Scholar] [CrossRef]
- Kim, H.-K.; Park, S.-H.; Lee, H.-G.; Kim, D.-R.; Lee, Y.-H. Approximation of contact stress for a compressed and laterally one side restrained O-ring. Eng. Fail. Anal. 2007, 14, 1680–1692. [Google Scholar] [CrossRef]
- Wu, Q.; Suo, S.; Liu, X.; Huang, W.; Wang, Y. Static sealing and fretting sealing characteristics of NITrile butadiene rubber O-ring. Lubr. Eng. 2012, 37, 5–11+21. (In Chinese) [Google Scholar]
- Zheng, J.; Shen, M.; Meng, X.; Li, J.; Peng, X. Fretting characteristics of o-ring rubber seals for mechanical seals. J. Shanghai Jiao Tong Univ. 2014, 48, 856–862. (In Chinese) [Google Scholar]
- Shen, M.; Zheng, J.; Meng, X.; Li, J.; Jiang, H.; Peng, X. Fretting tribological characteristics of fluorine rubber O-ring with reciprocating shaft seal. J. Mech. Eng. 2015, 51, 39–45. (In Chinese) [Google Scholar] [CrossRef]
- Zhu, Q.; Bai, S. Fretting friction test of fluorine rubber O-ring low pressure gas seal. J. Tribol. 2015, 35, 646–650. (In Chinese) [Google Scholar]
- Zhou, C.; Chen, G.; Xiao, S.; Hua, Z.; Gu, C. Study on fretting behavior of rubber O-ring seal in high-pressure gaseous hydrogen. Int. J. Hydrogen Energy 2019, 44, 22569–22575. [Google Scholar] [CrossRef]
- Bernard, A.O.; Hawong, J.-S.; Shin, D.-C.; Dong, B. Contact behavior analysis of elastomeric x-ring under uniform squeeze rate and internal pressure before and after forcing-out using the photoelastic experimental hybrid method. J. Mech. Sci. Technol. 2015, 29, 2157–2168. [Google Scholar] [CrossRef]
- Liu, H.; Yin, M.; Sun, H. Analysis of the sealing performance of the X-shaped seal of the triaxial combustible ice tester. Mod. Manuf. Eng. 2020, 130–135. (In Chinese) [Google Scholar] [CrossRef]
- Castagnet, S.; Grandidier, J.C.; Comyn, M.; Benot, G. Mechanical testing of polymers in pressurized hydrogen: Tension, creep and ductile fracture. Exp. Mech. 2012, 52, 229–239. [Google Scholar] [CrossRef]
- Marckmann, G.; Verron, E. Comparison of hyperelastic models for rubber-like materials. Rubber Chem. Technol. 2006, 79, 835–858. [Google Scholar] [CrossRef]
- Zhou, C.; Zheng, J.; Gu, C.; Zhao, Y.; Liu, P. Sealing performance analysis of rubber O-ring in high-pressure gaseous hydrogen based on finite element method. Int. J. Hydrogen Energy 2017, 42, 11996–12004. [Google Scholar] [CrossRef]
- Yamabe, J.; Koga, A.; Nishimura, S. Failure behavior of rubber O-ring under cyclic exposure to high-pressure hydrogen gas. Eng. Fail. Anal. 2013, 35, 193–205. [Google Scholar] [CrossRef]
- Zhang, C.; Wu, J.; Teng, F.; Su, B.; Wang, Y.; Ao, H. Theoretical and experimental characterization for macro-micro friction behaviors of EPDM rubber. Polym. Test. 2021, 99, 107213. [Google Scholar] [CrossRef]
- Kim, H.-K.; Nam, J.-H.; Hawong, J.-S.; Lee, Y.-H. Evaluation of O-ring stresses subjected to vertical and one side lateral pressure by theoretical approximation comparing with photoelastic experimental results. Eng. Fail. Anal. 2009, 16, 1876–1882. [Google Scholar] [CrossRef]
Publisher’s Note: MDPI stays neutral with regard to jurisdictional claims in published maps and institutional affiliations. |
© 2022 by the authors. Licensee MDPI, Basel, Switzerland. This article is an open access article distributed under the terms and conditions of the Creative Commons Attribution (CC BY) license (https://creativecommons.org/licenses/by/4.0/).