Article

Triggering Shock Wave Positions by Patterned Energy Deposition

Department of Aerospace and Mechanical Engineering, Institute for Flow Physics and Control, University of Notre Dame, South Bend, IN 46637, USA
*
Author to whom correspondence should be addressed.
Energies 2022, 15(19), 7104; https://doi.org/10.3390/en15197104
Submission received: 2 September 2022 / Revised: 23 September 2022 / Accepted: 25 September 2022 / Published: 27 September 2022

Abstract

:
The problem considered in this work is shock wave (SW) positioning control in shock-dominated flows. Experiments are conducted to investigate the triggering effect of patterned near-surface electrical discharges on SW reflection from plane walls. In the wind tunnel, M = 4 , P 0 = 4 bar, a solid wedge SW generator is mounted on the upper wall. Q-DC filamentary electrical discharges were arranged on the opposite wall, so that the SW from the wedge impinged on the plasma filaments that are arranged flow-wise in either a row of three or a single central filament. Within the supersonic flow, narrow subsonic areas are actuated by electrical discharge thermal deposition, resulting in pressure redistribution, which, in turn, relocates the reflection of impinging SW to a predefined position. Mie scattering, schlieren imaging, and wall pressure measurements are used to explore the details of plasma-SW interaction. Using Mie scattering, the three-dimensional shape of the SW structure is mapped both before and after electrical discharge activation. Plasma-based triggering mechanisms are described in terms of the physical principles of flow control and a criterion for determining the effectiveness of the flowfield control.

1. Introduction

Effective compression of the air at the engine inlet is one of the most significant engineering issues in the design of a vehicle propelled by an air-breathing engine during hypersonic flight. The ideal compression includes a minimum loss of total pressure on external compression surfaces as well as in the internal flowpath. An ideally designed system might be mechanically complex, so such a case is rarely realized due to weight, materials and control constraints. Practical design always involves trade-offs between functionality and multiple other factors, such as tolerance to incoming flow variation or modulation of external conditions over the trajectory [1,2]. In inlet and isolator, a series of weak SW enables a lower pressure loss when compared with a few strong SWs, which is a common concept of multi-SW compression [3,4]. Shock train geometry is affected by incoming airflow, BL conditions, gas pressure downstream (combustor), and other factors interfering with each other. The shock train configuration is usually unstable and poorly controllable, resulting in the transformation of oblique SWs into direct SWs (nearly perpendicular to flow velocity vector) and resulting pressure/engine performance losses [5,6].
Except for exotic magnetohydrodynamic acceleration techniques, all methods of shock train and inlet control function by decelerating the gas locally in its internal flowpath. Typical examples include mechanical obstacles, wall gas jets, or long isolators to reduce shock train sensitivity to combustor counterpressure [7,8,9,10]. The methods listed above are effective for stabilizing the shock train, but adversely affect the engine performance. A better technical solution is to use a temporal mode when the controller’s actuation prevents the system from shifting to an undesirable operational mode and does not affect cruise mode. A timely prevention of failure is twice as beneficial because of the hysteresis effect, when, after the duct choking, system restore to original state is challenging. Unfortunately, mechanical controllers have an inertial response time that is significantly longer than typical gasdynamic time in hypersonic/supersonic flow, τ g d = d / u < 1 ms. Another complication is caused by the essentially three-dimensional structure of the shock train and the inlet flowfield in many cases. A smart, highly adaptive control system is therefore preferred [11].
Contrary to the slow mechanical methods, the energy deposition inflow is one of the most promising rapid methods of controlling SW structures. In simplest terms, the electrical discharge or beamed energy deposition, such as laser or microwaves, heats gas flowing through it with subsequent pressure jumps and volumetric expansions. It creates a new SW, similar to solid obstacles, but much faster than any mechanical element. In an advanced approach [12,13,14], a spatial modulation of gas temperature is credited with redistributing pressure in the flowfield. High gas temperatures result in higher sonic velocity in the plasma zone, resulting in faster propagation of pressure disturbances or even the appearance of subsonic channels within supersonic flows. Several computational works have investigated the interaction mechanism and consequences for SW propagation in a temperature-stratified medium, see References [15,16,17] for example. In the presence of a single heated longitudinal zone, due to a higher sonic velocity in the heated zone with significant pressure redistribution, the SW propagates much farther upstream in a heated zone than it would in a cold gas, as shown schematically in Figure 1a. As one of the most popular gasdynamic tricks, the bow SW moves upstream when a heated zone is directly placed in front of a blunt body [15,18]. For a “thermally stratified” media, the SW structure looks different with the SWs forming a quasi-front of the propagating pressure jump, as it is shown in Figure 1b [17]. For a predefined control effect, the second, advanced, mechanism sounds more beneficial in terms of energy requirements: it declares a triggering effect on a SW position instead of a formation of a high pressure zone in result or the gas heating. A straightforward and the most effective method for a fast gas heating is electrical discharge generated inflow. It is, however, challenging to realize a volumetric, thermally stratified plasma zone—a near-surface implementation would be more realistic.
It has been described numerous times in the literature that a stationary or transient SW appears at the generation of electrical and laser discharges in supersonic flows [12,19,20,21]. The effects of near-surface filamentary plasmas on SWs position at plane wall and at compression surface arrangements were discussed in several serial works [14,22,23,24,25,26]. It was found that a near-surface stratified gas layer, consisting of lengthwise zones of supersonic and subsonic flow, modifies the SWBLI pattern when impinged by an external SW. The plasma method of SW triggering has been explored in recent publications [14,27,28] where schlieren visualization, pressure sensitive paint methods, and pressure sensing are used to demonstrate fast response with high actuation authority. However, for the SW pattern visualization, a three-dimensional technique is required for the detailed inside.
Apart from a 3D PIV technique, which is problematic in supersonic flow due to particle seeding issues, cross-flow 2D density/pressure maps can be used to reconstruct 3D SW structures. Measurements by planar techniques, such as PLIF and Rayleigh/Mie scattering, can be accomplished by seeding the flow with tracer gas, illuminating by laser sheet, and then observing the flow features. As a result of the seed gas condensation taking place naturally with a proper choice of secondary gas, the Mie scattering method is highly advantageous for the visualization in a supersonic flow since the scattered signal intensity is rather high [29,30,31]. With decreasing static temperature, the secondary gas condenses, forming uniformly distributed nano/micro-sized droplets. Considering that droplets can be of different sizes, Mie scattering theory is used to simulate scattering of light, which in the limit of small droplets approximates Rayleigh scattering. This method delivers a high-resolution instant image identifying the most flowfield features since droplets reevaporate at higher gas temperatures when they are in specific zones such as flow separation and boundary layer.
This study investigates the rapid control of shock train location and pressure redistribution in result of one or three quasi-DC plasma filaments generation near the wall of supersonic duct. In this paper, the key finding is a Mie-scattering visualization of a semi-conical SW that appeared in supersonic flow at BL-SW-plasma interaction.

2. Experimental Arrangement

In this study, testing was performed at the SBR-50 direct-connect supersonic blowdown wind tunnel at the University of Notre Dame [32]. This facility can operate at a variety of conditions thanks to swappable nozzle blocks and Ohmic heaters installed in the plenum section. For the tests described in this manuscript, the facility was operated with flow Mach number M = 4, ambient stagnation temperatures, stagnation pressures P 0 = 2.6–4 bar, R e = O ( 10 6 ) , and steady-state run time t < 1 
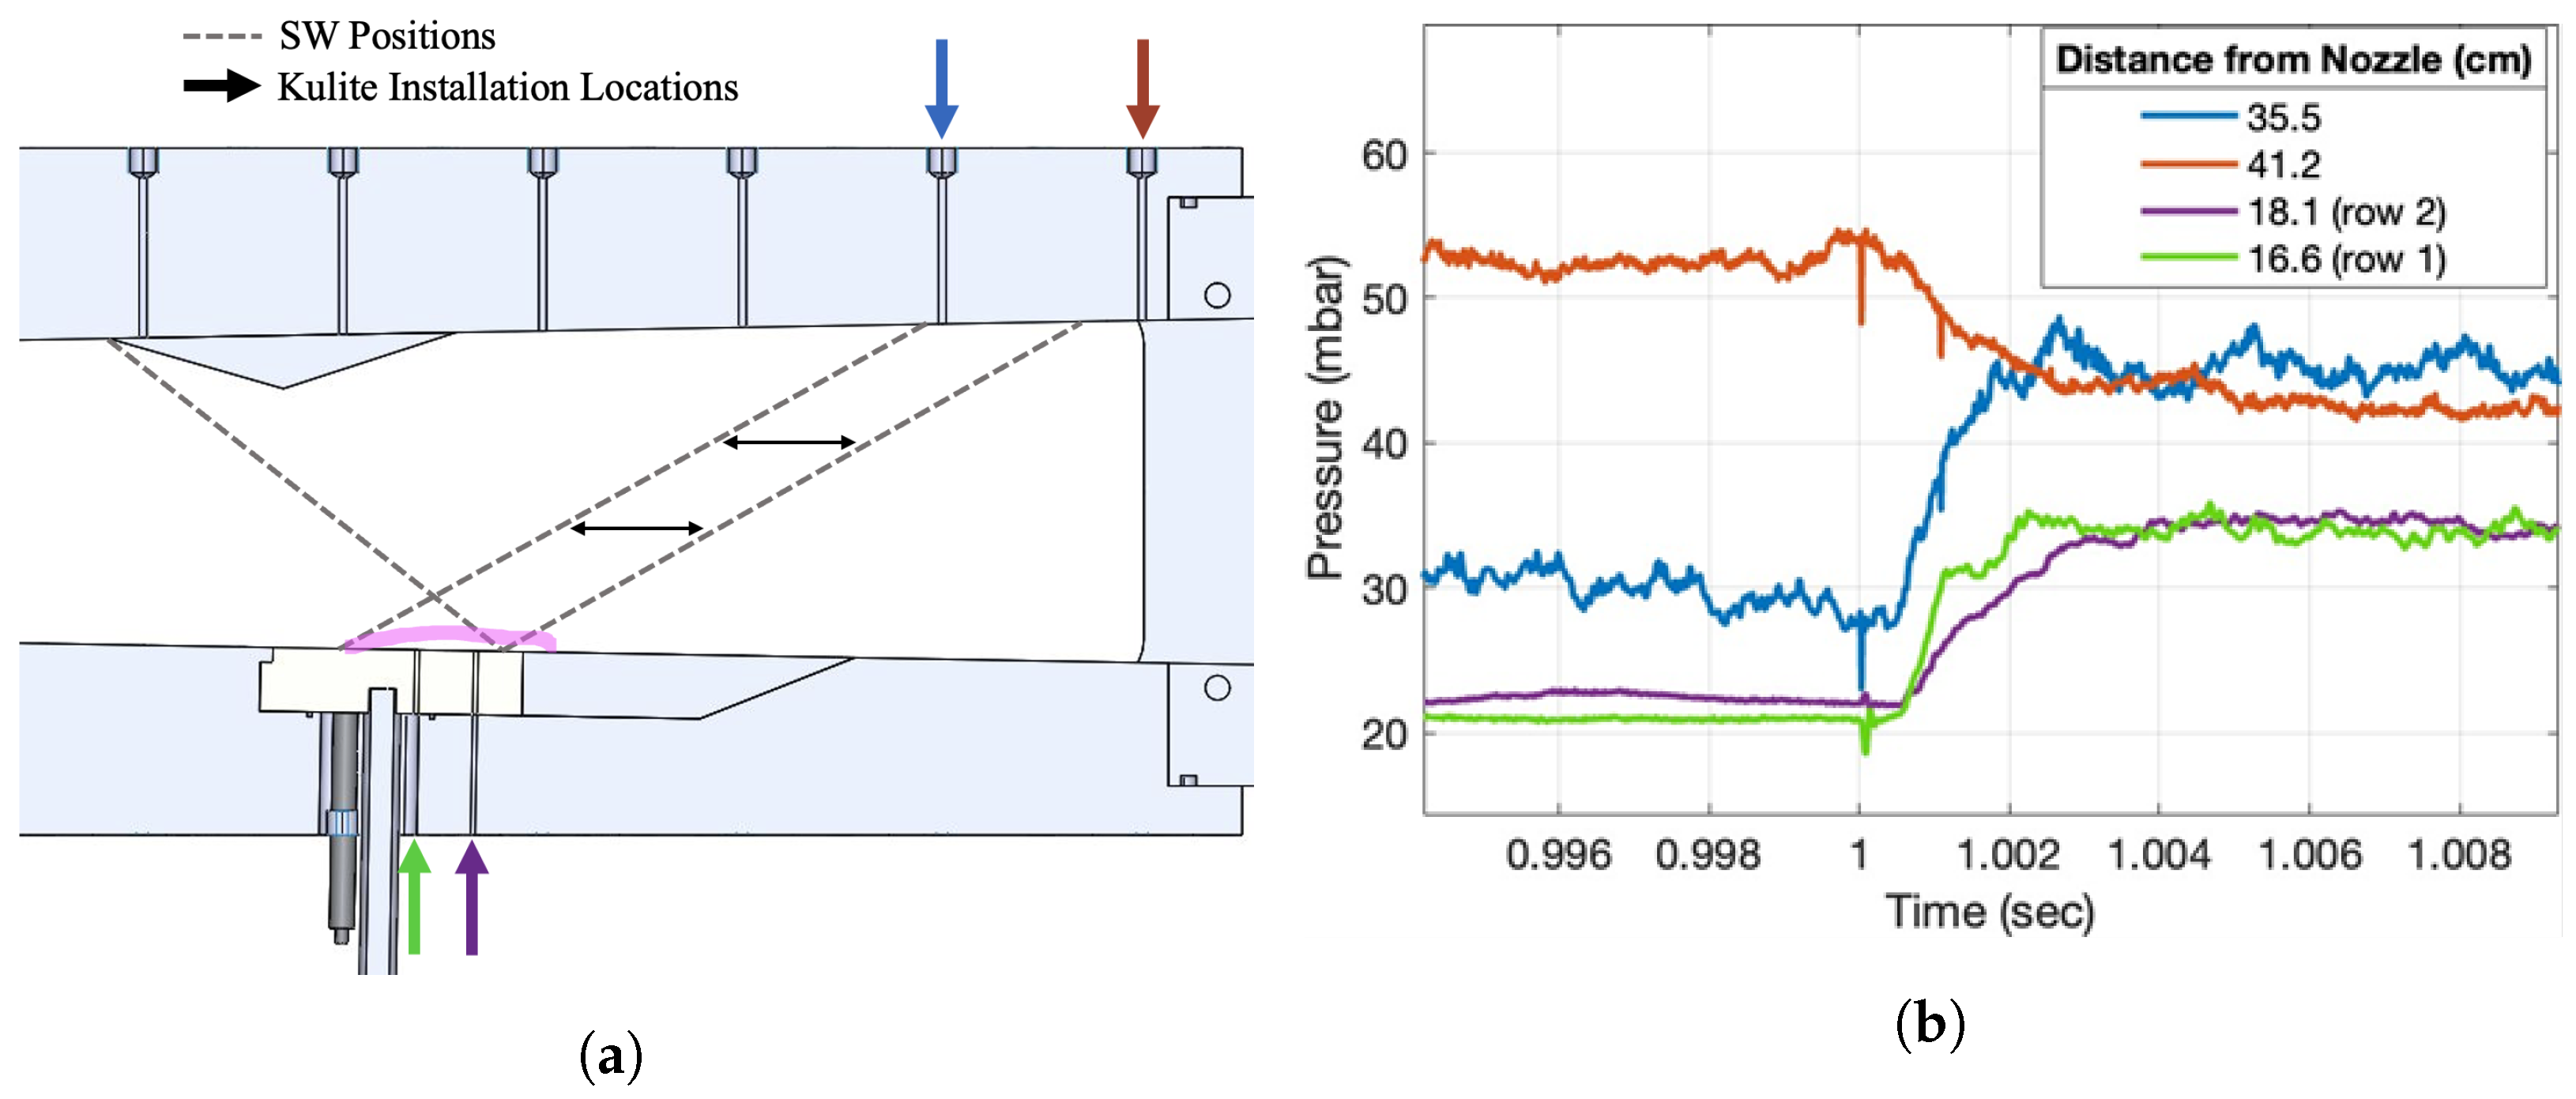
s. The facility uses a 2D nozzle paired to a rectangular cross section test section. The test section has dimensions 3 × 3 in at the nozzle exit with a 1° expansion on the top and bottom walls to maintain a roughly constant dimension core flow despite growth of the turbulent boundary layer. By installing a 17° spanwise uniform wedge on the top wall, a planar shock wave is generated that impinges on the bottom wall in the region that plasma is generated. The exact position of this SW impingement can be adjusted by moving the wedge between three available mounting positions as shown in Figure 2a. Plasma was generated from three high voltage electrodes using a quasi-DC (Q-DC) electric discharge. These electrodes were embedded in a ceramic bottom wall insert and spaced 19 mm apart from each other in a row 149 mm downstream from the nozzle exit. Two copper grounding rails were designed to provide initial breakdown and allow the filaments to elongate downstream over the rails. These rails are 2.6 mm wide with a distance of 19.05 mm between them. Figure 2b provides a schematic overview of this plasma generating insert. To generate the Q-DC discharge, a capacitor-based custom power supply with fast solid-state switch provides a current stabilized operation with breakdown voltages in a range of U p s = 4–5 kV. This facility also benefits from excellent optical access through quartz side windows spanning from top to bottom walls.
The test instrumentation for this work includes schlieren imaging, static pressure measurements, electrical measurements, high speed imaging of plasma, and optical spectroscopic observations. Static pressure was measured throughout the test section with a 64-channel pressure scanner (Scanivalve MPS4264) at an 800 Hz acquisition rate. The particular interest of this work is in pressure measurements taken along crossflow span within the region where plasma filaments are generated. To accomplish this, two rows of taps were placed at 165.5 mm and 180.7 mm downstream from the nozzle exit as shown in Figure 2b. The pressure dynamics were studied using 80 kHz Kulite pressure sensors installed in key locations such as the plasma region and area of reflected shock impingement.
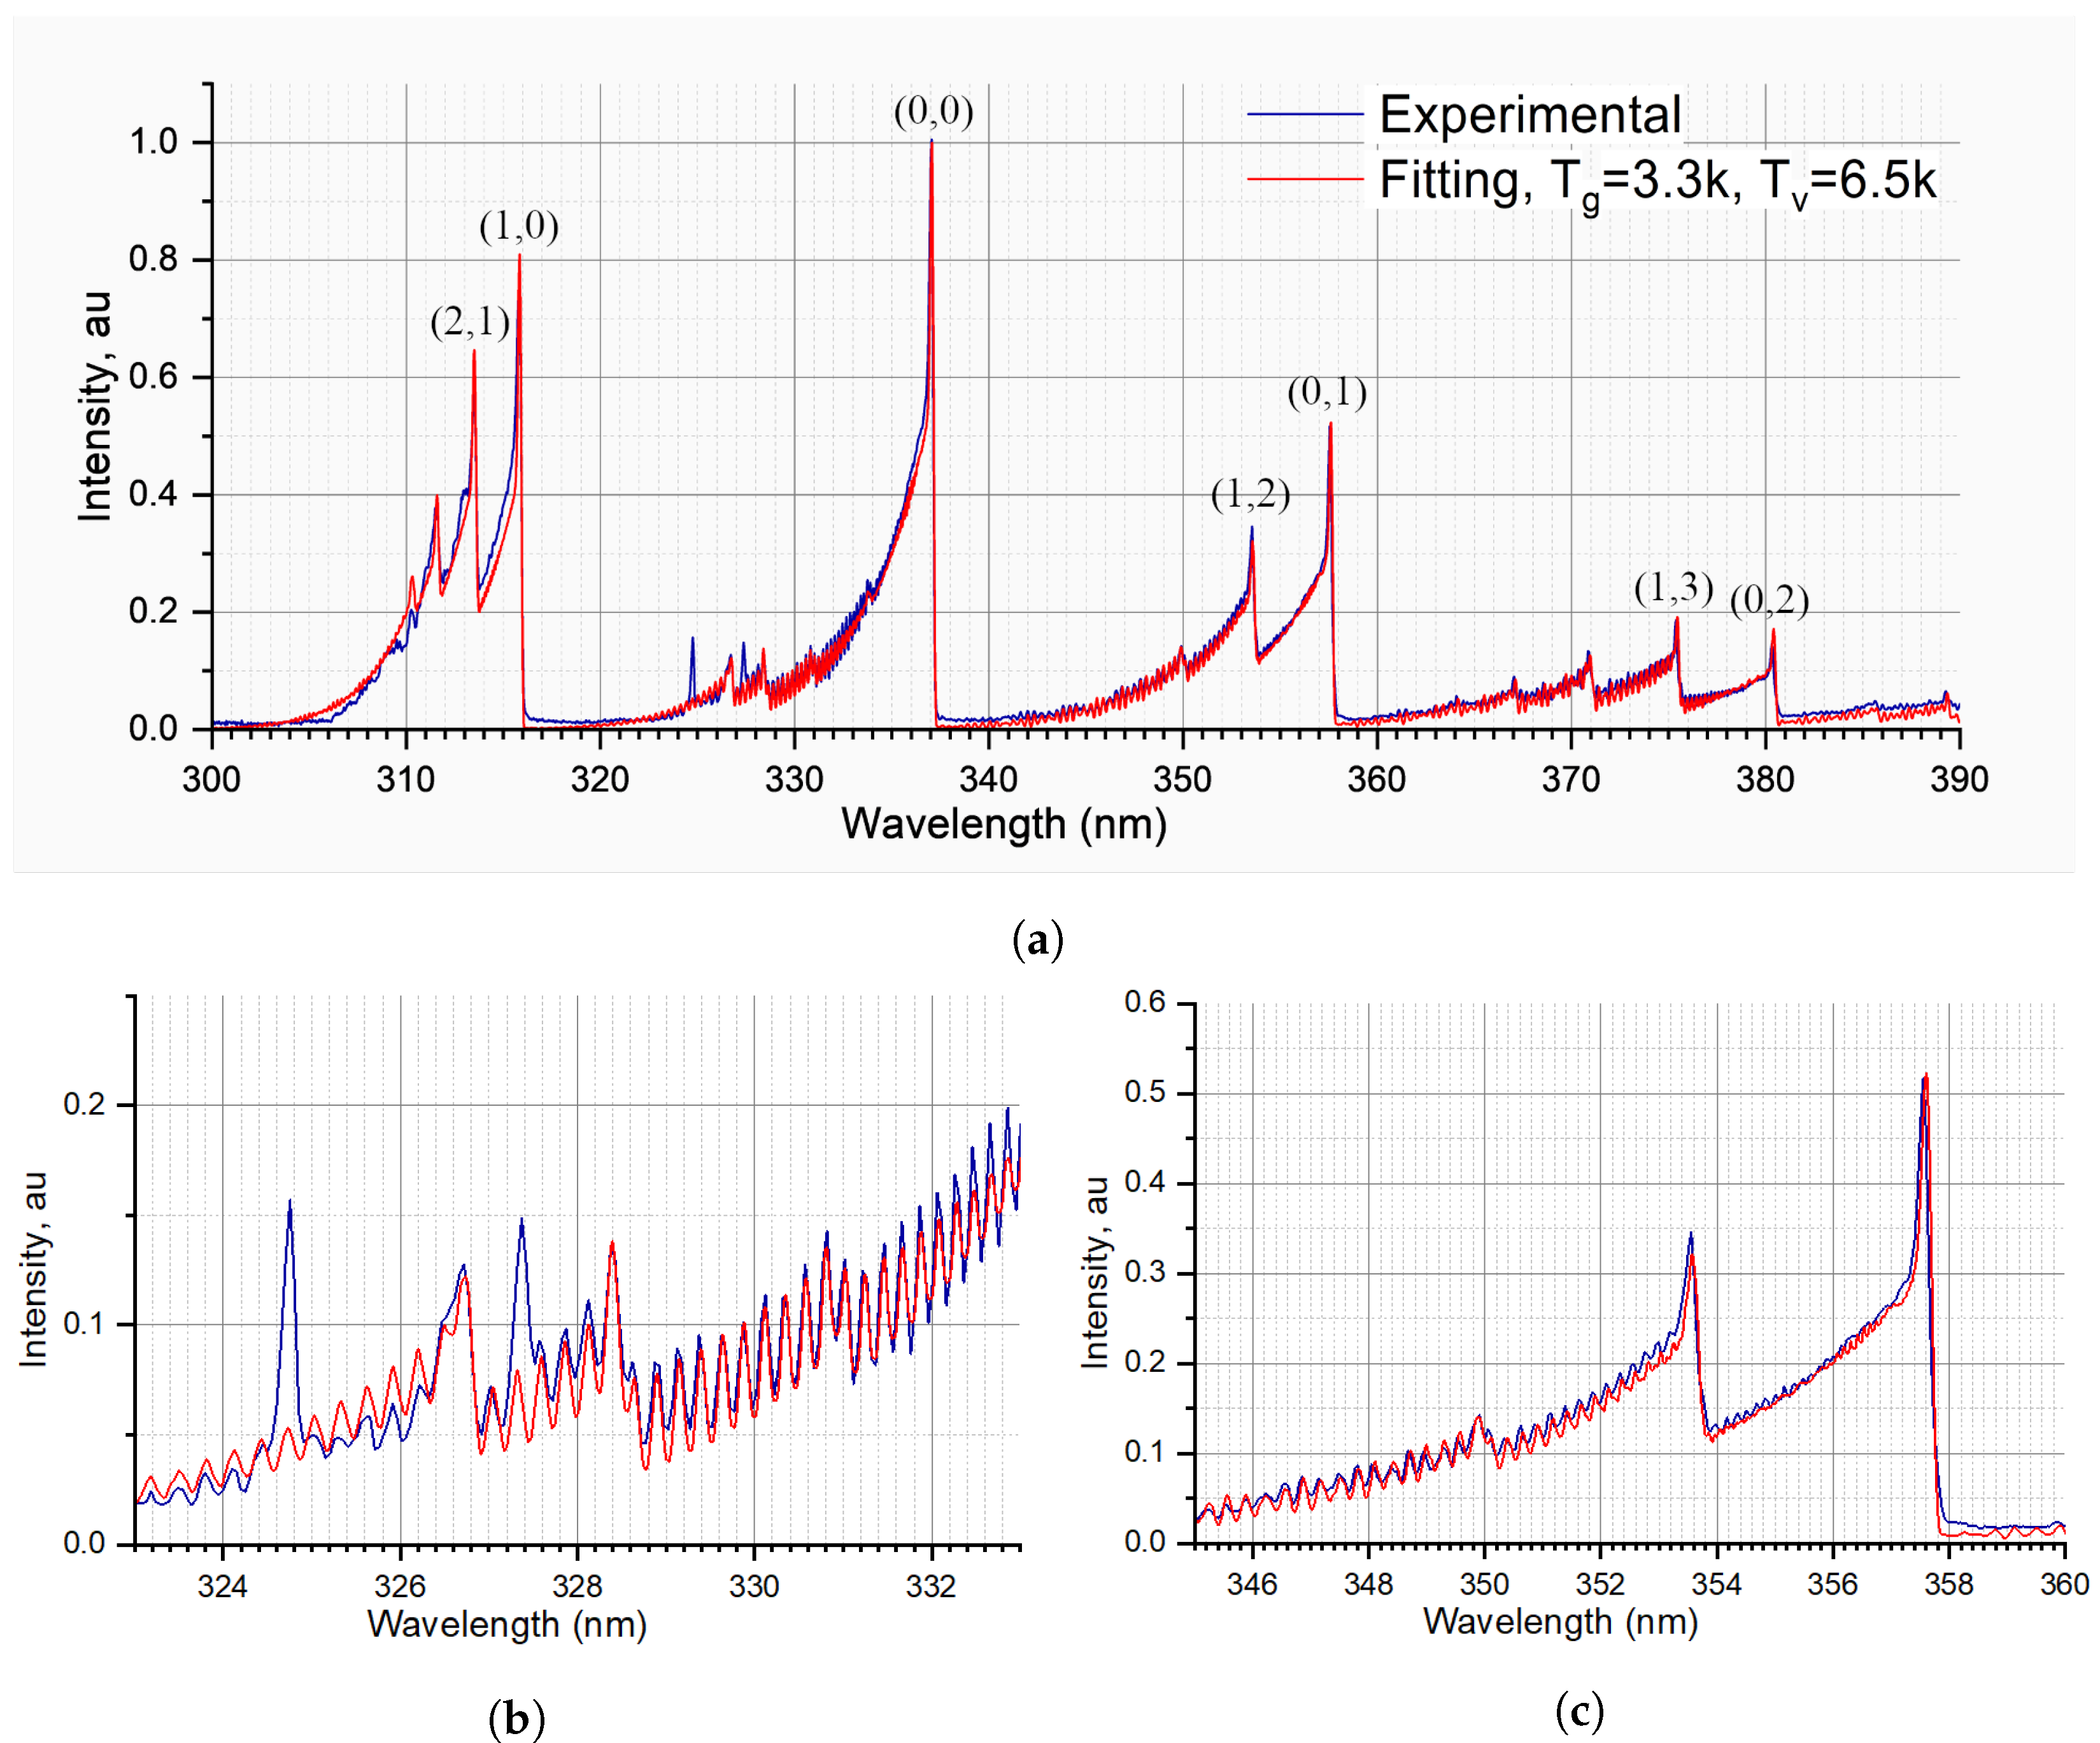
The schlieren imaging setup follows a traditional refractive scheme comprised of two telescopes and a high current pulsed white LED light source (100 ns pulse duration) as the illuminator. Images were recorded with a Phantom v2512 high speed camera operating with a frame-rate of 1 kHz and exposure of 1.25 μ s. Plasma power deposition was computed by recording gap voltages with high voltage electrical probes. High speed imaging of the plasma filaments was also collected using a Photron Nova S9 FastCam recording with a 20 kHz frame-rate and an exposure of 12.5 μ s. Each plasma filament has the following characteristic parameters: gap voltage U p l = 0.1–0.3 kV, electric current I = 2–4.5 A and plasma power W p l = 0.5–1.0 kW. Gas temperature due to plasma heating was measured through an optical emission spectroscopy technique in which luminescence from the plasma was collected by fiber optics from about a 5 mm diameter spot and then analyzed by a 300–400 nm Ocean Optics spectrometer. Spectra were fitted to the second positive system of molecular nitrogen as simulated by SpecAir software.
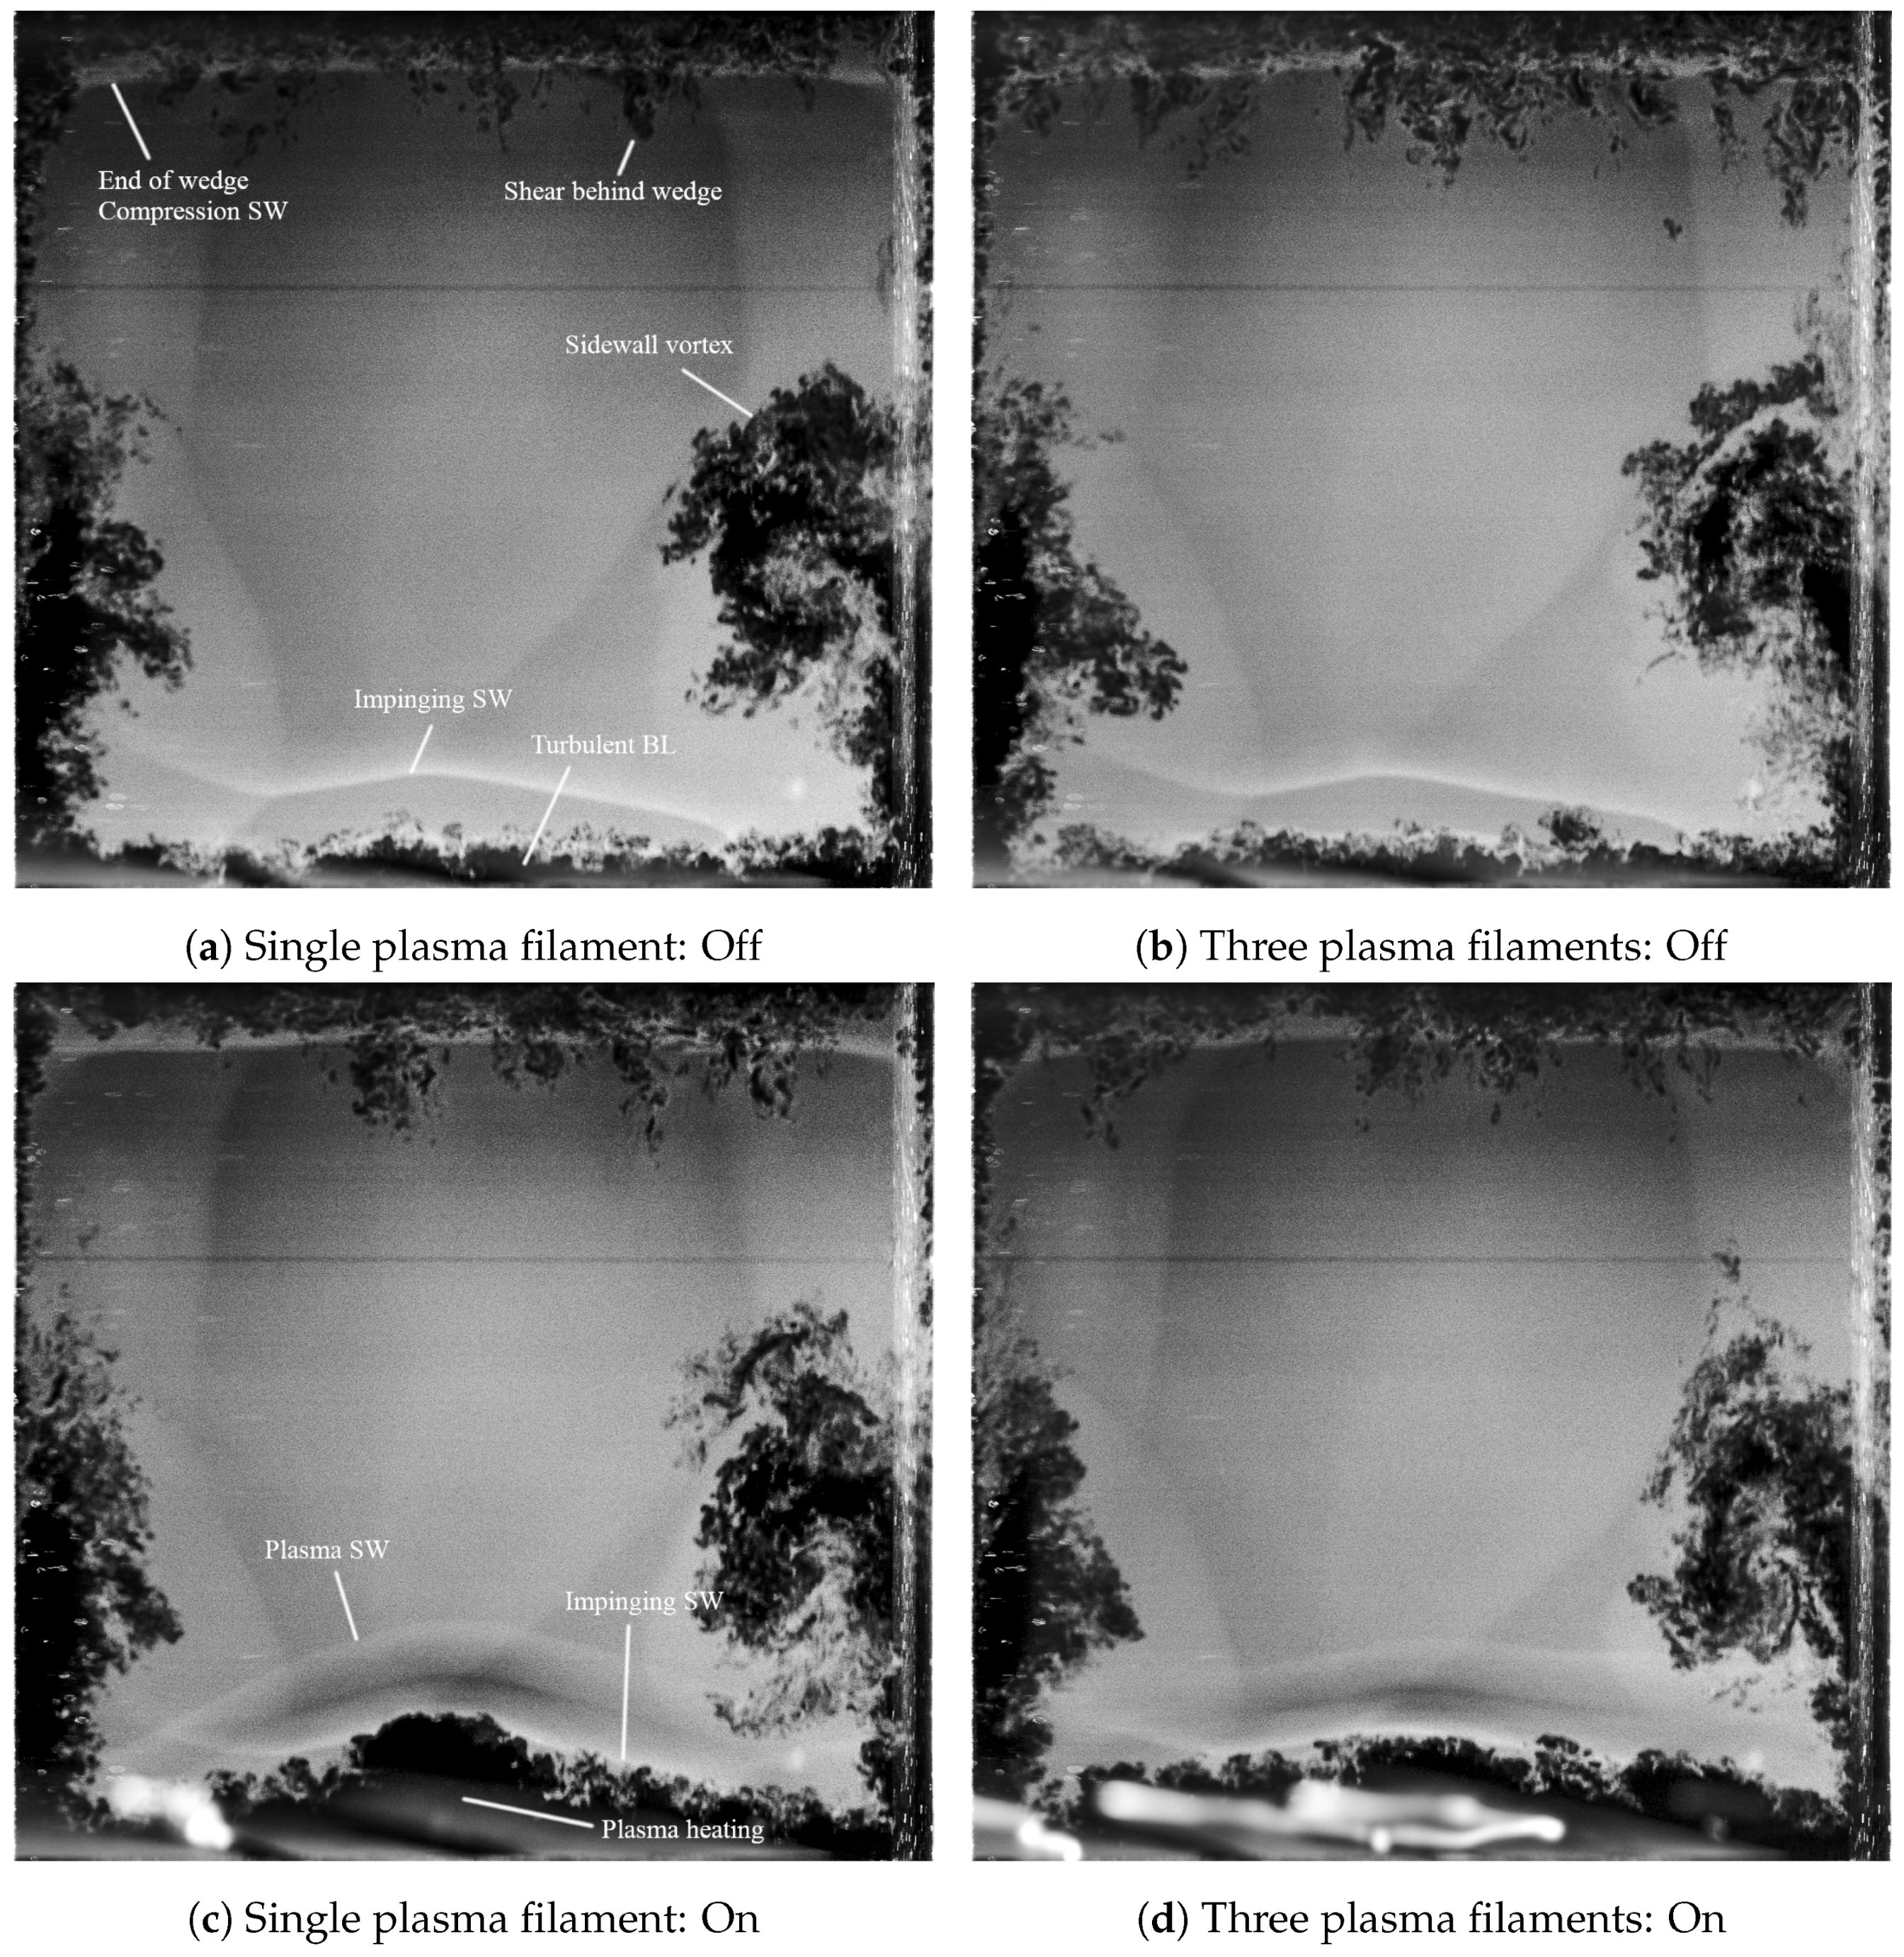
In addition to flow visualization by the schlieren imaging method, flow visualization of the SW structure in the zone of plasma was also performed by imaging planar Mie scattering. This technique was previously applied to Mach 2 flow using acetone vapor flow seeding [33] and repeated at Mach 4 using carbon dioxide gas seeding. In both cases, the flow was seeded by increasing the percentage of seeding gas and maintaining a constant stagnation temperature until the seeded gas condensation through the nozzle forms a sufficient density of nano/micro-droplets to maximize signal-to-noise ratio. Bulk CO2 seeding is performed by mixing pressurized carbon dioxide gas to the input air and measuring the added percentage of CO2 using a GasLab CM-40531 0–20% CO2 sensor at both input and by venting off of the plenum prior to tunnel run. The airflow was seeded with carbon dioxide so that the total concentration after mixing with air was 6–7% by volume. Seed gas concentration is largely specific to a given facility and simply affects the amount of condensation and thus total brightness of Mie scattering. Flow conditions used for Mie Scattering tests are summarized for convenience in Table 1.
Illumination is performed using a ns-pulsed Nd:YAG laser (Solar Laser Systems LQ 629–100) with a 100Hz repetition rate, frequency doubled from its fundamental wavelength of 1064 nm to produced a 532 nm beam. The laser pulse energy was measured by a thermopile power meter (Ophir 50A-PF-DIF-18) and is approximately 70 mJ/pulse. To image planar Mie scattering, the laser beam was formed into a sheet using a f = −50 mm cylindrical plano-concave lens and a 3-inch diameter f = 500 mm spherical plano-convex lens. The final sheet is aligned in the crossflow direction within the test section and is approximately 3 in tall and 200 μ m thick its waist. Images are acquired using a 4 MP Phantom v1840 camera with an exposure of 1 μ s synced so that the q-switch of the laser falls within the center of the exposure. By using an 85 mm, f/2.8 tilt-shift lens, the entire angled imaging plane could be kept in focus. The laser sheet position was also adjusted in 1 cm increments between tunnel runs to provide a 3D understanding of the flow features as shown in Figure 3.

3. Results

3.1. Electrical Discharge Appearance and Dynamics

The first test series aimed at characterization of the plasma geometry and the effect of an impinging shock on the plasma morphology. These tests results were acquired at T 0 = 297 K and P 0 = 2.6 bar or 4 bar. Three plasma pulses were activated with a pulse duration of 100 ms on followed by 100ms off during the middle of the run when the flow is closest to steady state. Two different ballast resistors (1 k Ω and 2 k Ω ) were used to control current vs. voltage characteristics of the plasma and provide different plasma powers. Figure 4 presents images of fully elongated plasma filaments for R b a l l a s t = 1 k Ω at Mach 4 flow comparing the three filament operation to when just one filament is activated. Filaments can ground to either rail, which means that the exact structure at any given time slightly varies. While images are not included here, the overall pattern observed is that when an impinging SW is present, the filaments are perturbed from their normal linear structure. This is a result of a variety of factors affecting the plasma geometry within the vicinity of the filaments including pressure increase, increased turbulence, and modification of the separation region, see Section 4.
Plasma temperature was measured by collecting spectra of the plasma luminescence and fitting it to the theoretical spectrum simulated by SpecAir for the second positive system of nitrogen to extract vibrational temperature ( T v ), rotational temperature ( T r ) and translational temperature ( T 0 ). The electron temperature ( T e ) was postulated to be as high as 1.2 eV based on Boltzig simulation. Under the conditions of a moderate magnitude of reduced electric field, E / n = ( 4 8 ) · 10 15 V cm 2 , estimated based on measured voltage, discharge length and gas temperature, the plasma from electrical discharge should be considered to be in a weakly nonequilibrium state [34], i.e., the translational, rotational, vibrational and electronic temperatures follow the expression T g T r < T v < T e . Figure 5 provides the experimentally collected spectrum as well as the final fit from which temperatures are extracted. Table 2 composes important plasma parameters at M = 4 . When plasma is turned on, rapid heating within the filament creates a local subsonic region around the filament since the sound speed within the filament drops below the physical gas velocity. Based on measured plasma temperature the sound speed within the filament is approximately a = γ R T g , p l a s m a 1200 m / s whereas the physical velocity is much lower as estimated by a 0 M = M γ R T g 670 m / s for T g = 71 K as calculated using isentropic flow relations. Key plasma characteristics at Mach 4 compared to the Mach 2 case are relatively low power and lower gas temperature along with a fairly diffuse filament. These characteristics are due primarily to the lower density of the flow.

3.2. Schlieren Visualization

Additional testing was focused on the plasma effect on the flow structure. Schlieren imaging provided path-integrated information on the locations of SW in the test section duct. Figure 6 presents schlieren images created by joining data from two separate tunnel runs so as to span the entire area of interest. Images collected before and after the center high voltage electrode is turned on are shown in Figure 6a,b, respectively, and images collected before and after all three high voltage electrodes are turned on are shown in Figure 6c,d. Before plasma is activated, the flowfield is dominated by a strong shock from the leading edge of the compression wedge, along with an expansion fan from the top of the wedge (visible as a black region downstream of the SW), an end shock from the ramp back wedge, and a reattachment SW downstream of the SW impingement. Near the middle of Figure 6a,c, the oblique compression SW generated by the ramp can be seen reflecting off the bottom wall. Once elongated plasma filaments form in this bottom wall region, the original reflected shock is largely mitigated and a new SW is seen originating upstream at the location of the high voltage electrodes as shown in Figure 6b,d. This causes an upstream shift of the whole shock train throughout the duct. In Figure 6b, this new SW pattern is less visible since a single plasma filament induces a semi-conical SW (as discussed in Section 3.4) occupying only a portion of the span-wise range. The effect of plasma on the configuration of the SW structure is also reflected in the wall pressure distribution, which corroborates this shift of the shock wave position upstream, as discussed in Section 3.3.

3.3. Pressure Measurements

By using the two rows of pressure taps in the plasma region, the SW movement observed in schlieren images can be confirmed by a corresponding pressure redistribution. The crossflow pressure distribution provides additional quantitative details on the plasma effect on the shock structure. In both rows, when plasma is turned on, the sudden increase in pressure across the row indicates an upstream movement of the pre-existing reflected SW such that the row of pressure taps is now located behind this shock. In the three filament case, the pressure increases uniformly across the entire row indicating a planar redistribution of the SW. In the single filament case, the pressure increases most at the tunnel center-line with a conical profile across the row due to a partial movement of the SW upstream. Pressure distribution profiles from row 2 are graphed across three plasma pulses in time in Figure 7 illustrating this effect.
Using time resolved pressure data taken from key locations, the dynamics of the shock movement seen in schlieren images was further investigated. Using Kulite sensors installed on the top wall in the region where the reflected SW impinges and in the plasma region provides this time-resolved data quantifying how long it takes for the SW movement to occur. Figure 8 provides the location of these installed sensors and the pressure dynamics at those tap locations. As the reflected shock impacting the top wall moves upstream due to plasma actuation, the pressure at x = 35.5 cm on the top wall dramatically increases indicating this sensor is now located behind the new shock front whereas the pressure at x = 41.2 cm decreases suddenly since the reflected SW is no longer directly impinging. Likewise, both locations in the plasma region experience a rapid jump in pressure as the SW shifts upstream. When plasma is turned on, there is an initial delay of about Δ t = 250 μ s before any effect on pressure is recorded: this time is concurrent with plasma filament formation and elongation by the flow. After plasma is turned on and fully elongated, the new SW pattern and pressure redistribution takes places in about Δ t = 2 ms. Likewise, after plasma is turned off pressures return to their pre-plasma baseline levels also within about Δ t = 2 ms. Between all Kulite locations, there is agreement that the redistribution of the shock train occurs in <2 ms.

3.4. Flow Structure Details by Mie Scattering Visualization

While schlieren images provide excellent visualization of stream-wise features of SW-plasma interaction, Mie scattering was used to probe the cross-flow SW structure when the impingent SW interacts with the plasma filaments. Images were collected at an angle through the side windows of the tunnel and a known calibration grid image was used to apply a projective transform and extract quantitative dimensions from the resulting orthogonal view. In this work, planar laser Mie scattering is applied to qualitatively map condensation in cold M = 4 flow, visualizing the SWs, BLs, and other zones with gas density variation or gas temperature variation. As the bulk air is seeded with CO2 in amount up to 7% in number density, significant condensation can occur.
It is assumed that the intensity of scattered light corresponds to the number of droplets and thus is a function of the local gas density and temperature. In Mie scattering images, oblique SWs appear as bright lines that mark the transition between dimmer regions upstream of the shock and slightly brighter regions downstream of the SW. Figure 9 provides an example of the images collected at laser sheet position x = 4 cm downstream from the electrode. There are many details of the flow structure acquired by Mie scattering and visible in Figure 9, including the impinging SW interaction with side walls and side walls vortices, which normally cannot be retrieved from schlieren images. Each side wall vortex strongly interacts with the wedge generated compression SW, but the impact on the plasma-SW interaction is still unknown. By scanning the laser sheet across the region of interaction, the cross-flow profiles of the plasma generated SW were mapped. Figure 10 illustrates the final 3D surface generated by merging each of the shock profiles together. The resulting SW surface matches predictions of a semi-conical SW due to a localized subsonic channel around the plasma filament. The SW is assumed to originate from the plasma electrode, however, visualization is challenging within the turbulent boundary layer since increased heating causes droplets to re-evaporate.

4. Discussion

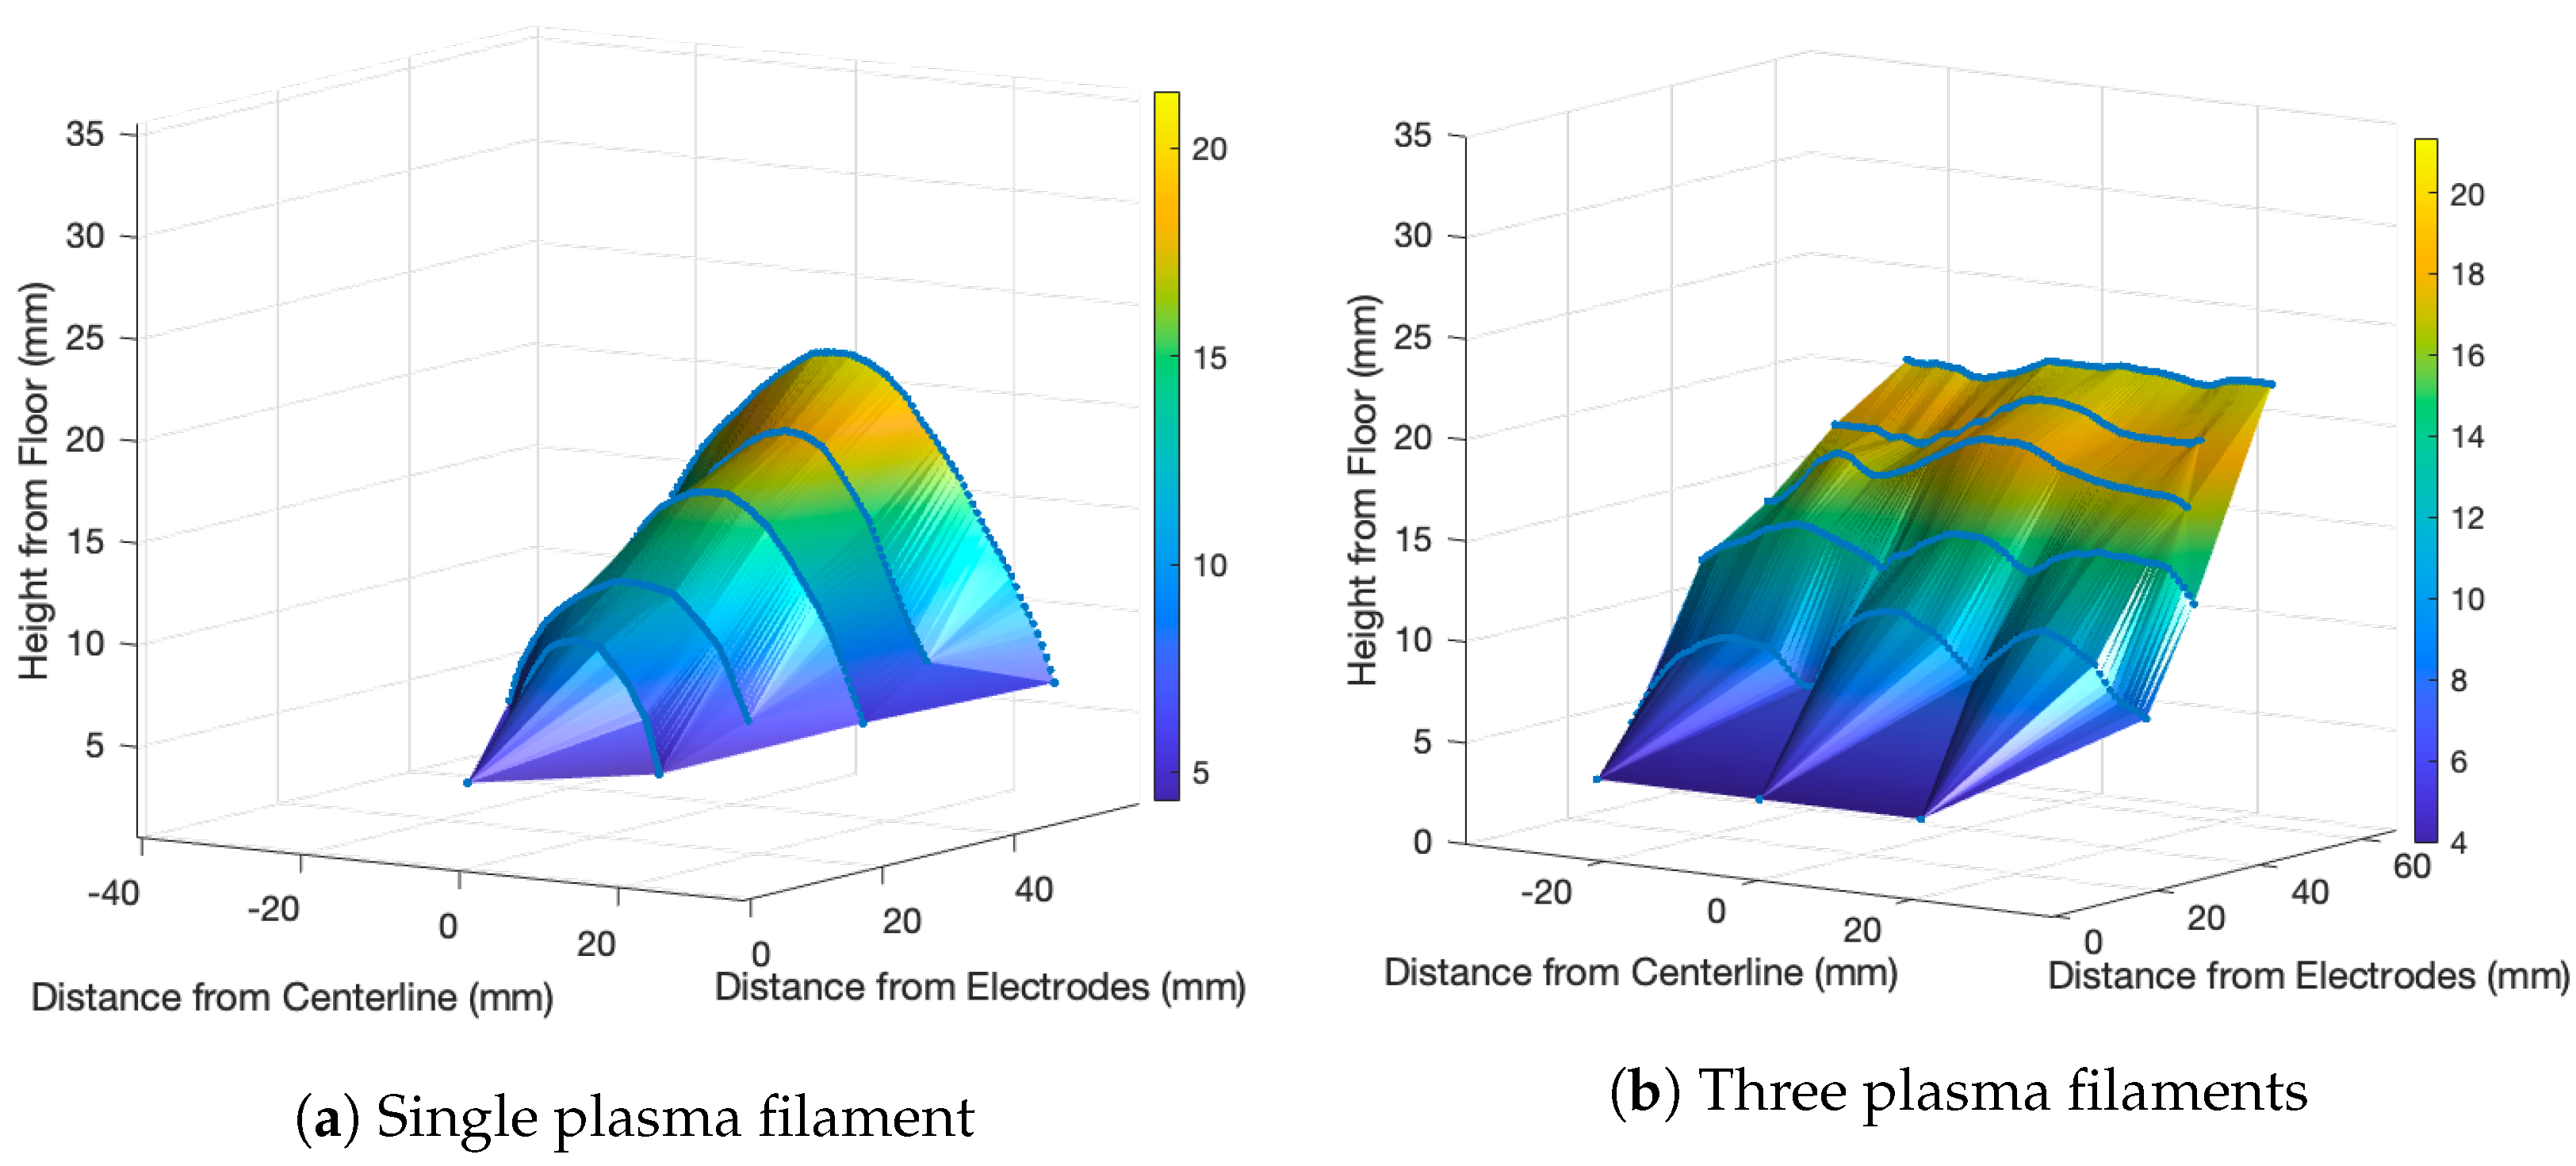
In accordance with the model of interaction and the data acquired for a single plasma filament, theory and simulation [
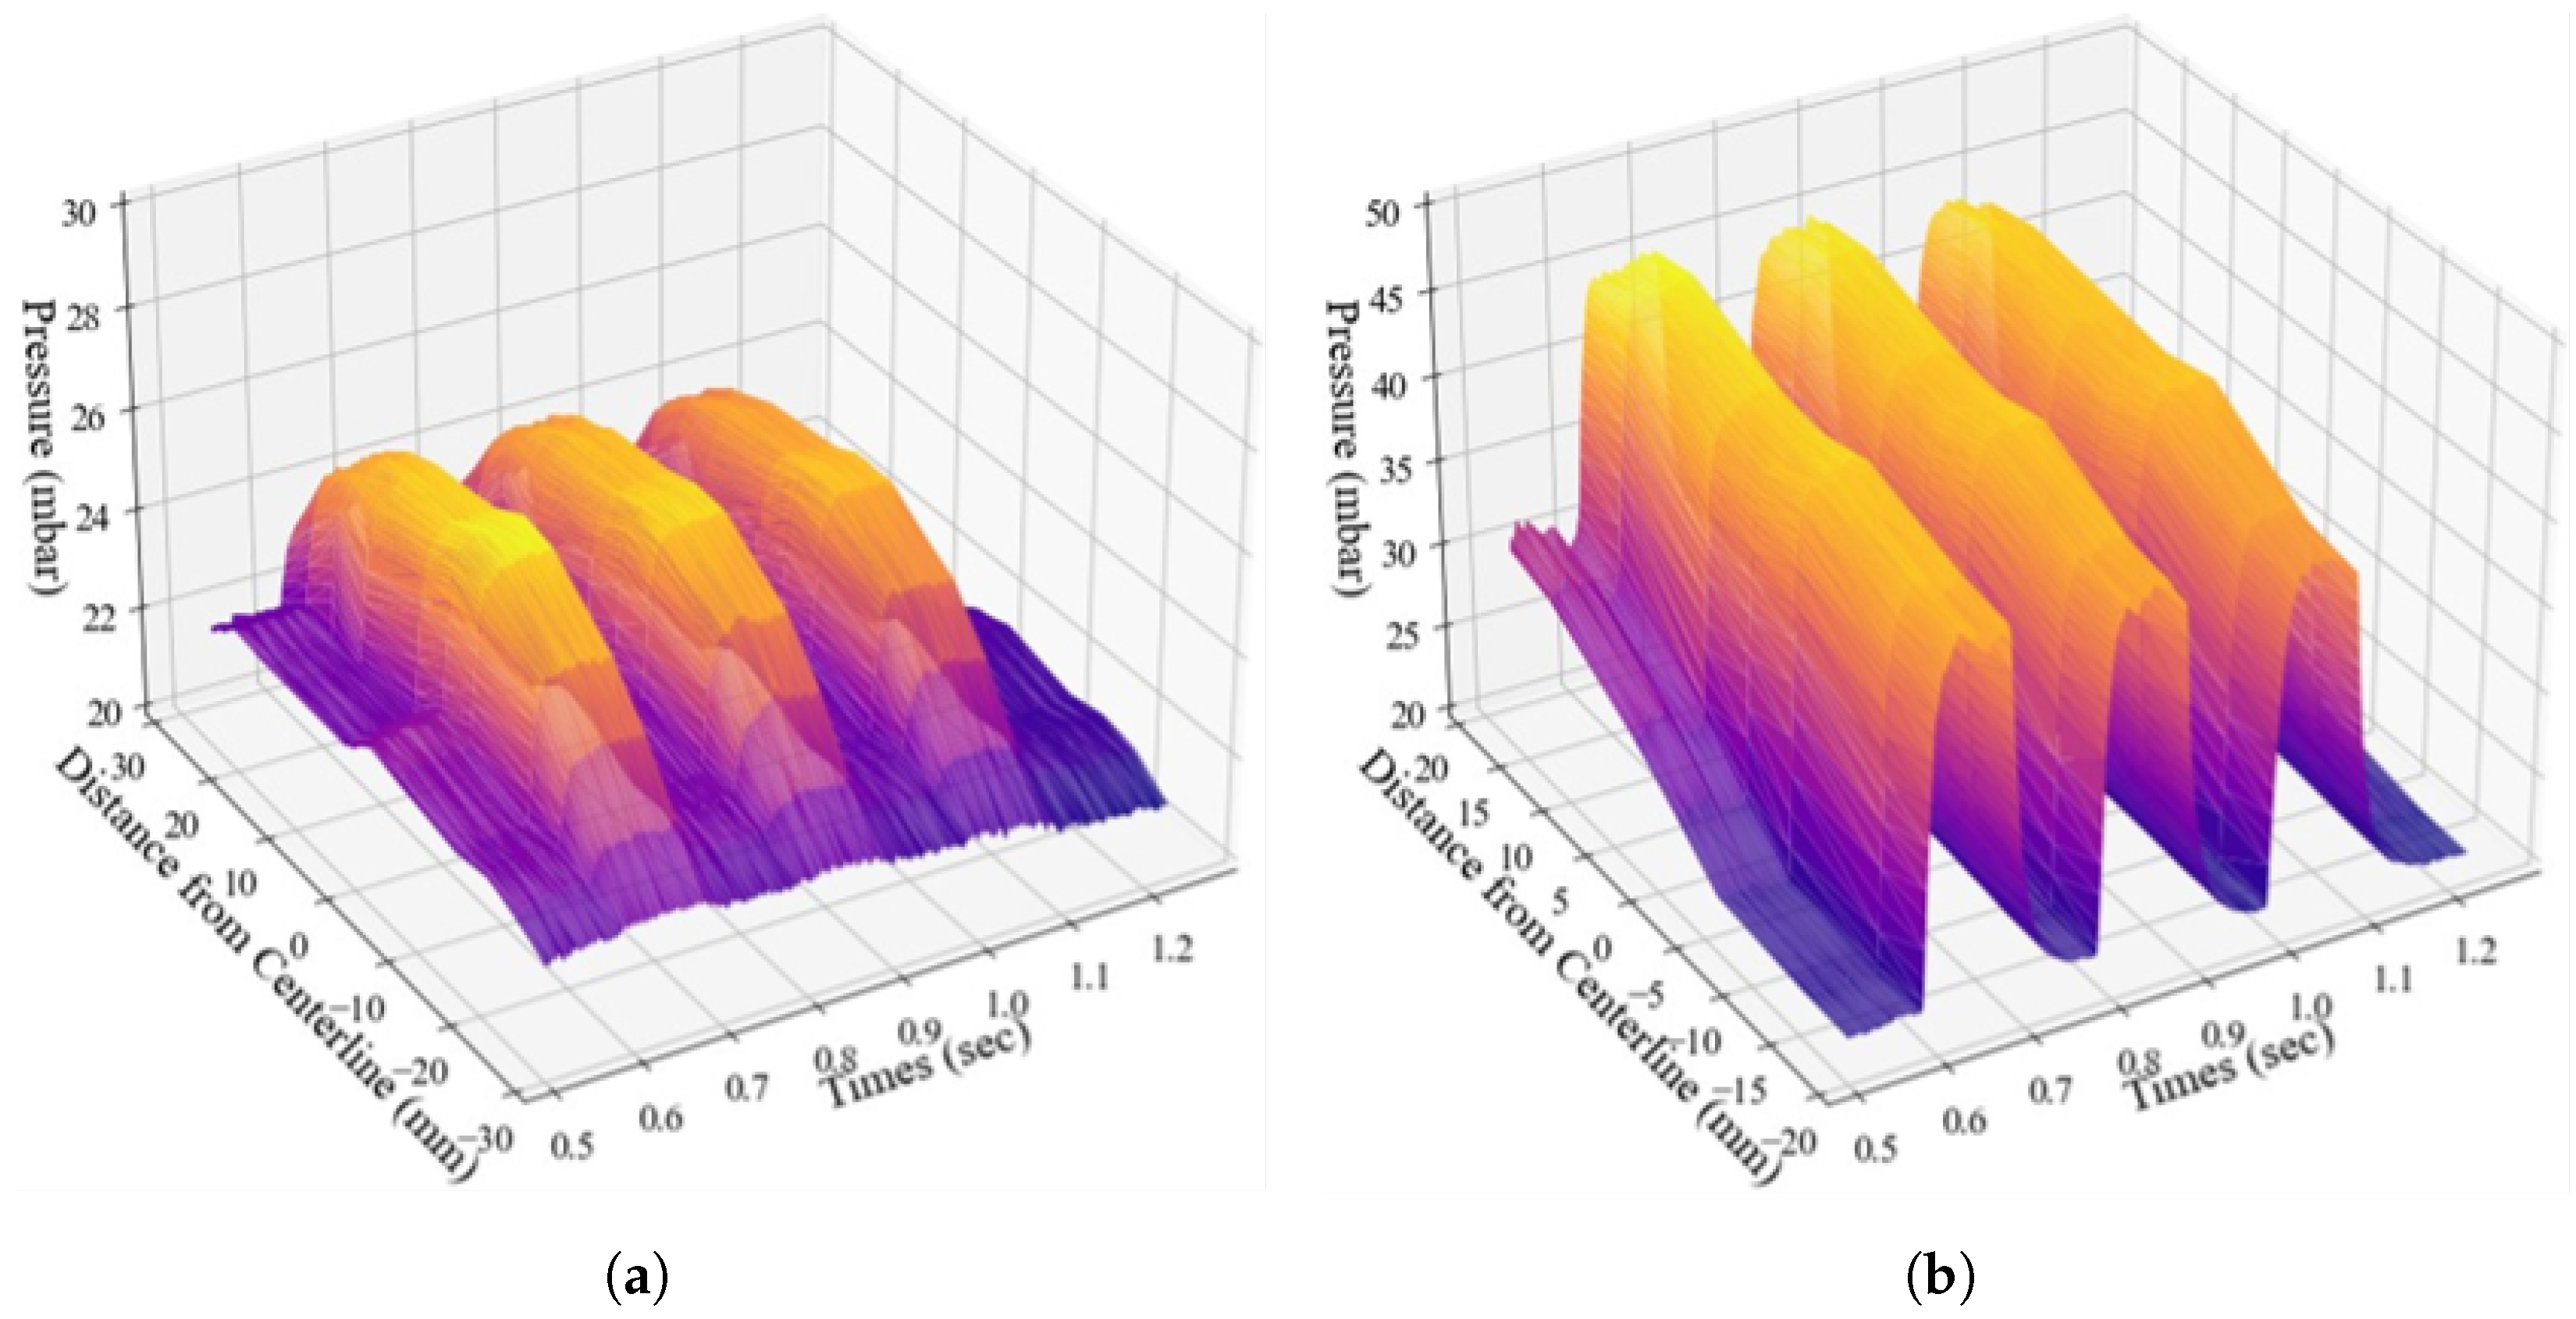
23] predict a semi-cone shape of plasma-induced SW with a zone of augmented pressure within the cone and a significantly lower pressure outside. With multifilamentary plasma arrays, individual SWs interfere with each other, resulting in almost planar plasma-induced SW, which is equivalent to shifting the entire shock train upstream. By analyzing cross-flow pressure distributions for single and triple plasma filament configurations as well as observing carbon dioxide Mie scattering, the predicted effect is now experimentally demonstrated at M = 4 . For various conditions [12,13,14,23], including supersonic flows with M = 2 and M = 4 , filamentary plasma authority has been well demonstrated. This essentially thermal interaction mechanism is illustrated in 
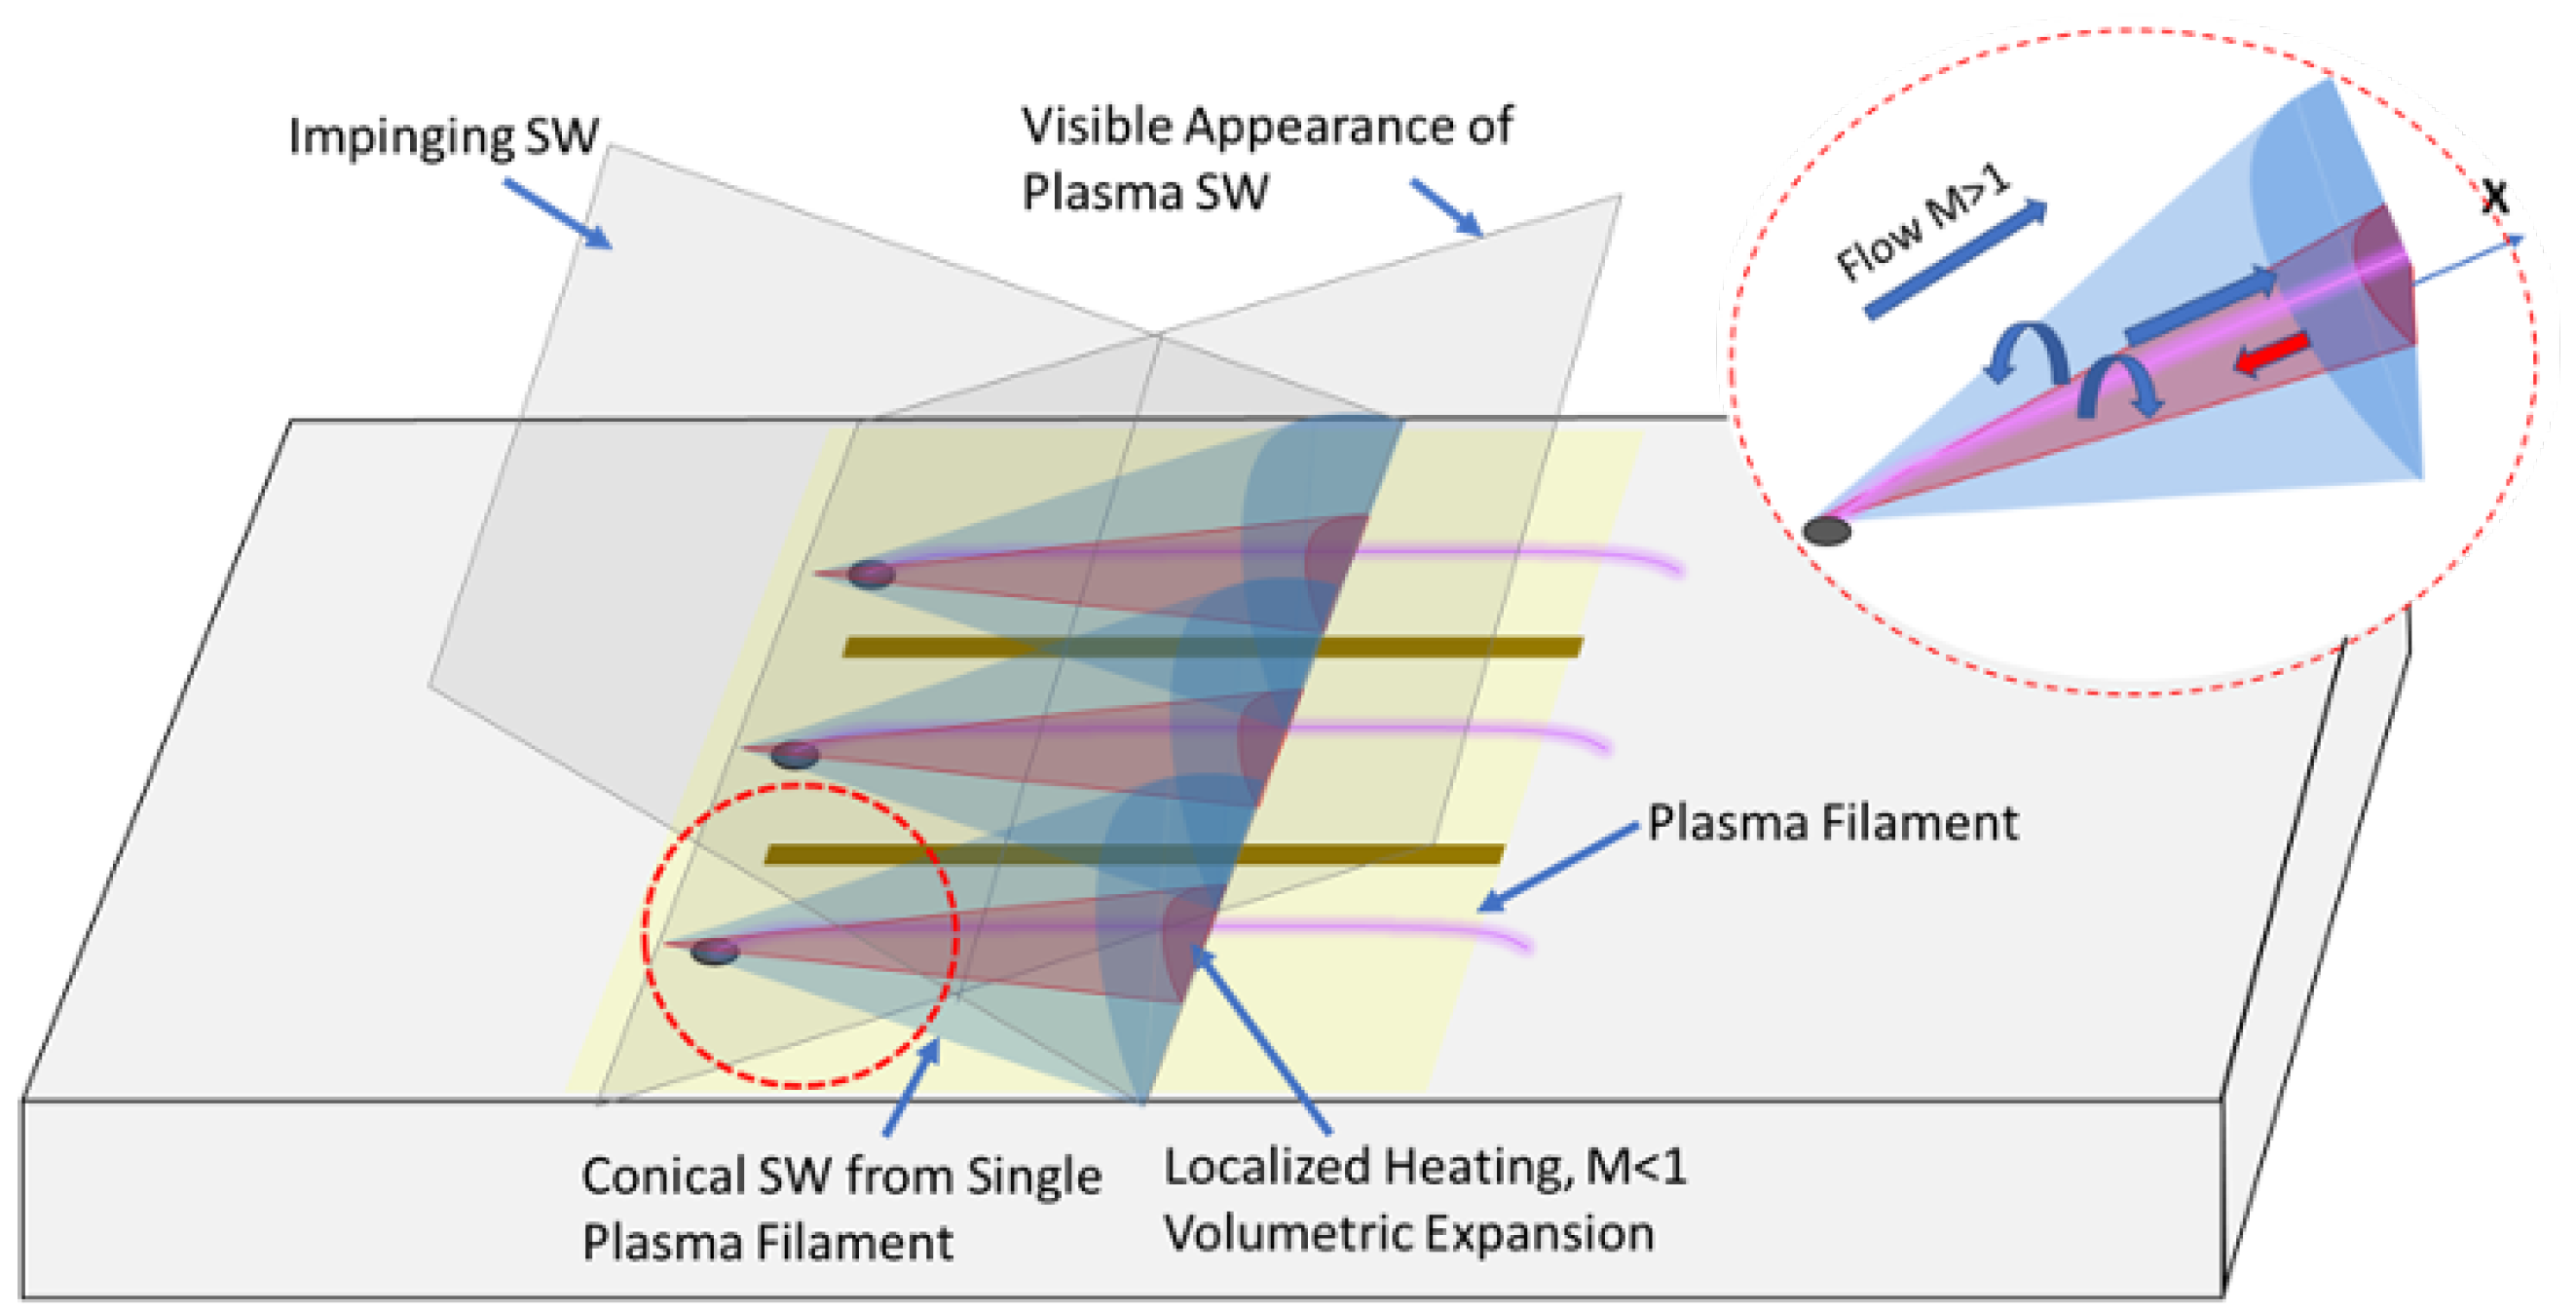
Figure 11: with a high local gas temperature, the multifilamentary plasma zone presents an array of longitudinal subsonic jets enclosed in a supersonic flow. A volumetrically expanded zone produces a long cone of subsonic flow in which the gas speed is similar to that of the supersonic core flow [13]. Side flow-wise vortices, similar to those generated over the mechanical obstacles or wall-injected jets, push the plasma filament up to the core flow while warm zones beneath the plasma filaments include areas with a reversal in the direction of the gas flow. Gas pressure is significantly redistributed due to such an unusual gasdynamic structure. A pressure bump caused by an impinging SW is mitigated and moves upstream until reaching electrode locations. The negative x-gradient of pressure is reduced significantly due to a presence of flow reversal. The redistribution of gas pressure in this way causes the reflected SW to be mitigated and appears as if a new SW is originating from the electrodes. This mechanism is illustrated in Figure 11.
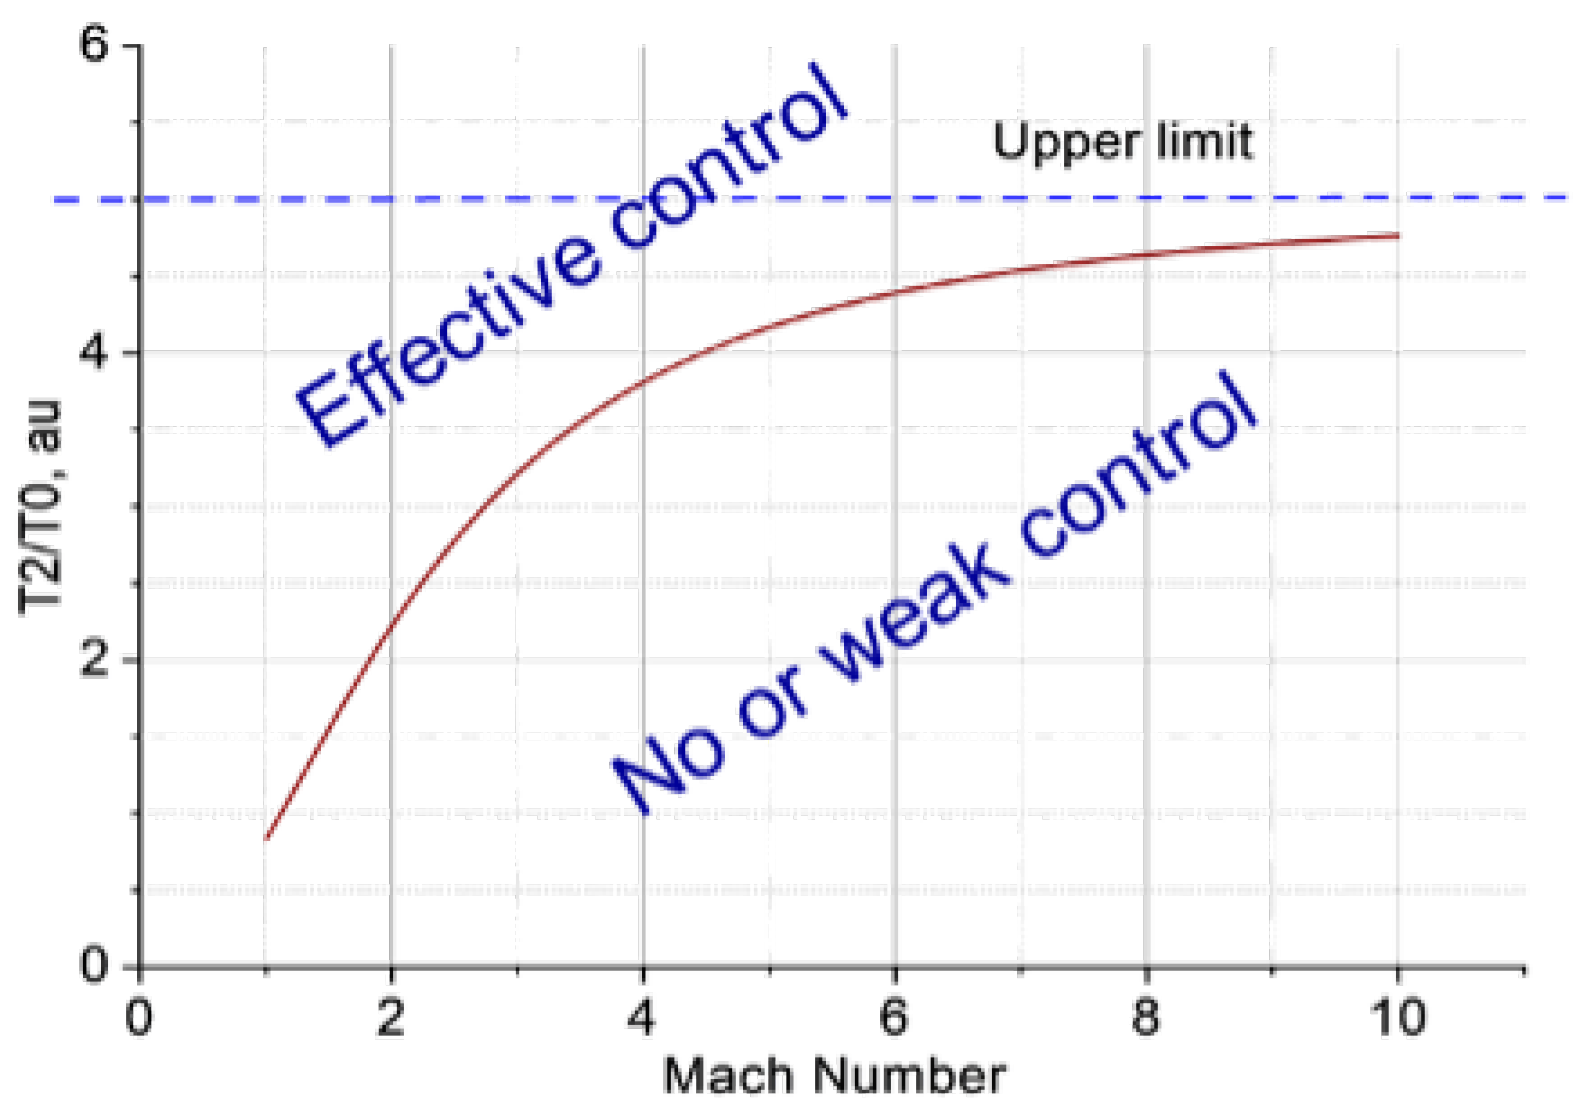
Based on the mechanism of SW-BL-plasma interaction, a simplified criterion of effective SW position control can be proposed assuming the following conditions: constant γ , M 2 < 1 , where M 2 is subsonic Mach number in plasma filaments and immediately surrounded area; and v 2 v 1 —that is, the physical gas velocity inside the plasma filament is about that of the external flow velocity [15]. With such speculations, the gas temperature T 2 in plasma channel should satisfy the following expression:
T 2 > T 0 1 M 2 + γ 1 2 1
where T 0 is stagnation gas temperature in external flow with Mach number M. For example, for M = 2 the temperature T 2 > 2.2 T 0 ; for M = 4 , T 2 > 3.8 T 0 . The criterion is shown graphically in Figure 12; the curve coming to a T 2 / T 0 = 5 limit at high Mach number. The criterion is well-achievable at low T0 but could be challenging at higher temperatures, T 0 > 1 kK for example.

5. Conclusions

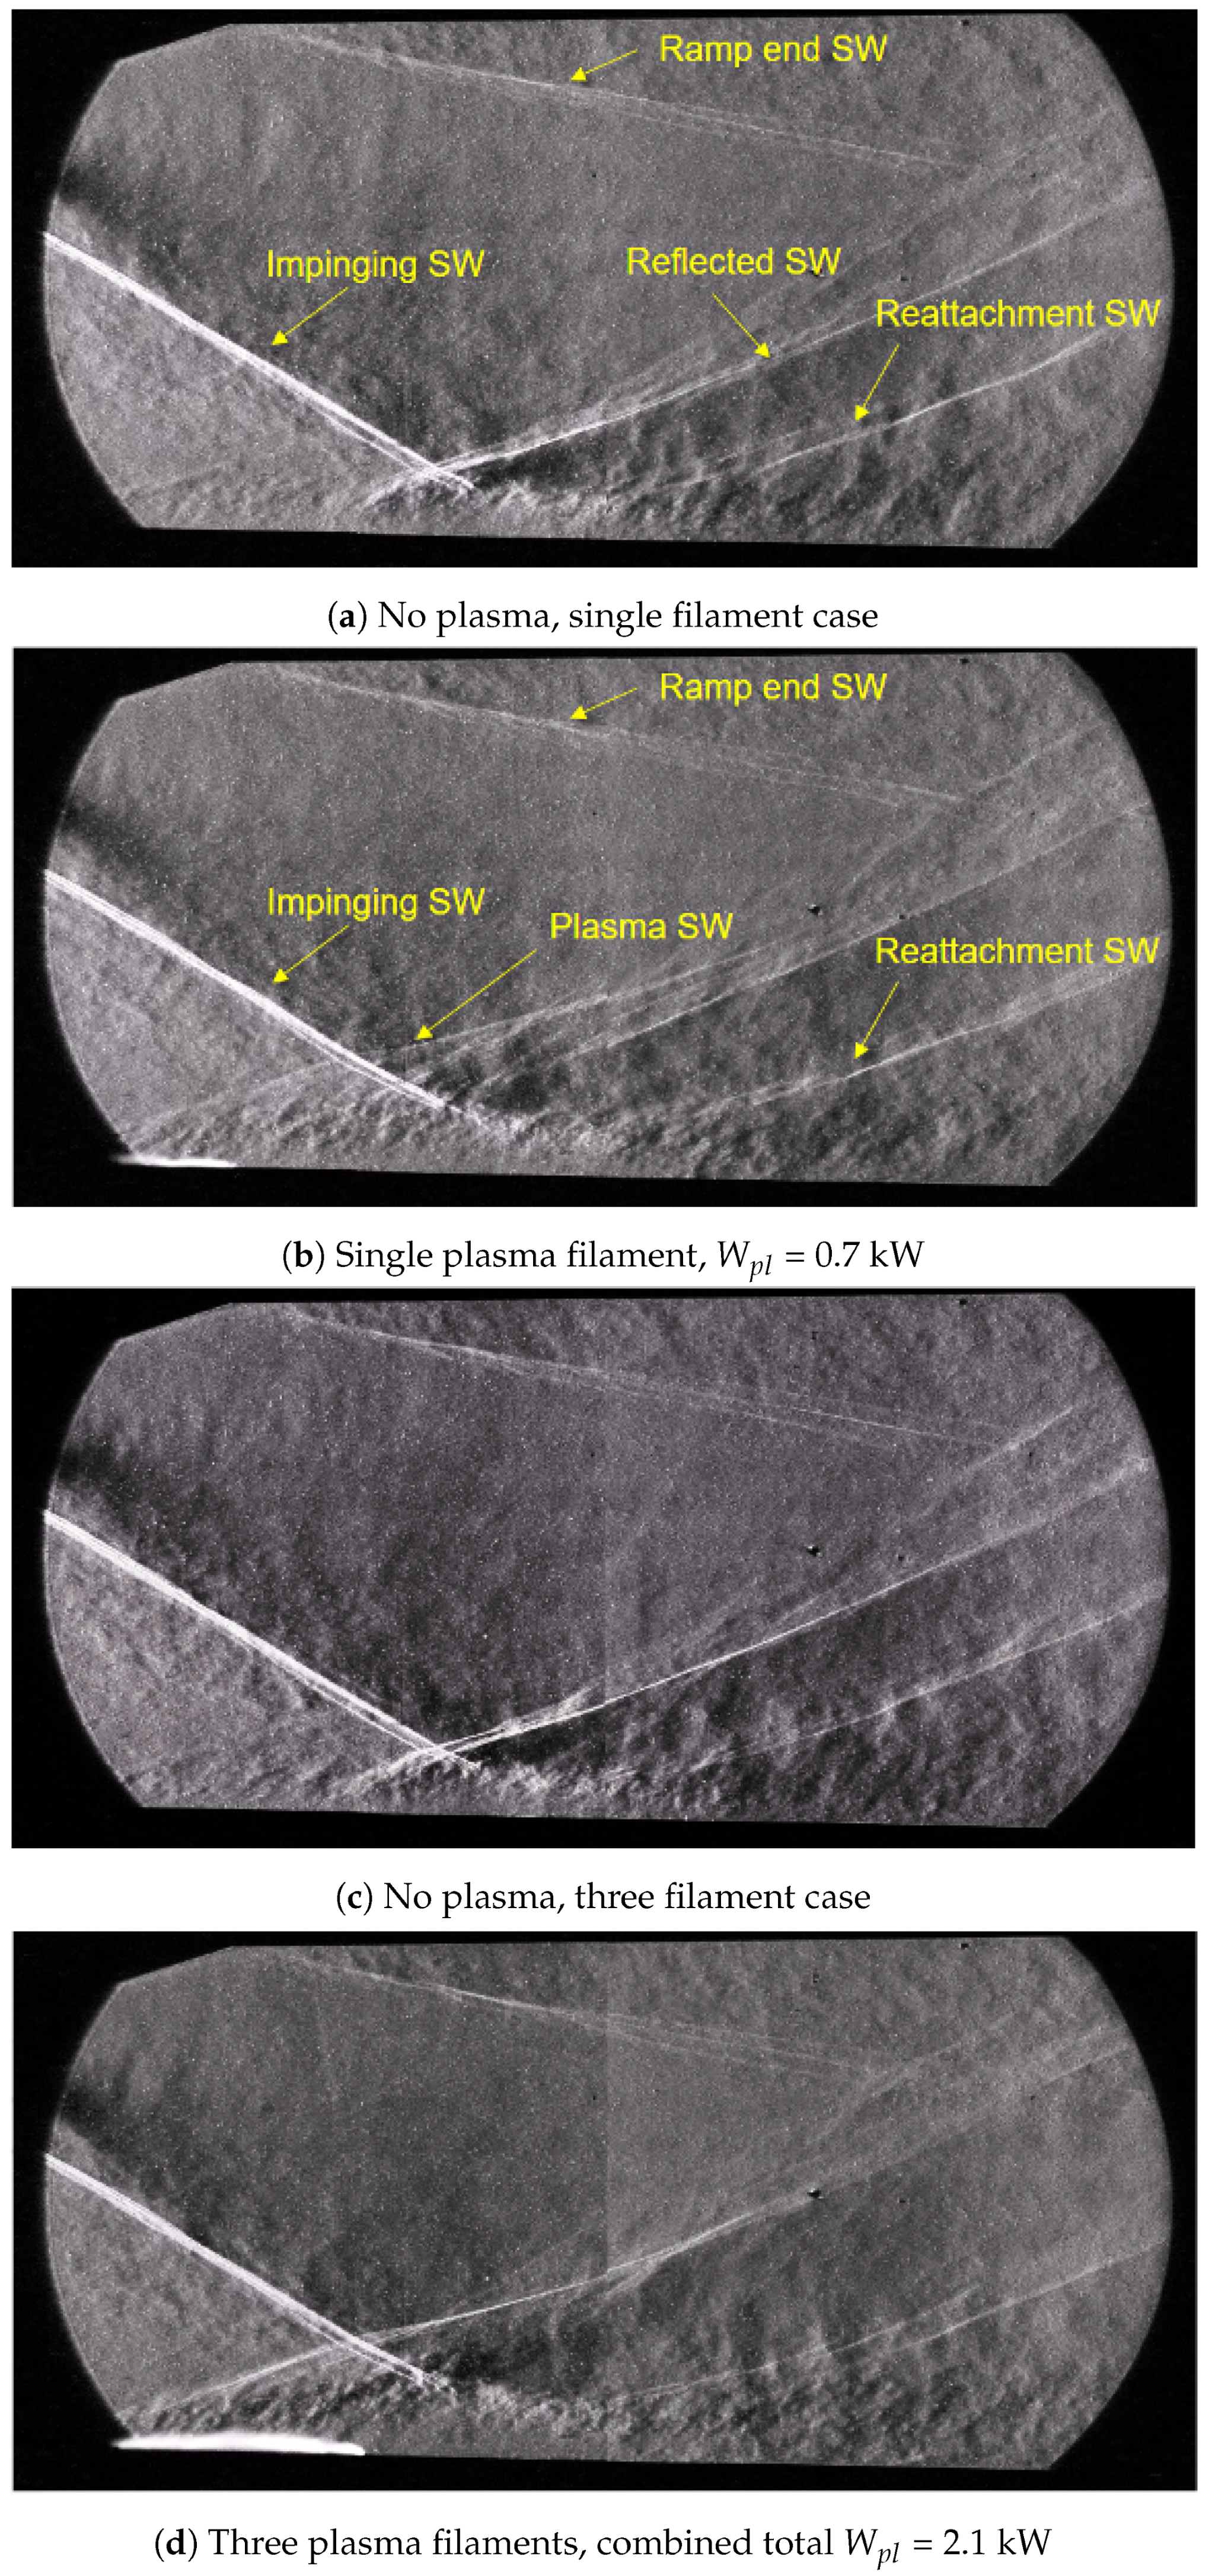
This paper discusses the experimental results of a filamentary plasma effect on a shock-dominated supersonic flow in a rectangular duct. Based on schlieren visualization, pressure measurements, and Mie scattering visualization, the major findings of this work are new details of a SW—plasma array/single filament interaction including the shape of the plasma-induced semi-conical SW and the dynamics of the plasma-induced SW. In schlieren images, the wall reflection of SW originating from the ramp appears to be reduced in magnitude or even vanishes, along with the emergence of new oblique SWs at electrode locations. Consequently, a new SW train forms within the test duct, shifting upstream from the previous pattern. Pressure sensor measurements indicate that a delay of approximately 2 ms occurs after plasma activation, followed by a similar delay during the return to baseline flow following plasma switching off.
Through analysis of experimental data, a thermal mechanism of interaction can be formulated as well as a simplified criterion for effective control of SW position. Based on this, the critical plasma temperature for the triggering effect to work is a rising function of the flow Mach number. It is also concluded that the method might be especially effective for cold external flow.
It is a paradigm-shifting concept to use plasma as an active trigger action for SW position control. In supersonic or hypersonic flows, narrow subsonic channels are opened to allow pressure to drain into an upstream area, creating a significant pressure redistribution despite a very small energy deposition relative to the flow total enthalpy.

Author Contributions

Conceptualization, P.A., P.L. and S.L.; methodology, P.L. and P.A.; formal analysis, P.A. and P.L.; investigation, P.A.; resources, S.L.; data curation, P.A.; writing—original draft preparation, P.A. and S.L.; writing—review and editing, P.A. and S.L.; visualization, P.A.; supervision, S.L.; project administration, S.L.; funding acquisition, S.L. All authors have read and agreed to the published version of the manuscript.

Funding

The authors appreciate the US Air Force Office of Scientific Research (PM Dr. Gregg Abate) for funding this work, grant number FA9550-21-1-0006.

Institutional Review Board Statement

Not applicable.

Informed Consent Statement

Not applicable.

Data Availability Statement

Data available upon request.

Conflicts of Interest

The authors declare no conflict of interest.

Abbreviations

The following abbreviations are used in this manuscript:
SWShock Wave
SWBLIShock Wave Boundary Layer Interaction
Q-DCQuasi Direct Current

References

  1. Van Wie, D.M. Scramjet Inlets. In Scramjet Propulsion; Curran, E.T., Murthy, S.N.B., Eds.; AIAA: Reston, NJ, USA, 2001; pp. 447–511. [Google Scholar]
  2. Heiser, W.H.; Pratt, D.T. Compression Systems or Components. In Hypersonic Airbreathing Propulsion, Educational Series; AIAA: Washinton, DC, USA, 1994; pp. 197–275. [Google Scholar]
  3. Matsuo, K.; Miyazato, Y.; Kim, H. Shock train and pseudoshock phenomena in internal gas flows. Prog. Aerosp. Sci. 1999, 35, 33–100. [Google Scholar] [CrossRef]
  4. Reinartz, B.U.; Herrmann, C.D.; Ballmann, J. Aerodynamic Performance Analysis of a Hypersonic Inlet Isolator Using Computation and Experiment. J. Porpulsion Power 2003, 19, 868–875. [Google Scholar] [CrossRef]
  5. Clemens, N.T.; Narayanaswamy, V. Low-Frequency Unsteadiness of Shock Wave/Turbulent Boundary Layer Interactions. Annu. Rev. Fluid Mech. 2014, 46, 469–492. [Google Scholar] [CrossRef]
  6. Dolling, D.S. Fifty Years of Shock-Wave/Boundary-Layer Interaction Research: What Next? AIAA J. 2001, 39, 1517–1531. [Google Scholar] [CrossRef]
  7. Surber, E.L.; Tinapple, J.A. Inlet Flow Control Technology: Learning from History, Reinventing the Future. AIAA 2012. [Google Scholar] [CrossRef]
  8. Weiss, A.; Olivier, H. Shock boundary layer interaction under the influence of a normal suction slot. Shock Waves 2014, 24, 11–19. [Google Scholar] [CrossRef]
  9. Valdivia, A.; Yuceil, K.B.; Wagner, J.L.; Clemens, N.T.; Dolling, D.S. Control of Supersonic Inlet-Isolator Unstart Using Active and Passive Vortex Generators. AIAA J. 2014, 52, 1207–1218. [Google Scholar] [CrossRef]
  10. Do, H.; Im, S.-K.; Mungal, M.G.; Cappelli, M.A. The influence of boundary layers on supersonic inlet flow unstart induced by mass injection. Exp. Fluids 2011, 51, 679–691. [Google Scholar] [CrossRef]
  11. Chang, J.; Li, N.; Xu, K.; Bao, W.; Yu, D. Recent research progress on unstart mechanism, detection and control of hypersonic inlet. Prog. Aerosp. Sci. 2017, 89, 1–22. [Google Scholar] [CrossRef]
  12. Leonov, S.B.; Adamovich, I.V.; Soloviev, V.R. Dynamics of near-surface electric discharges and mechanisms of their interaction with the airflow, Topical Review. Plasma Sources Sci. Technol. 2016, 25, 20168. [Google Scholar] [CrossRef]
  13. Houpt, A.; Hedlund, B.; Leonov, S.; Ombrello, T.; Carter, C. Quasi-DC Electrical Discharge Characterization in a Supersonic Flow. Exp. Fluid 2017, 58, 25. [Google Scholar] [CrossRef]
  14. Elliott, S.; Andrews, P.; Lax, P.; Leonov, S.B. Control of Shock Positions in a Supersonic Duct by Plasma Array. In Proceedings of the AIAA SCITECH Forum, San Diego, CA, USA, 3–7 January 2022. AIAA Paper 2022-2553. [Google Scholar]
  15. Azarova, O.A.; Lapushkina, T.A.; Krasnobaev, K.V.; Kravchenko, O.V. Redistribution of Energy during Interaction of a Shock Wave with a Temperature Layered Plasma Region at Hypersonic Speeds. Aerospace 2021, 8, 326. [Google Scholar] [CrossRef]
  16. Azarova, O. Supersonic Flow Control Using Combined Energy Deposition. Aerospace 2015, 2, 118–134. [Google Scholar] [CrossRef]
  17. Bityurin, V.; Klimov, A.; Leonov, S.; Wie, D.V.; Brovkin, V.; Kolesnichenko, Y.; Lutsky, A. Effect of heterogeneous discharge plasma on shock wave structure and propagation. In Proceedings of the 9th International Space Planes and Hypersonic Systems and Technologies Conference, Norfolk, VA, USA, 1–5 November 1999. AIAA Paper 1999-4940. [Google Scholar]
  18. Knight, D. Survey of Aerodynamic Drag Reduction at High Speed by Energy Deposition. J. Propuls. Power 2008, 24, 1153–1167. [Google Scholar] [CrossRef]
  19. Shang, J.; Surzhikov, S.; Kimmel, R.; Gaitonde, D.; Menart, J.; Hayes, J. Mechanisms of plasma actuators for hypersonic flow control. Prog. Aerosp. Sci. 2005, 41, 642–668. [Google Scholar] [CrossRef]
  20. Raizer, I.P. Laser-Induced Discharge Phenomena/Yu. P. Raizer; translated from Russian by Albin Tybulewicz; Vlases, G.C., Pietrzyk, Z.A., Eds.; Consultants Bureau: New York, NY, USA, 1977; p. xiv. 366p. [Google Scholar]
  21. Starikovskiy, A.; Aleksandrov, N. Aeronautics and Astronautics; Chapter Nonequilibrium Plasma Aerodynamics; Intech Open: London, UK, 2011. [Google Scholar]
  22. Falempin, F.; Firsov, A.; Yarantsev, D.; Goldfeld, M.; Timofeev, K.; Leonov, S. Plasma control of shock wave configuration in off-design mode of M = 2 inlet. Exp. Fluids 2015, 56, 54. [Google Scholar] [CrossRef]
  23. Watanabe, Y.; Elliott, S.; Firsov, A.; Houpt, A.; Leonov, S. Rapid control of force/momentum on a model ramp by quasi-DC plasma. J. Phys. D Appl. Phys. 2019, 52, 444003. [Google Scholar] [CrossRef]
  24. Li, Y.H.; Wu, Y.; Zhou, M.; Su, C.B.; Zhang, X.W.; Zhu, J.Q. Control of the corner separation in a compressor cascade by steady and unsteady plasma aerodynamic actuation. Exp. Fluids 2010, 48, 1015–1023. [Google Scholar] [CrossRef]
  25. Sun, Q.; Li, Y.; Cheng, B.; Cui, W.; Liu, W.; Xiao, Q. The characteristics of surface arc plasma and its control effect on supersonic flow. Phys. Lett. A 2014, 378, 2672–2682. [Google Scholar] [CrossRef]
  26. Yan, H.; Liu, F.; Xu, J. Study of Oblique Shock Wave Control by Surface Arc Discharge Plasma. AIAA J. 2018, 56, 532–541. [Google Scholar] [CrossRef]
  27. Elliott, S.; Lax, P.; Leonov, S. Realignment of Shock Wave Reflection Pattern by Plasma Array. In Proceedings of the AIAA SCITECH Forum, Virtual, 11–22 January 2021. AIAA Paper 2021-3116. [Google Scholar]
  28. Elliott, S.; Hasegawa, M.; Sakaue, H.; Leonov, S. Shock-dominated flow control by plasma array: Pressure analysis including pressure-sensitive paint visualization. Exp. Therm. Fluid Sci. 2022, 131, 110522. [Google Scholar] [CrossRef]
  29. Clemens, N.; Mungal, M. A planar Mie scattering technique for visualizing supersonic mixing flows. Exp. Fluids 1991, 11, 175–185. [Google Scholar] [CrossRef]
  30. Fischer, A. Imaging Flow Velocimetry with Laser Mie Scattering. Appl. Sci. 2017, 7, 1298. [Google Scholar] [CrossRef]
  31. Jinno, S.; Fukuda, Y.; Sakaki, H.; Yogo, A.; Kanasaki, M.; Kondo, K.; Faenov, A.; Skobelev, I.; Pikuz, T.; Boldarev, A.; et al. Mie scattering from submicron-sized CO2 clusters formed in a supersonic expansion of a gas mixture. Opt. Express 2013, 21, 20656–20674. [Google Scholar] [CrossRef] [PubMed]
  32. Andrews, P.; Lax, P.; Elliott, S.; Firsov, A.; Leonov, S. Flow Characterization at Heated Air Supersonic Facility SBR-50. Fluids 2022, 7, 168. [Google Scholar] [CrossRef]
  33. Andrews, P.S.; Elliott, S.; Lax, P.; Leonov, S.B. Study of pressure redistribution under plasma filament effect on shock wave reflection. In Proceedings of the AIAA AVIATION, Reston, VA, USA, 27 June–1 July 2022. AIAA 2022-3498. [Google Scholar]
  34. Benilov, M.S.; Naidis, G.V. Modelling of low-current discharges in atmospheric-pressure air taking account of non-equilibrium effects. J. Phys. D Appl. Phys. 2003, 36, 1834–1841. [Google Scholar] [CrossRef] [Green Version]
Figure 1. Illustration of the mechanism of SW interaction with thermally nonuniform layer: (a) schematics; (b) SW interaction with a thermally stratified zone, adapted from [17].
Energies 15 07104 g001
Figure 2. SBR-50 facility test arrangement: (a) side view cross-section; (b) schematics of the bottom insert.
Energies 15 07104 g002
Figure 3. Overview of crossflow Mie scattering setup. Images of Mie scattering by CO 2 condensation are recorded at a shallow angle through side window.
Energies 15 07104 g003
Figure 4. High speed image of plasma filaments an exposure time of 4 μ s for (a) triple plasma filaments vs. (b) single filament. Flow is from left to right.
Energies 15 07104 g004
Figure 5. Fitting of experimental spectrum collected from plasma luminescence to the second positive system of nitrogen where (a) provides full wavelength range and (b,c) illustrate quality of fit in key wavelength ranges.
Energies 15 07104 g005
Figure 6. Schlieren images collected at P 0 = 1.7 bar for left to right flow.
Energies 15 07104 g006
Figure 7. Time series across Row 2 of pressure taps as labeled in Figure 2b. Data is shown for three consecutive plasma pulses, each with duration 100 ms on followed by 100 ms off. Comparison of pressure redistribution at P 0 = 2.6 bar between (a) single filament and (b) three filaments actuation.
Energies 15 07104 g007
Figure 8. (a) Locations of pressure taps in which Kulite sensors were installed; (b) pressure dynamics at each location when plasma is turned on at t = 1 s.
Energies 15 07104 g008
Figure 9. Mie scattering visualization of crossflow features during a plasma pulse.
Energies 15 07104 g009
Figure 10. Resulting SW surfaces after merging plasma SW profiles taken from Mie scattering images.
Energies 15 07104 g010
Figure 11. Illustration of SW-BL-plasma interaction model.
Energies 15 07104 g011
Figure 12. Simplified criteria of plasma control of SW position.
Energies 15 07104 g012
Table 1. Summary of flow parameters for Mie Scattering experimental tests.
Flow Parameters M = 4
Test GasAir
Seed GasCarbon Dioxide
Seed Gas Concentration6–7%
Pressure, P 0 4.0 bar
Temp, T 0 298 K
Table 2. Key plasma filament parameters in Mach 4 flow.
Quantity M = 4
Power (kW)0.5–1
Current (A)2–6
W p l / P 0 (kW/bar)0.2–0.4
Temp, T g (K)3000–5000
Publisher’s Note: MDPI stays neutral with regard to jurisdictional claims in published maps and institutional affiliations.

