Article

Experimental Investigation and Performance Characteristics of Francis Turbine with Different Guide Vane Openings in Hydro Distributed Generation Power Plants

1
Department of Mechanical Engineering, Malla Reddy Engineering College, Maisammaguda, Secunderabad 500100, India
2
Department of Mechanical Engineering, Andhra Loyola Institute of Engineering and Technology, Vijayawada 520008, India
3
Department of Electrical and Electronics Engineering, Malla Reddy Engineering College, Secunderabad 500100, India
4
Department of Electrical and Electronics Engineering, Koneru Lakshmaiah Education Foundation, Vaddeswaram 522502, India
5
Department of Electrical Engineering, National Institute of Technology, Srinagar 190006, India
6
Department of Electrical Engineering, College of Engineering, Taif University, P.O. Box 11099, Taif 21944, Saudi Arabia
*
Authors to whom correspondence should be addressed.
Energies 2022, 15(18), 6798; https://doi.org/10.3390/en15186798
Submission received: 28 July 2022 / Revised: 7 September 2022 / Accepted: 10 September 2022 / Published: 17 September 2022
(This article belongs to the Special Issue Advancement in Renewable Energy Technologies and Smart Grid)

Abstract

:
This article presents a study on the performance characteristics of a Francis turbine operating with various guide vane openings to determine the best operating point based on unit quantities. The guide vane openings were specified based on the width between the vanes at their exit, i.e., 10 mm, 13 mm, 16 mm, and 19 mm. The performance characteristic curves of the Francis turbine—head versus speed, torque versus speed, discharge versus speed, and efficiency versus speed—were obtained at various input power and guide vane openings. From these data, unit curves were plotted and the corresponding best efficiency points were obtained. The highest efficiency of 50.25% was obtained at a guide vane opening of 19 mm. The values of head, discharge, speed, and output power at BEP were 7.84 m, 13.55 lps, 1250 rpm, and 524 W, respectively.

Graphical Abstract

1. Introduction

The motive energy found in water is known as hydropower. By using hydroelectric power plants, it can be transformed into electrical energy. All that is needed is a constant inflow of water and a height difference between the location where the water is found and the location where it can be released. The potential for hydropower is impressive. It is a free resource that is perpetually renewable and nonpolluting. Hydropower plays a significant role in the multipurpose use of water resources in many situations. The destructive forces of flood flows and the energy of normal flows are harnessed by hydropower projects to provide useful electrical energy. The economy of different power sources is reflected in the cost of electricity. Countries that have a large proportion of hydropower in their systems have the lowest tariffs. Upgrading existing hydropower plants is frequently more economical than building new ones. High initial investment-prone hydropower plants hold the substantial potential of uprating at the time of renovation, thereby making upgrading proposals cost-effective [1]. Due to the rising demand for electricity, hydropower plants are now more necessary than ever. Therefore, modernizing hydroelectric facilities is crucial to meeting public demand.

1.1. Selection of Turbines

The head under which a turbine is going to be operated gives guidance for the selection of the type of turbine. The range of operation of each type is shown concerning the head (H) and specific speed (ns) [2]. The total power to be installed must be known and the number of machines then are chosen by economic consideration of load factor, the extent of water storage, if any, cost of powerhouse, the convenience of operation, and maintenance. Once the output per machine has been decided, information must be obtained concerning the suitable speeds for which the generator can be constructed economically. From these data, the coupling power, effective head, and speed of the turbine are known. Hence, the specific speed is calculated. From the previous table, the suitable turbine is selected. Since the speed of the generator can generally be selected from several suitable numbers of pairs of poles, the appropriate specific speed is not limited to one value. In many cases, the overlap is considerably extended and the problem arises of selecting from two types of turbines, either of which could be used [3]. Here, knowledge of the advantages and disadvantages of each type will assist, especially concerning efficiency when running at part load. If the machine is required to operate for long periods of part loads, the Pelton turbine would be preferred to the Francis turbine. Similarly, if the choice lay between two Francis turbines, that with the lower specific speed would be more suitable, whereas if the choice lay between a Kaplan turbine or a propeller turbine or a Francis turbine with a high specific speed, the Kaplan turbine would be preferred. This is because of the flattest efficiency curve being obtained from the Kaplan turbine, followed by the Pelton turbine, the low-specific-speed Francis turbine, the high-specific-speed Francis turbine, and finally the propeller turbine, which has the most peaked form of the efficiency curve. It must not be assumed that the highest possible specific speed is always desirable [4,5].

1.2. Francis Turbine

Francis turbines can be built to handle a wide range of head and flow rates. This, combined with their high efficiency, has resulted in them being the most widely used turbine in the world. The Francis-type units have a head range of 20 m to 700 m, a specific speed of 60 to 400 rpm, and an output power ranging from a few kilowatts to one gigaton. Large Francis turbines are custom-built for each location to achieve the highest possible efficiency, typically exceeding 90% [6]. The water initially needs to enter the scroll (volute), which is an annular channel that surrounds the runner, and then flows between the stationary vanes and adjustable guide vanes, which provide the water with the best flow direction. It then enters the completely submerged runner, altering the momentum of the water and causing a reaction in the turbine. Water flows in a radial direction towards the center. The water is impinged upon by curved vanes on the runner. The guide vanes are configured in such a way that the energy of the water is largely converted into rotary motion, rather than being consumed by eddies and other undesirable flow phenomena that cause energy losses. The guide vanes are typically adjustable to provide some adaptability to variations in the water flow rate and turbine load. The Francis turbine’s guide vanes are the elements that direct the flow of water [7]. The authors investigated flow parameters, such as flow angles at the runner’s inlet and outlet, flow velocities, and guide vane angles, to derive flow characteristics. The goal was to analyze the pressure distribution and flow behavior to achieve the level of accuracy required for the concept design of a revitalized turbine. The obtained results are in good agreement with the on-site experiments, particularly for the characteristic curve [8].
For three different specific speed turbines, the authors predicted the accuracy and compared it to the model test results. It was demonstrated that the numerical model test presented in this investigation could predict important characteristics of the Francis turbine with high accuracy not only quantitatively but also qualitatively by comparing simulation results with model test results for pressure-fluctuation characteristics, efficiency characteristics, and cavitation characteristics. As a result, it was determined that numerical model testing would be a more realistic estimation tool for Francis turbine hydraulic performance, contributing to cost reduction in the development of the Francis turbine [9]. The authors investigated Francis turbine guide vanes with pivoted support and an external control mechanism for converting pressure to kinetic energy and directing it to runner vanes. It has been discovered that increasing the clearance gap of the guide vane opening increases leakage, lowering energy conversion and turbine efficiency and resulting in a larger secondary vortex [10].
Many simulated results on hydroturbines have been conducted using various turbulence models to identify their performance parameters [11]. Three distinct turbulence models were explored in this work to measure the sensitivity of the model for the derivation of Francis hydroturbine performance characteristics. To evaluate the performance of the turbine, three different operating circumstances were chosen: part load, overload, and best efficiency point. The highest velocity fluctuation inside the Francis runner was anticipated by the model. The turbulence model can be used to capture the vortex rope that appears at the runner’s output [12]. The influence of blade thickness on hydraulic performance was investigated numerically using six types of impellers with varied blade thicknesses that were integrated into the same pump to compare head and efficiency under design point [13]. The effect of clearance on the performance of a Francis turbine was investigated, and it was discovered that as transverse flow and loss increased, efficiency decreased significantly. When considering a specific degree of erosion, the pressure on both sides of the blade and at the outflow of the blade was precisely proportional to the erosion state [14,15,16]. The flow conditions in the runner inlet of a low-speed-number Francis turbine are found to be identical when a cascade with one guide vane between two flow channels is optimized [17].
Guide vane (GV) clearance gaps grow larger due to abrasive wear, which worsens the flow and reduces efficiency. In order to reduce potential consequences of an eroded guide vane on the performance of the turbine, this research evaluates several guide vane profiles. It is discovered that the pressure differential between the neighboring sides causes the clearance gap to create a leakage flow. A vortex filament is created when the leaky flow combines with the main flow and is forced within the runner [18]. The authors offer a methodology for the design, optimization, and additive manufacture of turbine blade rows and other components of highly stressed turbomachinery. The technique subsequently produces final geometries that have been suitably represented for additive manufacturing. A few aluminum prototypes of the newly improved turbine blade have been produced in order to undergo mechanical and fatigue testing [19]. The mechanical power turbine’s torque varies with its size. With a peak value of 3249.7 Nm at pitch angle 17°, significant torque was obtained in the pitch angle range of 15–20°. As turbines grow in size and their pitch angle range increases, they will produce more power, reaching a maximum of 124,987.1 W or 125 kW [20]. The findings demonstrated that in operating conditions involving substantial flow rates, severe sand abrasion might be seen close to the blade head and outlet. In working conditions with low flow rates, there may be very minor abrasion found close to the blade flange. The runner is severely abraded and its effectiveness is lowered in proportion to the sediment concentration and sand diameter [21]. While the flow separation on the suction side close to the blade tip merges, the flow characteristics on the blade pressure side are often stable. The flow-separation phenomenon manifests itself more visibly with larger tip clearance. The tip leakage vortex, which is also a spatial three-dimensional spiral structure created by the entrainment effect of the tip leakage flow and main flow, becomes more pronounced as the tip clearance rises [22].
After detailed review of the literature, it was apparent that lots of research has been carried out on hydroturbines, but few studies have made an attempt at different guide vane openings and no literature was found on best operating point based on unit quantities. As such, the present work focuses the best operating point based on unit quantities by studying the performance characteristics of the Francis turbine at various input powers and guide vane openings.

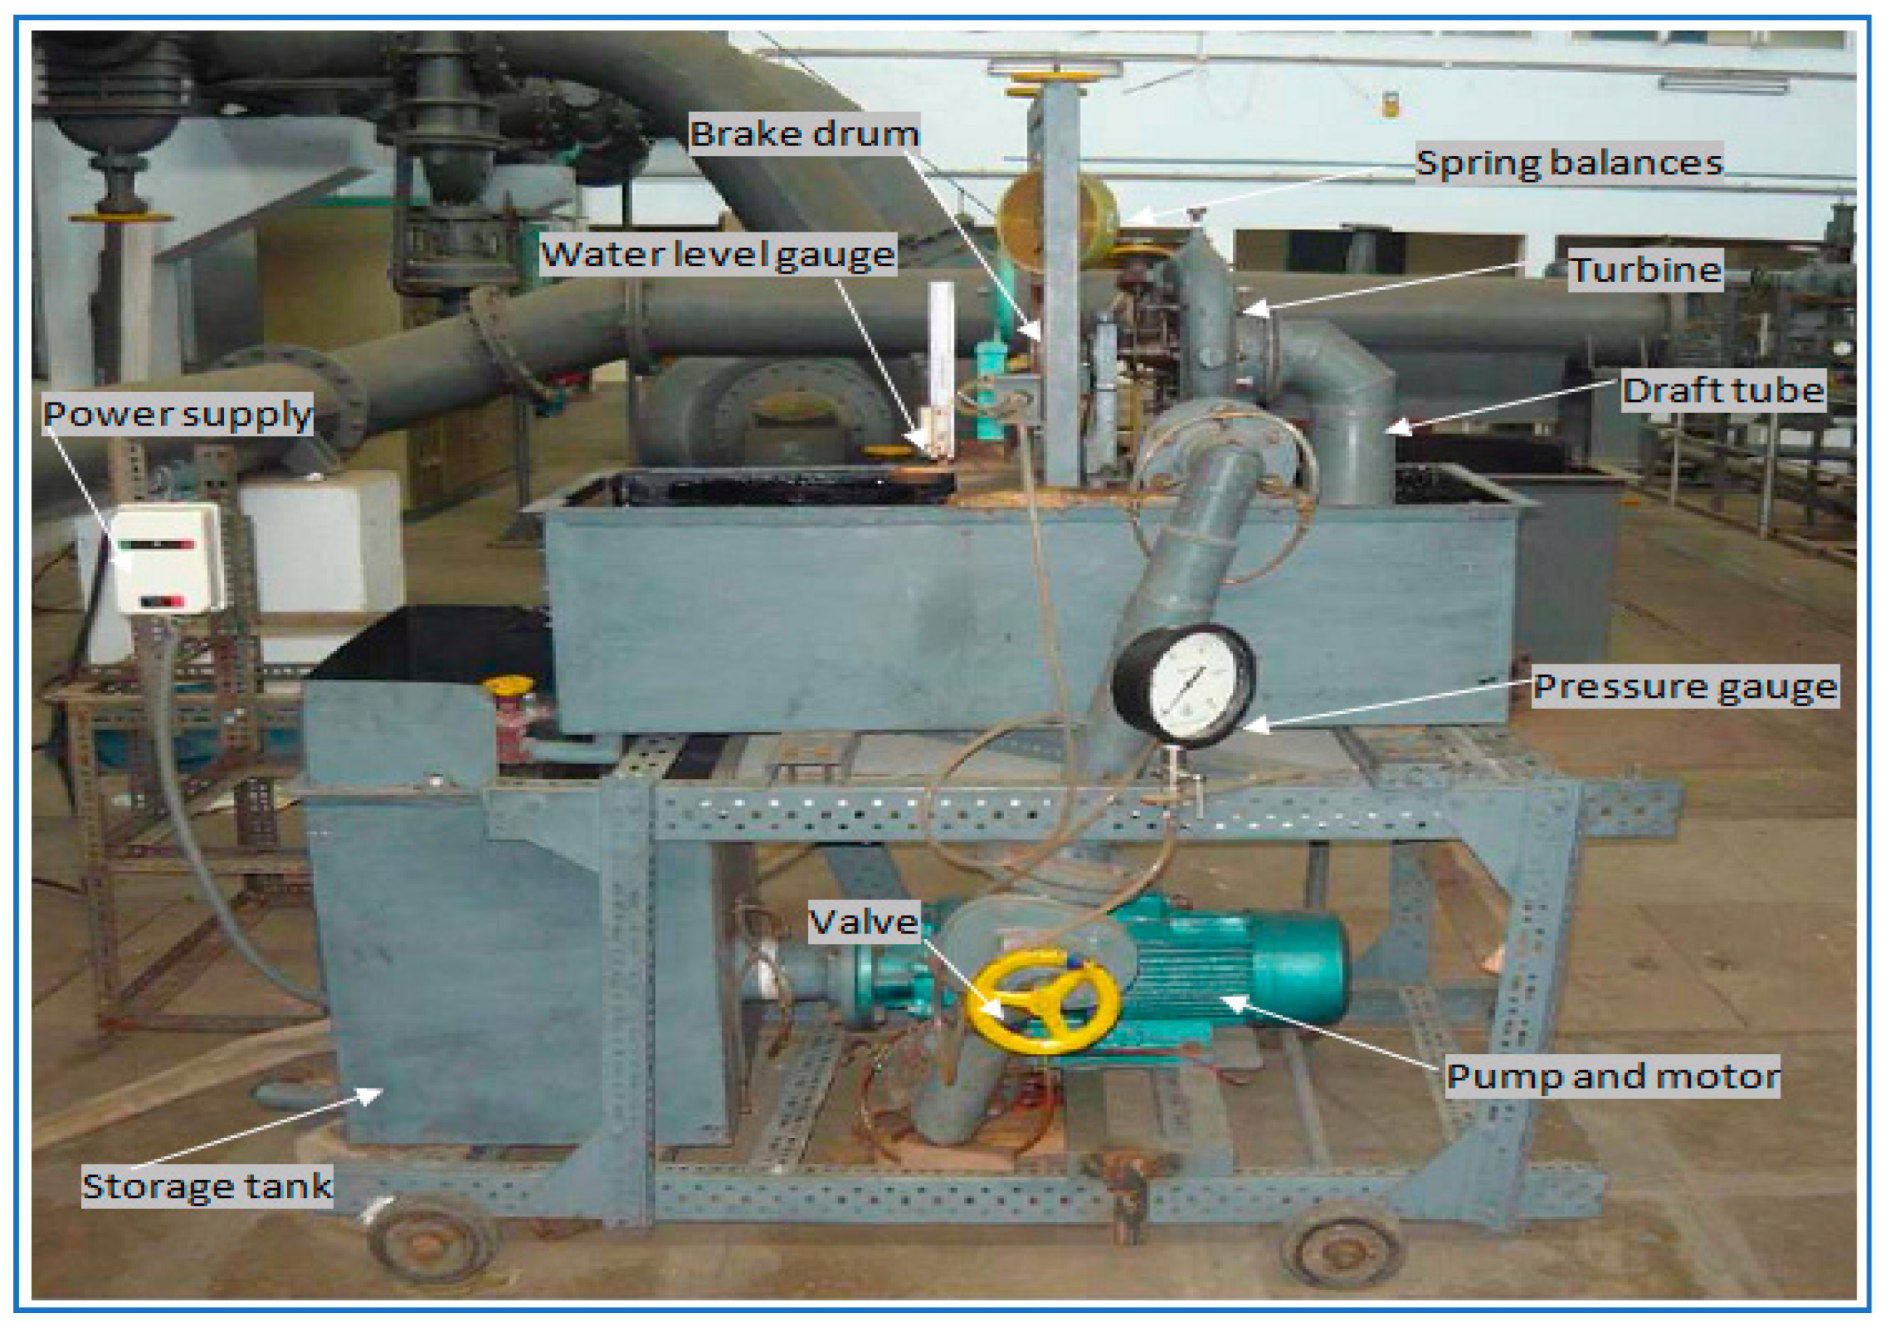
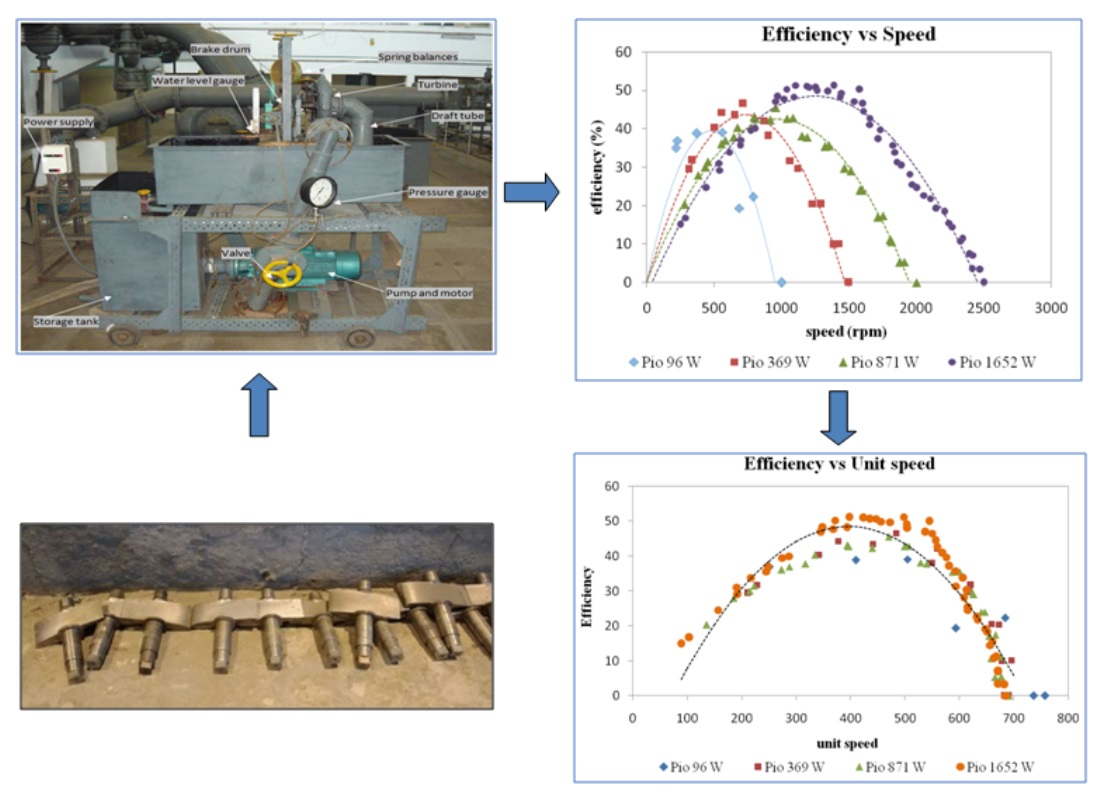
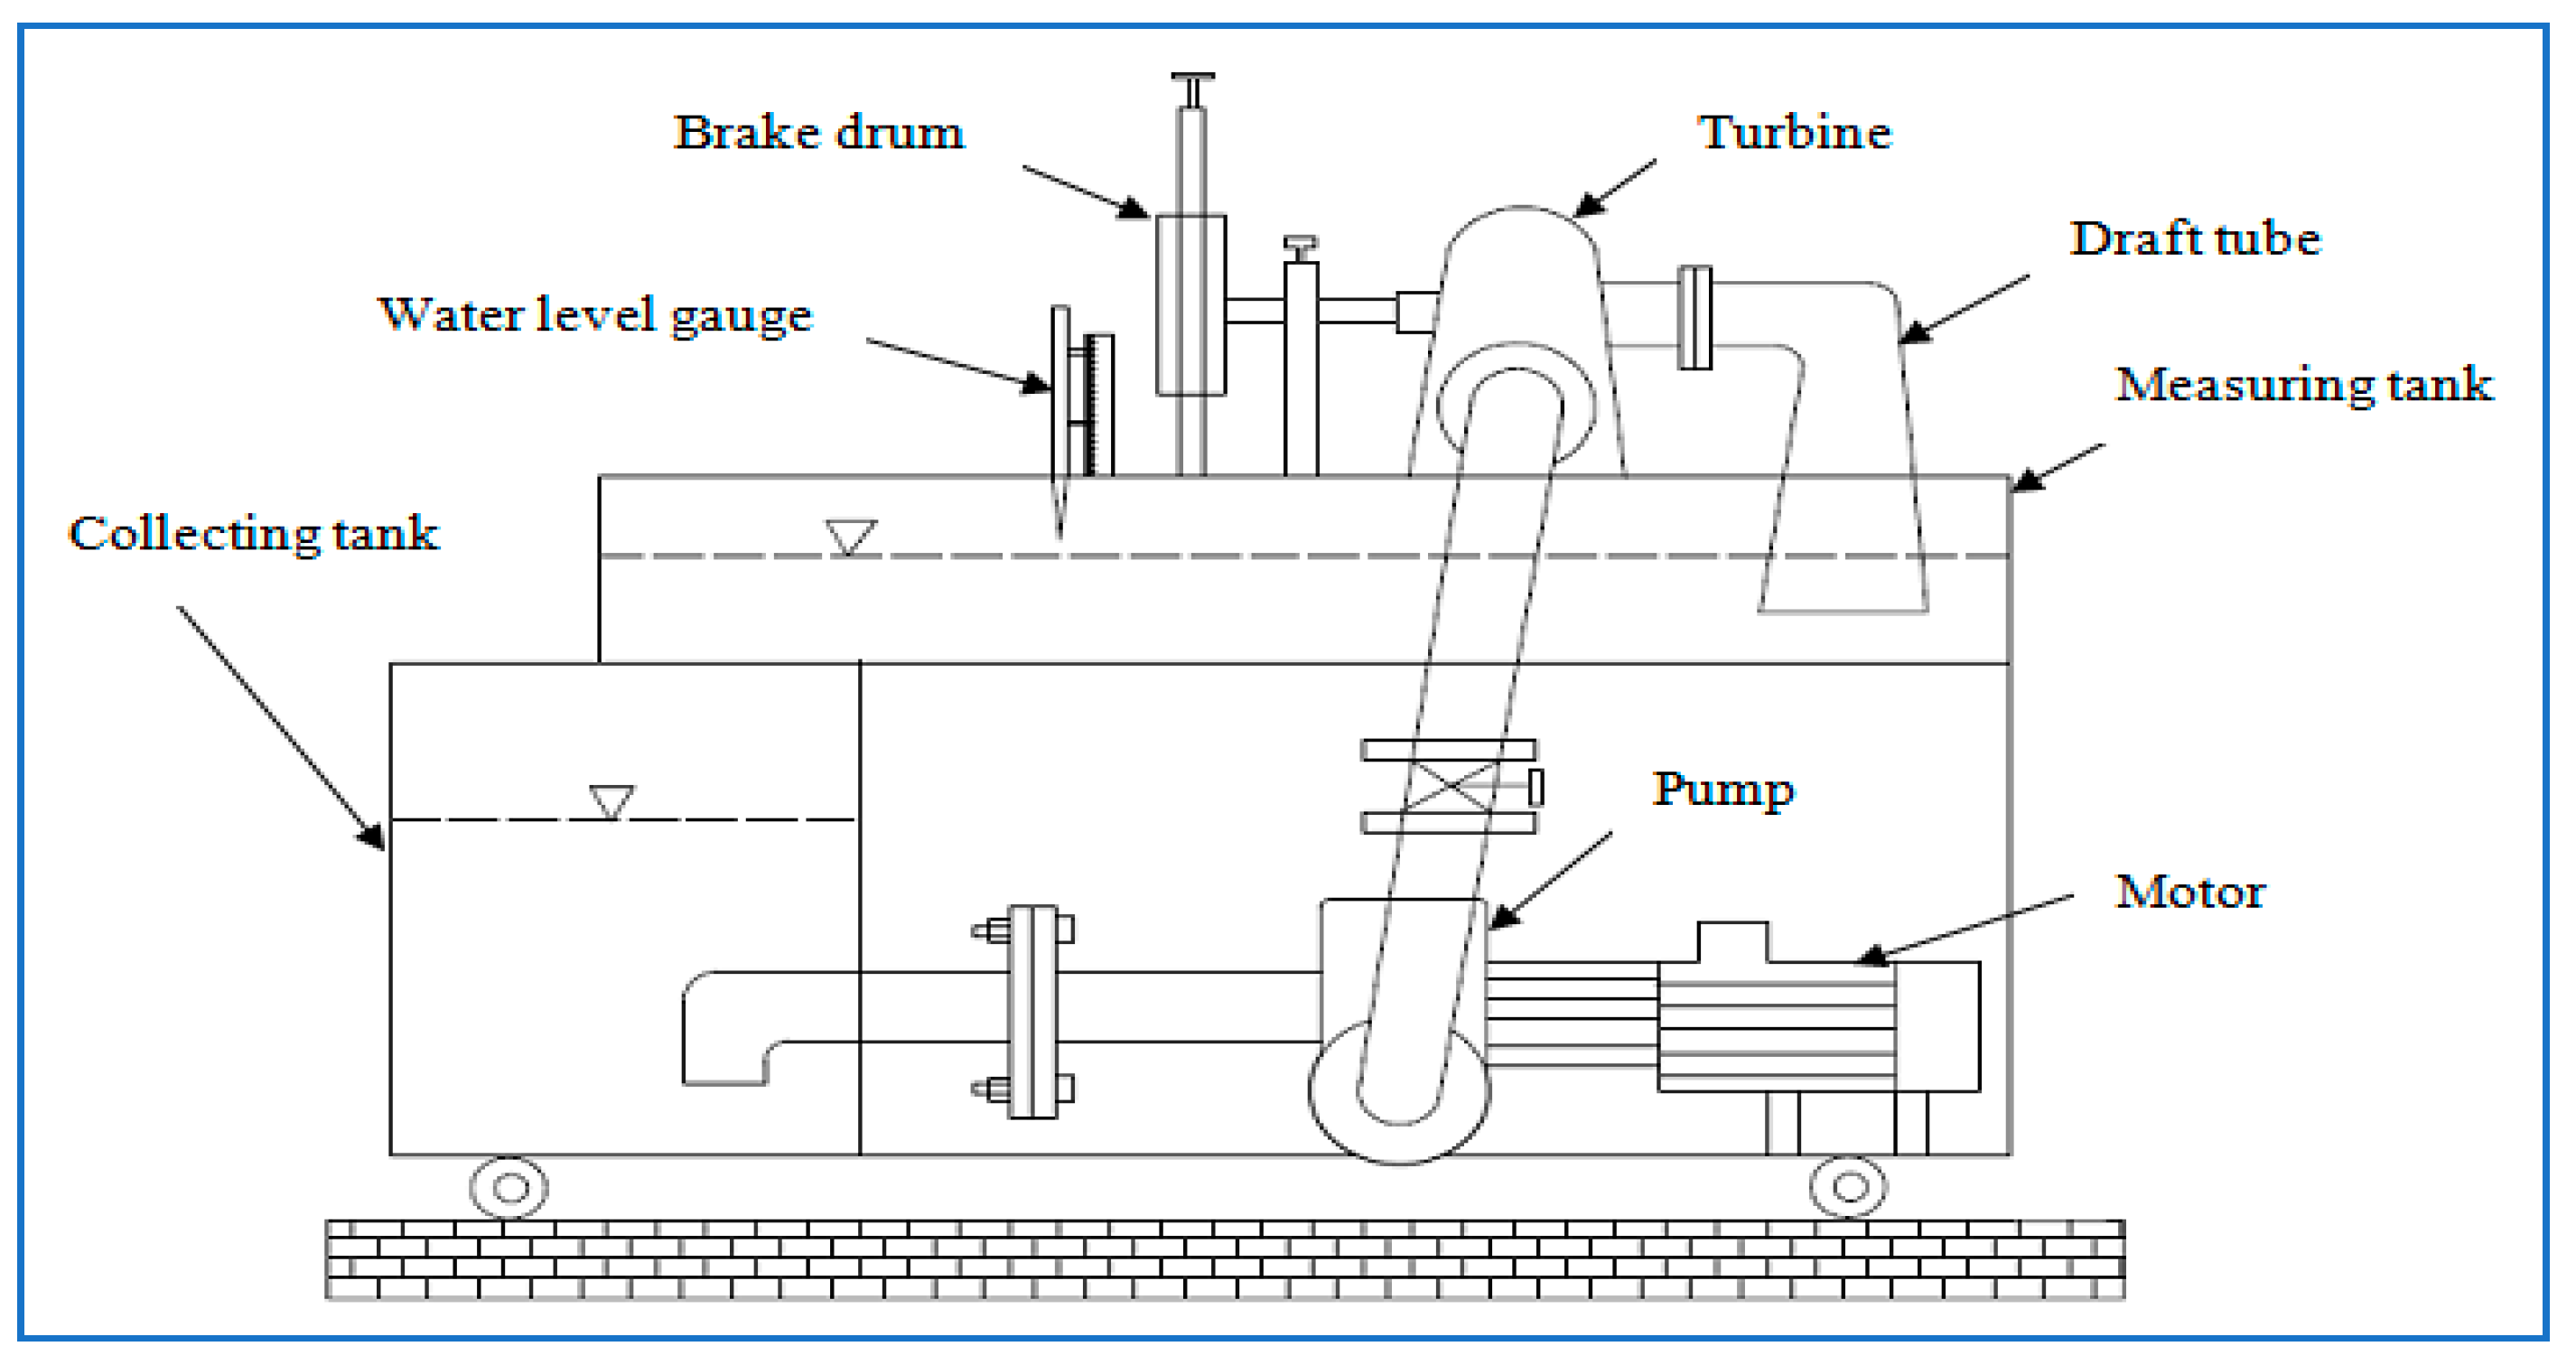
2. Experimental Setup

2.1. Experimental Setup of Francis Turbine

The model Francis turbine available at Hydro Turbo Machines Lab was designed and built by Nilavalagan (1973) and was used for these experiments, as shown in Figure 1 and Figure 2.
The Francis turbine is a machine that uses the energy of water and converts it into mechanical energy. Thus, it becomes the prime mover to run the electrical generators to produce electricity. The head is generated using a pump that draws water from the storage tank and supplies it to the inlet of the turbine. The torque generated by the turbine is measured using a brake drum. The water outlet flow of the turbine is sent to the measuring tank through the draft tube. The excess water from the measuring tank flows to the storage tank.
Four pressure tapings made near the inlet of the turbine were made to form a piezo-ring and were connected to a pressure gauge (range 0–2.5 kg/cm2). The tachometer was used to measure the speed (N) of the turbine. The turbine was loaded with the help of a brake drum connected to a loading belt. The tension in the belt on both sides of the brake drum was measured with spring balances. The load on the turbines was altered with the help of hand wheels connected to balances. The diameter of the brake drum was 225 mm and the thickness of the belt 5 mm. At the back of the turbine casing, there is a guiding vane mechanism. The distance between the two successive guide vanes can be altered by rotating a hand wheel. The maximum distance between one guide vane’s tip to another was measured using a vernier caliper. It was found to be 19 mm maximum.

2.2. Specification of the Instruments Required for Measuring
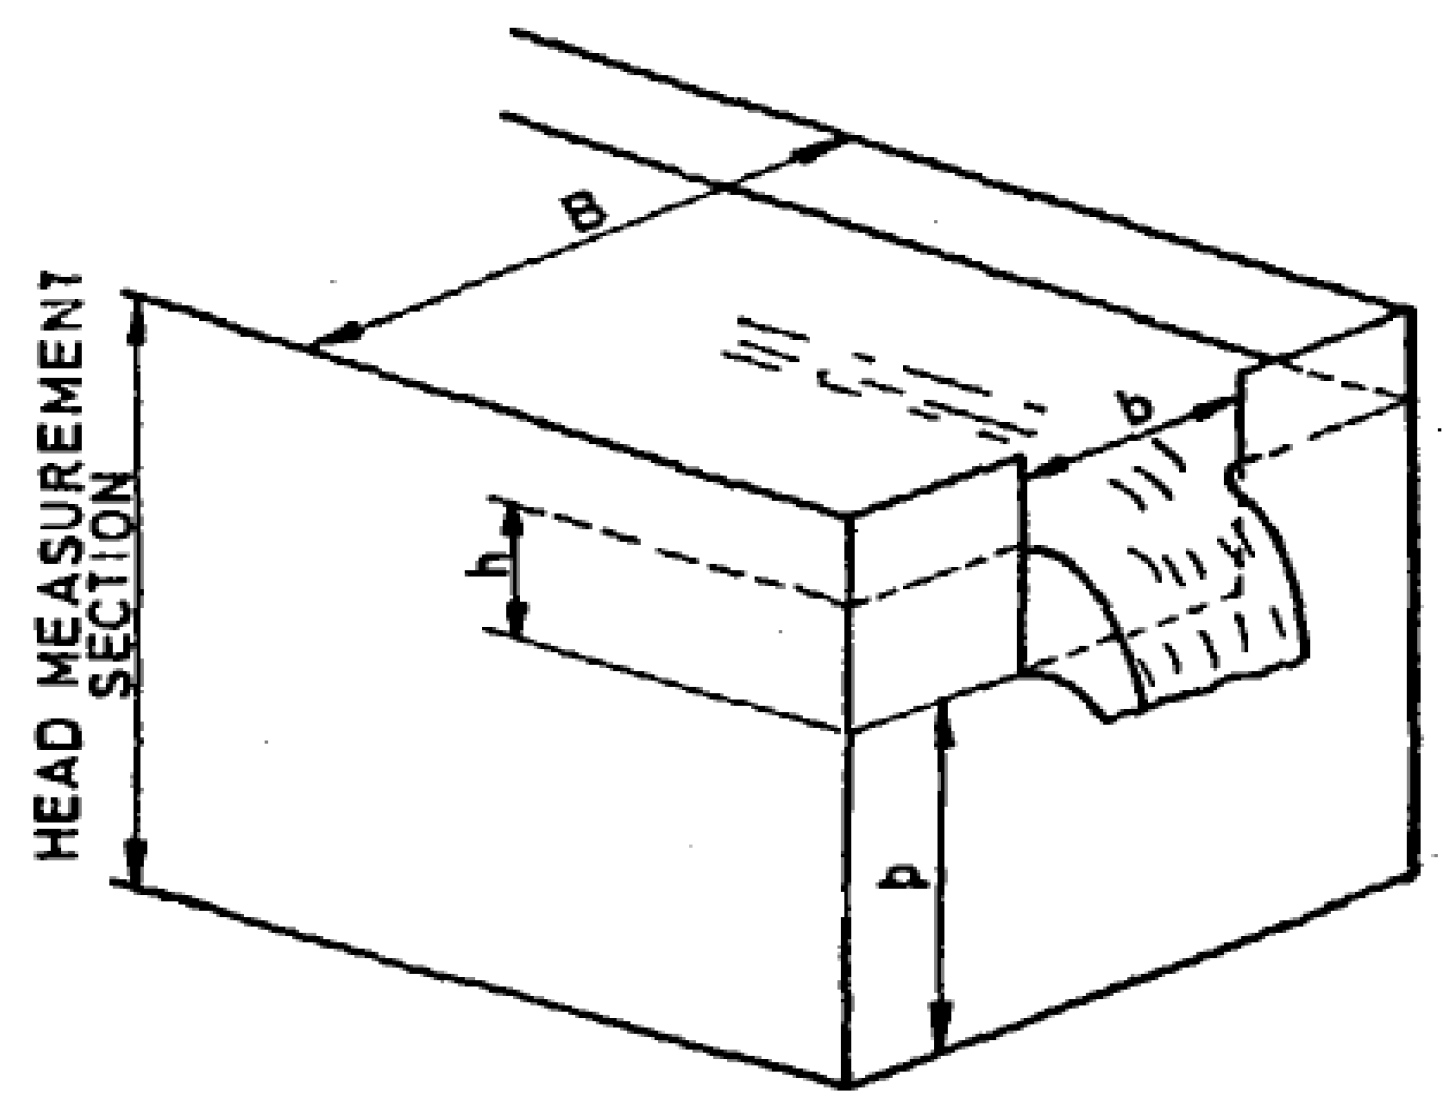
(a) 
Discharge
The discharge measurement in this experiment was done using a rectangular notch, shown in Figure 3, fitted in the measuring tank. The discharge formula found by the Indian Standard (IS: 9108-1979) was used and is discussed below.
The Kindsvater–Carter rectangular weir formula is
Q = C e 2 3 2 g b e h e 3 / 2
where,
Q = discharge, m3/sec
C e = coefficient of discharge,
b e = effective width, in mm, and
h e = effective head in mm.
The coefficient of discharge was determined by experiment as a function of two variables from the formula:
C e = f ( b B , h p )
The effective width and head are defined by the equations:
b e = b + k b = b + 3.6
h e = h + k h = h + 0.0012  
Which and are experimentally determined quantities, in meters, which compensates for the combined effects of viscosity and surface tension.
From the value of b/B, formula for C e can be written as
(b/B = 0.6): = 0.593 + 0.018
The water-level gauge was used to measure the height of the water level in a rectangular notch. This water-level gauge was fixed with the scale. This gauge mechanism has a rotating device for making adjustments.
(b) 
Speed
The digital tachometer was used to measure the speed of the turbine. Its range is 0–5000 rpm. This tachometer is kept at the back of the brake drum to find the speed of the turbine.
(c) 
Pressure
A Bourdon tube pressure gauge was used to find the pressure at the inlet of the turbine. The pressure gauge range was 0 to 2.5 kg/cm2.
(d) 
Load
The spring balance was used to find the loads applied on the brake drum. The spring-balance range was 10 kg × 50 gm and 20 kg × 100 gm.

2.3. Experimental Methodology

Connect the supply-pump motor unit to 3 ph, 440 V, 30 A, electrical supply, with neutral and earth connection and ensure the correct direction of pump motor unit. Keep the gate closed before the pump is on. Later, press the green button of the supply-pump starter and then release. The guide vane distance is maintained at 19 mm initially for fully open guide vane position and altered to 16 mm, 13 mm, and 10 mm distance with the help of a hand wheel. For each of the above guide vane openings, the speed of the turbine is maintained initially at 1000, 1500, 2000, and 2500 rpm by adjusting the pump outlet valve. Later, the load is applied in steps of 250 g till the lowest possible speed at which the turbine can run continuously. For each corresponding set of readings, the pressure at the inlet of the turbine, speed, load on the brake drum, and head over notch are noted. Then, the gate valve is closed and the supply-water pump switched off.
The performances of the turbine were calculated, i.e., discharge, head, torque, input power, output, efficiency, and unit quantities. Later, the performance characteristics of the turbine were plotted.

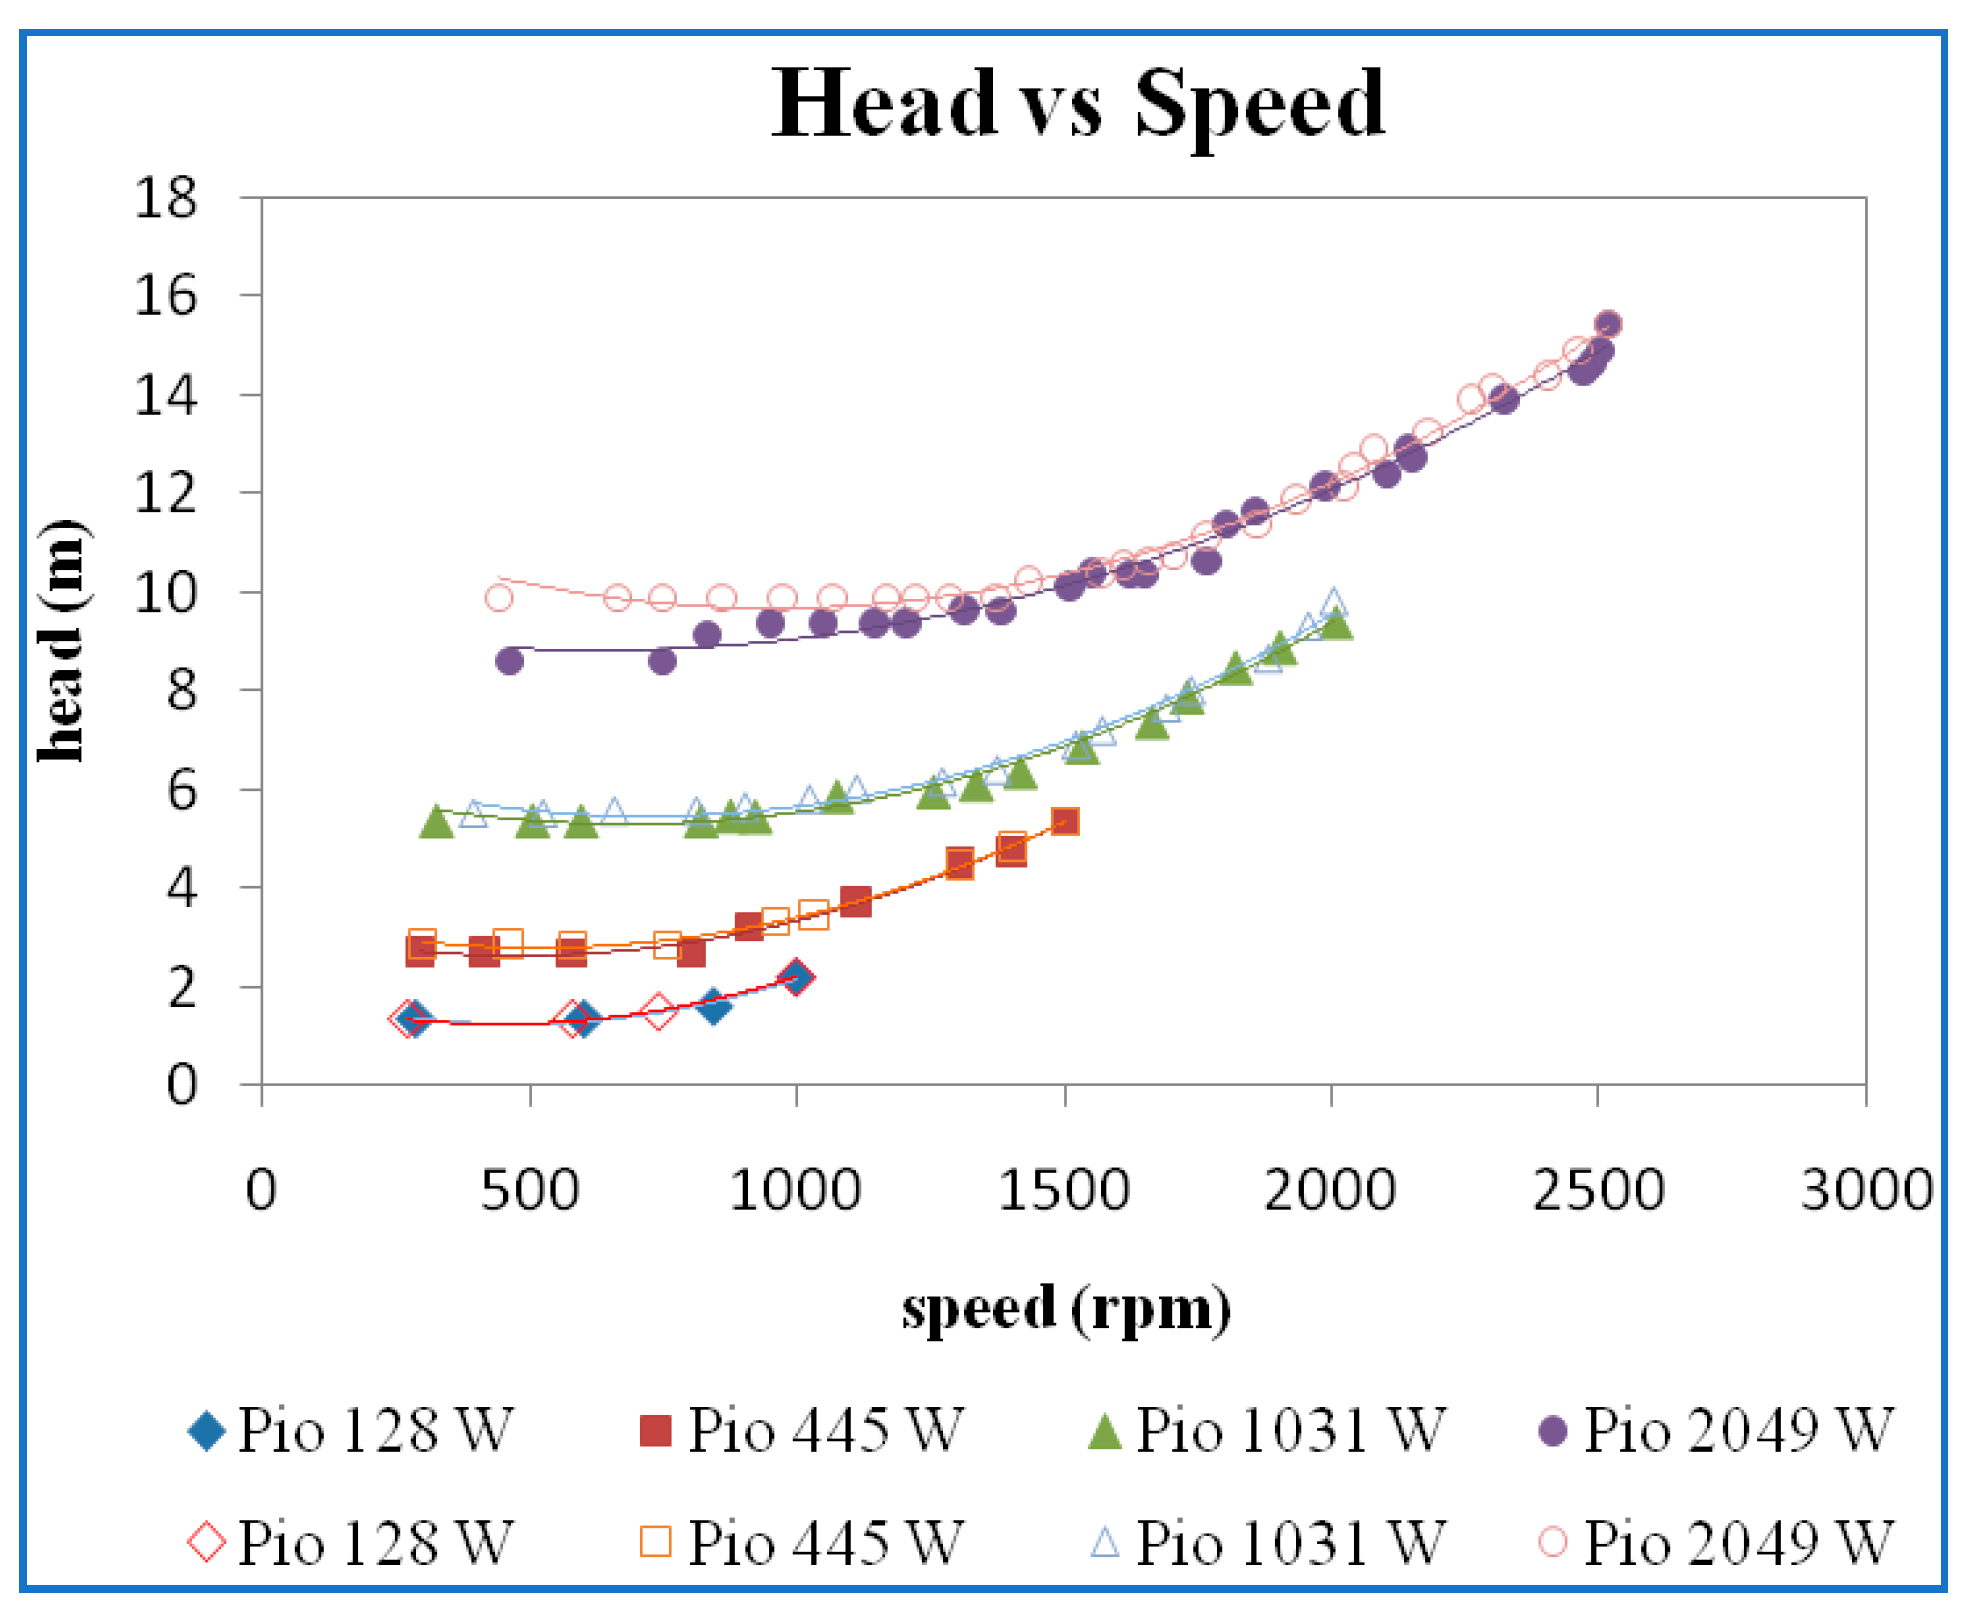
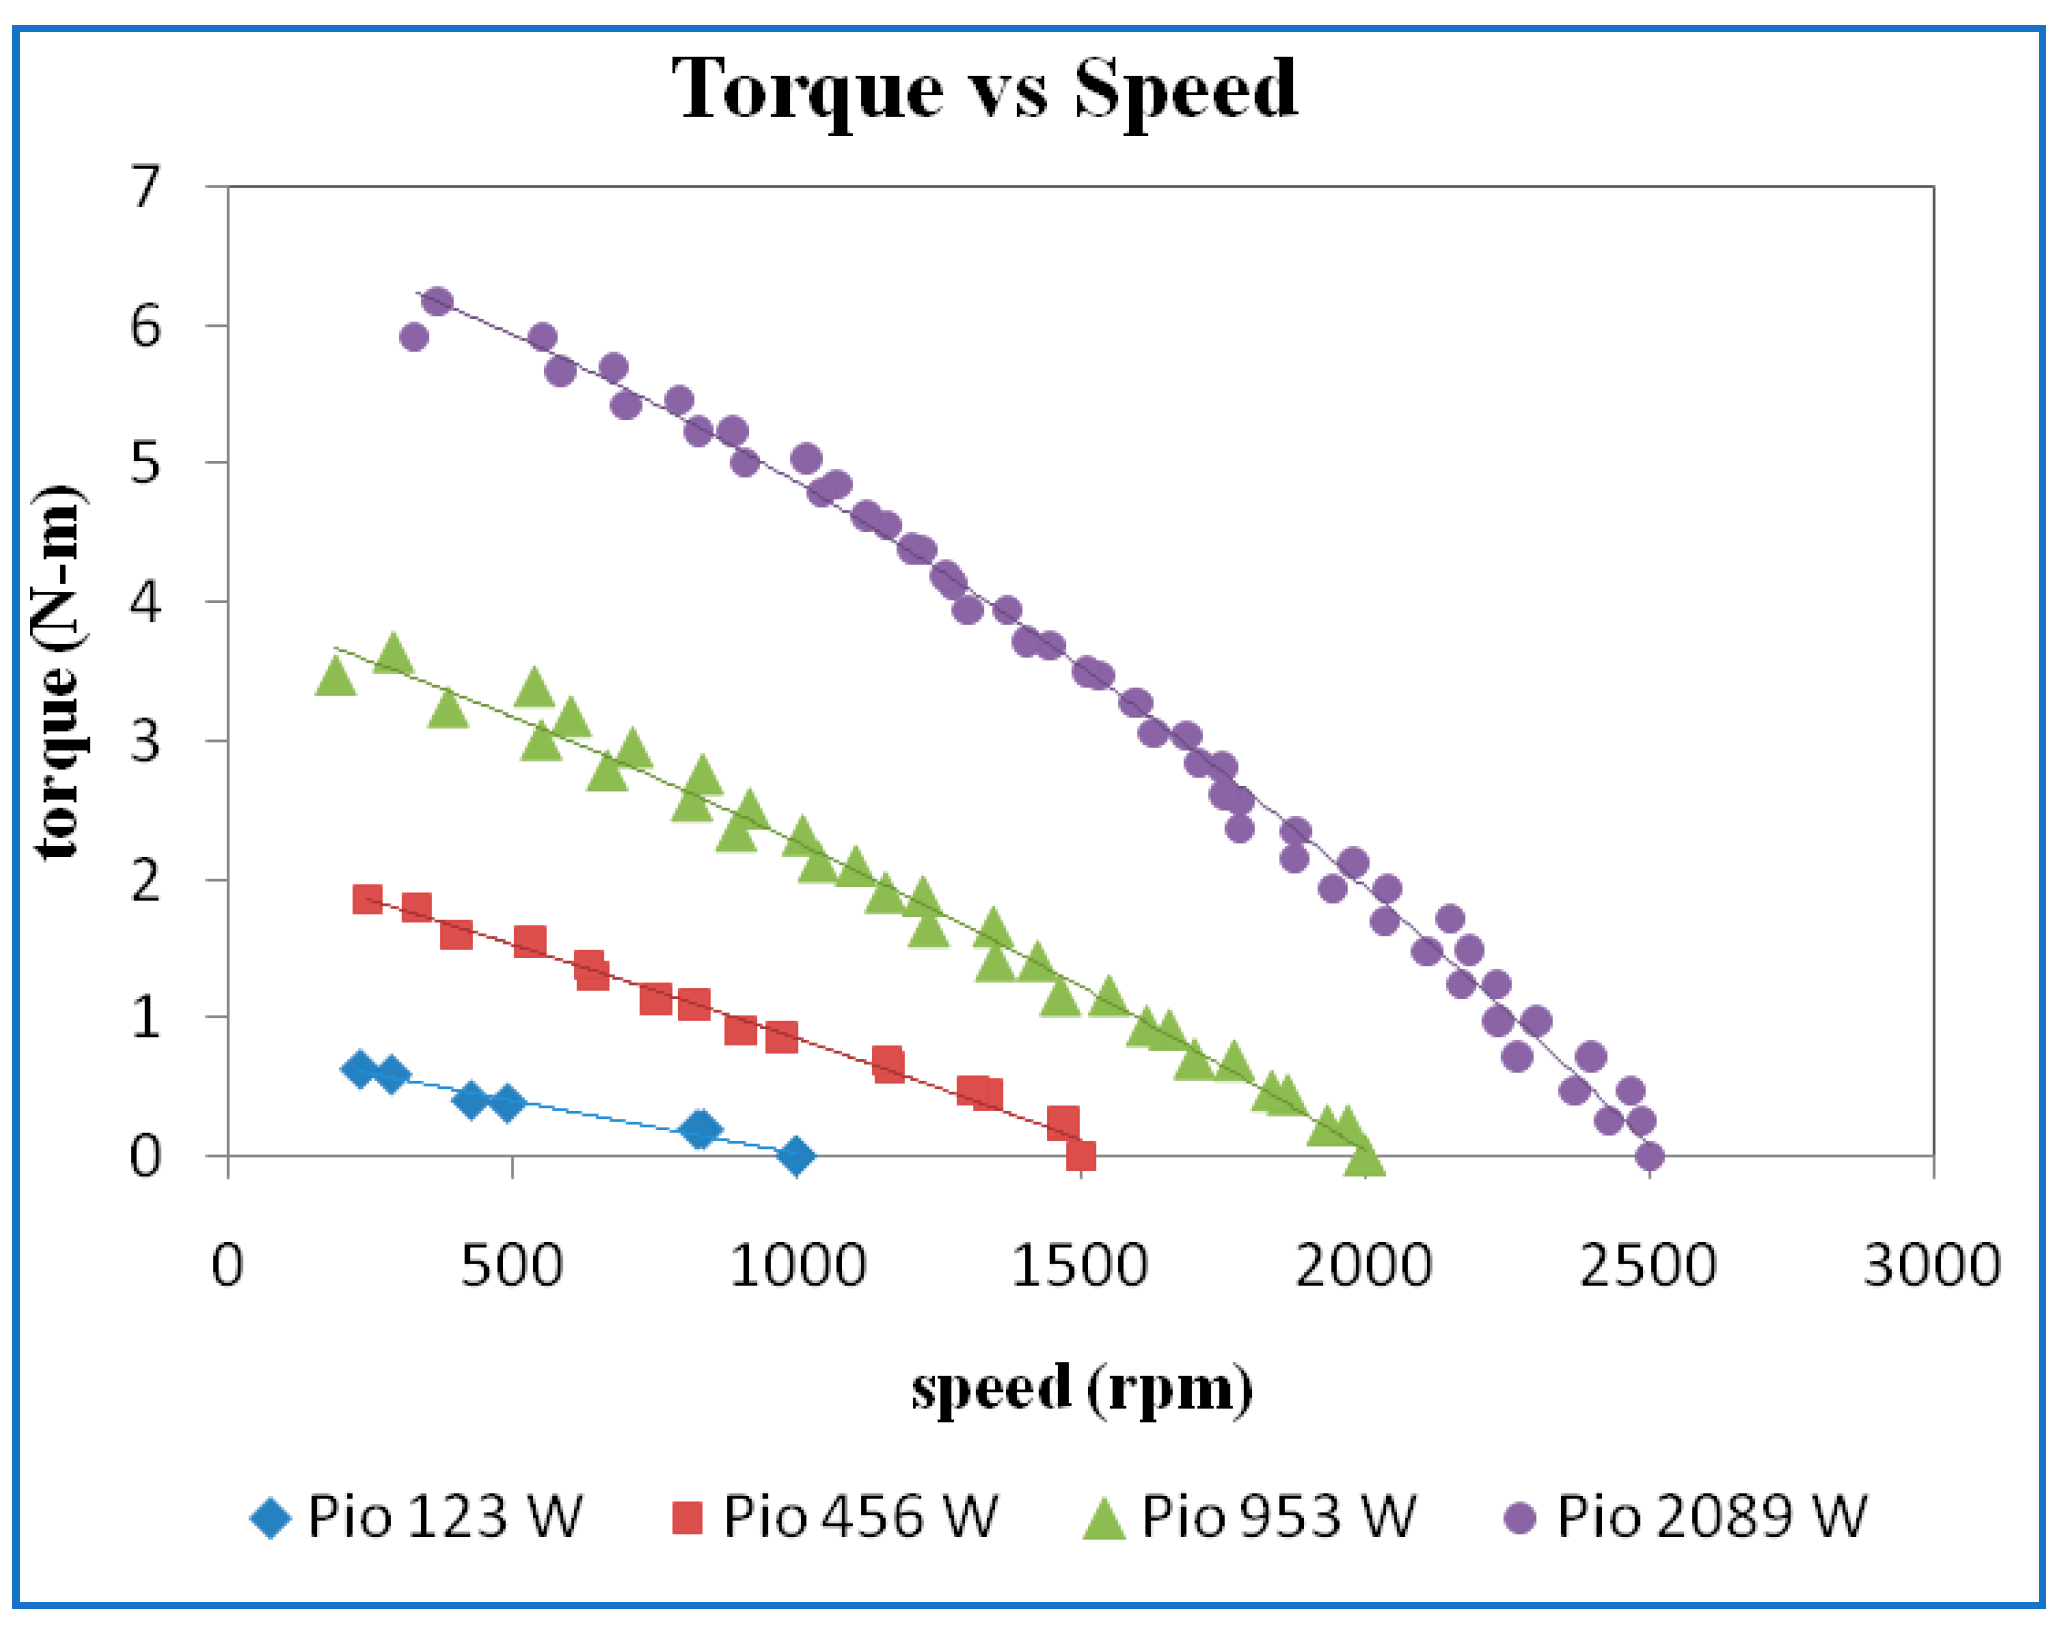
3. Results and Discussion

The best efficiency point of the Francis laboratory scale was found by operating the water pump at different guide vane openings. The performance characteristics were plotted for these conditions. For each water supply, the reading was obtained and respective characteristics curves plotted for four different guide vane openings. The guide vane openings were specified based on the width between the vanes at their exit, i.e., 10 mm, 13 mm, 16 mm, and 19 mm. For each water supply and respective guide vane opening, an experiment was conducted as per the procedure indicated in Section 2.3. Each experiment was repeated and performance curves for discharge versus speed, head versus speed, torque versus speed, and efficiency versus speed were plotted.
A polynomial curve fit was done for the two individual sets of readings that were repeated for the same experimental condition to check repeatability. Then, the two individual experimental results were merged as one single set and fitted as a polynomial curve. The correlation coefficient was found to be not less than 0.98. The respective polynomial equation for each of torque, discharge, and head with speed were substituted in the efficiency formula and corresponding efficiency was calculated.

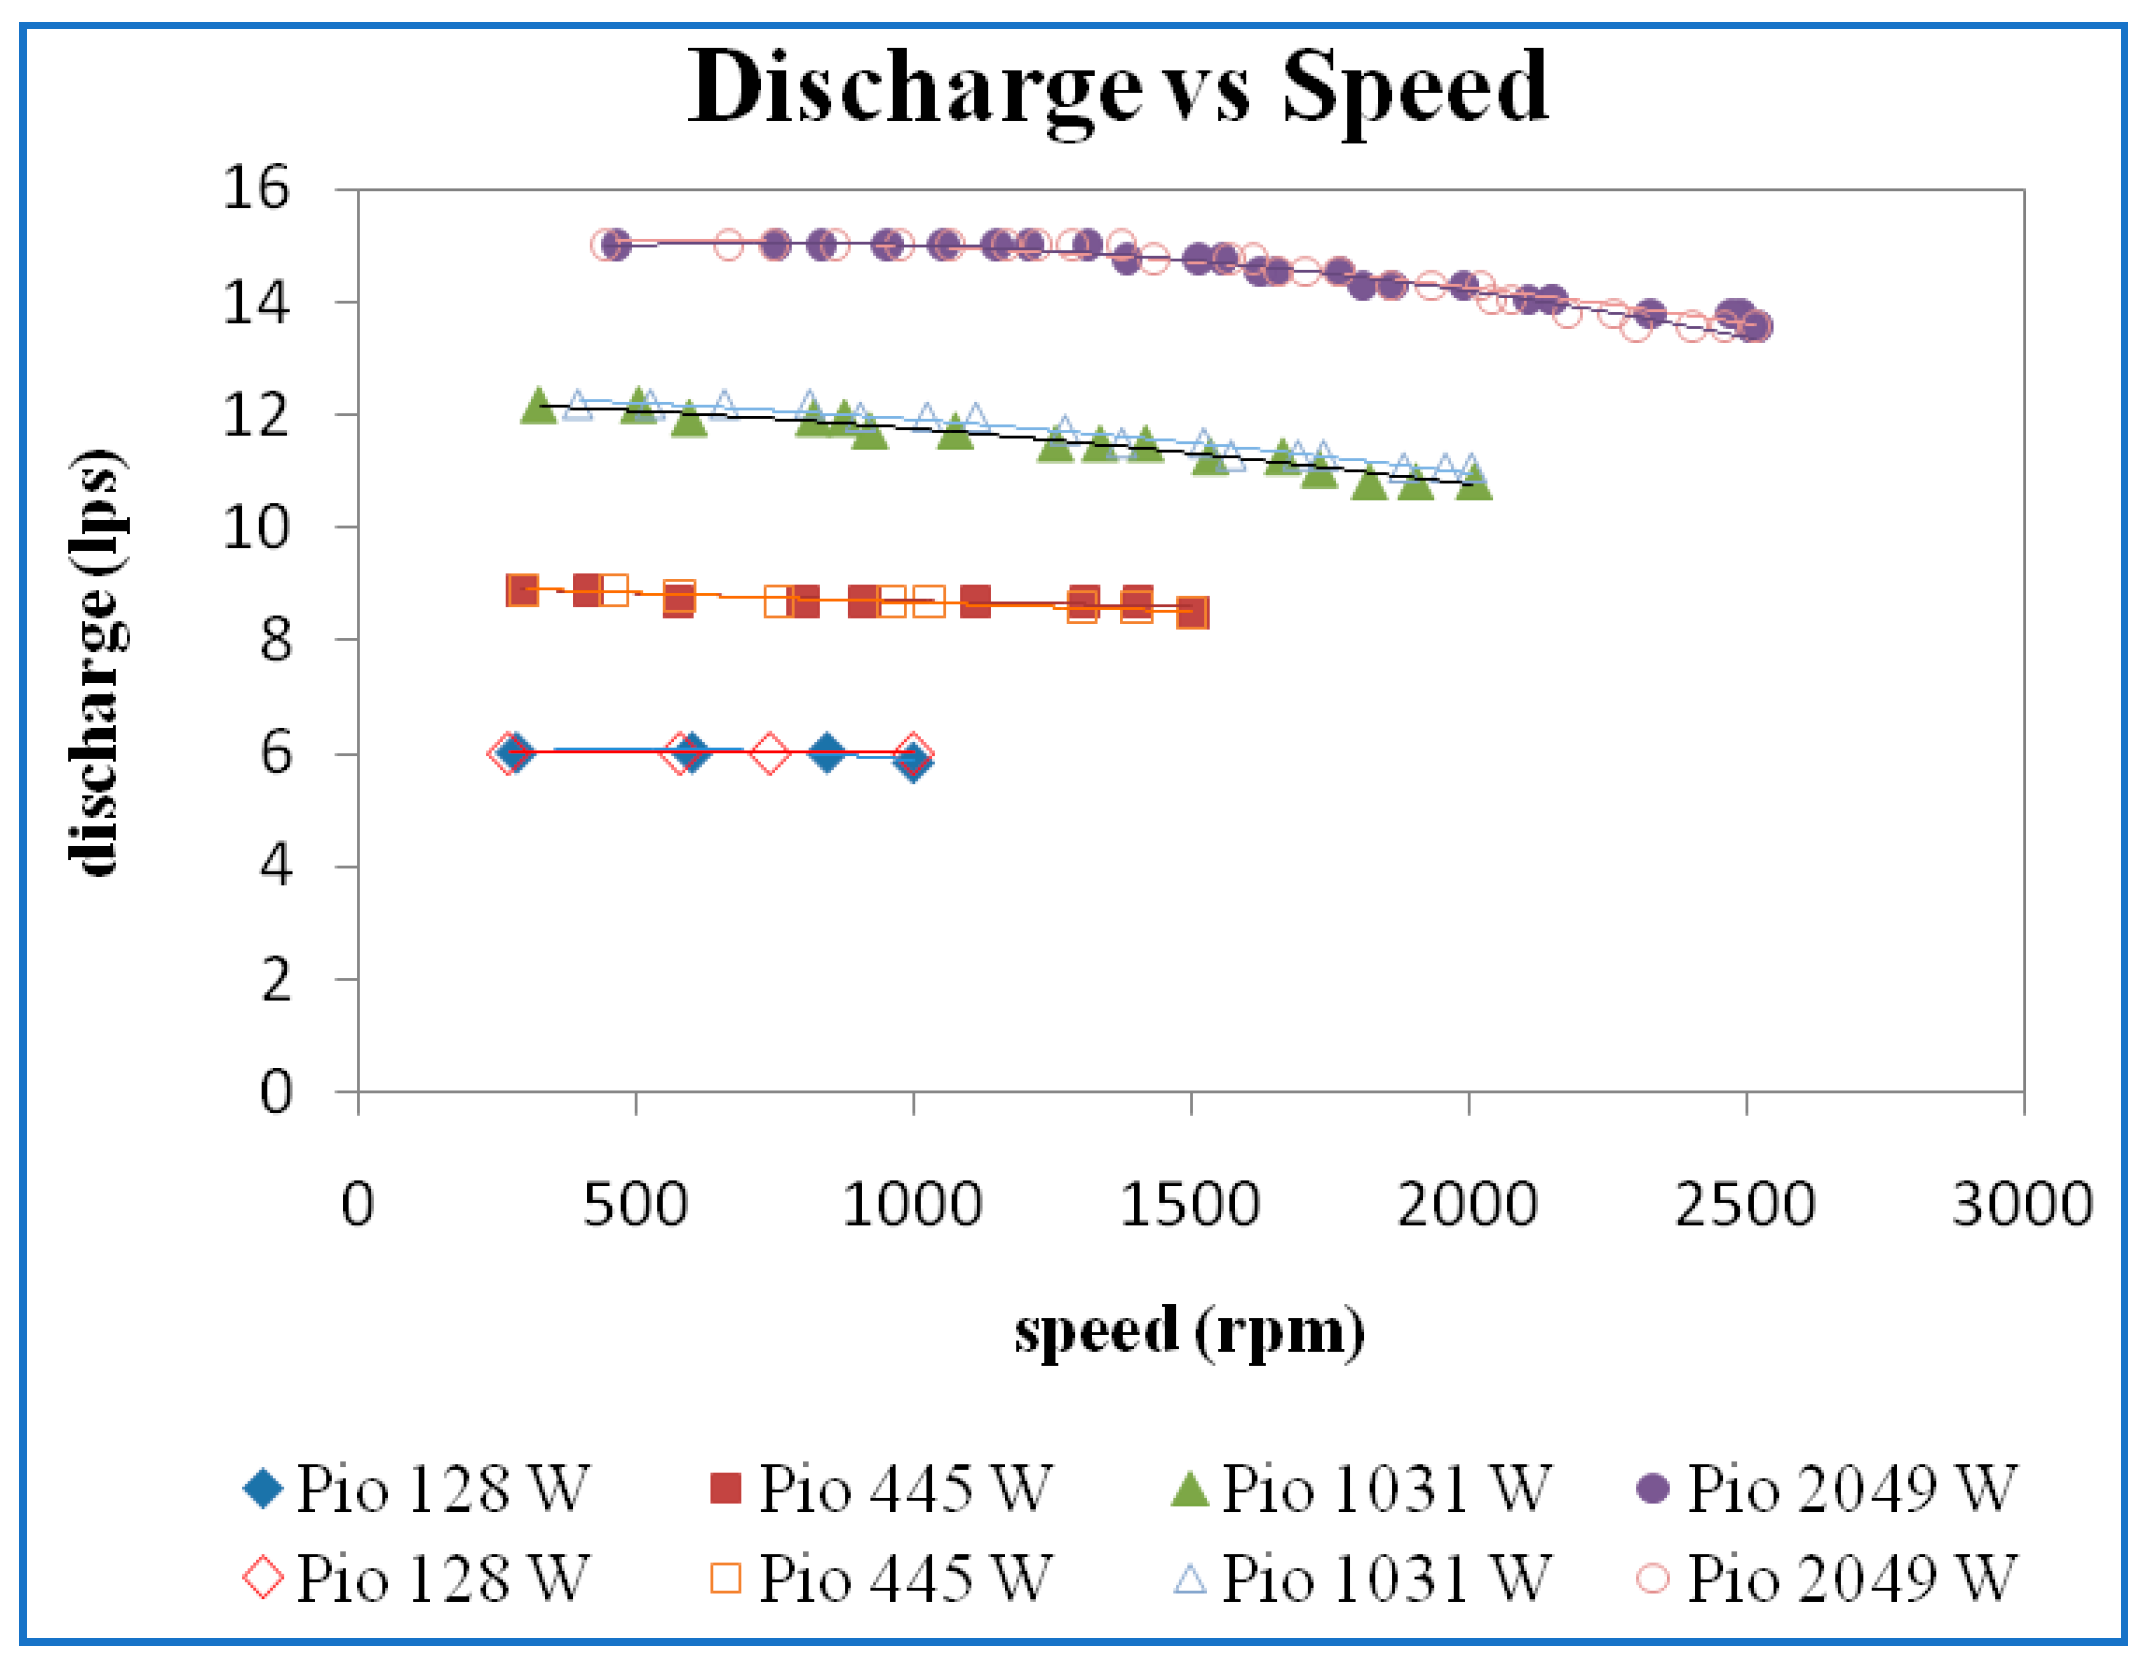
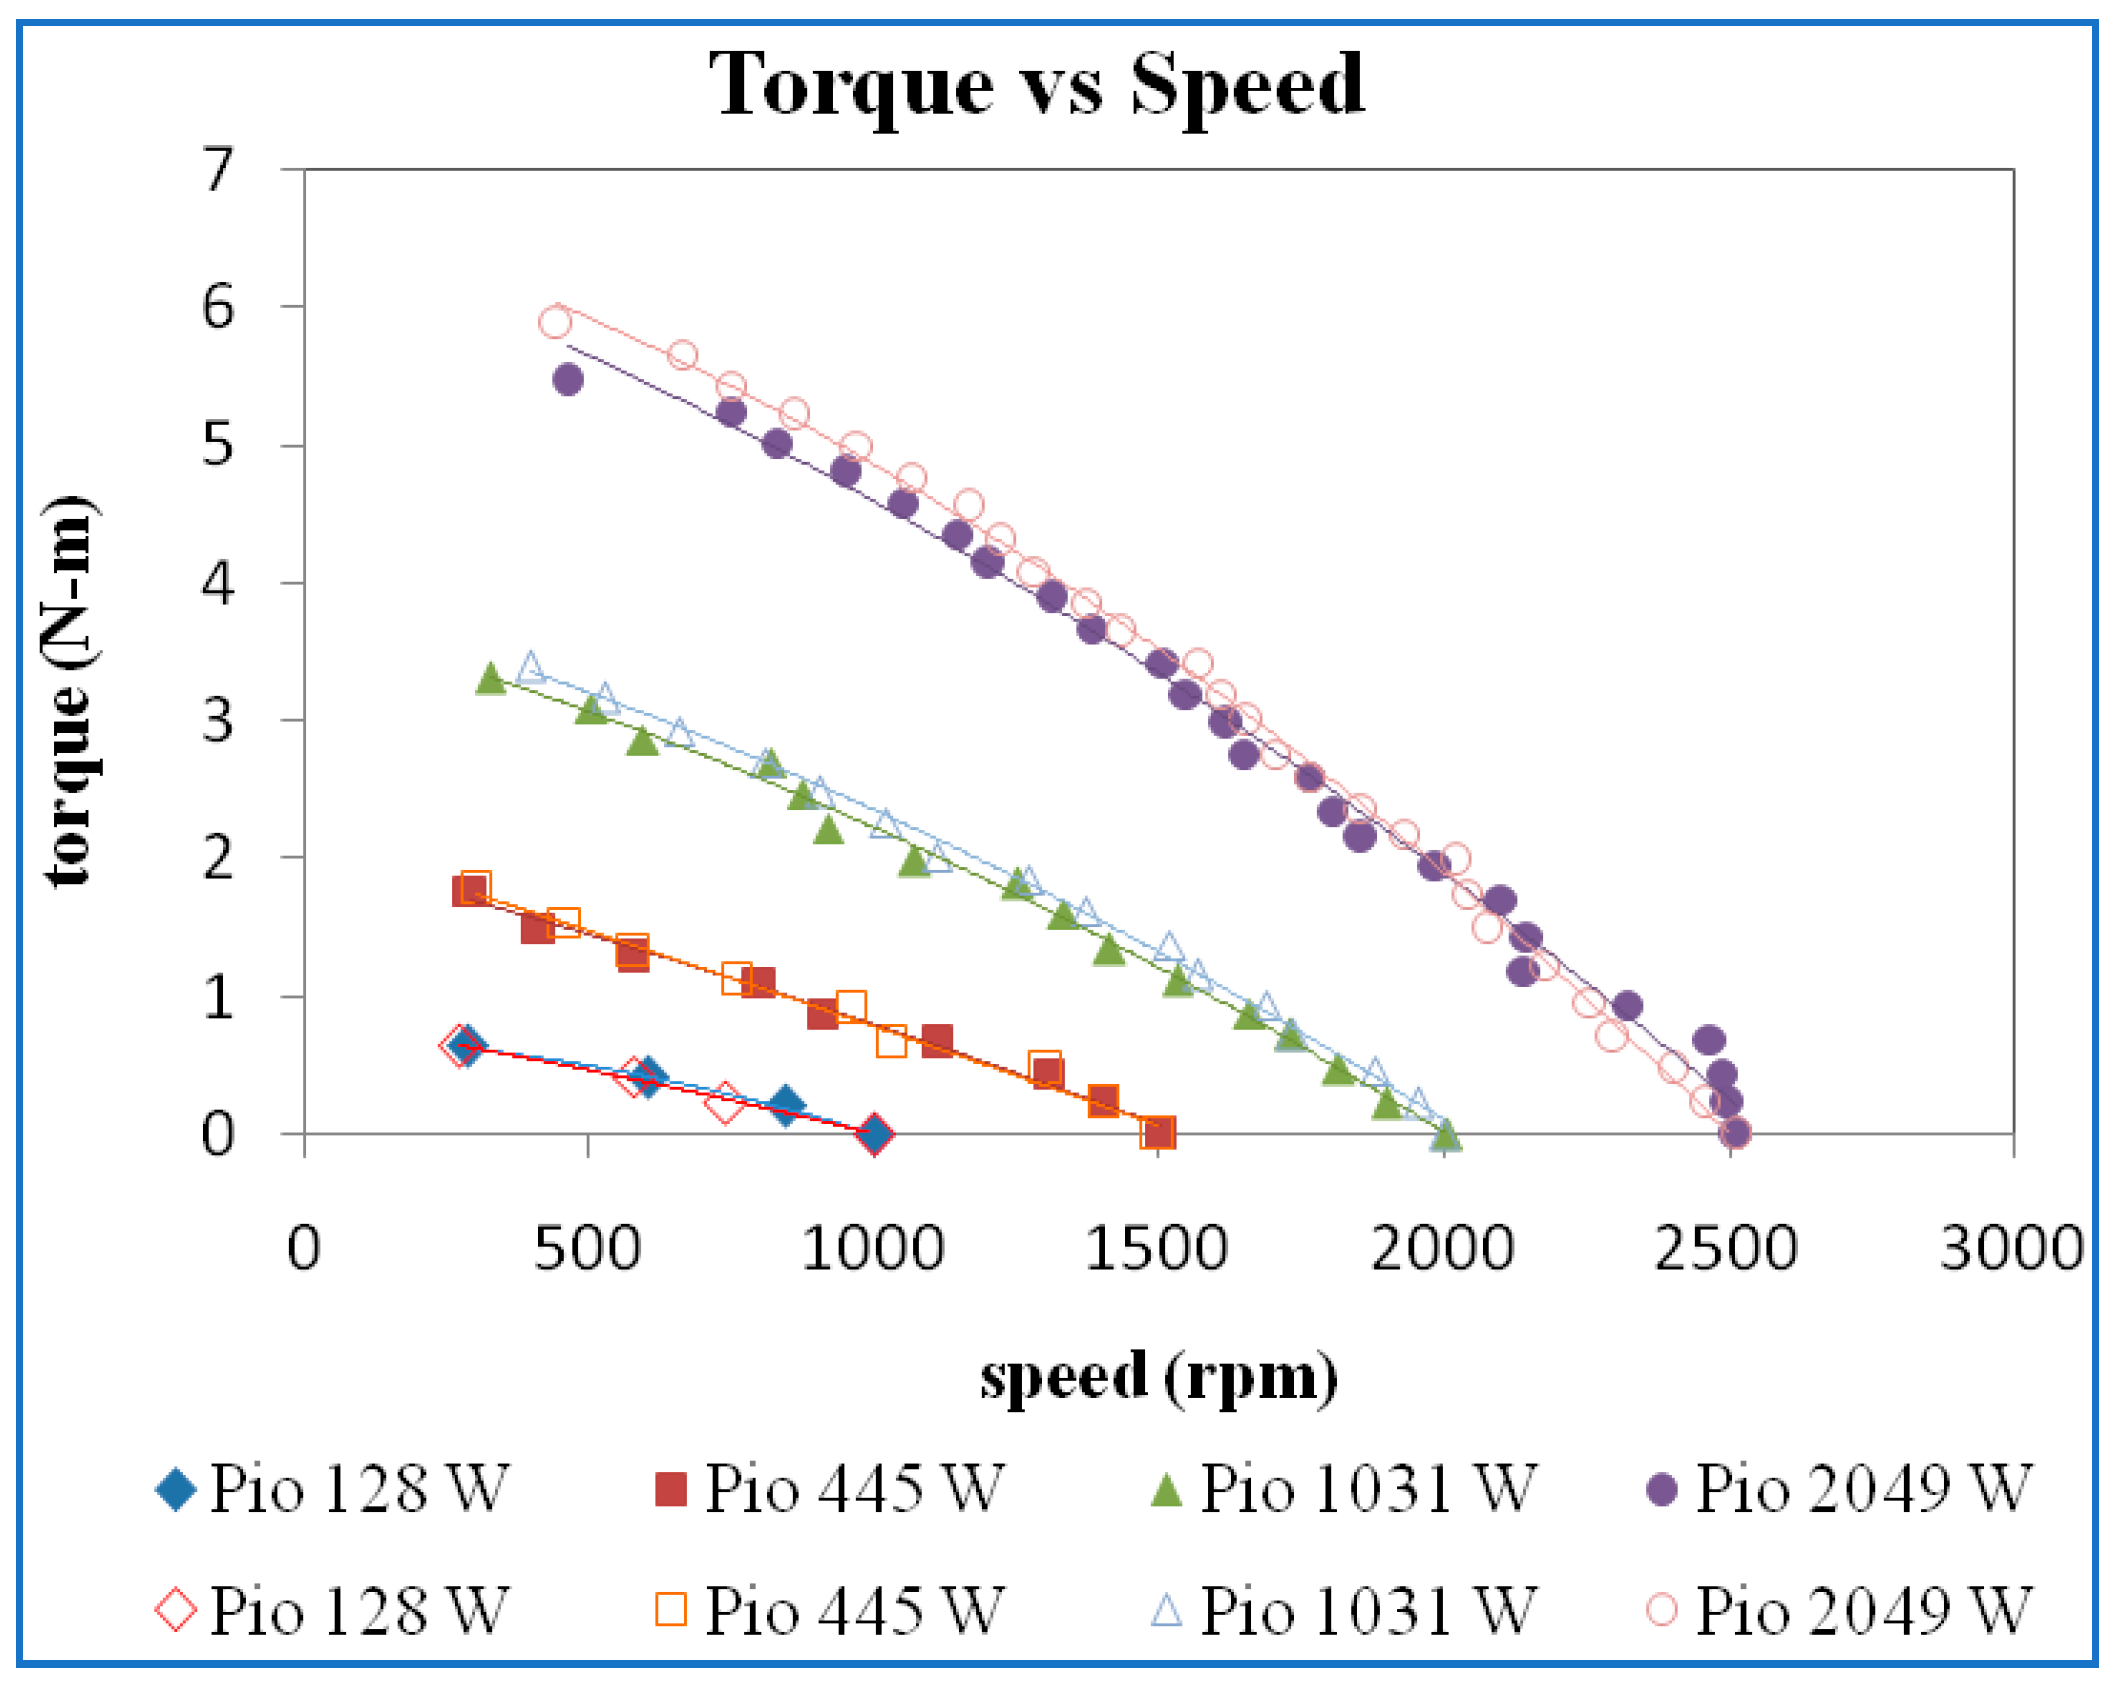
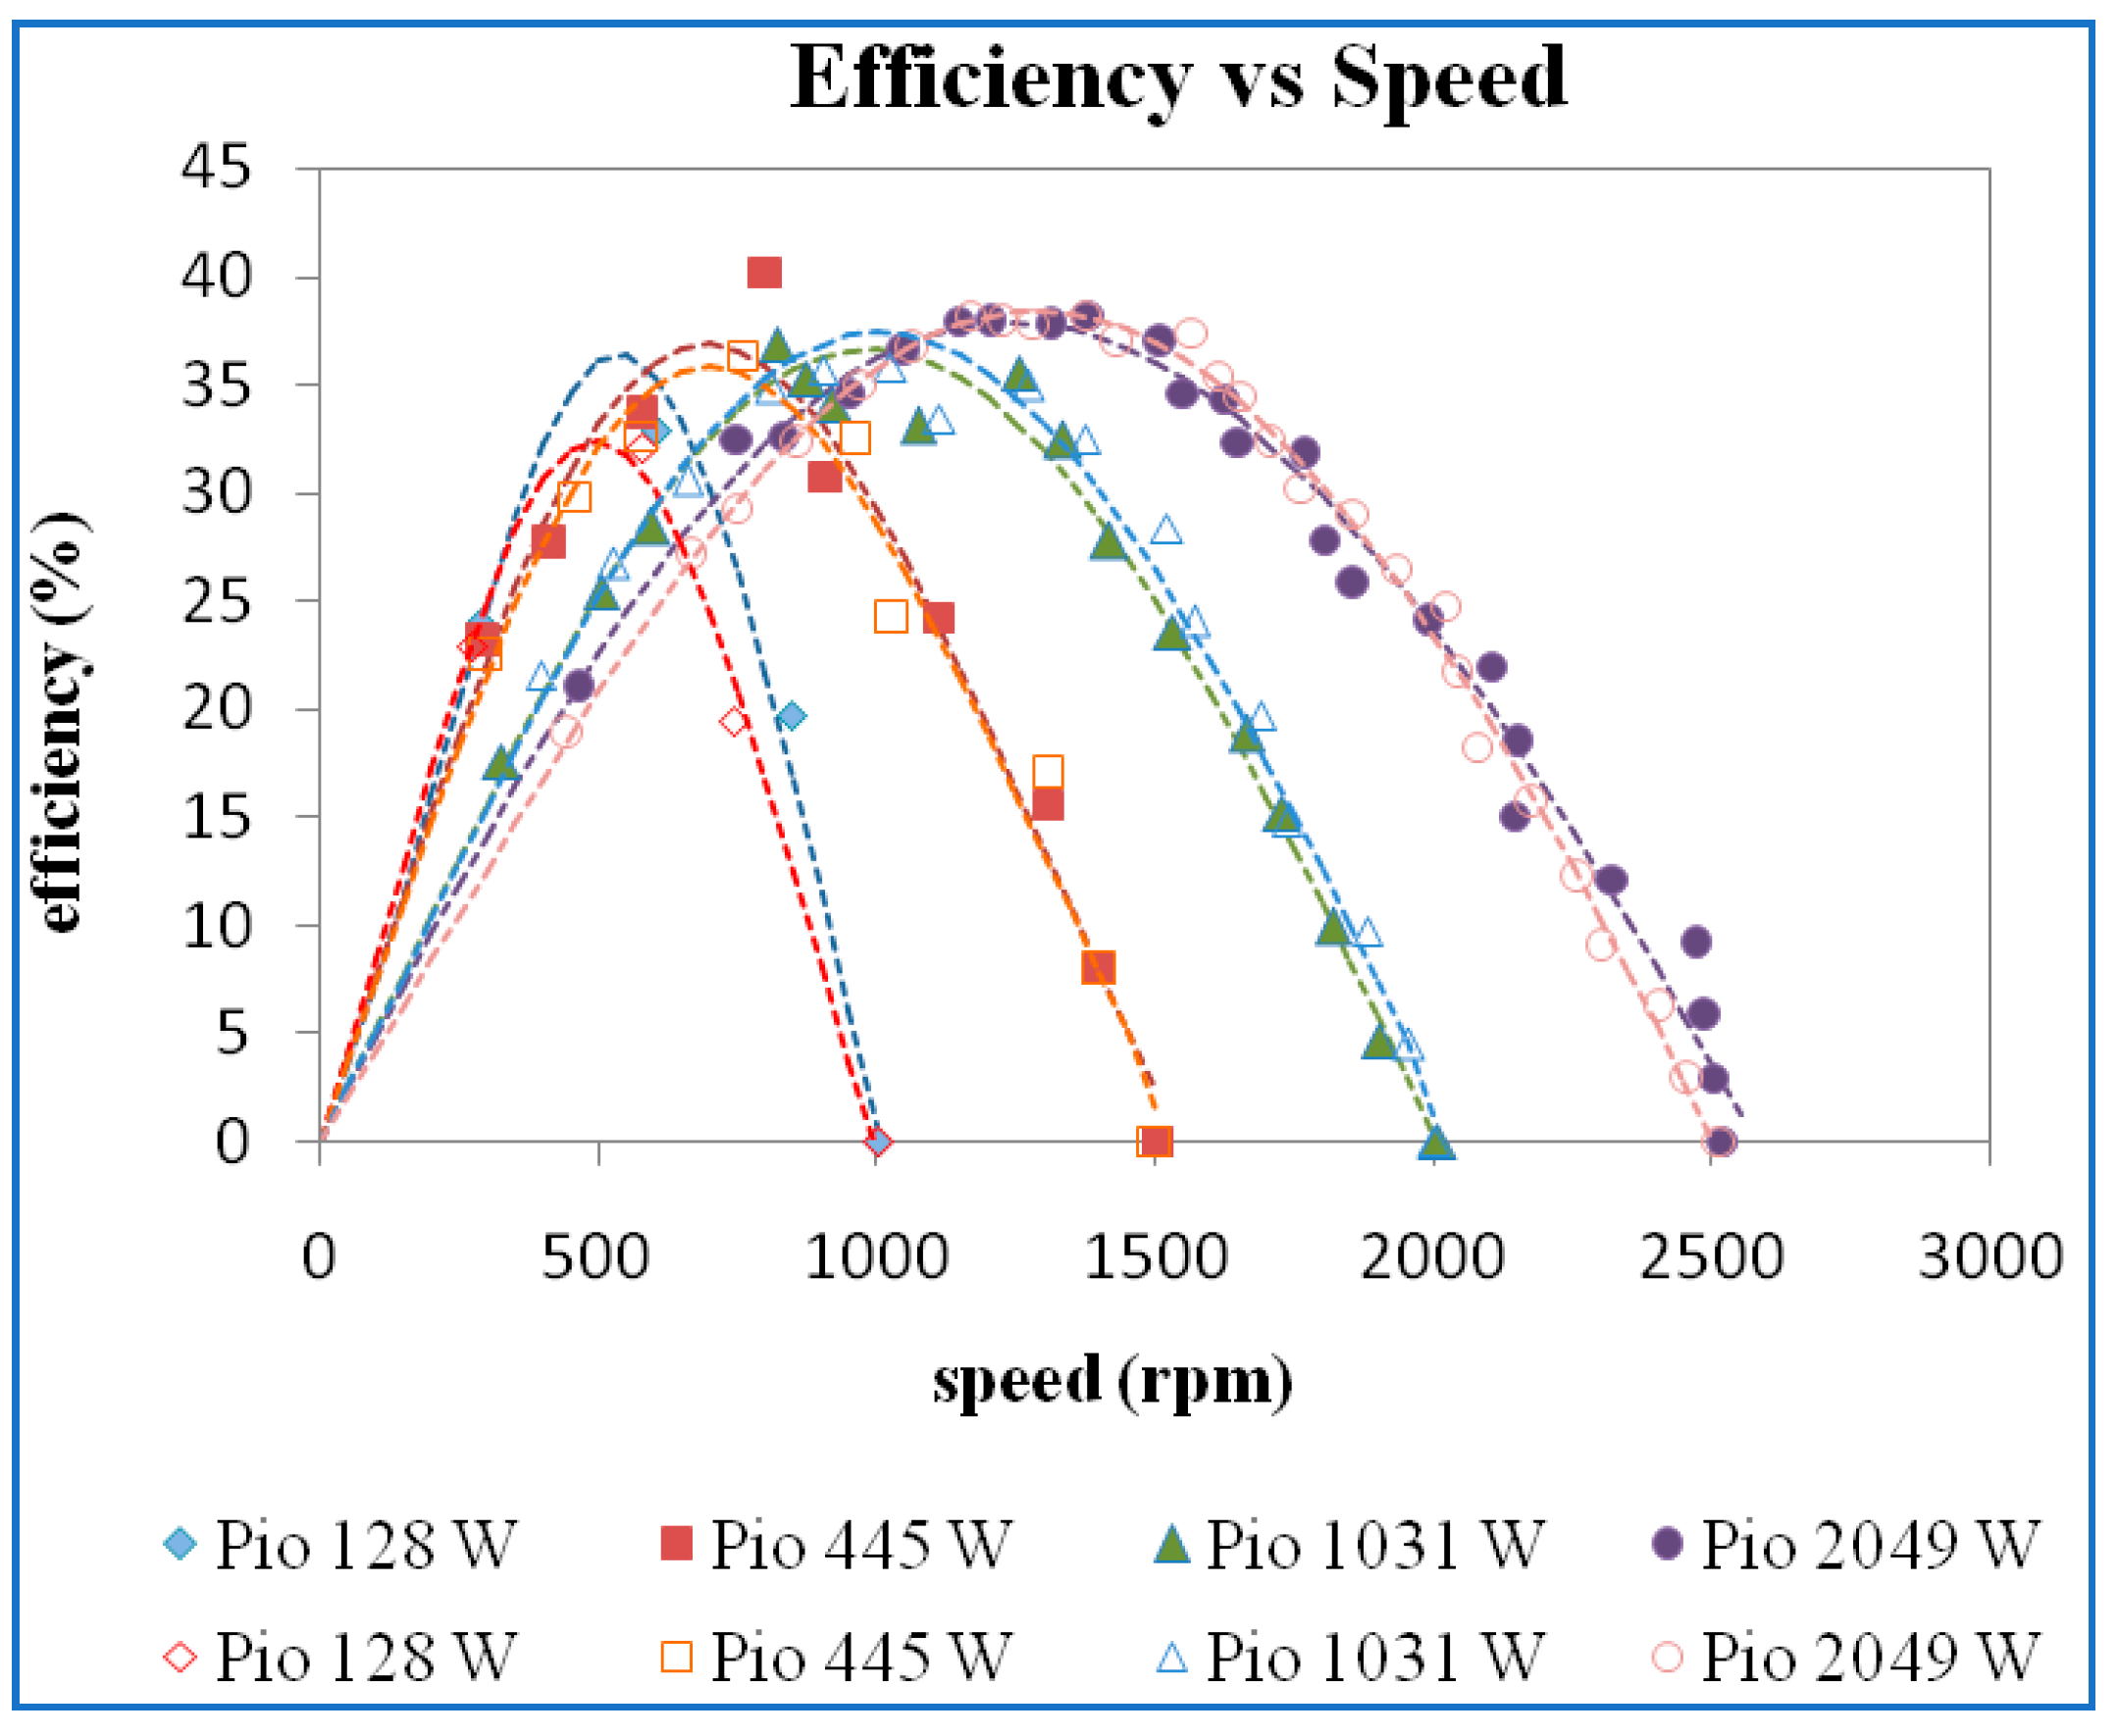
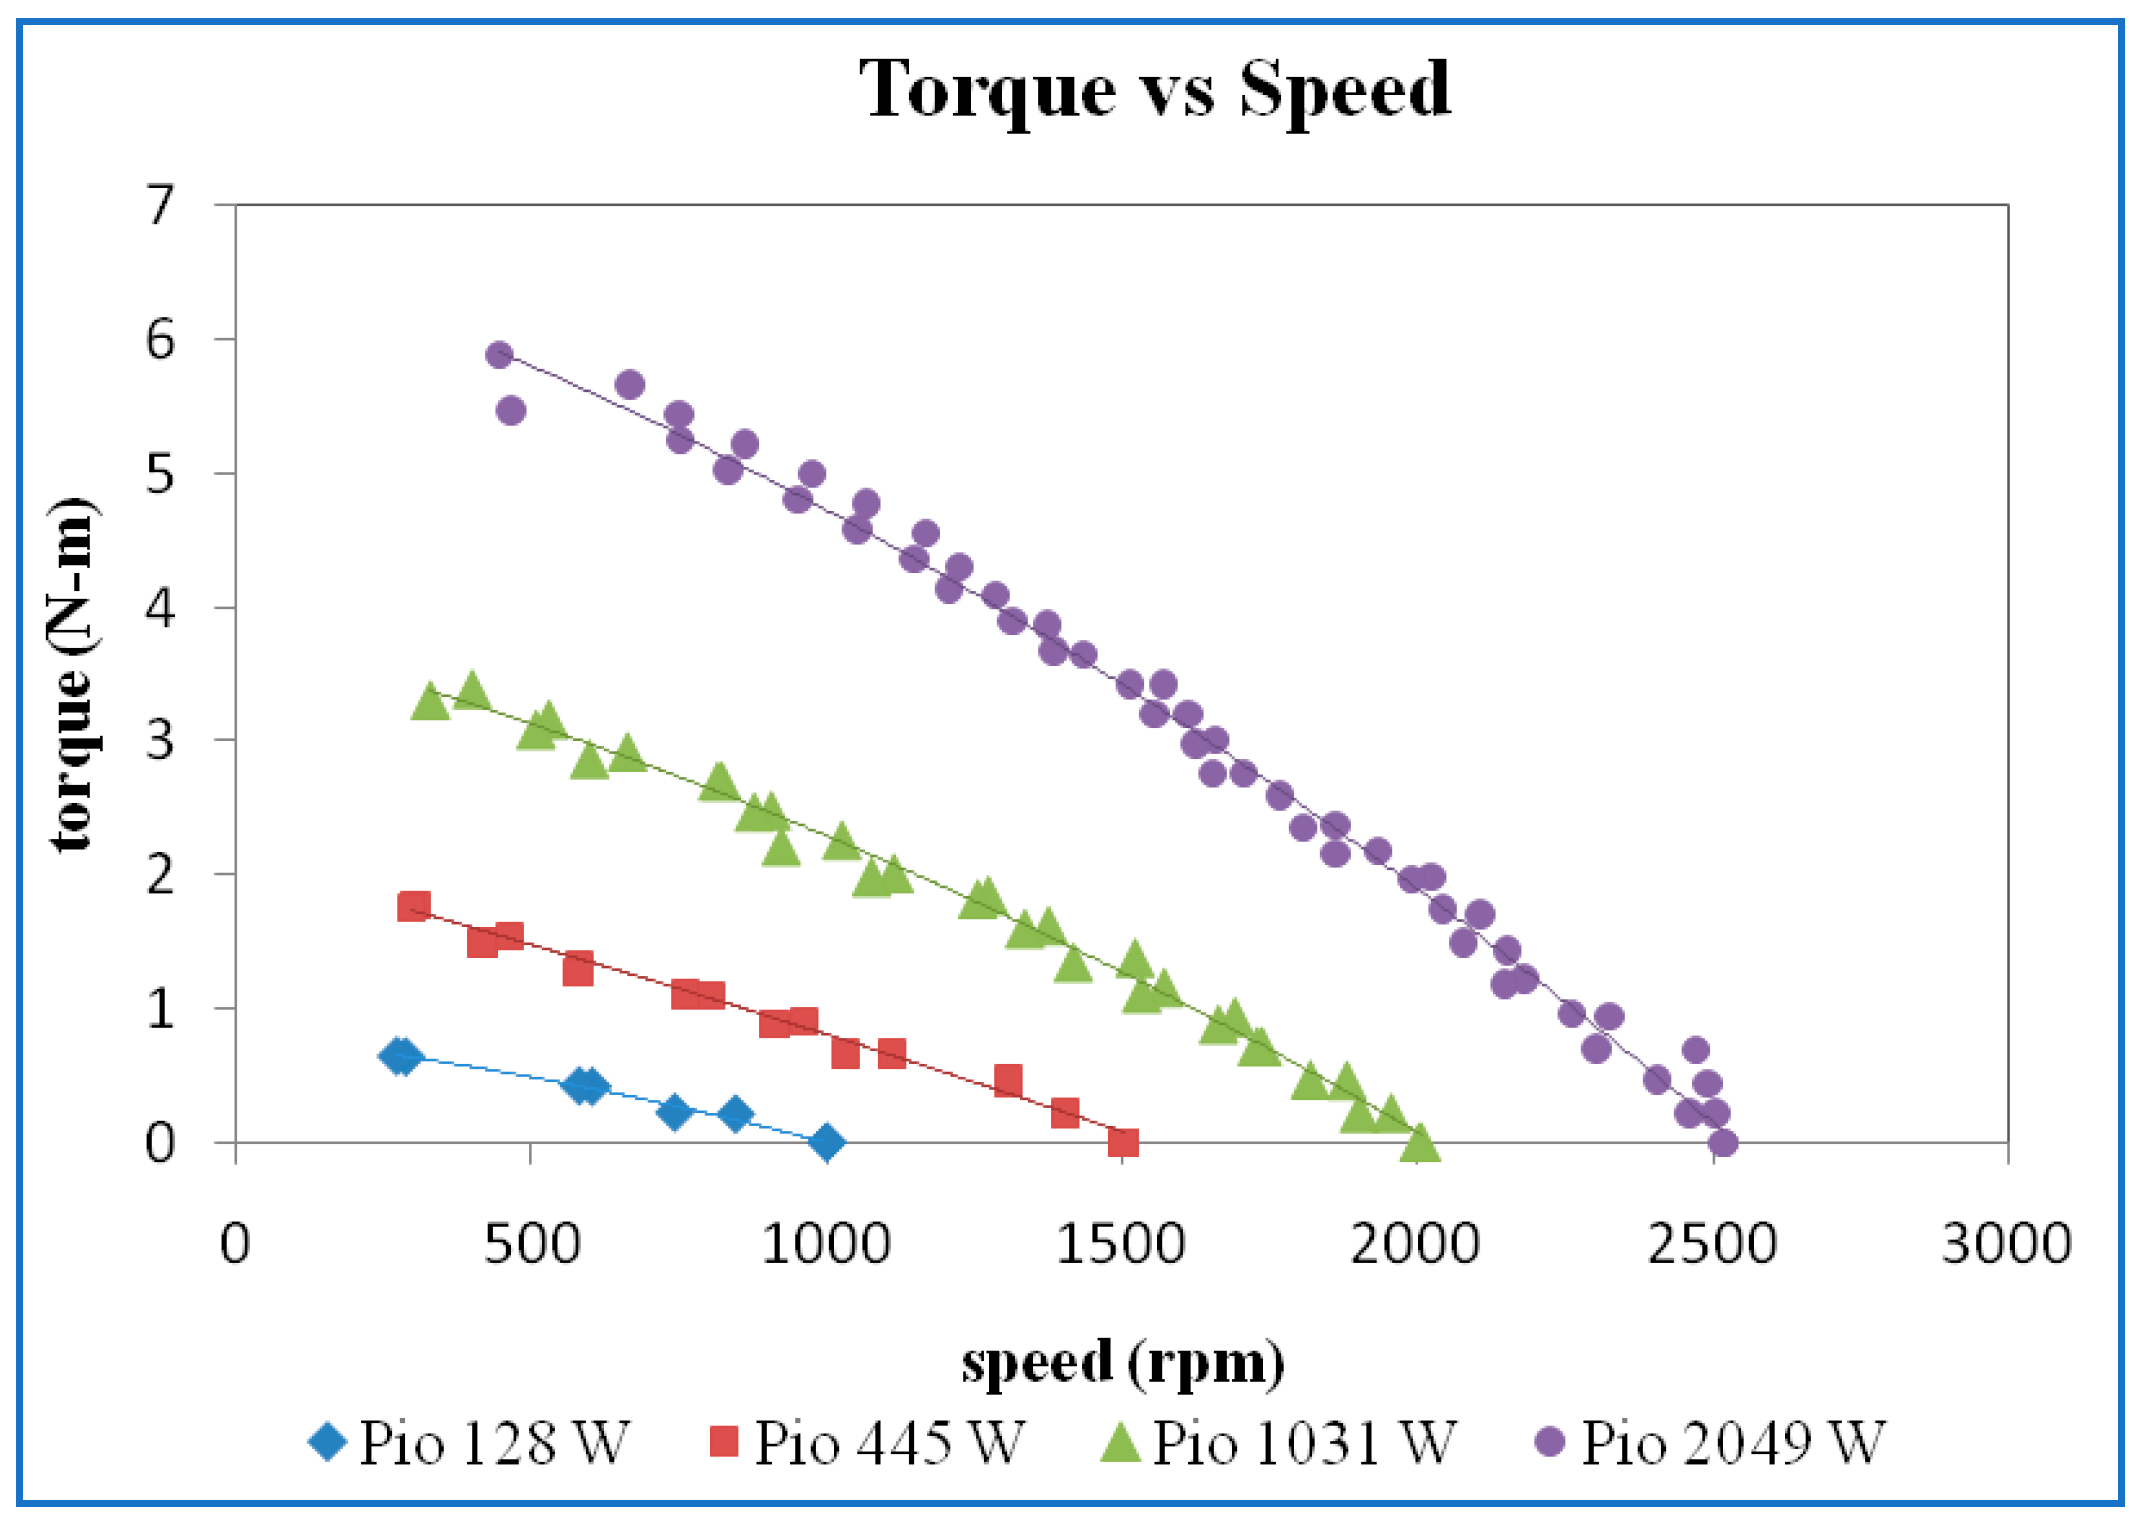
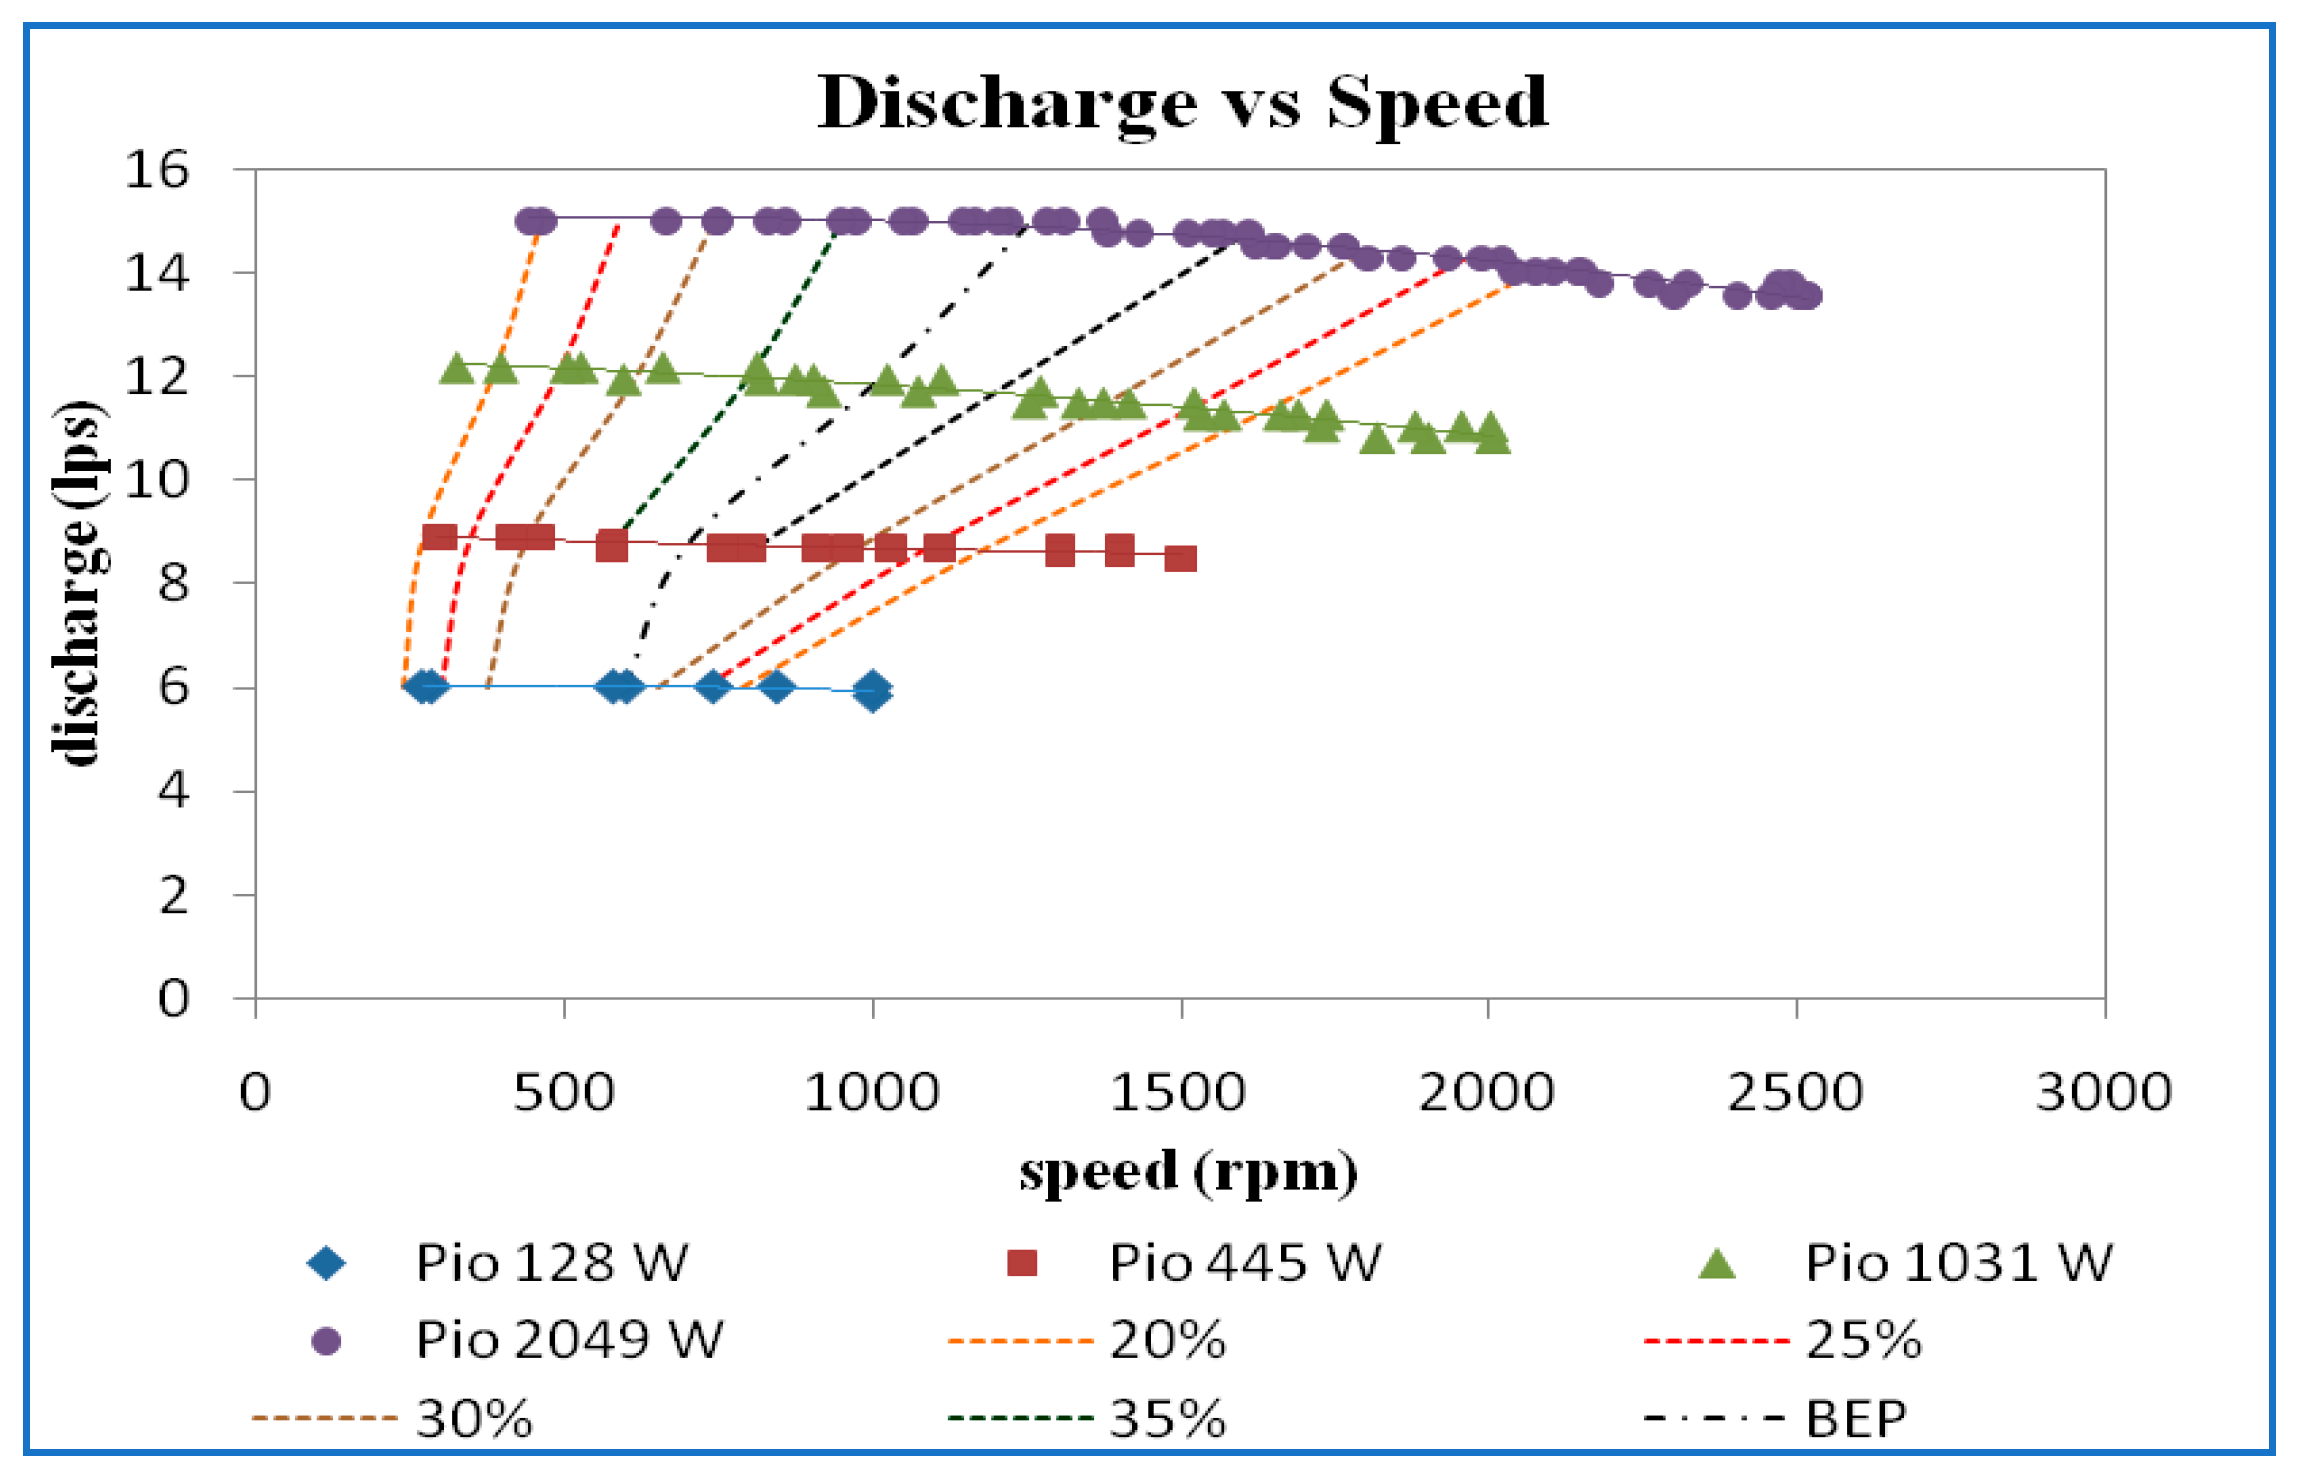
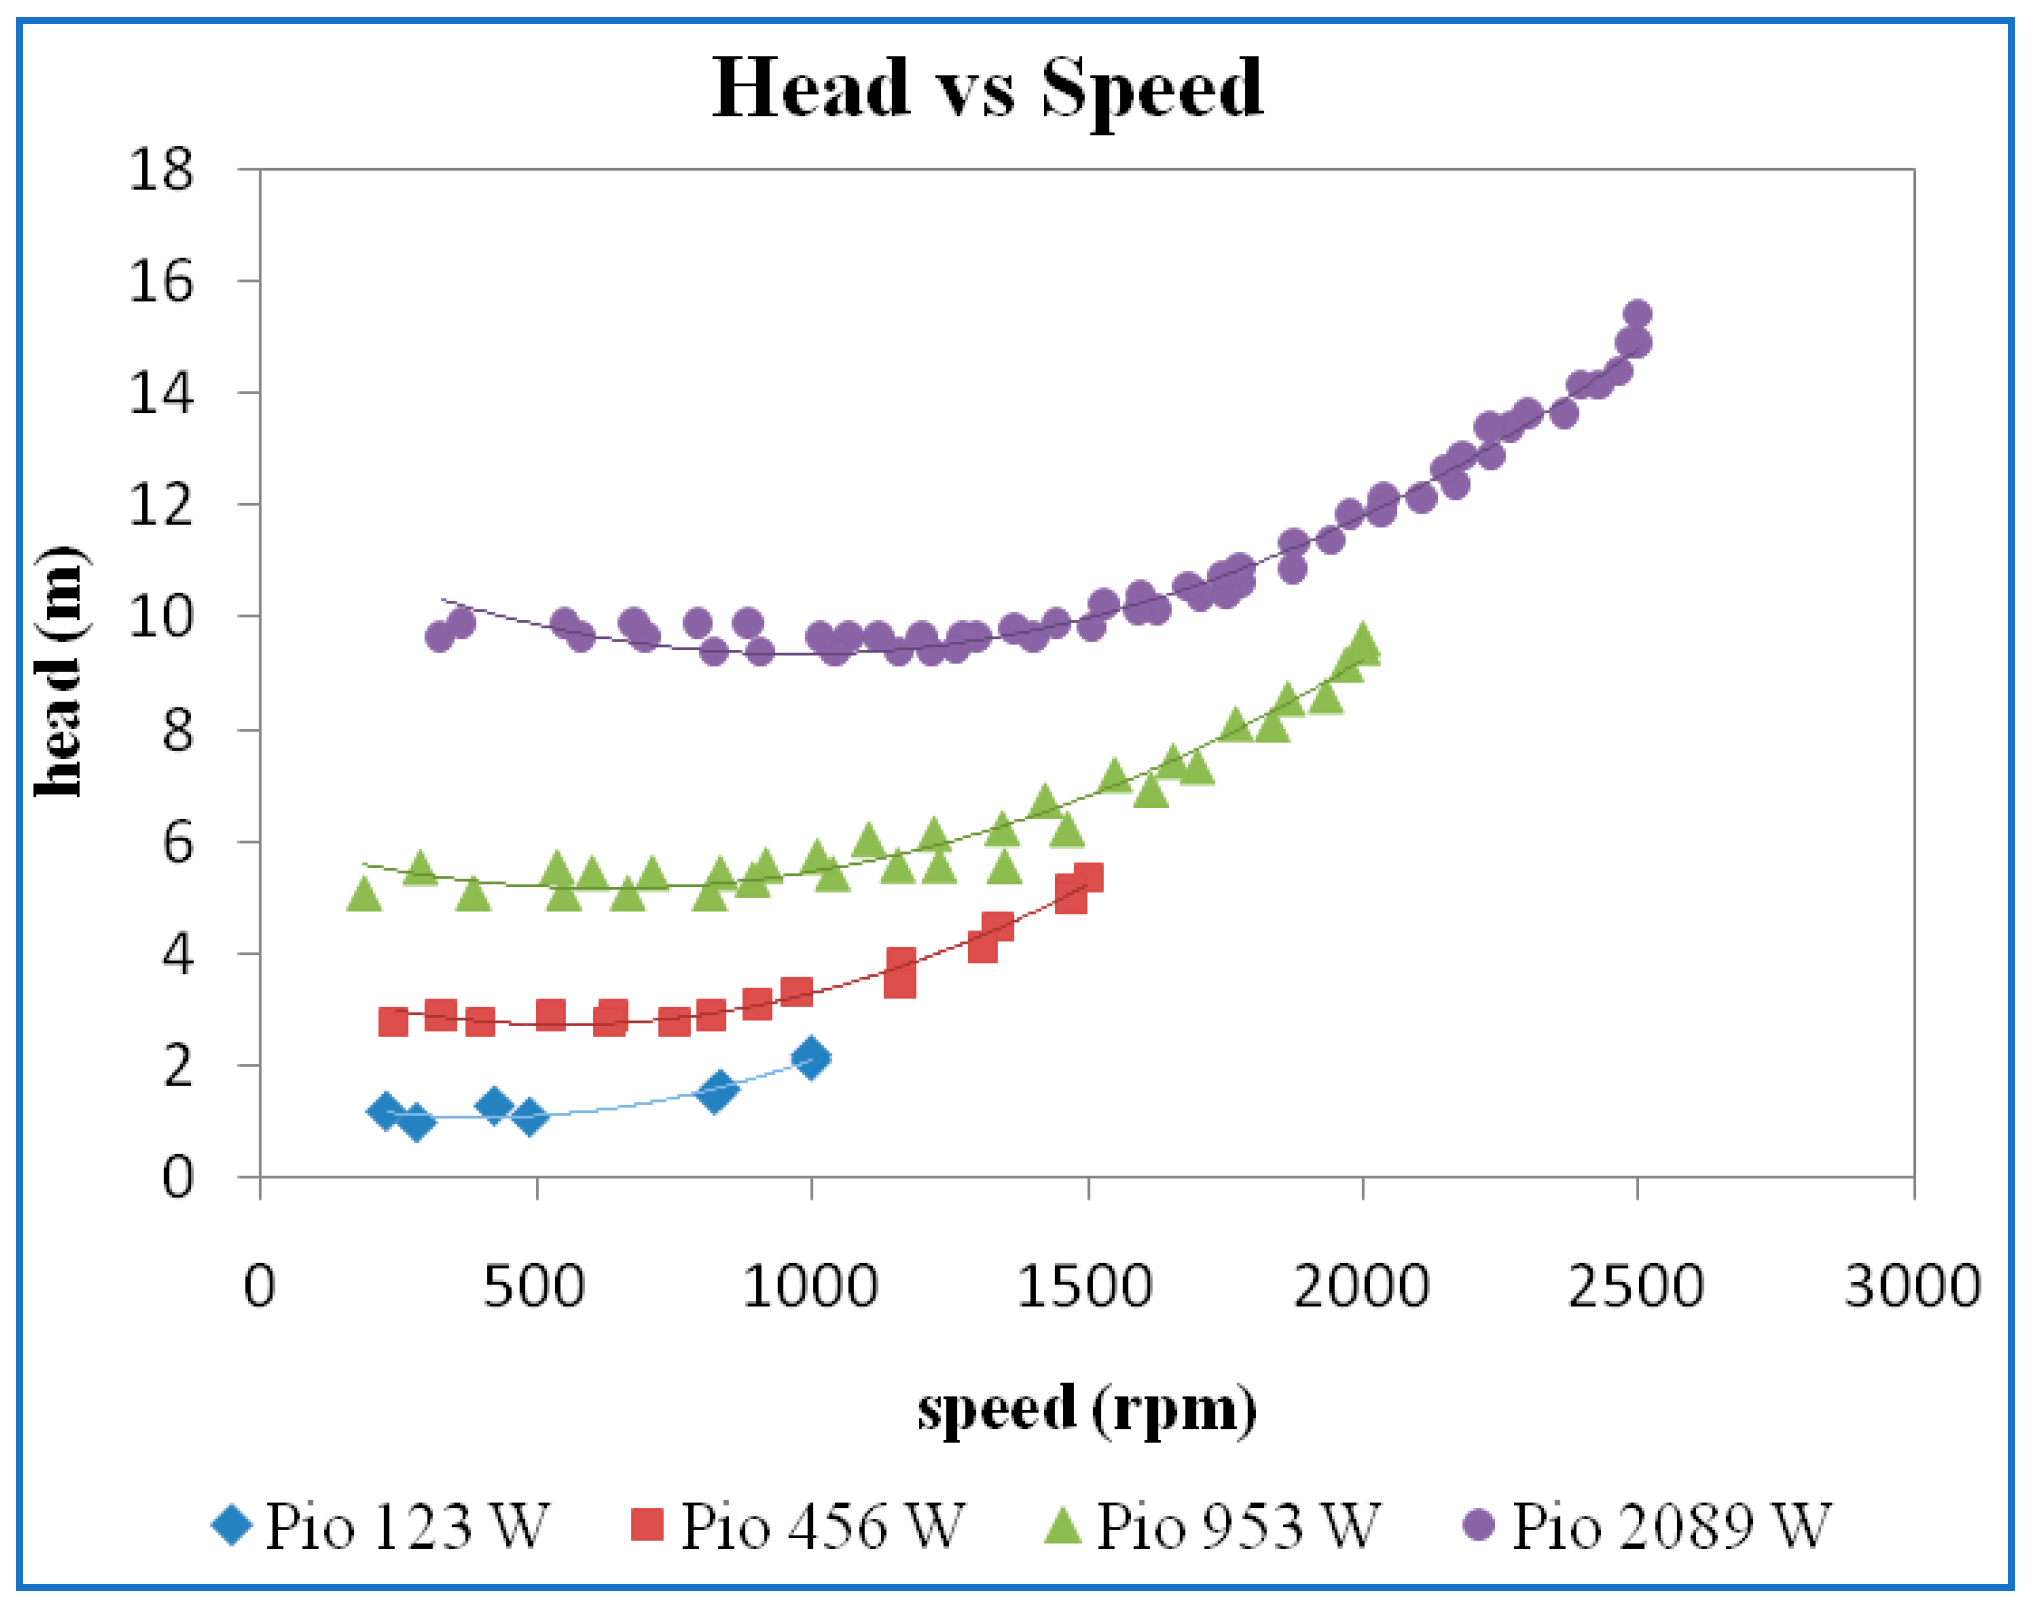
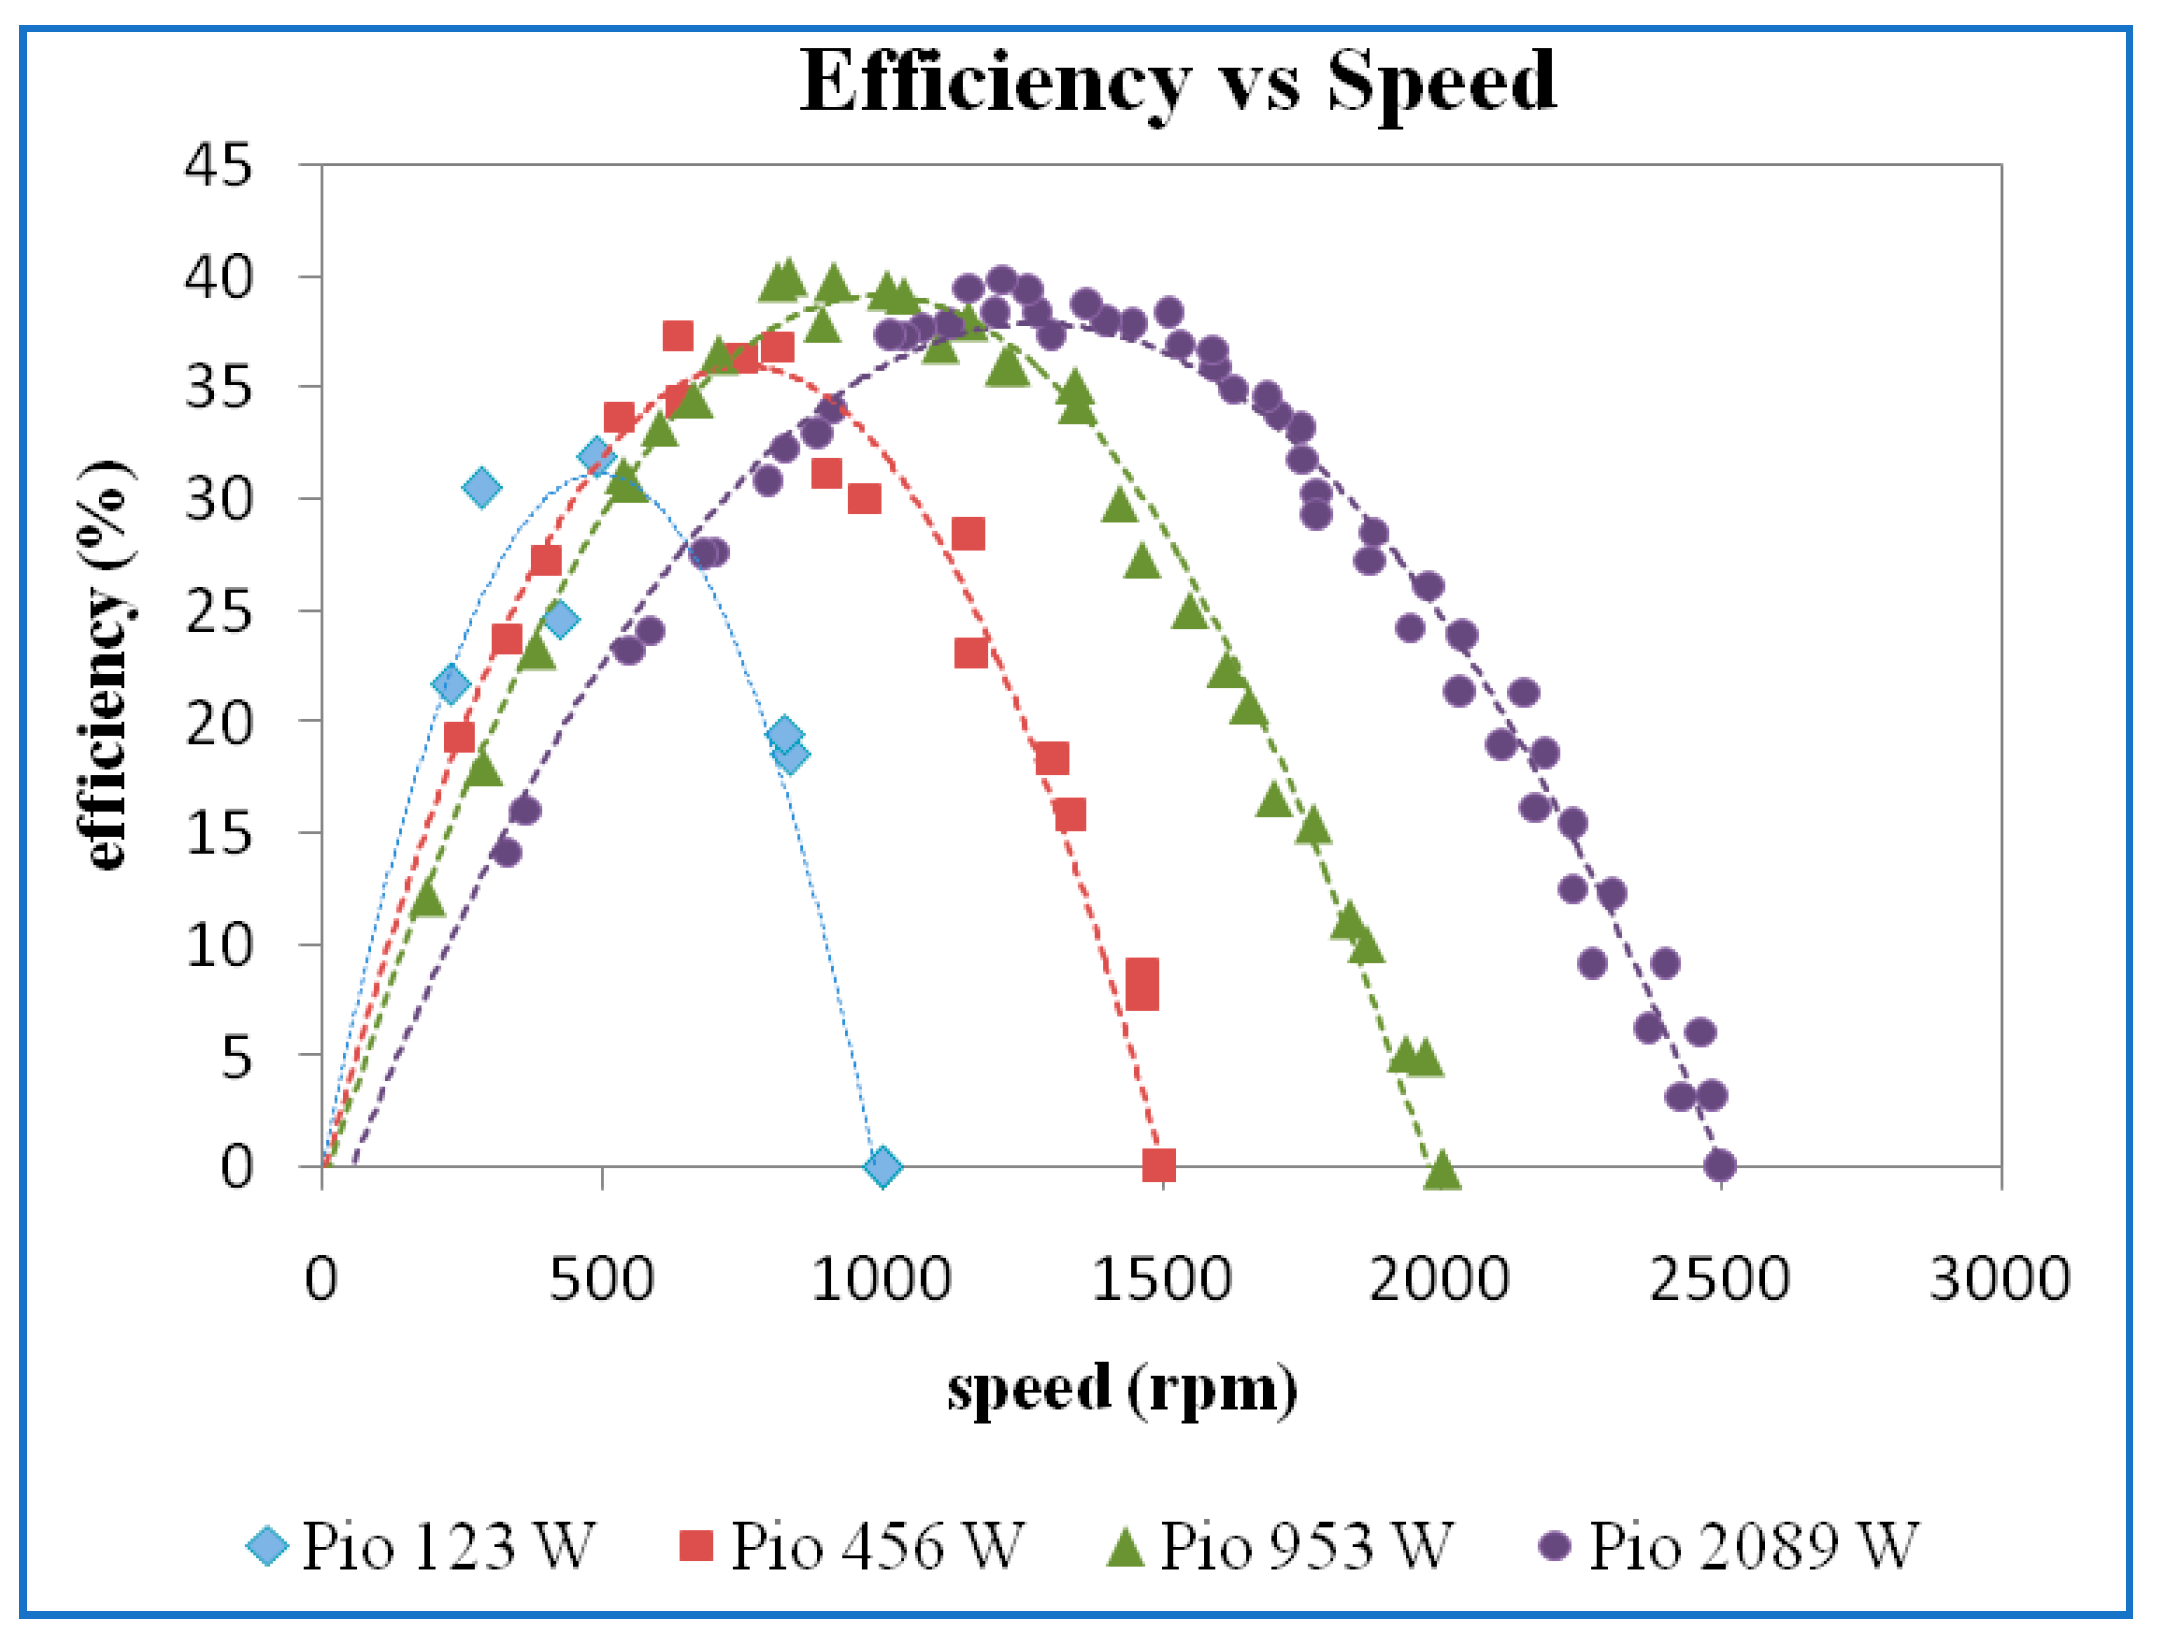
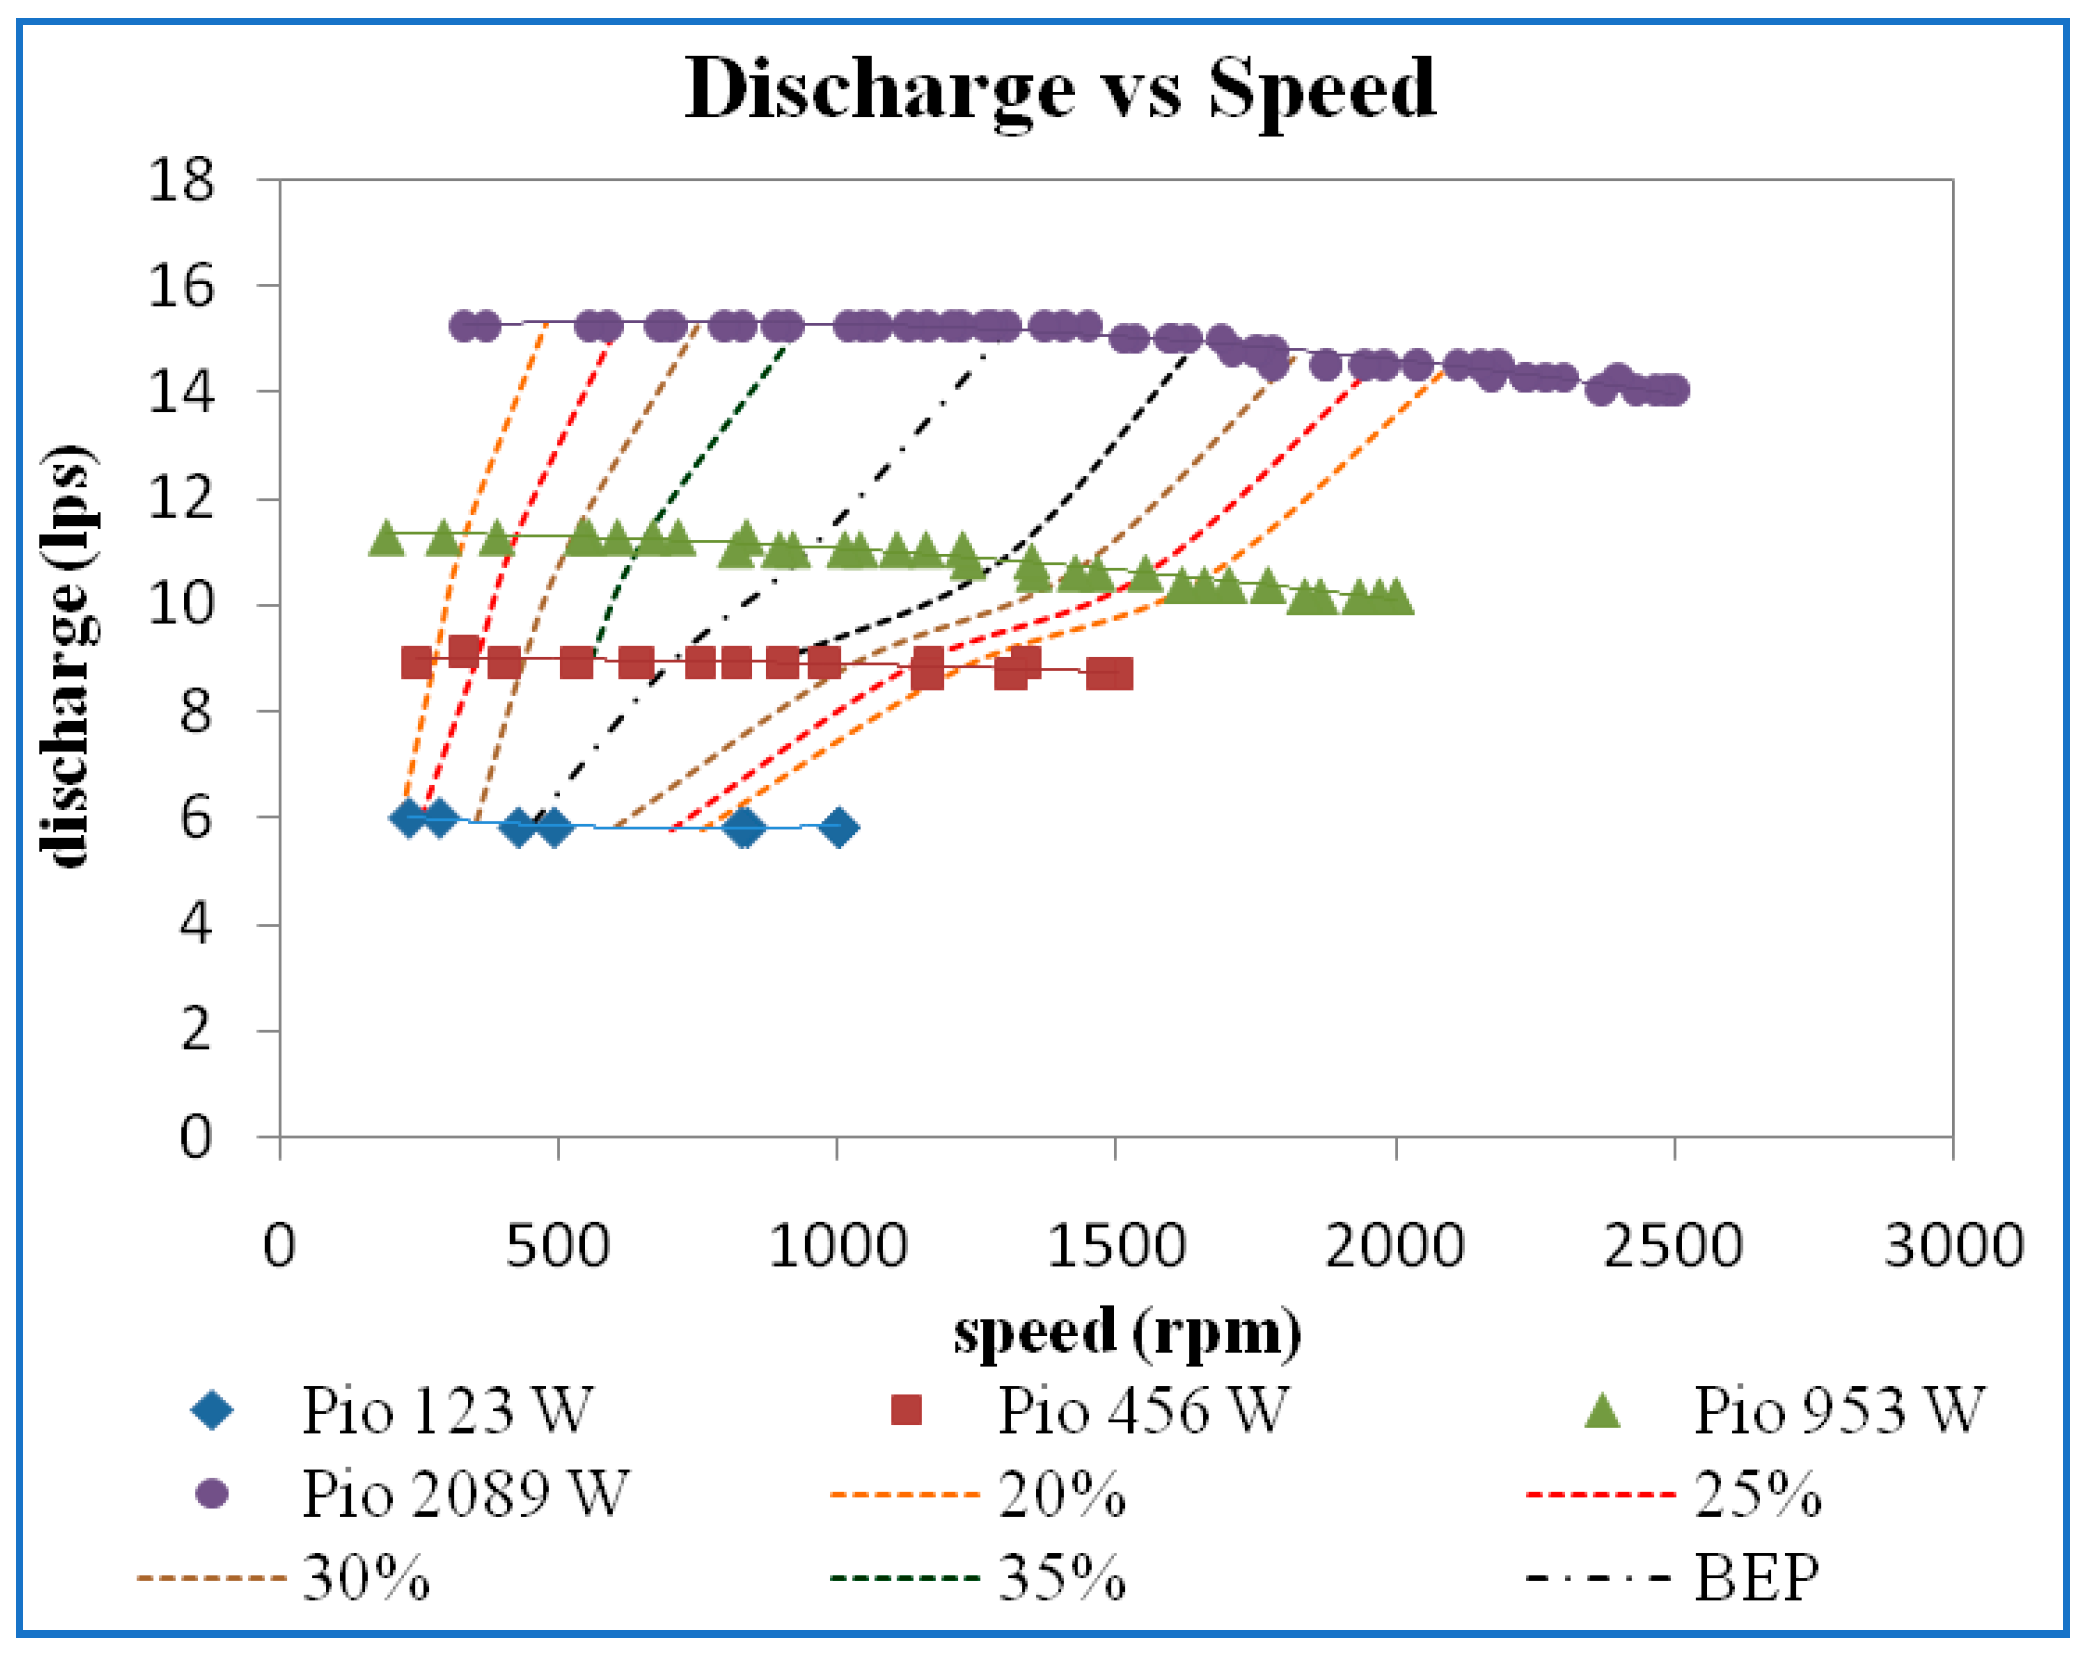
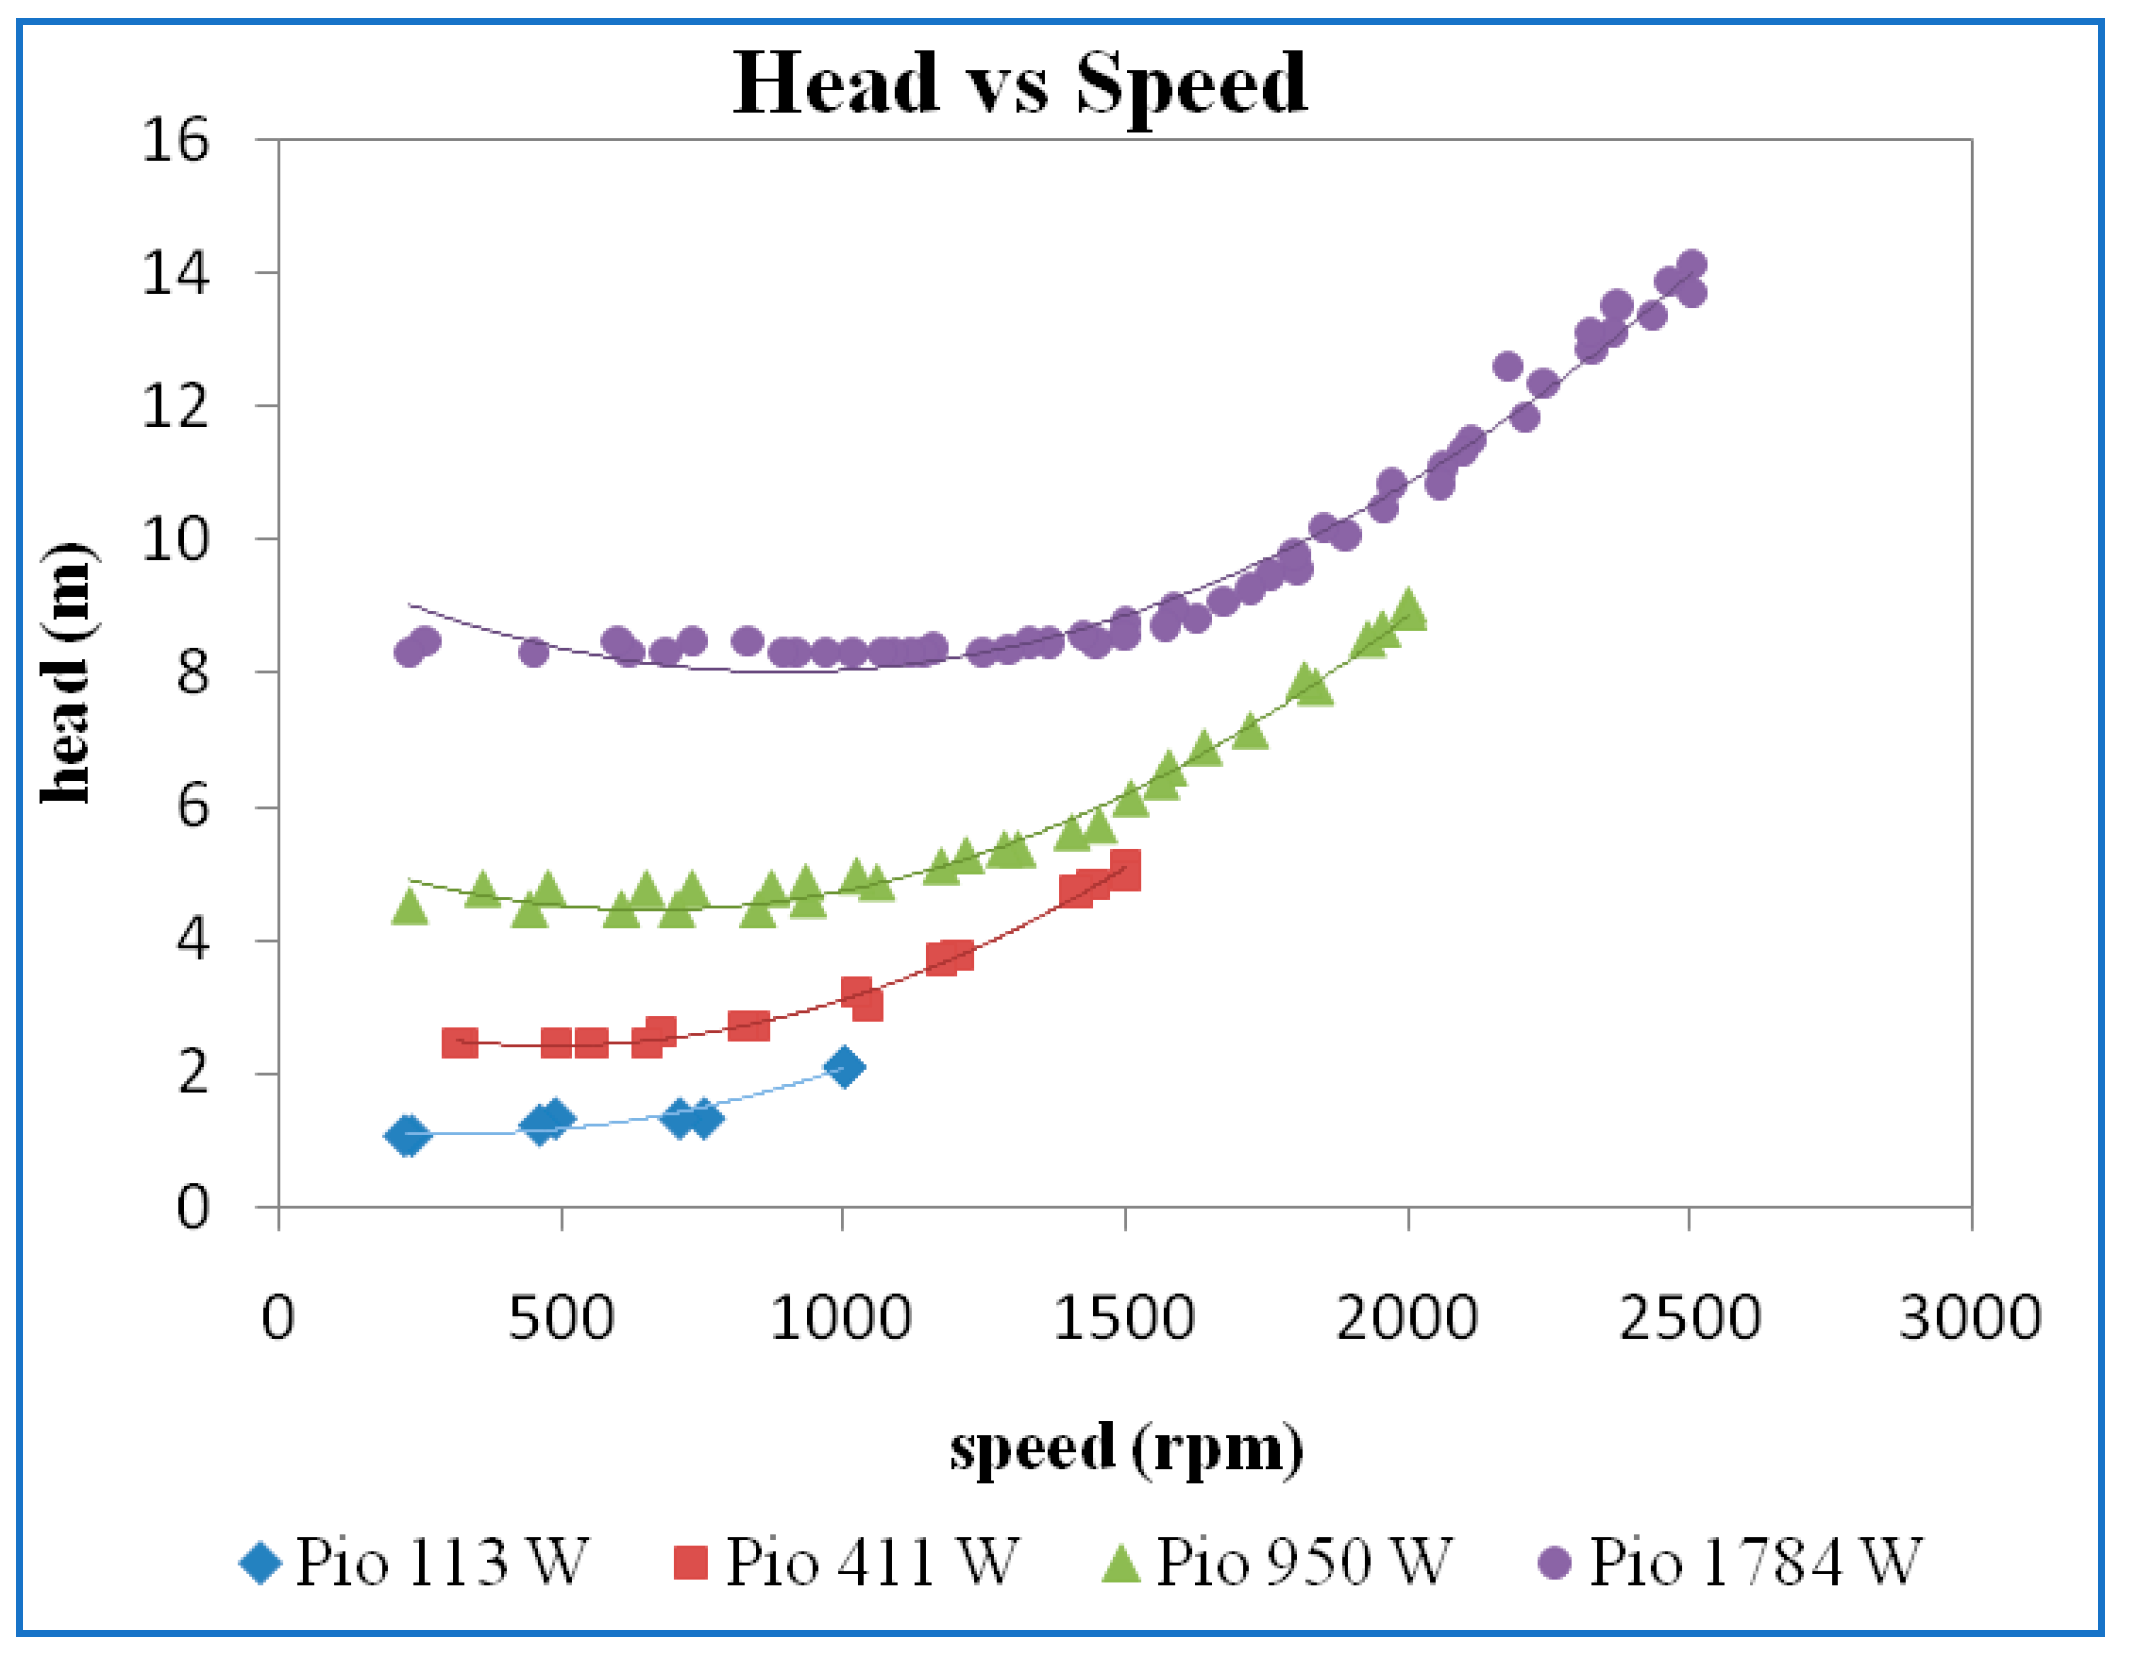
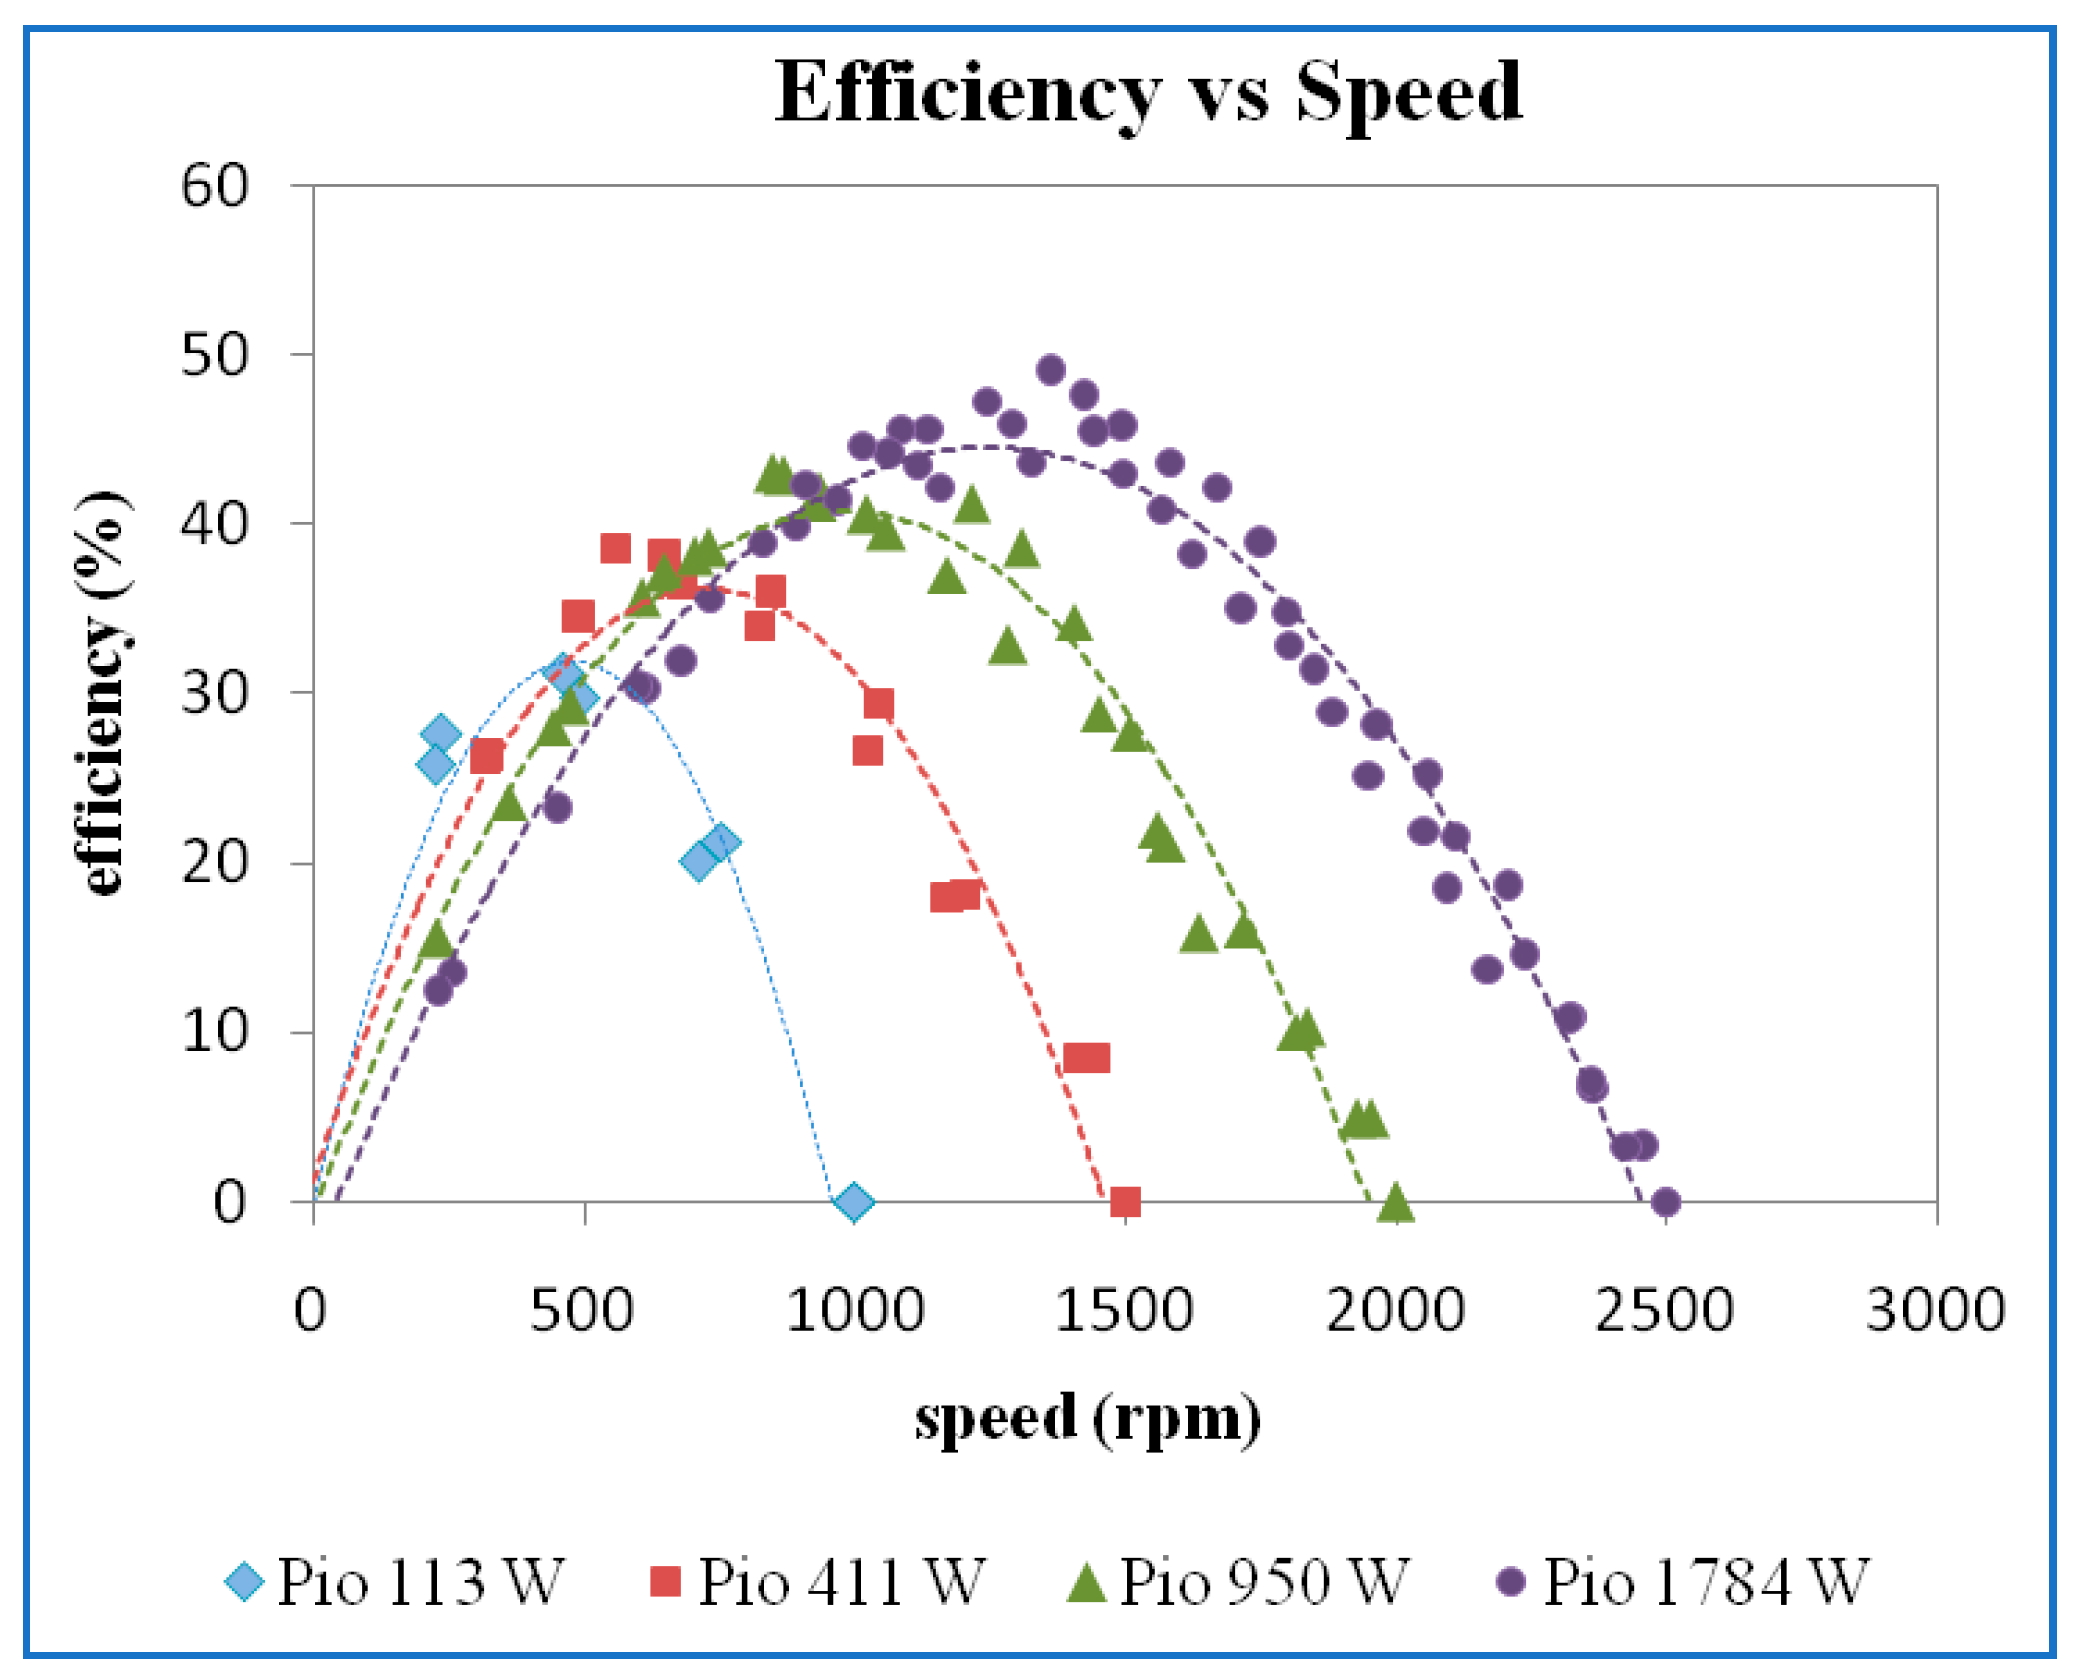
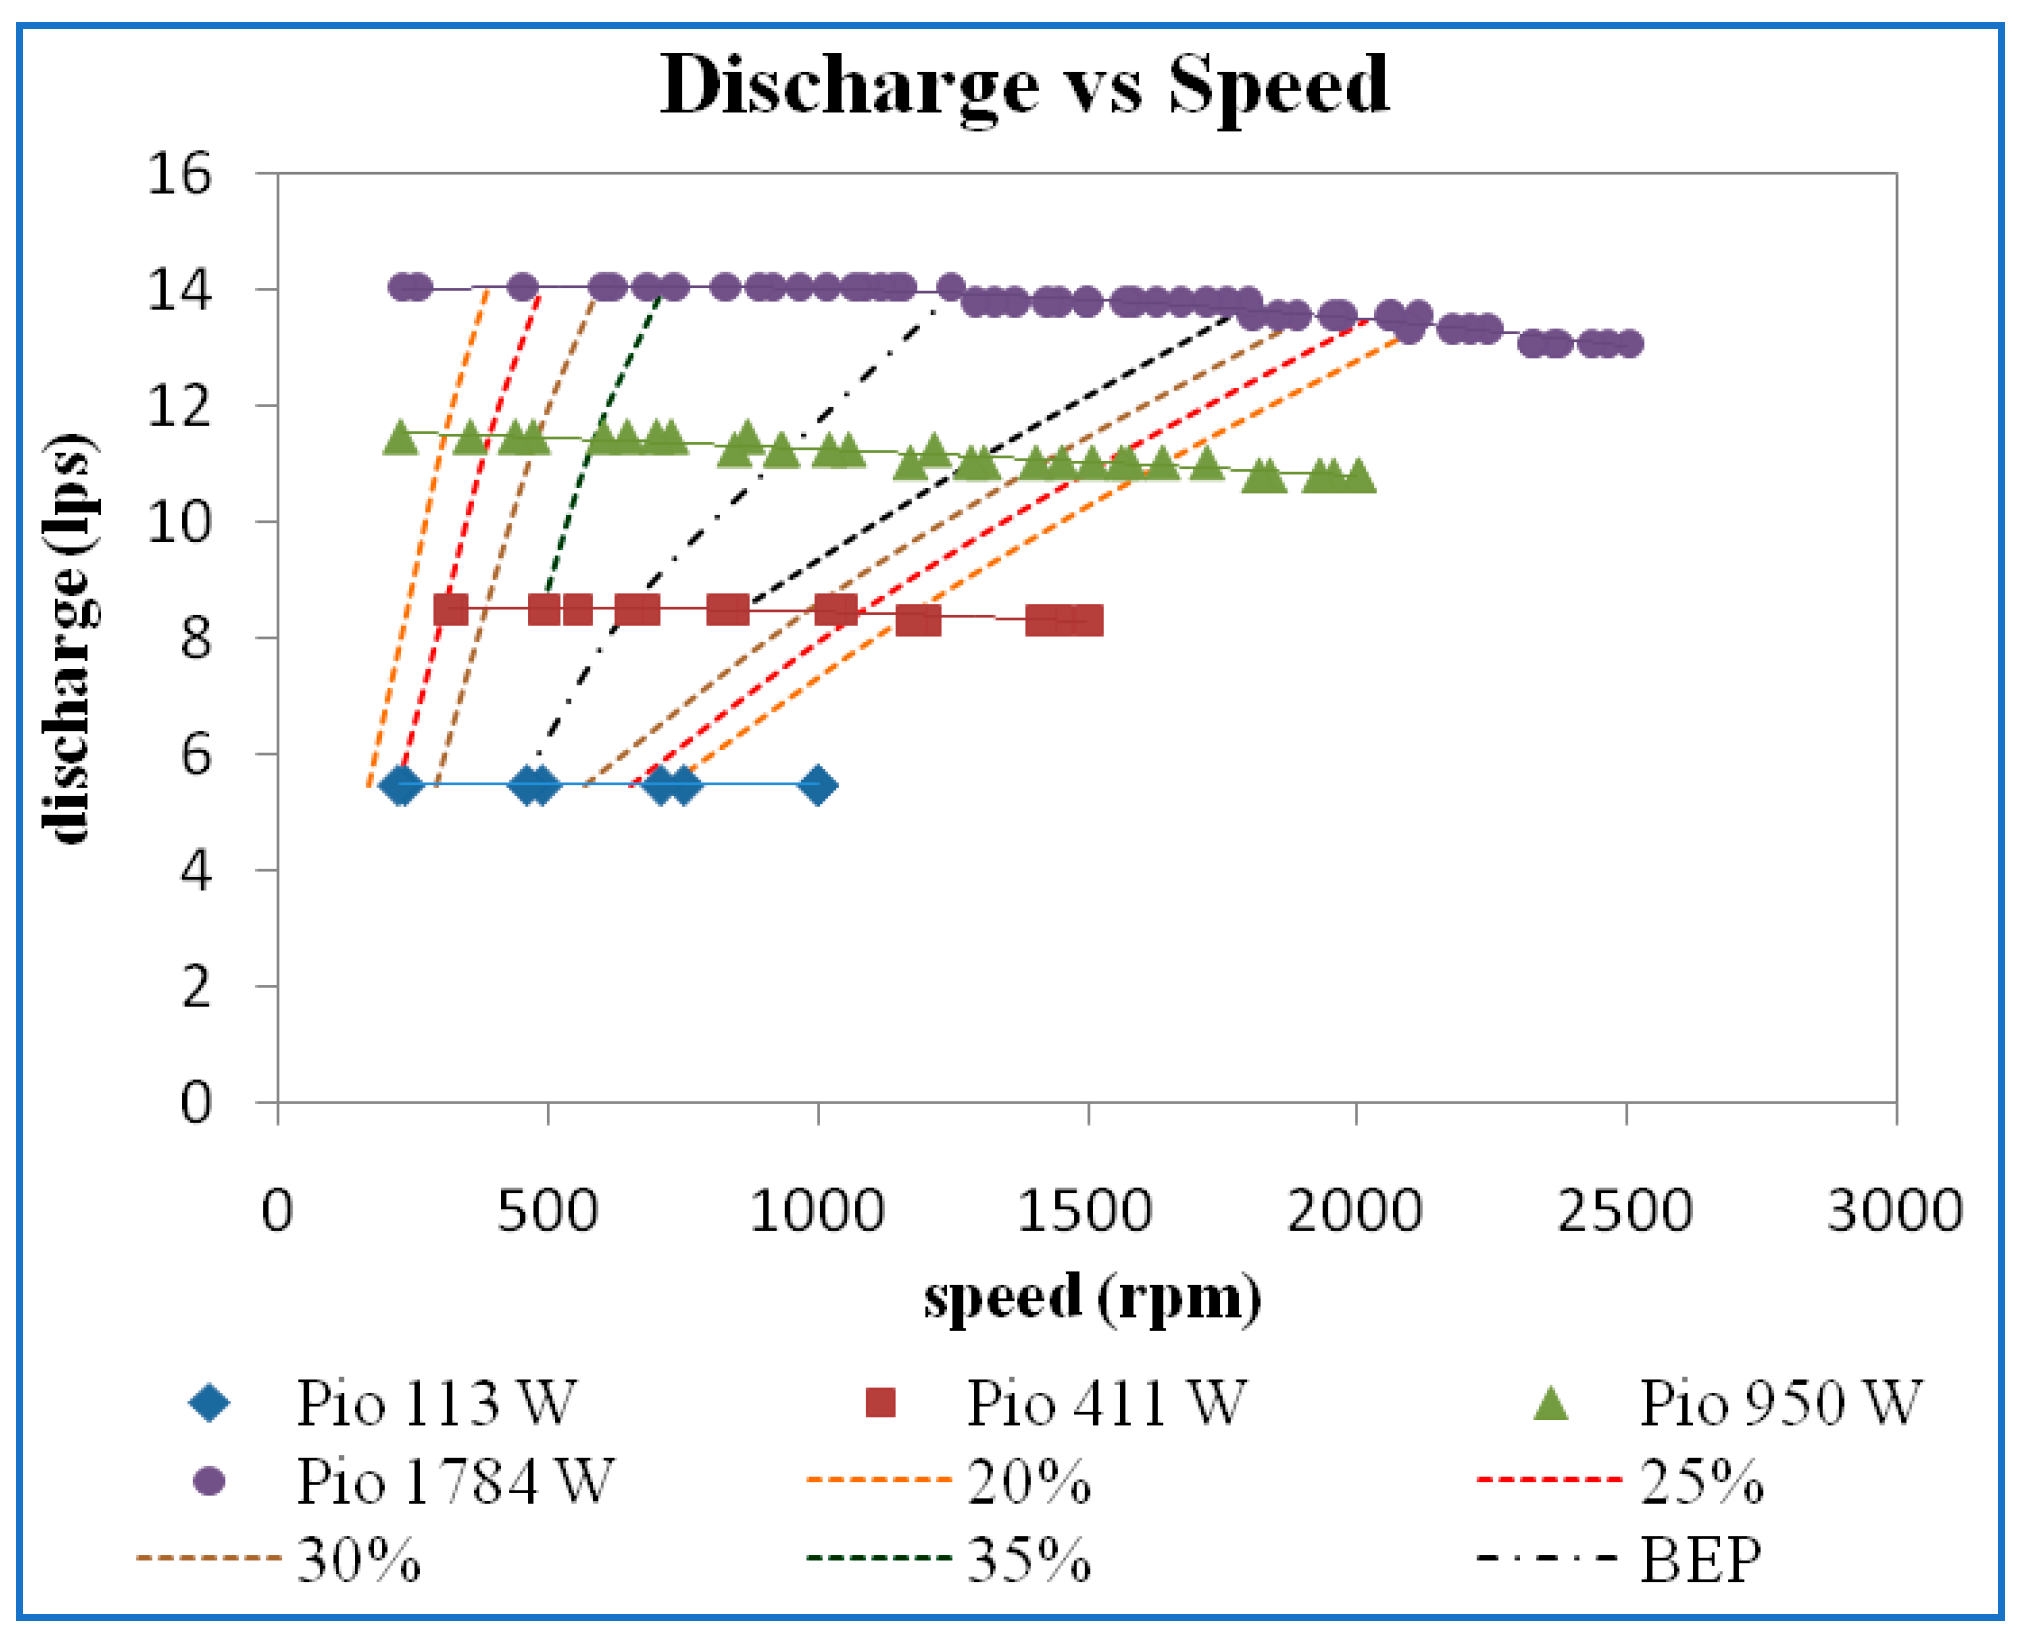
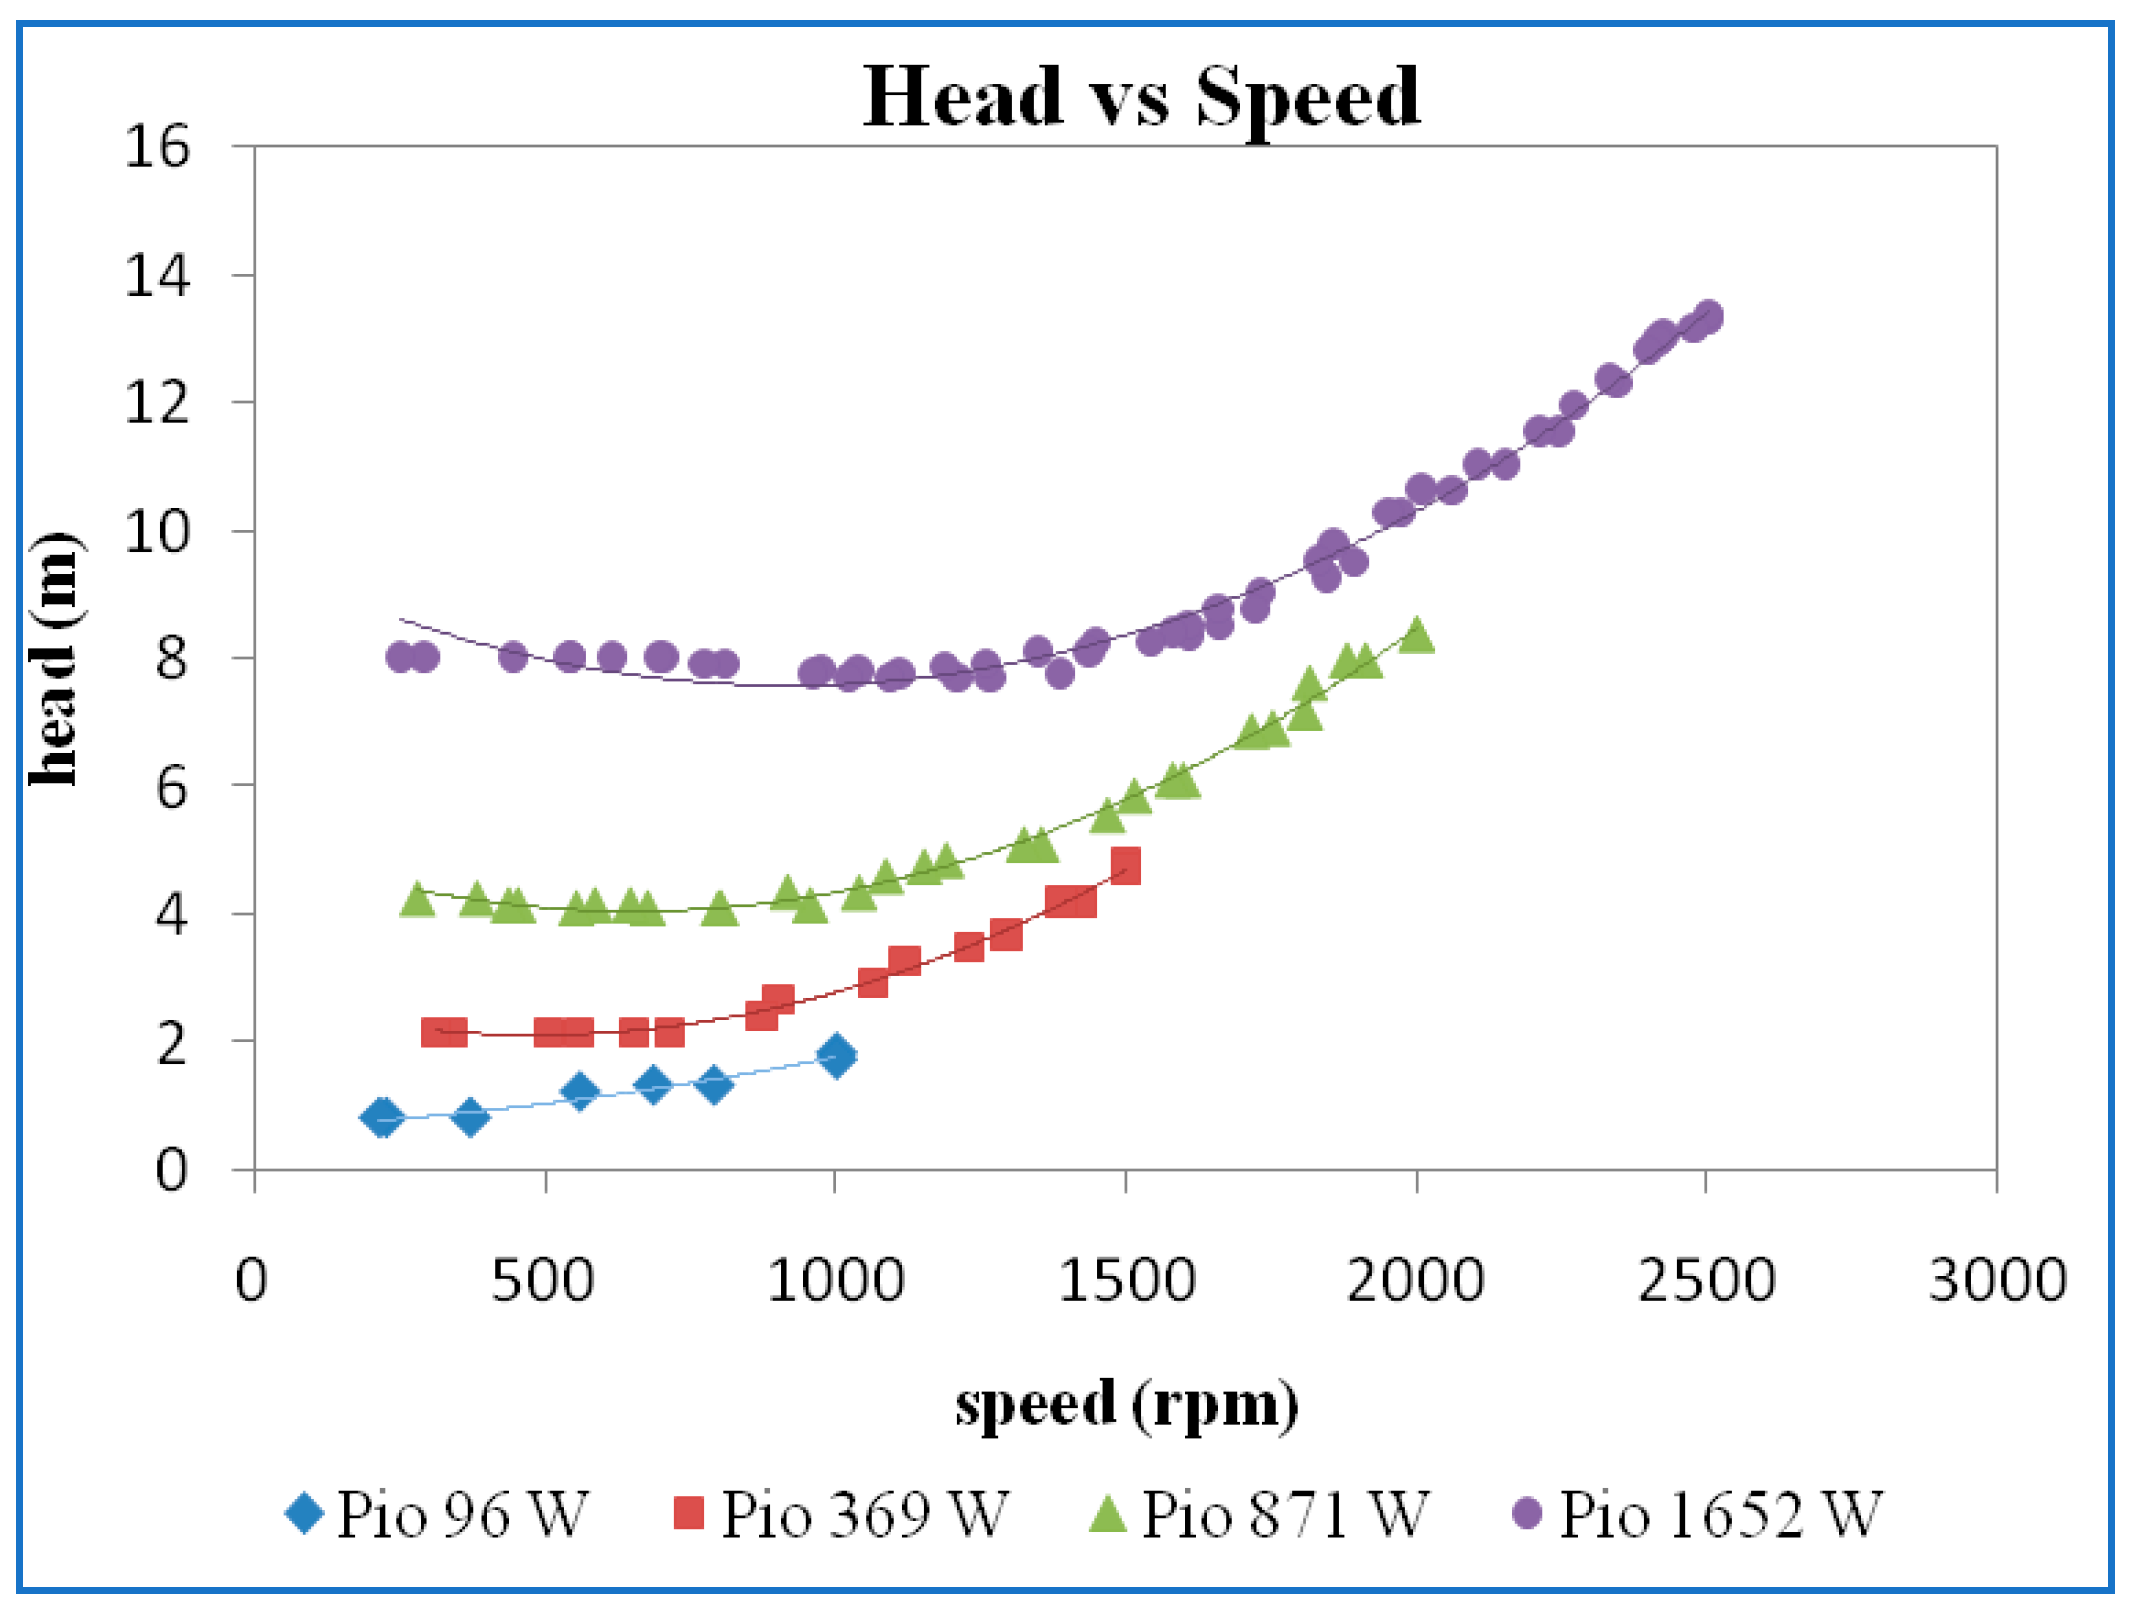
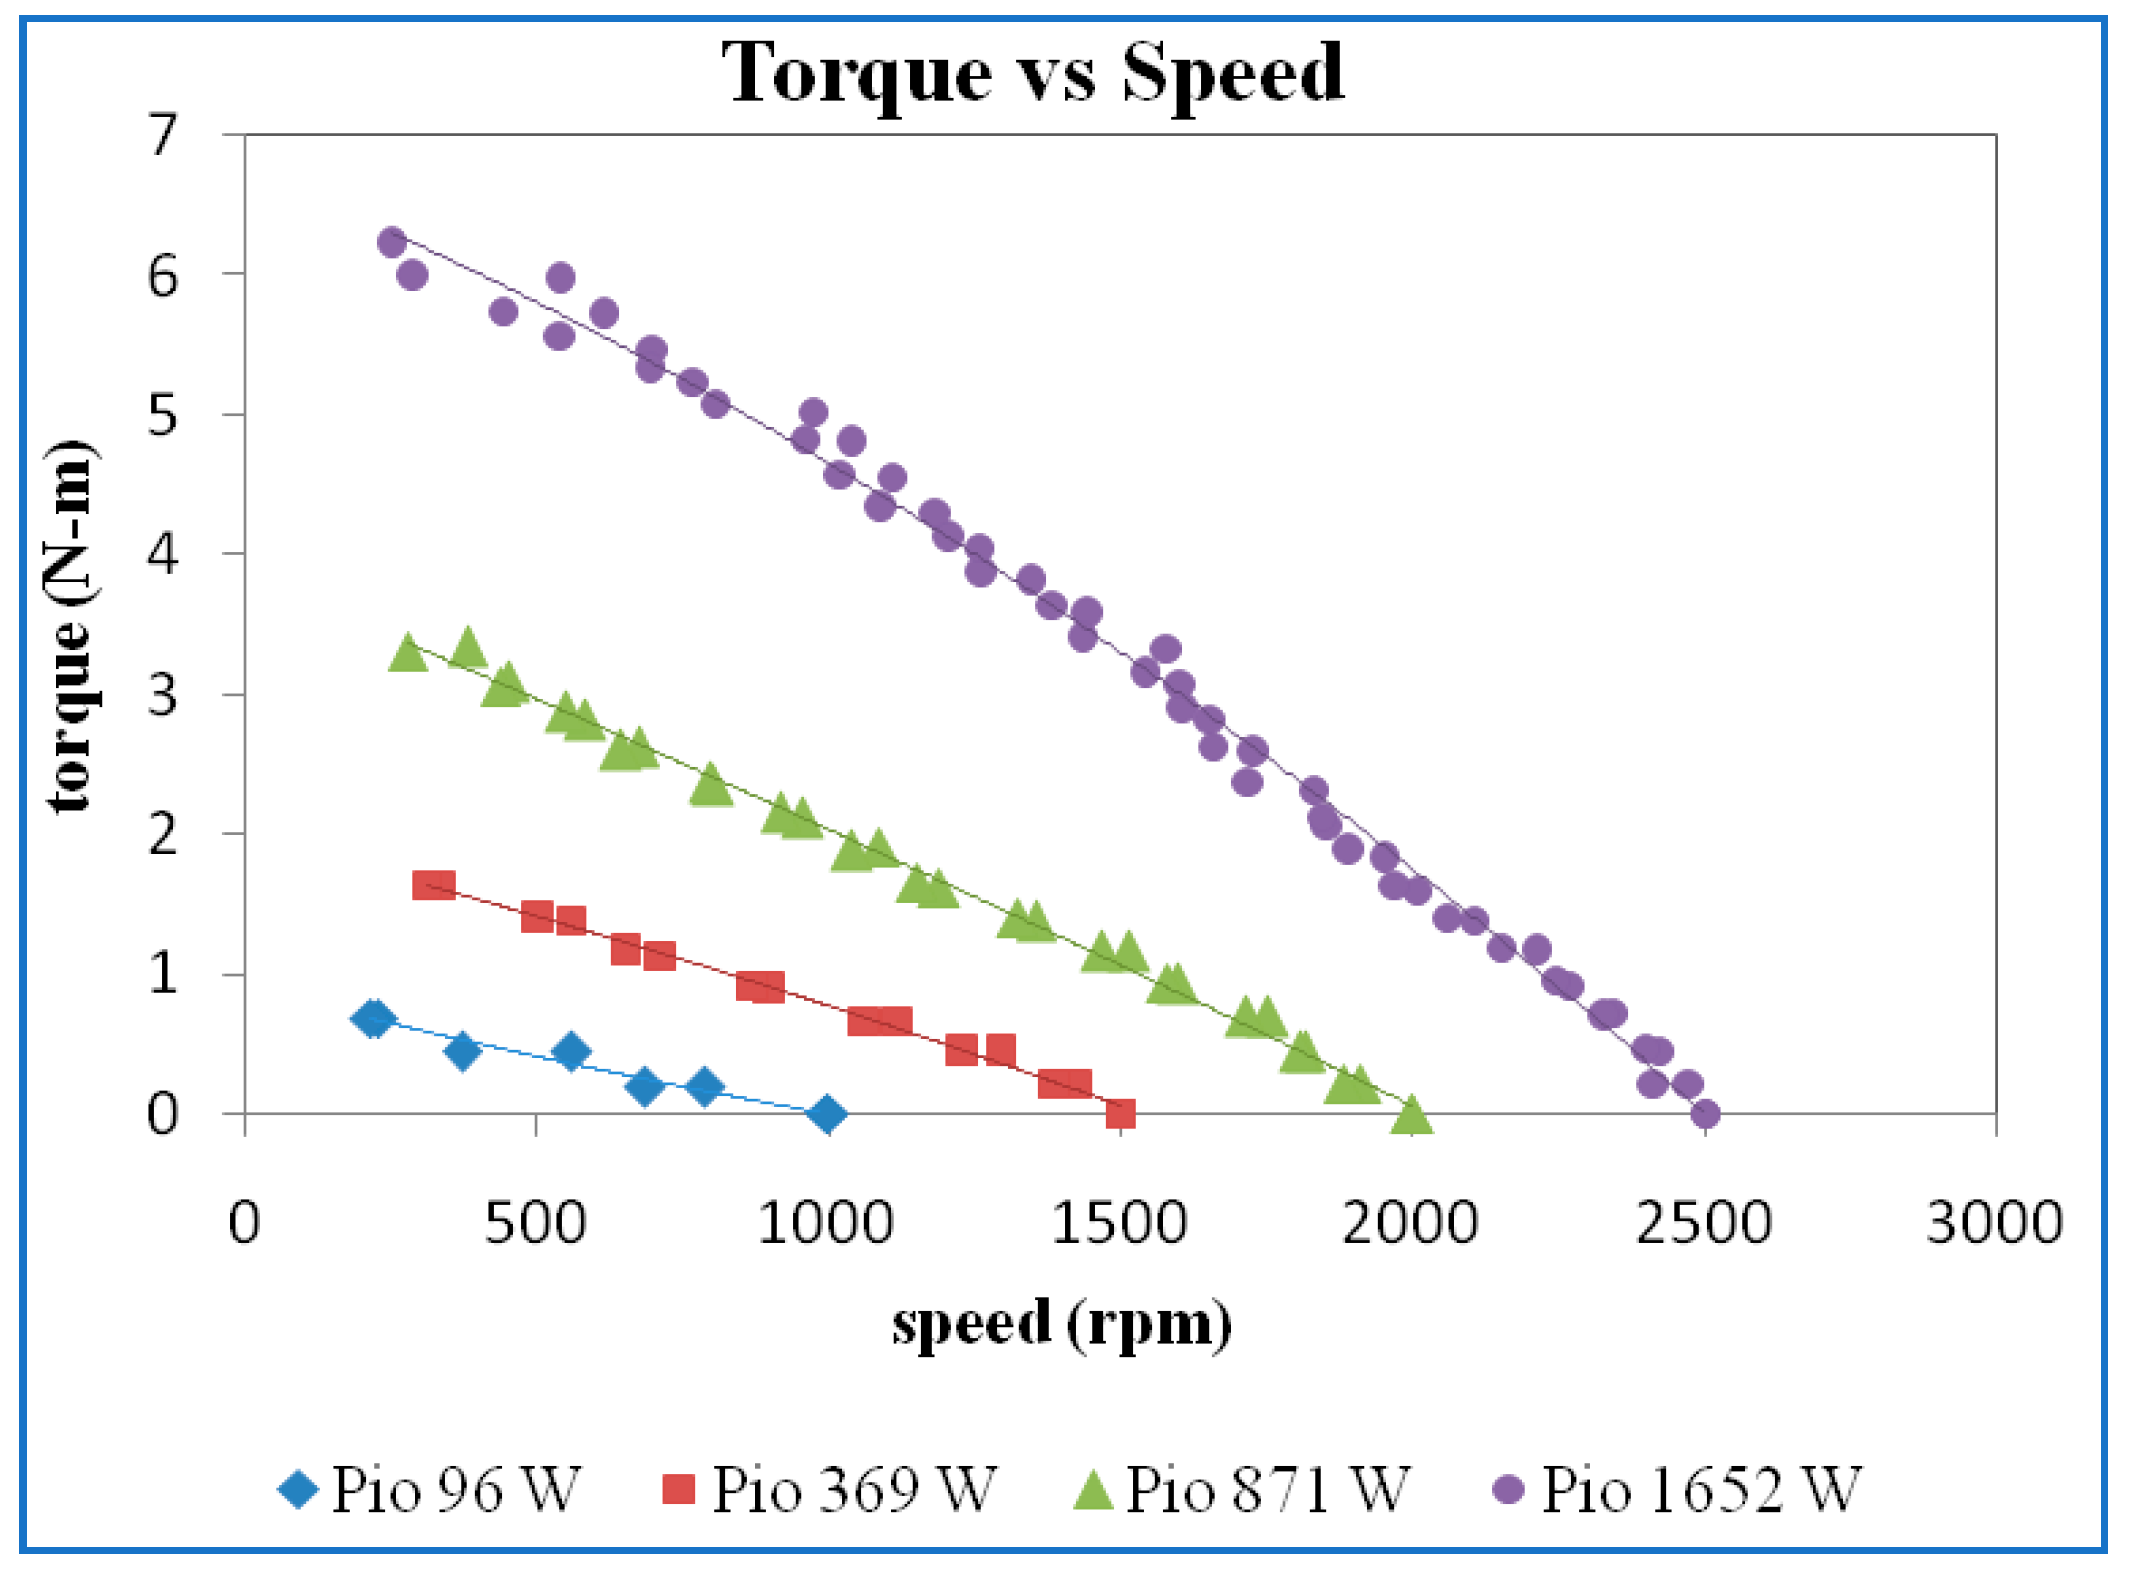
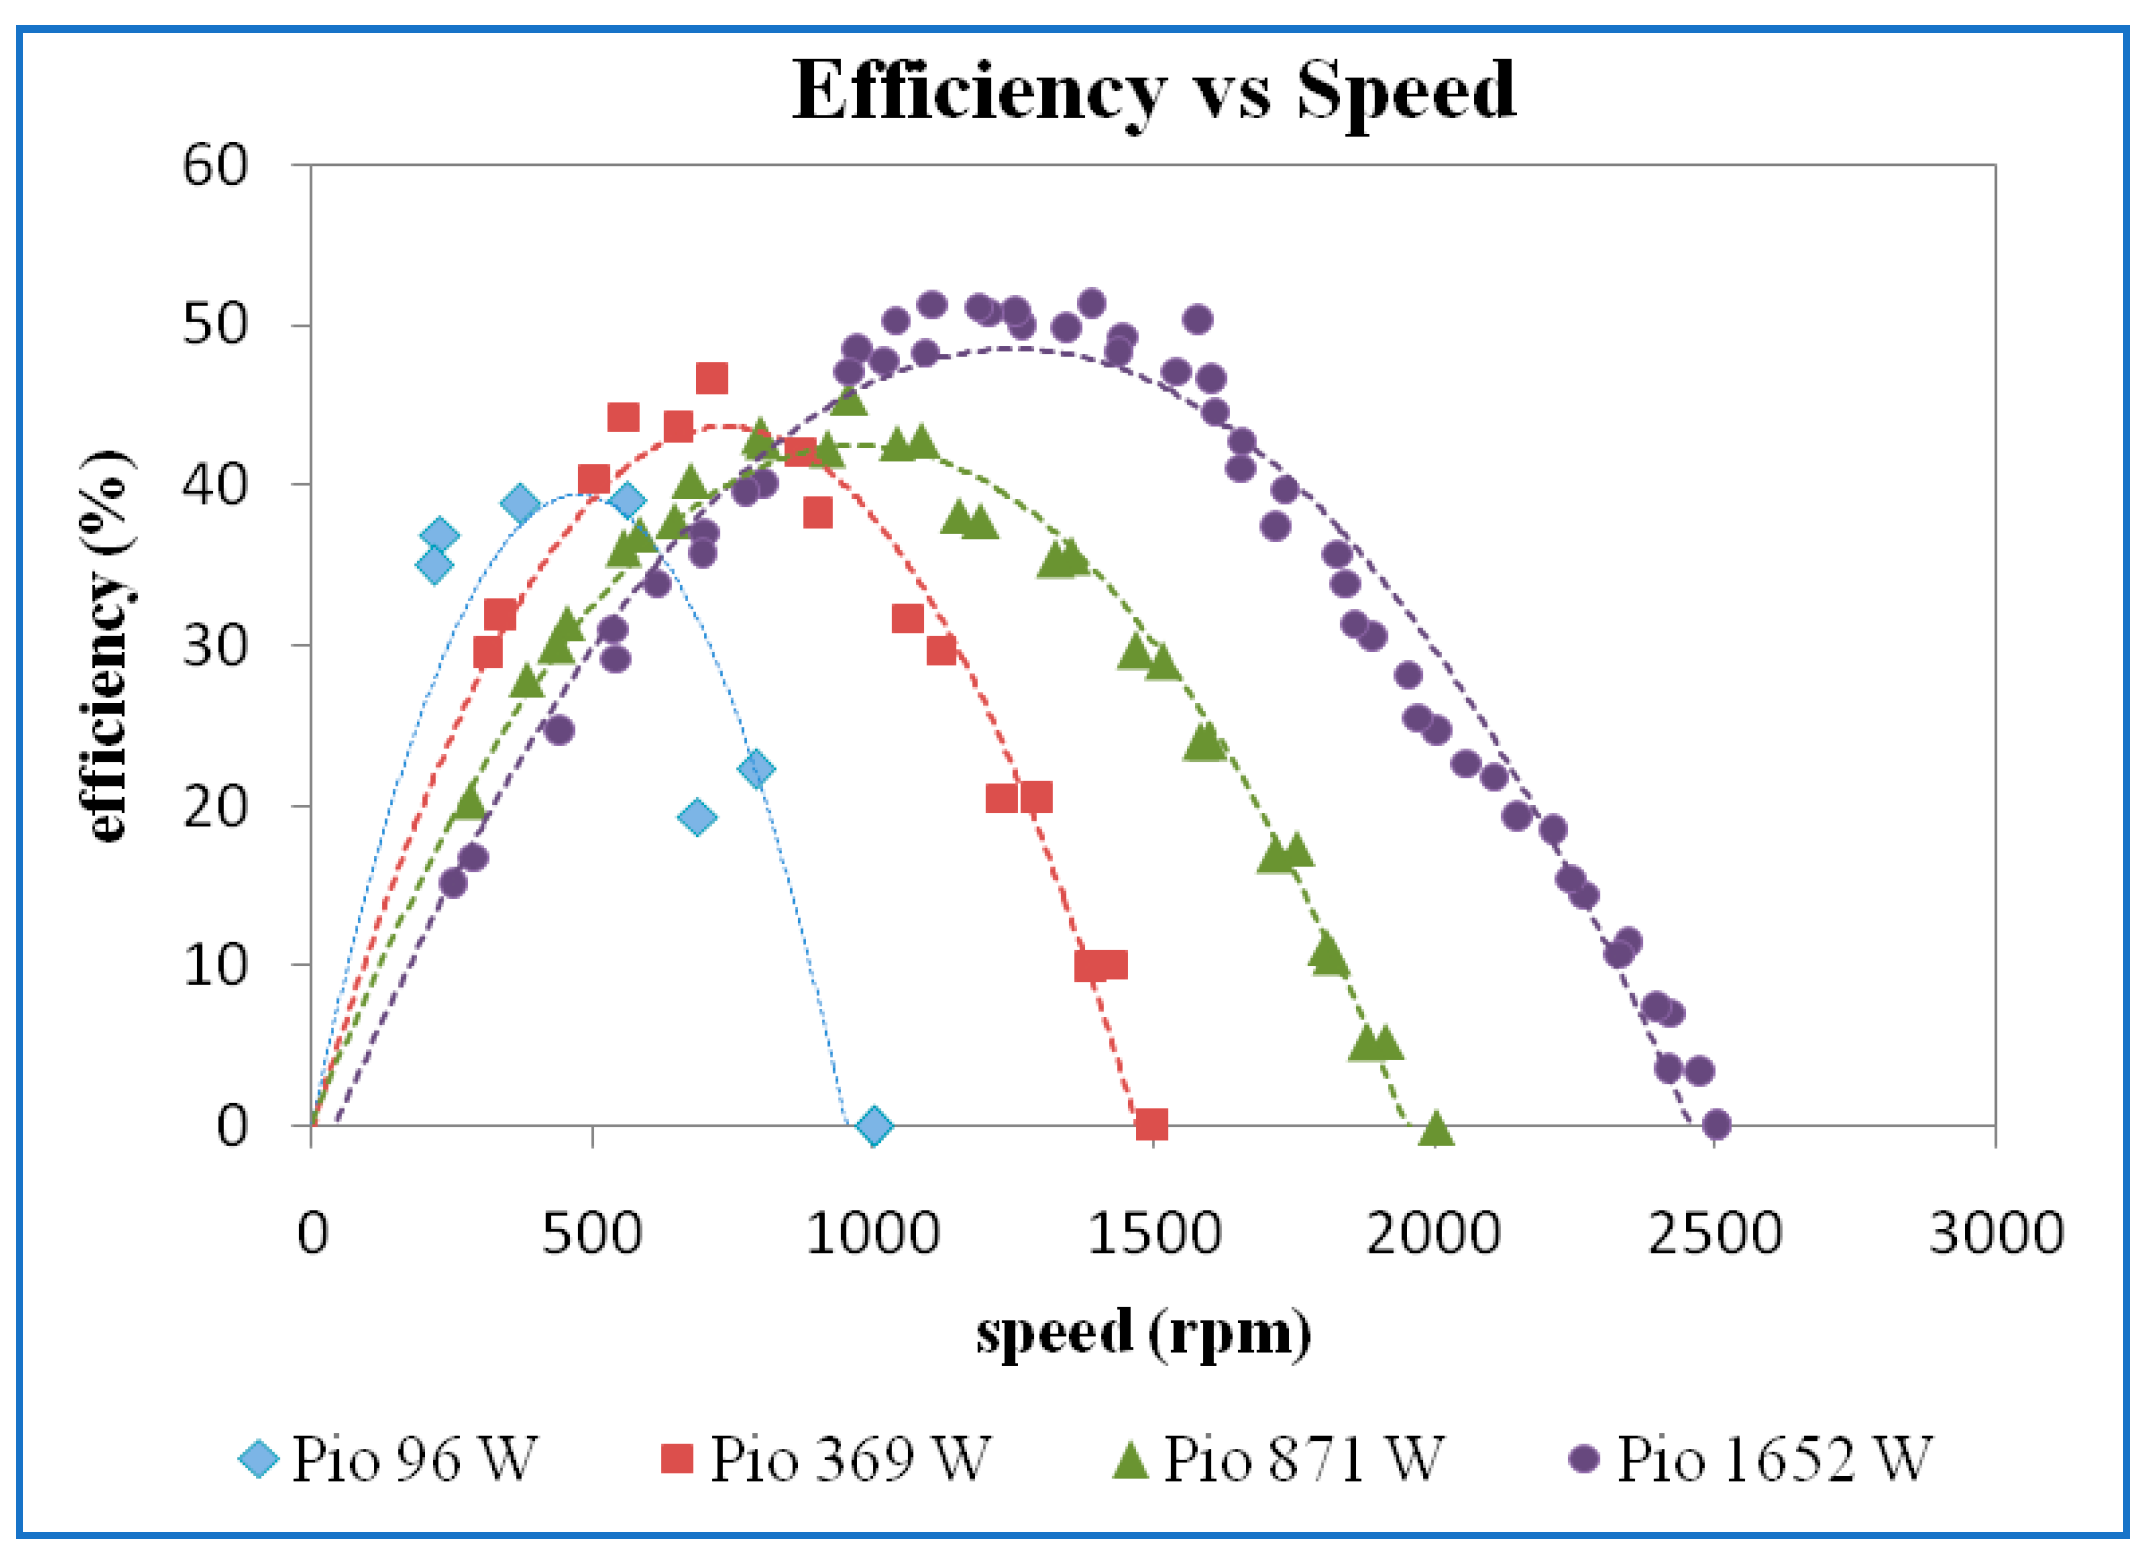
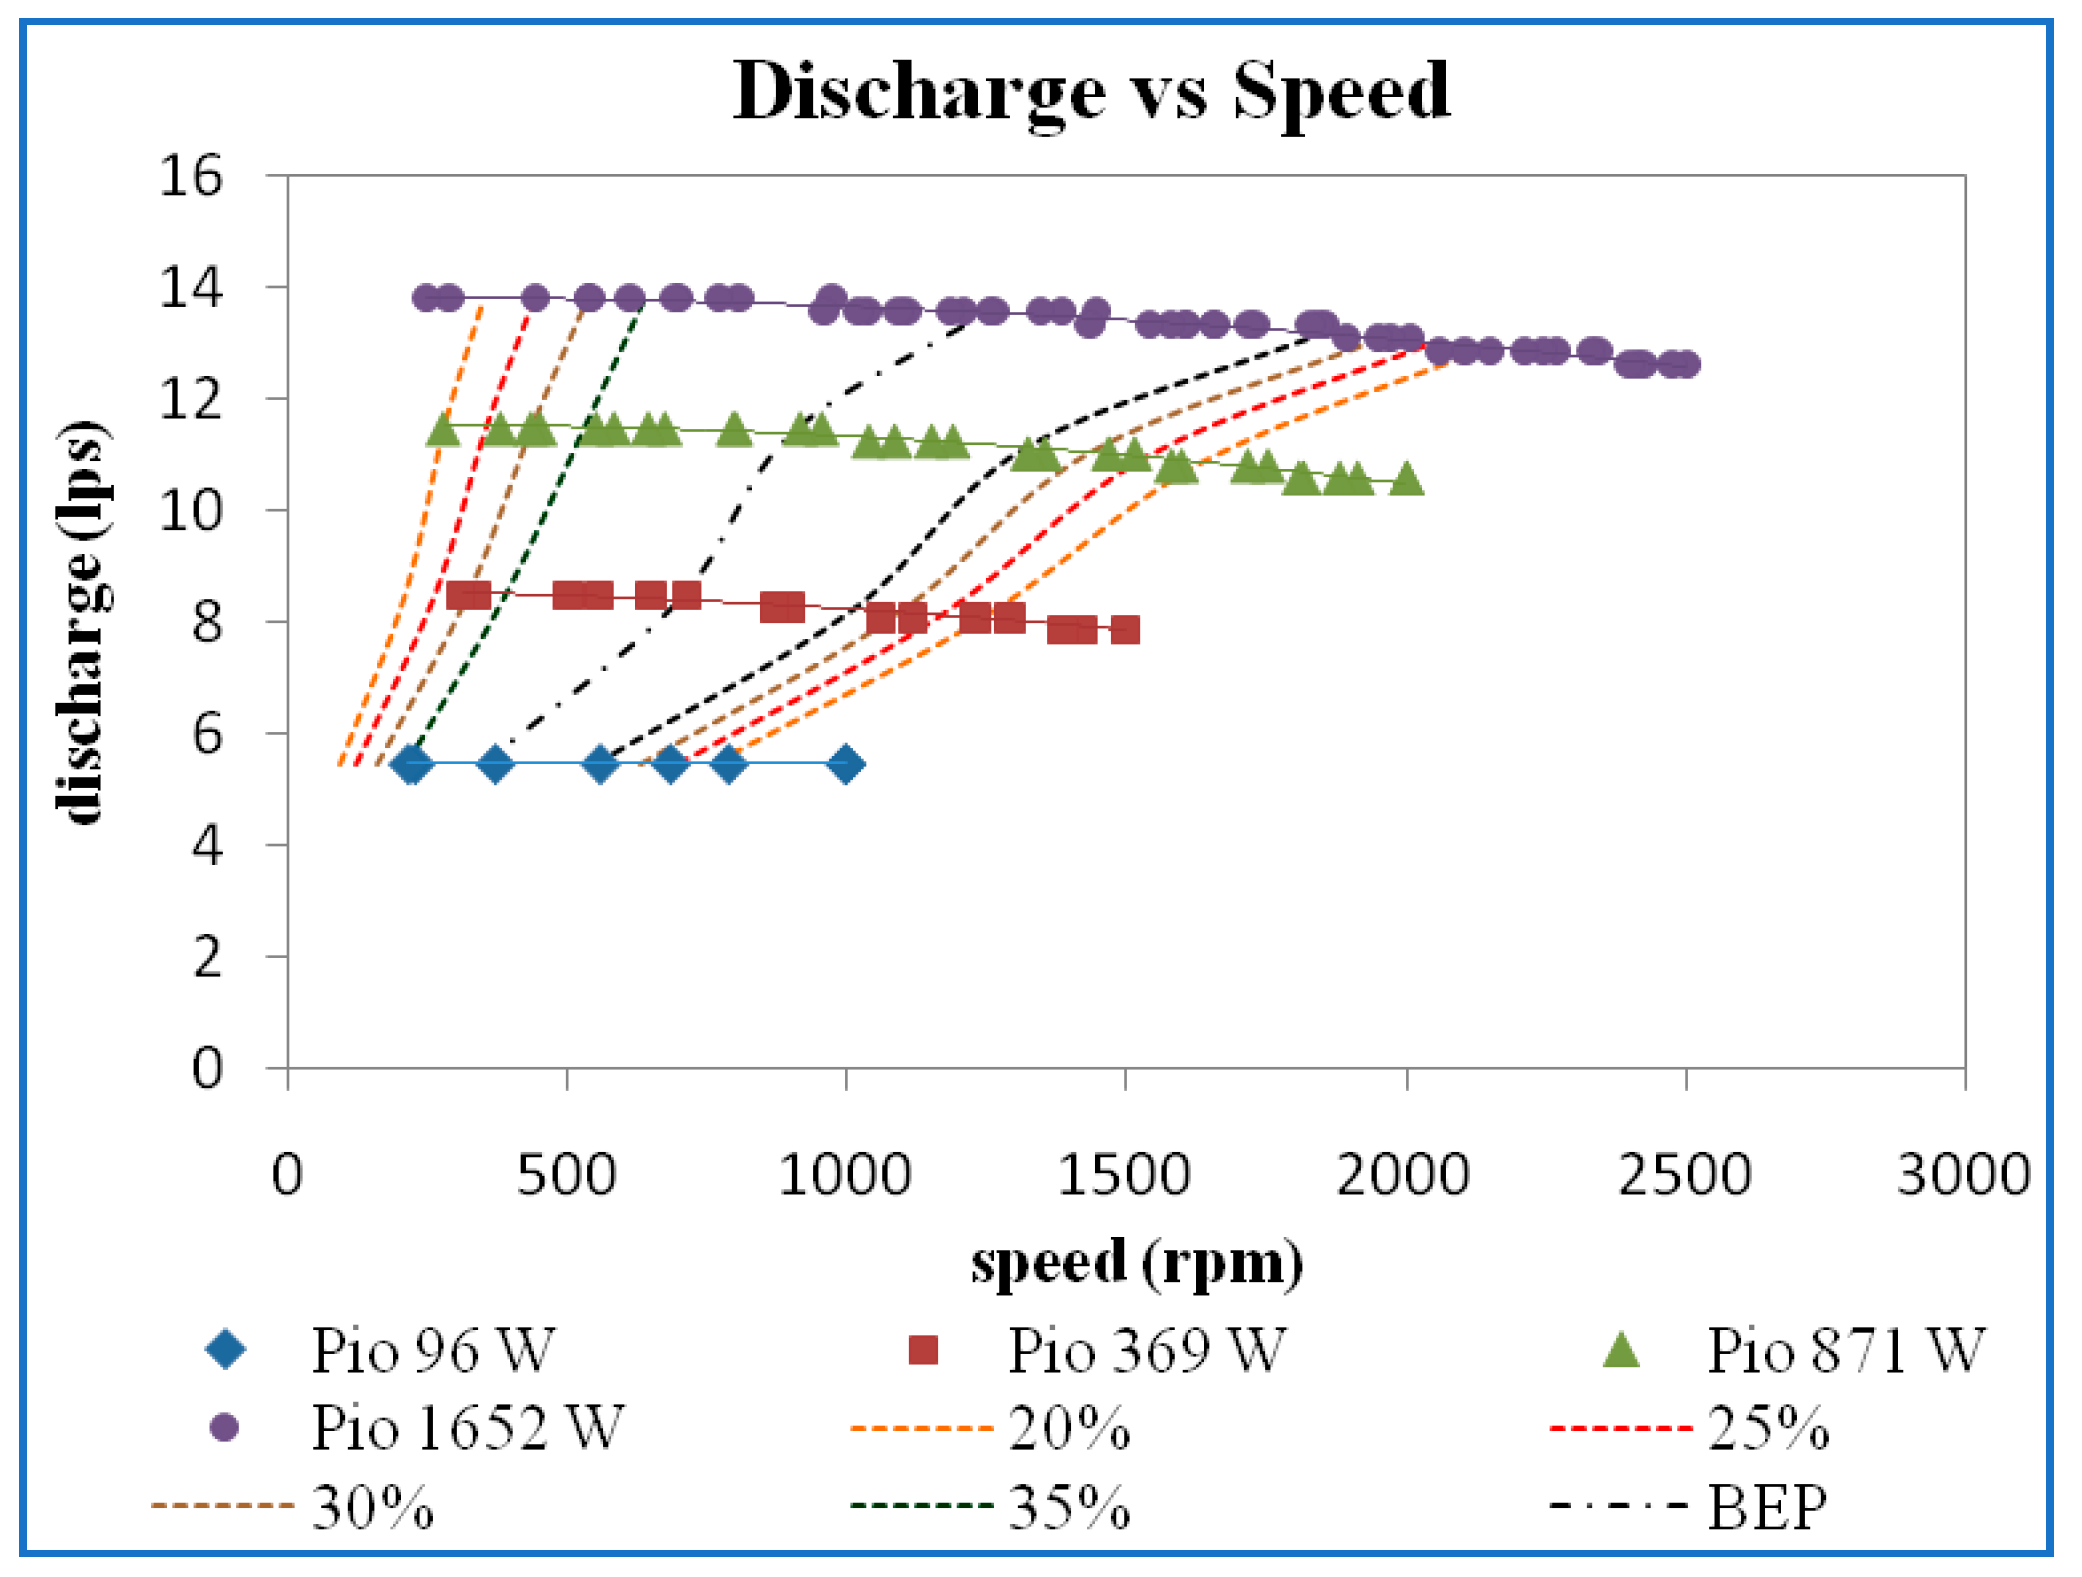
3.1. Performance Characteristics of Francis Turbine

The performance characteristics of discharge versus speed, head versus speed, torque versus speed, and efficiency versus speed for 10 mm guide vane opening are shown in Figure 4, Figure 5, Figure 6, Figure 7, Figure 8, Figure 9, Figure 10 and Figure 11. At lower input power, few points could be obtained. The turbine came to a halt at higher loads, but starting the turbine at higher power enables taking a large number of readings. The discharge appears to be less at high speeds compared to low speeds; this may be because the machine is vibrating and fluctuating while it is functioning.
Figure 5 shows the plot of the variation of the head concerning the speed for different power inputs. The head increases with an increase in the power inputs. The head is almost constant at lower speeds and then increases with speed. There is a slight increase in the head curves even during the lower speeds for the power input of 2049 (W). In this plot also, it may be observed that the repeatability of the readings is good.
A study of Figure 6 showing the plot of torque versus speed shows that at no load conditions, the speed of the turbine is about 2500 rpm for the power input of 2049 (W). This is the maximum speed that was achieved for the highest possible power input. The speed at no load came down to 2000 rpm, 1500 rpm, and 1000 rpm, respectively, as the input power was decreased. In fact, during the experiments, the input valve that changes the power input to the turbine was fixed based on the speed in the no-load condition. When a load is applied, the torque rises, increasing the frictional forces acting between the brake drum and the belt. This causes heat to be released, reducing speed. The repeatability of the readings can also be seen in the two sets plotted in Figure 6.
Efficiency versus speed for different power inputs is shown in Figure 7. It may be seen that higher maximum efficiency was obtained for higher inputs and efficiency increased to a maximum then decreased as speed increased. This is because the output power is contributed by the torque and speed. The speed decreases with increases in torque; thereby, the overall output power increases, reaches a maximum, and then decreases. One can argue that the effect of input power may also contribute to the variation in efficiency. This is true, but only at higher speeds. The discharge and the head were almost constant at lower speeds, so the variation of input power becomes insignificant. That is the reason that the efficiency curves show the increasing and decreasing trend.
The two sets of points in Figure 4, Figure 5, Figure 6 and Figure 7 indicate clearly that the results are repeatable and hence they were considered together and a single curve fitted for every value of input power.
Figure 8 shows the plot of the variation of the head concerning the speed for different power inputs. Trial 1 and trial 2 were combined and plotted as a single curve. It can be seen that head decreases with a decrease in the power inputs.
Figure 9 shows that when the load is applied, the torque increases the frictional forces acting between the brake drum and the belt increase and dissipate the energy in the form of heat; therefore, the speed comes down. The torque is increased by decreasing the speed.
The efficiency versus speed for different power inputs is shown in Figure 10. The higher maximum efficiency was obtained for higher input power. However, there is only a slight variation of maximum efficiency at 445 W, 1031 W, and 2049 W input power.
The iso-efficiency lines plotted on discharge versus speed curves are shown in Figure 11. From the efficiency curves, horizontal lines corresponding to efficiencies of 20%, 25%, 30%, 35%, and best efficiency point (BEP) were drawn and the speed and the discharge corresponding to the point where the efficiency curves intersect the horizontal iso-efficiency lines were noted and plotted, as shown in the above figure. It may be noted that the value of discharge and speed at maximum efficiency is 32%, 36%, 37%, and 38% at input power of 77 W, 243 W, 647 W, and 1414 W for guide vane opening of 10 mm.
The head versus speed curve shown in Figure 12 was obtained at a guide vane opening of 13 mm. The head is decreasing with decreasing the speed. When input power is more, the head seems to be more.
From Figure 13, it may be seen that as speed decreases, the torque starts to increase when the load is applied to the brake drum. There is not much variation in these curves between guide vane openings of 13 mm and 10 mm, as seen in Figure 13 and Figure 9.
The maximum efficiency was observed at a power input of 953 W for a guide vane opening of 13 mm, as seen in Figure 14. At input power of 123 W, 456 W, and 953 W the maximum efficiency increases gradually, but at power input 2089 W it is decreased slightly due to the vibration, which leads to cavitations within the turbine.
Figure 15 shows that the discharge is more or less constant at different input power. The iso-efficiency plot seems not much different between the guide vane openings of 10 mm and 13 mm. The values at best efficiency points are 33%, 37%, 40%, and 39%.
The plot of the variation between the head and speed for different power input at 16 mm GVO is shown in Figure 16. The head decreases with decreasing power input. A notable variation may be observed at higher speeds.
From Figure 17, it may be concluded that at a GVO of 16 mm, when the torque increases the speed starts decreasing when the load is applied on the brake drum. There is not much variation from guide vane openings of 16 mm, 13 mm, and 10 mm.
From Figure 18, it is observed that the maximum efficiency at 16 mm GVO was seen at a power input of 1784 W. The maximum efficiency decreases as input power is decreased. As there is an increase in guide vane opening, the efficiency improves compared to the low guide vane opening due to there being no impediment or vibration.
From Figure 19, it is seen that at 113 W power input, the discharge was constant. At other input power, the discharge was slightly decreased as speed increased at 16 mm GVO. The iso-efficiency lines plotted seem to be a straight line with different slopes. The discharge versus speed at BEP is 32%, 38%, 42%, and 46%.
Figure 20 shows the plot of the variation of head with respect to the speed for different power input at a GVO of 19 mm. The head increases with increase in the power input. There is a variation in the head curves at higher speed for all the four power inputs.
According to Figure 21, when the load is applied the torque increases the frictional forces acting between the brake drum and the belt increases and dissipates the energy in the form of heat, and thus the speed comes down. The torque is increased with increased input power. There is a large variation in torque at 1652 W power input compared to other lower input power.
From Figure 22, maximum efficiency is observed at 1652 W. Maximum efficiency observed at 871 W was higher compared to the 96 W and 369 W power inputs. Compared to all other guide vane openings, the 19 mm guide vane opening showed the best efficiency due to no obstruction and vibration compared to low guide vane openings. As per the standard of this turbine, it could not achieve more efficiency at 19 mm guide vane opening due to some of the drawbacks, such as leakages between the blades and the casing and vibrations of the turbine.
Discharge was found to be constant as speed was varied at different input powers, as shown in Figure 23 at a GVO of 19 mm. The iso-efficiency was plotted and seems not much different between guide vane openings of 10 mm, 13 mm, 16 mm and 19 mm. The bp values are 41%, 46%, 47% and 50%.

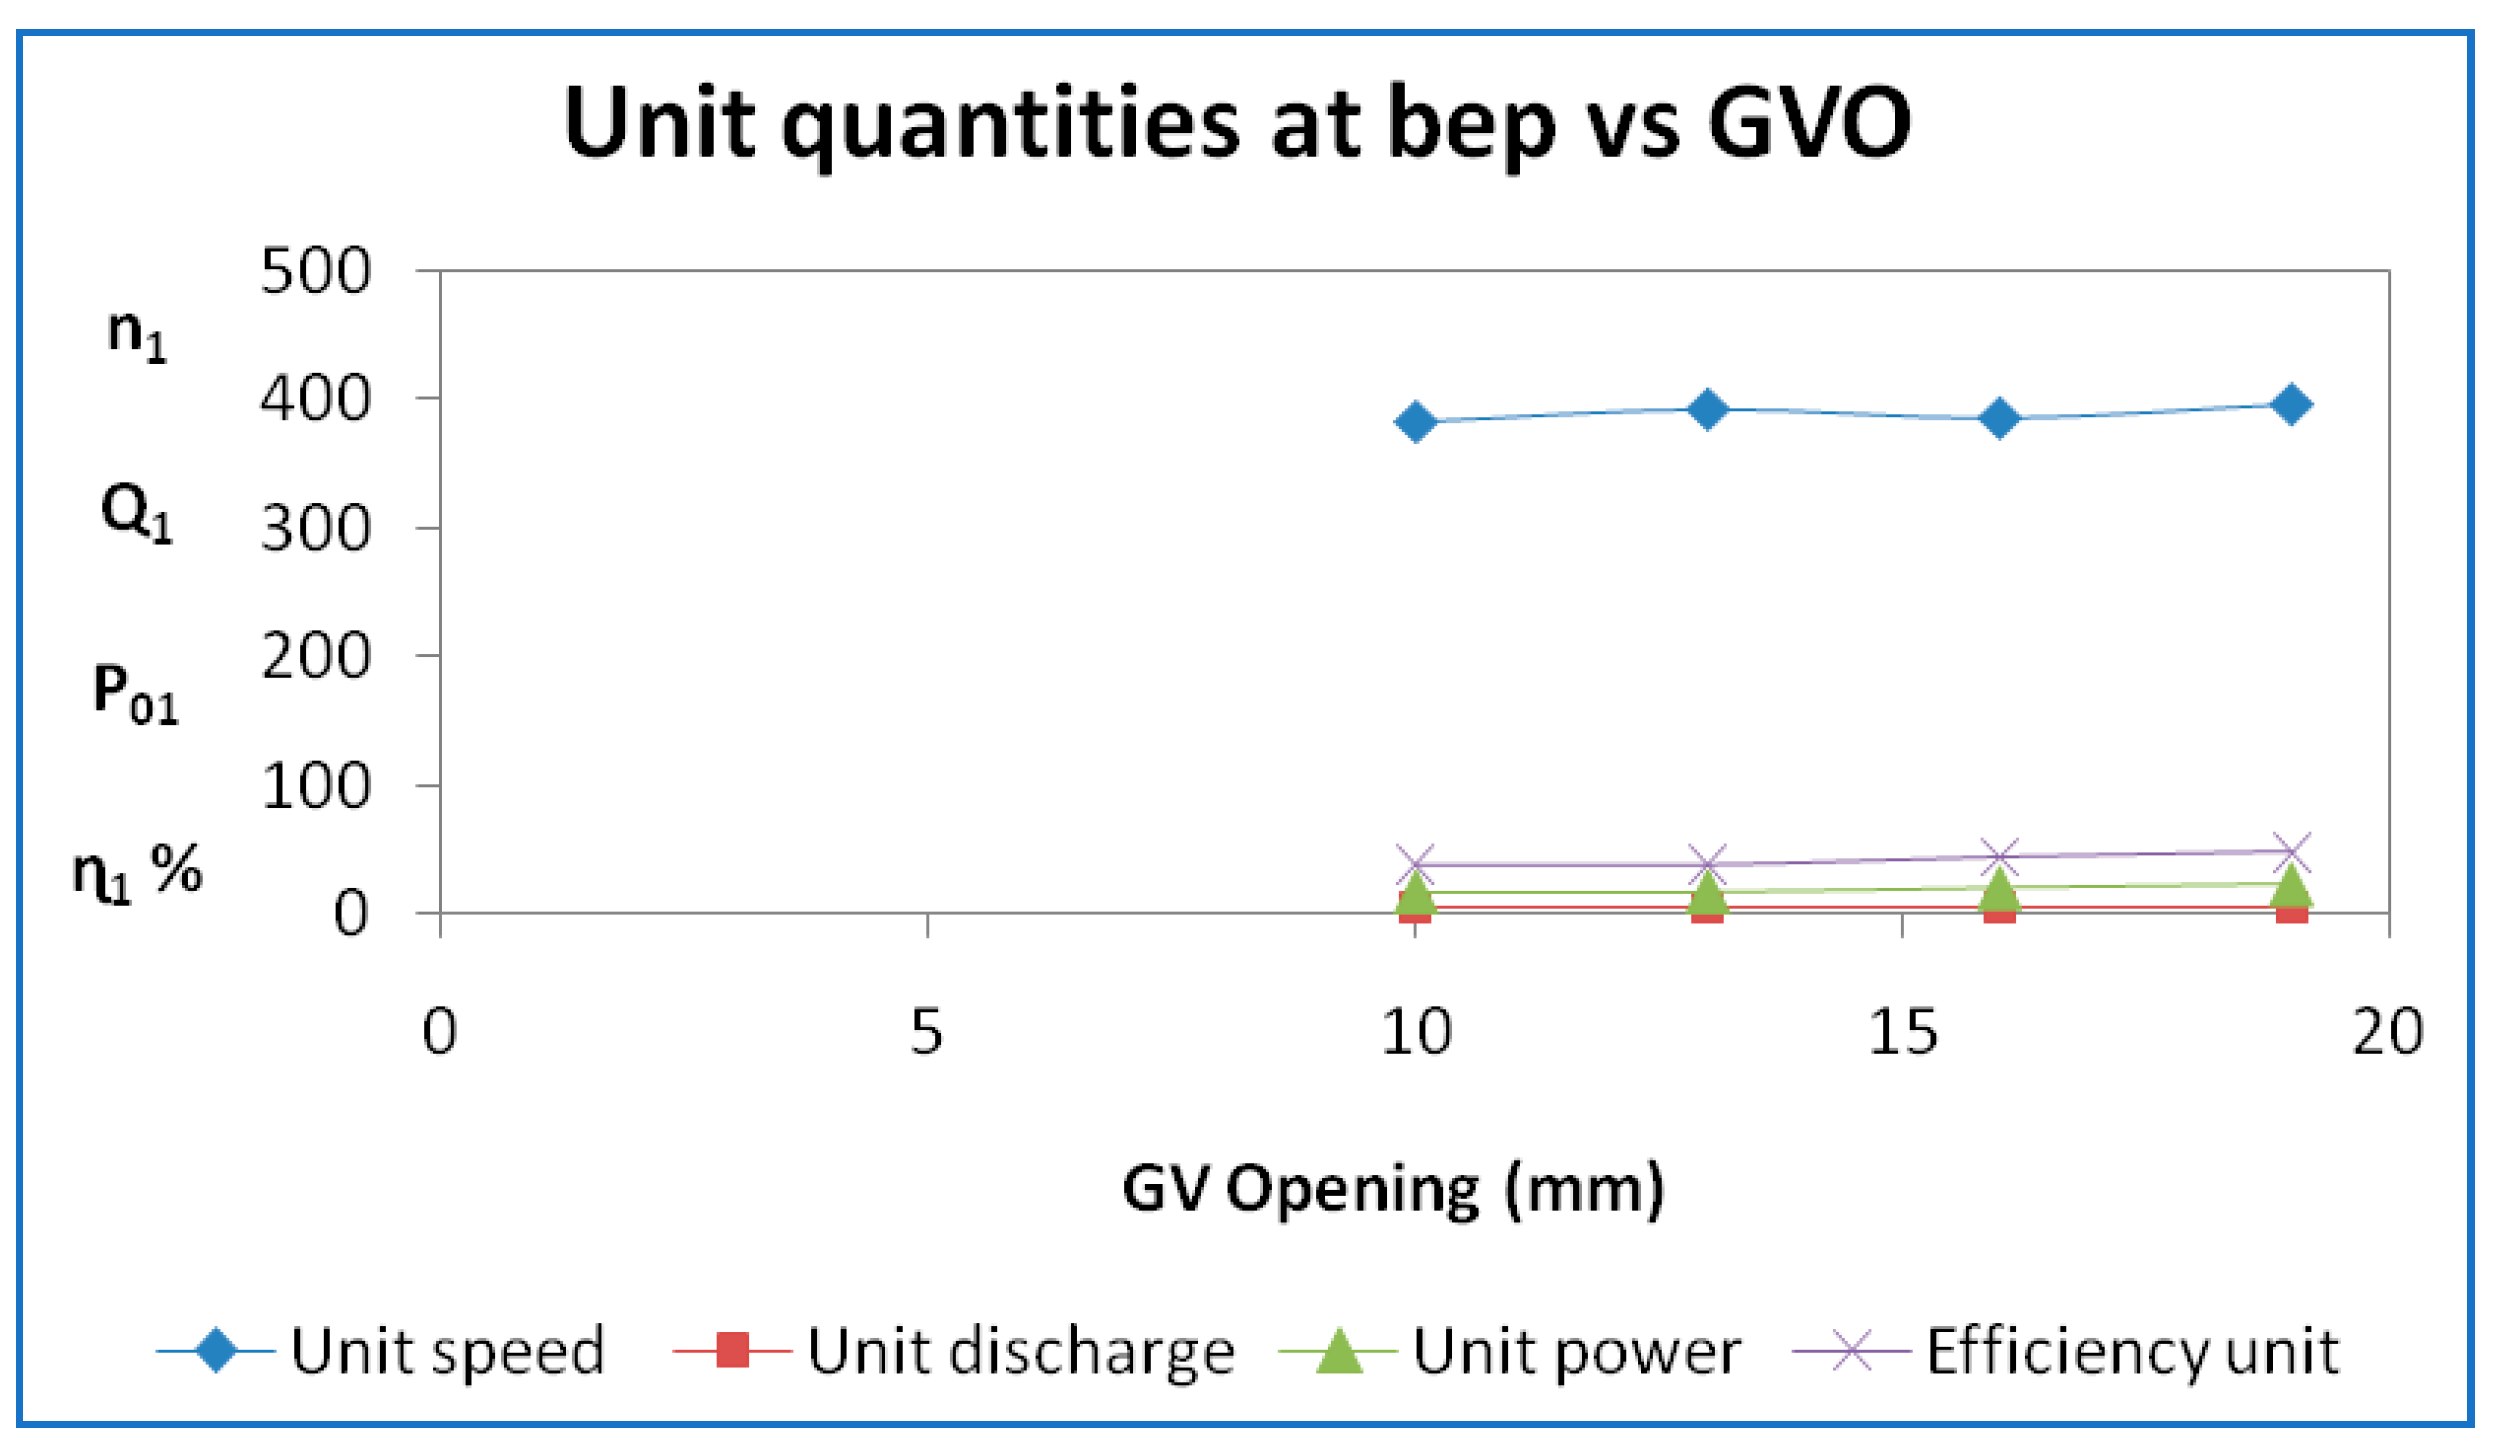
3.2. Best Efficiency Point Curves
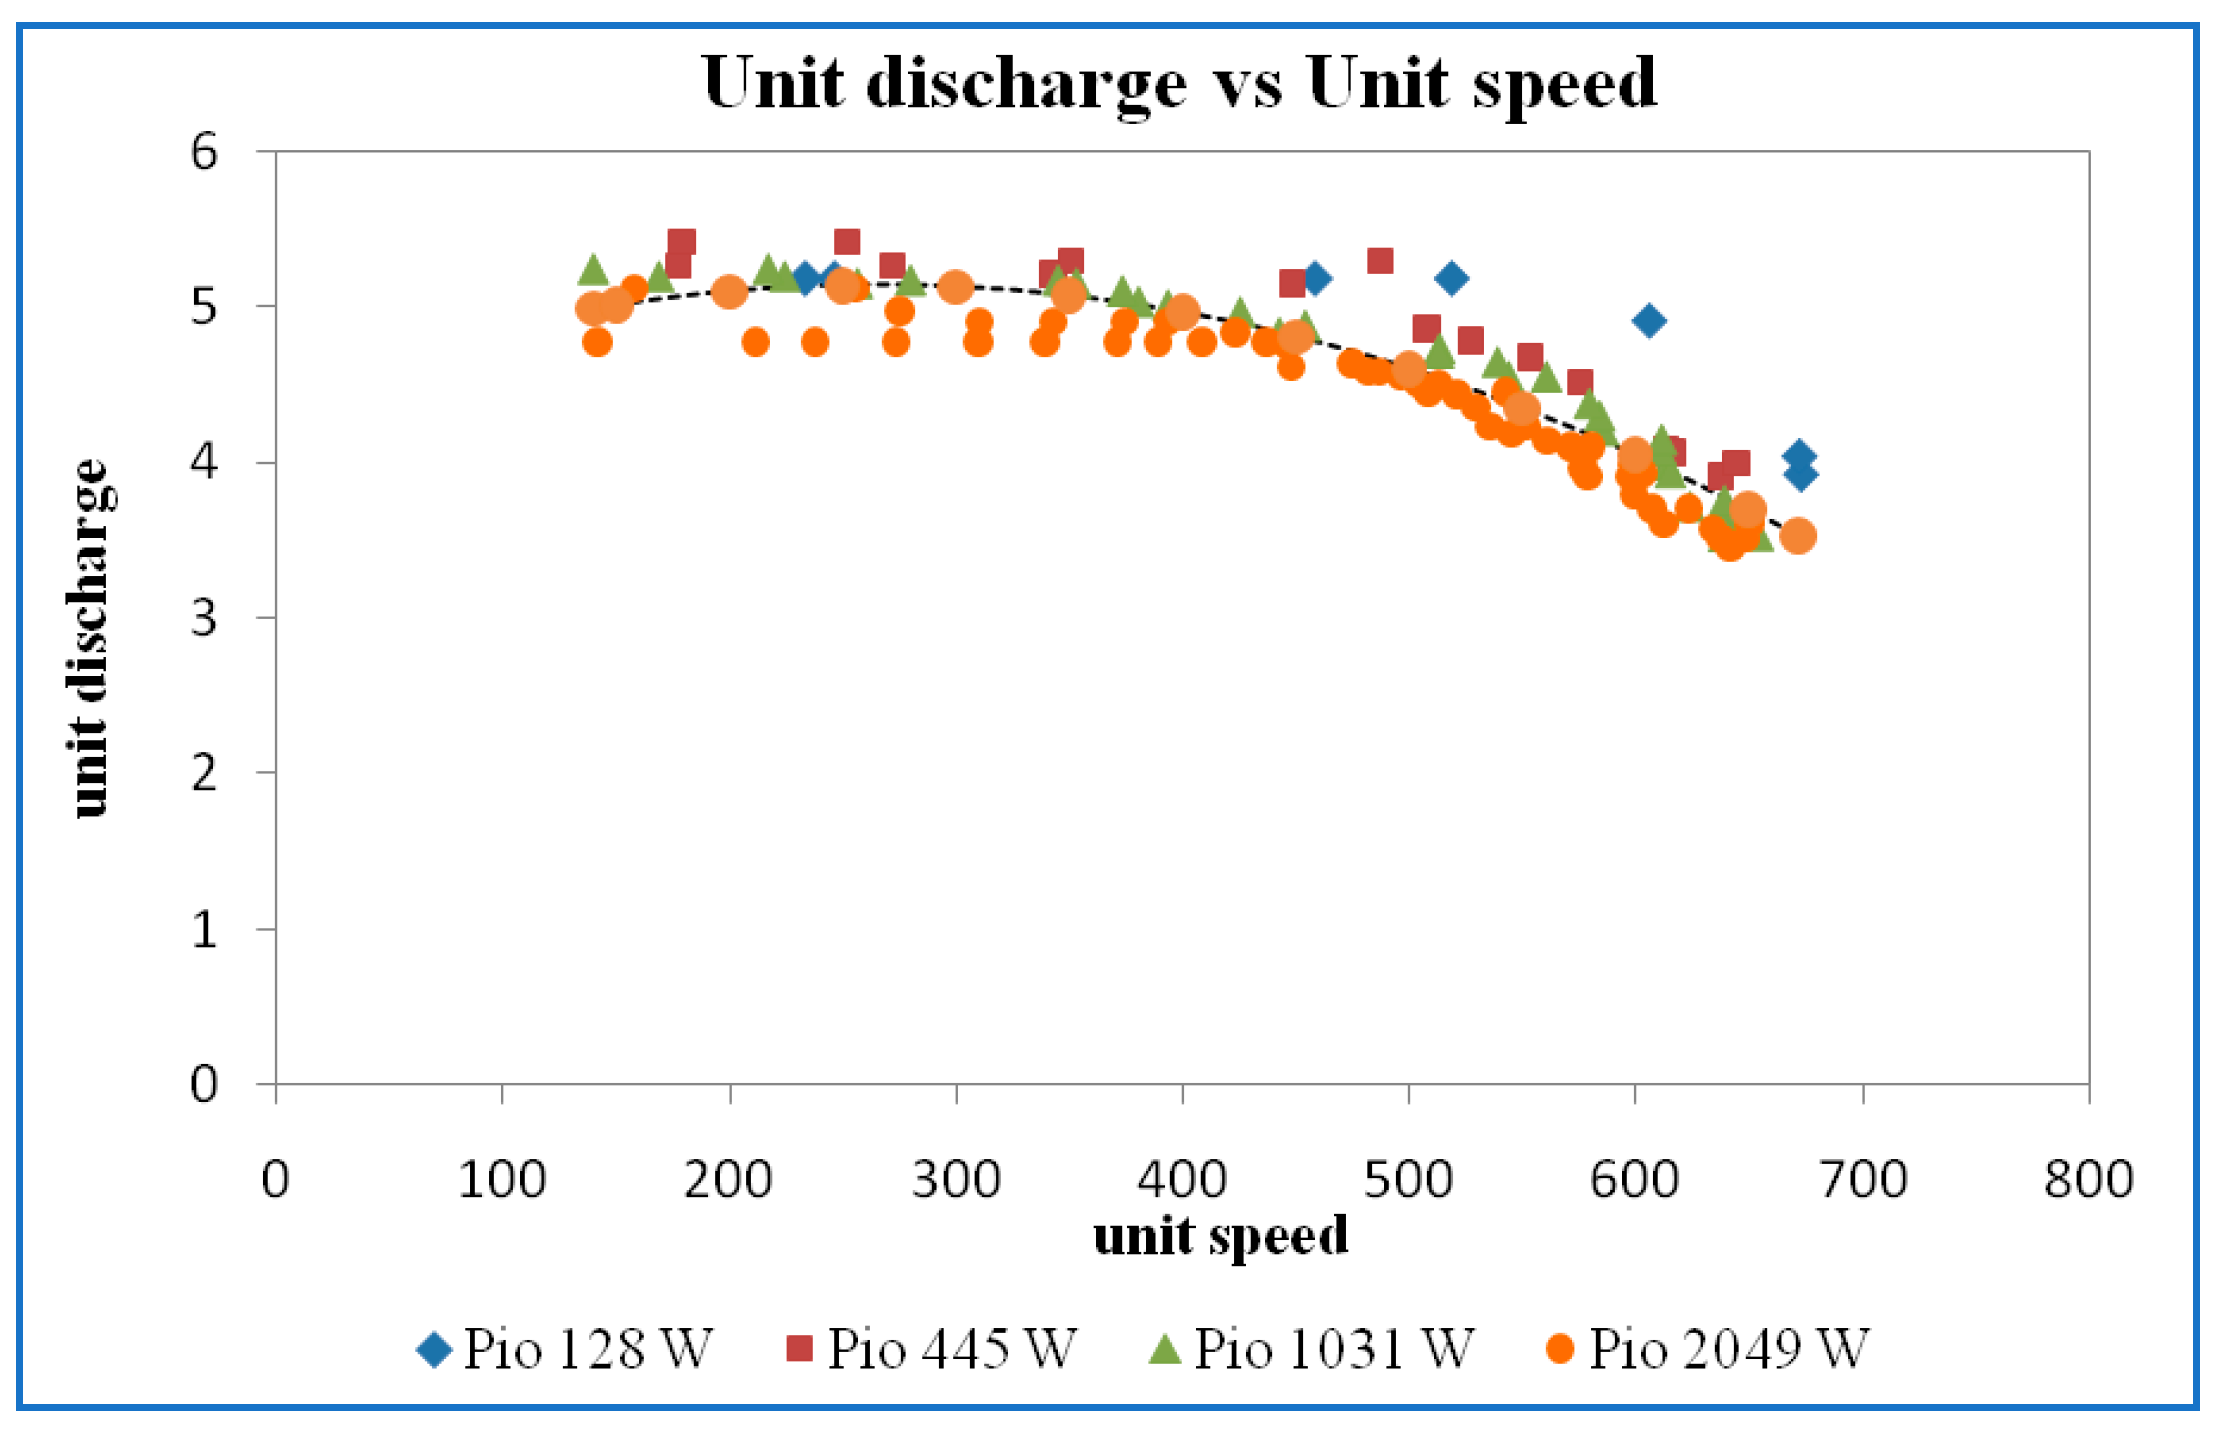
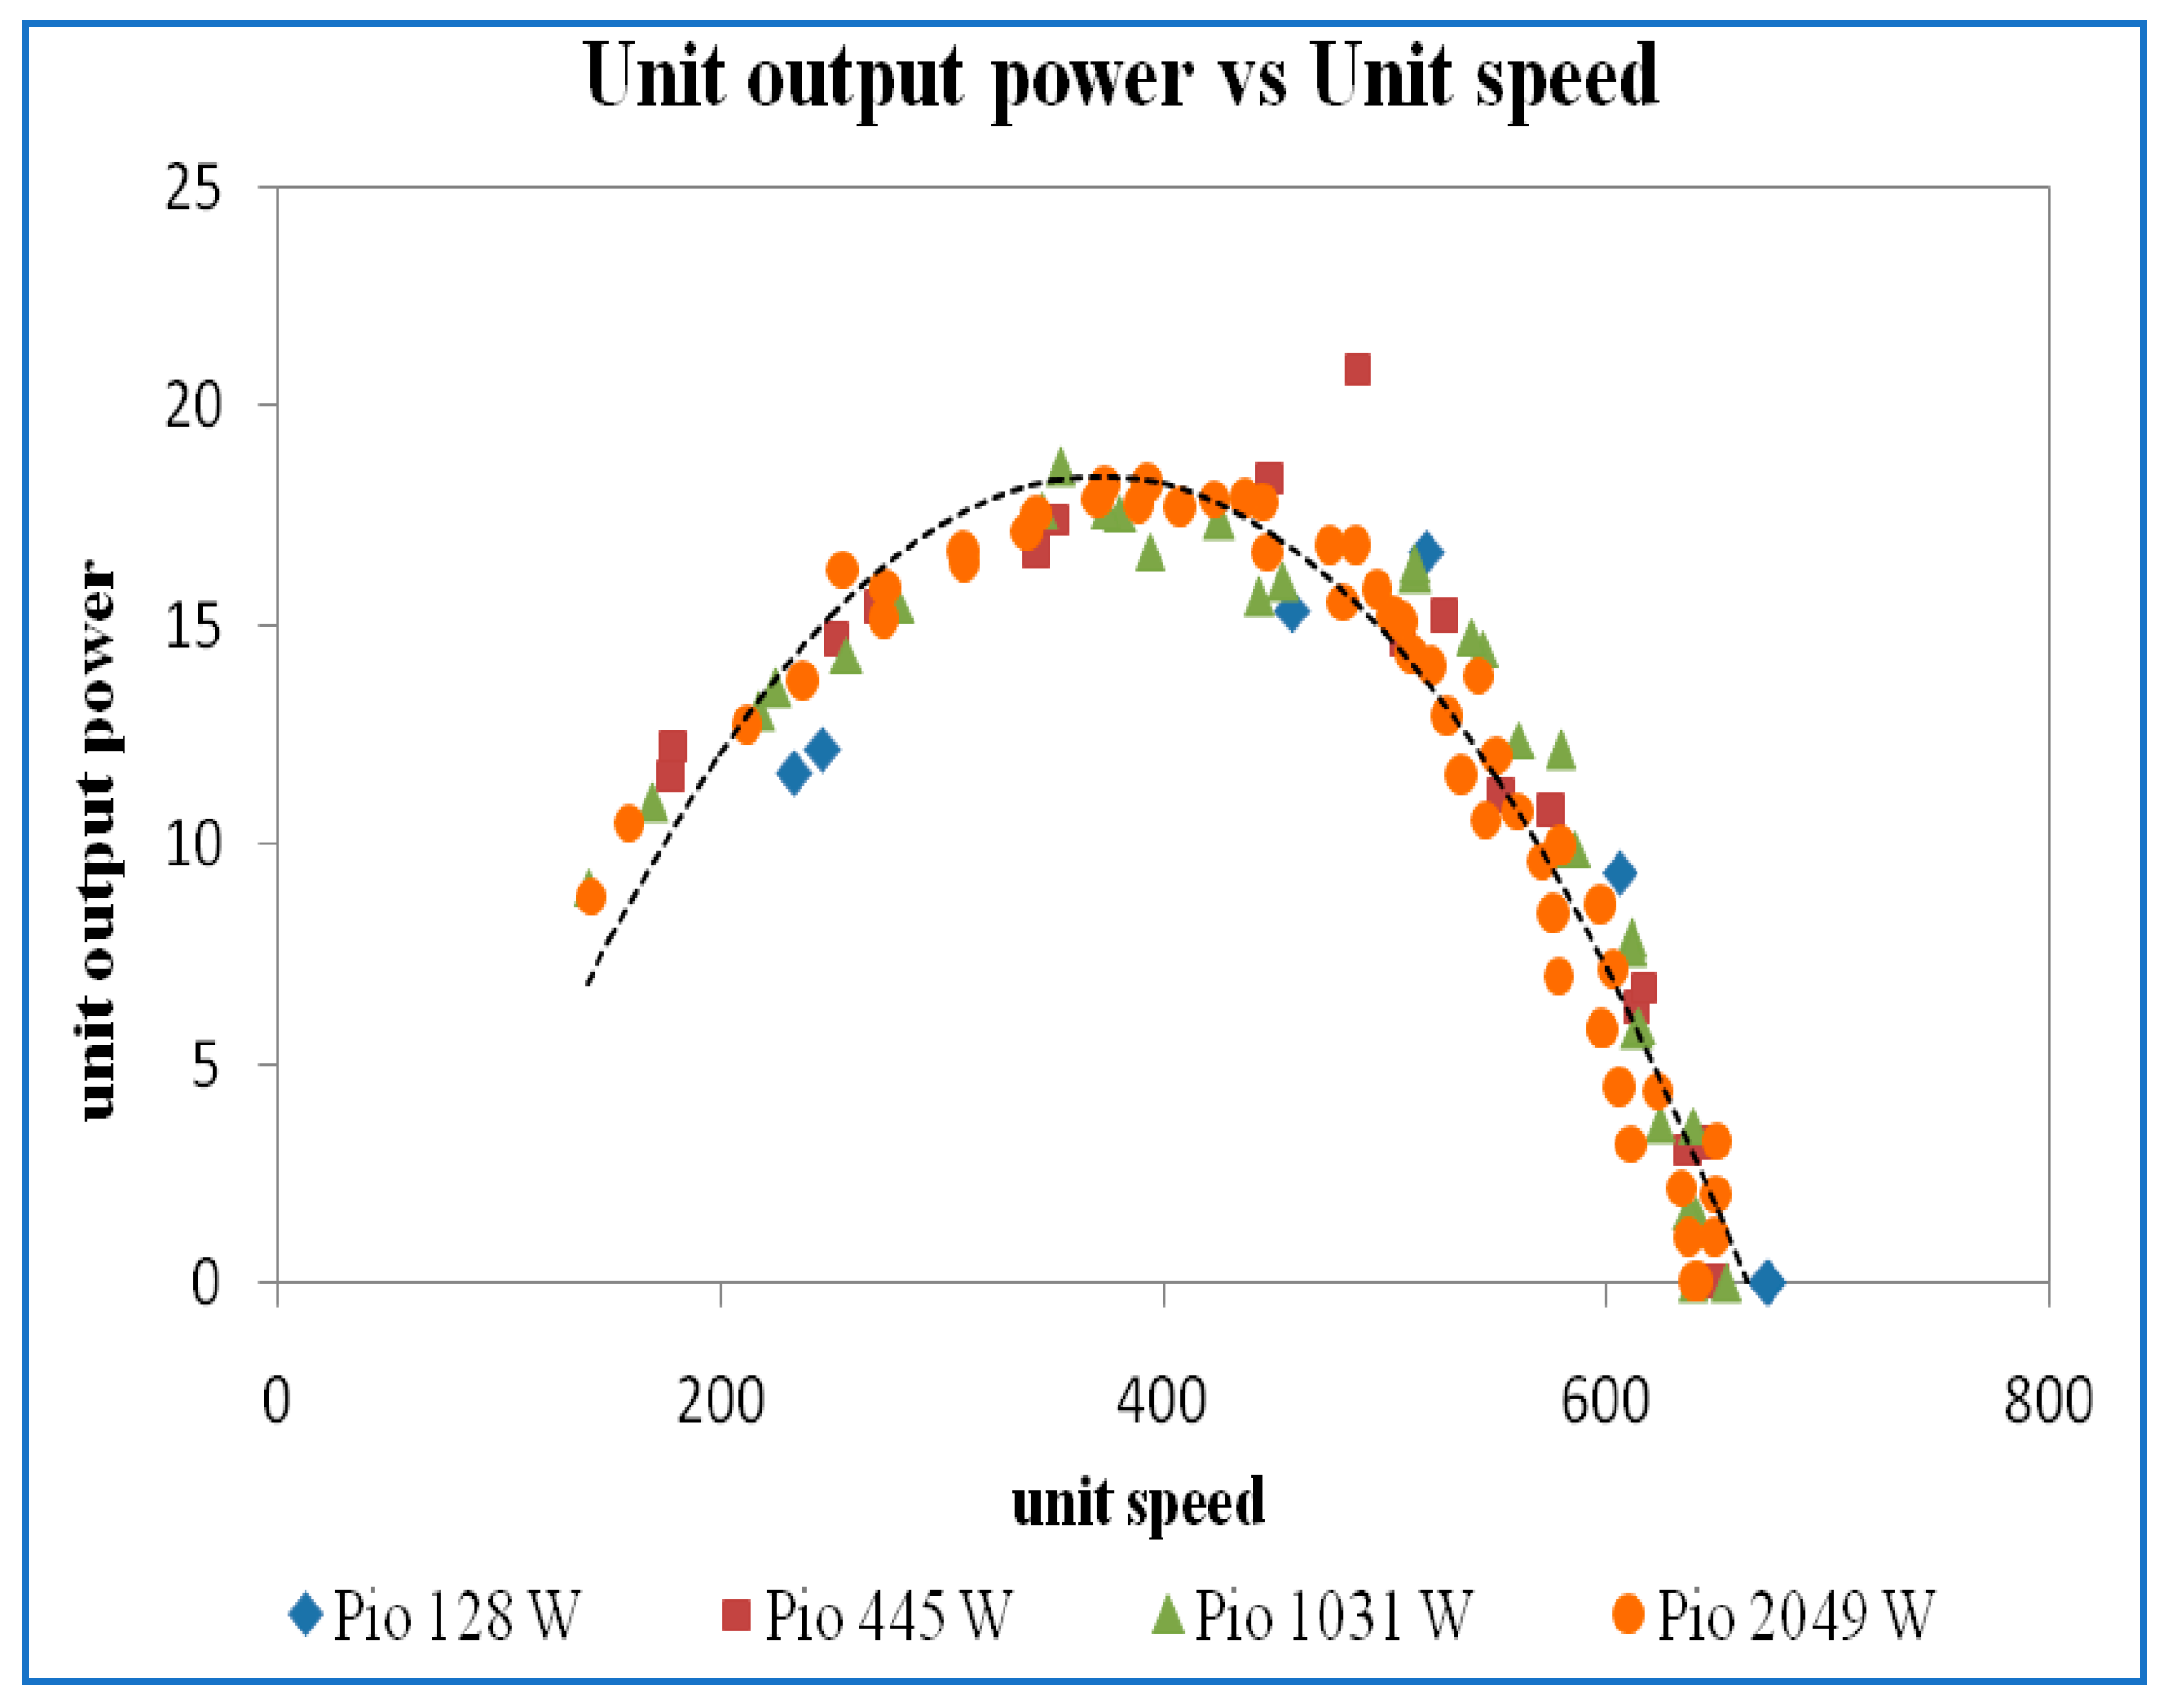
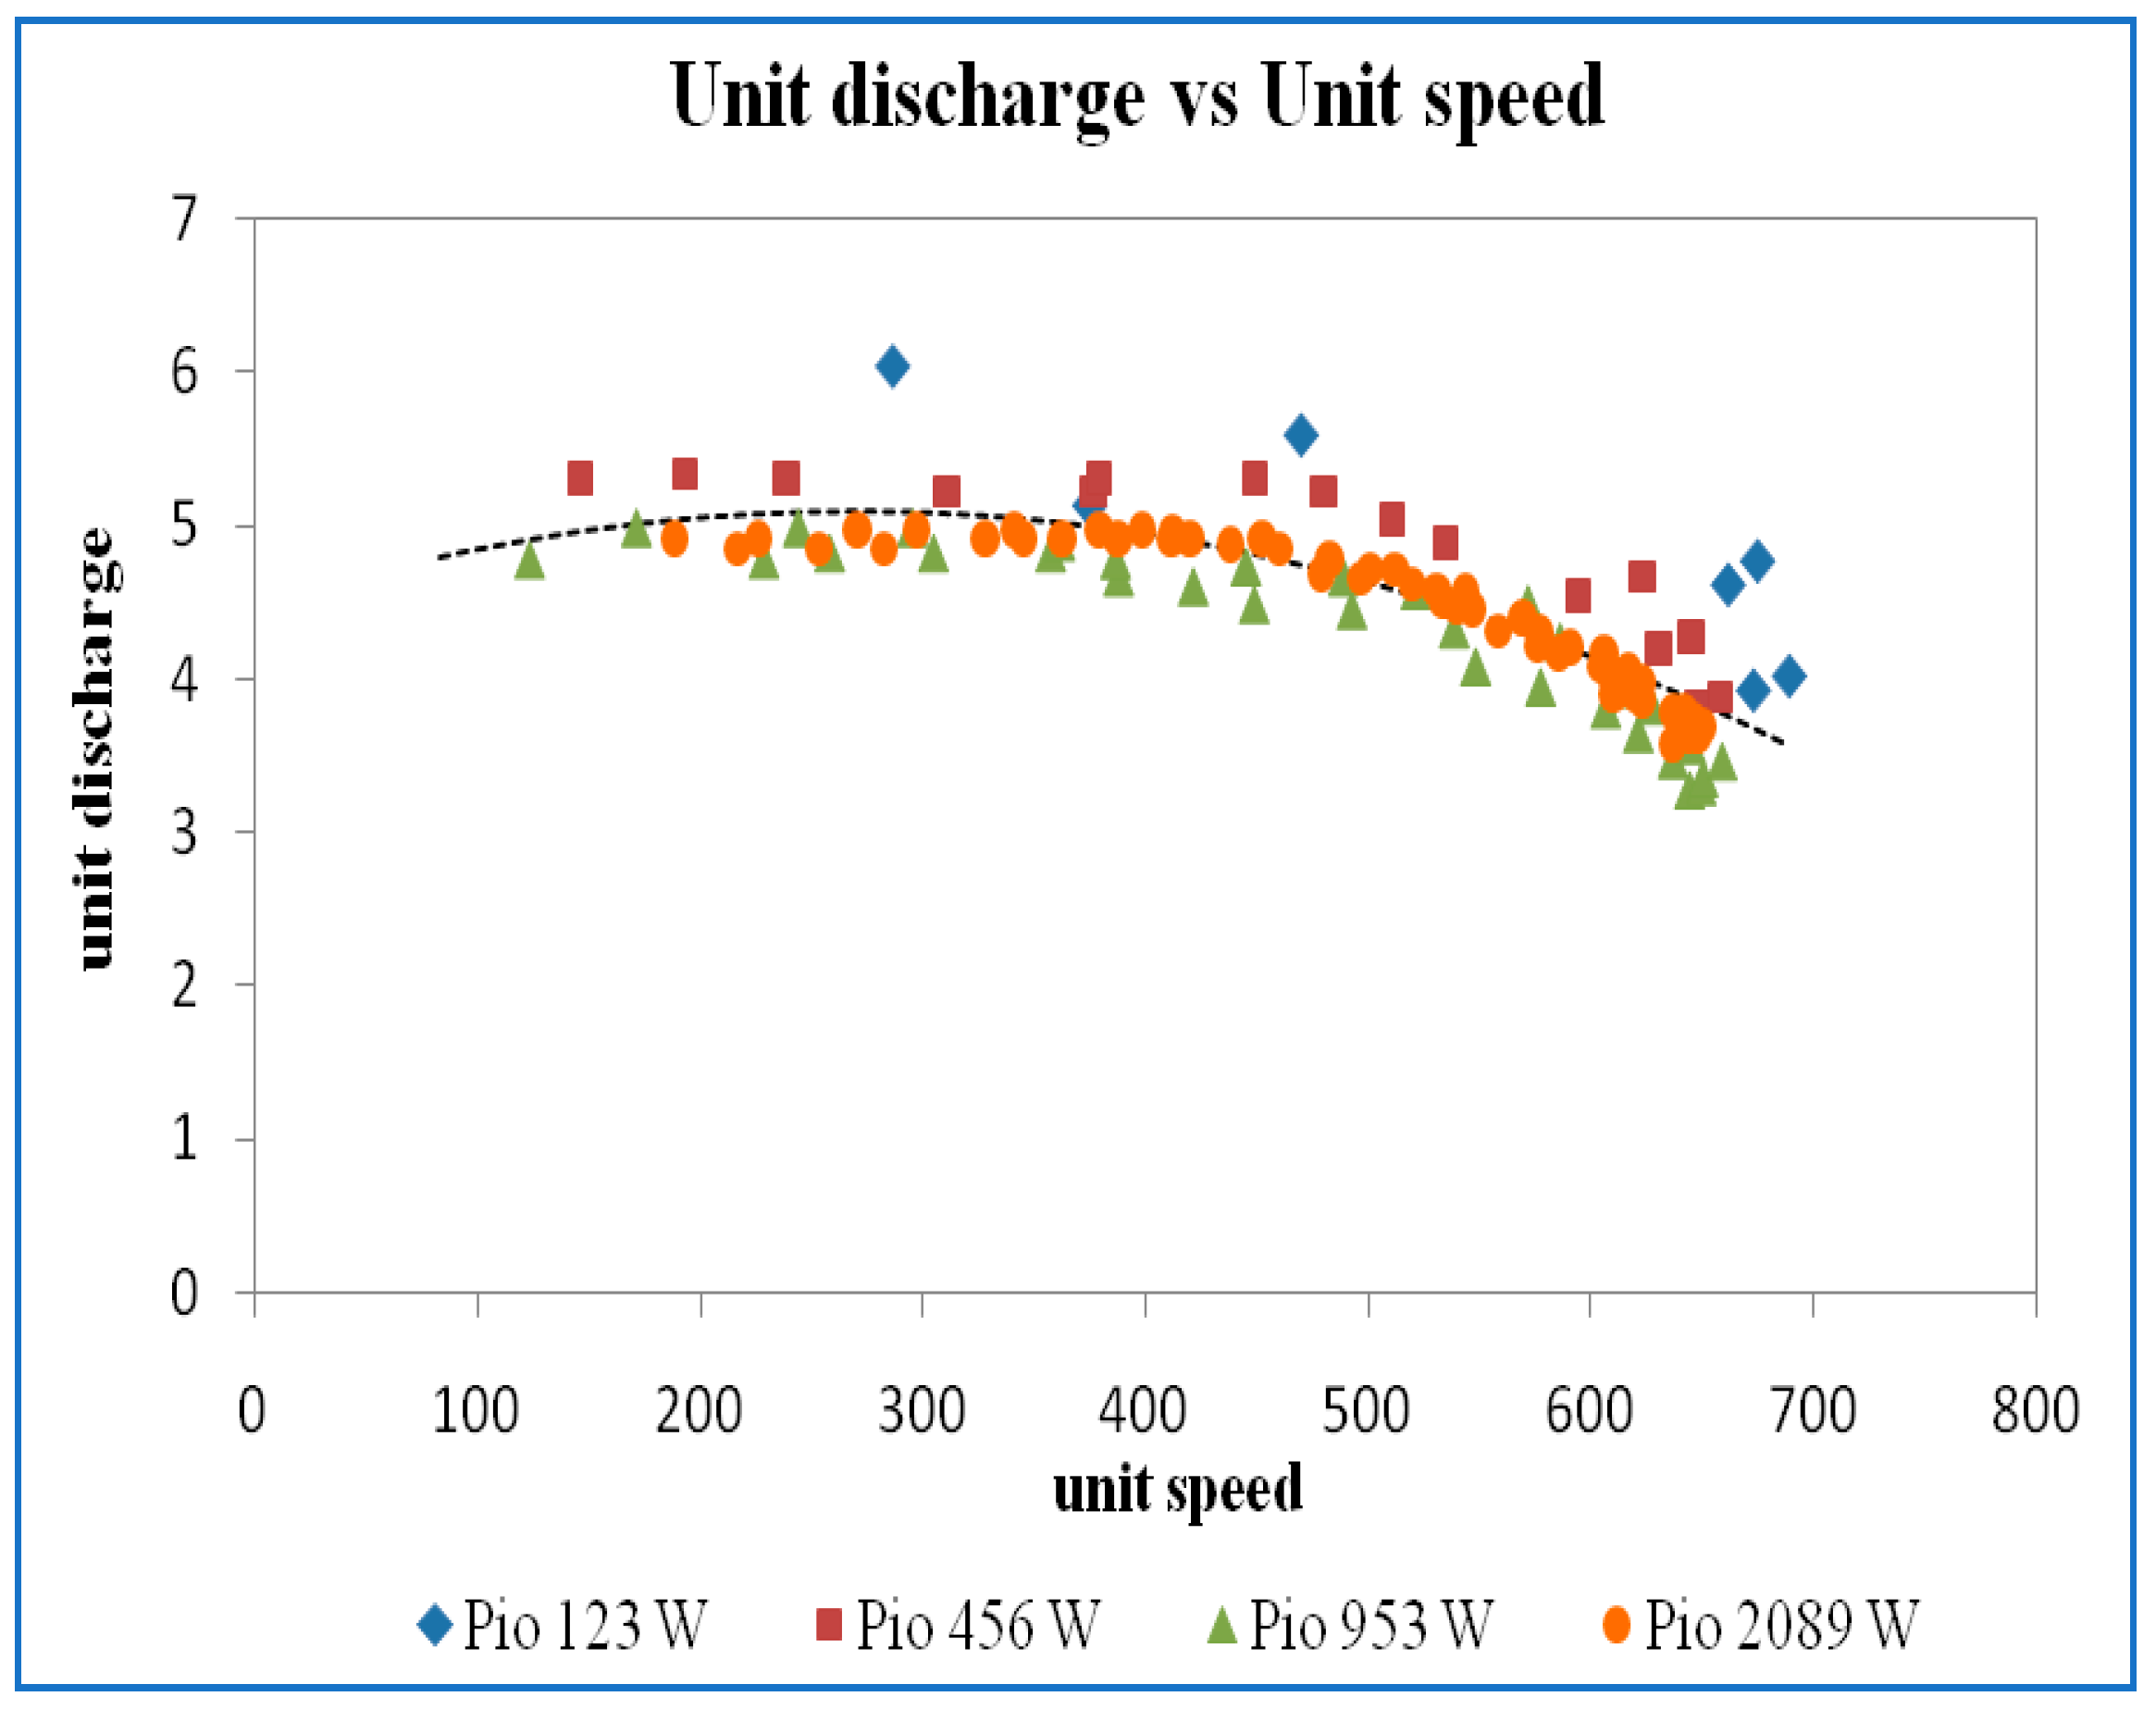
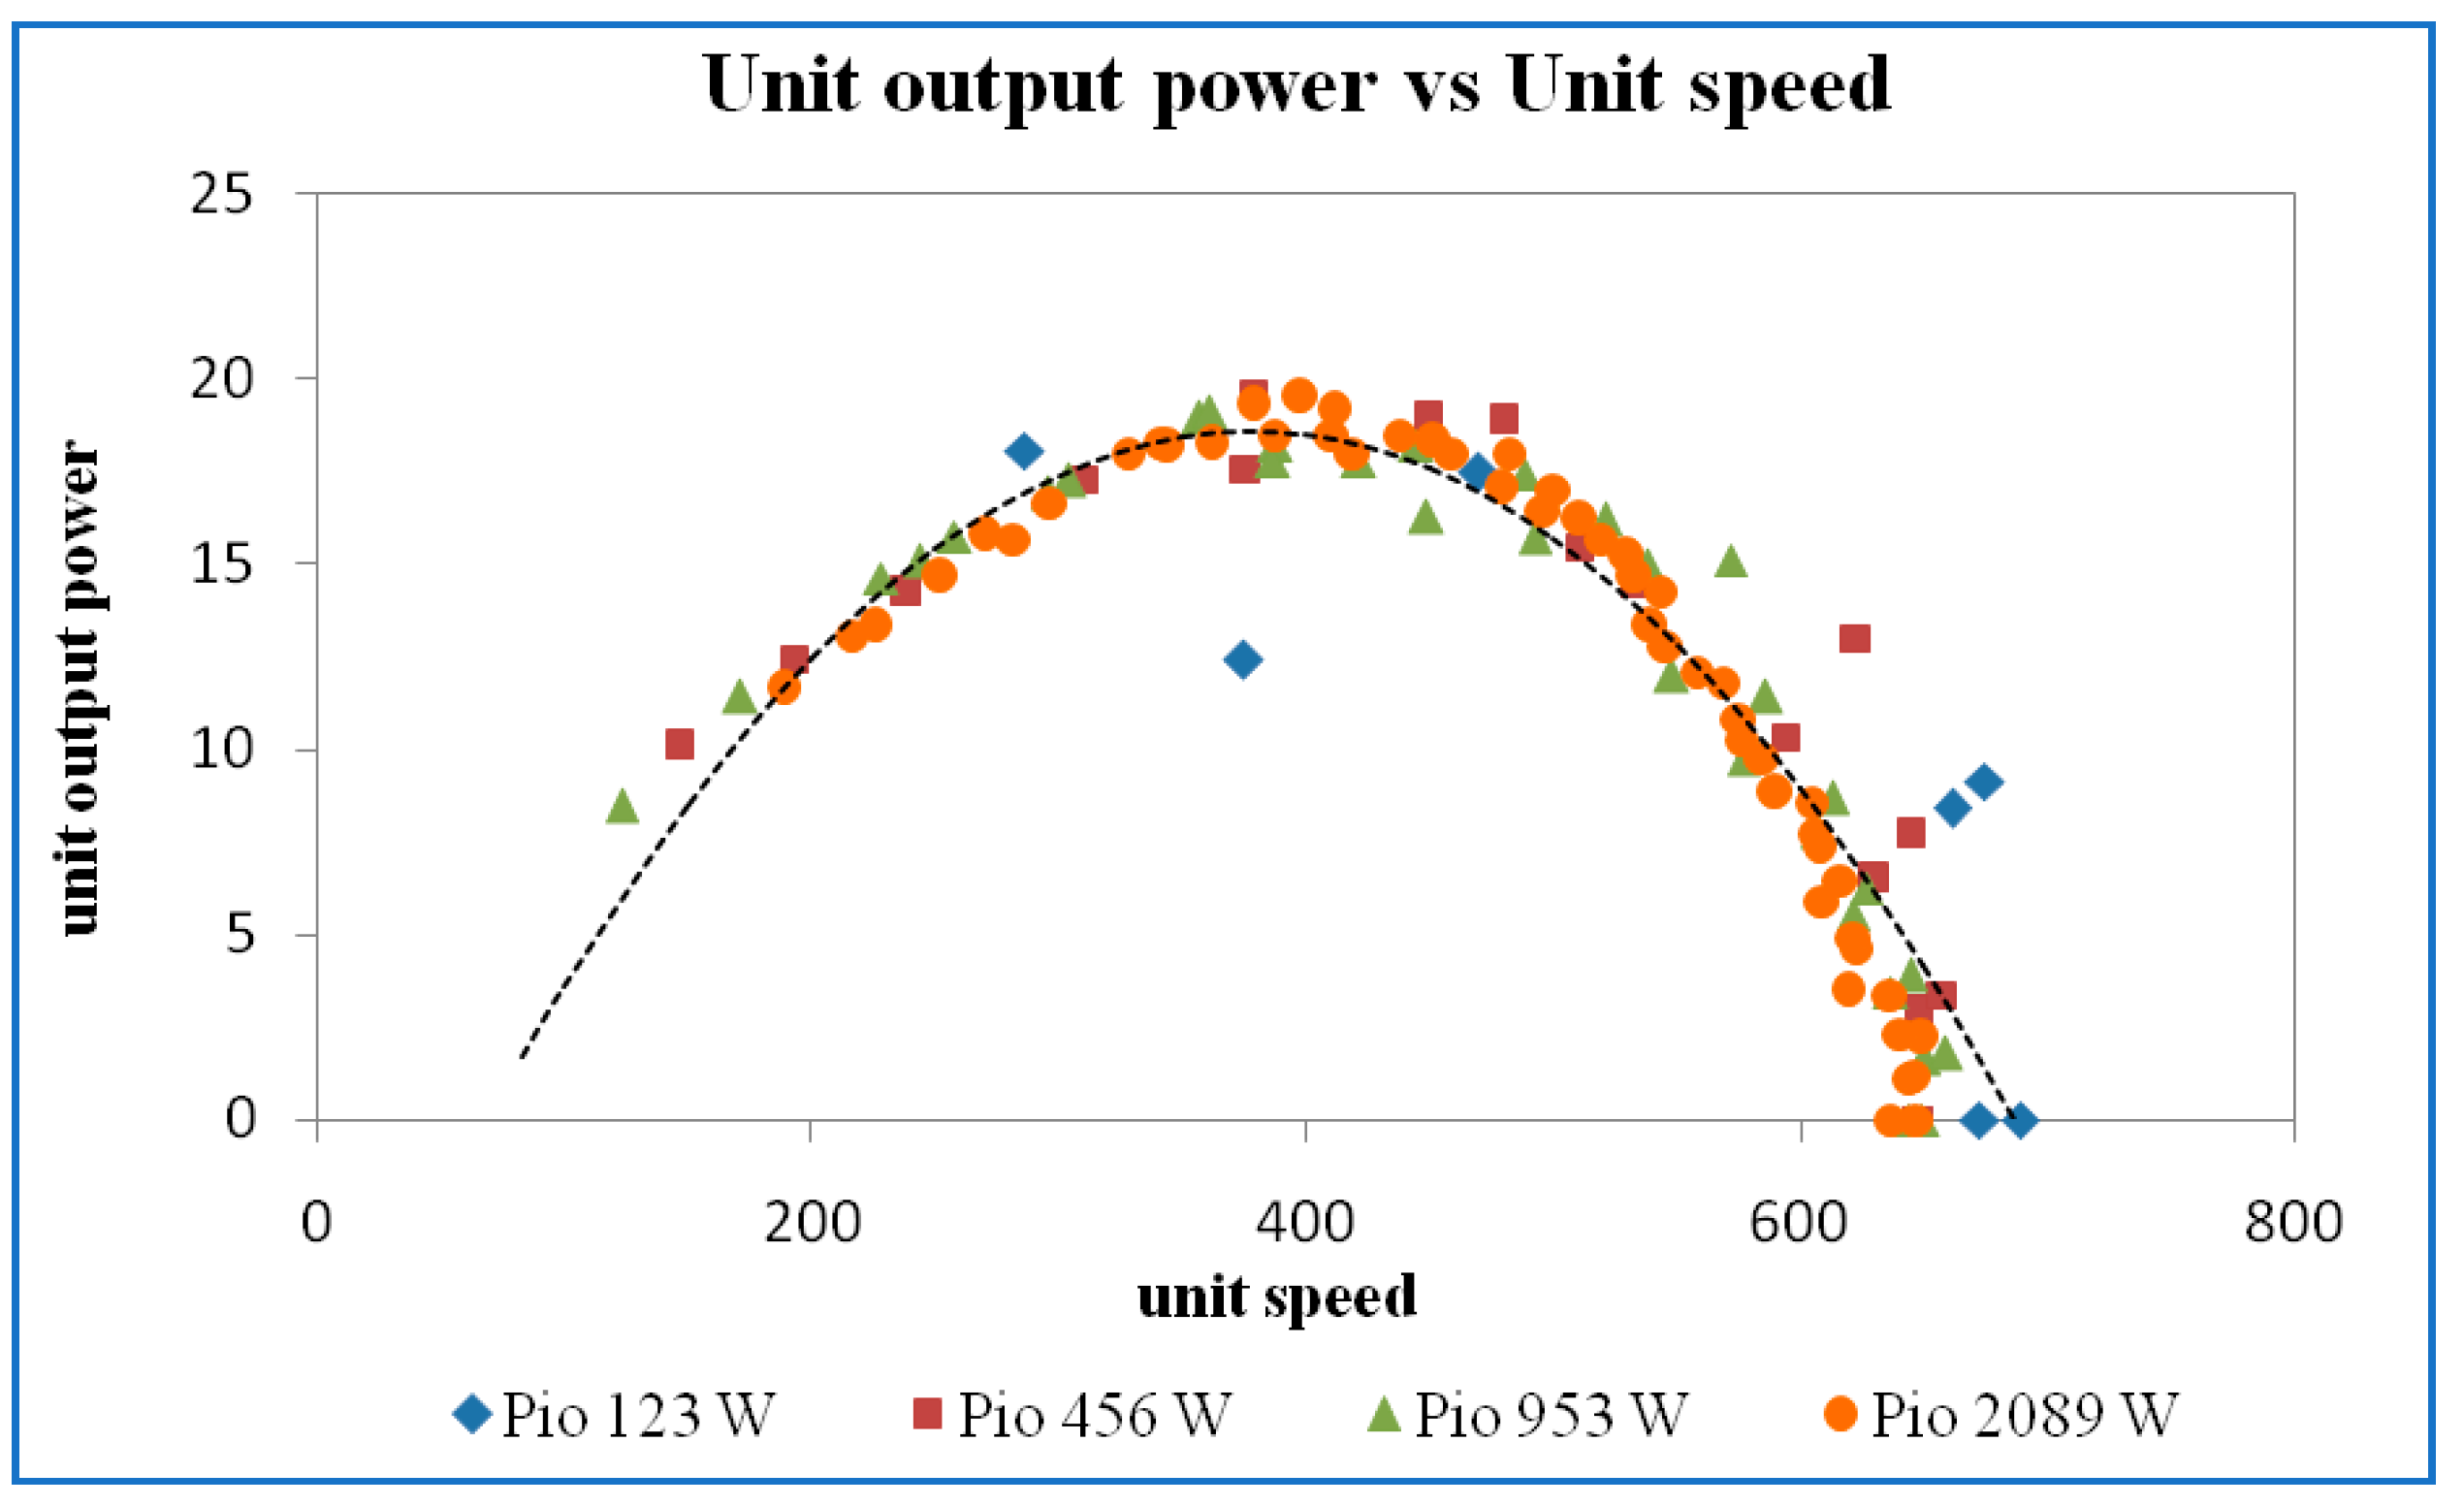
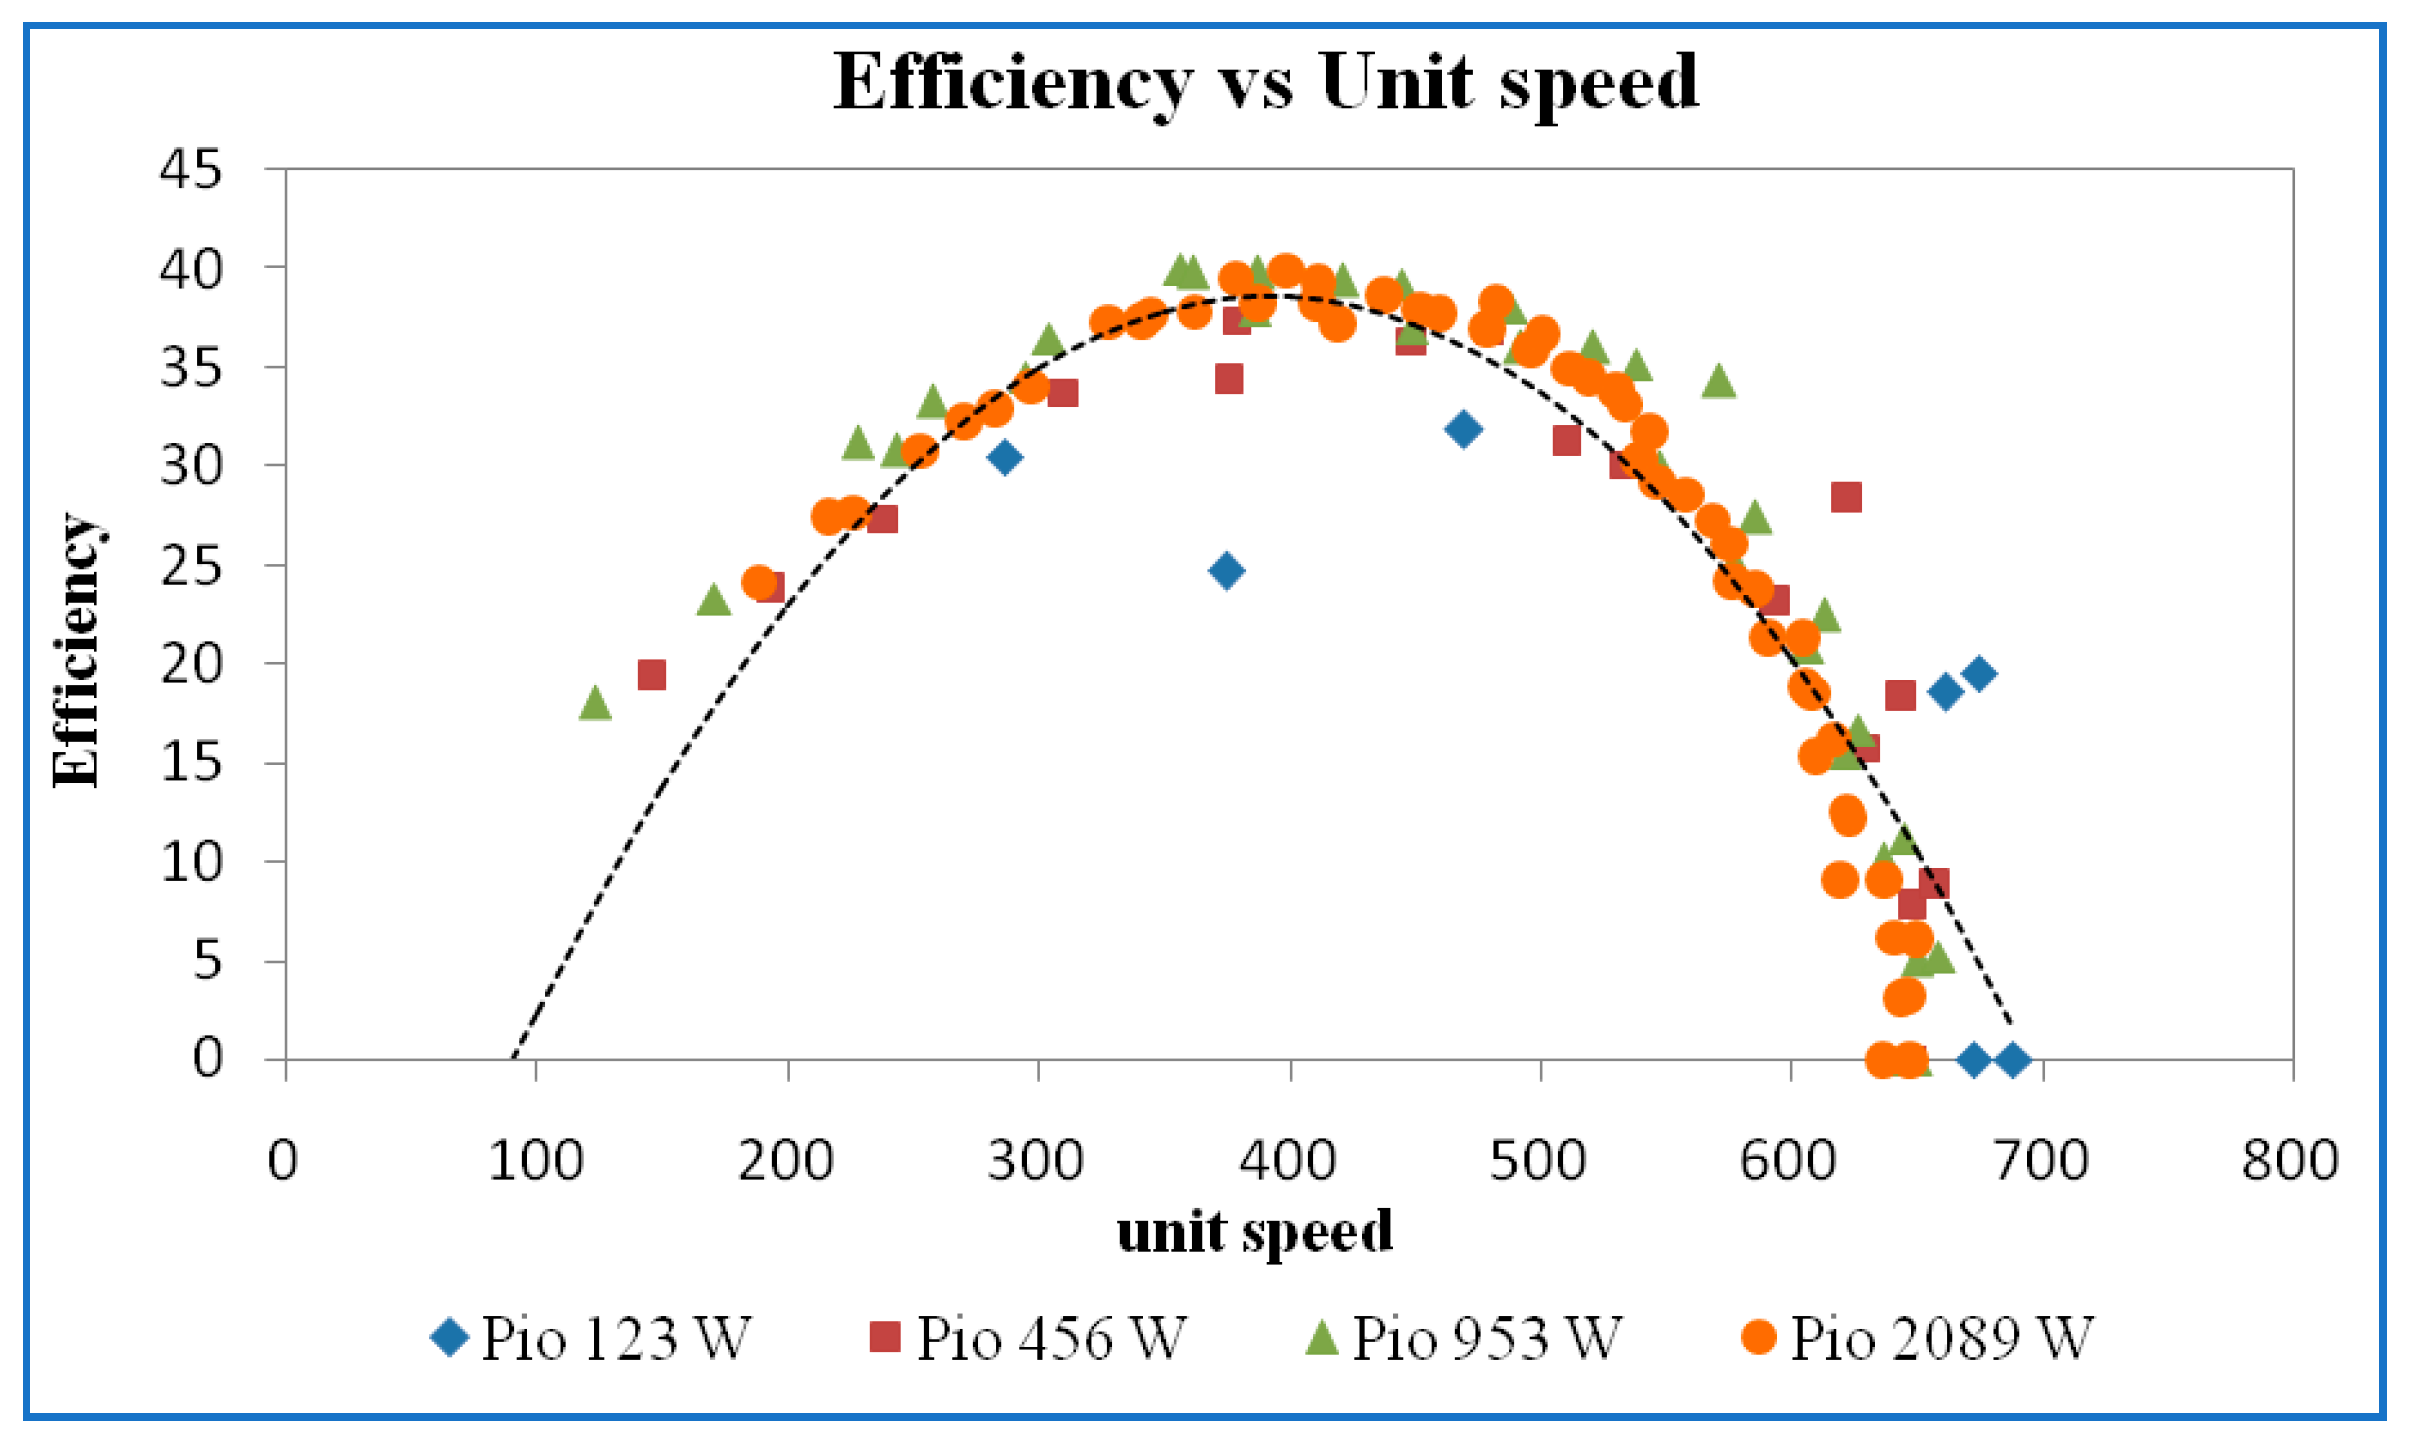
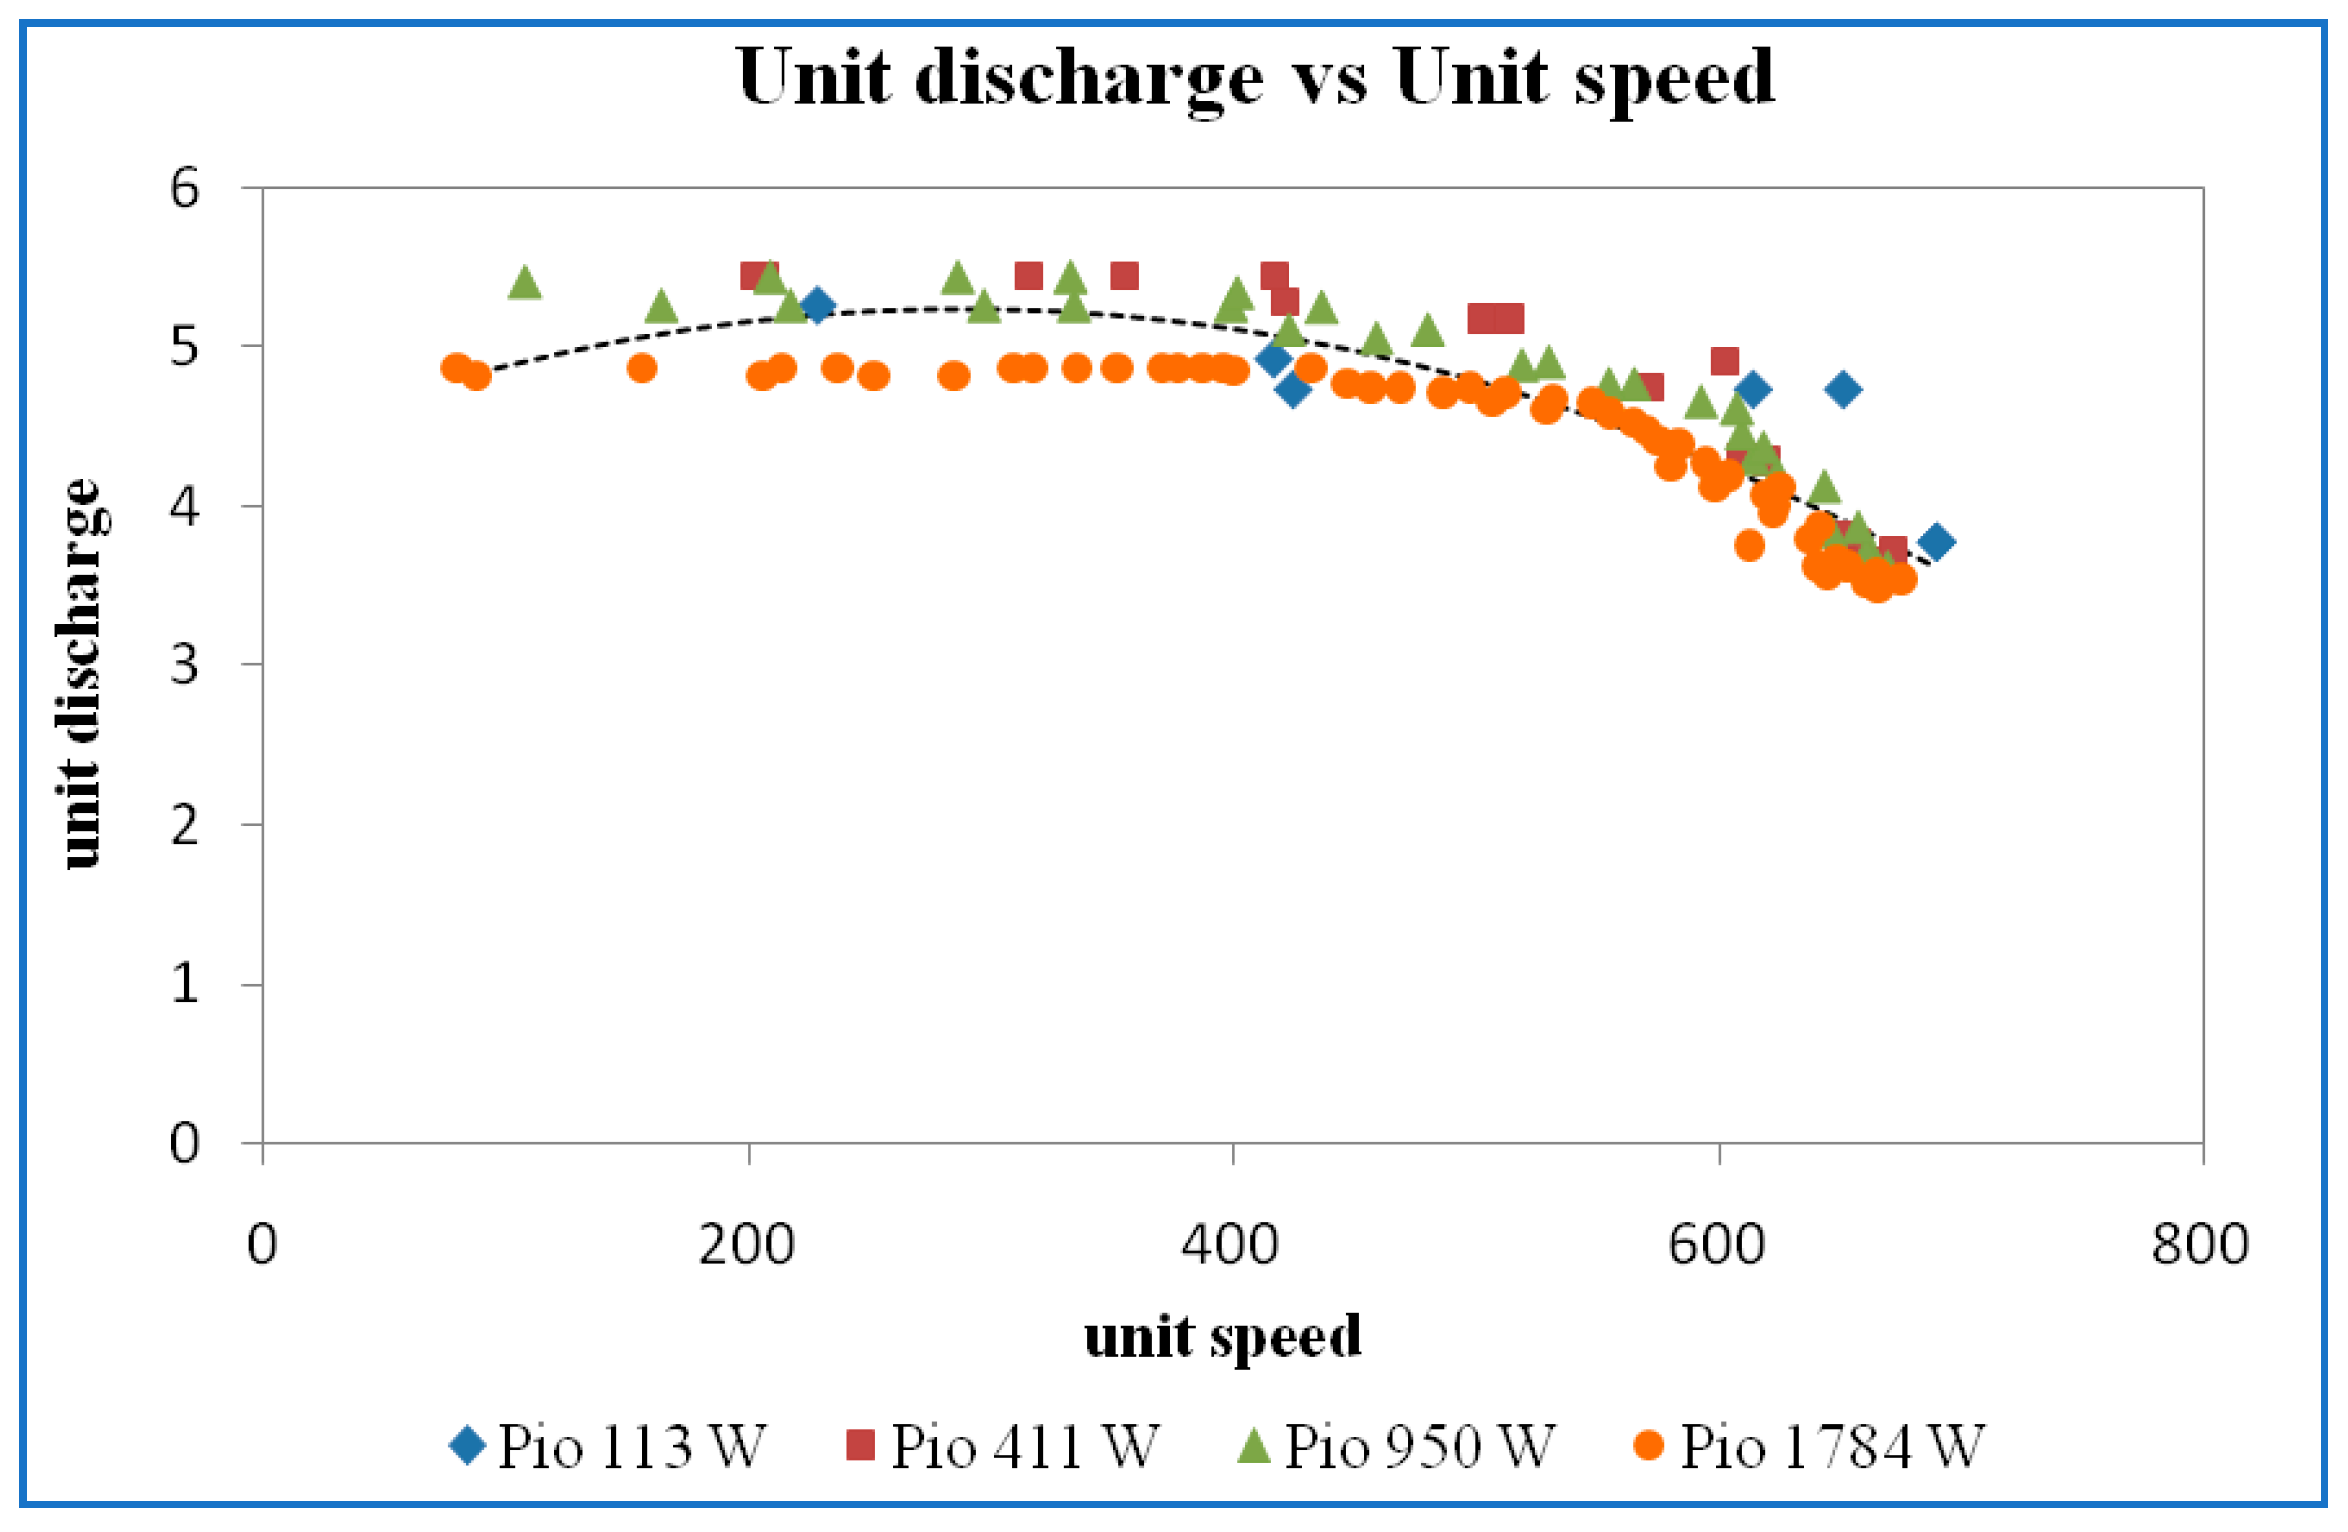
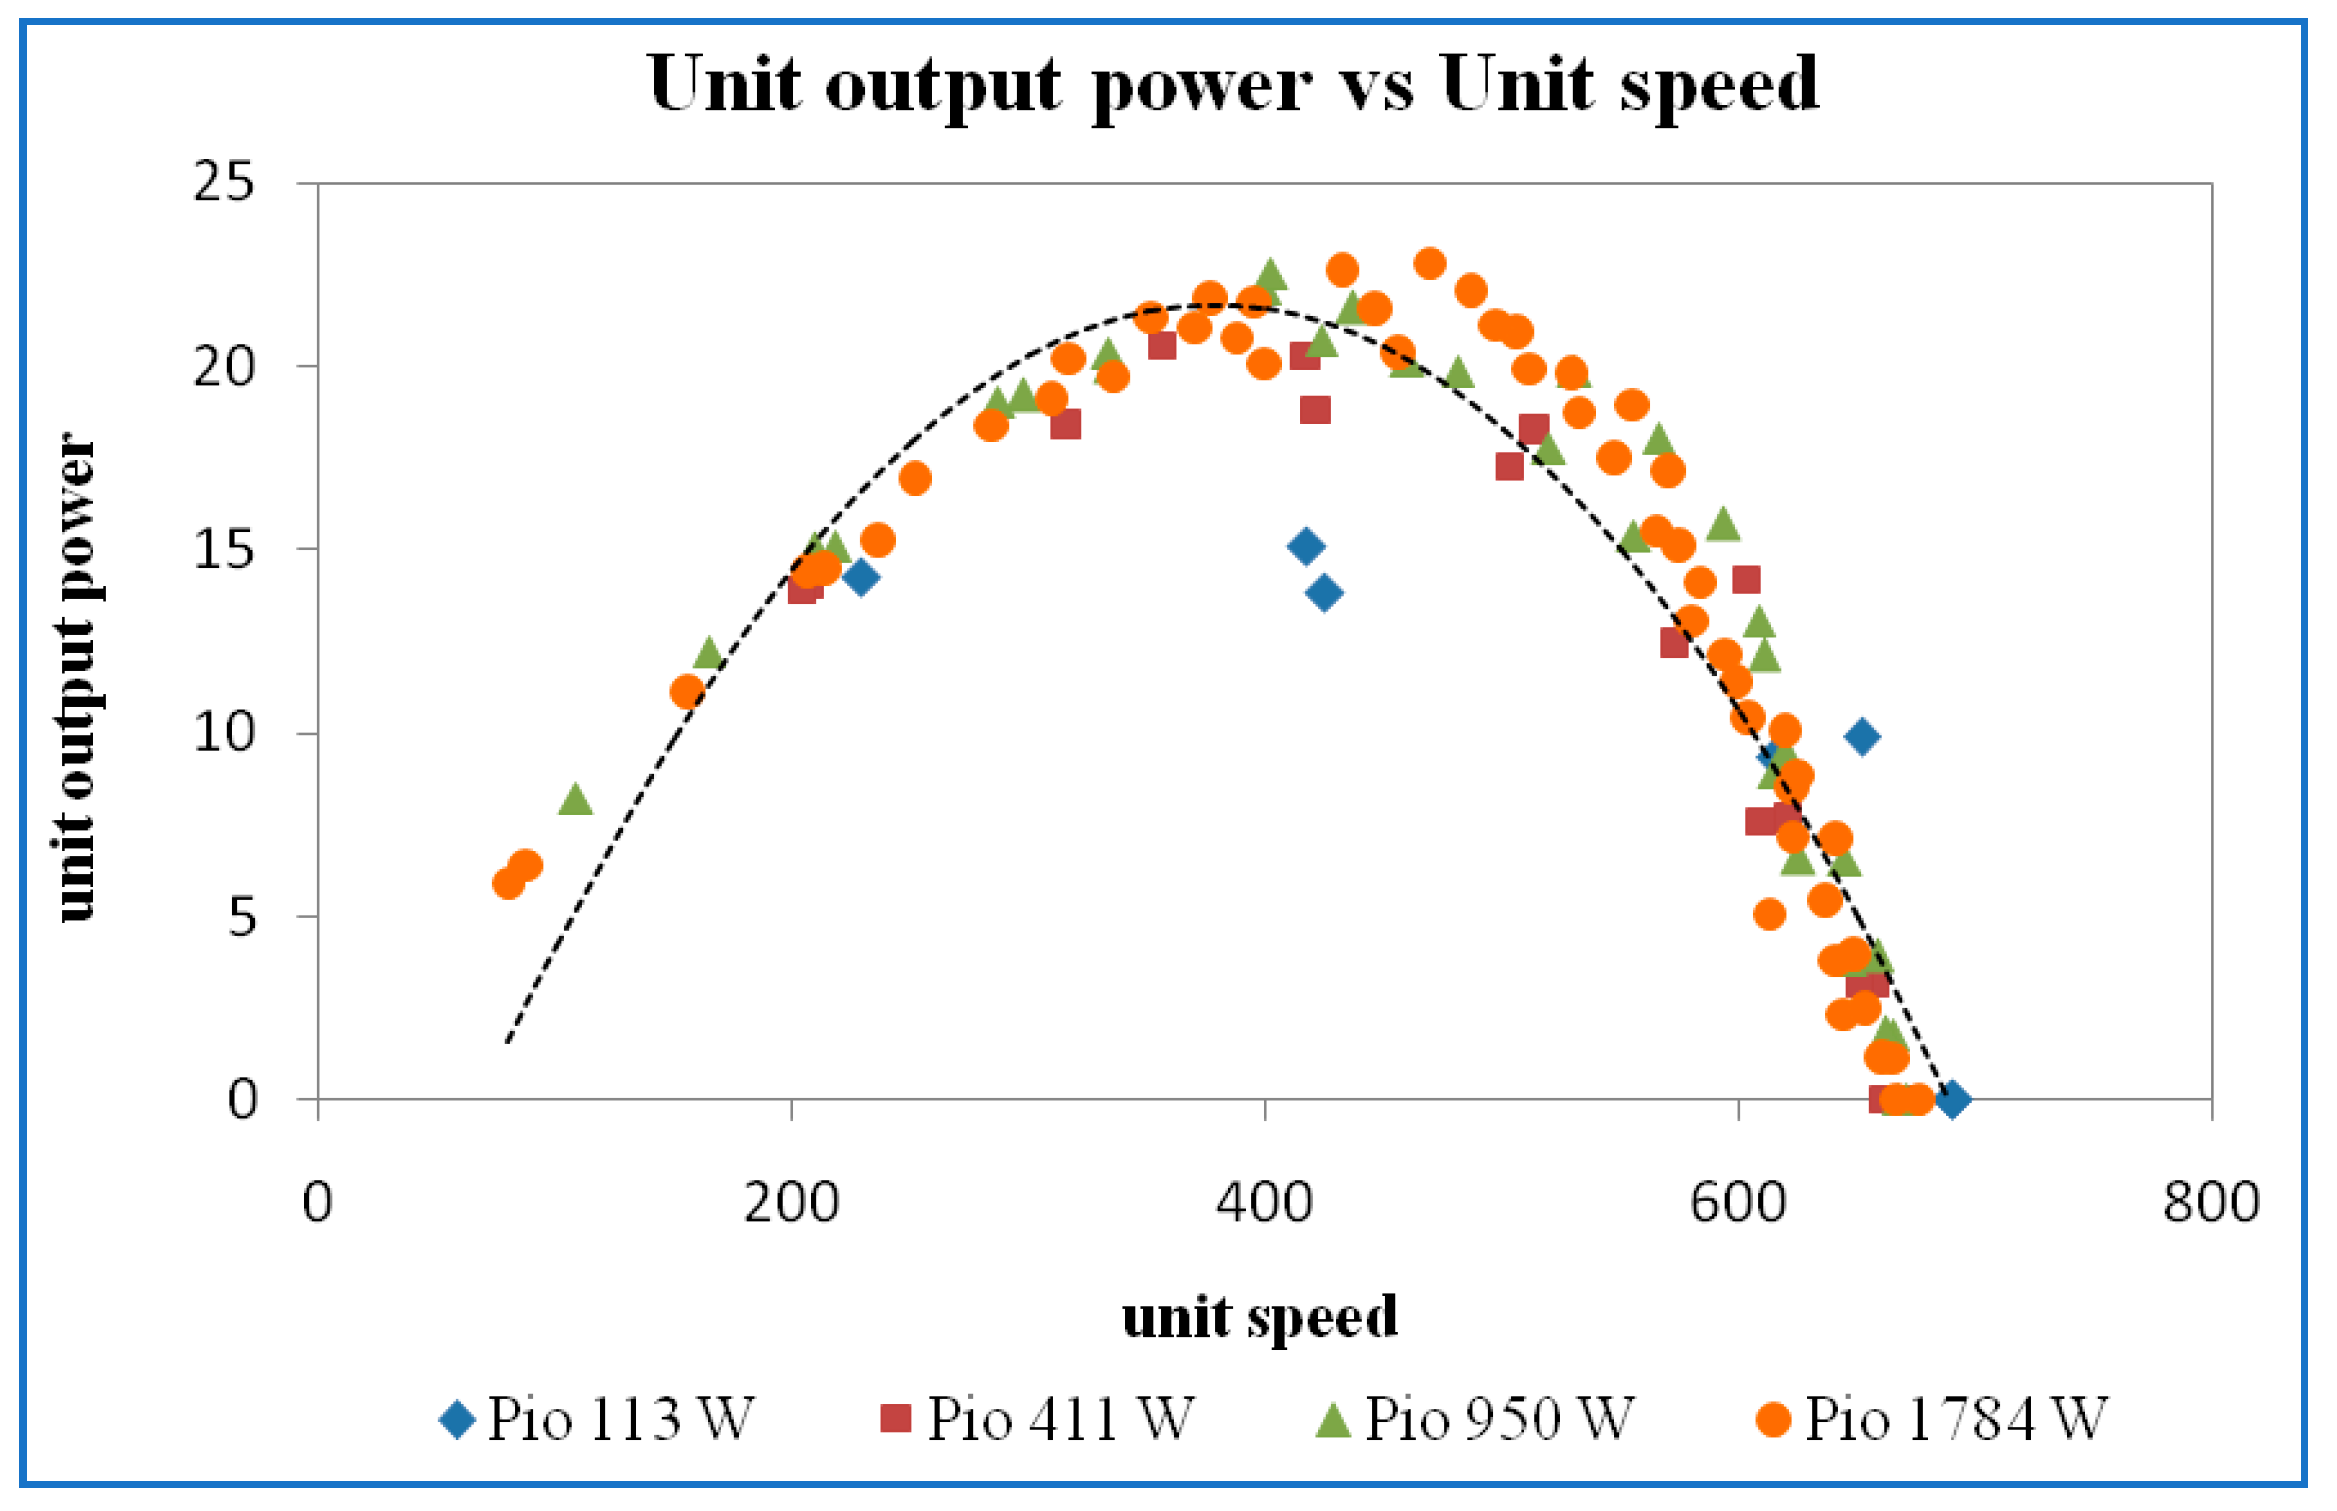
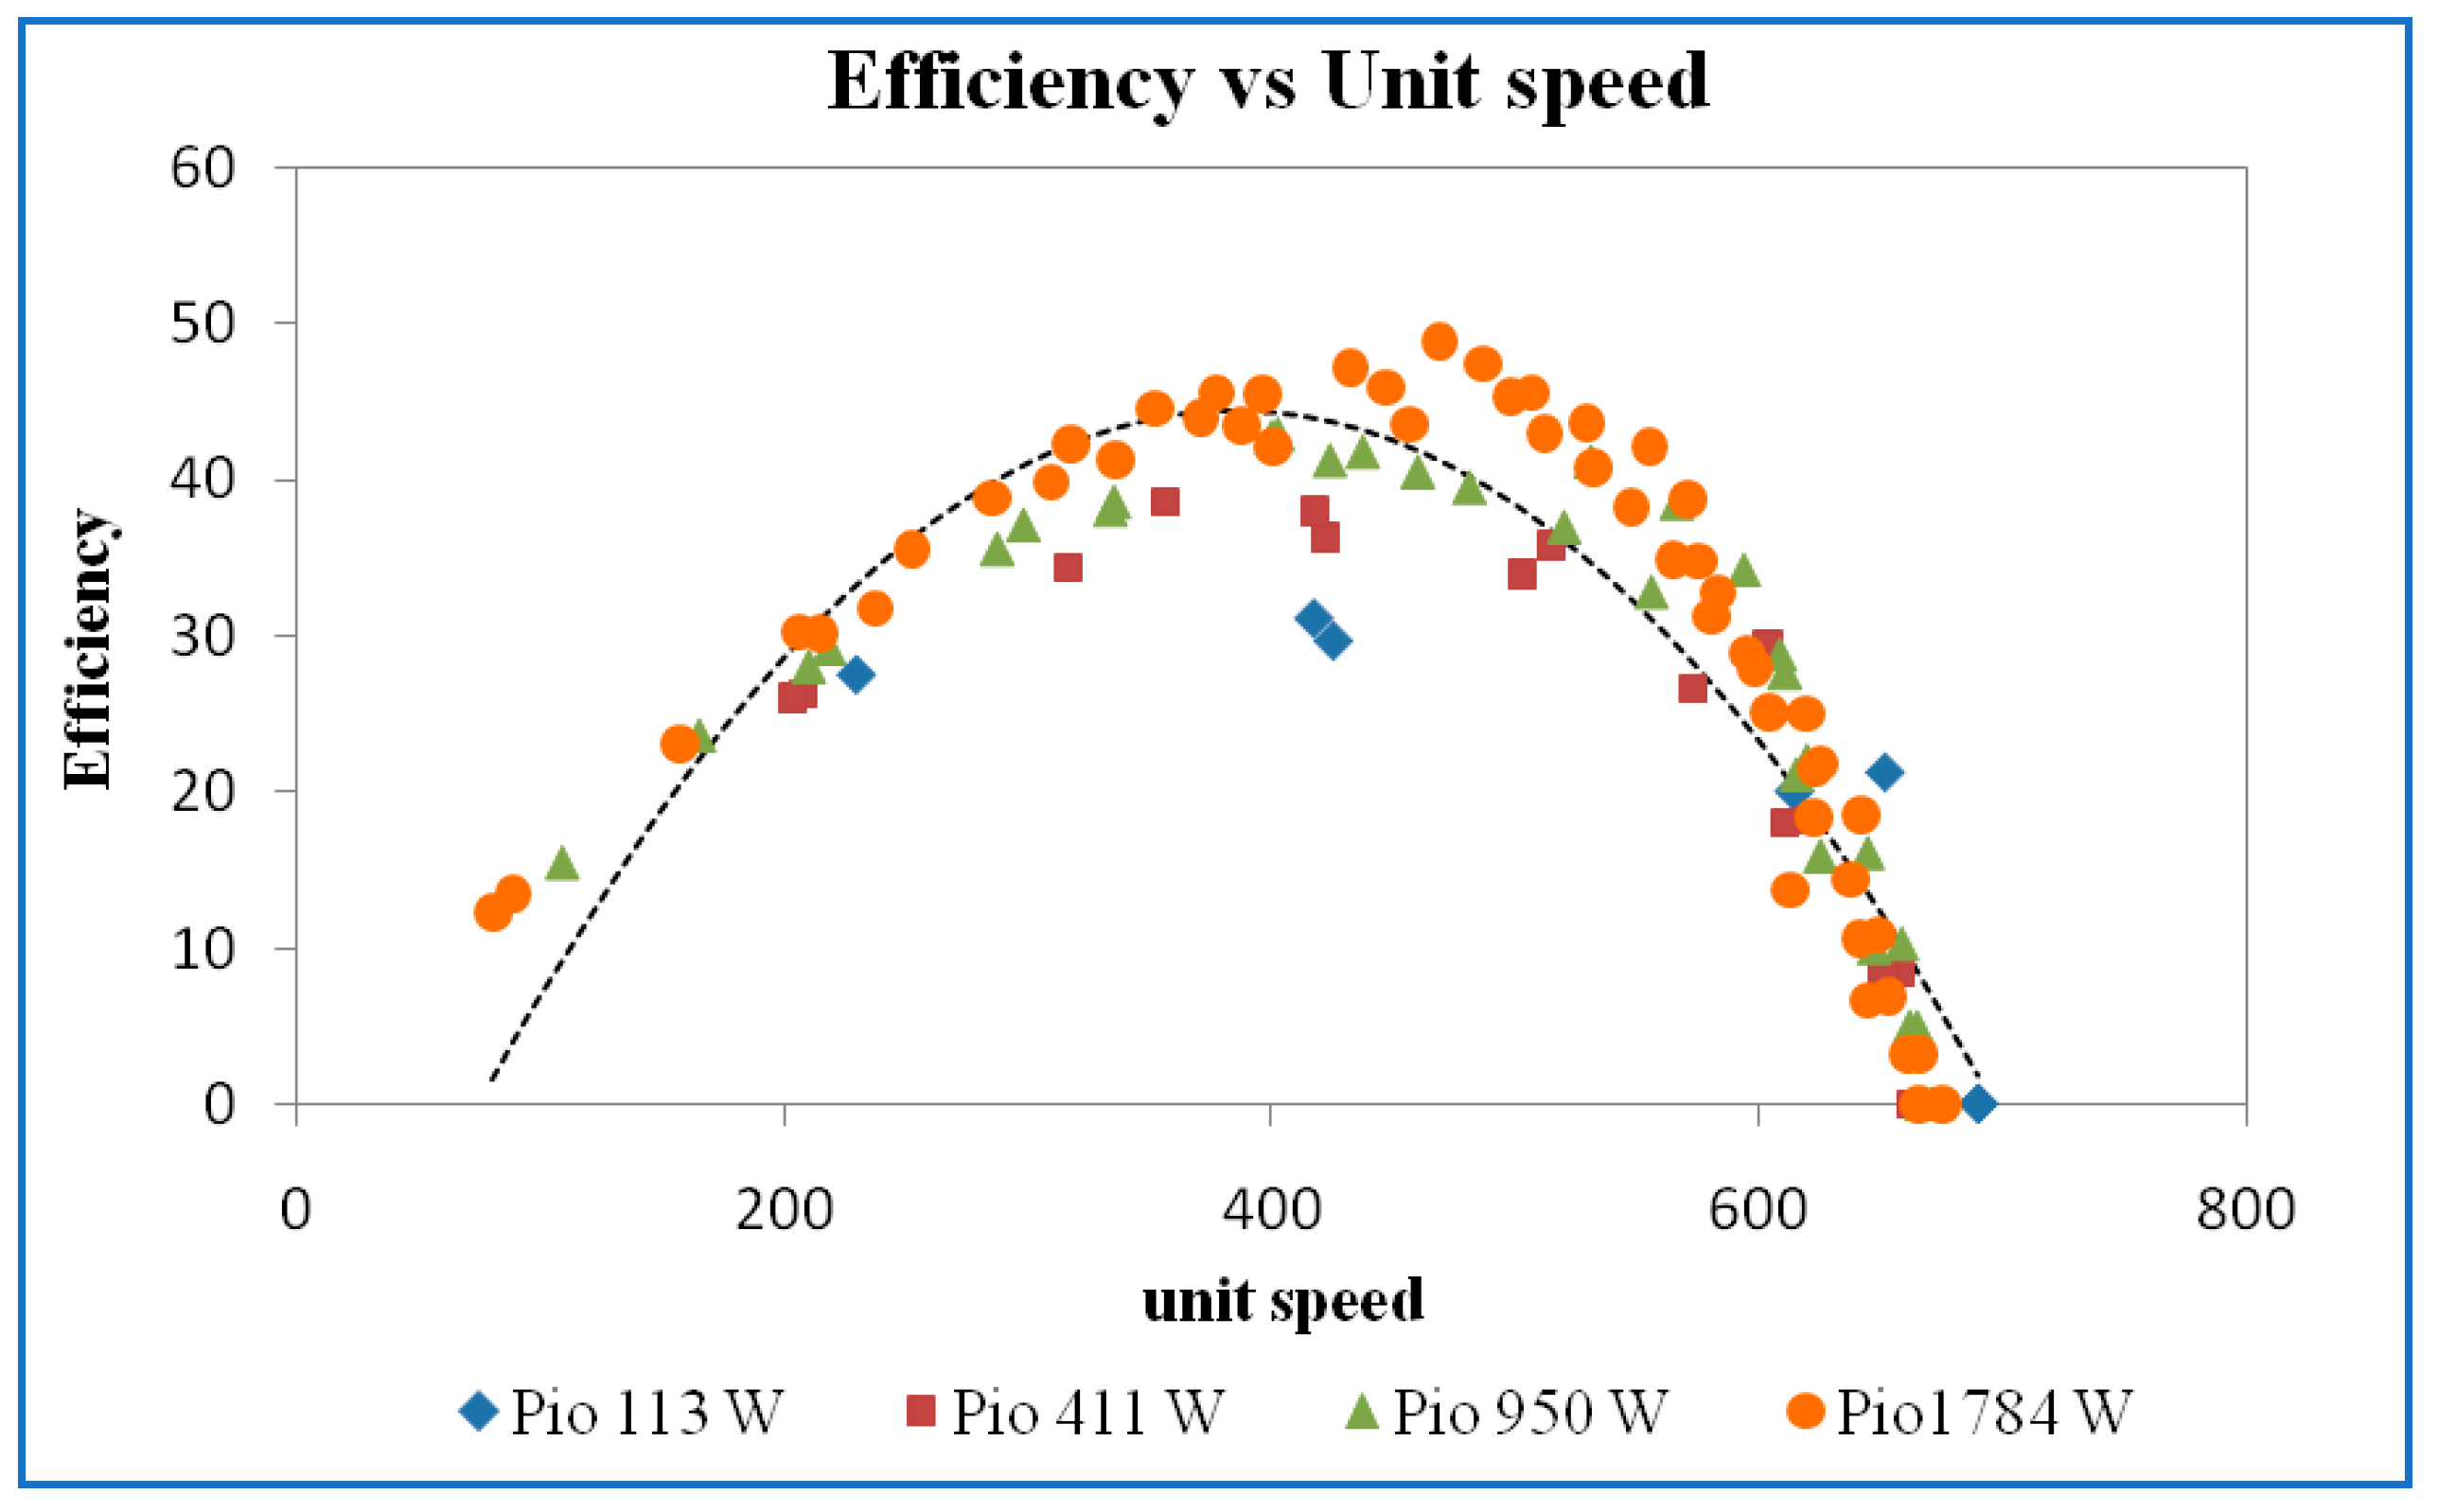
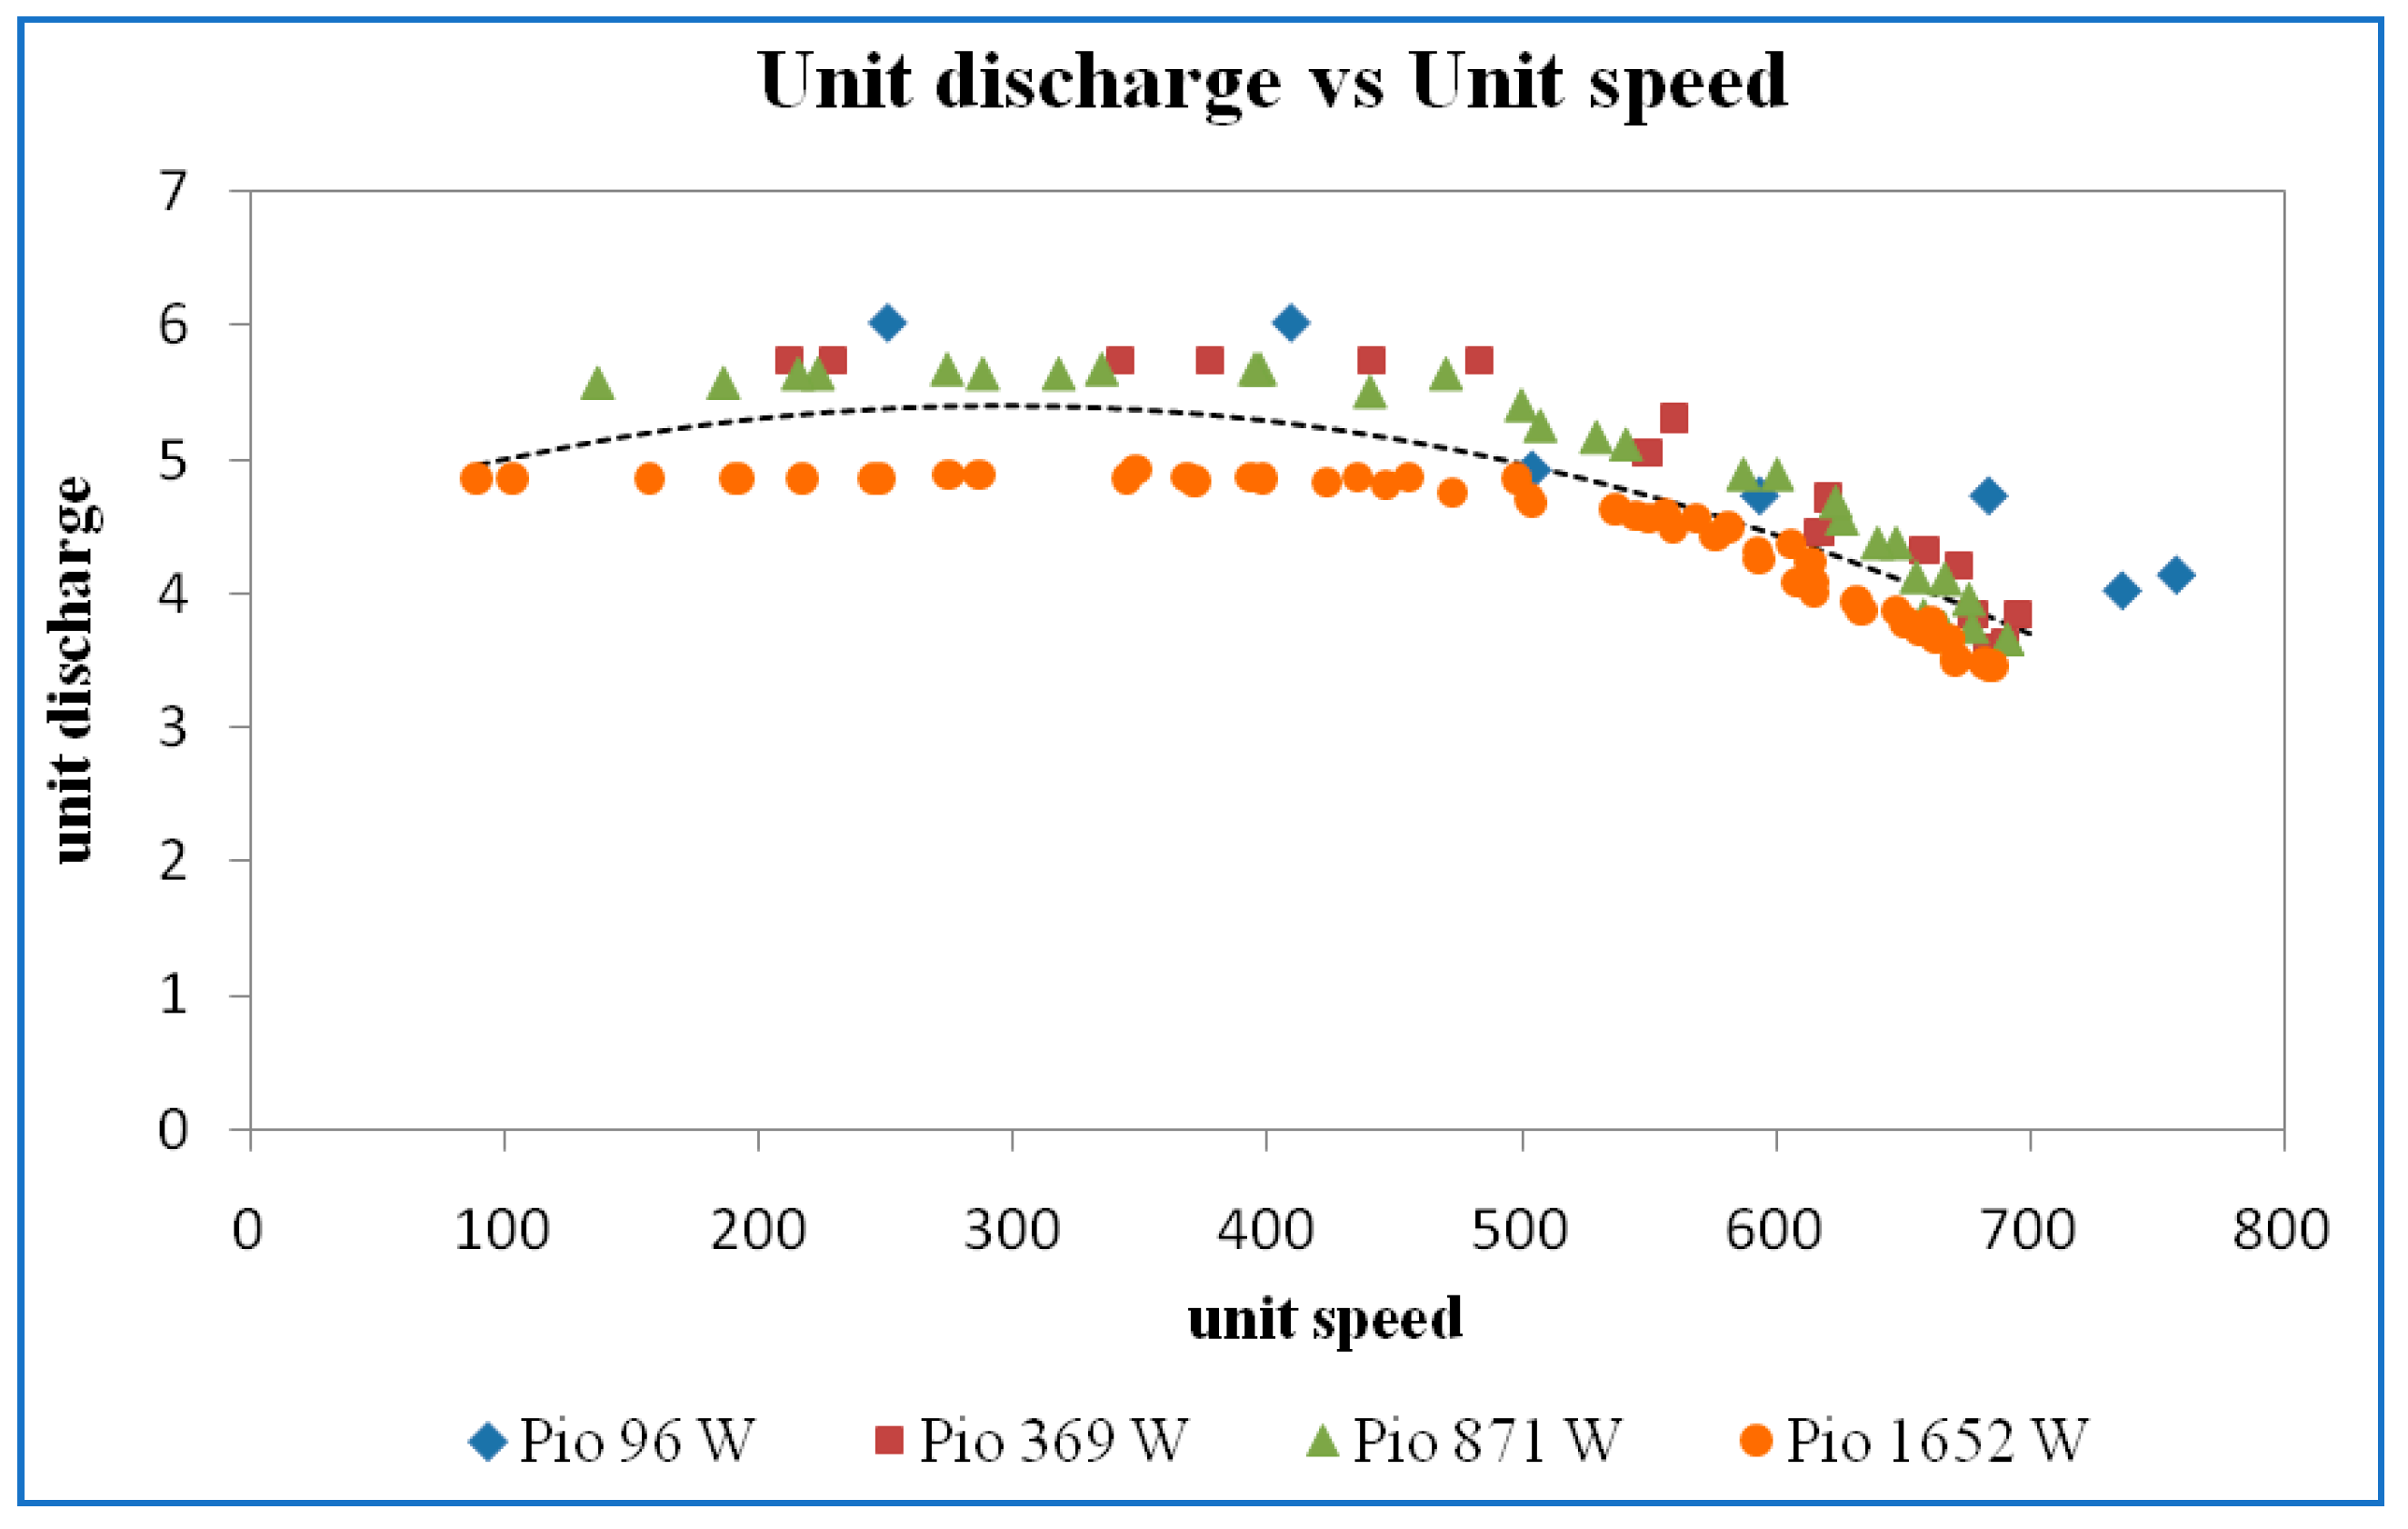
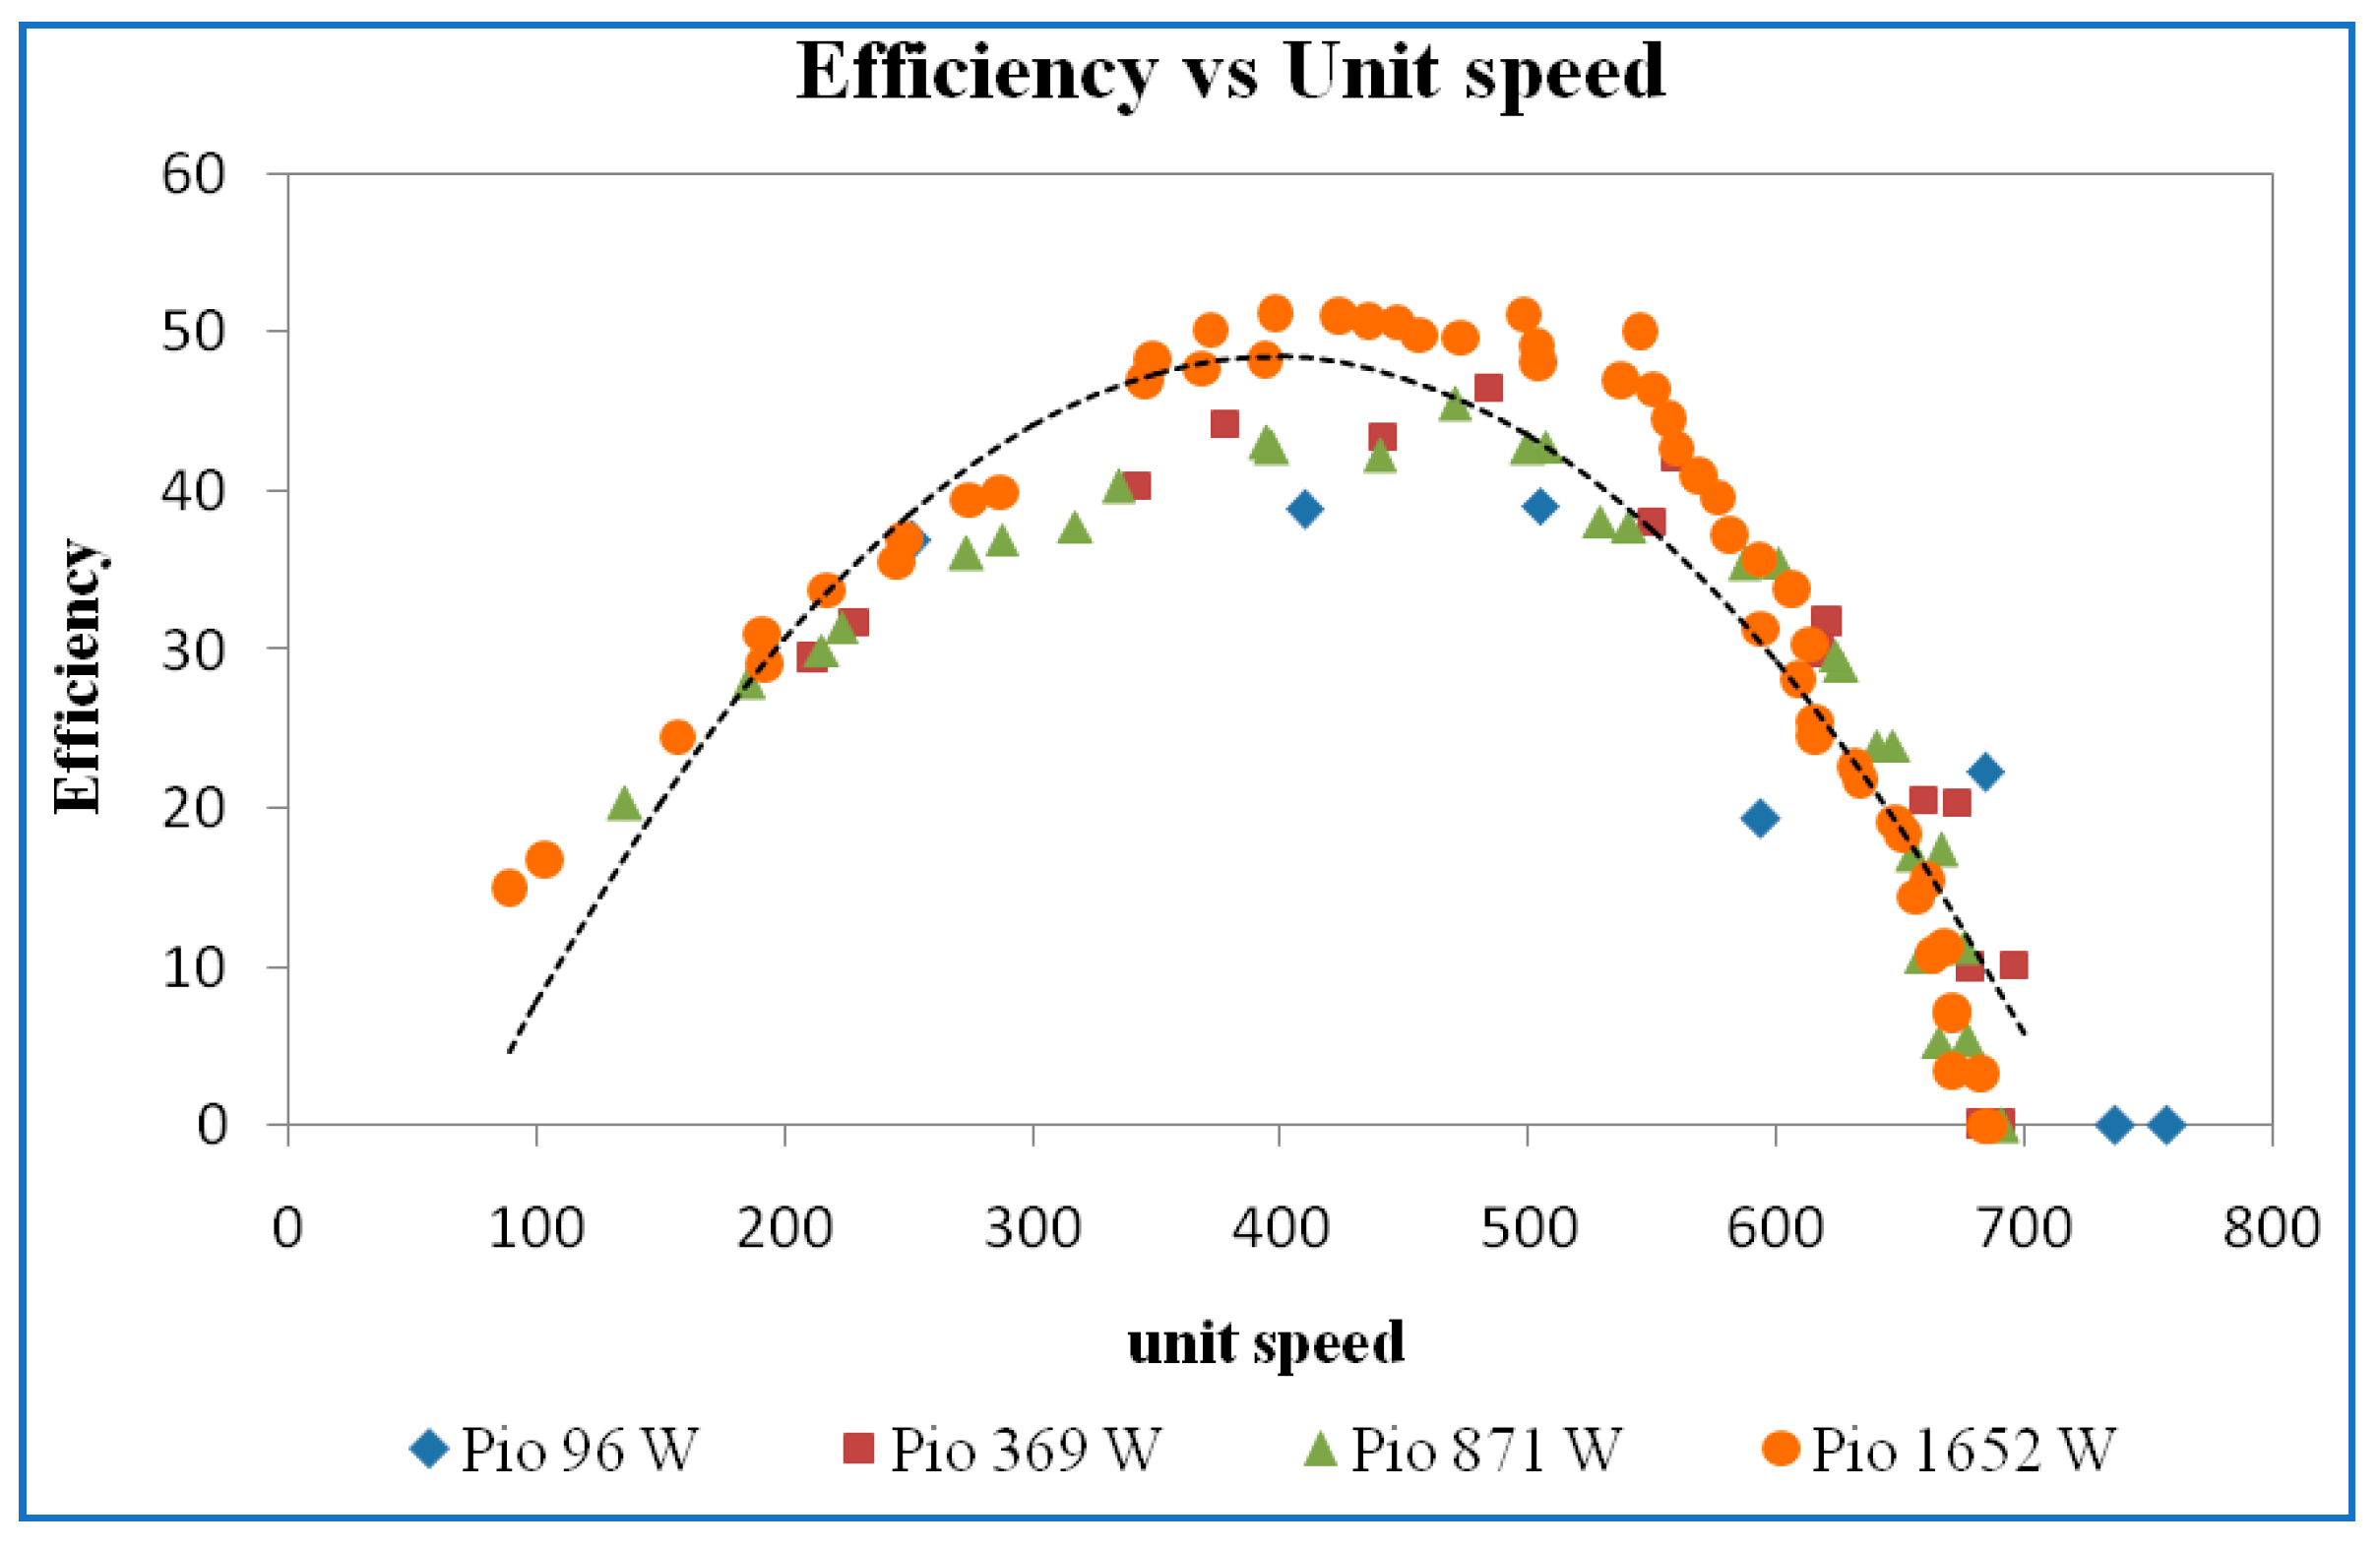
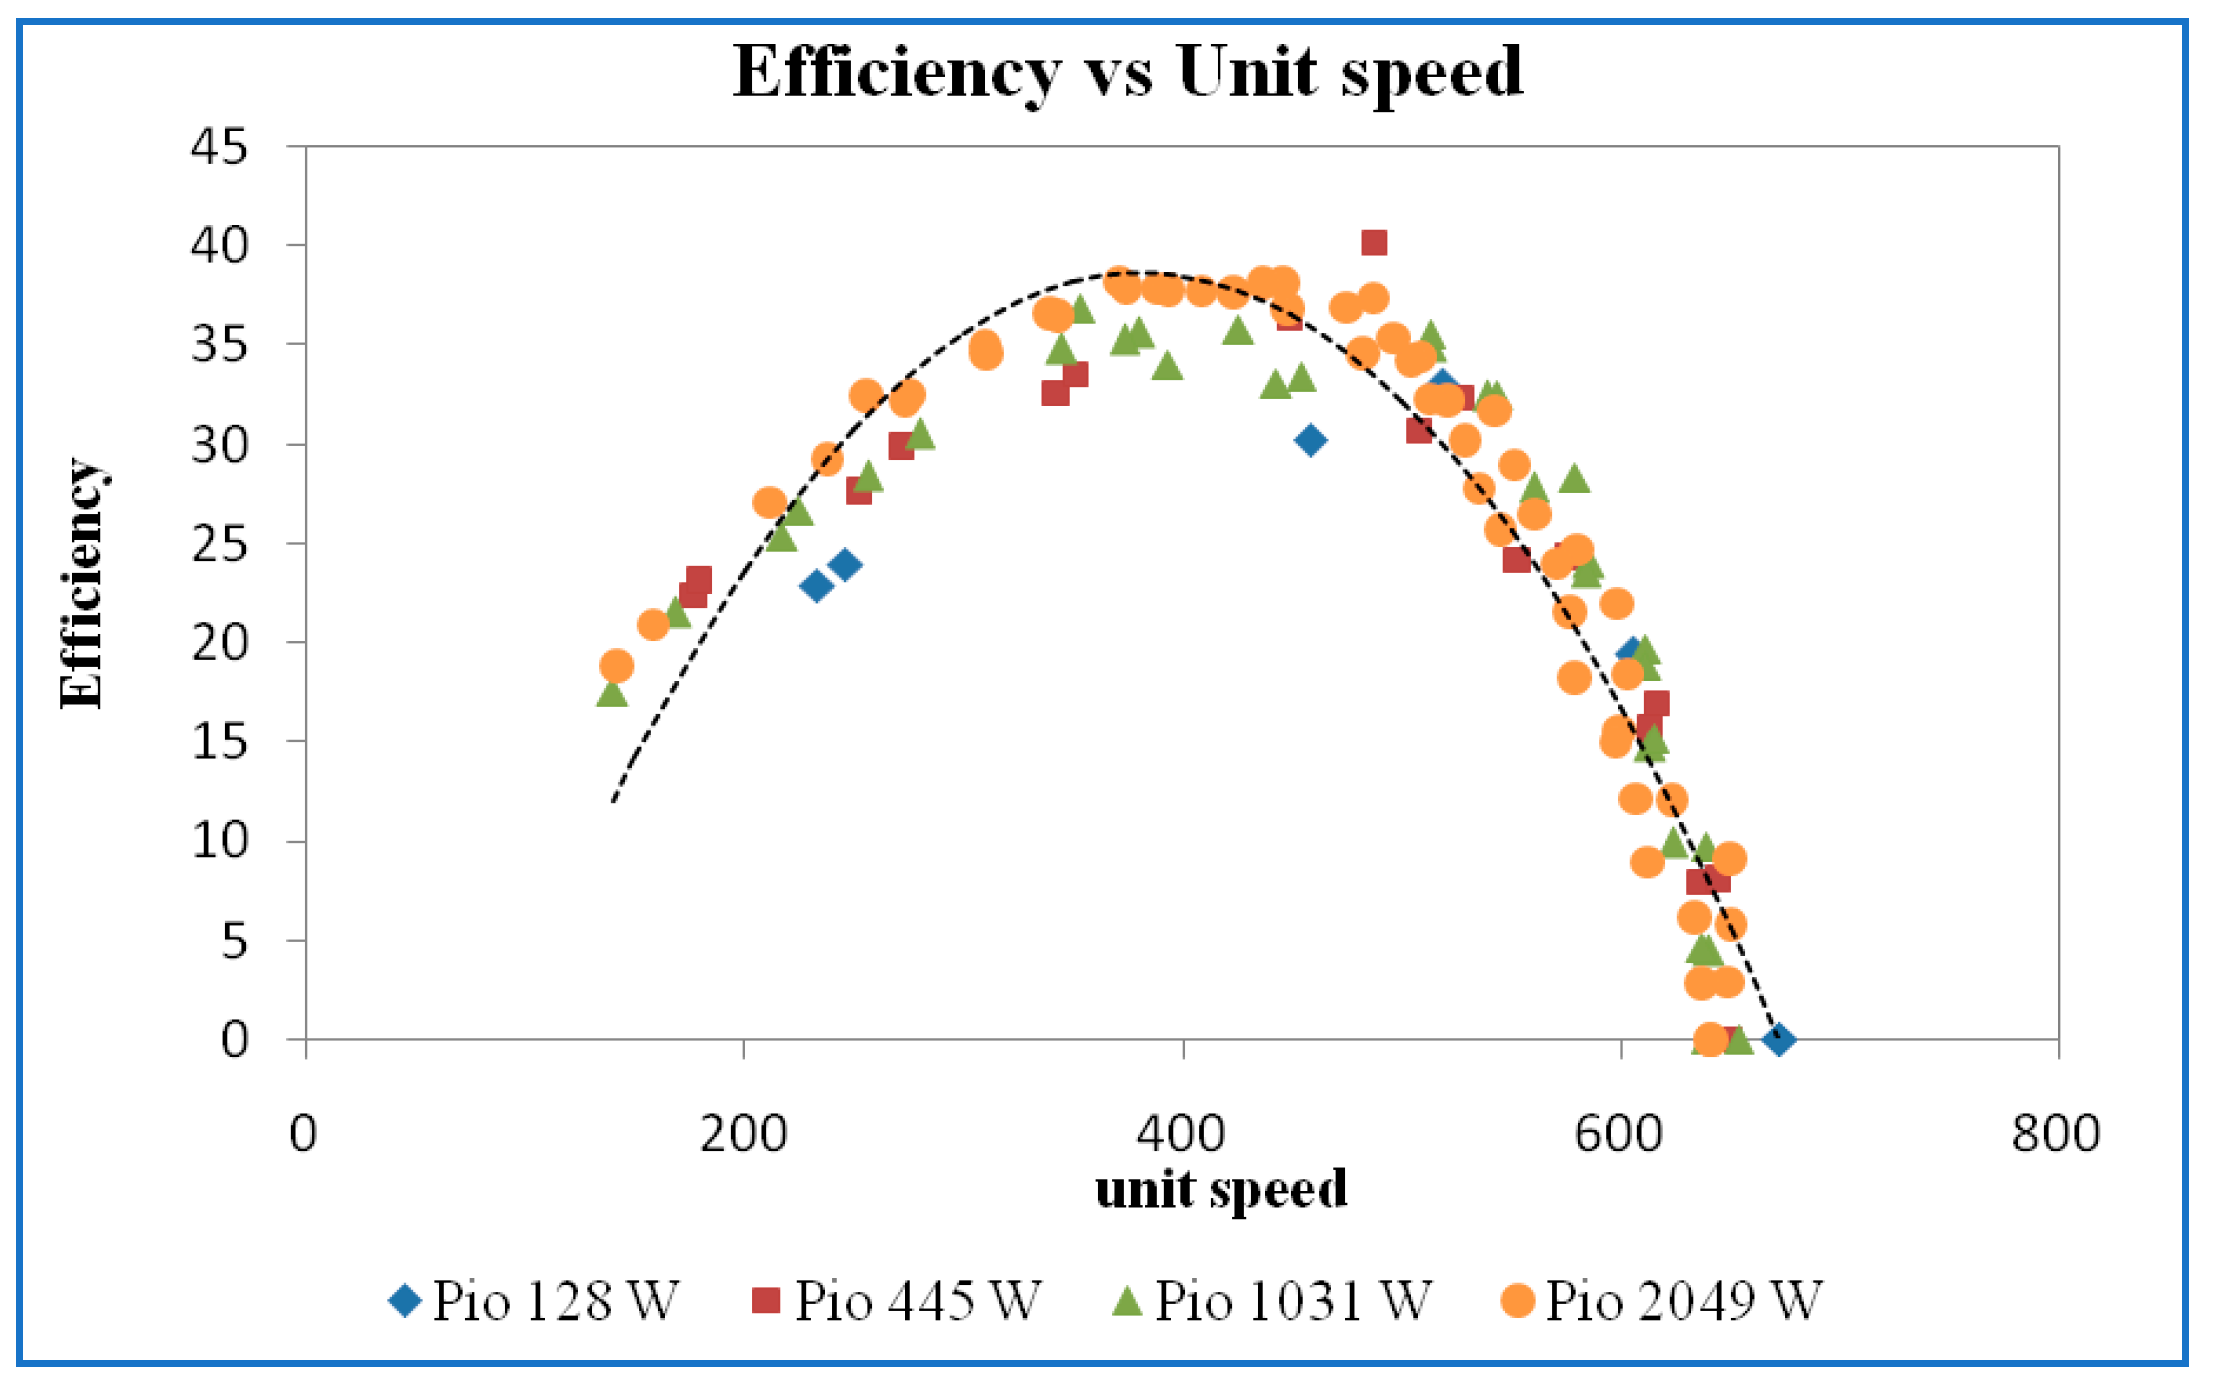
Figure 24 shows that all the best efficiency points with different guide vane openings are plotted in 10 mm guide vane opening. The four best efficiency points combined are intersecting at 930 speed and 11 discharge. They all split at higher discharge and lower discharge. All the discharge curves seem to be constant. As the guide vane opening was varied, there was a variation in the line of best efficiency, as shown in Figure 10. This plot indicates that all these lines merge at speed of 920 rpm.

3.3. Unit Curves

The unit discharge versus unit speed curve is shown in Figure 25. For all trial 1 and trial 2 readings at various input power, the points seem to coalesce, so one universal trend line was drawn for all the data indicating the variation of the unit discharge with respect to unit speed. Compared to characteristic curves of discharge versus speed, the unit discharge decreases with increase in unit speed.
The variation of output power versus unit speed operating at different power inputs is shown in Figure 26. These points form a second-order polynomial curve fit with correlation coefficients near one. The maximum unit output power is found at a unit speed of 396 rpm.
For the 10 mm guide vane opening, the maximum efficiency is obtained for unit speed of 400, as shown in Figure 27. The highest efficiency is about 38%.
For a guide vane opening of 13 mm, the unit discharge versus unit speed curve is shown in Figure 28. The unit discharge decreases with increase in unit speed at this guide vane opening also. When compared to that for 10 mm, the unit discharge increases and decreases with increasing speed.
The variation in unit output power versus unit speed operating at different power inputs is shown in Figure 29. The maximum output power is found at a unit speed of 396 rpm, the same as that at a GVO of 10 mm.
Variation in efficiency versus unit speed is shown in Figure 30. The efficiency gradually increases and decreases. The maximum efficiency is attained at a unit speed of 400 rpm.
For a guide vane opening of 16 mm, the unit discharge versus unit speed curve is shown in Figure 31. The unit discharge decreases with an increase in unit speed.
The variation in unit output power versus unit speed operating at different power inputs is shown in Figure 32. The maximum output power is found at a unit speed of 396 rpm, the same as that at a GVO of 10 mm and 13 mm.
Figure 33 shows that a higher maximum efficiency is obtained at 45% with a guide vane opening of 16 mm. This curve at a unit speed value of 400 rpm attained maximum efficiency.
The unit discharge versus unit speed curve is shown in Figure 34. The unit discharge decreases with increasing unit speed. The unit discharge decreases with increasing unit speed. The unit discharge curve looks similar to GVO of 13 mm, 16 mm, and 19 mm.
The variation in unit output power versus unit speed operating at different power inputs is shown in Figure 35. The maximum output power is found at a unit speed of 400 rpm, the same as that at a GVO of 10 mm, 13 mm, and 19 mm.
Figure 36 shows the variation in efficiency with unit speed for GVO of 19 mm. It shows that the unit speed at BEP is 400 rpm.
Using results obtained for other GVOs, as mentioned in Table 1, variations of unit quantities at the best efficiency point were plotted concerning GVO. The results presented in Figure 37 show the values to be more or less constant for all guide vane openings.

4. Conclusions

In the current work on the best operating point based on unit quantities by studying the performance characteristics of the Francis turbine at various input powers and guide vane openings, the important conclusions are revealed below.
The performance characteristic curves were plotted within the available range of variation of guide vane openings (10 mm to 19 mm) and input power (96 W to 2089 W). From these available data, unit curves were plotted and corresponding best efficiency points obtained. The highest efficiency of 50.25% was obtained at a guide vane opening of 19 mm. The values of head, discharge, speed, and output power at BEP were 7.84 m, 13.55 lps, 1250 rpm, and 524 W, respectively. As per the condition of this Francis turbine, the main reason for not obtaining more than the higher efficiency of 50.25% was leakage flow that passed through the clearance gap between the guide vanes’ high-pressure and low-pressure sides. To determine how much leakage flow there is, finding the velocity vectors inside the gap can be used.

Author Contributions

Conceptualization, M.V.K., T.S.R. and P.S.; methodology, C.R.R., P.S.V. and O.C.S.; software, B.A., Y.A. and A.B.; validation, M.V.K., P.S.V. and C.R.R.; formal analysis, B.A. and Y.A.; investigation M.V.K. and A.B.; resources, M.V.K.; data curation, T.S.R.; writing—original draft preparation, M.V.K. and C.R.R.; writing—review and editing, M.V.K., T.S.R., C.R.R., P.S., P.S.V. and O.C.S.; visualization, Y.A.; supervision, C.R.R.; project administration, C.R.R.; funding acquisition, B.A. All authors have read and agreed to the published version of the manuscript.

Funding

The authors would like to acknowledge the financial support received from the Taif University Researchers Supporting Project (TURSP-2020/278), Taif University, Taif, Saudi Arabia.

Institutional Review Board Statement

Not applicable.

Informed Consent Statement

Not applicable.

Data Availability Statement

Not applicable.

Conflicts of Interest

The authors declare no conflict of interest.

References

  1. Logan, E., Jr. Turbomachinery: Basic Theory and Applications; CRC Press: Boca Raton, FL, USA, 1993; Available online: https://books.google.co.in/books?hl=en&lr=&id=s4Qfa1AWGGkC&oi=fnd&pg=PR5&dq=1.%09Logan+Jr,+Earl.+Turbomachinery:+Basic+theory+and+applications (accessed on 25 June 2022).
  2. Yannopoulos, S.I.; Lyberatos, G.; Theodossiou, N.; Li, W.; Valipour, M.; Tamburrino, A.; Angelakis, A.N. Evolution of Water Lifting Devices (Pumps) over the Centuries Worldwide. Water 2015, 7, 5031–5060. [Google Scholar] [CrossRef]
  3. Reynolds, T.S. Stronger than a Hundred Men: A History of the Vertical Water Wheel; No. 7; JHU Press: Baltimore, MD, USA, 1983. [Google Scholar]
  4. Pang, J.; Liu, H.; Liu, X.; Yang, H.; Peng, Y.; Zeng, Y.; Yu, Z. Study on sediment erosion of high head Francis turbine runner in Minjiang River basin. Renew. Energy 2022, 192, 849–858. [Google Scholar] [CrossRef]
  5. Zhang, W.; Zhu, B.; Yu, Z.; Yang, C. Numerical study of pressure fluctuation in the whole flow passage of a low specific speed mixed-flow pump. Adv. Mech. Eng. 2017, 9, 1687814017707651. [Google Scholar] [CrossRef]
  6. Gatte, M.T.; Rasim, A.K. Hydro Power. Energy Conserv. 2012, 9, 95–124. Available online: https://books.google.co.in/books?hl=en&lr=&id=DASaDwAAQBAJ&oi=fnd&pg=PA95&dq=Gatte,+Mohammed+Taih,+and+Rasim+Azeez+Kadhim.+%22Hydro+power (accessed on 30 June 2022).
  7. Norquest, P.E. Ambient Pressure Water Turbine. U.S. Patent No. 4,416,584, 22 November 1983. Available online: https://patents.google.com/patent/US4416584A/en (accessed on 7 July 2022).
  8. Choi, H.-J.; Zullah, M.A.; Roh, H.-W.; Ha, P.-S.; Oh, S.-Y.; Lee, Y.-H. CFD validation of performance improvement of a 500 kW Francis turbine. Renew. Energy 2013, 54, 111–123. [Google Scholar] [CrossRef]
  9. Kurosawa, S.; Lim, S.M.; Enomoto, Y. Virtual model test for a Francis turbine. In IOP Conference Series: Earth and Environmental Science; IOP Publishing: Bristol, UK, 2010; Volume 12. [Google Scholar]
  10. Sahu, R.K.; Gandhi, B.K. Erosive flow field investigation on guide vanes of Francis turbine—A systematic review. Sustain. Energy Technol. Assess. 2022, 53, 102491. [Google Scholar]
  11. Li, G.; Ma, F.; Guo, J.; Zhao, H. Case Study of Roadway Deformation Failure Mechanisms: Field Investigation and Numerical Simulation. Energies 2021, 14, 1032. [Google Scholar] [CrossRef]
  12. Kamal, M.; Abbas, A.; Prasad, V.; Kumar, R. A numerical study on the performance characteristics of low head Francis turbine with different turbulence models. Mater. Today Proc. 2021, 49, 349–353. [Google Scholar] [CrossRef]
  13. Shigemitsu, T.; Fukutomi, J.; Kaji, K. Influence of Blade Outlet Angle and Blade Thickness on Performance and Internal Flow Conditions of Mini Centrifugal Pump. Int. J. Fluid Mach. Syst. 2011, 4, 317–323. [Google Scholar] [CrossRef]
  14. Koirala, R.; Zhu, B.; Neopane, H.P. Effect of Guide Vane Clearance Gap on Francis Turbine Performance. Energies 2016, 9, 275. [Google Scholar] [CrossRef]
  15. Koirala, R.; Thapa, B.; Neopane, H.P.; Zhu, B.; Chhetry, B. Sediment erosion in guide vanes of Francis turbine: A case study of Kaligandaki Hydropower Plant, Nepal. Wear 2016, 362–363, 53–60. [Google Scholar] [CrossRef]
  16. Koirala, R.; Neopane, H.P.; Zhu, B.; Thapa, B. Effect of sediment erosion on flow around guide vanes of Francis turbine. Renew. Energy 2019, 136, 1022–1027. [Google Scholar] [CrossRef]
  17. Thapa, B.S.; Trivedi, C.; Dahlhaug, O.G. Design and development of guide vane cascade for a low speed number Francis turbine. J. Hydrodyn. 2016, 28, 676–689. [Google Scholar] [CrossRef]
  18. Chitrakar, S.; Dahlhaug, O.G.; Neopane, H.P. Numerical investigation of the effect of leakage flow through erosion-induced clearance gaps of guide vanes on the performance of Francis turbines. Eng. Appl. Comput. Fluid Mech. 2018, 12, 662–678. [Google Scholar] [CrossRef]
  19. Amedei, A.; Meli, E.; Rindi, A.; Romani, B.; Pinelli, L.; Vanti, F.; Arnone, A.; Benvenuti, G.; Fabbrini, M.; Morganti, N. Innovative design, structural optimization and additive manufacturing of new-generation turbine blades. Turbo Expo: Power for Land, Sea, and Air. Am. Soc. Mech. Eng. 2020, 84089, V02CT35A004. [Google Scholar] [CrossRef]
  20. Sosilo, A.K.; Hadi, H.; Soehartanto, T. Design of Hydro Power by Using Turbines Kaplan on The Discharge Channel Paiton 1 and 2. E3S Web Conf. 2018, 42, 01008. [Google Scholar] [CrossRef]
  21. Weili, L.; Jinling, L.; Xingqi, L.; Yuan, L. Research on the cavitation characteristic of Kaplan turbine under sediment flow condition. IOP Conf. Ser. Earth Environ. Sci. 2010, 12, 012022. [Google Scholar] [CrossRef]
  22. Ma, Y.; Qian, B.; Feng, Z.; Wang, X.; Shi, G.; Liu, Z.; Liu, X. Flow behaviors in a Kaplan turbine runner with different tip clearances. Adv. Mech. Eng. 2021, 13, 16878140211015879. [Google Scholar] [CrossRef]
Figure 1. The Francis turbine test setup.
Energies 15 06798 g001
Figure 2. Schematic of Francis turbine test setup.
Energies 15 06798 g002
Figure 3. Rectangular notch.
Energies 15 06798 g003
Figure 4. Discharge vs. speed at a guide vane opening of 10 mm.
Energies 15 06798 g004
Figure 5. Head vs. speed at a guide vane opening of 10 mm.
Energies 15 06798 g005
Figure 6. Torque vs. speed at a guide vane opening of 10 mm.
Energies 15 06798 g006
Figure 7. Efficiency vs. speed at a guide vane opening of 10 mm.
Energies 15 06798 g007
Figure 8. Head vs. speed at a guide vane opening of 10 mm.
Energies 15 06798 g008
Figure 9. Torque vs. speed at a guide vane opening of 10 mm.
Energies 15 06798 g009
Figure 10. Efficiency vs. speed at a guide vane opening of 10 mm.
Energies 15 06798 g010
Figure 11. Discharge vs. speed and iso-efficiency line at 10 GVO.
Energies 15 06798 g011
Figure 12. Head vs. speed at a guide vane opening of 13 mm.
Energies 15 06798 g012
Figure 13. Torque vs. speed at a guide vane opening of 13 mm.
Energies 15 06798 g013
Figure 14. Efficiency vs. speed at a guide vane opening of 13 mm.
Energies 15 06798 g014
Figure 15. Discharge vs. speed and iso-efficiency line at 13 GVO.
Energies 15 06798 g015
Figure 16. Head vs. speed at a guide vane opening of 16 mm.
Energies 15 06798 g016
Figure 17. Torque vs. speed at a guide vane opening of 16 mm.
Energies 15 06798 g017
Figure 18. Efficiency vs. speed at a guide vane opening of 16 mm.
Energies 15 06798 g018
Figure 19. Discharge vs. speed and iso-efficiency line at 16 GVO.
Energies 15 06798 g019
Figure 20. Head vs. speed at a guide vane opening of 19 mm.
Energies 15 06798 g020
Figure 21. Torque vs. speed at a guide vane opening of 19 mm.
Energies 15 06798 g021
Figure 22. Efficiency vs. speed at a guide vane opening of 19 mm.
Energies 15 06798 g022
Figure 23. Discharge vs. speed and iso-efficiency line at 19 GVO.
Energies 15 06798 g023
Figure 24. Discharge vs. speed for best efficiency point at 10 mm GVO.
Energies 15 06798 g024
Figure 25. Unit discharge vs. unit speed at a guide vane opening of 10 mm.
Energies 15 06798 g025
Figure 26. Unit output power vs. unit speed at a guide vane opening of 10 mm.
Energies 15 06798 g026
Figure 27. Efficiency vs. unit speed at a guide vane opening of 10 mm.
Energies 15 06798 g027
Figure 28. Unit discharge vs. unit Speed at a guide vane opening of 13 mm.
Energies 15 06798 g028
Figure 29. Unit output power vs. unit speed at a guide vane opening of 13 mm.
Energies 15 06798 g029
Figure 30. Efficiency vs. unit speed at a guide vane opening of 13 mm.
Energies 15 06798 g030
Figure 31. Unit discharge vs. unit speed at a guide vane opening of 16 mm.
Energies 15 06798 g031
Figure 32. Unit output power vs. unit speed at a guide vane opening of 16 mm.
Energies 15 06798 g032
Figure 33. Efficiency vs. unit speed at a guide vane opening of 16 mm.
Energies 15 06798 g033
Figure 34. Unit discharge vs. unit speed at a guide vane opening of 19 mm.
Energies 15 06798 g034
Figure 35. Unit output power vs. unit speed at a guide vane opening of 19 mm.
Energies 15 06798 g035
Figure 36. Efficiency vs. unit speed at a guide vane opening of 19 mm.
Energies 15 06798 g036
Figure 37. BEP unit quantities vs. GVO.
Energies 15 06798 g037
Table 1. Best efficiency points from characteristics of Francis turbine.
S. NoGuide Vane Opening
GVO (mm)
Speed
N (rpm)
Discharge
Q (lps)
Head Given to Turbine
H (m)
Brake Output Power (W)Power Input to the Turbine (W)Efficiency
(%)
1106006.021.3125.0877.4432.39
27008.772.8288.15242.8636.30
3100011.835.58239.34647.3336.97
4125014.899.68537.681414.1438.02
5134505.861.0920.9062.8933.24
67008.922.8192.36245.7937.58
795011.065.39236.09584.5540.39
8130015.149.61558.151427.6939.09
9164505.471.1420.5761.3333.54
106508.492.4778.64205.5138.27
1195011.294.67220.64517.2642.66
12125013.948.29522.941134.0446.11
13193505.470.9119.9948.8940.88
147008.402.2585.26185.5745.94
1590011.384.19209.13468.1544.67
16125013.557.84524.001042.7950.25
Publisher’s Note: MDPI stays neutral with regard to jurisdictional claims in published maps and institutional affiliations.

