Article

Determining the Availability of Continuous Systems at Open Pits Applying Fuzzy Logic

by
Miljan Gomilanovic
1,*,
Milos Tanasijevic
2 and
Sasa Stepanovic
1
1
Mining and Metallurgy Institute Bor, 19210 Bor, Serbia
2
Faculty of Mining and Geology Belgrade, University of Belgrade, 11000 Belgrade, Serbia
*
Author to whom correspondence should be addressed.
Energies 2022, 15(18), 6786; https://doi.org/10.3390/en15186786
Submission received: 27 July 2022 / Revised: 25 August 2022 / Accepted: 5 September 2022 / Published: 16 September 2022

Abstract

:
This work presents a model for determining the availability of continuous systems at open pits by applying fuzzy logic and fuzzy inference systems. The applied model was formed by the synthesis of independent partial indicators of availability. The model is based on an expert system for assessing the availability of continuous mining systems. The availability of the system, as a complex state parameter, is decomposed into the partial indicators, reliability, and convenience of maintenance, and the fuzzy compositions, used for integration the partial indicators, are the max–min and min–max compositions. The advantage of this model in comparison to the conventional models is that it takes into account the effect of practical indicators of availability, does not require long-term monitoring, and records necessary to determine the time picture of the system state. This model for determining the availability has a role to help responsible persons at open pits in the planning and control of exploitation, and the adoption of an appropriate maintenance strategy, all with the aim of stable production and cost reduction. The presented model can be used as a tool for the quick assessment of system availability, based on expert judgments and assessments.

1. Introduction

Continuous systems are used at the open pits of the PE Electric Power Industry of Serbia for coal and waste excavation. These are high-capacity complex mining systems whose operation is crucial for the reliable supply of coal to thermal power plants [1]. Specifically, this work presents a model that predicts the availability of the I ECC (bucket wheel excavator–conveyor–crushing plant) system of the open pit, Drmno–Kostolac, based on the fuzzy model. This work deals with the development of a model for predicting the availability of continuous systems at open pits by applying fuzzy logic, more precisely the max–min and min–max compositions. The main idea of this work is the expert assessment of partial indicators that affect the availability and their synthesis in order to determine the availability of continuous systems with the help of fuzzy models.
Availability is one of the most commonly used terms in maintenance engineering. This concept is used to denote the quality of service of an engineering system, i.e., machine, analysis of weak points, asset management, as well as decision-making in the management process of life cycle [1].
Availability is a function of time, the change of which can be followed during the aging of a technical system. It refers to the total time, including the storage time of the technical system. There is a difference in the nature of putting the technical system into operation, depending on whether the technical system was used or was in storage before putting it into operation. When the technical system is in use, its condition is known so that there are no additional uncertainties when it is put into operation. If the technical system was in storage, its condition is unknown, and the possibility of being included in operation is uncertain [2,3].
The theory of fuzzy sets, and fuzzy logic in general, is a conceptual mathematical tool for modeling various processes dominated by uncertainty, multidimensionality, subjectivity, and indeterminacy [4].
Fuzzy logic is a generalization of “classical logic” and allows the use of notions of partial truth. Interval [0,1] is used instead of set {0,1}.
The concept of fuzzy logic forms the basis of fuzzy systems and relies on the idea that there is no distinct need for precision. In 1965, Zadeh presented and mathematically described fuzzy logic in the paper “Fuzzy sets” [5]. When observing a complex technical system in real-time, it is often not possible to collect and present all the data, and in such circumstances, the application of fuzzy logic is preferred [1].
Fuzzy logic is acceptable as an efficient, understandable, easily adaptable, and manipulatively simple mathematical tool, equally applicable for augmented and real-time decision support. Fuzzy logic can be powerful, but it is not an all-powerful tool in the hands of an engineer. The results of the application do not depend on the potential of fuzzy logic, but on the success of connection with the real problem. The knowledge of the user has a dominant position in this [6].

1.1. Literature Review

In the literature, the development of a systemic approach to the evaluation of parameters of the quality of service of engineering systems is a widely present topic. The authors deal with the selection of an overall concept that comprehensively looks at the operational parameters, maintenance, and their impact on the lifetime of a machine. Concepts are predominantly synthetic and hybrid in nature. In the development of an evaluation model, the choice of a suitable conceptual and mathematical model for the composition of partial parameters of usable quality is a special issue. Some examples from the literature are given below.
Miodragovic et al., in the paper “Effectiveness Assessment of Agricultural Machinery Based on the Fuzzy Sets Theory” [7], provide the concept of effectiveness of agricultural machinery, due to the evident need to define indicators of the usability quality of these machines, in order to determine the optimality of the machines for different operation conditions. The concept of effectiveness, given in this paper, represents one of the synthetic indicators of the usability quality of technical systems. The effectiveness model was formed applying the theory of fuzzy logic. The partial indicators, included in this paper, are the partial indicators of reliability, ease of maintenance, and functionality. A tractor effectiveness assessment model was created. It is based on the integration of linguistic descriptions of partial indicators applying the fuzzy theory and max–min composition. The model was tested on an example of three tractors of the same category.
Tanasijevic et al., in the paper “Study of Dependability Evaluation for Multi-hierarchical Systems Based on the MaxMin Composition” [8], provide a model of security in functioning the complex technical systems that includes the partial indicators of reliability, convenience of maintenance, and logistic support for maintenance. The model was developed starting from the position that a correct understanding of the usability quality of any technical system is important to define the performance of safety of functioning at the level of individual components as well as at the higher levels—subsystem levels and the entire system. Indicators of safety of functioning are defined as the linguistic variables. To determine the safety of functioning and their integration, the phase max–min composition was applied. A concept for synthesizing the safety performance of functioning the individual components to the upper levels in a complex technical system is proposed.
In the paper “Development of the Availability Concept Using the Fuzzy Theory with the AHP Correction, A Case Study: Bulldozers in the Open-Pit Lignite Mine” [1], the authors formed a model for defining the availability of auxiliary machinery that relies on fuzzy theory and the multi-criteria method in evaluating the AHP. The basis of the paper is the expert assessment of the formed indicators that enter the availability structure. In this paper, the availability structure is constructed in the form of three indicators that have a direct impact, namely: reliability, maintainability, and supportability. The assessment included the evaluation of four experts, who evaluated each of the three analyzed machines in the area of three previously defined indicators by assigning the grades-linguistic variables (A—the best grade; E—the worst grade) that have their own functions of class membership. The analysts made decisions on ratings on the basis of a given descriptive description of the machine’s behavior. The analysis was done for two states of the machines, when they were used for 2 years (the new, i.e., in the warranty period) and when they were used for seven years (the old, i.e., before scrapping). The authors used the obtained data on the expert opinion to form a fuzzy model with the max–min composition. The sequence of activities in the model is based on the entry of the ratings of the experts, followed by the identification, composition, fuzzification, and, finally, defuzzification to obtain the final numerical values. The AHP method was used for the mutual ranking of indicators (R, M; S) according to the importance of the availability structure for the considered machine at a defined moment.
Ivezic et al., in the paper “A Fuzzy Expert Model for Availability Evaluation” [9], analyze the concept of availability of the mining machines. The basic principles of this concept imply that every technical system carries a great potential risk of possible failure and damage, especially the mining machines characterized by the high investment values, costs of unplanned downtime, complex working conditions, and danger to the workers and environment. An expert fuzzy model was formed that analyzes and integrates the reliability, convenience of maintenance, and functionality of three types of bulldozers working in the coal (lignite) mines. Based on the assessment results, a comparison of bulldozers was made. Conclusions were given that can be useful for improving the convenience of maintenance and logistics, and during the purchase of new machines.
Jagodic, Tanasijevic, and Vujic, in the papers “Fuzzy Logic Model of Safety Assessment of Functioning the Mechanization at the Open Pits” [10] and “Application of the Fuzzy Logic Modeling in Assessment the Safety of Functioning the Mechanization at the Open Pits” [11], formed a mathematical–conceptual model for assessing the safety of functioning of the auxiliary mechanization machines at the lignite open pits that enables the analysis and structuring of the partial indicators of reliability, convenience of maintenance, and logistic support for maintenance, and their synthesis to the level of safety of functioning. Functional safety is defined as the most complete term for describing the availability of a technical system, as a measure of its usable quality. The fuzzy logic theory has been applied as a suitable apparatus for computing with the hybrid data that gives a synergistic effect. The created operational safety model can be briefly described through the following stages: operational safety proposition and partial indicators, fuzzification of the input data, fuzzy composition of partial indicators into the overall operational safety assessment, and identification (defuzzification) of the overall operational safety assessment. The results of the evaluation model of the safety of functioning and indicators of the dozer work point out the necessary correction of machinery management, primarily to the maintenance policy, identification and diagnosis of defects, critical failures, etc.
Jovancic et al. [12], in the paper “Applying the Fuzzy Inference Model in Maintenance Centered to Safety: Case Study—Bucket Wheel Excavator”, as the main idea of this work promote the safety-centered maintenance in accordance with the adaptive fuzzy inference model, which has online adaptation to the working conditions. The input parameters for this model are the service quality indicators of the analyzed engineering system: reliability, maintenance convenience, consequences, severity, and observability of failure.
Polovina et al. [13], in the paper “Evaluation of the Remaining Working Possibilities of a Rotary Excavator Using the Method of Applied Expert Assessment with an Empirical Correction Factor”, present the concept of the assessment of rotary excavators based on the expert evaluation. At the same time, the assessment can be called a process that is the result of the synthesis of knowledge and experience, which are again the result of either performed measurements, analysis of statistically processed data about the time spent in work or downtime, or direct expert assessment. At the same time, the assessment refers to a specific moment and should predict the safety of functioning for the next period of work. This model is an effective mathematical model for assessing the serviceability of the rotary excavator, evaluating its remaining working capabilities and potential revitalization effects. The model uses the settings promoted by the multi-criteria analysis models with the multi-attribute evaluation and models based on the application of fuzzy set theory and fuzzy algebra.
In this paper, the modeling of the ECC (bucket wheel excavator–conveyors–crushing plant) system availability was performed using fuzzy logic. The ECC system is a complex system with hierarchical and line structures that includes equipment with different characteristics and purposes, different behavior in time, and different needs for exploitation and maintenance. The work of an ECC system is characterized by a high risk of consequences for the energy system; thus, availability, as an umbrella term, is taken as an indicator of its behavior. In addition, each of the components of the ECC system is a complex technical system. The proposed hypothesis is that for such systems, the consideration of a larger number of partial indicators contributes to the quality of model and that by considering them, a realistic picture of the ECC system availability can be obtained. This is an important difference from the considerations given in the mentioned papers, which were mainly related to a specific machine. In the papers which discussed complex technical systems, a system consisting of a large number of elements with different constructions and functions was not considered.
Novelty is the application of two types of compositions (max–min and min–max composition) of values of partial indicators and uses a combination of partial indicator values to obtain system availability.

1.2. Continuous Systems of Open Pit Mining

Continuous systems of open pit mining are systems where the flow of material is continuous. They are characterized by excavation during the entire work cycle, in contrast to the discontinuous ones, where only a part of the time of one cycle is spent on excavation. This feature is provided by the possibility of continuous excavation machines to excavate and unload the excavated material continuously, instead of in cycles. The mechanization that is applied is very complex and most often made according to the special requirements, because the continuous systems must be adapted to the specific working conditions [14].
Continuous systems can contain more excavators, produce more products or run-of-mine materials; they are very complex and reflect a strong interdependence between the factors [15]. Based on a long-term monitoring and development of the lignite open pits, it has been proven that the continuous systems with the rotary excavators and belt conveyors are the most efficient loading and transport system for these needs [16].
Surface exploitation is often associated with uncertainty due to variable natural, technical and human factors. Technical factors such as grade distribution, ground conditions, and equipment reliability, especially with complex mining systems, influence the performance of a mining production system. Uncertainty associated with natural, technical, and human factors often leads to significant output differing from what was planned. Therefore, an in-depth analysis of the important causes of deviations from the planned outcomes is relevant [17]. This uncertainty can lead to potentially large consequences for the work, economy, and environment due to accidental situations.
According to [18], an hour of unplanned downtime at the open pits of the PE Electric Power Industry of Serbia creates costs from 3000 to 10,000 €.
Figure 1 shows the open pit Drmno–Kostolac.

1.3. I ECC System at the Open Pit Drmno

The following equipment is used for coal excavation, transport, and crushing on the I ECC system of the open pit Drmno:
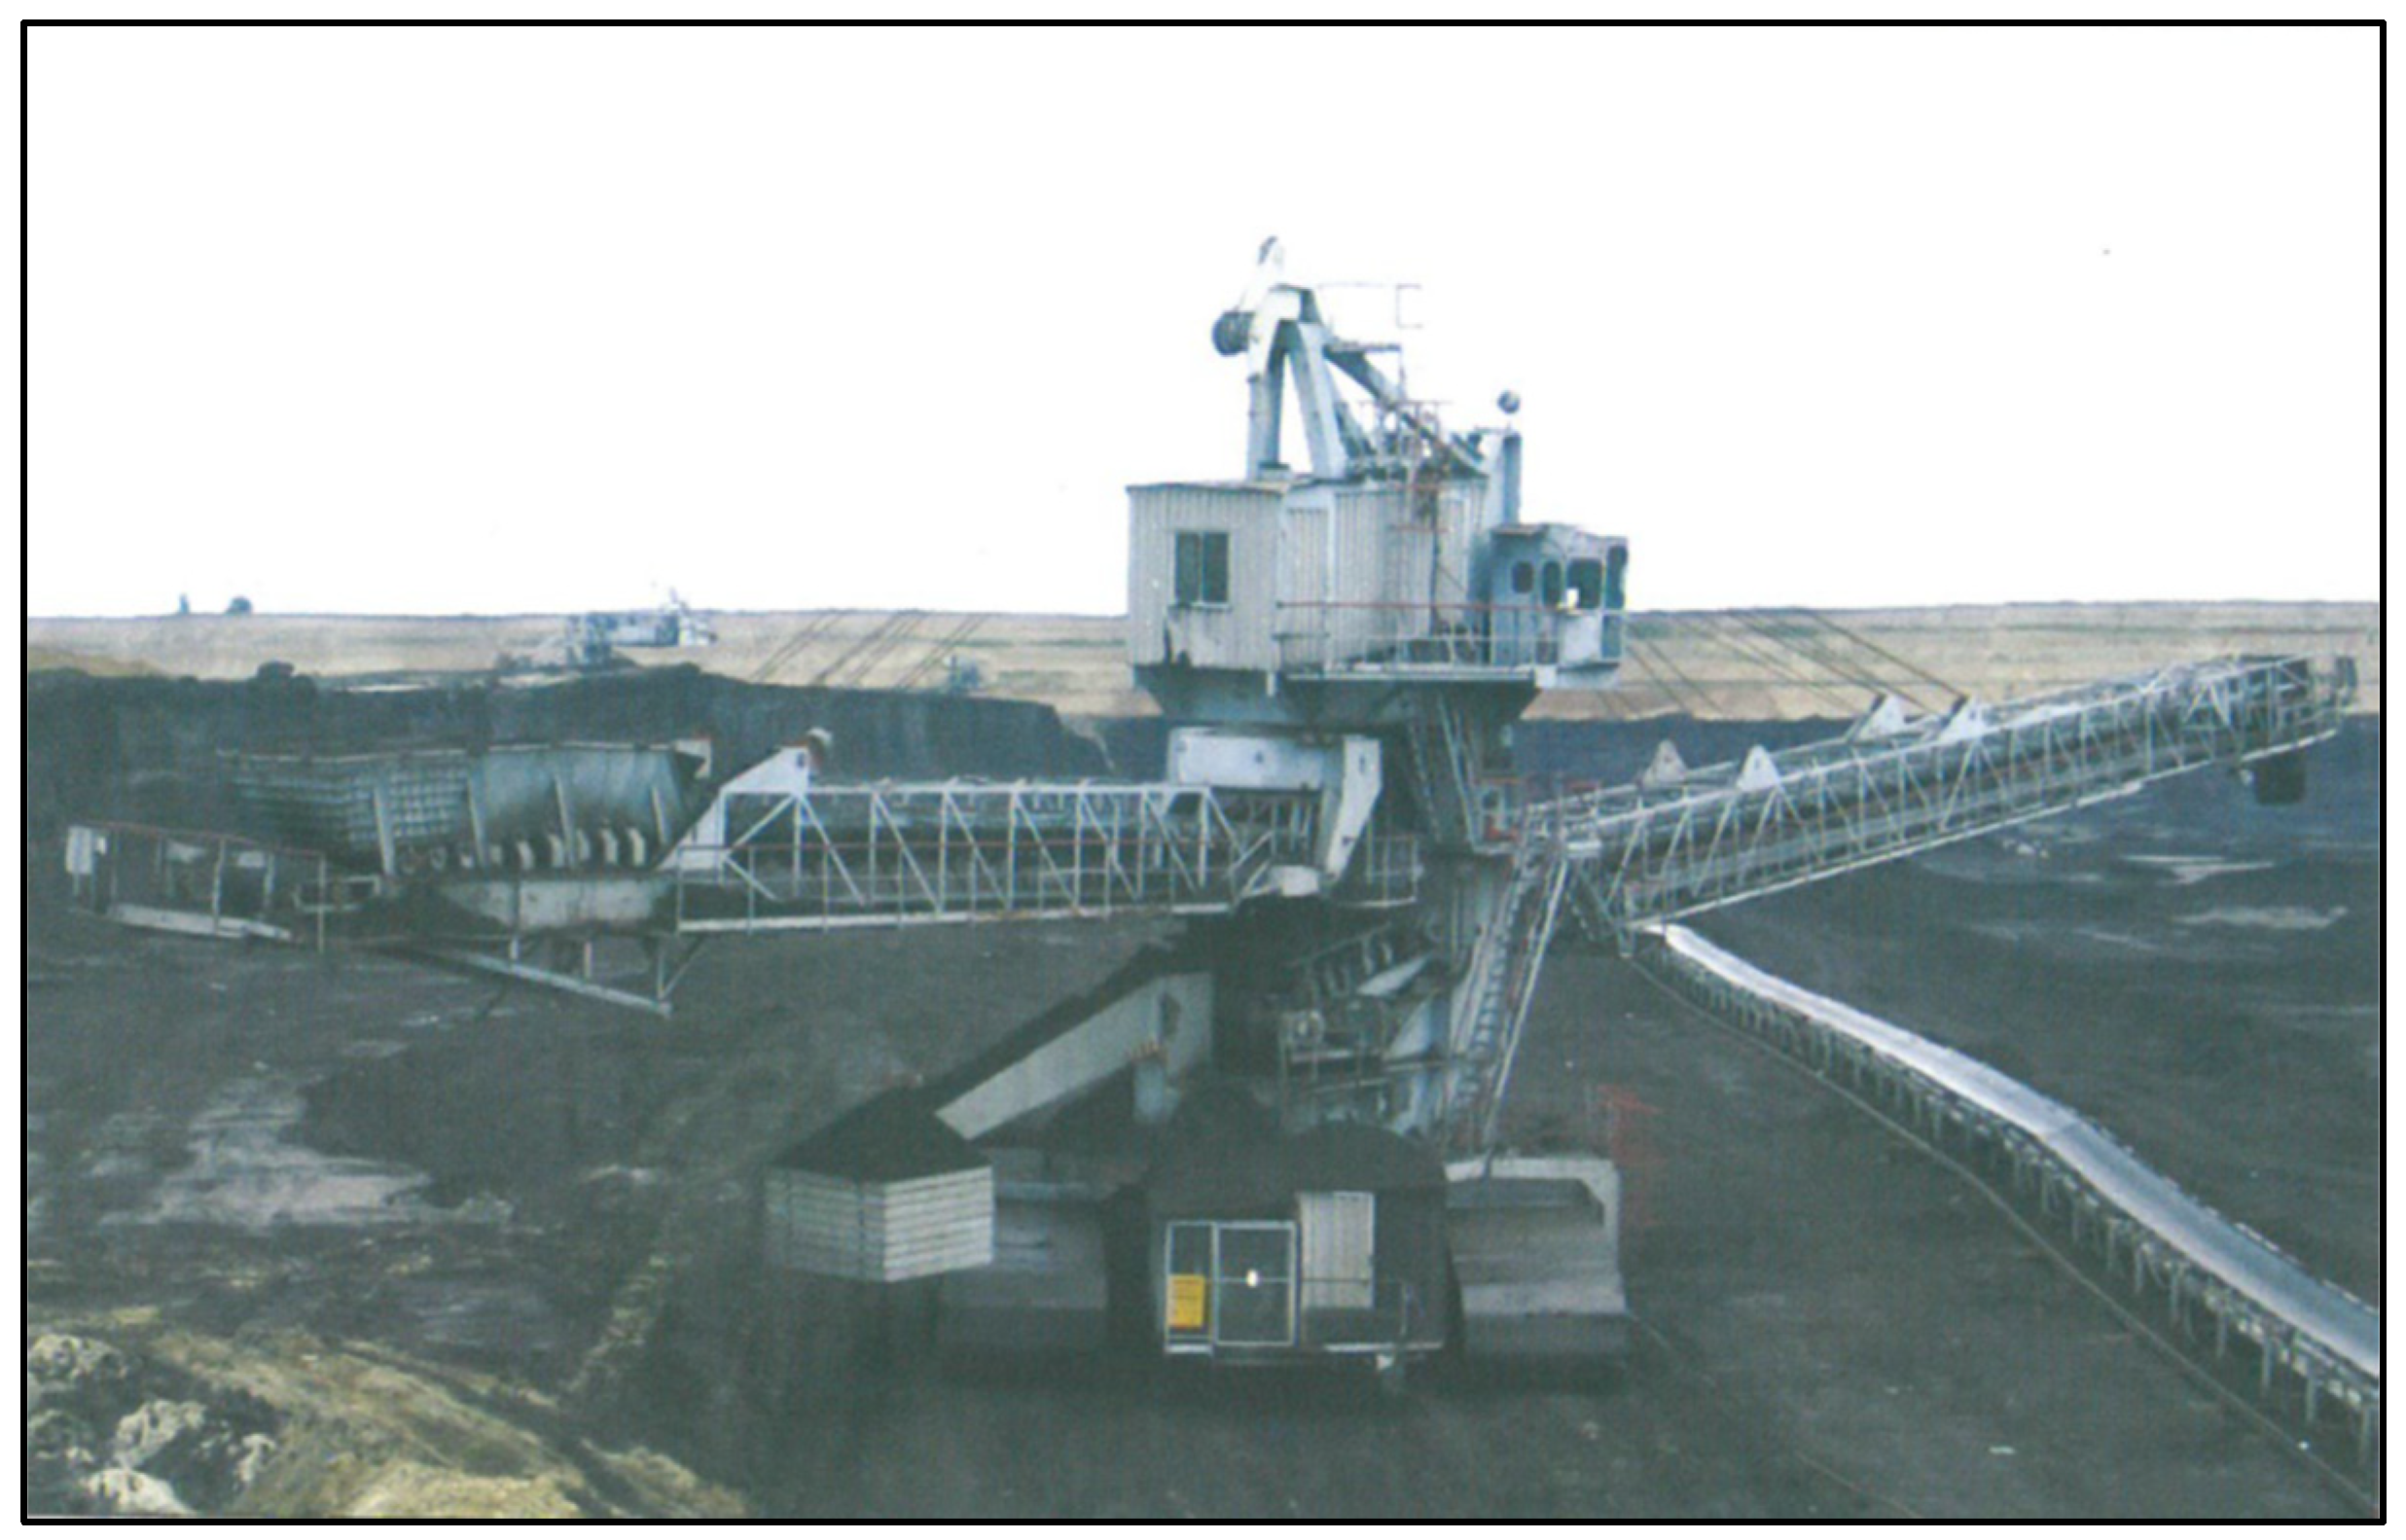
  • Bucket wheel excavator (BWE) SRs 400.14/1.5 (Figure 2)
  • Beltwagon BRs 2400 (Figure 3)
  • Belt conveyors
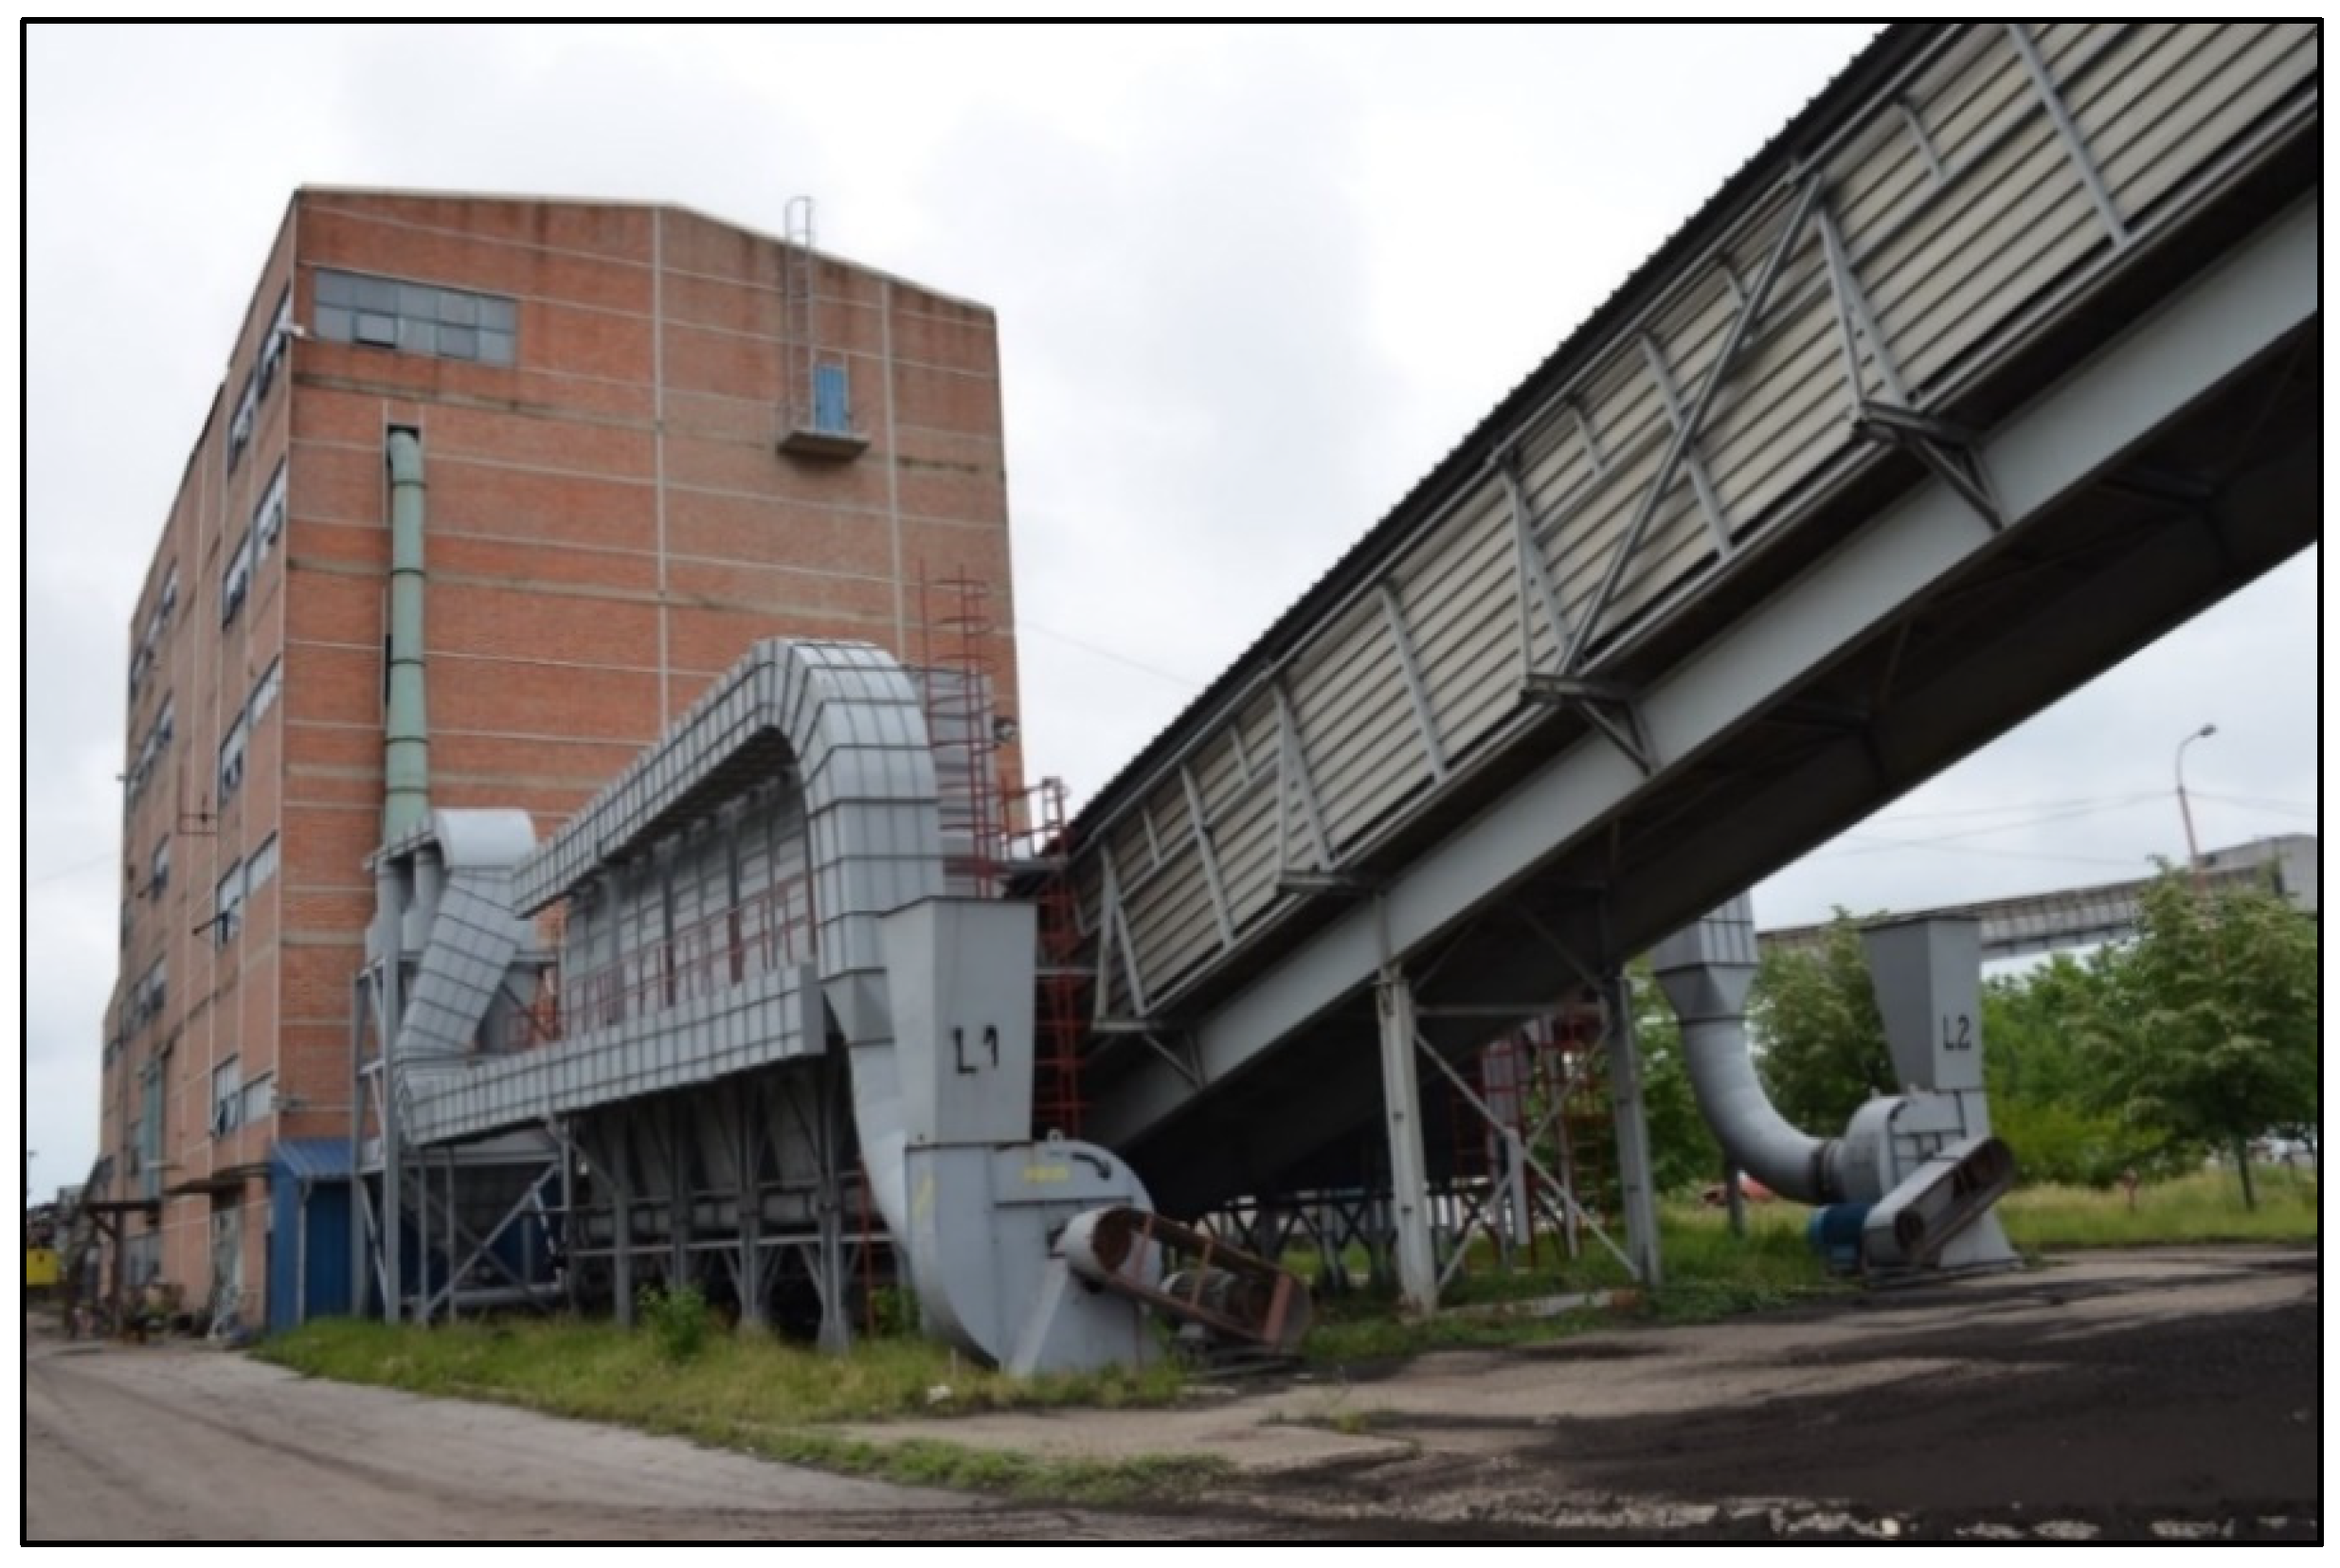
  • Crushing plant (Figure 4)

2. Materials and Methods

2.1. Availability

The availability is calculated on the basis of a time state picture, in which the times when the system is up alternate with the times when the system is down. The time picture of the state can be shown in Figure 5. The time when the system is in a correct state can be divided into an inactive time, that is, the time when the system is standby ( t 11 ) and the time when the system is in operation ( t 12 ). The time when the system is in failure is divided into organizational time ( t 21 ), logistic time ( t 22 ), and active repair time ( t 23 ), which can be time for corrective repairs ( t 231 ) and time for preventive repairs ( t 232 ) [1,19].
Availability is determined as the quotient of the total time during which the system is in a correct state and the total time that makes up the time in the correct state and time in failure (operational availability) [1,4].
A ( t ) =   t 11 , t 12   t 11 , t 12 , t 21 , t 22 t 231 , t 232  
The availability is a comprehensive concept that covers the entire lifetime of an engineering system [12]. Additional definitions of availability can be found in the references [9].
The operation of continuous systems at the open pits is characterized by changing the working environment conditions, changeable meteorological conditions, and a number of different technological phases and procedures. This is the reason why, for a sufficiently accurate determination of system parameters, including availability, its condition must be monitored over a longer period of time. It is common for the minimum monitoring period to be one year (in all seasons, through the technological phases of operation, current, and preventive maintenance). The availability based on formula (1) therefore requires the historical monitoring of operation and this formula can only be used after determining the uptime and downtime in a certain time interval.
On the basis of form (1), it can be stated that, broadly speaking, the constituent elements of availability are: correctness at a given moment as well as the satisfactory technical condition of the machine as a predictive category; design predetermination; and level of supportability for service and corrective maintenance.

2.2. Development of a Fuzzy Expert Model for the Availability Assessment

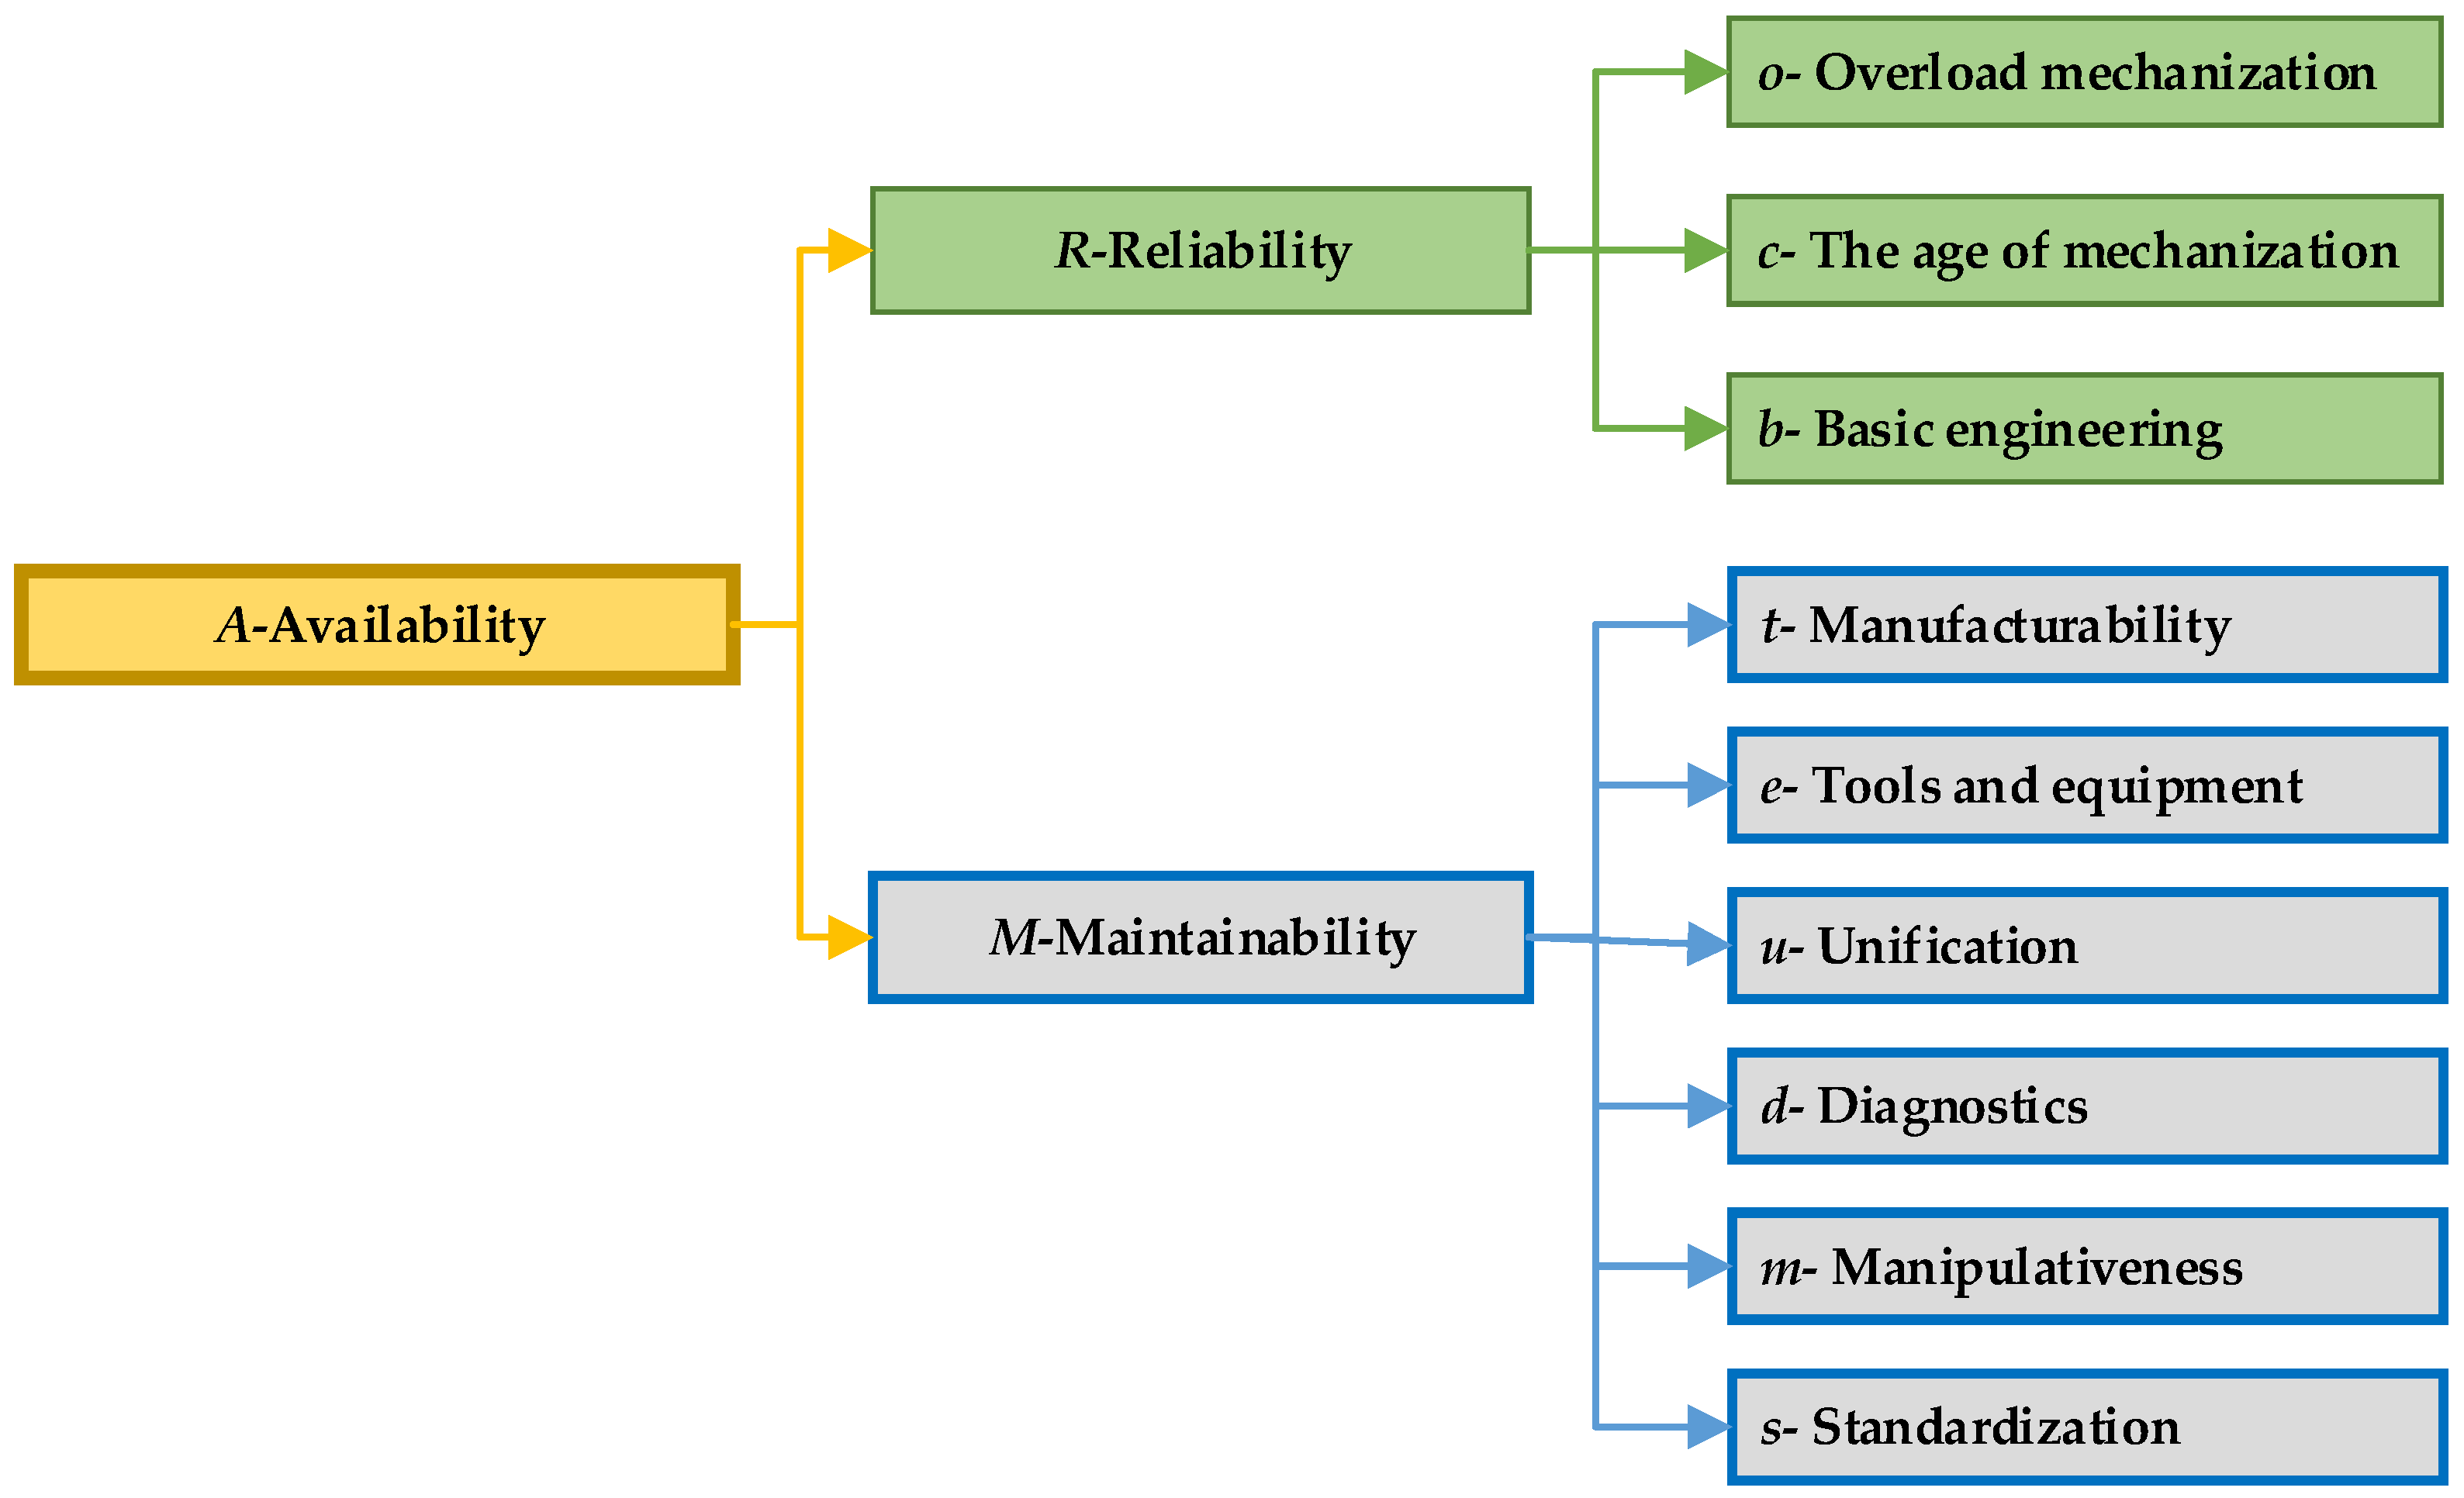
The availability as a measure of safety the system is in a function of appropriate factors, which in the literature are most often divided into two groups—partial indicators: reliability and ease of maintenance. These partial indicators, further, are a function of a number of independent parameters that are also considered as variables.
The first step in creating a fuzzy model is defining the linguistic variables that relate to the factors of partial indicators of availability, as follows:
  • R —reliability
  • o —mechanization overload
  • c —age of mechanization
  • b —basic engineering
  • M —maintainability (constructive maintainability)
  • t —technology
  • e   —tool and equipment
  • u —unification
  • d —diagnostics
  • m —manipulativeness
  • s —standardization
Reliability represents the probability, at a certain level of confidence, that the system (machine) will successfully perform the function for which it is intended, without failure and within the specified performance limits, taking into account the previous time of the system use, during the specified duration of the task, when it is used in the prescribed manner and for the purpose for which it is intended, under the specified load levels [2,20].
Failure is a phenomenon in which the parameters of an element or system as a whole are outside the established limits. The reasons for failures include, among others, design, manufacturing, inadequate testing, human error, age, inadequate maintenance, or lack of overload protection.
Maintainability, as a set of structural characteristics that affect the time to eliminate failures or the time of performing other maintenance procedures, is an internal property of the observed technical system: therefore, it is called the structural ease of maintenance or repairability. The constructive maintainability is influenced by the following parameters: t —technology, e —tools and equipment, u —unification, d —diagnostics, m —manipulativeness, s   —standardization [21].
The technology of the maintenance technical system represents the accessibility of the maintenance places, and it also represents the complexity degree of disassembly or assembly operations. Tools and equipment are important parameters of the maintenance quality. A high degree of standardization and unification increases availability. Shortening the duration of maintenance activities is achieved through adequate diagnostics—identification and location of the resulting failure. Manipulability refers to the constructional characteristics of the technical system that enable its transportation and transfer from the place of work to the place of maintenance. Figure 6 shows presentation of the partial availability indicators.
Regarding the number of linguistic variables, it can be concluded that seven is the maximum number of rationally recognizable variables that a person (expert) can simultaneously consider (identify) [22].
Accordingly, in this paper, four types of evaluations were considered in this work. Each of them is listed below.
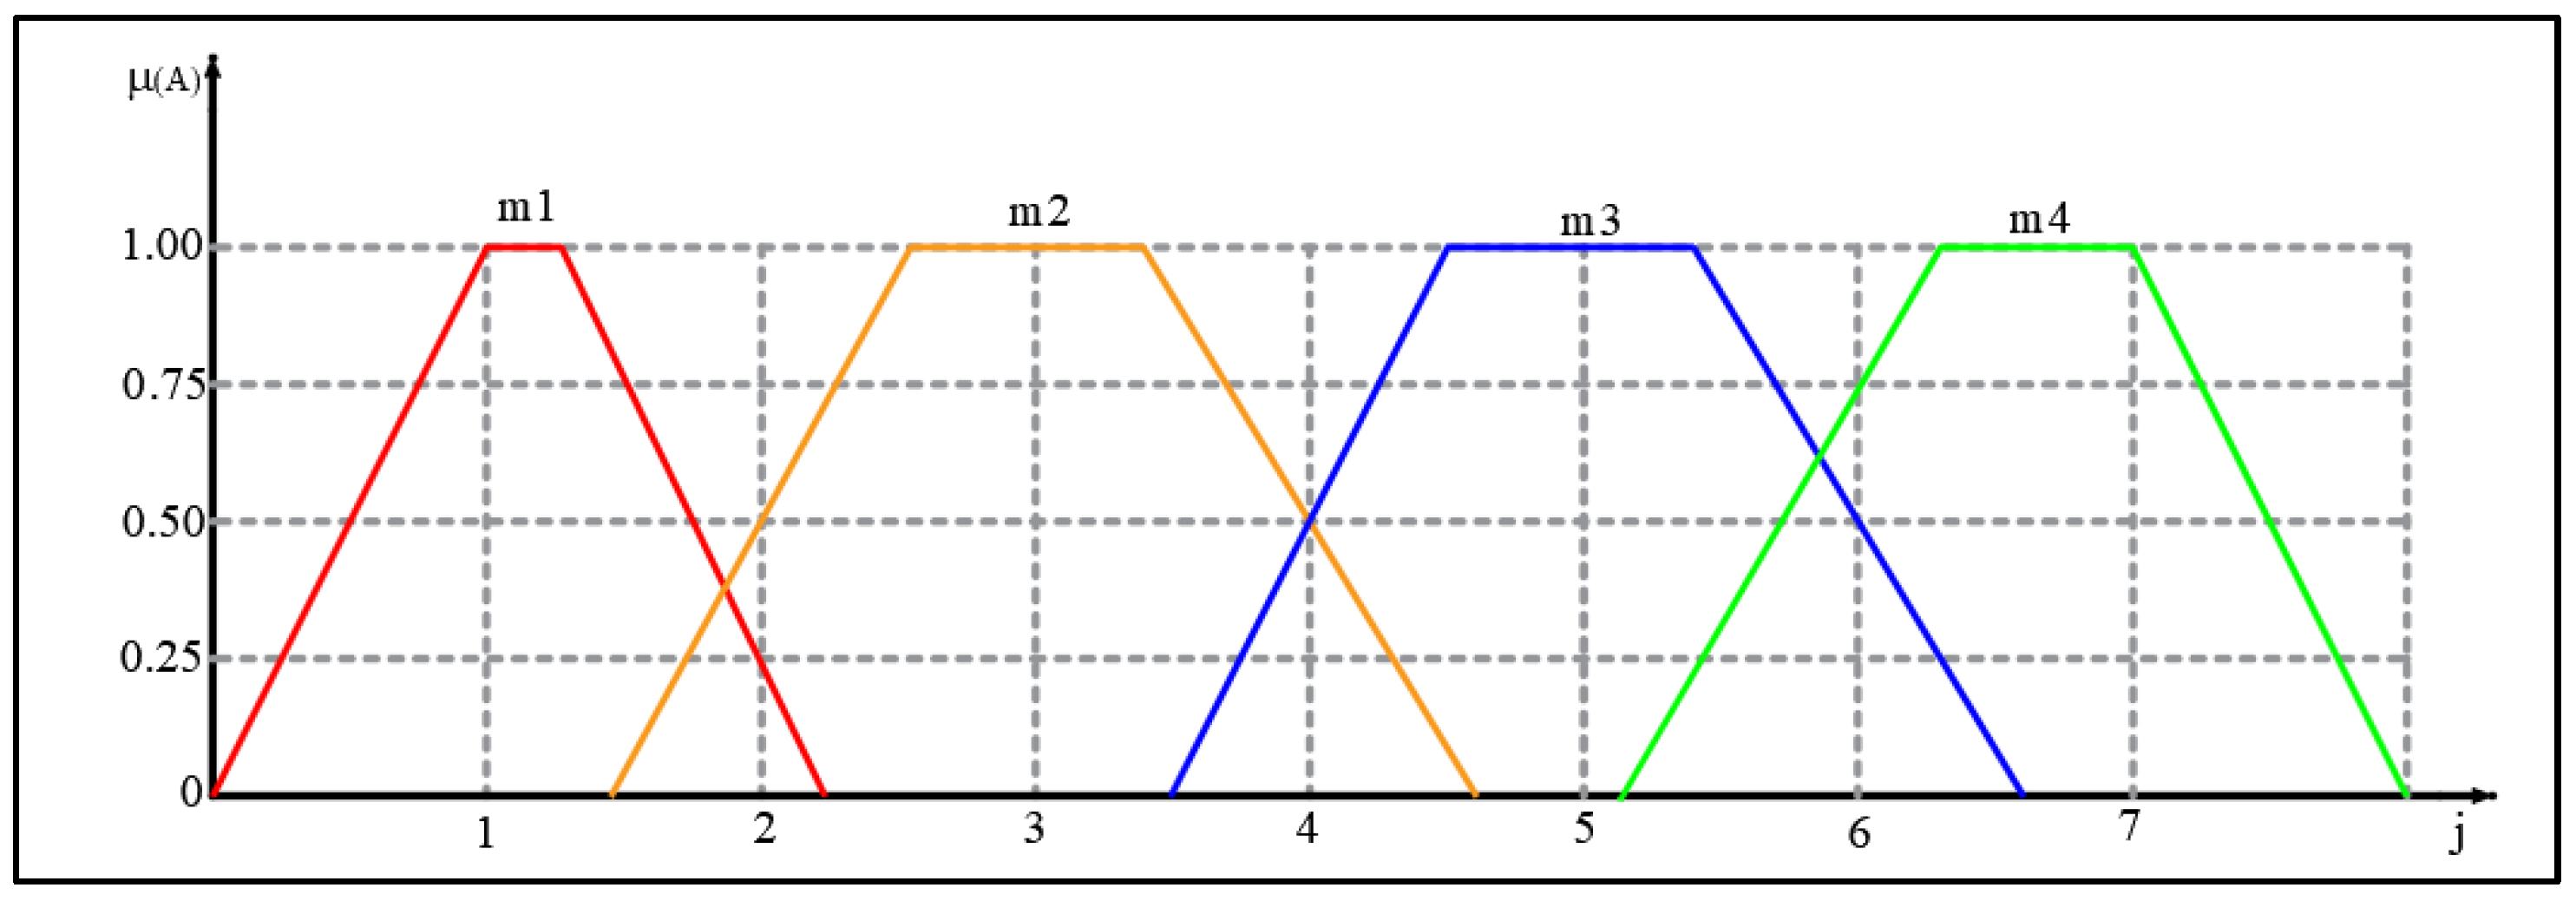
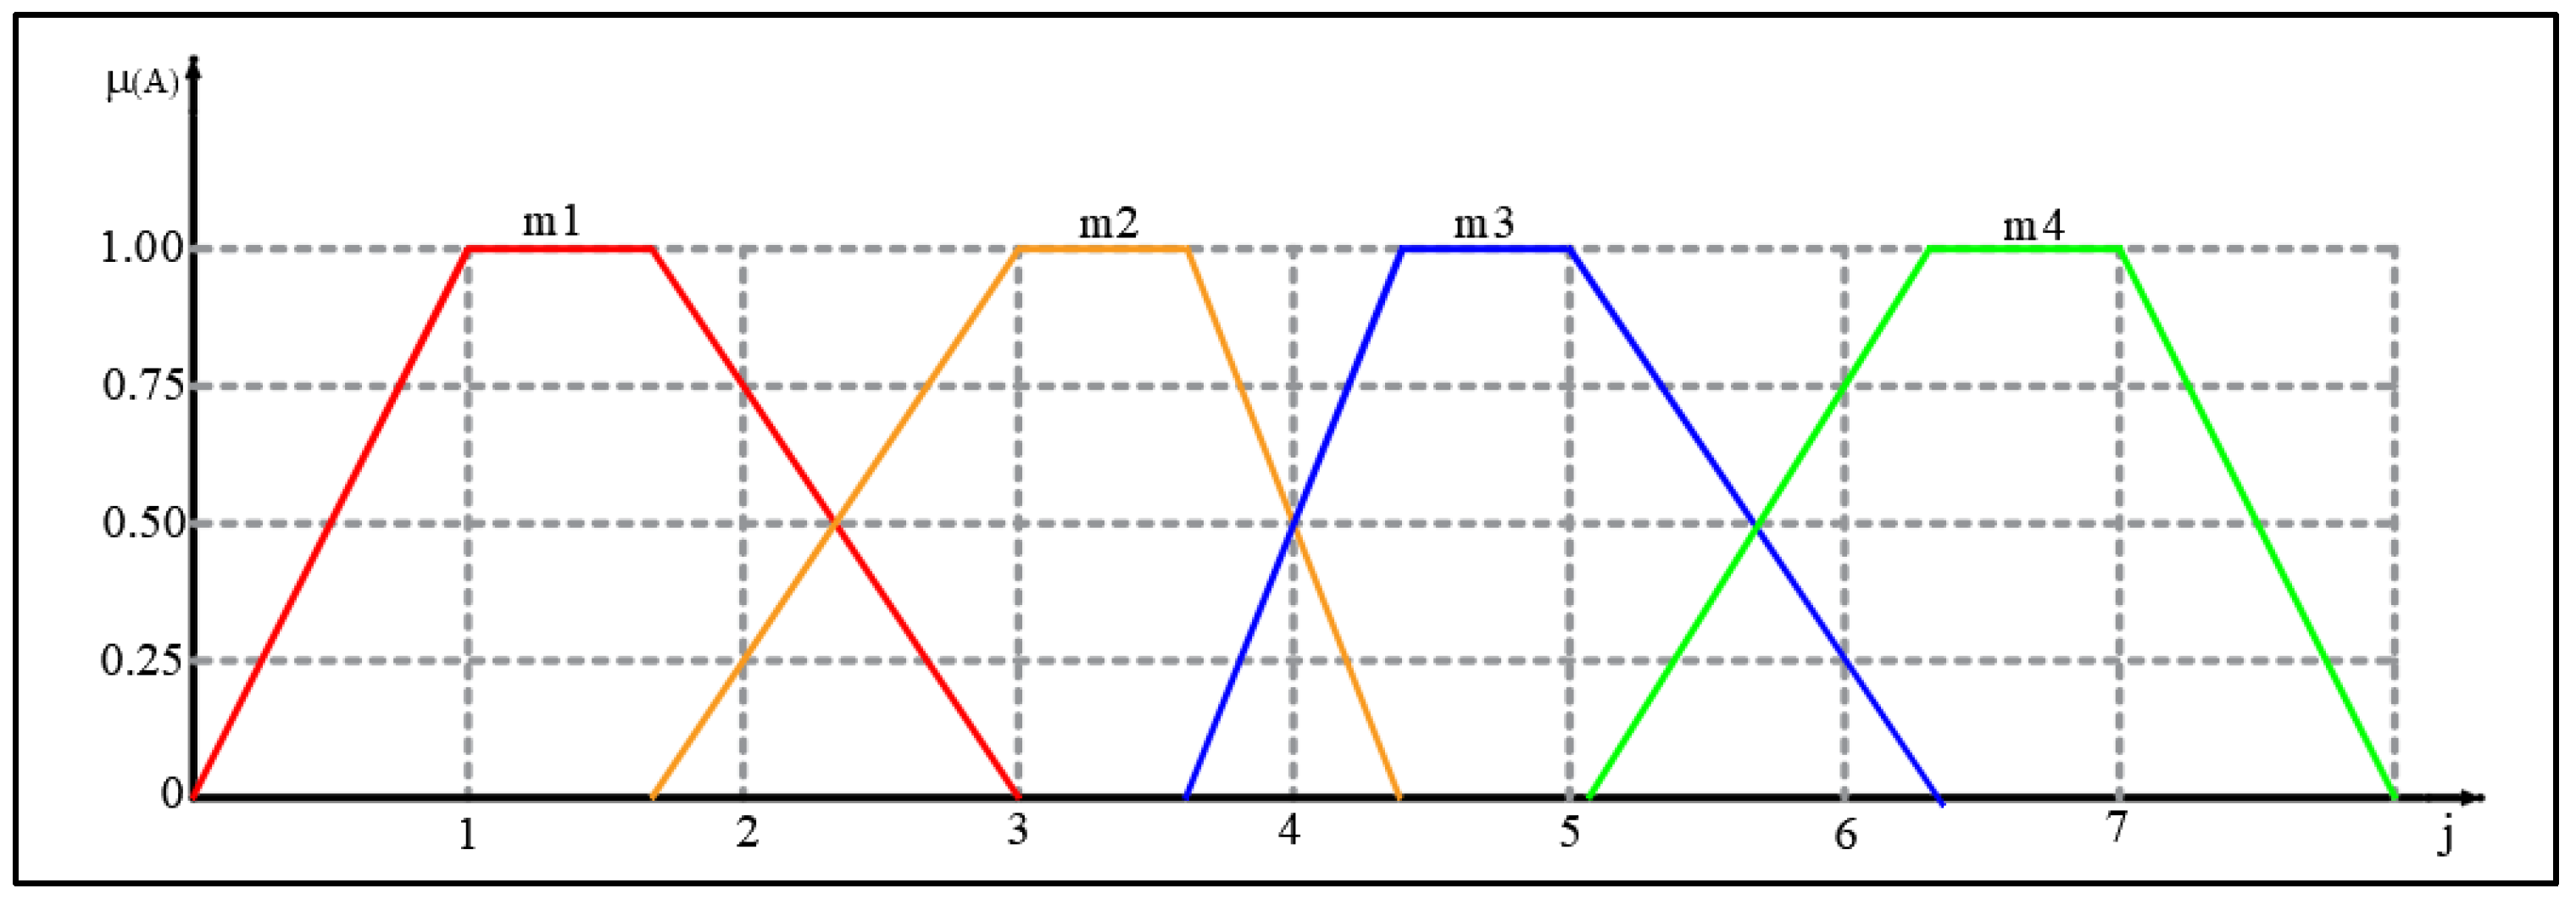
The first type of assessment that is used for the parameters of reliability, maintainability, overload, and availability R / M / o / A contains four linguistic variables defined as follows. The conditions of the working environment are such that unreliable/poor maintenance convenience/the engaged equipment is mostly not fulfilled/unavailable (mark m1). Low reliability/low convenience of maintenance/the technical characteristics of the equipment are mostly corresponding to the conditions of the working environment/low availability (mark m2); medium reliability/medium convenience of maintenance/the technical characteristics correspond to the conditions of the working environment/medium availability (mark m3); and high reliability/high convenience of maintenance/the technical characteristics of the equipment significantly exceed the requirements of the working environment/high availability (mark m4). Linguistic variables (ratings) are presented in Figure 7.
The corresponding phase numbers of the mentioned linguistic variables are defined by (according to Figure 7):
μ m 1 = ( 1 ,   0.25 ,   0 ,   0 ,   0 ,   0 ,   0 ) , μ m 2 = ( 0 ,   0.5 ,   1 ,   0.5 ,   0 ,   0 , 0 ) , μ m 3 = ( 0 ,   0 ,   0 ,   0.5 ,   1 ,   0.5 , 0 ) , μ m 4 = ( 0 ,   0 ,   0 ,   0 ,   0 ,   0.75 ,   1 ) .
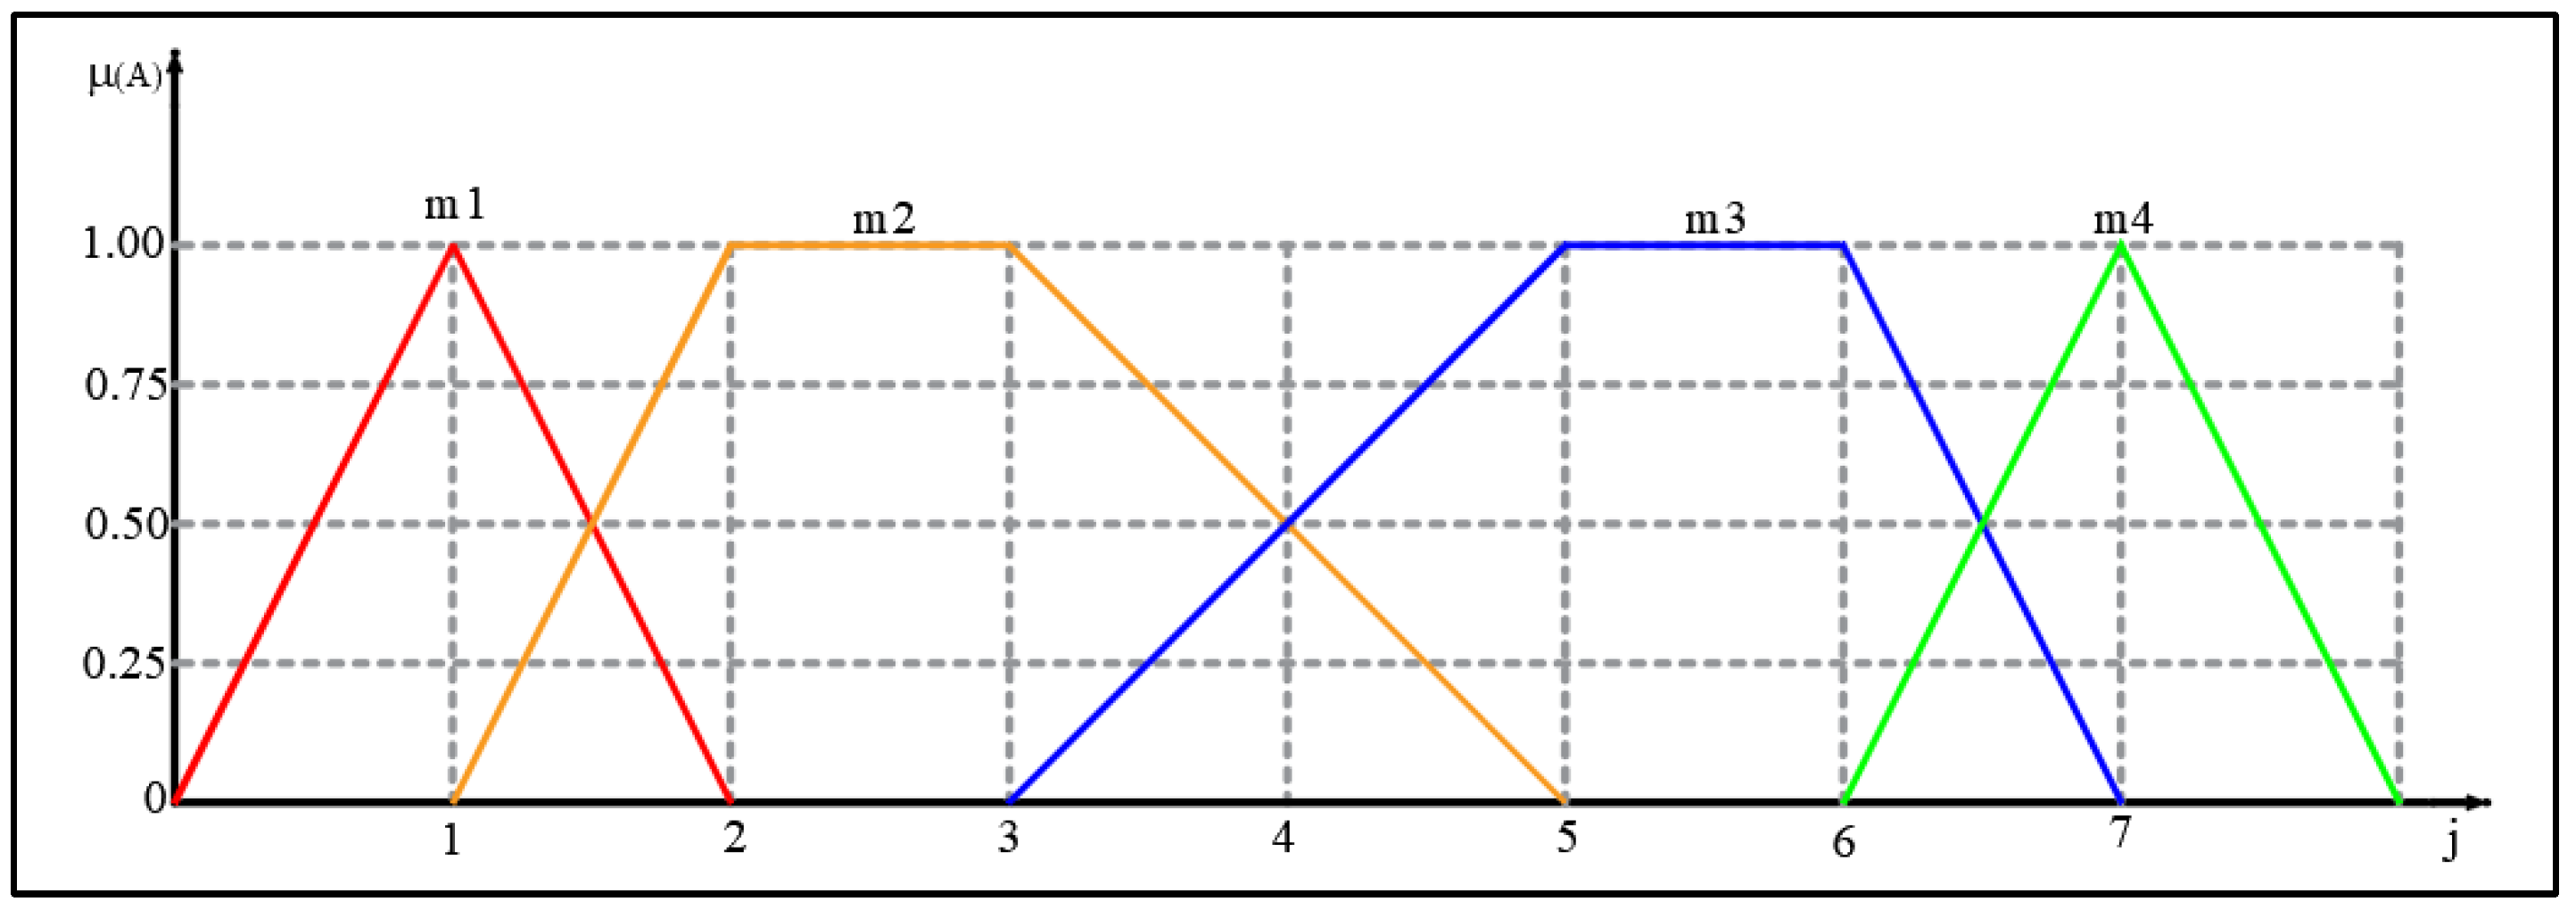
The second type of assessment that is used for the parameters t / m / s (technological/manipulative/standardization), contains four linguistic variables, defined as follows:
  • Technology and manipulativeness—poor (mark m1), sufficient (mark m2), good (mark m3), excellent (mark m4);
  • Standardization—no standardization (mark m1), partially present standardization (mark m2), present standardization (mark m3), complete standardization (mark m4). Linguistic variables (ratings) are presented in Figure 8.
The corresponding fuzzy numbers of the mentioned linguistic variables are defined by (according to Figure 8):
μ m 1 = ( 1 ,   0.75 ,   0 ,   0 ,   0 ,   0 ,   0 ) , μ m 2 = ( 0 ,   0.25 ,   1 ,   0.5 ,   0 ,   0 ,   0 ) , μ m 3 = ( 0 ,   0 ,   0 ,   0.5 ,   1 ,   0.25 ,   0 ) , μ m 4 = ( 0 ,   0 ,   0 ,   0 ,   0 ,   0.75 ,   1 ) .
The third type of assessment, which is used for the parameters d / u (diagnostics, unification), contains four linguistic variables, defined as follows:
  • Diagnostics—no diagnostics (mark m1), limited diagnostics (mark m2), well-developed diagnostics (mark m3), excellently developed diagnostics (mark m4);
  • Unification—no unification (mark m1), little unification present (mark m2), mostly present unification (mark m3), complete unification (mark m4). Linguistic variables (ratings) are presented in Figure 9.
The corresponding fuzzy numbers of the mentioned linguistic variables are defined by (according to Figure 9):
μ m 1 = ( 1 , 0 ,   0 ,   0 ,   0 ,   0 ,   0 ) , μ m 2 = ( 0 ,   1 ,   1 , 0.5 ,   0 ,   0 ,   0 ) , μ m 3 = ( 0 ,   0 ,   0 ,   0.5 ,   1 ,   1 ,   0 ) , μ m 4 = ( 0 ,   0 ,   0 ,   0 ,   0 ,   0 ,   1 ) .  
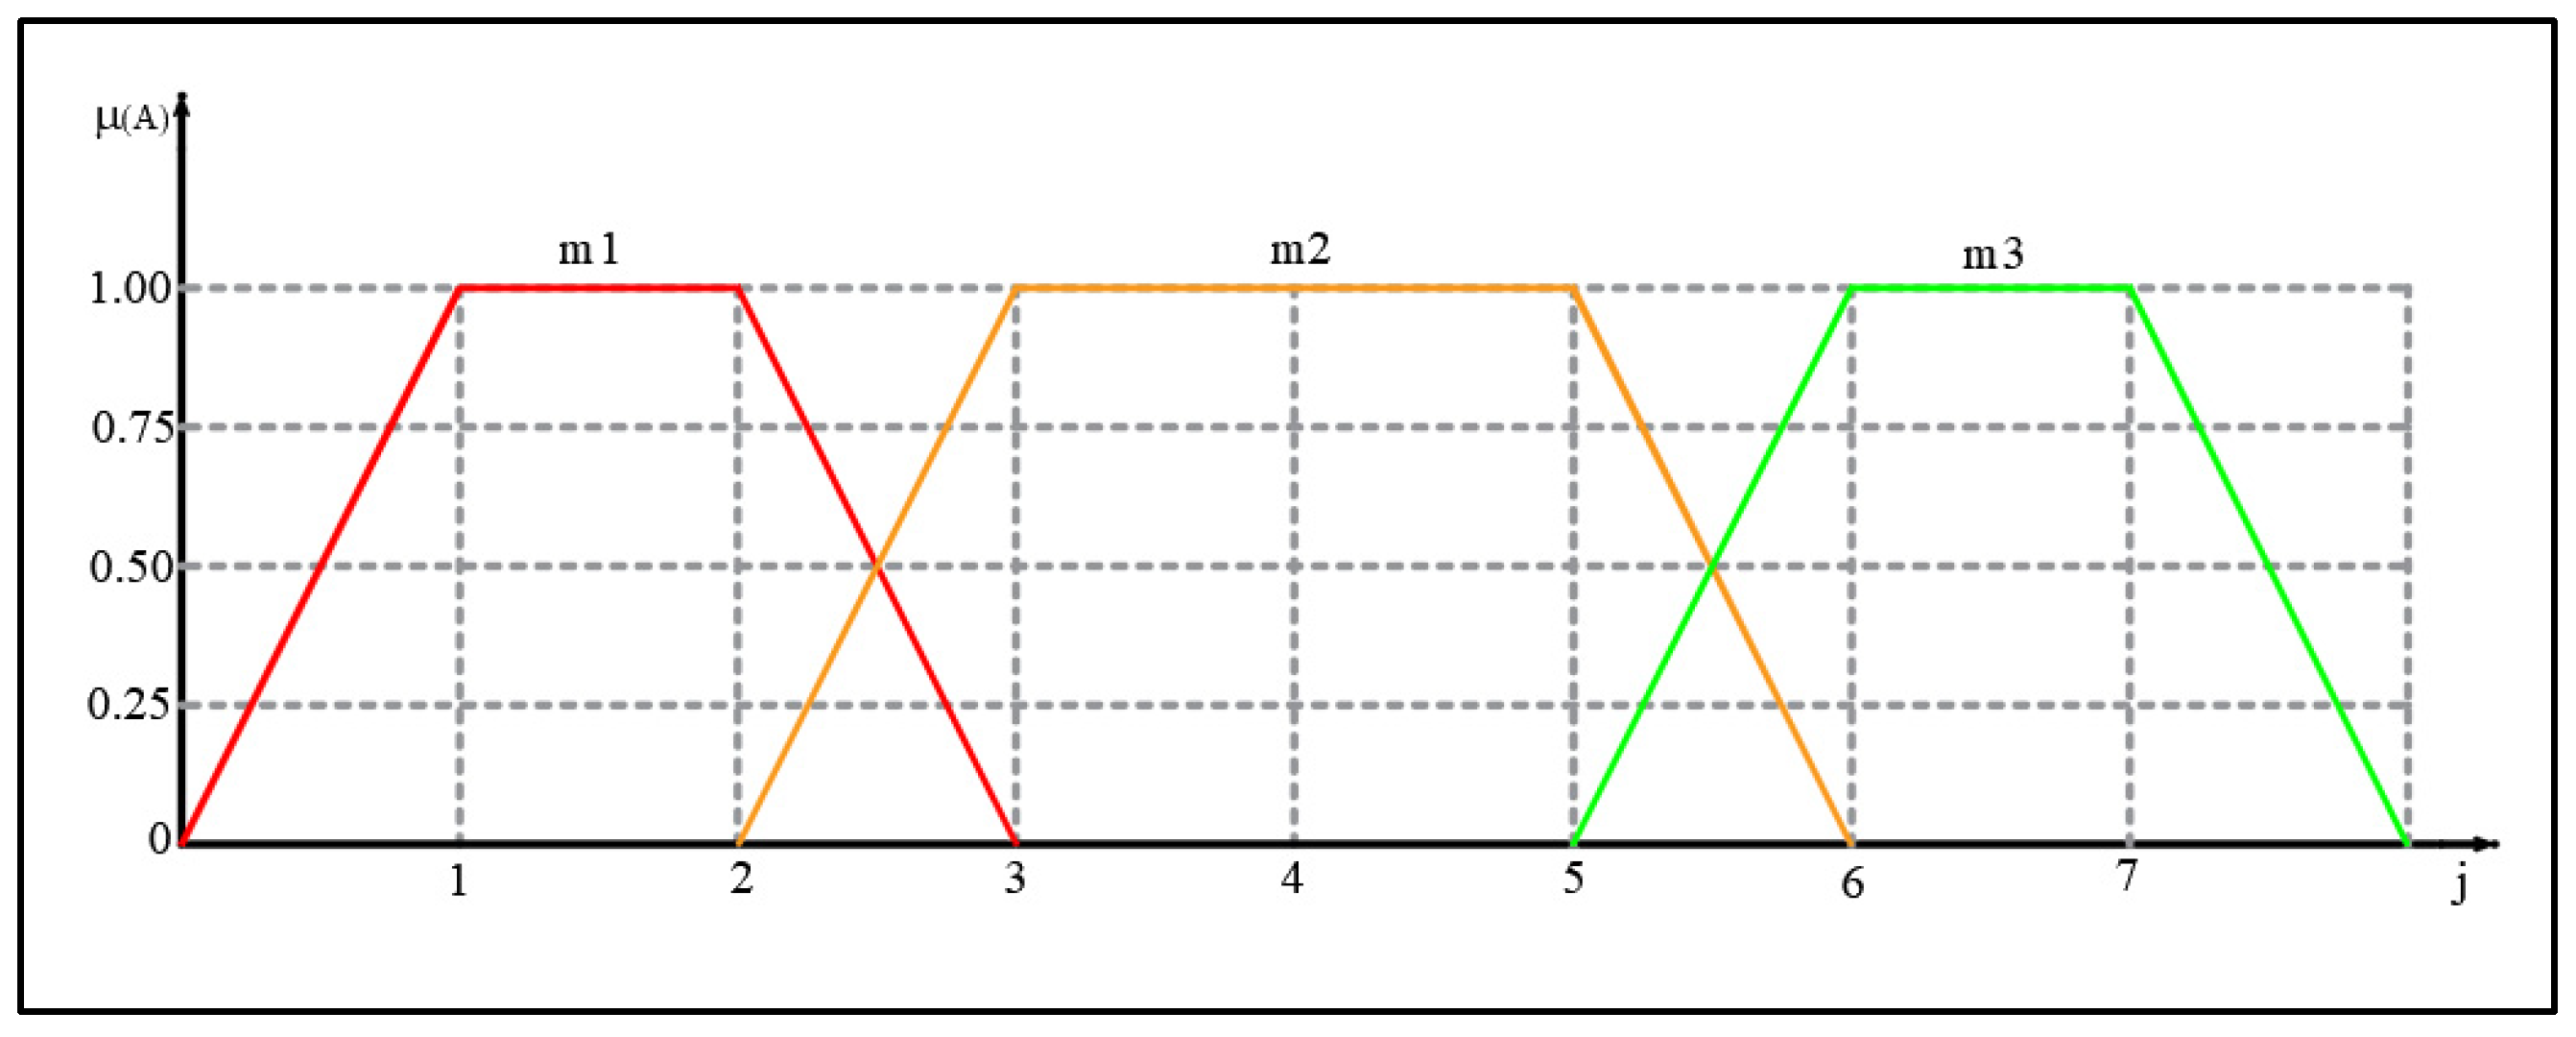
The fourth type of assessment that is used for the parameter e (tools and equipment), partial indicator c (age of machinery), and b -basic engineering contains three linguistic variables defined as follows: undeveloped equipment/machine at the end of its life/undeveloped basic engineering (mark m1), medium equipment/machine in the exploitation phase/medium basic engineering (mark m2), and good equipment/new machine (mechanization)/good basic engineering (mark m3). Linguistic variables (ratings) are presented in Figure 10.
The corresponding fuzzy numbers of the mentioned linguistic variables are defined by (according to Figure 10):
μ m 1 = ( 1 ,   1 ,   0 ,   0 ,   0 ,   0 , 0 ) , μ m 2 = ( 0 ,   0 ,   1 ,   1 ,   1 ,   0 ,   0 ) , μ m 3 = ( 0 ,   0 ,   0 ,   0 ,   0 ,   1 ,   1 ) .
Trapezoid fuzzy sets were used for phenomena that are not clearly defined (e.g., medium basic engineering) and which are linguistically more uncertain, while triangular fuzzy sets were used for clearly defined phenomena (e.g., no unification).
The partial indicators o , c , and b more closely determine the partial indicator R —reliability, while the partial indicators t , e , u , d , m , and s more closely determine the partial indicator M —convenience of maintenance. The following shows how availability A is determined based on the reliability indicators R and maintenance convenience M .
The idea of this work was to obtain a more accurate assessment of the availability of continuous systems at the open pit Drmno. Let the partial indicators R , M be shown in the form of the following fuzzy numbers:
μ R ( μ R 1 , μ R 2 ,   μ R , 3 μ R 4 ,   μ R , 5 μ R , 6 μ R 7   ) ,         μ M ( μ M 1 , μ M 2 ,   μ M , 3 μ M 4 ,   μ M 5 , μ M , 6 μ M 7 )
In the next step, the max–min and min–max compositions were performed on them. The max–min composition is also called the pessimistic composition, and is often used in the algebra phase as a synthesis model (for more information see [22,23,24]) while the min–max composition is also called the optimistic composition.
If the partial indicators R , M are observed, it is possible to make C = 7 2 = 49 combinations of the appropriate membership functions, which will be further denoted by:
μ i j k   ( μ R i , μ M j ) ,           i ,   j ,   k   { 1 ,   2 ,   3 ,   4 ,   5 ,   6 ,   7 }
Each of these combinations represents one possible estimate of availability, and the following two values can be associated with it:
Ω i j = [ i + j ] 2
and,
m i j = min { μ R i , μ M j }
It is clear that Ω i j k takes values from the set {1,2,3,4,5,6,7}, and each of the mentioned values can be associated with the number μ l which represents the maximum value m i j of all those combinations for which Ω i j is equal to l, for l ∈ {1,2,3,4,5,6,7}, that is:
μ l = min { m i j   :   Ω i j = l }
In this way, the rating is obtained for the A availability:
μ = ( μ 1 , μ 2 , μ 3 ,   μ 4 , μ 5 , μ 6 ,   μ 7 ) .
Using the best fit method (for more information see [16]) to transform the obtained rating into belonging to the fuzzy set, determined by (2), the distance is used that is defined by:
d i = d ( μ , μ   i ) = j = 1 7 ( μ j μ i , j ) 2   ,       μ i = ( μ i , 1 , μ i , 2 , μ i , 3 , μ i , 4 , μ i , 5 , μ i , 6 , μ i , 7 )
For μ i { μ m 1 ,   μ m 2 ,   μ m 3 ,   μ m 4 } . Small values of d i indicate proximity to the linguistic variable μ   i . Accordingly, let d m i n be the minimum value of the obtained distances d 1 , d 2 ,   d 3 ,   d 4 , then the normalized reciprocal values of relative distances can be associated to each of them, determined by:
μ i = d m i n d i d m i n d 1 + d m i n d 2 + d m i n d 3 + d m i n d 4 ,             i { 1 ,   2 ,   3 ,   4 } ,
and present belonging to the appropriate rating:
A = { ( μ 1 ,   m 1 ) , ( μ 2 ,   m 2 ) , ( μ 3 ,   m 3 ) , ( μ 4 ,   m 4 ) }
In the end, the corresponding linguistic rating is obtained as follows:
Z = 1 μ 1 + 2 μ 2 + 3 μ 3 + 4 μ 4 μ 1 + μ 2 + μ 3 + μ 4
In a similar way, from the linguistic variables t , e , u , d , m , s , a rating for convenience of maintenance M was obtained from the linguistic variables t , e , u , d , m , s which were later used to determine the availability of A .
Figure 11 shows the fuzzy model algorithm for the availability assessment. In the first step in Figure 11, the experts were given a questionnaire, based on which they had to give an expert opinion on different types of indicators. The next step involves the statistical processing of the obtained grades, as a necessary step that precedes the process of fuzzification. The fuzzy proposal represents the first segment of artificial intelligence (AI) in which each indicator is assigned a corresponding fuzzy number. In the next step, using fuzzy compositions (max–min and min–max), fuzzy numbers were defined for those indicators that were included in the final model and which depend on the indicators submitted in the questionnaire. After obtaining the grades, using adequate methods (best fit method), the obtained grade was identified.

3. Case Study

3.1. Results of the Expert Assessment

The determination of the system availability and its partial indicators was processed through the results obtained through the questionnaire related to the expert assessment of the partial indicators of availability. The questionnaire contained detailed descriptions of the partial indicators themselves. The ratings were given in terms of the membership function of pre-defined linguistic variables (bad—excellent) in the interval from 0 to 1. At the same time, the membership can be assigned for several linguistic variables at the same time for a certain parameter, but such as the sum of ratings is 1. The following tables show the results of expert assessments for each part of the continuous system (bucket wheel excavator, beltwagon, belt conveyors and crushing plant).
In the expert assessment, 10 experts from the field of continuous systems in surface exploitation were surveyed.
Results of the expert assessment are given in the annex.

3.2. Determining the Partial Reliability Indicator R (O-Load of the Mechanization)

Determining the indicator rating is illustrated in an example of the partial o -load indicator for the bucket wheel excavator SRs 400.14/1.5, from the obtained assessment by the experts, which are shown in the Table 1.
Arithmetic means for each of the ratings were obtained as follows:
m 1 = 0 + 0 + 0 + 0 + 0 + 0 + 0 + 0 + 0 + 0 10 = 0 m 2 = 0.5 + 0 + 0 + 0 + 0 + 0 + 0 + 0 + 0 + 0 10 = 0.05 m 3 = 0.5 + 0.3 + 0.5 + 0.1 + 0.3 + 0.4 + 0.3 + 0.2 + 0.2 + 0.6 10 = 0.34 m 4 = 0 + 0.7 + 0.5 + 0.9 + 0.7 + 0.6 + 0.6 + 0.8 + 0.8 + 0.4 10 = 0.61
From which it follows that the rating of the O load indicator is equal to:
o = ( 0 m 1 , 0.05 m 2 , 0.34 m 3 , 0.61 m 4 )
The ratings of other indicators for the remaining parts of the system were calculated in the same way. The obtained ratings are shown in the following tables.
Based on the submitted results, the following assessments were obtained for each analyzed part of the continuous system. Table 2 shows ratings of reliability indicators for bucket wheel excavator SRs 400.14/1.5 and beltwagon BRs 2400.
Table 3 shows ratings of reliability indicators for belt conveyors and crushing plant.
Determining the final rating of indicator will be also illustrated on an example of the partial indicator o for the bucket wheel excavator SRs 400.14/1.5. Table 4 shows transformation of ratings in fuzzy number.
The final ratings of other indicators for the remaining parts of the system were calculated in the same way. The obtained final ratings are shown in the following tables. Table 5 shows final rating for partial indicators o, b, and c for bucket wheel excavator SRs 400.14/1.5, beltwagon BRs 2400 in the form of fuzzy number. Table 6 shows final rating for partial indicators o, b, and c for belt conveyors and crushing plant in the form of fuzzy number.
When calculating the max–min and min–max compositions for the mentioned parts of the system, it is necessary to observe   7 3 = 343 combination of affiliation for the partial indicators o ,   b , and c . Table 7 shows calculation of max–min and min–max compositions for first 15 and last 15 combinations.
On the basis of the ratings obtained in the form of fuzzy number, the ratings obtained using the max–min and min–max composition for the specified parts of the system are shown in the following table. Table 8 shows ratings obtained for the partial indicator of reliability using max–min composition. Figure 12 shows ratings obtained for partial indicator R (reliability) of the system parts using max–min composition—(a) bucket wheel excavator SRs 400 14/1.5, (b) beltwagon BRs 2400, (c) belt conveyors, (d) crushing plant.
Table 9 shows ratings obtained for partial indicator R (reliability) of the system parts using min–max composition. Figure 13 shows ratings obtained for partial indicator R (reliability) of the system parts using min–max composition—(a) bucket wheel excavator SRs 400 14/1.5, (b) beltwagon BRs 2400, (c) belt conveyors, (d) crushing plant.

3.3. Determining the Partial Maintainability Indicator M

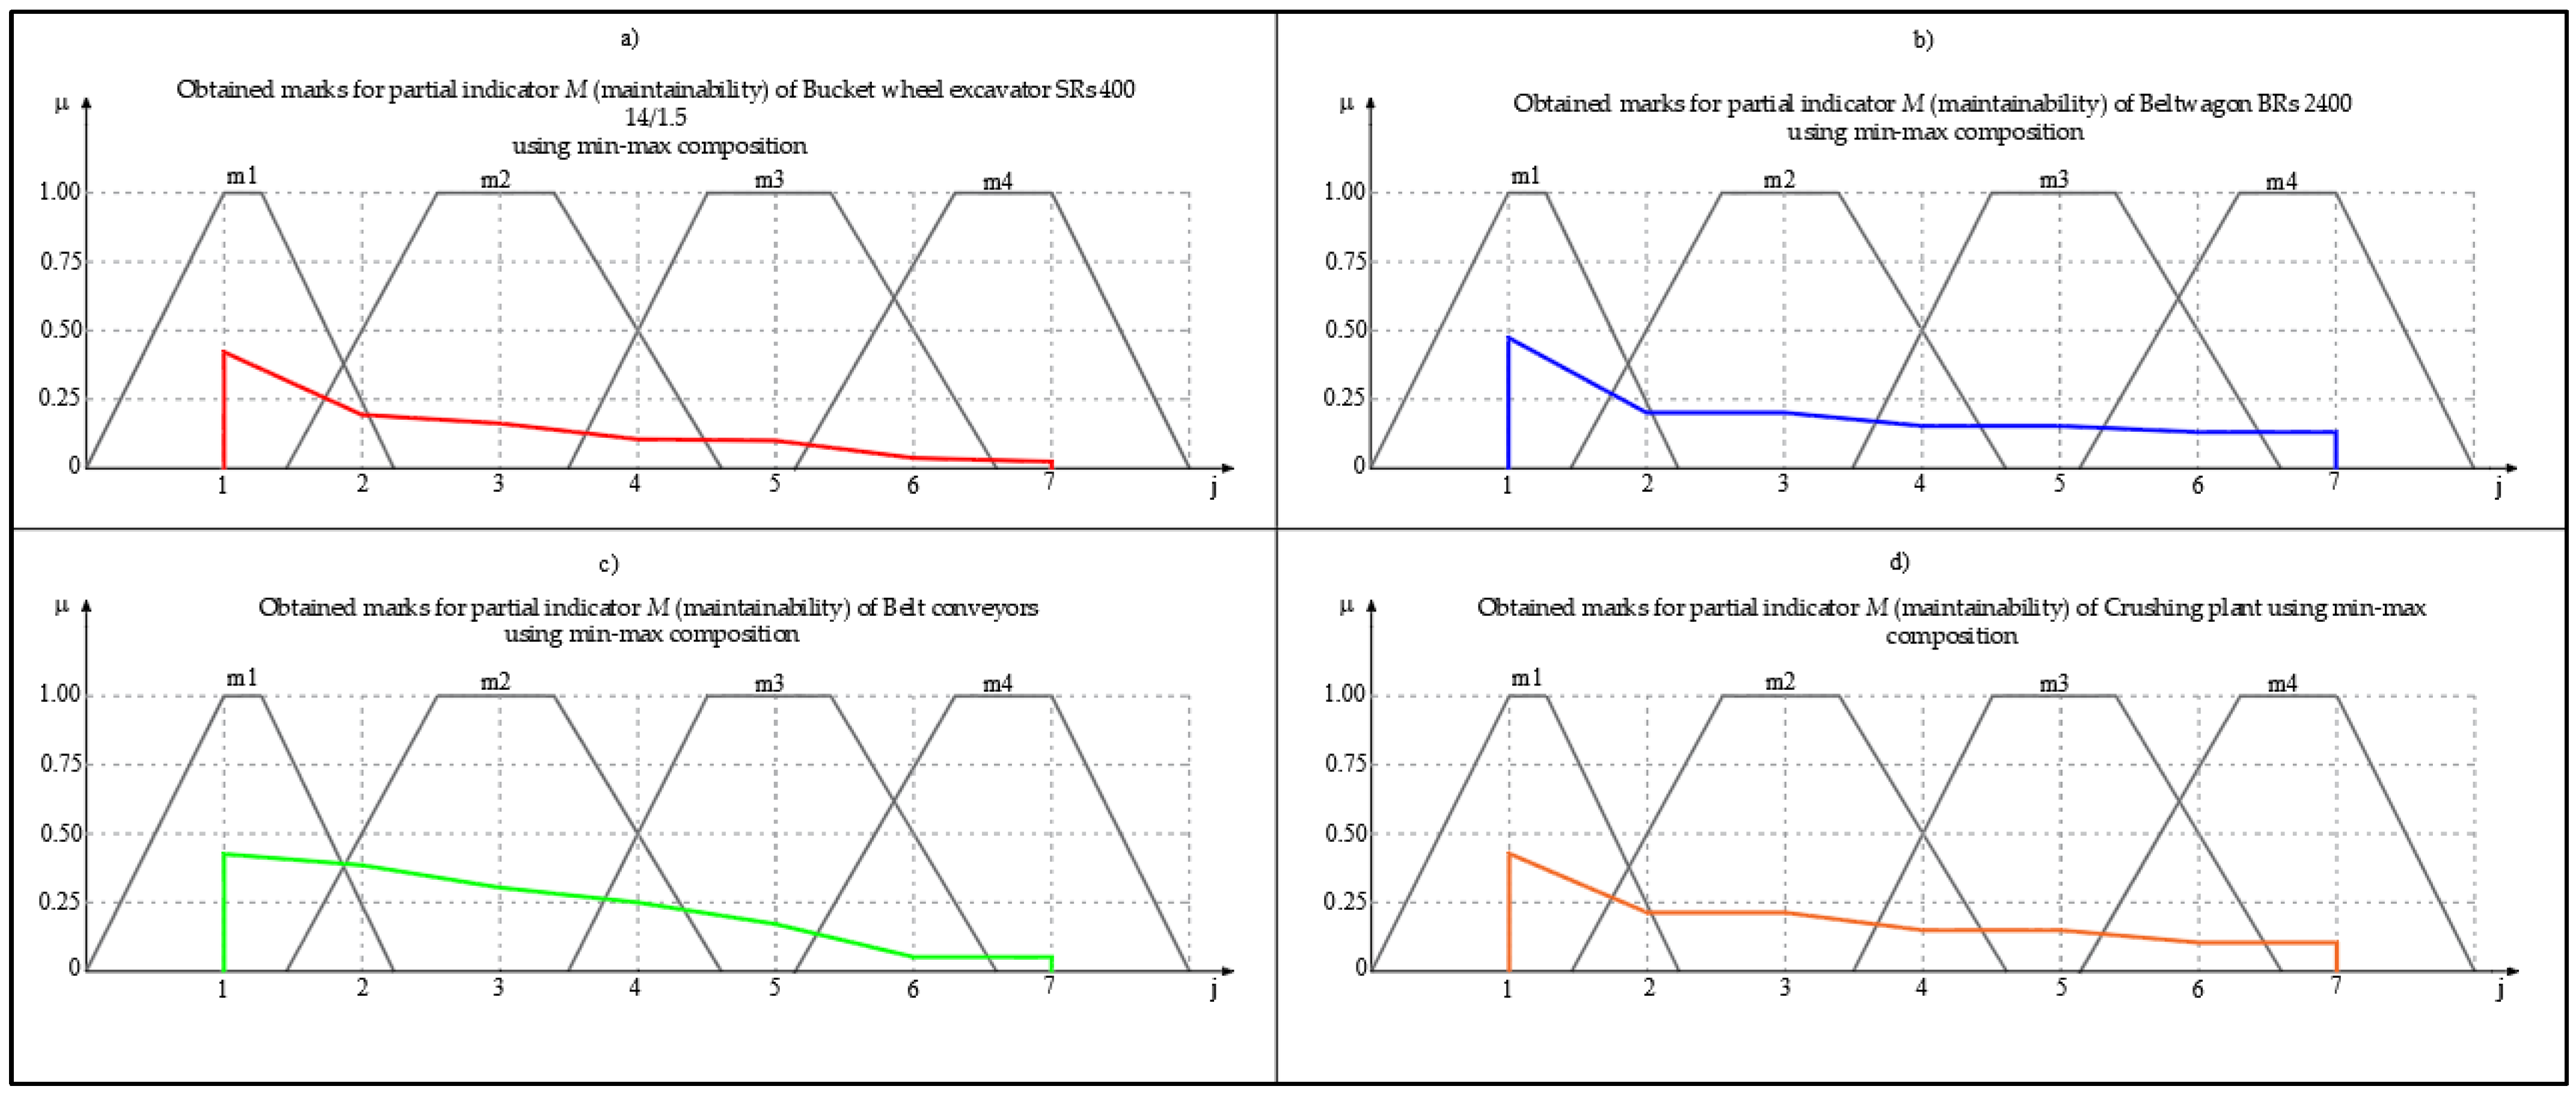
In a similar way as in the previous chapter, the ratings of the maintainability indicator were determined. Table 10 shows ratings of maintainability indicator for bucket wheel excavator SRs 400.14/1.5 Beltwagon BRs 2400. Table 11 shows ratings of maintainability indicator for belt conveyors and crushing plant. Table 12 shows final rating for partial indicators t , e , u , d , m , s , for bucket wheel excavator SRs 400.14/1.5, beltwagon BRs 2400 in the form of fuzzy number. Table 13 shows final rating for partial indicators t, e, u, d, m, s, for belt conveyors and crushing plant in the form of fuzzy number.
Based on the obtained ratings in the form of fuzzy number, the ratings obtained using max–min and min–max composition for the specified parts of the system are shown in the following table. Table 14 shows ratings obtained for partial maintainability indicator using max–min composition. Table 15 shows ratings obtained for partial indicator maintainability using min–max composition.
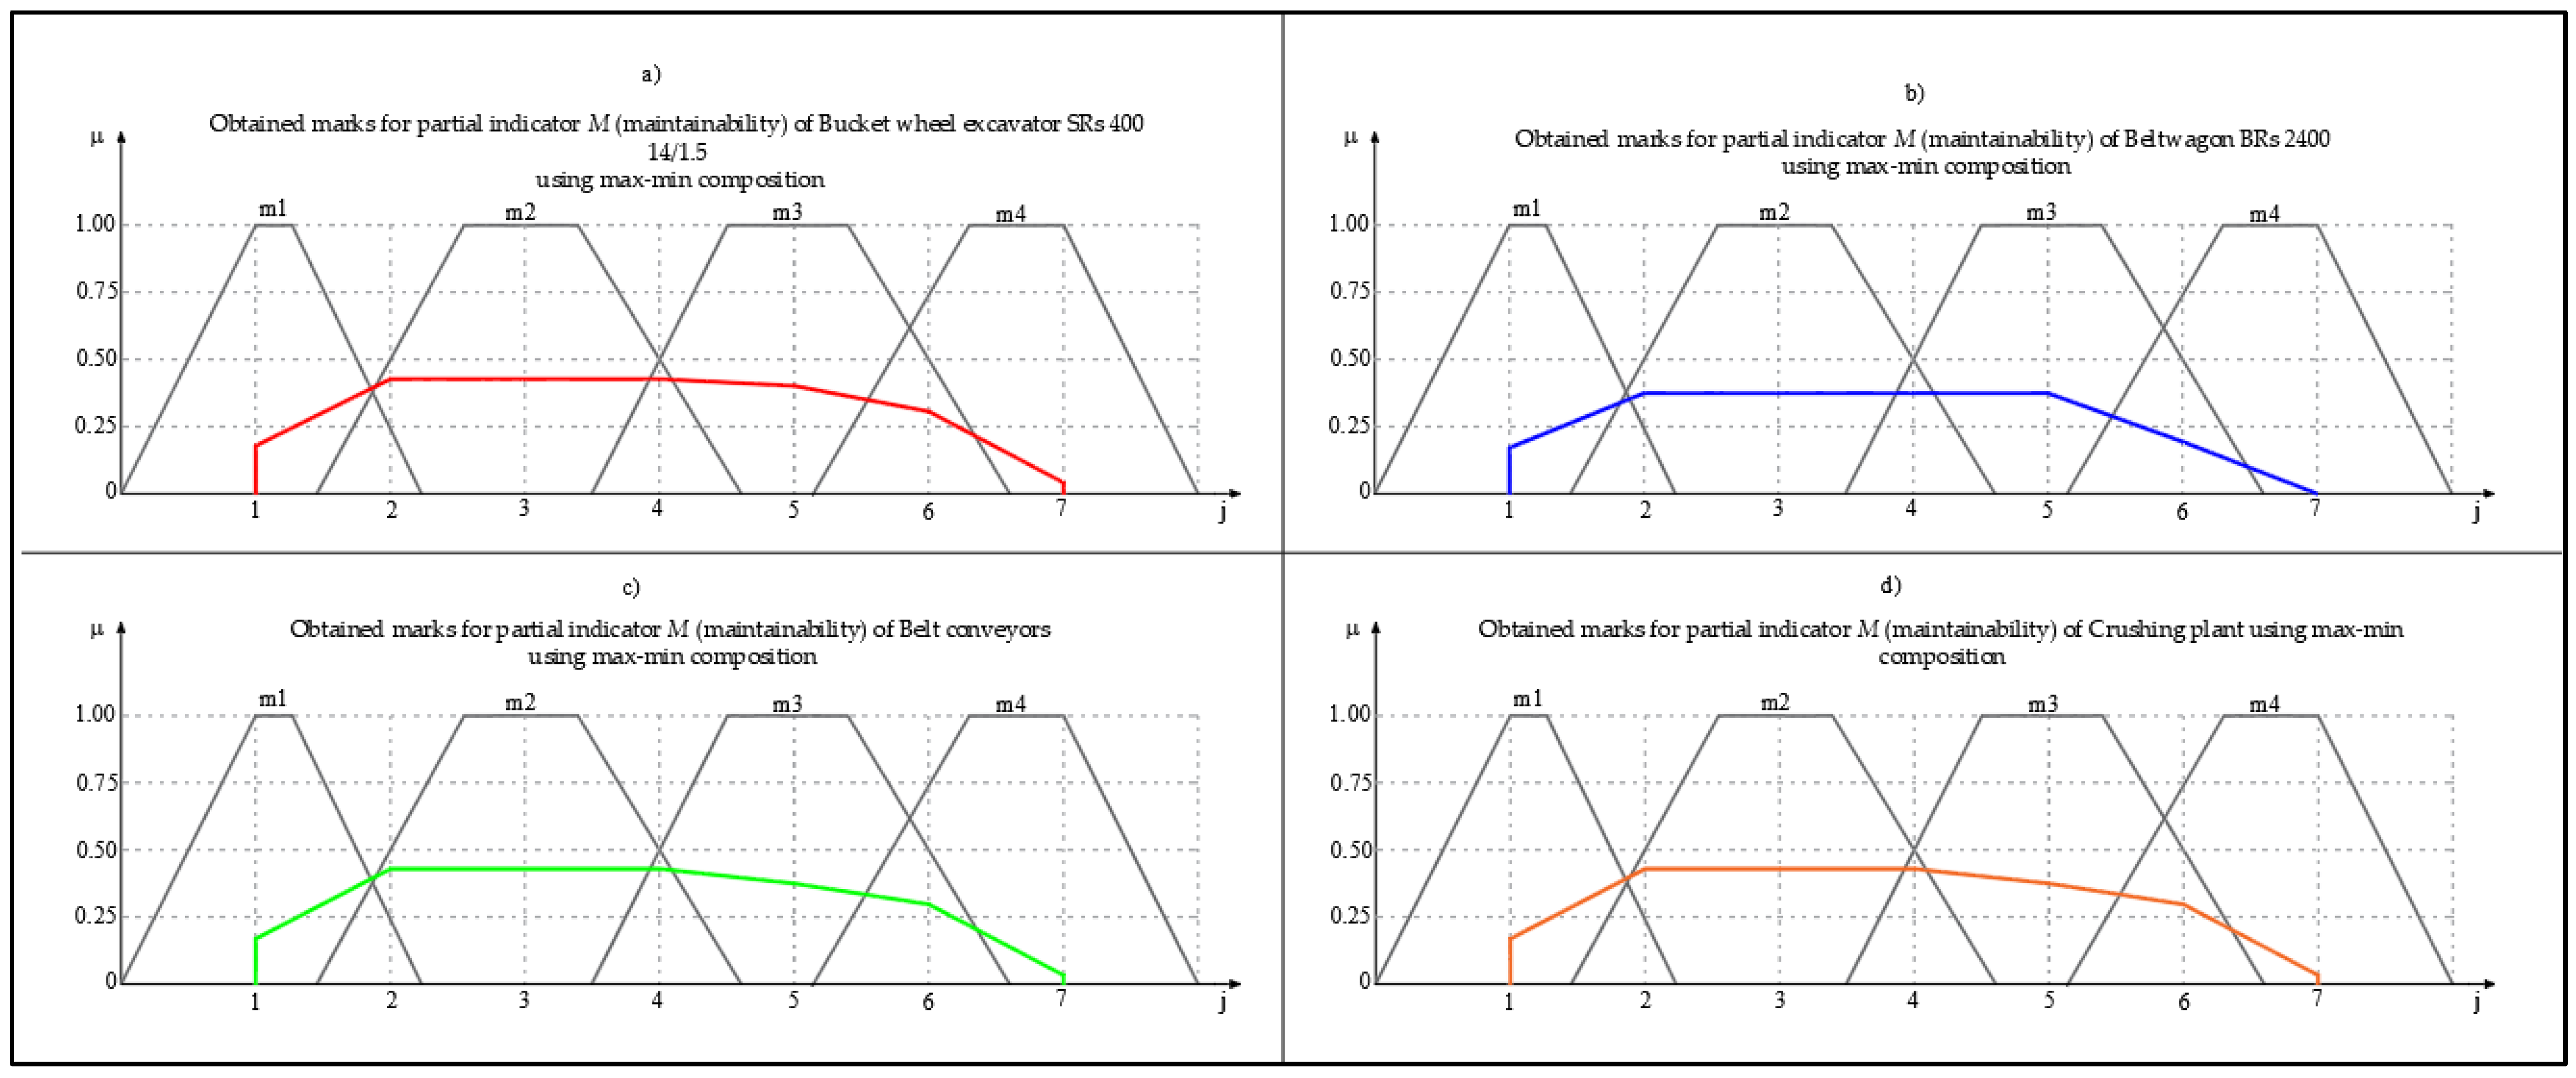
Figure 14 shows ratings obtained for partial indicator M (maintainability) of the system parts using max–min composition—(a) bucket wheel excavator SRs 400 14/1.5, (b) Beltwagon BRs2400, (c) belt conveyors, (d) crushing plant. Figure 15 shows ratings obtained for partial indicator M (maintainability) of the system parts using min–max composition—(a) bucket wheel excavator SRs 400 14/1.5, (b) beltwagon BRs2400, (c) belt conveyors, (d) crushing plant.

3.4. Determining the Availability— A of System Parts

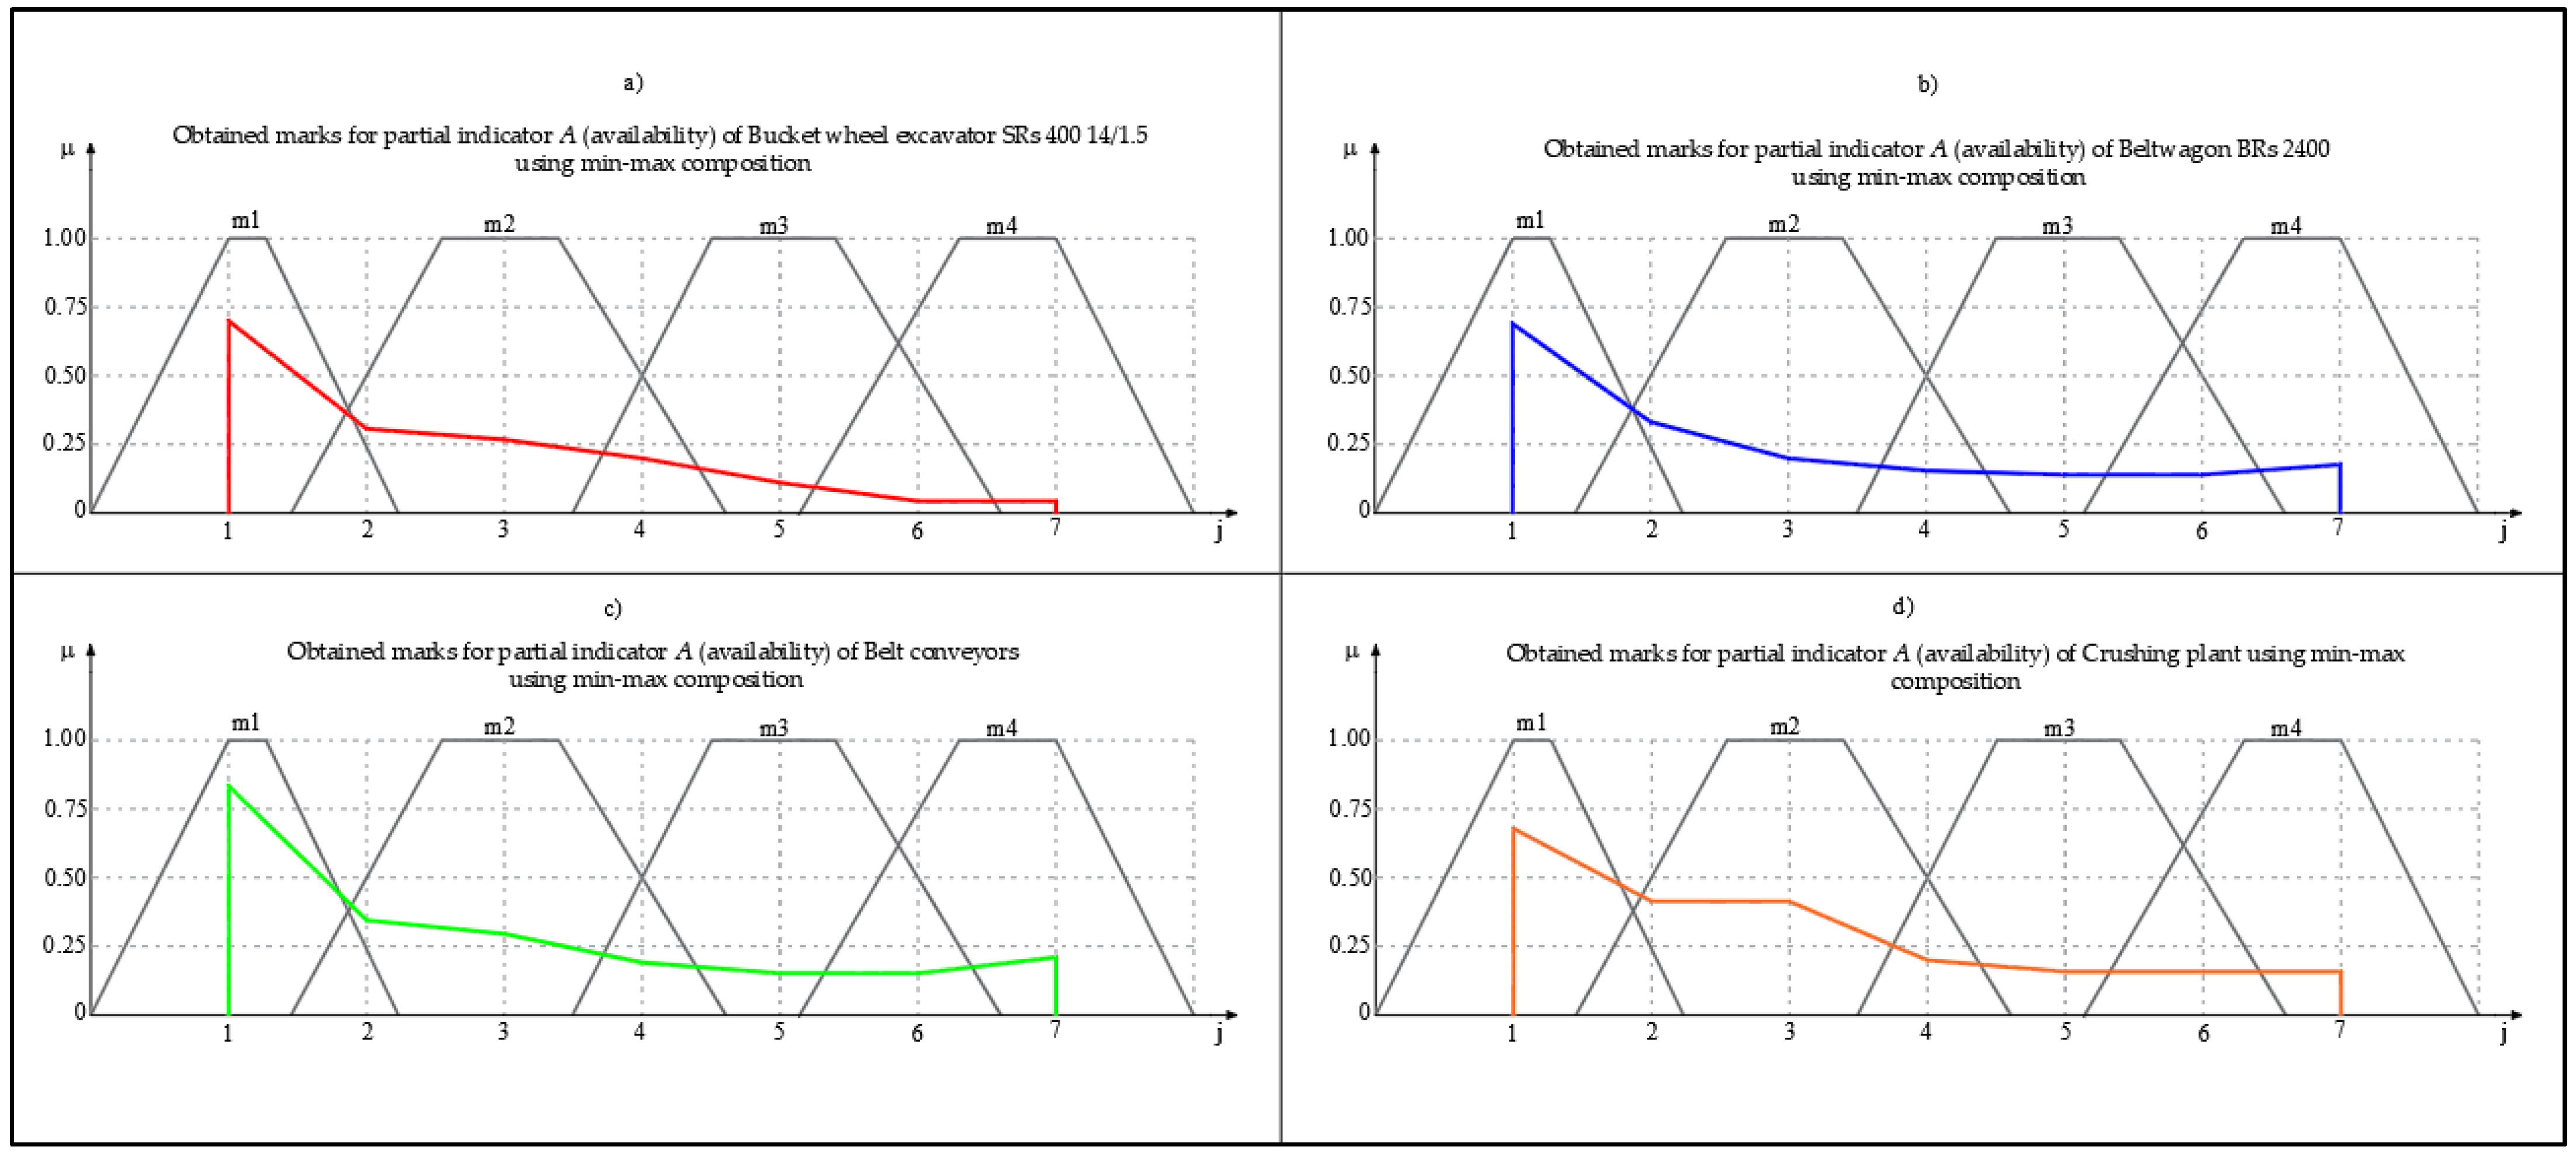
Based on the obtained ratings in the form of fuzzy number, the ratings obtained using the max–min and min–max composition for the specified parts of the system are shown in the following tables. Table 16 shows ratings obtained for availability of the system parts using max–min composition. Table 17 shows ratings obtained for availability of system parts using min–max composition.
Figure 16 shows ratings obtained for availability A of parts of the system using max–min composition—(a) bucket wheel excavator SRs 400 14/1.5, (b) Beltwagon BRs2400, (c) belt conveyors, (d) crushing plant. Figure 17 shows ratings obtained for availability of A parts of the system using min–max composition—(a) bucket wheel excavator SRs 400 14/1.5, (b) beltwagon BRs2400, (c) belt conveyors, (d) crushing plant.

3.5. Availability of Continuous System

Based on the obtained ratings of availability of the system parts (bucket wheel excavator, beltwagon, belt conveyors, crushing plant), the overall rating of availability was obtained using the max–min and min–max composition as follows (Table 18):
The application of the best fit method will be demonstrated on rating obtained by the max–min composition.
d 1 = d m a x m i n , m 1 = ( 0.14 1 ) 2 + ( 0.36 0.75 ) 2 + ( 0.36 0 ) 2 + ( 0.36 0 ) 2 + ( 0.23 0 ) 2 + ( 0.19 0.0 ) 2 + ( 0 0 ) 2 = 1.2103 d 2 = d ( m a x m i n ,   m 2 ) = ( 0.14 0 ) 2 + ( 0.36 0.5 ) 2 + ( 0.36 1 ) 2 + ( 0.36 0.5 ) 2 + ( 0.23 0 ) 2 + ( 0.19 0 ) 2 + ( 0 0 ) 2 = 0.9973 d 3 = d ( m a x m i n ,   m 3 ) = ( 0.14 0 ) 2 + ( 0.36 0 ) 2 + ( 0.36 0 ) 2 + ( 0.36 0.5 ) 2 + ( 0.23 1 ) 2 + ( 0.19 0.5 ) 2 + ( 0 0 ) 2 = 0.7466 d 4 = d ( m a x m i n ,   m 4 ) = ( 0.14 0 ) 2 + ( 0.36 0 ) 2 + ( 0.36 0 ) 2 + ( 0.36 0 ) 2 + ( 0.23 0 ) 2 + ( 0.19 0.25 ) 2 + ( 0 1 ) 2 = 1.1135
In a similar way, the value of the best fit method was obtained for the min–max composition. Table 19 shows results of the best fit method.
Calculation of the normalized reciprocal values will be demonstrated on the example of max–min composition where: d m i n = 0.7466
μ 1 = d m i n d 1 d m i n d 1 + d m i n d 2 + d m i n d 3 + d m i n d 4 = 0.7466 1.2103 0.7466 1.2103 + 0.7466 0.9937 + 0.7466 0.7466 + 0.7466 1.1135 = 0.2030
μ 2 = d m i n d 2 d m i n d 1 + d m i n d 2 + d m i n d 3 + d m i n d 4 = 0.7466 0.9937 0.7466 1.2103 + 0.7466 0.9937 + 0.7466 0.7466 + 0.7466 1.1135 = 0.2472
μ 3 = d m i n d 3 d m i n d 1 + d m i n d 2 + d m i n d 3 + d m i n d 4 = 0.7466 0.7466 0.7466 1.2103 + 0.7466 0.9937 + 0.7466 0.7466 + 0.7466 1.1135 = 0.3291
μ 4 = d m i n d 4 d m i n d 1 + d m i n d 2 + d m i n d 3 + d m i n d 4 = 0.7466 1.1135 0.7466 1.2103 + 0.7466 0.9937 + 0.7466 0.7466 + 0.7466 1.1135 = 0.2206
Reciprocal values for the min–max composition were also obtained in a similar way. Table 20 shows normalized reciprocal values of the best fit method results.
The max–min composition was used when the analyst had an interest in extracting the positive outcomes, while the min–max composition was used to separate the negative outcomes [17].
Calculation of the corresponding center of gravity of the linguistic rating Z , obtained by the max–min composition, is obtained in the following way:
Z m a x m i n = μ 1 + 2 μ 2 + 3 μ 3 + 4 μ 4 μ 1 + μ 2 + μ 3 + μ 4 = 0.2030 + 2 · 0.2472 + 3 · 0.3291 + 4 · 0.2206 0.2030 + 0.2472 + 0.3291 + 0.2206 = 2.5674
In a similar way, the center of gravity of the linguistic assessment was obtained for the min–max composition:
Z m i n m a x = 0.2910 + 2 · 0.1955 + 3 · 0.2236 + 4 · 0.3618 0.2910 + 0.1955 + 0.2236 + 0.3618 = 2.7283
It can be concluded from this that on a scale of 1–4, this system has the center of gravity of the linguistic assessment for the max–min composition 2.5674, and for the min–max composition the center of gravity of the linguistic variable is 2.7283.

4. Conclusions

This paper describes a model for assessing the availability of technical systems, as a measure of quality of service; more precisely, continuous systems at the lignite open pits, based on fuzzy set theory.
The availability of the system as a complex state parameter is decomposed into partial indicators, and fuzzy compositions used to integrate the partial indicators are the max–min and min–max compositions. Partial indicators are defined for the considered technical system. Next, phase sets were used to define indicators and phase compositions for their synthesis. In this way, a detailed inherent availability analysis is provided. The presented model can be used as a tool for quick assessment the system availability, based on the expert judgments and assessments.
In the specific case, the obtained ratings reflect the availability of the analyzed system well, considering its elements, composition, age, conditions of the working environment in which it operates, and organizational factors that can be confirmed by comparison with the availability ratings, obtained by the other methods (e.g., analytical rating).
This model for determining the availability has a role to help responsible persons at the open pit in planning and control of exploitation and adoption of an appropriate maintenance strategy, all with the aim of stable coal production and cost reduction.
The fuzzy model presented in this paper has an advantage over the conventional models because it takes into account the importance of practical indicators of availability. The necessary data for this model are the expert assessments of those involved in the operation and maintenance of mechanization, unlike the conventional models that require an IT monitoring system. The main advantage of the presented model is its simplicity and easy practical implementation. It does not require long-term monitoring or data collection to determine the temporal picture of the system state.
The model was applied to a complex technical system whose elements significantly differed in their construction and function. Each of the elements of the system was analyzed according to the same indicators and based on an expert assessment, a fuzzy rating of the indicators was given. The composition of the ratings determined the centers of gravity of the linguistic ratings, which are located in the domain of surface coal mines’ continuous system availability, determined by monitoring the time state picture. In this way, it was shown that by applying the presented model, a sufficiently precise assessment of availability can be given and that for complex technical systems whose elements are diverse and of diverse behavior, the used indicators, their expert assessment, and the applied compositions are sufficient to describe the state of the system.
Recommendations for the management of the company that the activities on maintenance, analysis of work, analysis of weak points, and life cycle of mechanization itself are adapted according to this model in order to reduce the costs of maintenance and exploitation.
This model that has been defined is applicable to all similar systems with appropriate adaptation regarding the choice of partial indicators and the description of linguistic values.

Author Contributions

Methodology, M.G. and M.T.; writing—review and editing, M.G. and S.S.; supervision, M.T. and S.S. All authors have read and agreed to the published version of the manuscript.

Funding

This work was financially supported by the Ministry of Education, Science, and Technological Development of the Republic of Serbia, Grant No. 451-03-68/2022-14/200052.

Institutional Review Board Statement

Not applicable.

Informed Consent Statement

Not applicable.

Data Availability Statement

Not applicable.

Acknowledgments

Gratitude to the Ministry of Education, Science and Technological Development of the Republic of Serbia. Mining and Metallurgy Institute Bor, Zeleni bulevar 35, Bor. PE Electric Power Industry of Serbia, Balkanska 13, 11000 Belgrade. PE Electric Power Industry of Serbia—Branch “TE-KO Kostolac”, Nikola Tesla 5-7, 12208 Kostolac.

Conflicts of Interest

The authors declare no conflict of interest.

References

  1. Djenadic, S.; Ignjatovic, D.; Tanasijevic, M.; Bugaric, U.; Jankovic, I.; Šubaranovic, T. Development of the Availability Concept by Using Fuzzy Theory with AHP Correction, A Case Study: Bulldozers in the Open-Pit Lignite Mine. Energies 2019, 12, 4044. [Google Scholar] [CrossRef]
  2. Krunic, D.J. Development of a Model of the Service Quality of Auxiliary Mechanization in Surface Lignite Mines. Ph.D. Thesis, Faculty of Mining and Geology, University of Belgrade, Belgrade, Serbia, 2021. [Google Scholar]
  3. Todorovic, J. Maintenance Engineering of Technical Systems; Yugoslav Society for Motors and Vehicles: Belgrade, Serbia, 1993. [Google Scholar]
  4. Crnogorac, M.; Tanasijević, M.; Danilović, D.; Maričić, V.K.; Leković, B. Selection of Artificial Lift Methods: A Brief Review and New Model Based on Fuzzy Logic. Energies 2020, 13, 1758. [Google Scholar] [CrossRef]
  5. Zadeh, L.A. Fuzzy sets. Inf. Control. 1965, 8, 338–353. [Google Scholar] [CrossRef]
  6. Vujic, S.; Miljanovic, I. Fazi Logic in Mining; Academy of Engineering Sciences of Serbia, Rudarski Institut d.o.o. Belgrade: Belgrade, Serbia, 2013; ISBN 978-86-87035-09-6. [Google Scholar]
  7. Miodragovic, R.; Tanasijevic, M.; Mileusnic, Z.; Jovancic, P. Effectiveness Assessment of Agricultural Machinery Based on Fuzzy Sets Theory. Expert Syst. Appl. 2012, 39, 8940–8946. [Google Scholar] [CrossRef]
  8. Tanasijevic, M.; Ivezic, D.; Jovancic, P.; Catic, D.; Zlatanovic, D. Study of Dependability Evaluation for Multi-hierarchical Systems Based on Max-Min Composition. Qual. Reliab. Eng. Int. 2013, 29, 317–326. [Google Scholar] [CrossRef]
  9. Ivezic, D.; Tanasijevic, M.; Jovancic, P.; Đuric, R. A Fuzzy Expert Model for Availability Evaluation. In Proceedings of the 20th International Carpathian Control Conference (ICCC), Krakow-Wieliczka, Poland, 26–29 May 2019. [Google Scholar] [CrossRef]
  10. Krunic, D.J.; Tanasijevic, M.; Vujic, S. Fuzzy logic model for safety assessment of the functioning of mechanization in surface mines. In Rudarski Glasnik; Mining Institute Belgrade, Academy of Engineering Sciences of Serbia: Belgrade, Serbia, 2018; pp. 99–106. [Google Scholar]
  11. Krunic, D.J.; Tanasijevic, M.; Vujic, S. Application of fuzzy logic modeling in the evaluation of the safety of the functioning of mechanization in surface mines. In Rudarski Glasnik; Mining Institute Belgrade, Academy of Engineering Sciences of Serbia: Belgrade, Serbia, 2018; pp. 107–119. [Google Scholar]
  12. Jovancic, P.; Tanasijevic, M.; Milisavljevic, V.; Cvijetic, A.; Ivezic, D.; Bugaric, U. Applying the Fuzzy Inference Model in Maintenance Centered to Safety: Case Study—Bucket Wheel Excavator. In Applications and Challenges of Maintenance and Safety Engineering in Industry 4.0; IGI Global: Hershey, PA, USA, 2020. [Google Scholar] [CrossRef]
  13. Polovina, D.; Ivkovic, S.; Ignjatovic, D.; Tanasijevic, M. Remaining Operational Capabilities Evaluation of Bucket Wheel Excavator by Applying Expert Assessment Method with Empirical Correction Factor. Struct. Integr. Life 2010, 10, 31–41. [Google Scholar]
  14. De Lilla, E. Continuous Surface Mining Equipment: How to Achieve Success. Int. J. Rock Mech. Min. Sci. Geomech. Abstr. 1995, 4, 171A. [Google Scholar]
  15. Shishvan, M.; Benndorf, J. Performance Optimization of complex continuous mining system using stochastic simulation. In Engineering Optimization 2014, Proceedings of the 4th International Conference on Engineering Optimization, Lisbon, Portugal, 8–11 September 2014; CRC Press: Boca Raton, FL, USA, 2014; pp. 273–278. [Google Scholar]
  16. Kawalec, W. Short-Term Scheduling and Blending in a Lignite Open Pit Mine with BWEs. In Proceedings of the 13th International Symposium on Mining Planning and Equipment Selection, Wroclaw, Poland, 1–3 September 2004; Taylor & Francis Group: London, UK, 2004; pp. 53–59. [Google Scholar]
  17. Sebutsoe, T.C.; Musingwini, C. Characterizing a mining production system for decision-making purposes in a platinum mine. J. South. Afr. Inst. Min. Met. 2017, 117, 199–206. [Google Scholar] [CrossRef]
  18. Study: Selection of Optimal Maintenance System at the Lignite Basin Kostolac, Public Enterprise “Electric Power Industry of Serbia”; University of Belgrade, Faculty of Mining and Geology, Faculty of Electrical Engineering: Belgrade, Serbia, 2006.
  19. Gomilanovic, M.; Stanic, N.; Milijanovic, D.; Stepanovic, S.; Milijanovic, A. Predicting the Availability of Continuous Mining Systems Using LSTM Neural Network. Adv. Mech. Eng. 2022, 14, 16878132221081584. [Google Scholar] [CrossRef]
  20. Ivkovic, S. Failures of Mining Machine Elements; University in Belgrade, Faculty of Mining and Geology: Belgrade, Serbia, 1997. [Google Scholar]
  21. Jovancic, P. Održavanje rudarskih mašina. In Rudarsko-Geološki Fakultet; Univerzitet u Beogradu: Beograd, Serbia, 2014; ISBN 978-86-7352-250-0. [Google Scholar]
  22. Wang, J.; Yang, J.B.; Sen, P. Safety Analyses and Synthesis Using Fuzzy Sets and Evidential Reasoning. Reliab. Eng. Syst. Saf. 1995, 47, 103–118. [Google Scholar] [CrossRef]
  23. Klir, G.J.; Yuan, B. Fuzzy Sets and Fuzzy Logic, Theory and Applications; Prentice Hall: New York, NY, USA, 1995. [Google Scholar]
  24. Wang, J. A Subjective Modelling Tool Applied to Formal Ship Safety Assessment. Ocean. Eng. 2000, 27, 1019–1035. [Google Scholar] [CrossRef]
Figure 1. The open pit Drmno–Kostolac (photographed by the author of the article: M.G.).
Energies 15 06786 g001
Figure 2. Bucket wheel excavator SRs 400.14/1.5 [19].
Energies 15 06786 g002
Figure 3. Beltwagon BRs 2400 [19].
Energies 15 06786 g003
Figure 4. Crushing plant at the open pit Drmno (photographed by the author of the article: M.G.).
Energies 15 06786 g004
Figure 5. Time picture of the state [1,19].
Energies 15 06786 g005
Figure 6. Presentation of the partial availability indicators.
Energies 15 06786 g006
Figure 7. Fuzzy sets for R-reliability, M-maintainability, o-overload, and A-availability.
Energies 15 06786 g007
Figure 8. Fuzzy sets for m-manipulativeness, t-maintainability, s-standardization.
Energies 15 06786 g008
Figure 9. Fuzzy sets for d-diagnostics and u-unification.
Energies 15 06786 g009
Figure 10. Fuzzy sets for e-tools and equipment, c-age of mechanization, and b-basic engineering.
Energies 15 06786 g010
Figure 11. Fuzzy model algorithm for availability assessment.
Energies 15 06786 g011
Figure 12. Ratings obtained for partial indicator R (reliability) of the system parts using max–min composition—(a) bucket wheel excavator SRs 400 14/1.5, (b) beltwagon BRs 2400, (c) belt conveyors, (d) crushing plant.
Energies 15 06786 g012
Figure 13. Ratings obtained for partial indicator R (reliability) of the system parts using min–max composition—(a) bucket wheel excavator SRs 400 14/1.5, (b) beltwagon BRs 2400, (c) belt conveyors, (d) crushing plant.
Energies 15 06786 g013
Figure 14. Ratings obtained for partial indicator M (maintainability) of the system parts using max–min composition—(a) bucket wheel excavator SRs 400 14/1.5, (b) beltwagon BRs2400, (c) belt conveyors, (d) crushing plant.
Energies 15 06786 g014
Figure 15. Ratings obtained for partial indicator M (maintainability) of the system parts using min–max composition—(a) bucket wheel excavator SRs 400 14/1.5, (b) beltwagon BRs2400, (c) belt conveyors, (d) crushing plant.
Energies 15 06786 g015
Figure 16. Ratings obtained for availability A of parts of the system using max–min composition—(a) bucket wheel excavator SRs 400 14/1.5, (b) beltwagon BRs2400, (c) belt conveyors, (d) crushing plant.
Energies 15 06786 g016
Figure 17. Ratings obtained for availability of A parts of the system using min–max composition—(a) bucket wheel excavator SRs 400 14/1.5, (b) beltwagon BRs2400, (c) belt conveyors, (d) crushing plant.
Energies 15 06786 g017
Table 1. The obtained assessments for partial indicator o -load.
Expert m1m2m3m4
100.50.50
2000.30.7
3000.50.5
4000.10.9
5000.30.7
6000.40.6
7000.30.6
8000.20.8
9000.20.8
10000.60.4
Table 2. Ratings of reliability indicators for bucket wheel excavator SRs 400.14/1.5 and beltwagon BRs 2400.
Bucket Wheel Excavator SRs 400.14/1.5—RatingsBeltwagon BRs 2400—Ratings
m1m2m3m4m1m2m3m4
o 0.00000.05000.34000.61000.00000.06000.29000.6500
c 0.04000.54500.4150 0.19000.76000.0500
b 0.00000.31000.6900 0.00000.29000.7100
Table 3. Ratings of reliability indicators for belt conveyors and crushing plant.
Belt Conveyors—RatingsCrushing Plant—Ratings
m1m2m3m4m1m2m3m4
o 0.00000.00000.38000.62000.00000.40000.31000.6500
c 0.21000.65000.1400 0.14000.44000.4200
b 0.00000.20000.8000 0.00000.48000.5200
Table 4. Transformation of ratings in fuzzy number.
f1f2f3f4f5f6f7
m10 × 00 × 00 × 00 × 00 × 00 × 0.750 × 1
m20.05 × 00.05 × 00.05 × 00.05 × 0.50.05 × 10.05 × 0.250.05 × 0
m30.34 × 00.34 × 0.250.34 × 10.34 × 0.50.34 × 00.34 × 00.34 × 0
m40.61 × 10.61 × 0.750.61 × 00.61 × 00.61 × 00.61 × 00.61 × 0
Σ0.61000.62750.34000.19500.05000.02500.0000
Table 5. Final rating for partial indicators o, b, and c for bucket wheel excavator SRs 400.14/1.5, beltwagon BRs 2400 in the form of fuzzy number.
Bucket Wheel Excavator SRs 400.14/1.5—Fuzzy NumberBeltwagon BRs 2400—Fuzzy Number
f1f2f3f4f5f6f7f1f2f3f4f5f6f7
o 0.61000.62750.34000.19500.05000.0250.00000.65000.63250.29000.17500.60000.30000.0000
c 0.26000.26000.65000.65000.65000.09000.09000.05000.05000.76000.76000.76000.19000.1900
b 0.69000.69000.31000.31000.31000.00000.00000.71000.71000.29000.29000.29000.00000.0000
Table 6. Final rating for partial indicators o, b, and c for belt conveyors and crushing plant in the form of fuzzy number.
Belt Conveyors—Fuzzy NumberCrushing Plant—Fuzzy Number
f1f2f3f4f5f6f7f1f2f3f4f5f6f7
o 0.62000.65500.38000.19000.00000.00000.00000.65000.64250.31000.17500.04000.02000.0000
c 0.14000.14000.65000.65000.65000.21000.21000.42000.42000.44000.44000.44000.14000.1400
b 0.80000.80000.20000.20000.20000.00000.00000.52000.52000.48000.48000.48000.00000.0000
Table 7. Calculation of max–min and min–max compositions for first 15 and last 15 combinations.
CombµMinMax
12345671234567
1-1-11(0.61, 0.26, 0.69)0.26 0.69
1-1-22(0.61, 0.26, 0.69) 0.26 0.69
1-1-32(0.61, 0.26, 0.31) 0.26 0.61
1-1-42(0.61, 0.26, 0.31) 0.26 0.61
1-1-53(0.61, 0.26, 0.31) 0.26 0.61
1-1-63(0.61, 0.26, 0.00) 0.00 0.61
1-1-73(0.61, 0.26, 0.00) 0.00 0.61
1-2-12(0.61, 0.26, 0.69) 0.26 0.69
1-2-22(0.61, 0.26, 0.69) 0.26 0.69
1-2-32(0.61, 0.26, 0.31) 0.26 0.61
1-2-43(0.61, 0.26, 0.31) 0.26 0.61
1-2-53(0.61, 0.26, 0.31) 0.26 0.61
1-2-63(0.61, 0.26, 0.00) 0.00 0.61
1-2-74(0.61, 0.26, 0.00) 0.00 0.61
1-3-12(0.61, 0.65, 0.69) 0.61 0.69
7-5-77(0.00, 0.65, 0.00) 0.00 0.65
7-6-15(0.00, 0.09, 0.69) 0.00 0.69
7-6-25(0.00, 0.09, 0.69) 0.00 0.69
7-6-36(0.00, 0.09, 0.31) 0.00 0.31
7-6-46(0.00, 0.09, 0.31) 0.00 0.31
7-6-56(0.00, 0.09, 0.31) 0.00 0.31
7-6-67(0.00, 0.09, 0.00) 0.00 0.09
7-6-77(0.00, 0.09, 0.00) 0.00 0.09
7-7-15(0.00, 0.09, 0.69) 0.00 0.69
7-7-26(0.00, 0.09, 0.69) 0.00 0.69
7-7-36(0.00, 0.09, 0.31) 0.00 0.31
7-7-46(0.00, 0.09, 0.31) 0.00 0.31
7-7-57(0.00, 0.09, 0.31) 0.00 0.31
7-7-67(0.00, 0.09, 0.00) 0.00 0.09
7-7-77(0.00, 0.09, 0.00) 0.00 0.09
max0.260.630.630.310.200.050.00
min 0.690.340.310.260.200.090.09
Table 8. Ratings obtained for the partial indicator of reliability using max–min composition.
R - Reliability f1f2f3f4f5f6f7
Bucket wheel excavator SRs 400 14/1.50.26000.63000.63000.31000.20000.05000.0000
Beltwagon BRs 24000.05000.65000.65000.29000.19000.06000.0000
Belt conveyors0.14000.65000.65000.65000.21000.19000.0000
Crushing plant0.42000.44000.44000.44000.17500.04000.0000
Table 9. Ratings obtained for partial indicator R (reliability) of the system parts using min–max composition.
R - Reliability f1f2f3f4f5f6f7
Bucket wheel excavator SRs 400 14/1.50.69000.34000.31000.26000.20000.09000.0900
Beltwagon BRs 24000.71000.29000.29000.05000.05000.19000.1900
Belt conveyors0.62000.19000.14000.14000.21000.21000.2100
Crushing plant0.64250.48000.42000.42000.17500.14000.1400
Table 10. Ratings of maintainability indicator for bucket wheel excavator SRs 400.14/1.5 beltwagon BRs 2400.
M Bucket Wheel Excavator SRs 400.14/1.5—RatingsBeltwagon BRs 2400—Ratings
m1m2m3m4m1m2m3m4
t 0.00000.18000.53500.28500.00000.11000.55500.3350
e 0.04000.54500.4150 0.00000.53500.4650
u 0.06000.37500.19000.10000.00000.33000.53000.1400
d 0.05000.31000.45000.19000.00000.23000.54000.2300
m 0.03000.34000.40000.23000.12000.37000.33000.1800
s 0.05500.41500.44000.09000.07000.41000.43000.0900
Table 11. Ratings of maintainability indicator for belt conveyors and crushing plant.
M Belt Conveyors—RatingsCrushing Plant—Ratings
m1m2m3m4m1m2m3m4
t 0.00000.07000.44000.49000.00000.13000.51500.3550
e 0.04000.56000.4000 0.00000.54500.4550
u 0.04500.24500.35000.36000.00000.33000.53000.1400
d 0.00000.10000.47000.43000.00000.25000.53000.2200
m 0.09000.21000.39000.31000.11000.37000.34000.1800
s 0.05500.32500.45000.17000.03000.44000.44000.0900
Table 12. Final rating for partial indicators t , e , u , d , m , s , for bucket wheel excavator SRs 400.14/1.5, beltwagon BRs 2400 in the form of fuzzy number.
Bucket Wheel Excavator SRs 400.14/1.5—Fuzzy NumberBeltwagon BRs 2400—Fuzzy Number
f1f2f3f4f5f6f7f1f2f3f4f5f6f7
t 0.28500.34750.53500.35750.18000.04500.00000.33500.39000.55500.33250.11000.02750.0000
e 0.41500.41500.54500.54500.54500.04000.04000.46500.46500.53500.53500.53500.00000.0000
u 0.10000.46500.46500.42000.37500.37500.06000.14000.53000.53000.43000.33000.33000.0000
d 0.19000.45000.45000.38000.31000.31000.05000.23000.54000.54000.38500.23000.23000.0000
m 0.23000.27250.40000.37000.34000.10750.03000.18000.21750.33000.35000.37000.18250.1200
s 0.09000.17750.44000.42750.41500.14500.05500.09000.17500.43000.42000.41000.15500.0700
Table 13. Final rating for partial indicators t , e , u, d , m , s , for belt conveyors and crushing plant in the form of fuzzy number.
Belt Conveyors—Fuzzy NumberCrushing Plant—Fuzzy Number
f1f2f3f4f5f6f7f1f2f3f4f5f6f7
t 0.28500.34750.53500.35750.18000.04500.00000.28500.34750.53500.35750.18000.04500.0000
e 0.41500.41500.54500.54500.54500.04000.04000.41500.41500.54500.54500.54500.04000.0400
u 0.10000.46500.46500.42000.37500.37500.06000.10000.46500.46500.42000.37500.37500.0600
d 0.19000.45000.45000.38000.31000.31000.05000.19000.45000.45000.38000.31000.31000.0500
m 0.23000.27250.40000.37000.34000.10750.03000.23000.27250.40000.37000.34000.10750.0300
s 0.09000.17750.44000.42750.41500.14500.05500.09000.17750.44000.42750.41500.14500.0550
Table 14. Ratings obtained for partial maintainability indicator using max–min composition.
M - Maintainability   ( Max Min ) f1f2f3f4f5f6f7
Bucket wheel excavator SRs 400 14/1.50.17750.39990.39990.39990.3750.30990.0400
Beltwagon BRs 24000.17500.37000.37000.37000.37000.23000.0000
Belt conveyors0.17750.40000.40000.40000.37500.31000.0400
Crushing plant0.17750.40000.40000.40000.37500.31000.0400
Table 15. Ratings obtained for partial indicator maintainability using min–max composition.
M Maintainability   ( Min Max ) f1f2f3f4f5f6f7
Bucket wheel excavator SRs 400 14/1.50.41500.23000.19000.10750.10000.09000.0600
Beltwagon BRs 24000.46500.23000.23000.14000.14000.12000.1200
Belt conveyors0.44000.40000.31000.24500.17000.09000.0900
Crushing plant0.45500.22000.22000.14000.14000.11000.1100
Table 16. Ratings obtained for availability of the system parts using max–min composition.
Availability- A   ( Max Min ) f1f2f3f4f5f6f7
Bucket wheel excavator SRs 400 14/1.50.18000.40000.40000.40000.31000.20000.0000
Beltwagon BRs 24000.05000.37000.37000.37000.23000.19000.0000
Belt conveyors0.14000.36000.36000.36000.20000.12000.0000
Crushing plant0.17750.37000.37000.37000.25000.17500.0000
Table 17. Ratings obtained for availability of system parts using min–max composition.
Availability- A   ( Min Max ) f1f2f3f4f5f6f7
Bucket wheel excavator SRs 400 14/1.50.69000.31000.26000.19000.11000.09000.0900
Beltwagon BRs 24000.71000.29000.23000.14000.12000.12000.1900
Belt conveyors0.80000.35000.30000.17000.14000.14000.2100
Crushing plant0.64200.42000.42000.17500.14000.14000.1400
Table 18. The overall ratings of availability using max-min and min-max composition.
max–min0.14000.36000.36000.36000.23000.19000.0000
min–max0.71000.35000.29000.17000.14000.14000.1900
Table 19. Results of the best fit method.
d 1 d 2 d 3 d 4
max–min1.21030.99370.74661.1135
min–max1.19471.31331.10220.6575
Table 20. Normalized reciprocal values of the best fit method results.
μ 1 μ 2 μ 3 μ 4
max–min0.20300.24720.32910.2206
min–max0.29100.19550.22360.3618
Publisher’s Note: MDPI stays neutral with regard to jurisdictional claims in published maps and institutional affiliations.