
Performance Evaluation of a Nearly Zero-Energy Office Building in Temperate Oceanic Climate Based on Field Measurements


Abstract
1. Introduction
- How do the indoor thermal comfort conditions vary in the reference building?
- How do space cooling and heating energy use vary in the reference building?
- How do greenhouse gas emissions vary in the reference building?
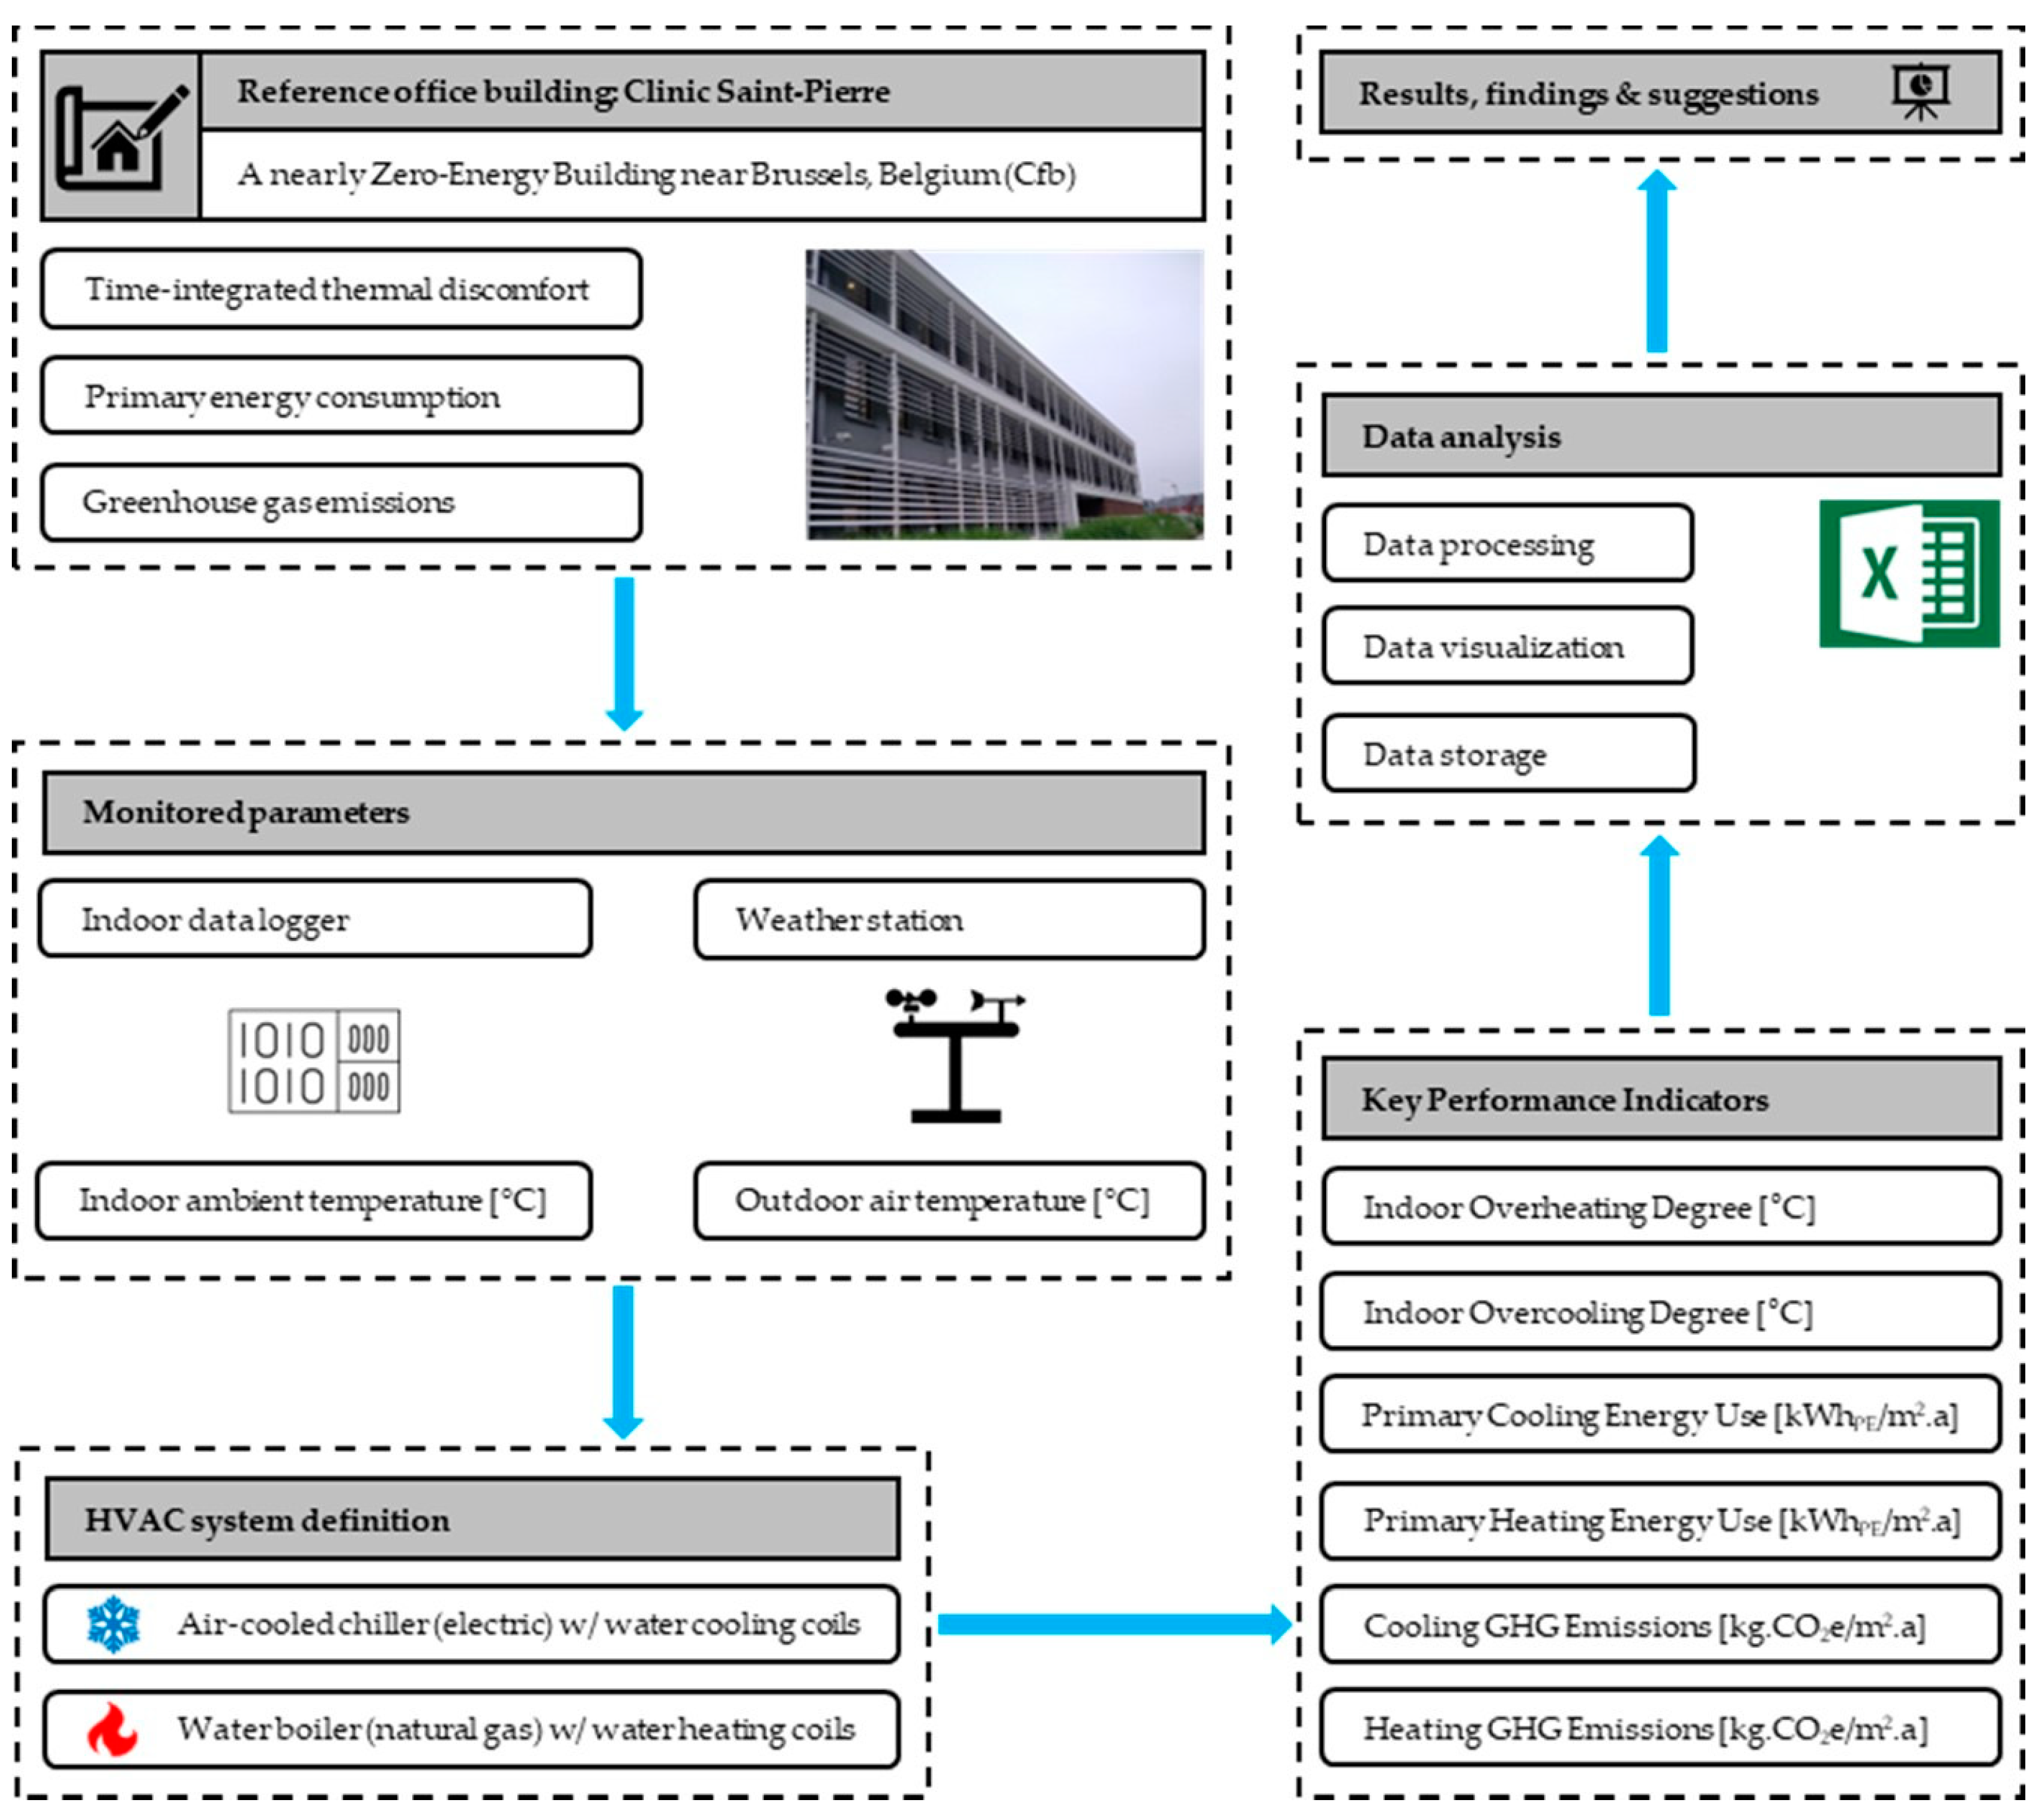
2. Methodology
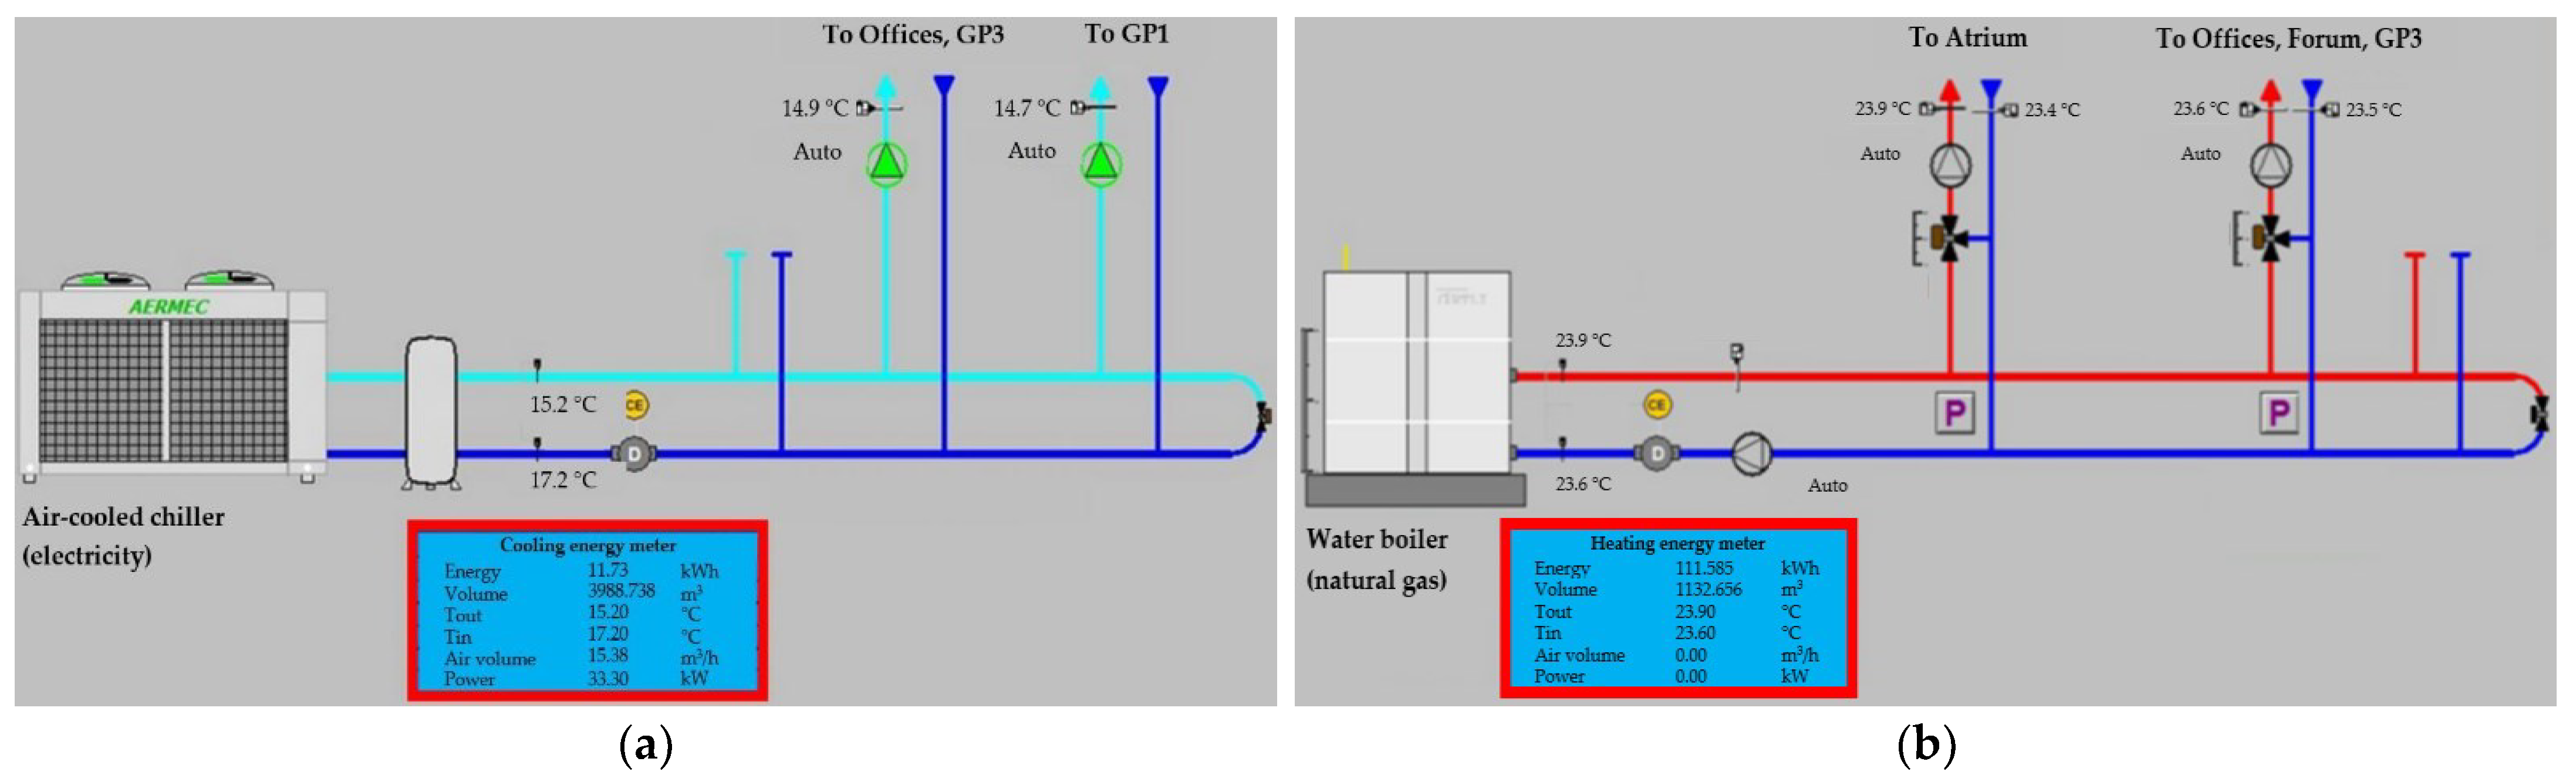
- A real office building located in Brussels, Belgium, with a baseline HVAC system of an air-cooled chiller (electric) with water cooling coils and a water boiler (natural gas) with water heating coils was identified.
- The building performance parameters for thermal comfort and energy use were extracted from the energy management system (EMS) maintained by Equans and from the weather station outside the building from May 2018 to April 2019.
- The collected data were analyzed using the key performance indicators (KPIs) that quantified the time-integrated thermal discomfort, site cooling and heating energy use, primary cooling and heating energy use, and cooling and heating GHG emissions.
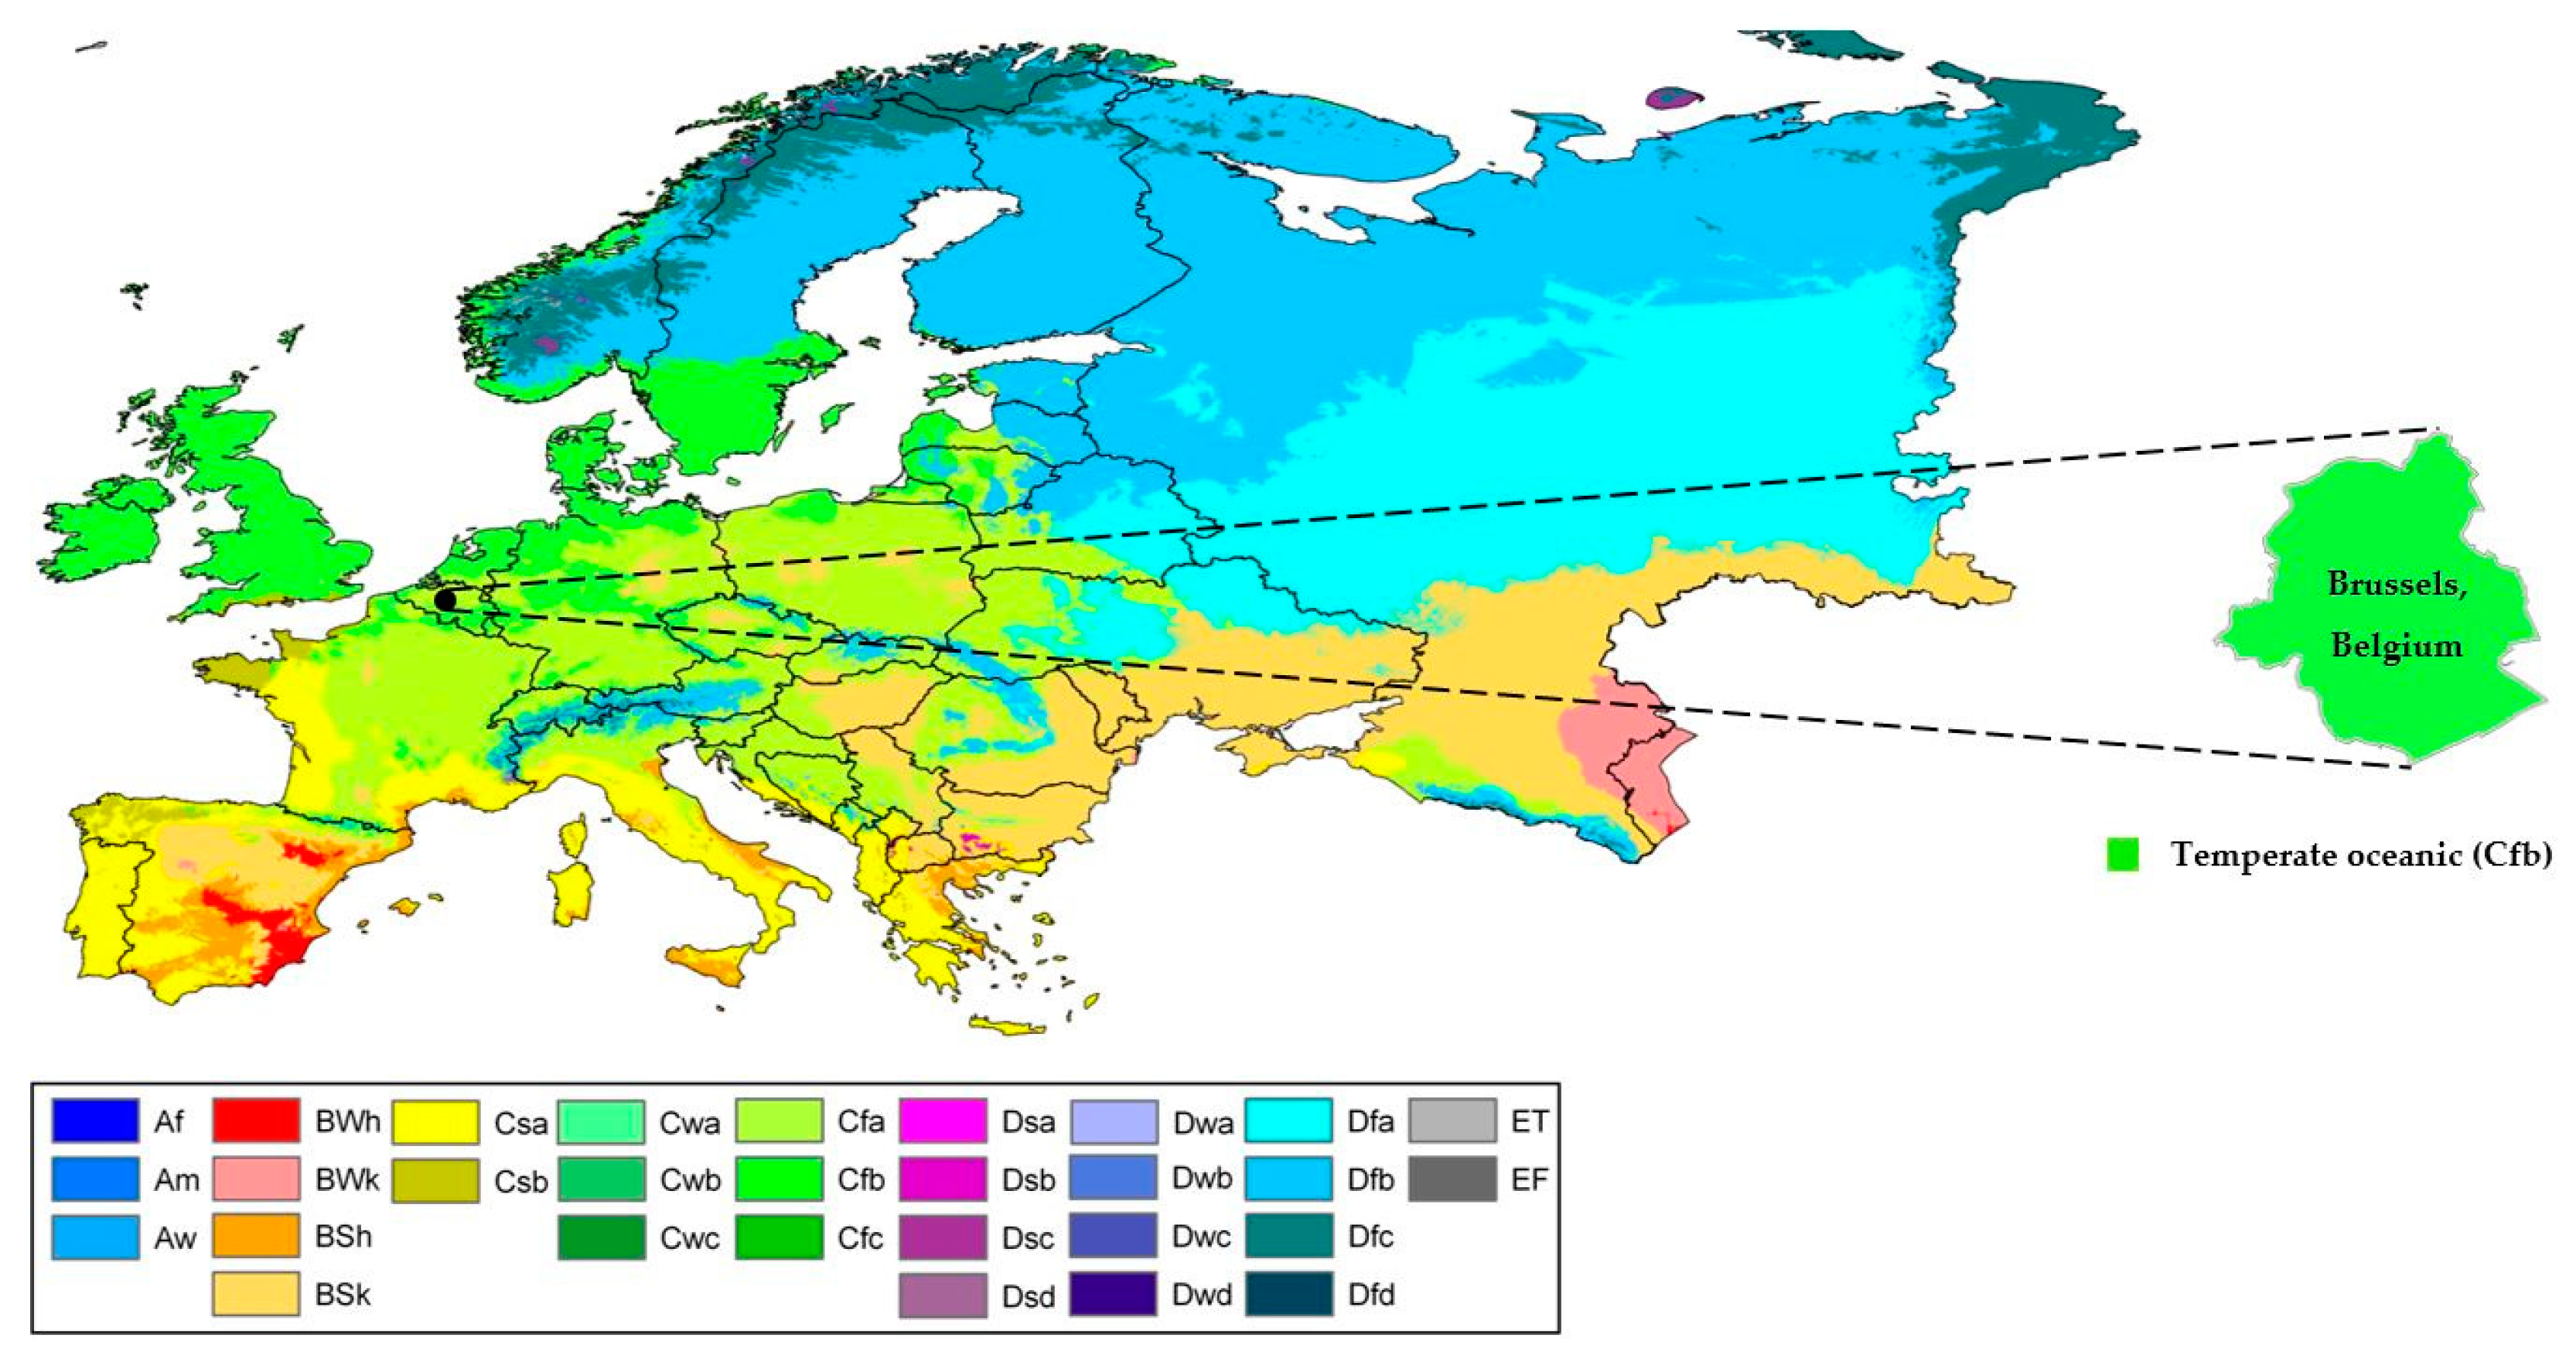
2.1. Climate Data
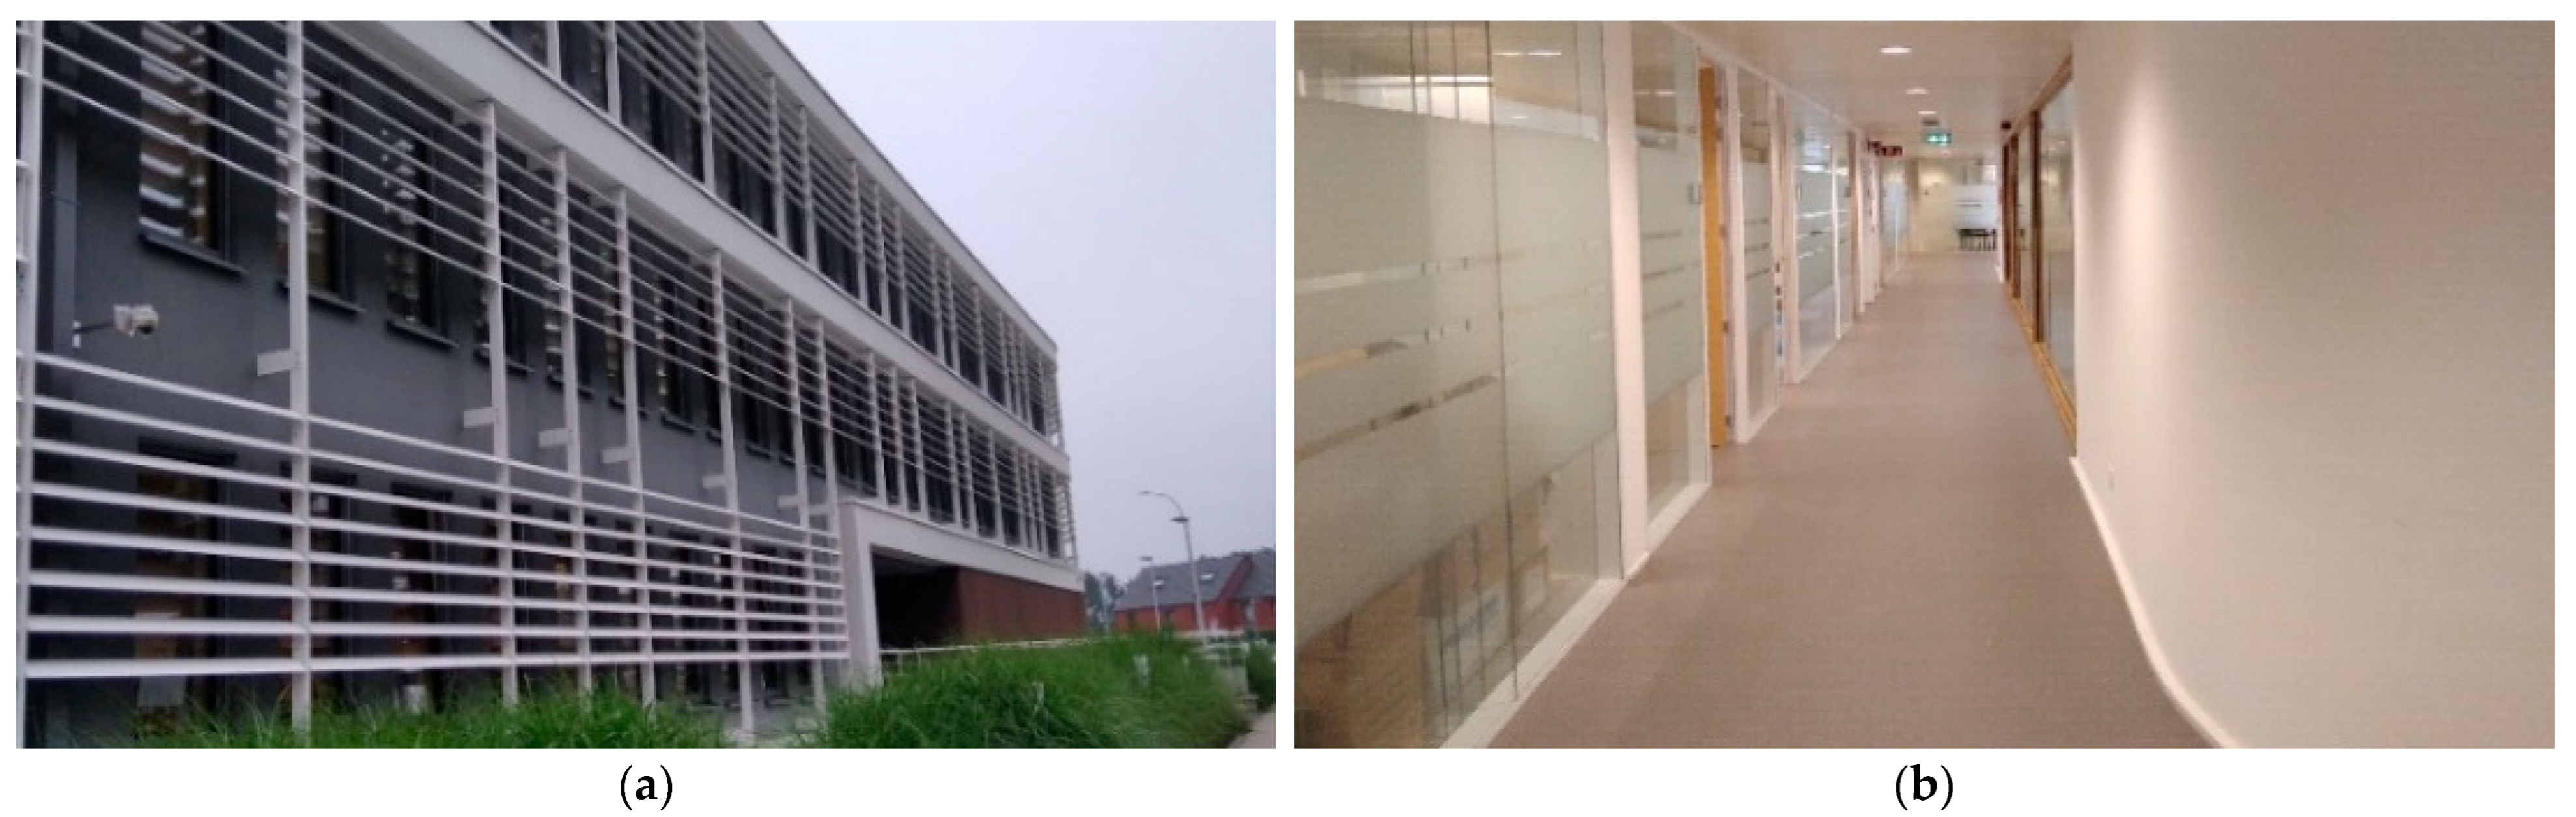
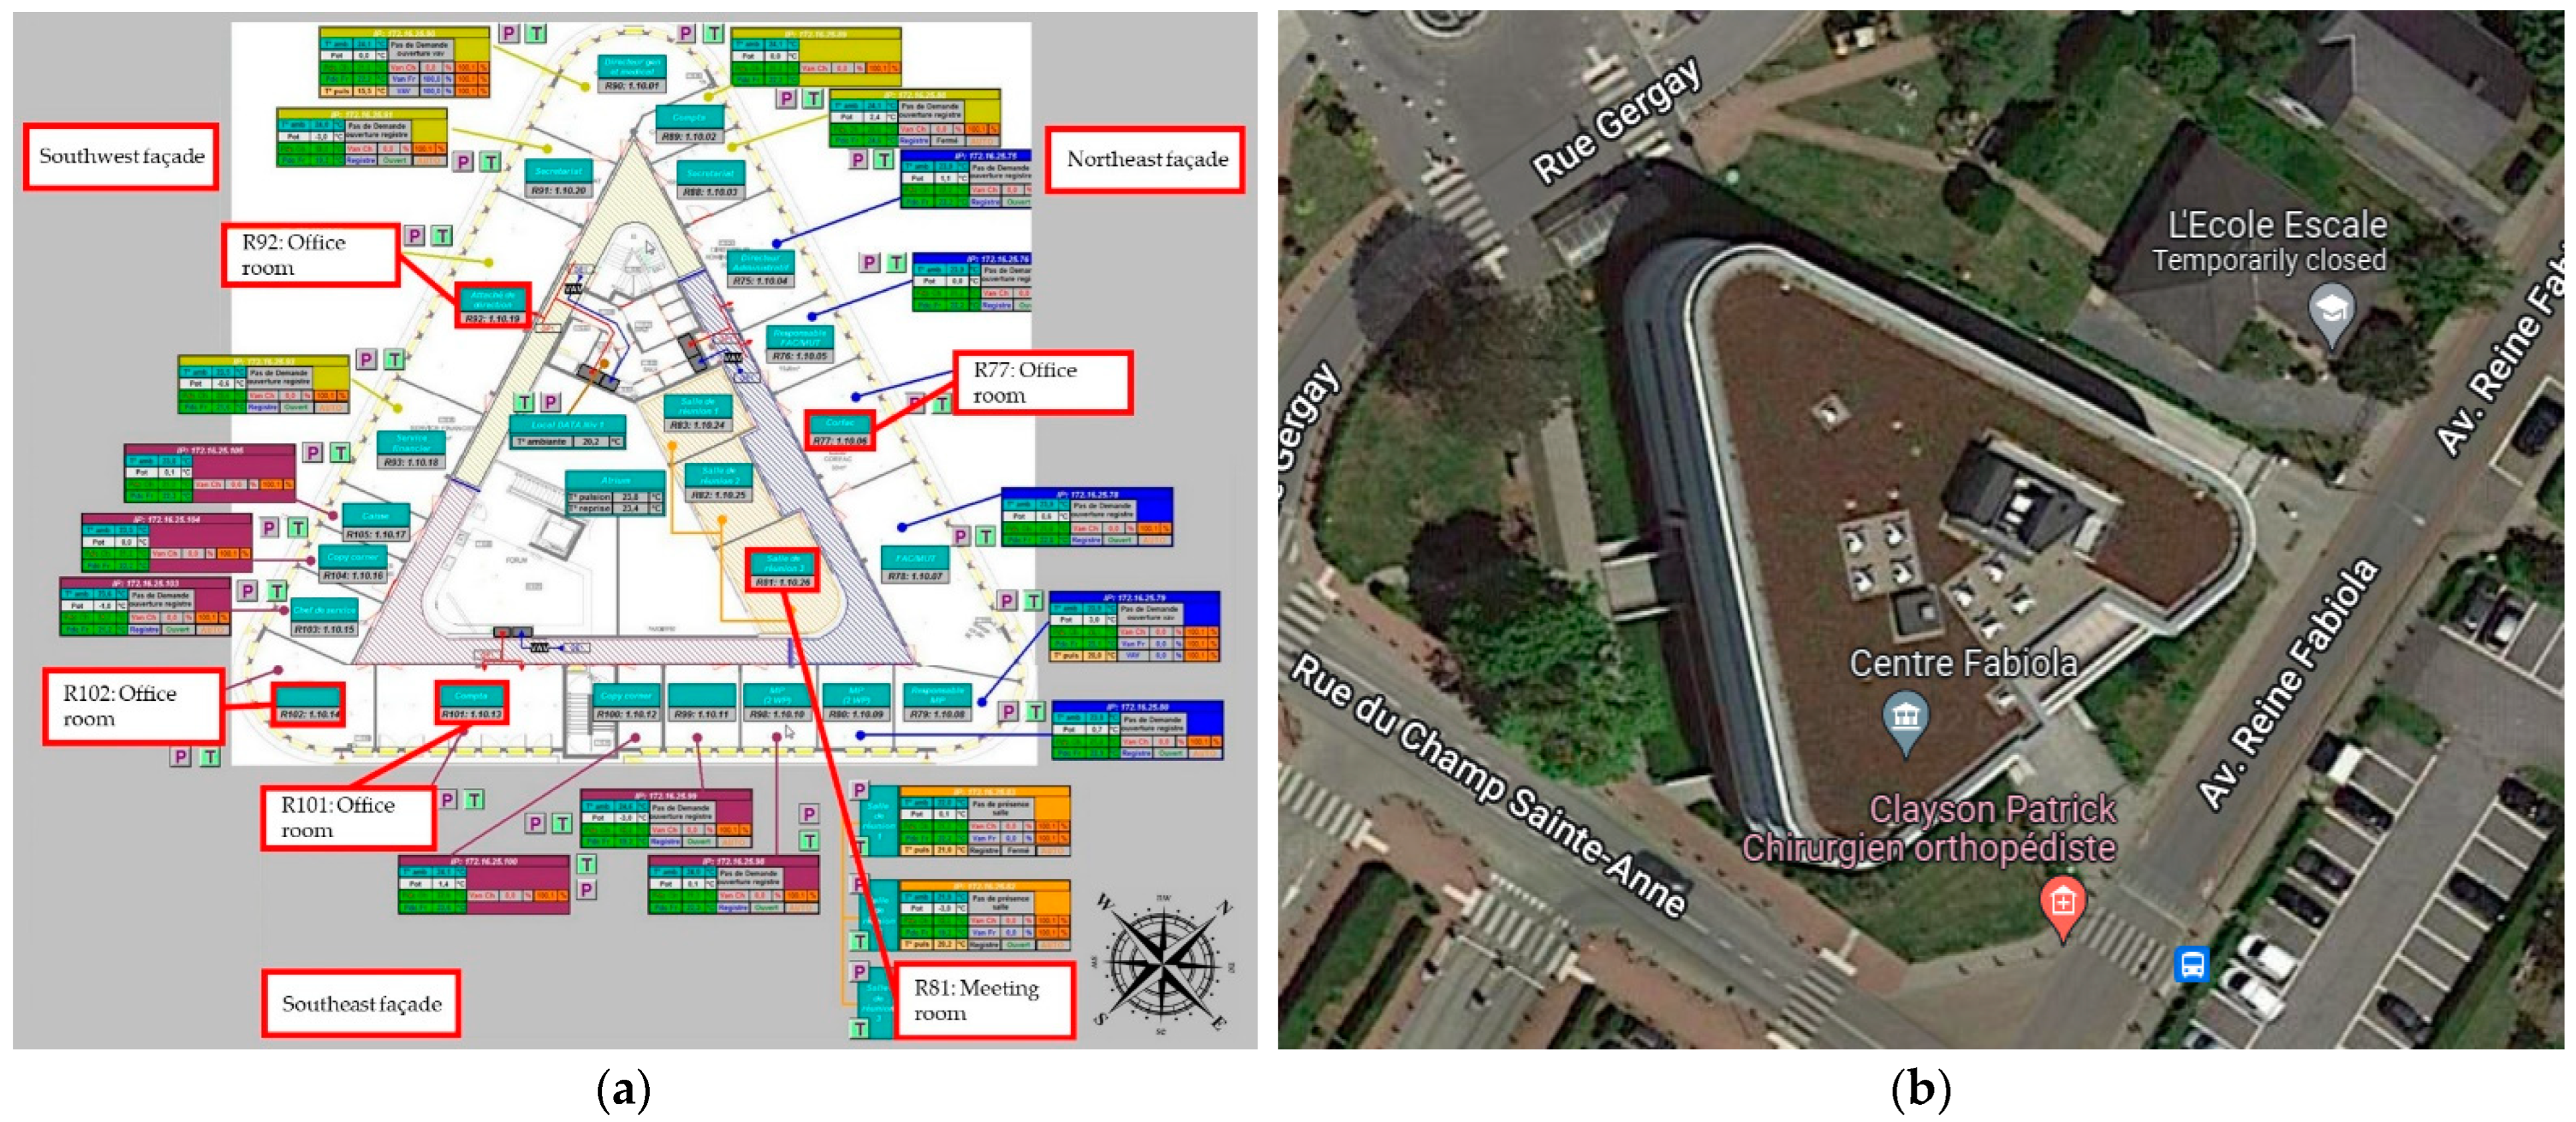
2.2. Reference Building
- Monitoring, regulating, and communicating the energy used by the building.
- Planning energy use according to usage patterns and needs, considering the costs.
- Managing the energy demand from various office equipment.
- The external walls consist of three layers. Cast concrete, MW glass wool roll, and plasterboard are used from the outer layer to the inner layer.
- The ground floor consists of four layers. Urea formaldehyde foam, cast concrete, floor screed, and timber flooring are used from the outer layer to the inner layer.
- The internal floors consist of a layer of an aerated concrete slab.
- The external roof consists of four layers. Asphalt, MW glass wool roll, air gap, and plasterboard are used from the outer layer to the inner layer.
2.3. Performance Evaluation
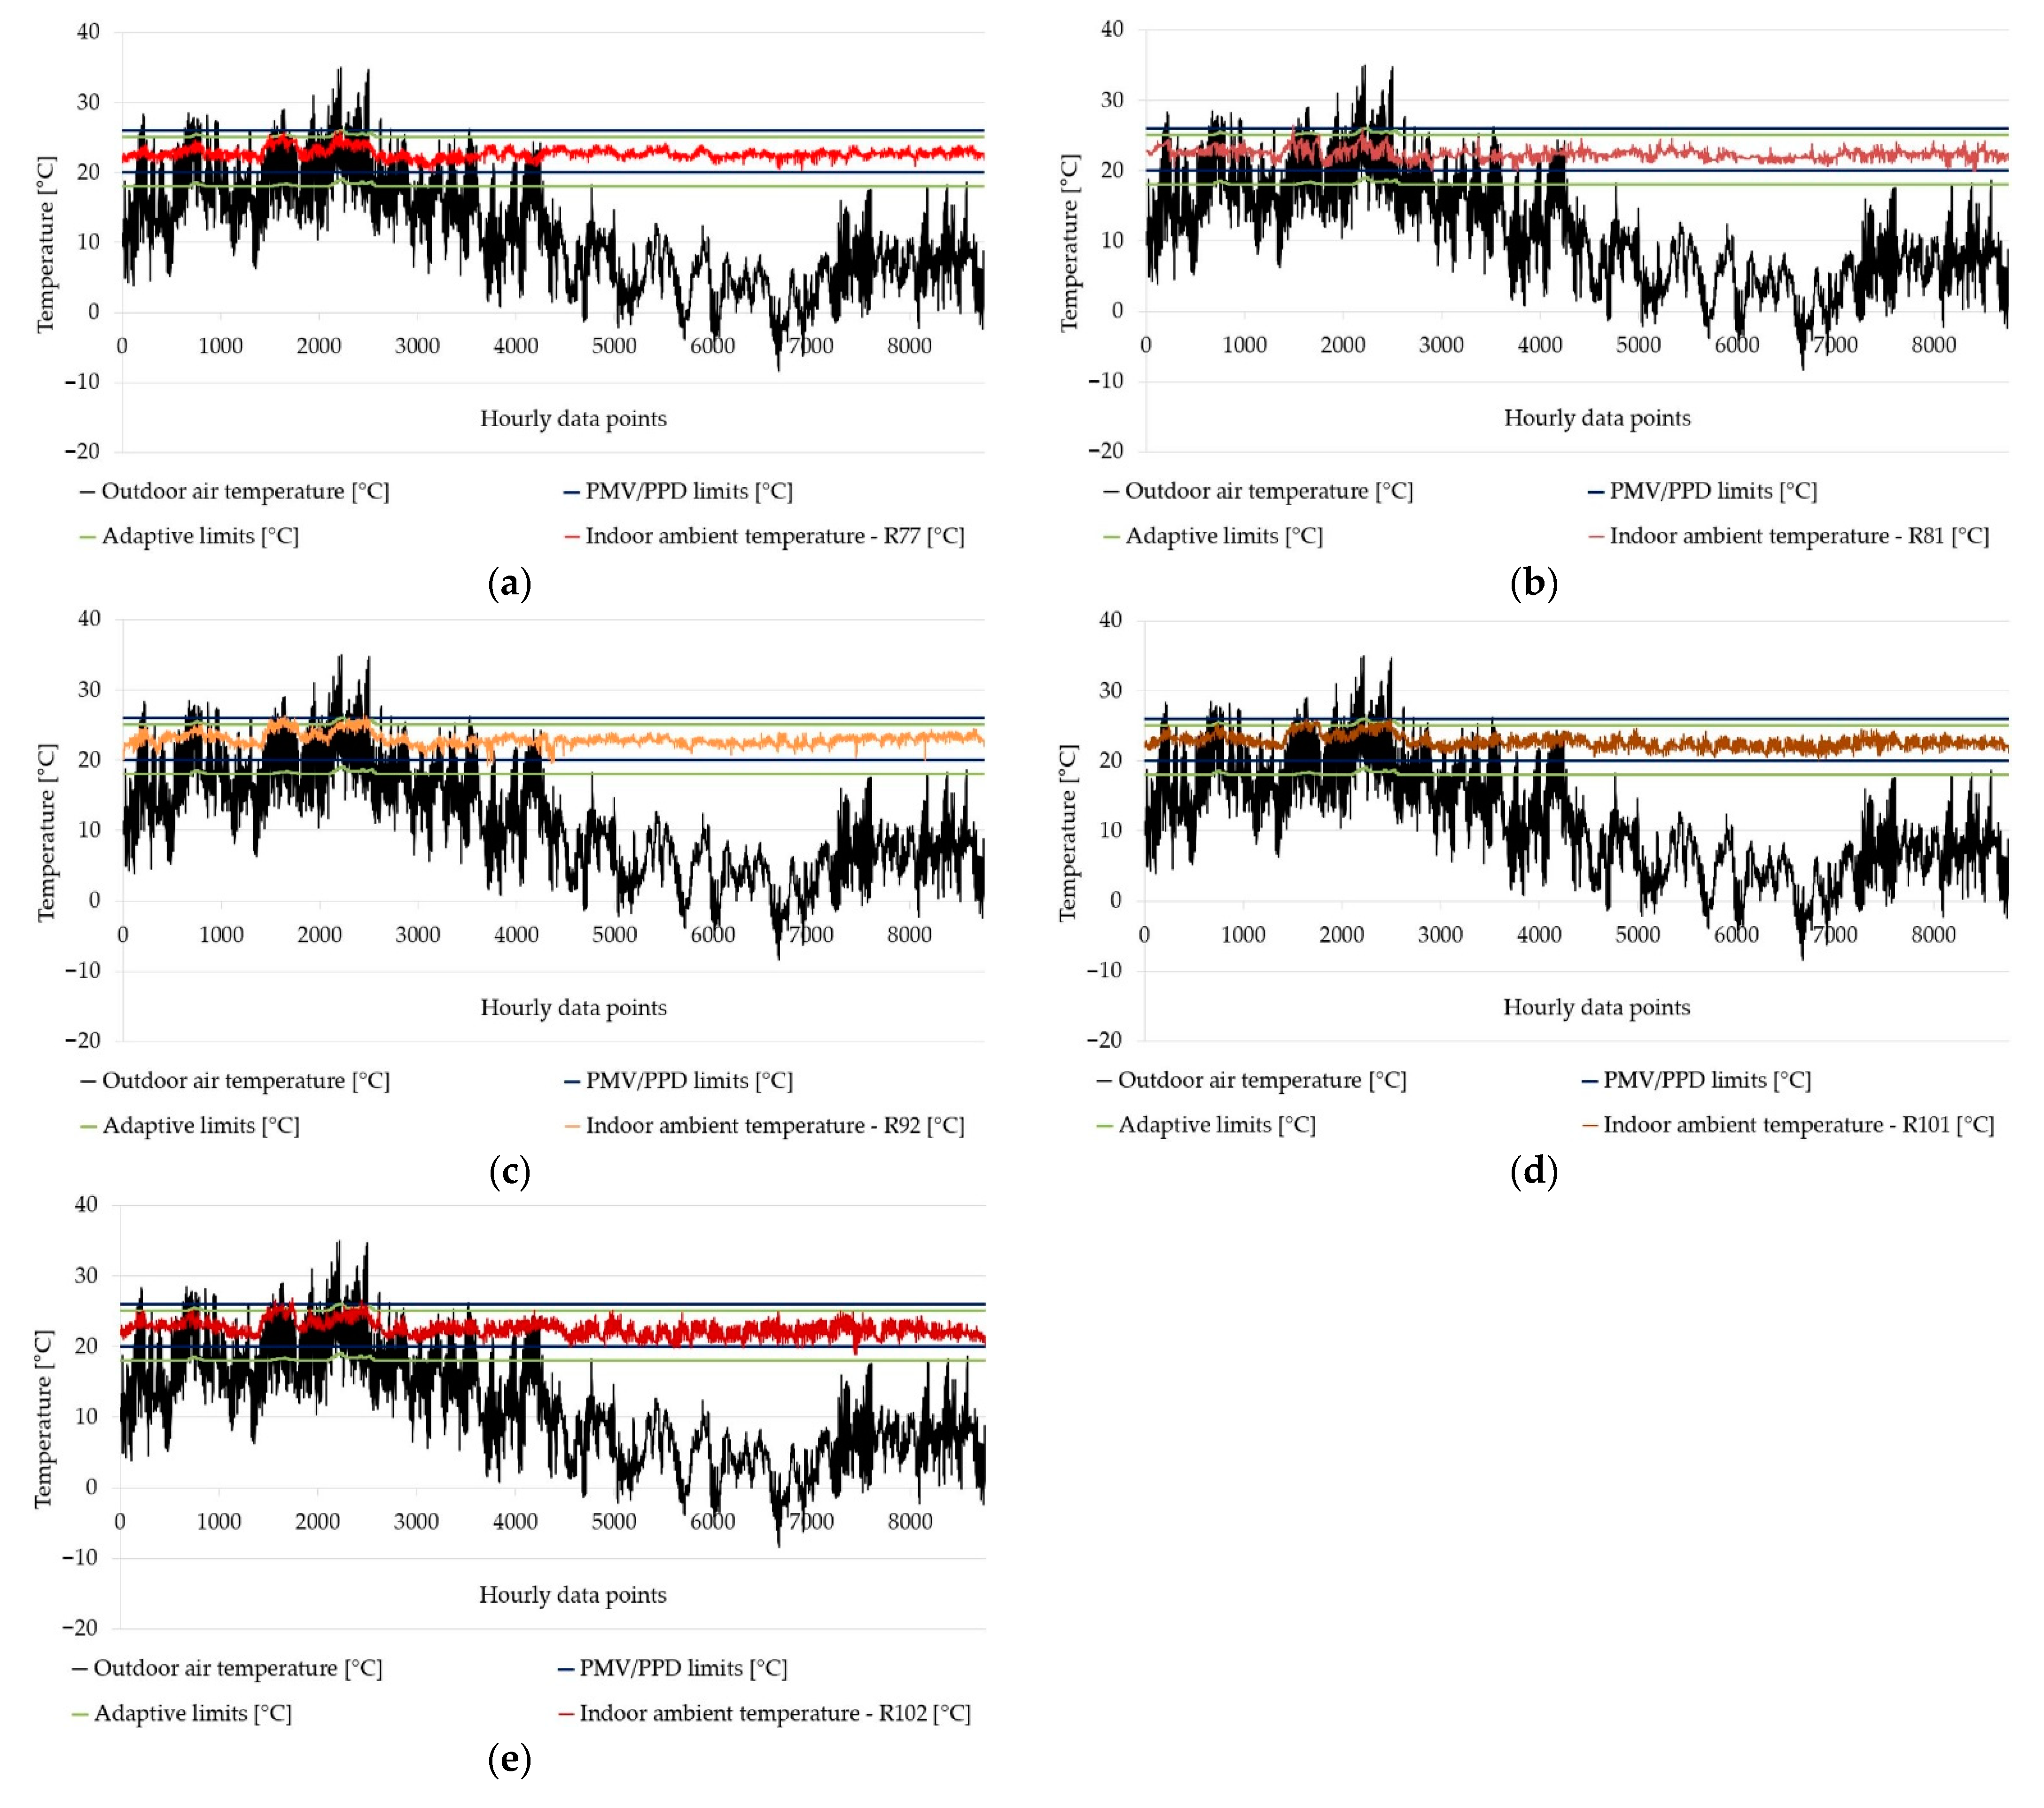
2.3.1. Time-Integrated Thermal Discomfort
- is the total number of conditioned zones in the building.
- is the occupied hour counter.
- is the total number of zonal occupied hours in zone .
- is the indoor operative temperature in zone z at time step in (°C).
- is the maximum comfort threshold in zone at hour in (°C).is the minimum comfort threshold in zone at hour in (°C).
2.3.2. Primary Energy Use
2.3.3. Greenhouse Gas Emissions
3. Results
3.1. Time-Integrated Thermal Discomfort
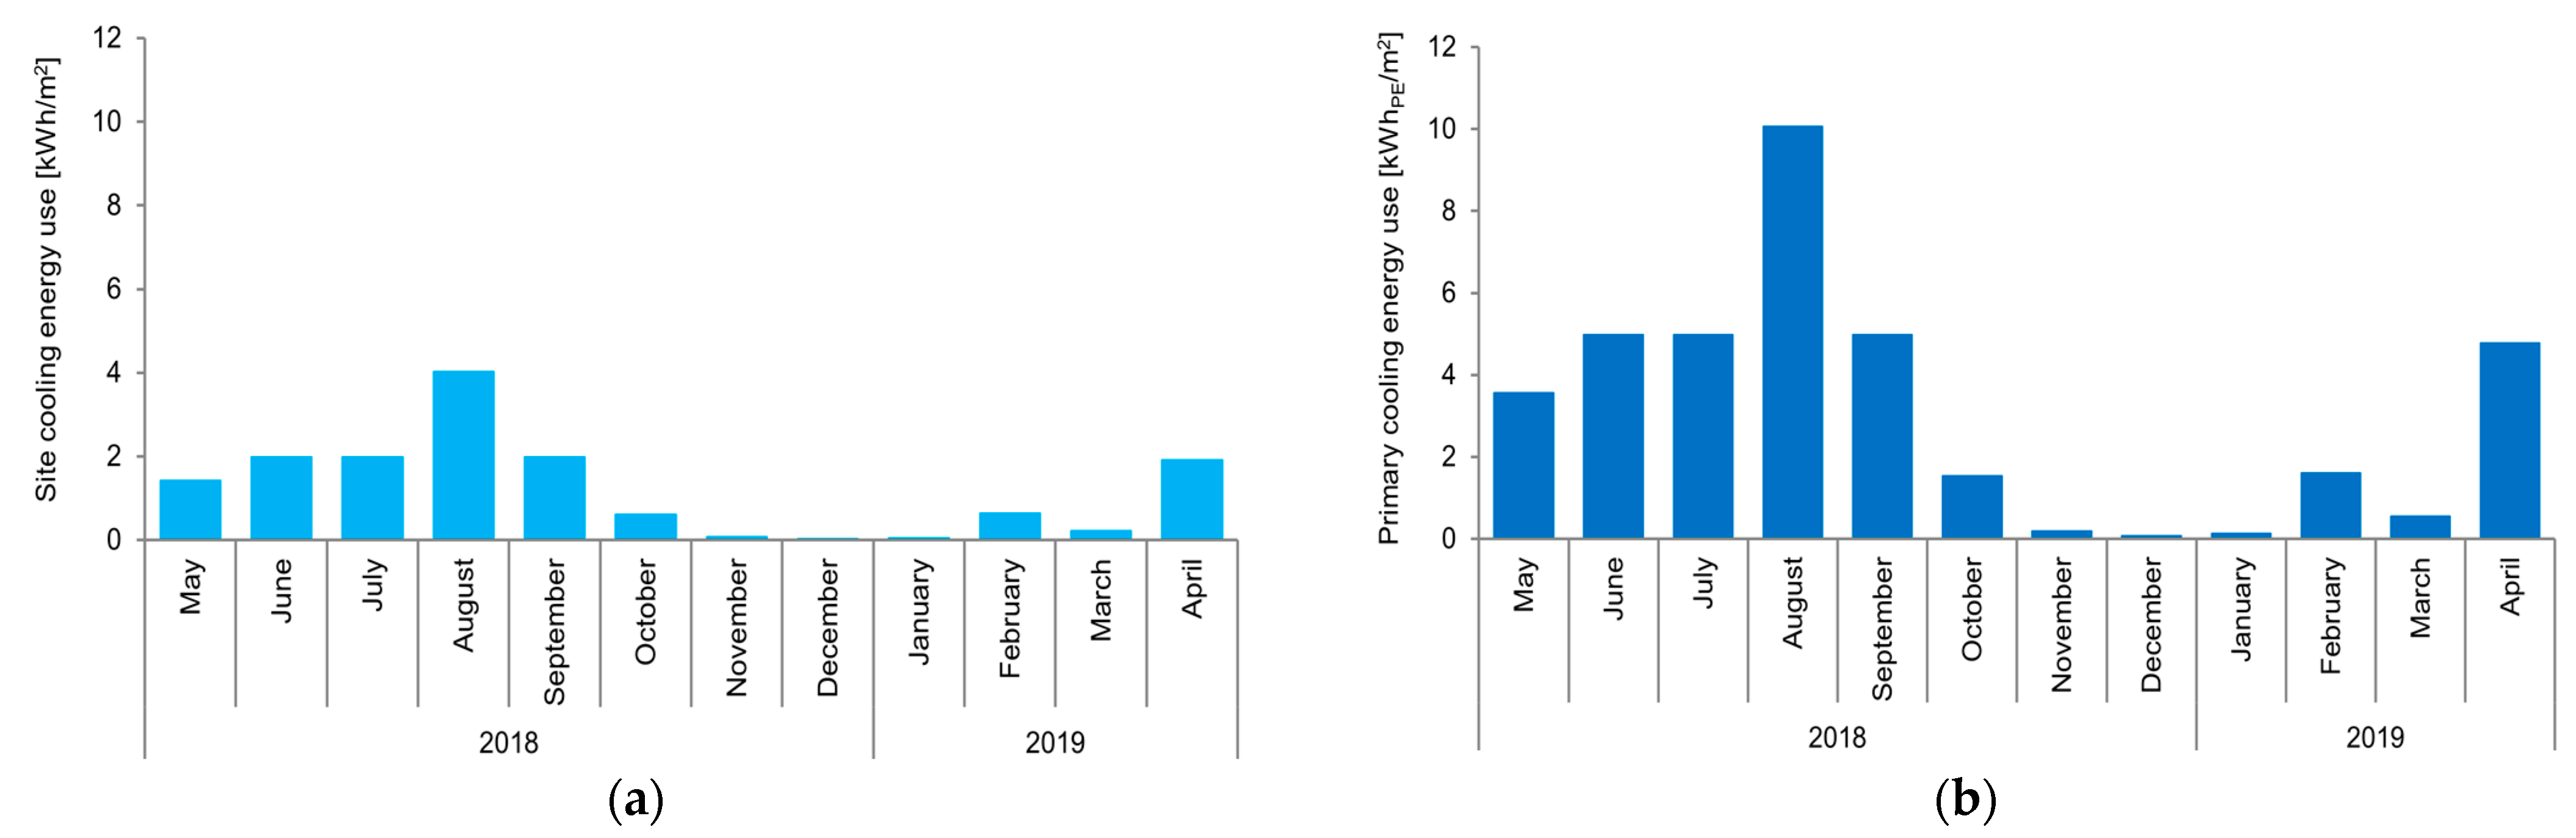
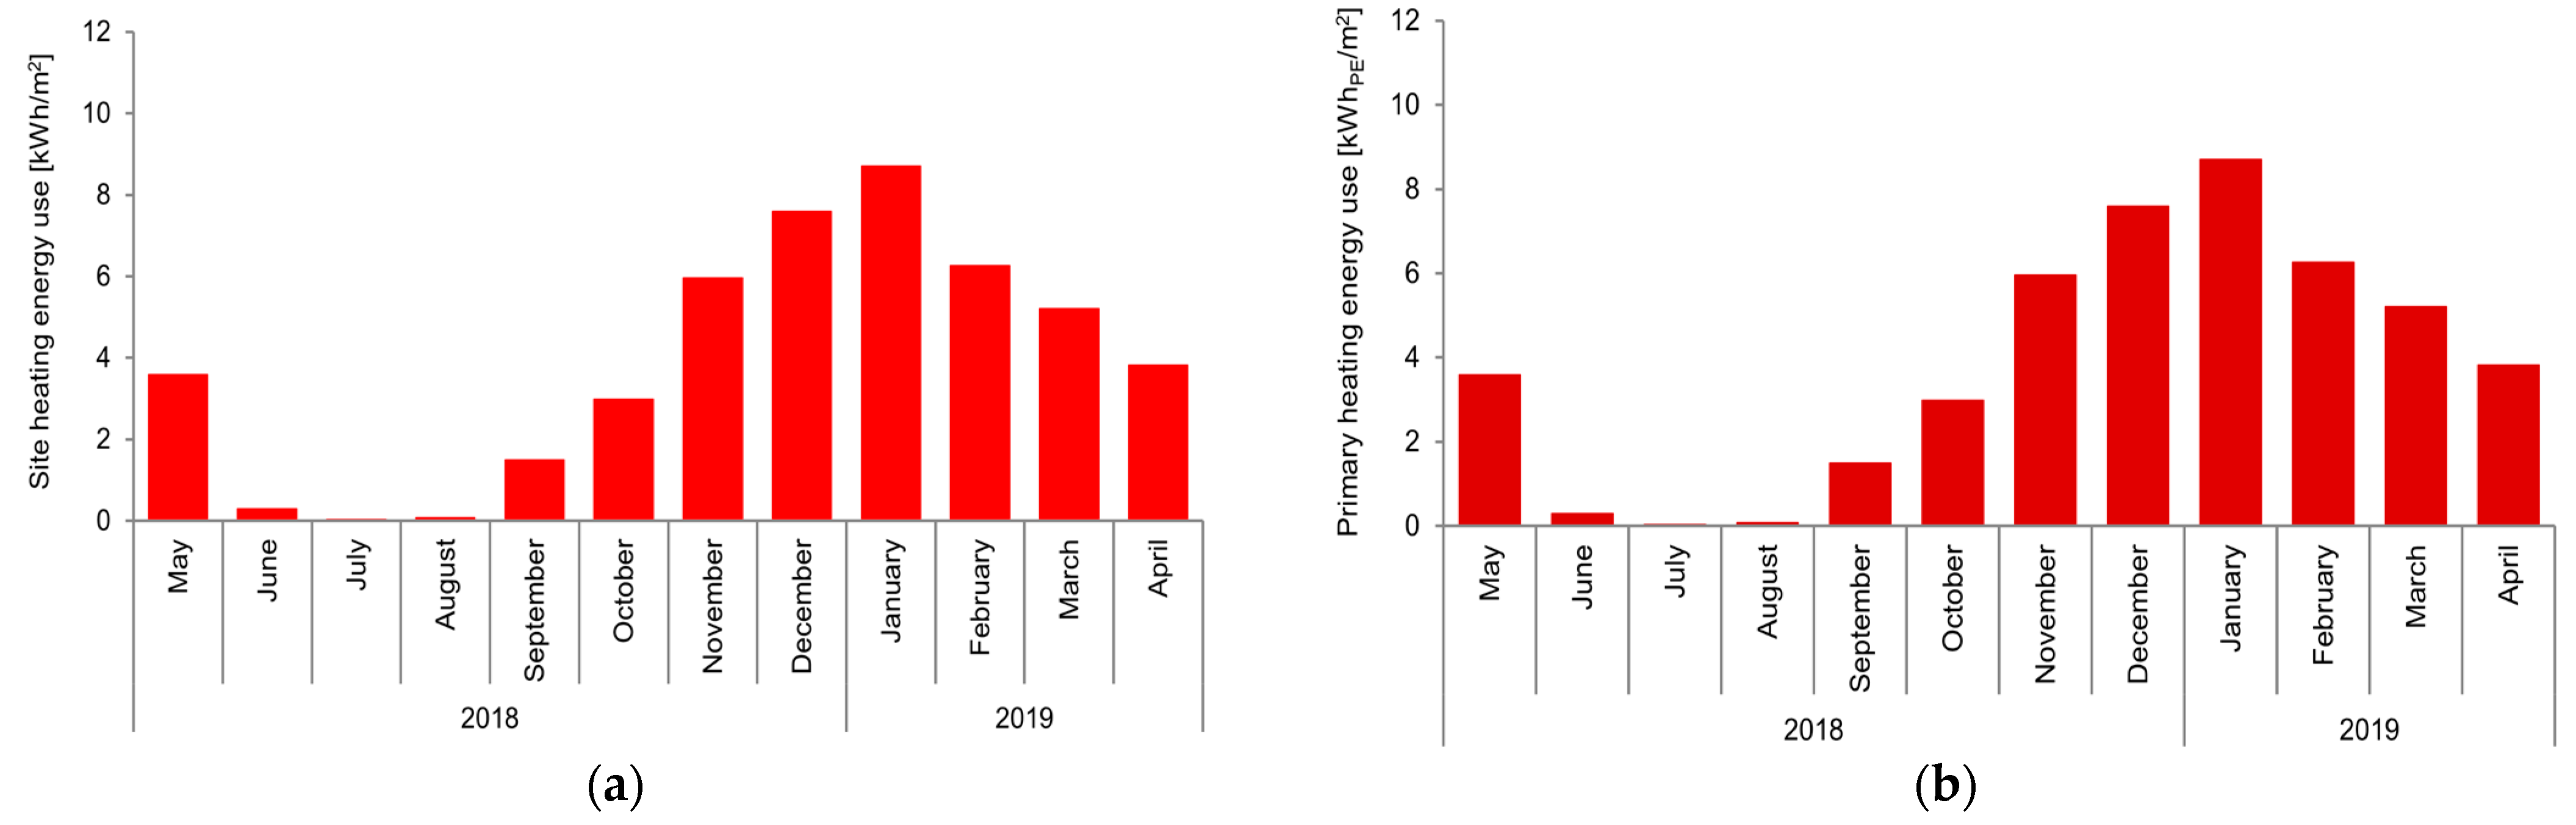
3.2. Primary Energy Use
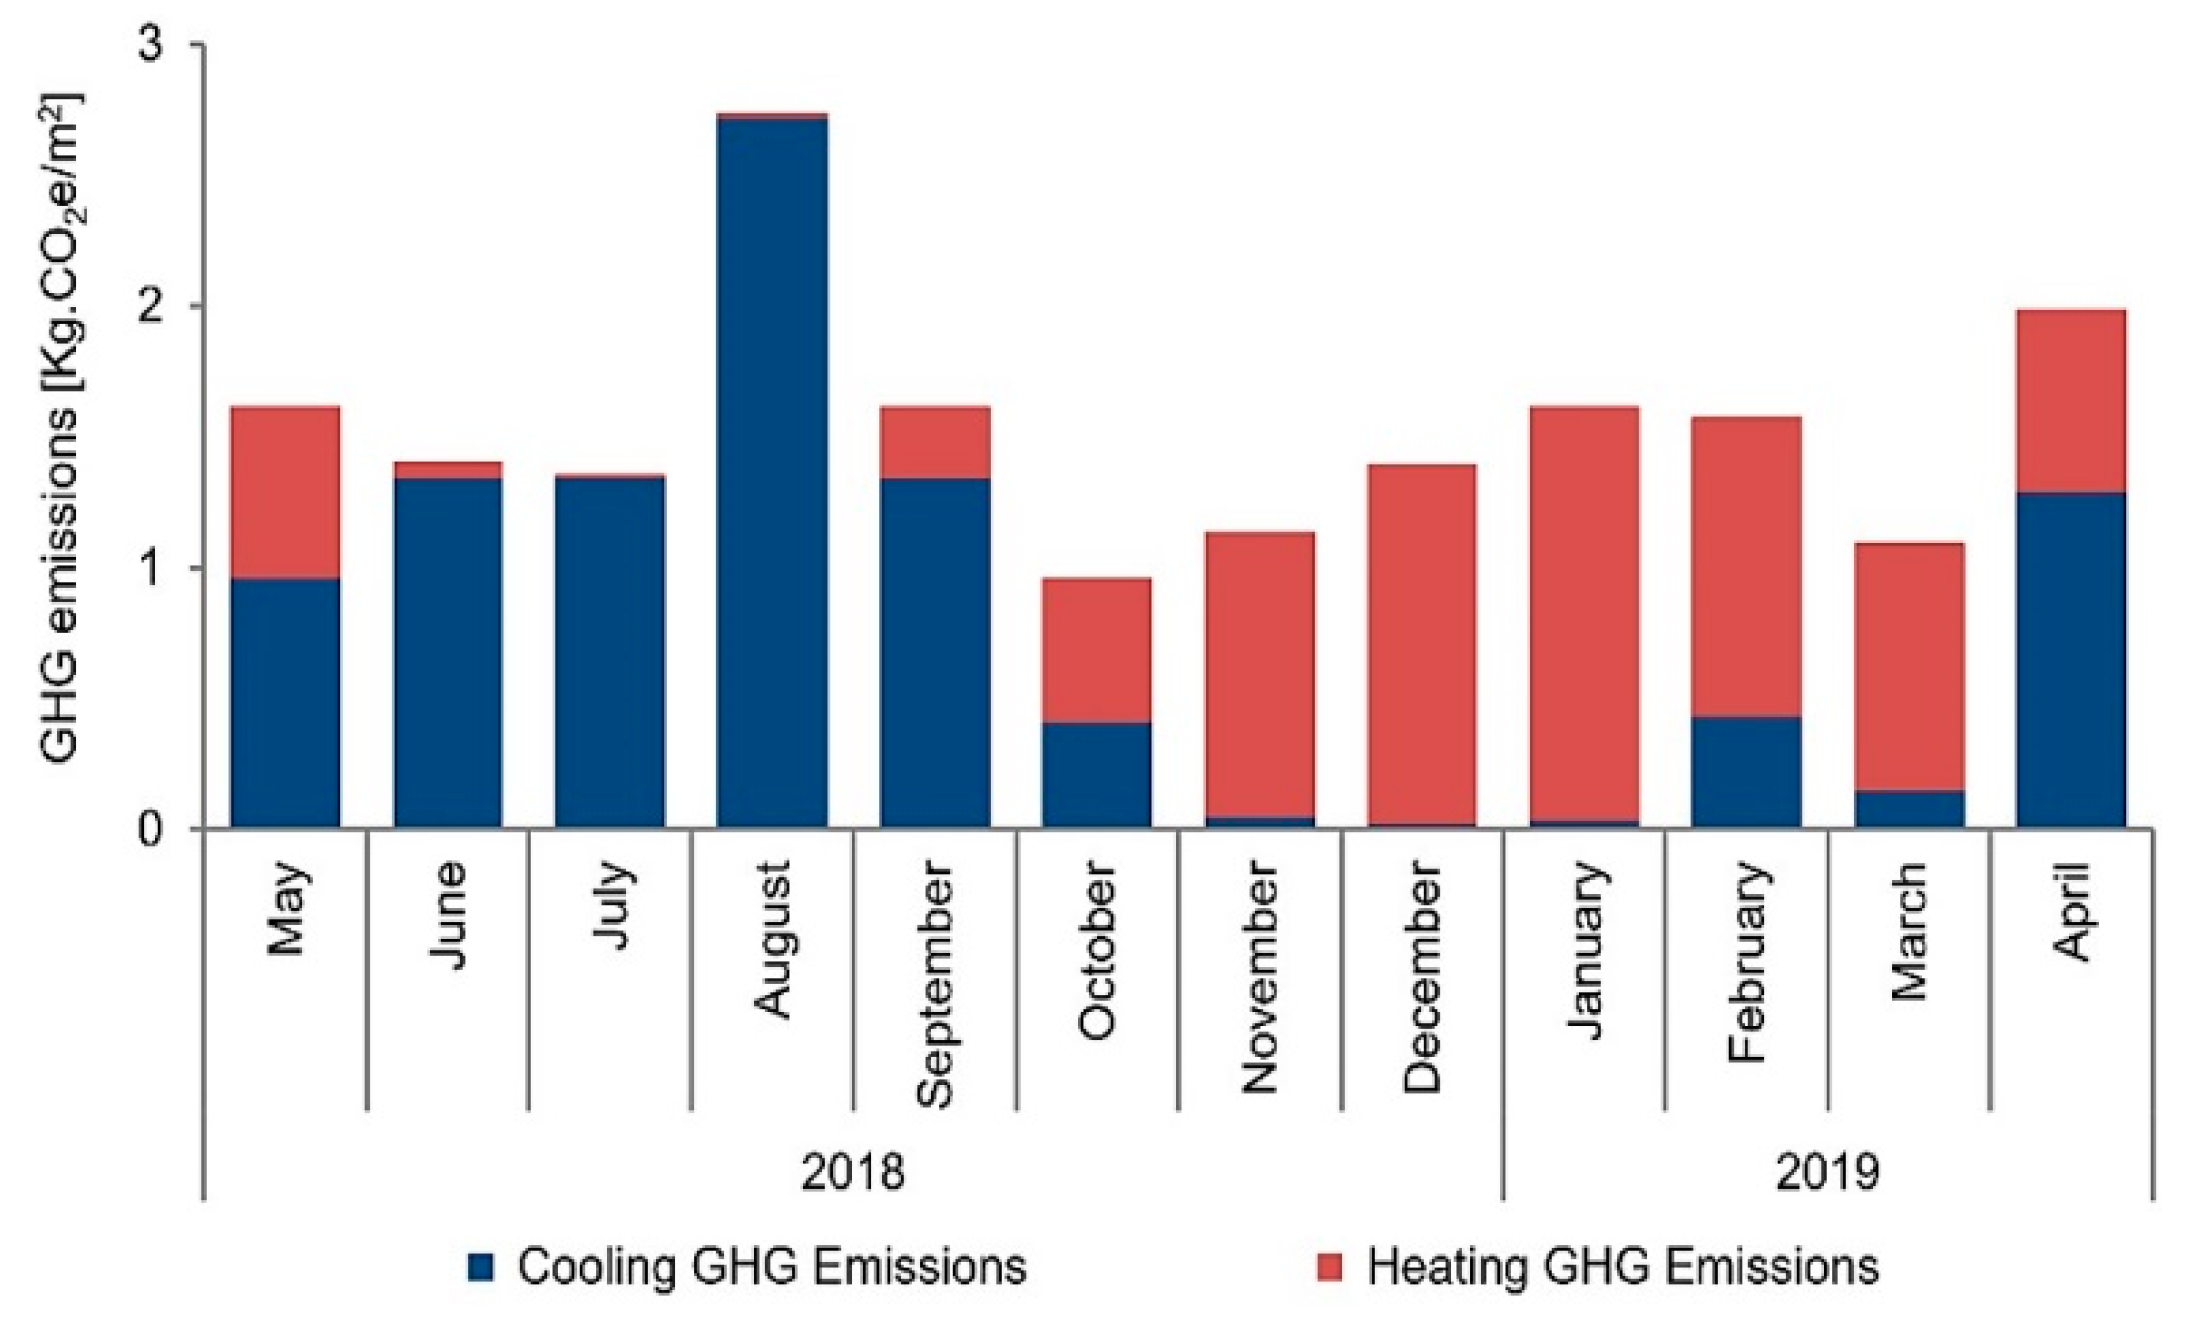
3.3. GHG Emissions
4. Discussion
4.1. Main Findings
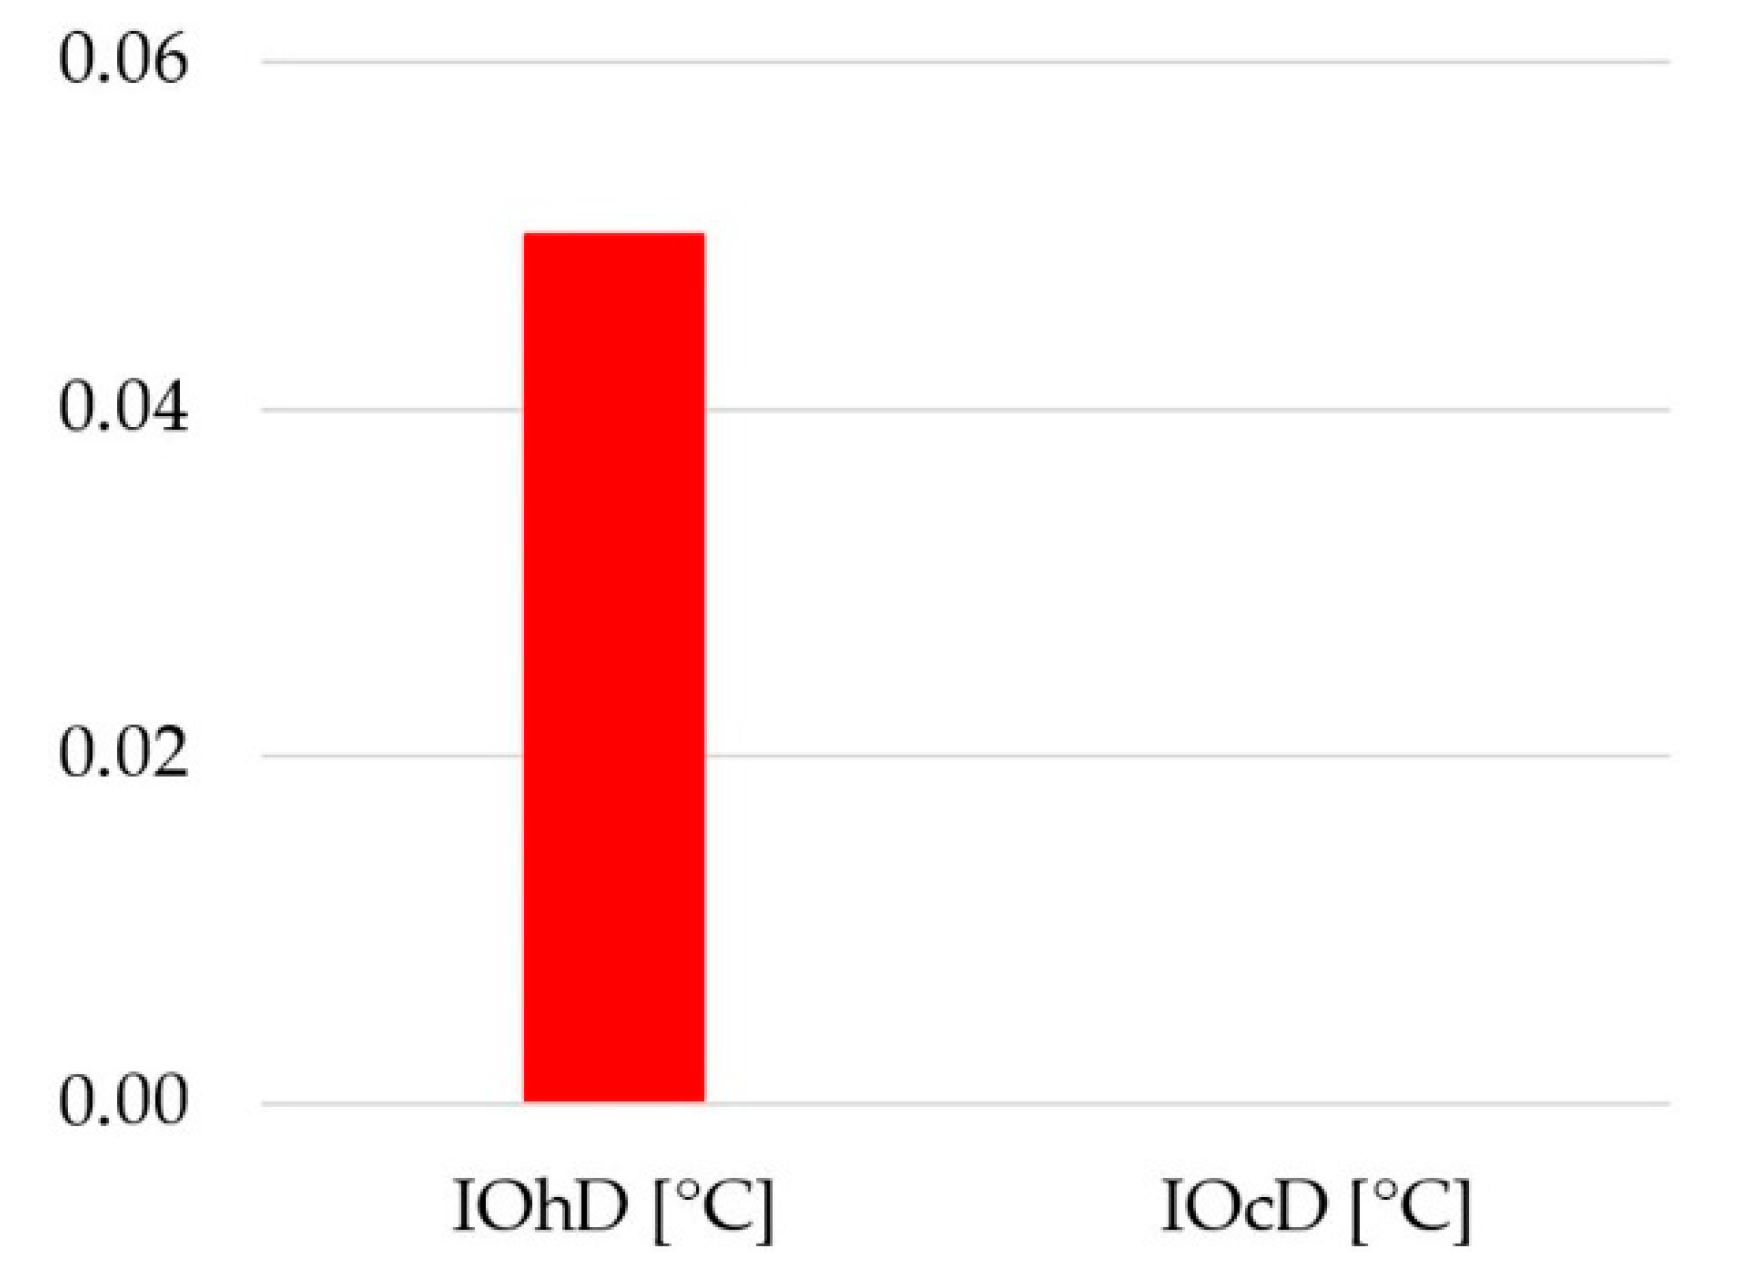
- The time-integrated analysis of spatial thermal comfort indicated only 0.05 °C of overheating and 0 °C of overcooling in the building during the monitored period and is available from the dataset [40]. However, with an increased rate of climate change and the urban heat islands [41], higher rates of summer discomfort can be foreseen.
- The primary energy use of the building was estimated at 37.54 kWhPE/m2.a for cooling and 46.08 kWhPE/m2.a for heating. To decrease the primary energy use and dependency on natural gas for heating purposes, the building should integrate renewable energy sources into the energy mix. These values indicate that building energy use is higher than expected.
- The GHG emissions from the building were estimated to be 10.14 kg.CO2e/m2.a for cooling and 8.34 kg.CO2e/m2.a for heating. Integration of renewable energy sources and/or low carbon sources, such as nuclear energy, will decrease the building GHG emissions and accelerate EU decarbonization goals.
- The HVAC system used in the building was an air-cooled chiller with water cooling coils and a water boiler with water heating coils. The system conditions the outdoor air through the mechanical ventilation unit, and this air heats/cools the building.
- An occupancy-based HVAC operation schedule will improve the energy performance of the reference building. In addition, integrating the building with renewable energy sources for heating and cooling loads will decrease primary energy use and natural gas dependency.
4.2. Strengths and Limitations
4.3. Implications for Practice and Future Work
- Post-occupancy surveys and interviews are essential in determining how the users might influence the building’s energy use. Researchers can compare the qualitative data collected through these interviews and surveys to understand how the occupants perceive buildings in terms of thermal comfort.
- In addition to the quantitative data from the field monitoring, qualitative data from occupant surveys will enable a thorough evaluation of the building’s performance. This will emphasize that the buildings must be efficient in terms of energy use and emissions, but they must also be efficient and useful in terms of thermal comfort.
- HVAC systems will always be an integral part of the building systems, even though well-designed building envelopes can significantly reduce cooling and heating loads [8]. Efficient HVAC sizing can save energy use, while providing thermal comfort.
- In addition, well-designed building envelopes and foundations can significantly reduce humidity infiltration. However, residual humidity transfer, in combination with the humidity produced by the occupants and building operations, will continue to make humidity removal a priority in building systems to ensure occupant health [8].
- A mixed mode building operation and HVAC operation based on building occupancy will reduce energy use and GHG emissions. The research should also be expanded to determine the effects of mixed-mode building operation [44] on building performance.
- These developments should consider the design, control, operation, and safety issues associated with the mixed-mode building operation. The need for the removal of latent heat in humid climates might prove a major barrier to mixed-mode building operations.
- Future studies should also conduct a deeper analysis with multiyear observation to understand the building system patterns. Although there has been remarkable improvement in energy efficiency over the past few decades, there is still a significant amount of untapped potential, regarding theoretical limits and equipment performance.
5. Conclusions
Author Contributions
Funding
Data Availability Statement
Acknowledgments
Conflicts of Interest
References
- Tian, Z.; Zhang, X.; Wei, S.; Du, S.; Shi, X. A review of data-driven building performance analysis and design on big on-site building performance data. J. Build. Eng. 2021, 41, 102706. [Google Scholar] [CrossRef]
- Wilde, P.; Jones, R. The building energy performance gap: Up close and personal. In Proceedings of the CIBSE ASHRAE Technical Symposium, Dublin, Ireland, 3 April 2014. [Google Scholar]
- Turner, C.; Frankel, M. Energy Performance of LEED for New Construction Buildings—Final Report; New Buildings Institute: Vancouver, WA, USA, 2008. [Google Scholar]
- Carbon Trust. Closing the Gap: Lessons Learned on Realising the Potential of Low Carbon Building Design; Carbon Trust: London, UK, 2011. [Google Scholar]
- Menezes, A.C.; Cripps, A.; Bouchlaghem, D.; Buswell, R. Predicted vs. actual energy performance of non-domestic buildings: Using post-occupancy evaluation data to reduce the performance gap. Appl. Energy 2012, 97, 355–364. [Google Scholar] [CrossRef]
- D’Agostino, D.; Mazzarella, L. What is a nearly zero energy building? Overview, implementation and comparison of definitions. J. Build. Eng. 2019, 21, 200–212. [Google Scholar] [CrossRef]
- Attia, S. Net Zero Energy Buildings (NZEB): Concepts, Frameworks and Roadmap for Project Analysis and Implementation, 1st ed.; Butterworth-Heinemann: Oxford, UK, 2018; pp. 343–369. [Google Scholar]
- Nearly Zero-Energy Buildings. Available online: energy.ec.europa.eu/topics/energy-efficiency/energy-efficient-buildings/nearly-zero-energy-buildings_en (accessed on 22 July 2022).
- Energy Performance of Buildings (EPB). Available online: www.brussels.be/energy-performance-buildings-epb (accessed on 22 July 2022).
- Govaert, M.; Knipping, G.; Mortehan, Y.; Rolin, I.; Rouard, J.-H.; Brussels Environment. EPBD Implementation in Belgium—Brussels Capital Region; EPB: Brussels, Belgium, 2016. [Google Scholar]
- Cozza, S.; Chambers, J.; Brambilla, A.; Patel, M.K. In search of optimal consumption: A review of causes and solutions to the energy performance gap in residential buildings. Energy Build. 2021, 249, 111253. [Google Scholar] [CrossRef]
- Cuerda, E.; Guerra-Santin, O.; Sendra, J.J.; Neila, F.J. Understanding the performance gap in energy retrofitting: Measured input data for adjusting building simulation models. Energy Build. 2020, 209, 109688. [Google Scholar] [CrossRef]
- Liang, J.; Qiu, Y.; Hu, M. Mind the energy performance gap: Evidence from green commercial buildings. Resour. Conserv. Recycl. 2019, 141, 364–377. [Google Scholar] [CrossRef]
- Allard, I.; Olofsson, T.; Nair, G. Energy evaluation of residential buildings: Performance gap analysis incorporating uncertainties in the evaluation methods. Build. Simul. 2018, 11, 725–737. [Google Scholar] [CrossRef]
- Coleman, S.; Robinson, J.B. Introducing the qualitative performance gap: Stories about a sustainable building. Build. Res. Inf. 2017, 46, 485–500. [Google Scholar] [CrossRef]
- Khoury, J.; Alameddine, Z.; Hollmuller, P. Understanding and bridging the Energy Performance Gap in building retrofit. Energy Procedia 2017, 122, 217–222. [Google Scholar] [CrossRef]
- Robinson, J.F.; Foxon, T.J.; Taylor, P.G. Performance gap analysis case study of a non-domestic building. Proc. Eng. Sustain. 2015, 169, 31–38. [Google Scholar] [CrossRef]
- Fedoruk, L.E.; Cole, R.J.; Robinson, J.B.; Cayuela, A. Learning from failure: Understanding the anticipated–achieved building energy performance gap. Build. Res. Inf. 2015, 43, 750–763. [Google Scholar] [CrossRef]
- de Wilde, P. The gap between predicted and measured energy performance of buildings: A framework for investigation. Autom. Constr. 2014, 41, 40–49. [Google Scholar] [CrossRef]
- Attia, S.; Levinson, R.; Ndongo, E.; Holzer, P.; Kazanci, O.B.; Homaei, S.; Zhang, C.; Olesen, B.W.; Qi, D.; Hamdy, M.; et al. Resilient cooling of buildings to protect against heat waves and power outages: Key Concepts and definition. Energy Build. 2021, 239, 110869. [Google Scholar] [CrossRef]
- Beck, H.E.; Zimmermann, N.E.; McVicar, T.R.; Vergopolan, N.; Berg, A.; Wood, E.F. Present and future Köppen-Geiger climate classification maps at 1-km resolution. Sci. Data 2018, 5, 180214. [Google Scholar] [CrossRef]
- Pérez-Andreu, V.; Aparicio-Fernández, C.; Martínez-Ibernón, A.; Vivancos, J.L. Impact of climate change on heating and cooling energy demand in a residential building in a Mediterranean climate. Energy 2018, 165, 63–74. [Google Scholar] [CrossRef]
- Seminara, P.; Vand, B.; Sajjadian, S.M.; Tupenaite, L. Assessing and monitoring of building performance by diverse methods. Sustainability 2022, 14, 1242. [Google Scholar] [CrossRef]
- Alimohammadisagvand, B. Influence of Demand Response Actions on Thermal Comfort and Electricity Cost for Residential Houses. Ph.D. Thesis, Aalto University, Espoo, Finland, 2018. [Google Scholar]
- ASHRAE 55; Thermal Environmental Conditions for Human Occupancy. American Society of Heating, Refrigerating and Air Conditioning Engineers: Atlanta, GA, USA, 2020.
- Frontczak, M.; Wargocki, P. Literature survey on how different factors influence human comfort in indoor environments. Build. Environ. 2011, 46, 922–937. [Google Scholar] [CrossRef]
- Klepeis, N.E.; Nelson, W.C.; Ott, W.R.; Robinson, J.P.; Tsang, A.M.; Switzer, P.; Behar, J.V.; Hern, S.C.; Engelmann, W.H. The National Human Activity Pattern Survey (NHAPS): A resource for assessing exposure to environmental pollutants. J. Expo. Sci. Environ. Epidemiol. 2001, 11, 231–252. [Google Scholar] [CrossRef]
- Hamdy, M.; Carlucci, S.; Hoes, P.J.; Hensen, J.L.M. The impact of climate change on the overheating risk in dwellings—A Dutch case study. Build. Environ. 2017, 122, 307–323. [Google Scholar] [CrossRef]
- Rahif, R.; Amaripadath, D.; Attia, S. Review on time-integrated overheating evaluation methods for residential buildings in temperate climates of Europe. Energy Build. 2021, 252, 111463. [Google Scholar]
- Rahif, R.; Hamdy, M.; Homaei, S.; Zhang, C.; Holzer, P.; Attia, S. Simulation-based framework to evaluate resistivity of cooling strategies in buildings against overheating impact of climate change. Build. Environ. 2022, 208, 108599. [Google Scholar] [CrossRef]
- EN 16798-1:2019; Energy Performance of Buildings—Ventilation for Buildings—Indoor Environmental Input Parameters for Design and Assessment of Energy Performance of Buildings Addressing Indoor Air Quality, Thermal Environment, Lighting and Acoustics. European Committee for Standardization: Brussels, Belgium, 2019.
- Carlucci, S.; Pagliano, L. A review of indices for the long-term evaluation of the general thermal comfort conditions in buildings. Energy Build. 2012, 53, 194–205. [Google Scholar] [CrossRef]
- Fumo, N. A review on the basics of building energy estimation. Renew. Sustain. Energy Rev. 2014, 31, 53–60. [Google Scholar] [CrossRef]
- Primary Energy Consumption. Available online: ec.europa.eu/eurostat/statistics-explained/index.php?title=Glossary:Primary_energy_consumption#:~:text=Primary%20energy%20consumption%20measures%20the,final%20consumption%20by%2%200end%20users (accessed on 25 July 2022).
- Energy Use in Buildings. Available online: www.velux.com/what-we-do/research-and-knowledge/deic-basic-book/energy/energy-use-in-buildings?consent=preferences%2Cstatistics%2Cmarketing&ref-original=https%3A%2F%2Fwww.google.com%2F (accessed on 25 July 2022).
- Carlier, M. Nearly Zero-Energy Building Definitions in Selected Countries. Master’s Thesis, Ghent University, Ghent, Belgium, July 2016. [Google Scholar]
- IBGE. Performance Energétique des Bâtiments: Guide des Exigences et des Procédures de la 960 Réglementation Travaux PEB en Région de Bruxelles Capitale; IBGE: Brussels, Belgium, 2017.
- Greenhouse Gas Emissions from Energy Use in Buildings in Europe. Available online: www.eea.europa.eu/data-and-maps/indicators/greenhouse-gas-emissions-from-energy/assessment (accessed on 22 July 2022).
- Calculation of CO2. Available online: www.encon.be/en/calculation-co2 (accessed on 5 July 2022).
- Amaripadath, D.; Attia, S. Field Measurement Dataset of a Nearly Zero-Energy Office Building in Temperate Oceanic Climate; Harvard Dataverse: Cambridge, MA, USA, 2022. [Google Scholar] [CrossRef]
- Luo, M.; de Dear, R.; Ji, W.; Bin, C.; Lin, B.; Ouyang, Q.; Zhu, Y. The dynamics of Thermal comfort expectations: The problem, challenge and implication. Build. Environ. 2016, 95, 322–329. [Google Scholar] [CrossRef]
- SAPP Ceiling. Available online: www.dgbg.nl/product/263 (accessed on 20 July 2022).
- Discover SAPP Ceiling. Available online: www.interalu.eu/en/kennis/discover-sappceiling (accessed on 20 July 2022).
- About Mixed-Mode: Case Studies and Project Database. Available online: Cbe.berkeley.edu/mixedmode/aboutmm.html (accessed on 26 July 2022).
- Piderit, M.; Vivanco, F.; van Moeseke, G.; Attia, S. Net zero buildings—A framework for an integrated policy in Chile. Sustainability 2019, 11, 1494. [Google Scholar] [CrossRef]


| Authors | Methodology | Building | Recommendations |
|---|---|---|---|
| Cozza et al. [11] | Qualitative w/review | Residential | Inform the occupants about optimum usage, as well as assess their level of comfort and satisfaction. Give the building designers and other stakeholders involved feedback and support best practices. |
| Cuerda et al. [12] | Modeling w/simulations Observational w/monitoring | Residential | The use of monitored data reduces the uncertainties due to the pre-bound effect during the design phase and rebound effect during the user phase. The use of the mixed-method approach to define the building models and occupant behavior will create models that will accurately simulate energy use and bring the results closer to reality. |
| Liang et al. [13] | Observational w/surveys | Commercial | Facility managers listed occupant energy consumption, increased occupancy, and technology failures as the top reasons for the energy performance gap. Engineering, organizational, and behavioral factors all influence the energy performance gap. Therefore, too much emphasis on a single aspect is inappropriate and insufficient. |
| Allard et al. [14] | Observational w/monitoring | Residential | To find any deviations from the intended design or flaws in the completed building, calibrating the simulation model is essential. A method gap should be introduced to perform the performance gap analysis to identify the procurement gap effectively. |
| Coleman and Robinson [15] | Observational w/monitoring and surveys | University | The response to the energy performance gap should keep up and create innovations for social wellbeing. Thus, energy performance gap studies will lead to the creation of innovative solutions. Designers, operators, and occupants should communicate both successes and failures. |
| Khoury et al. [16] | Modeling w/simulations | Green commercial | The simulation process must consider the variation between ideal yet realistic conditions of use and standard values. The optimization potential corresponds to the difference between the actual and ideal conditions of use. Building optimization and responsible behavior can reduce the energy performance gap. |
| Robinson et al. [17] | Observational w/monitoring and surveys | University | Reliable energy forecasting at design stage is a crucial component of the performance gap. This might be underestimated if realistic building use expectations are not set during the design phase. |
| Fedoruk et al. [18] | Observational w/monitoring | University | Neither economic nor technical constraints hindered energy performance, but the roadblocks came from how various life-cycle stages were specified and& implemented. The main issues emphasize the significance of having efficient energy monitoring capabilities, bridging life cycle stage gaps, and design and operation feedback processes. |
| de Wilde [19] | Qualitative w/review | All buildings | This study summarizes the following performance gaps between (i) first-principle predictions and measurements, (ii) machine learning and measurements, and (iii) predictions and display legislation certificates. Only a comprehensive and coordinated strategy that combines model validation and verification, improved data collection, better forecasting, and a shift in industry practices can close the performance gap. |
| Parameter | Values |
|---|---|
| Offices, cafeterias, and multi-purpose spaces | 3090 m2 |
| Underground car parking area | 1140 m2 |
| Window-to-wall ratio | 38.25% |
| Window G-value | 0.50 |
| Window U-value | 0.50 W/m2.K |
| External wall U-value | 0.35 W/m2.K |
| Roof U-value | 0.25 W/m2.K |
| Ground floor U-value | 0.25 W/m2.K |
| Basement floor U-value | 0.25 W/m2.K |
| Airtightness | 0.60 |
| Maximum ventilation rate | 21,600 m3/hr |
| Category | Key Performance Indicators | Values |
|---|---|---|
| Time-integrated thermal discomfort | Indoor overheating degree | 0.05 °C |
| Indoor overcooling degree | 0 °C | |
| Energy use | Site cooling energy use (electricity) | 15.02 kWh/m2.a |
| Primary cooling energy use (electricity) | 37.54 kWhPE/m2.a | |
| Site heating energy use (natural gas) | 46.08 kWh/m2.a | |
| Primary heating energy use (natural gas) | 46.08 kWhPE/m2.a | |
| GHG emissions | Cooling emissions (electricity) | 10.14 kg.CO2e/m2.a |
| Heating emissions (natural gas) | 8.34 kg.CO2e/m2.a |
Publisher’s Note: MDPI stays neutral with regard to jurisdictional claims in published maps and institutional affiliations. |
© 2022 by the authors. Licensee MDPI, Basel, Switzerland. This article is an open access article distributed under the terms and conditions of the Creative Commons Attribution (CC BY) license (https://creativecommons.org/licenses/by/4.0/).
Share and Cite
Amaripadath, D.; Velickovic, M.; Attia, S. Performance Evaluation of a Nearly Zero-Energy Office Building in Temperate Oceanic Climate Based on Field Measurements. Energies 2022, 15, 6755. https://doi.org/10.3390/en15186755
Amaripadath D, Velickovic M, Attia S. Performance Evaluation of a Nearly Zero-Energy Office Building in Temperate Oceanic Climate Based on Field Measurements. Energies. 2022; 15(18):6755. https://doi.org/10.3390/en15186755
Chicago/Turabian StyleAmaripadath, Deepak, Mirjana Velickovic, and Shady Attia. 2022. "Performance Evaluation of a Nearly Zero-Energy Office Building in Temperate Oceanic Climate Based on Field Measurements" Energies 15, no. 18: 6755. https://doi.org/10.3390/en15186755
APA StyleAmaripadath, D., Velickovic, M., & Attia, S. (2022). Performance Evaluation of a Nearly Zero-Energy Office Building in Temperate Oceanic Climate Based on Field Measurements. Energies, 15(18), 6755. https://doi.org/10.3390/en15186755