Article

Modeling of Fuel Cells Characteristics in Relation to Real Driving Conditions of FCHEV Vehicles

by
Ireneusz Pielecha
Faculty of Civil and Transport Engineering, Poznan University of Technology, ul. Piotrowo 3, 60-965 Poznan, Poland
Energies 2022, 15(18), 6753; https://doi.org/10.3390/en15186753
Submission received: 21 August 2022 / Revised: 10 September 2022 / Accepted: 13 September 2022 / Published: 15 September 2022
(This article belongs to the Special Issue Fuel Cell-Based and Hybrid Power Generation Systems Modeling)

Abstract

:
Fuel cells are one of the zero-emission elements of modern automotive drive systems. This article presents theoretical identification of the component parameters of indicators for the fuel cell operating conditions. Activation, ohmic, and mass transport losses were identified. Current–voltage characteristics were provided along with an analysis of typical cell losses. The actual performance characteristics of fuel cells were analyzed for Toyota Mirai I and II generation vehicles. The fuel cells operating conditions were derived and analyzed in the context of real driving conditions. Therefore, urban, rural, and motorway conditions were used. The vehicles were equipped with PEM fuel cells supplying power equal to 114 kW (1st gen.) or 128 kW (2nd gen.). The average fuel cell stack power values depend on the driving conditions: urban (about 10 kW), rural (20 kW) and motorway (about 30–40 kW) driving modes. The different power ratings of fuel cells combined with different battery generations resulted in a variation in the cells operating conditions. Analyses conducted in various traffic conditions indicated the possibility of determining losses related to the fuel cells. The analysis of fuel cell losses shows the greatest values for activation losses when the cells are under high load (for both generations)—i.e., in motorway driving conditions. The voltage of resistive losses reached its maximum in urban driving conditions when the load on the fuel cells was small.

1. Introduction

The search for low-emission drive systems leads to the increasingly more common use of hybrid drive systems in transport means. Unfortunately, such systems turn out to be insufficient in terms of meeting carbon dioxide emission limits. These limits in 2021 were 95 g/km. On 14 July 2021, the European Commission proposed more ambitious goals for 2030 as part of the European Green Deal [1]. Compared to the 2021 baseline, the average CO2 emissions from new vehicles registered between 2025 and 2030 would have to be reduced by 15% (unchanged from previous assumptions) and 55% (up from 37.5% previously), respectively. The legislation also suggests that new cars will need to be zero-emission by the year 2035. Such a drastic reduction in CO2 emissions necessitates the use of electric drive systems or the use of fuel cell systems.
Currently, the fee for exceeding the average CO2 emission limit (measured up to three decimal places) for a given manufacturer of passenger vehicles in accordance with the Regulation of the European Parliament and the EU Council 2019/631 amounts to 95 EUR for each newly registered vehicle [2].
As mentioned before, these regulatory proposals also suggest selling only zero-emission cars by 2035. In order to achieve a total reduction of CO2 emissions using electric drive systems or fuel cell systems seems like the only viable solution. Such systems of production or storage of energy were shown in Figure 1, also including data on their specific power and specific energy parameters. This results in a great similarity between fuel cells and batteries in terms of specific power and energy. However, the conditions for either charging or refueling these systems are completely different. The charging frequency of an electric vehicle is several times greater than that of a vehicle powered by fuel cells. In addition, the refueling time of vehicles powered by hydrogen fuel cells is several times shorter than the charging time necessary to recharge an electric vehicle’s batteries. The hydrogen refueling time is currently about 3 min—for a tank weighing about 5 kg H2. The shortest FastCharging charging times take no less than several minutes.
The ability to model fuel cells enables their complete diagnostics, which improves the knowledge of fuel cell aging. In addition, operational information influences the prediction of the behaviour of fuel cells in real operating conditions.

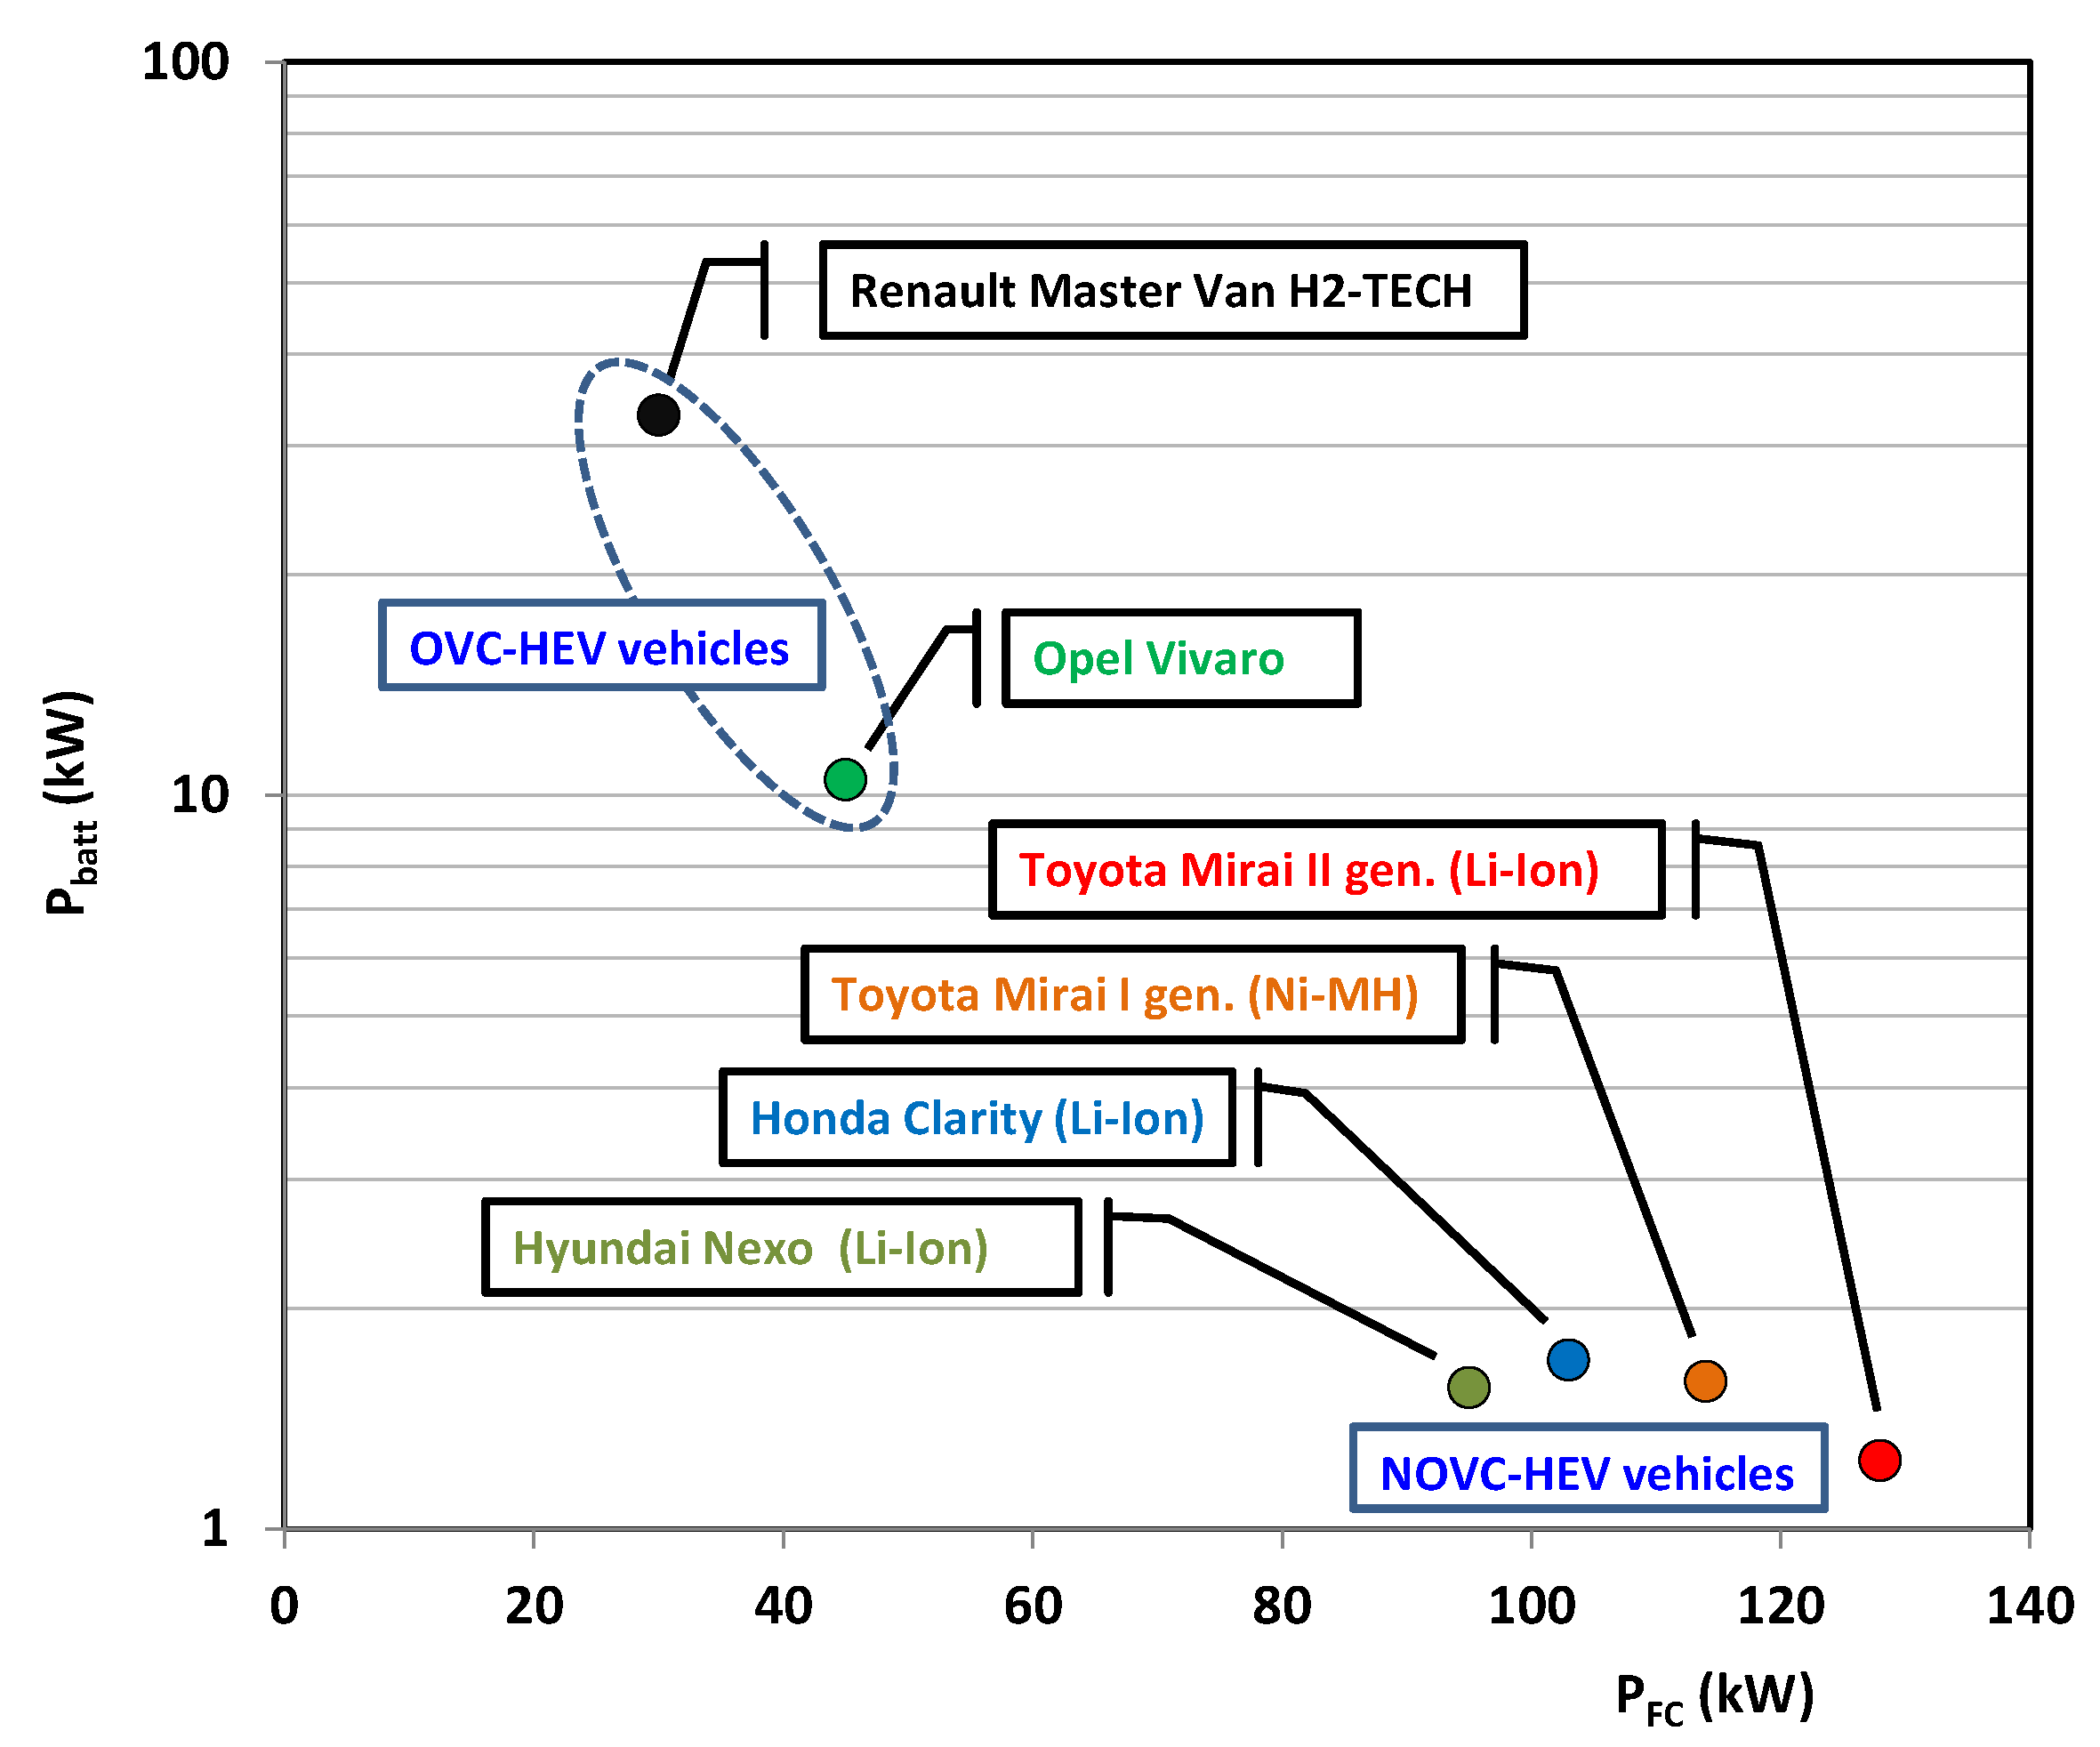
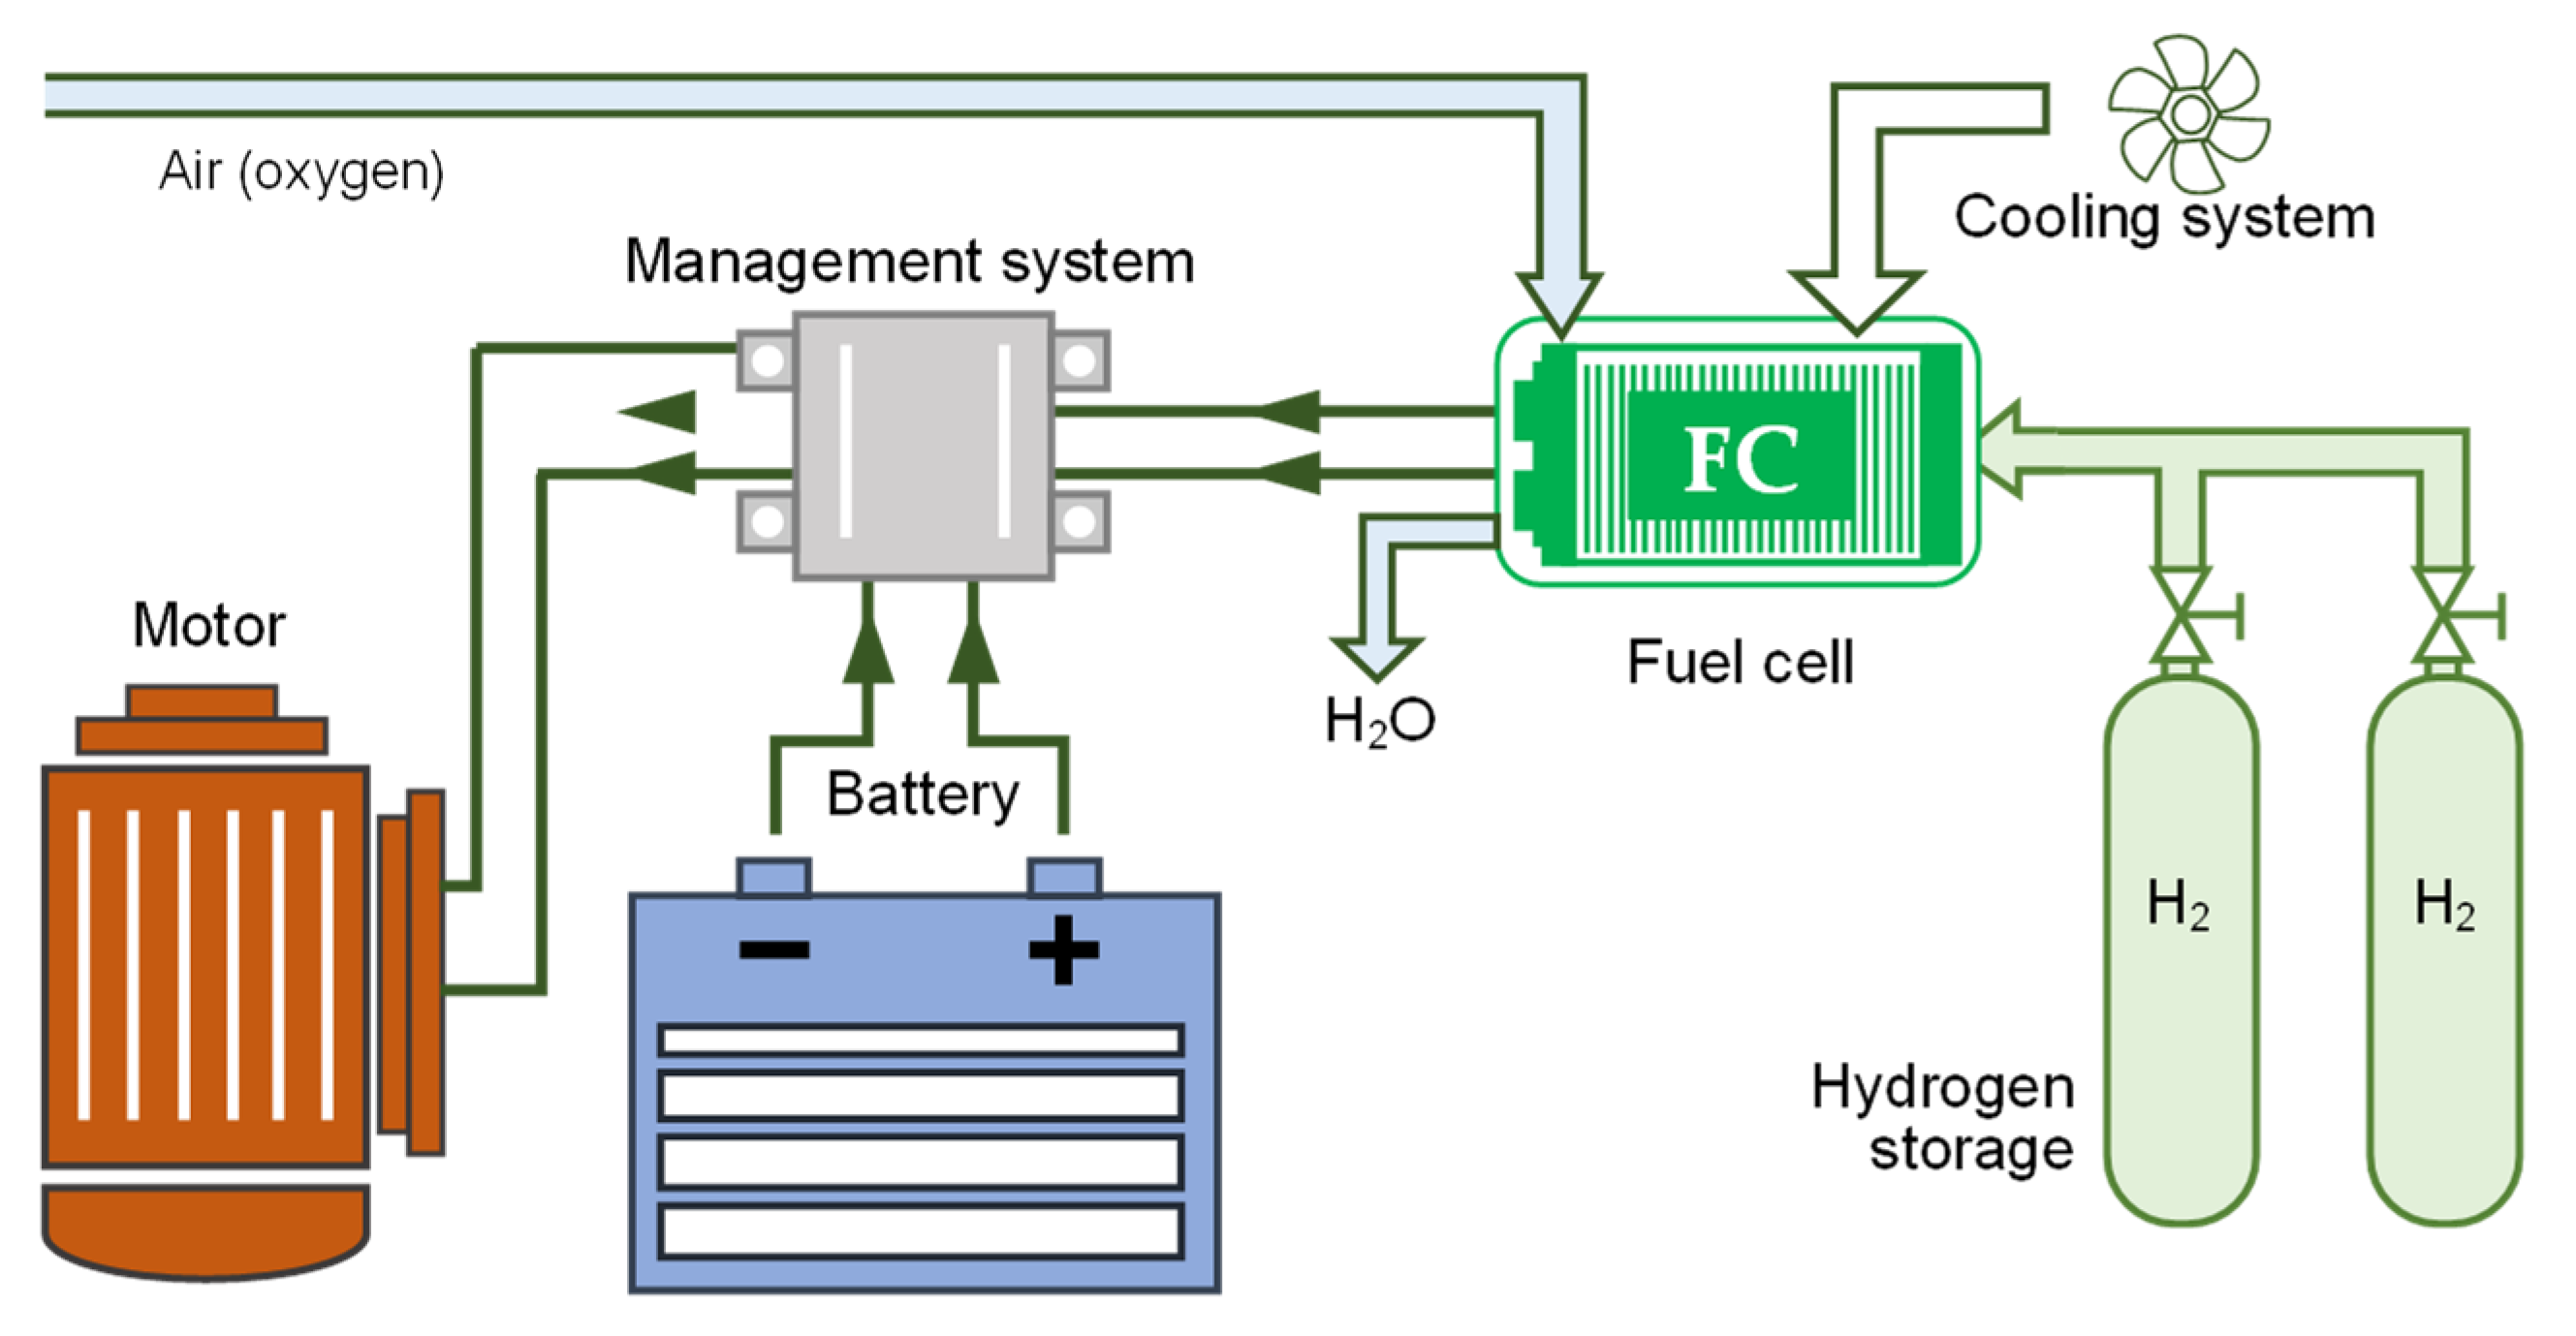
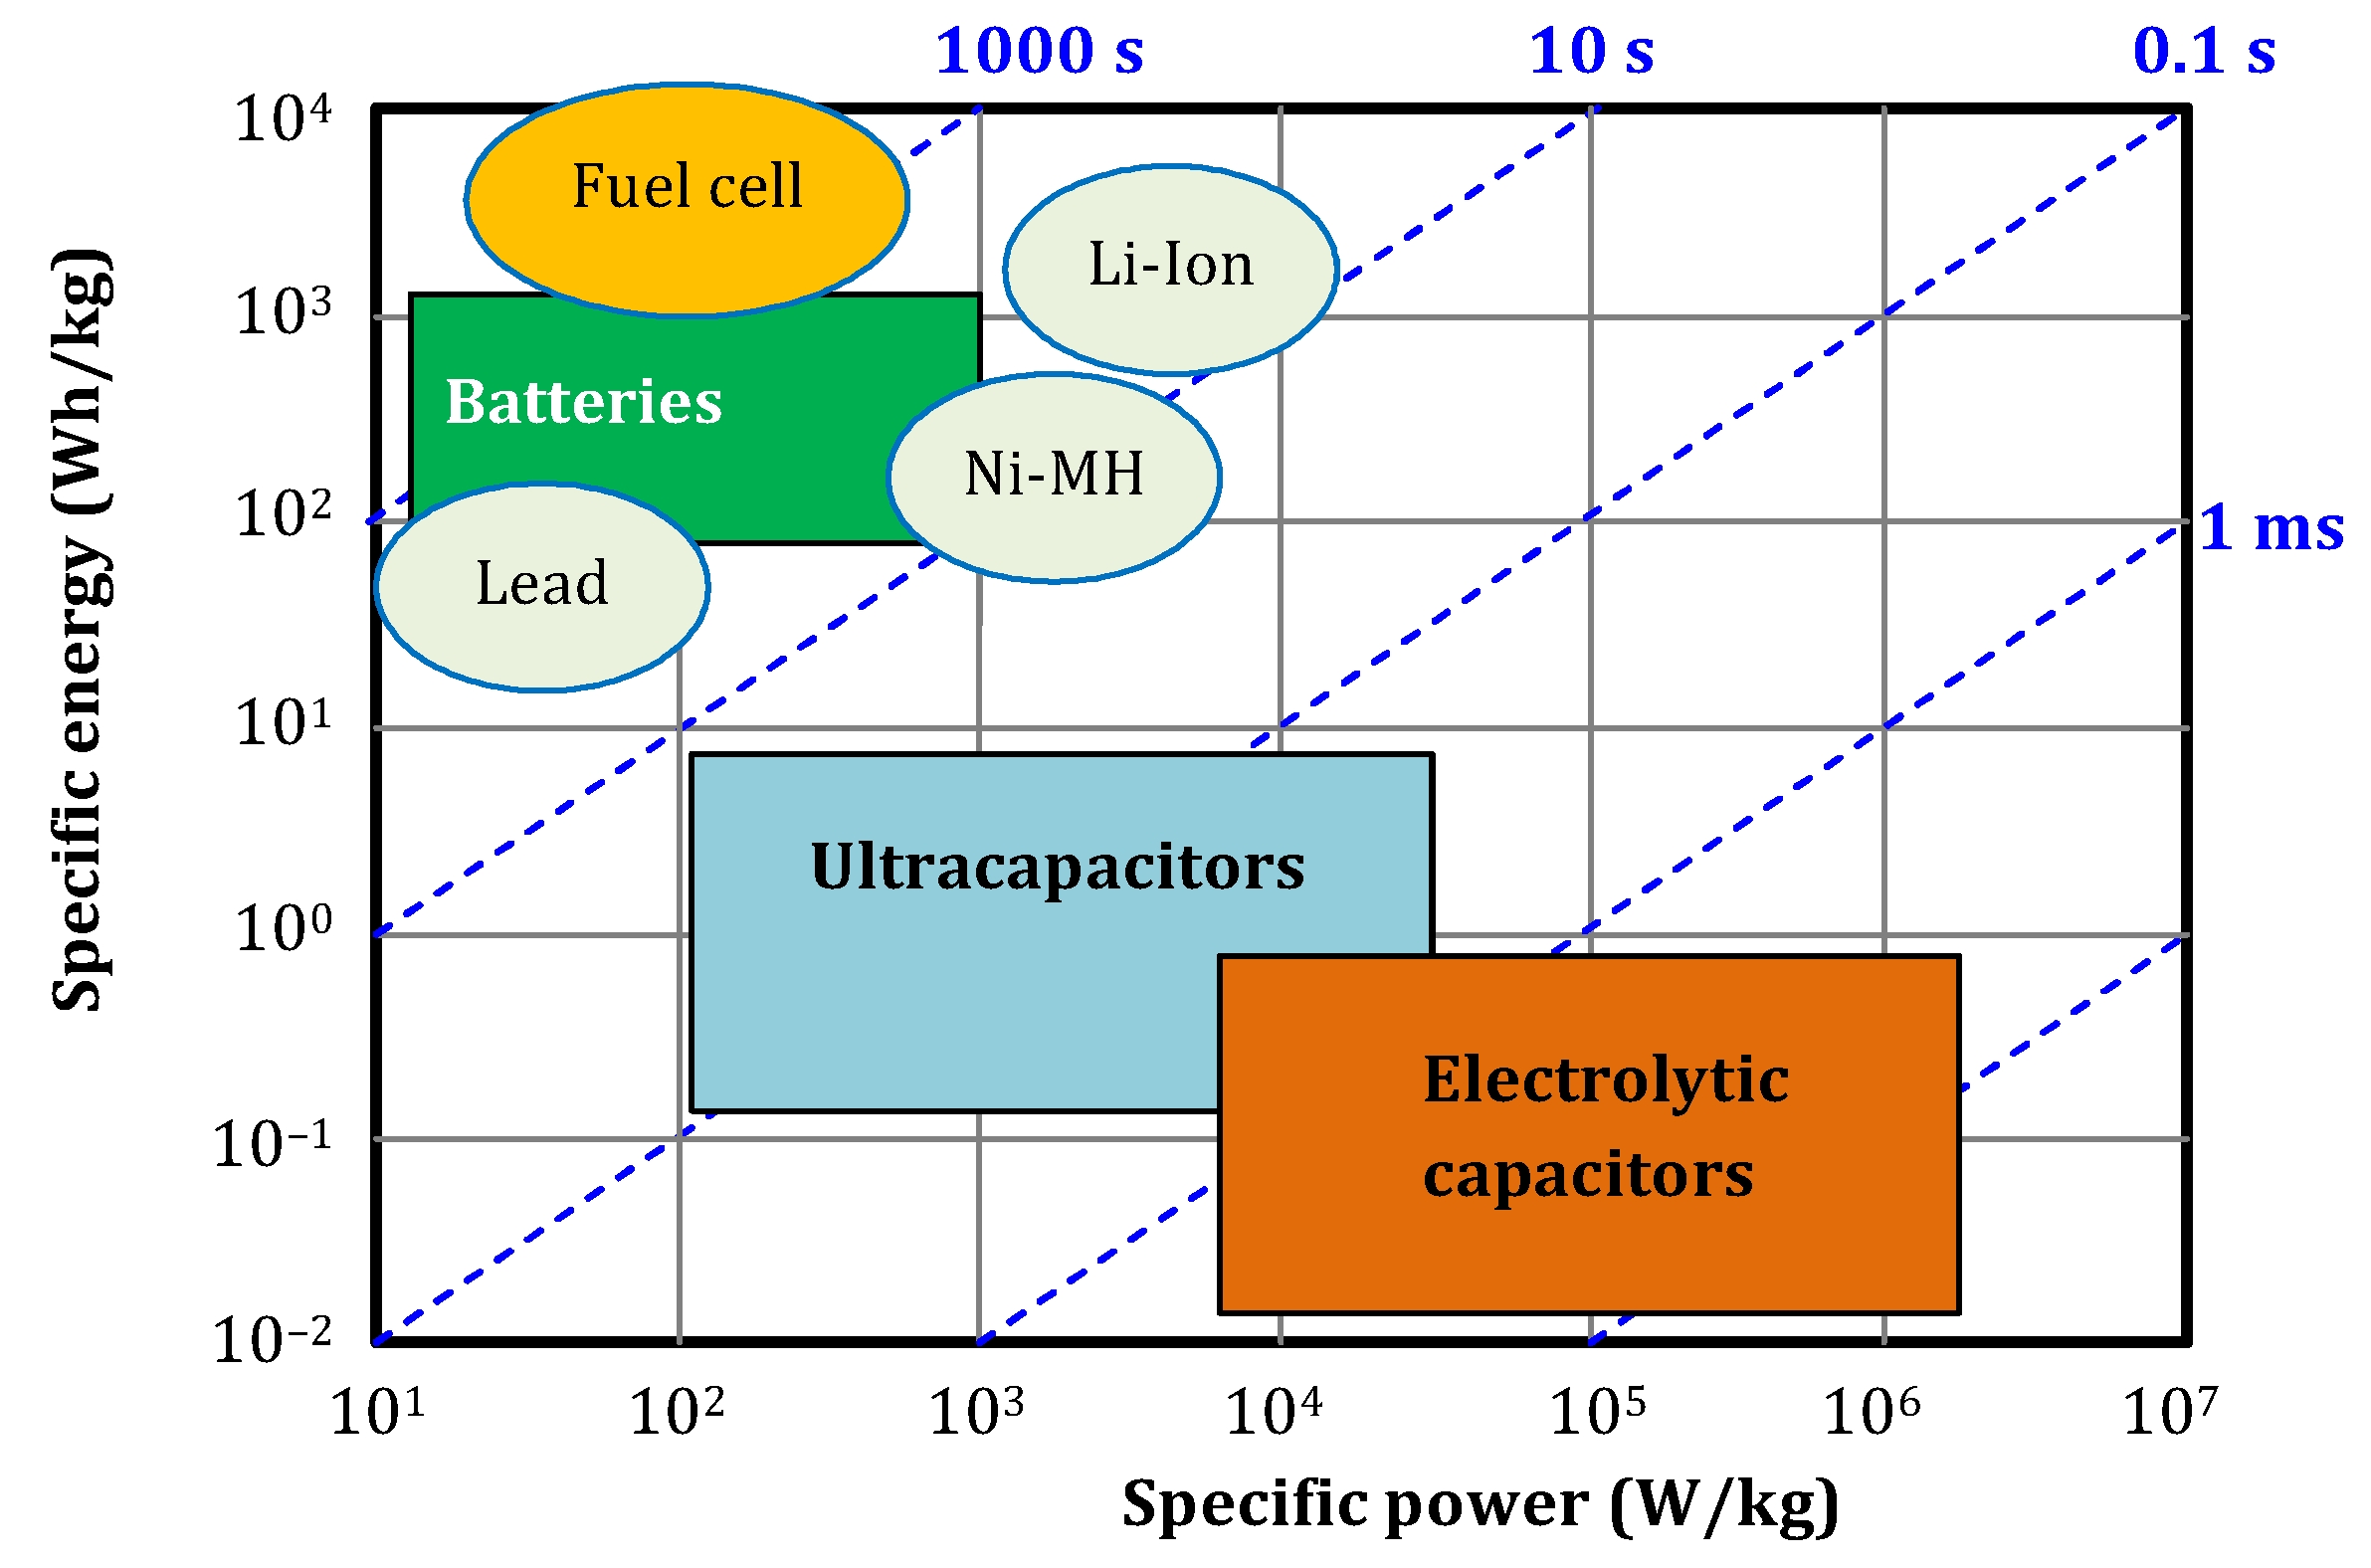
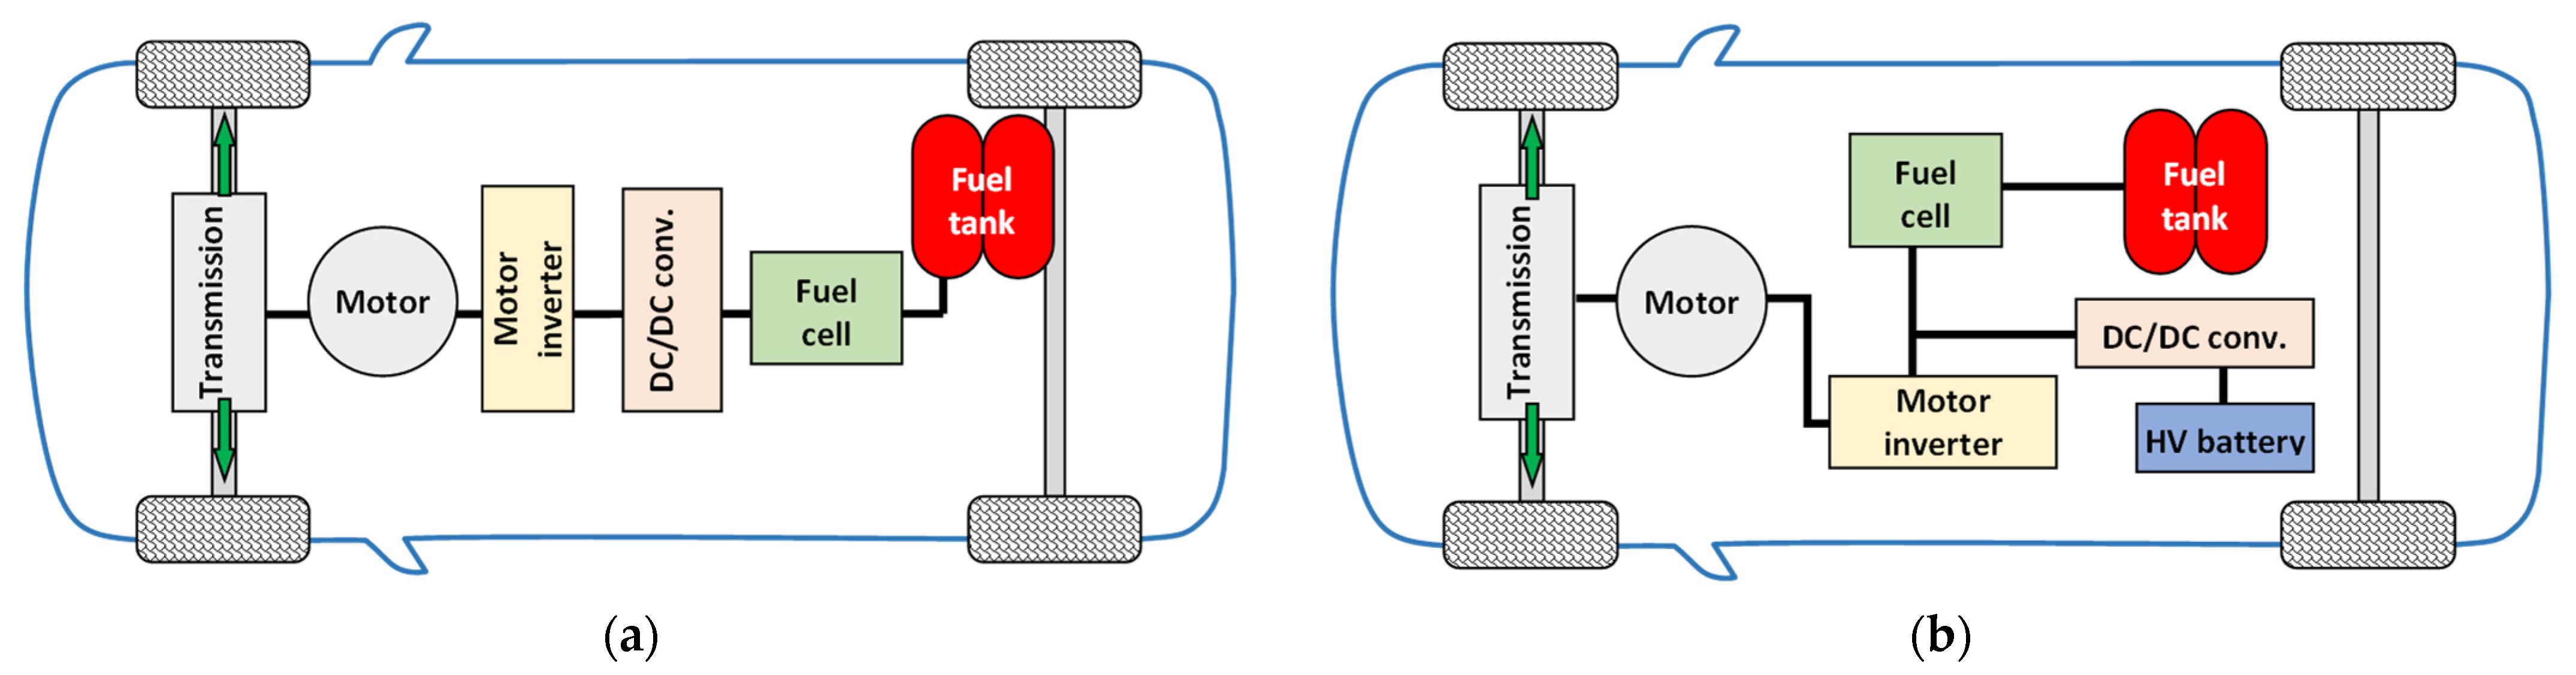
2. Fuel Cell Use in Vehicle Drive Systems

Typical solutions appearing in the literature concern two vehicle propulsion solutions (shown as diagrams in Figure 2): FCEV (fuel cell electric vehicle) [3] and FCHEV (fuel cell hybrid electric vehicle) [3,4,5]. The first one only uses fuel cells for all vehicle propulsion. Although this solution is much simpler in technical terms, it is nevertheless more difficult to implement. The main downside of this system stems from the fact that the fuel cell is an electro-chemical device, and the maximum rate at which chemical reactions take place usually takes a certain time to be reached [6]. Therefore, it is difficult to obtain the maximum power of such a system immediately after its activation. The second solution is a typical hybrid drive system. The fuel cell is usually the primary source of energy for the vehicle.
A battery with a low energy capacity of 1–3 kWh [7,8] would be used as a support device to complement the operation of the fuel cells. However, starting the vehicle and moving it in the initial period is completed largely with the use of batteries (since the fuel cell is not able to work independently immediately after activation).
In the nomenclature, hybrid vehicles are usually divided into two groups [9]: not-off-vehicle charging hybrid electric vehicles (NOVC-HEV) and off-vehicle charging hybrid electric vehicles (OVC-HEV).
Contemporary FCHEV vehicles offer relatively low battery energy capacity (NOVC-HEV): Toyota Mirai I gen.—1.59 kWh (Ni-MH); [10] Toyota Mirai II gen.—1.24 kWh (Li-Ion) [10], Hyundai Nexo—1.56 kWh (Li-Ion) [11]; Honda Clarity—1.7 kWh (Li-Ion) [12]. These small capacities are due to the fact that the fuel cell serves as the primary propulsion system of the vehicle instead of a battery. The analysis of the battery capacity and the power of the fuel cell was presented in Figure 3.
Figure 3 also presents some other drive systems solutions. The OVC-HEV category is used to describe plug-in vehicles. The Opel Vivaro with a fuel cell system (45 kW) includes a high voltage battery with a capacity of 10.5 kWh [16], which provides a vehicle range of 50 km in electric mode. Another example of such is the Renault Master Van H2-TECH equipped with a 30 kW fuel cell and a 33 kWh battery [17].
All the mentioned drive systems achieve a specific power density of 3.1 kW/dm3 [10,11,12]. The new Toyota Mirai II achieves a specific power density of 4.4 kW/dm3 (including end plates).
A different drive philosophy is represented by FEV proposed with the BREEZE! project [18]. It is a drive using fuel cells as a range extender. The vehicle was equipped with batteries with an electric capacity of 12 kWh and a fuel cell (PEM) with a power of 30 kW. The specific power density of the cell was 0.45 kW/dm3, and the drive efficiency reached 40–50%. The fuel cell consisted of 150 individual cells with an active surface area of 300 cm2.

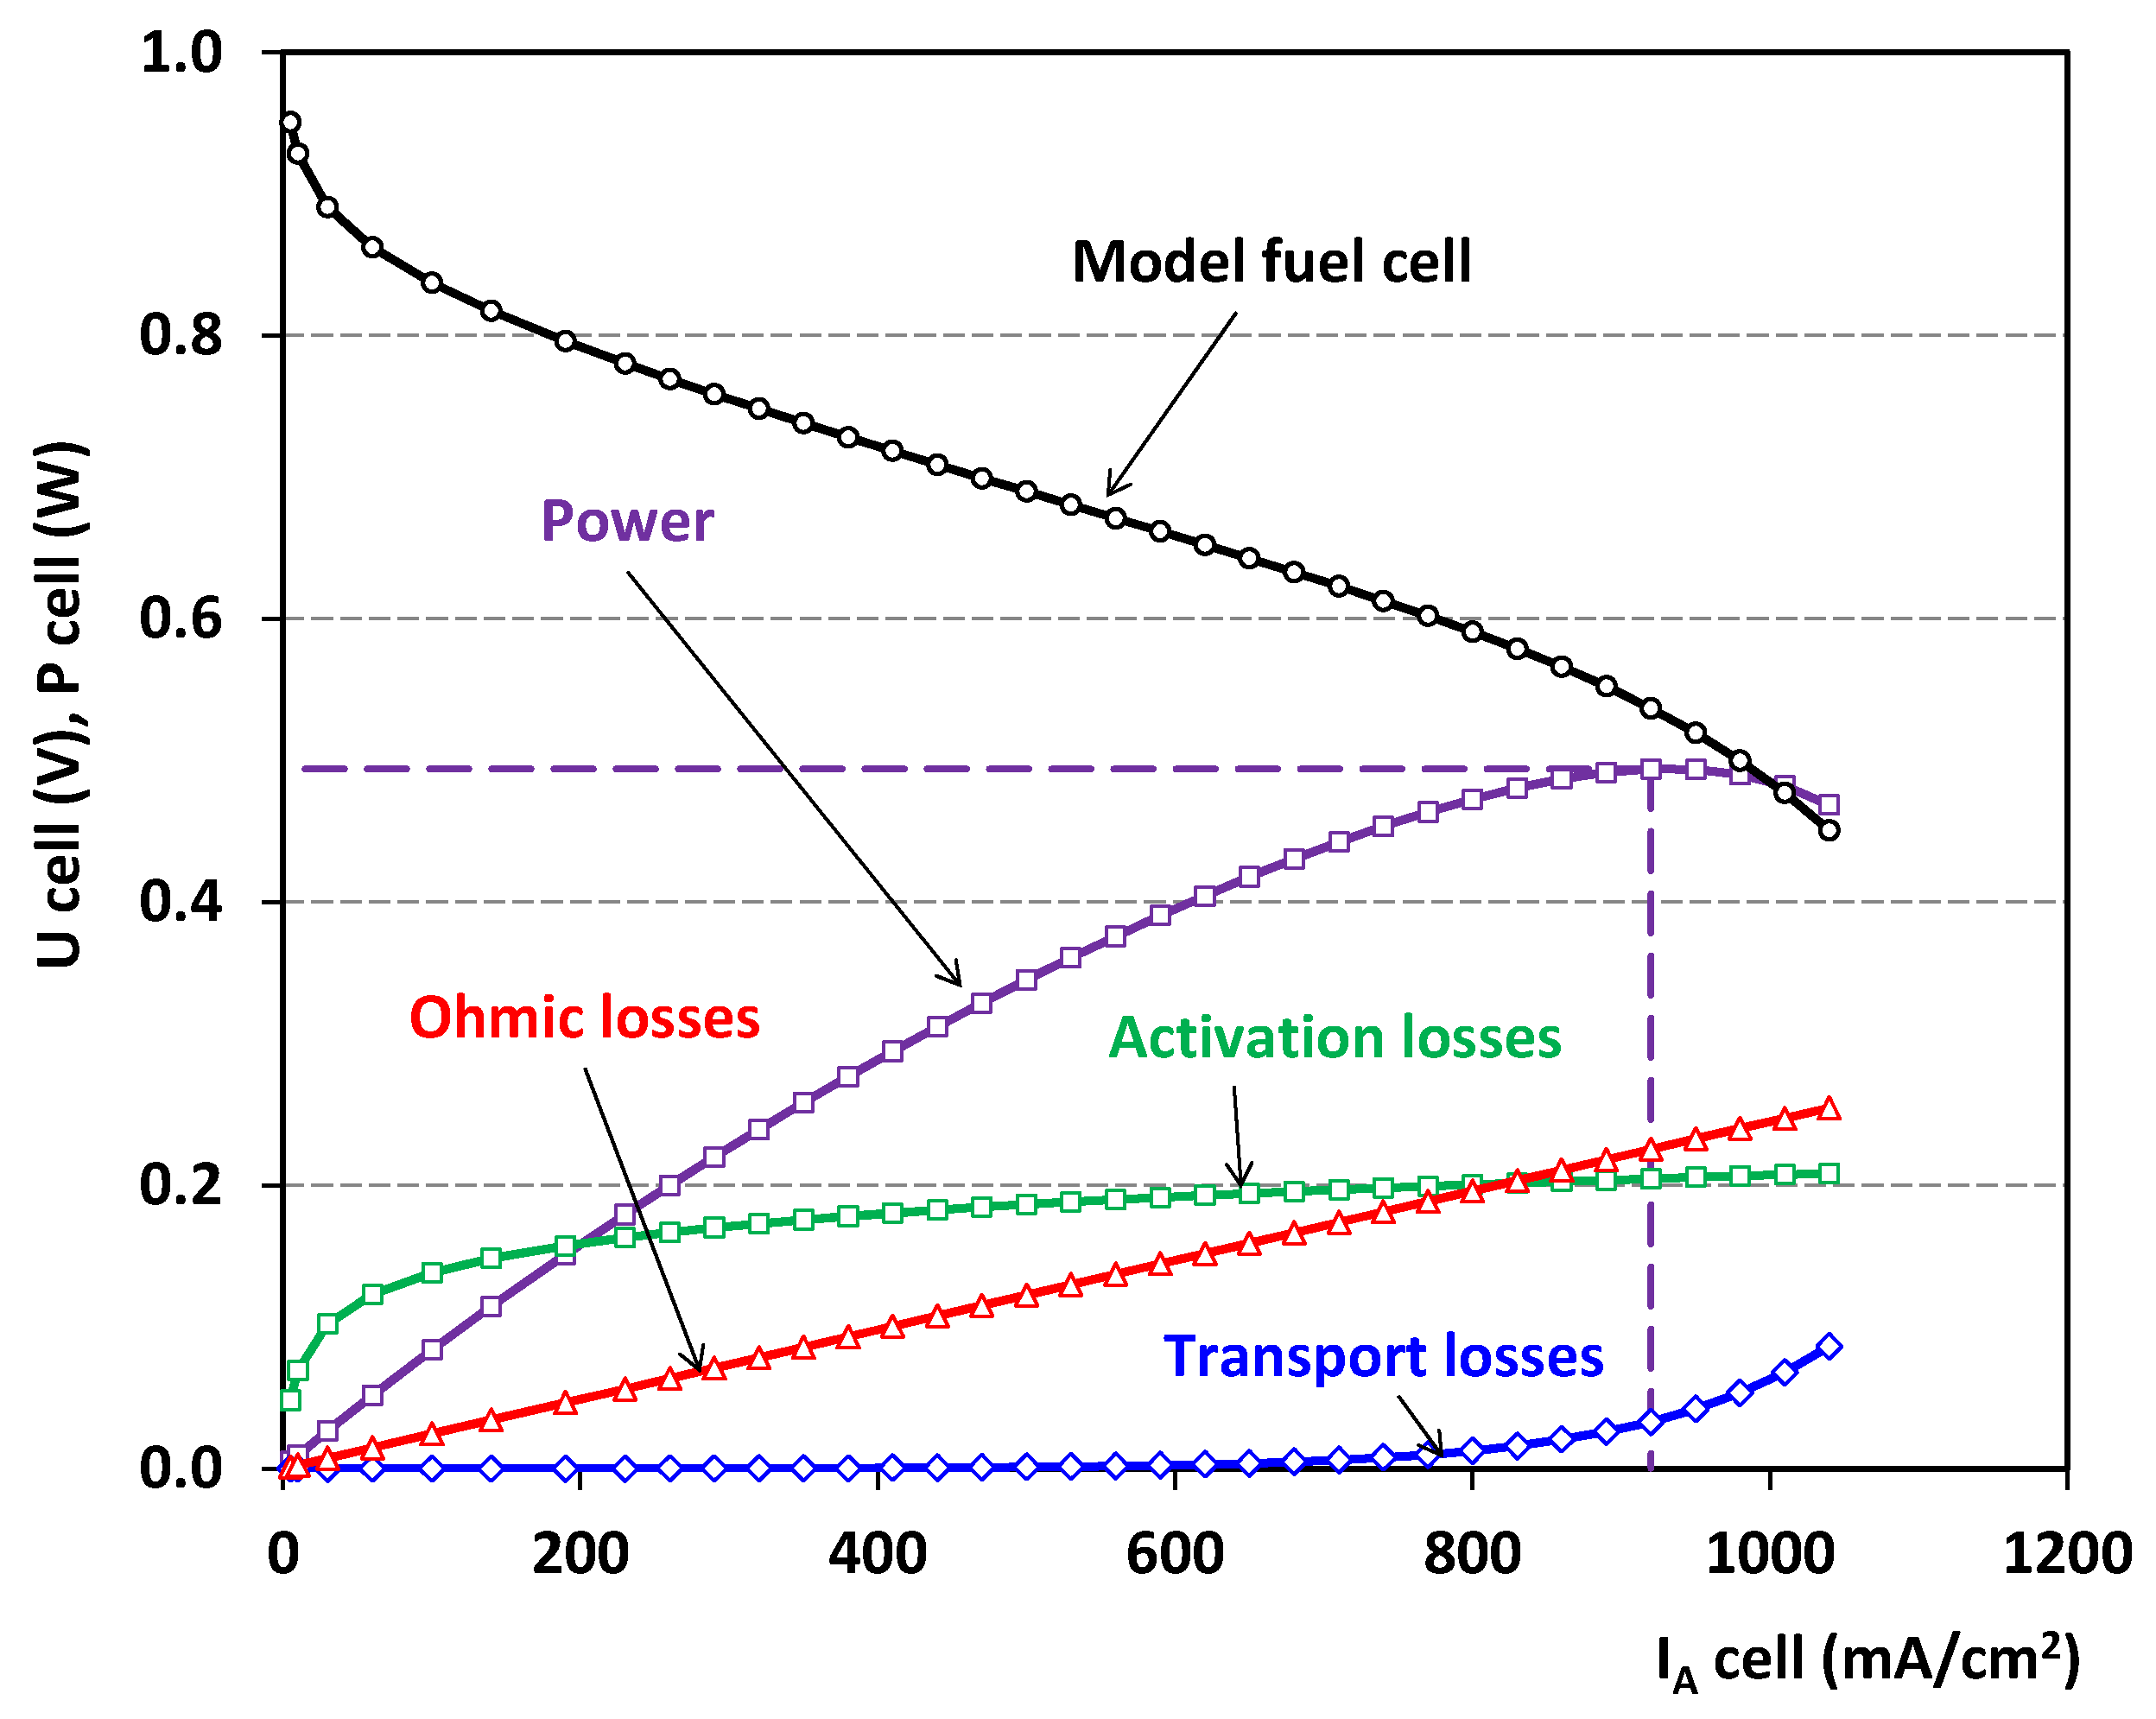
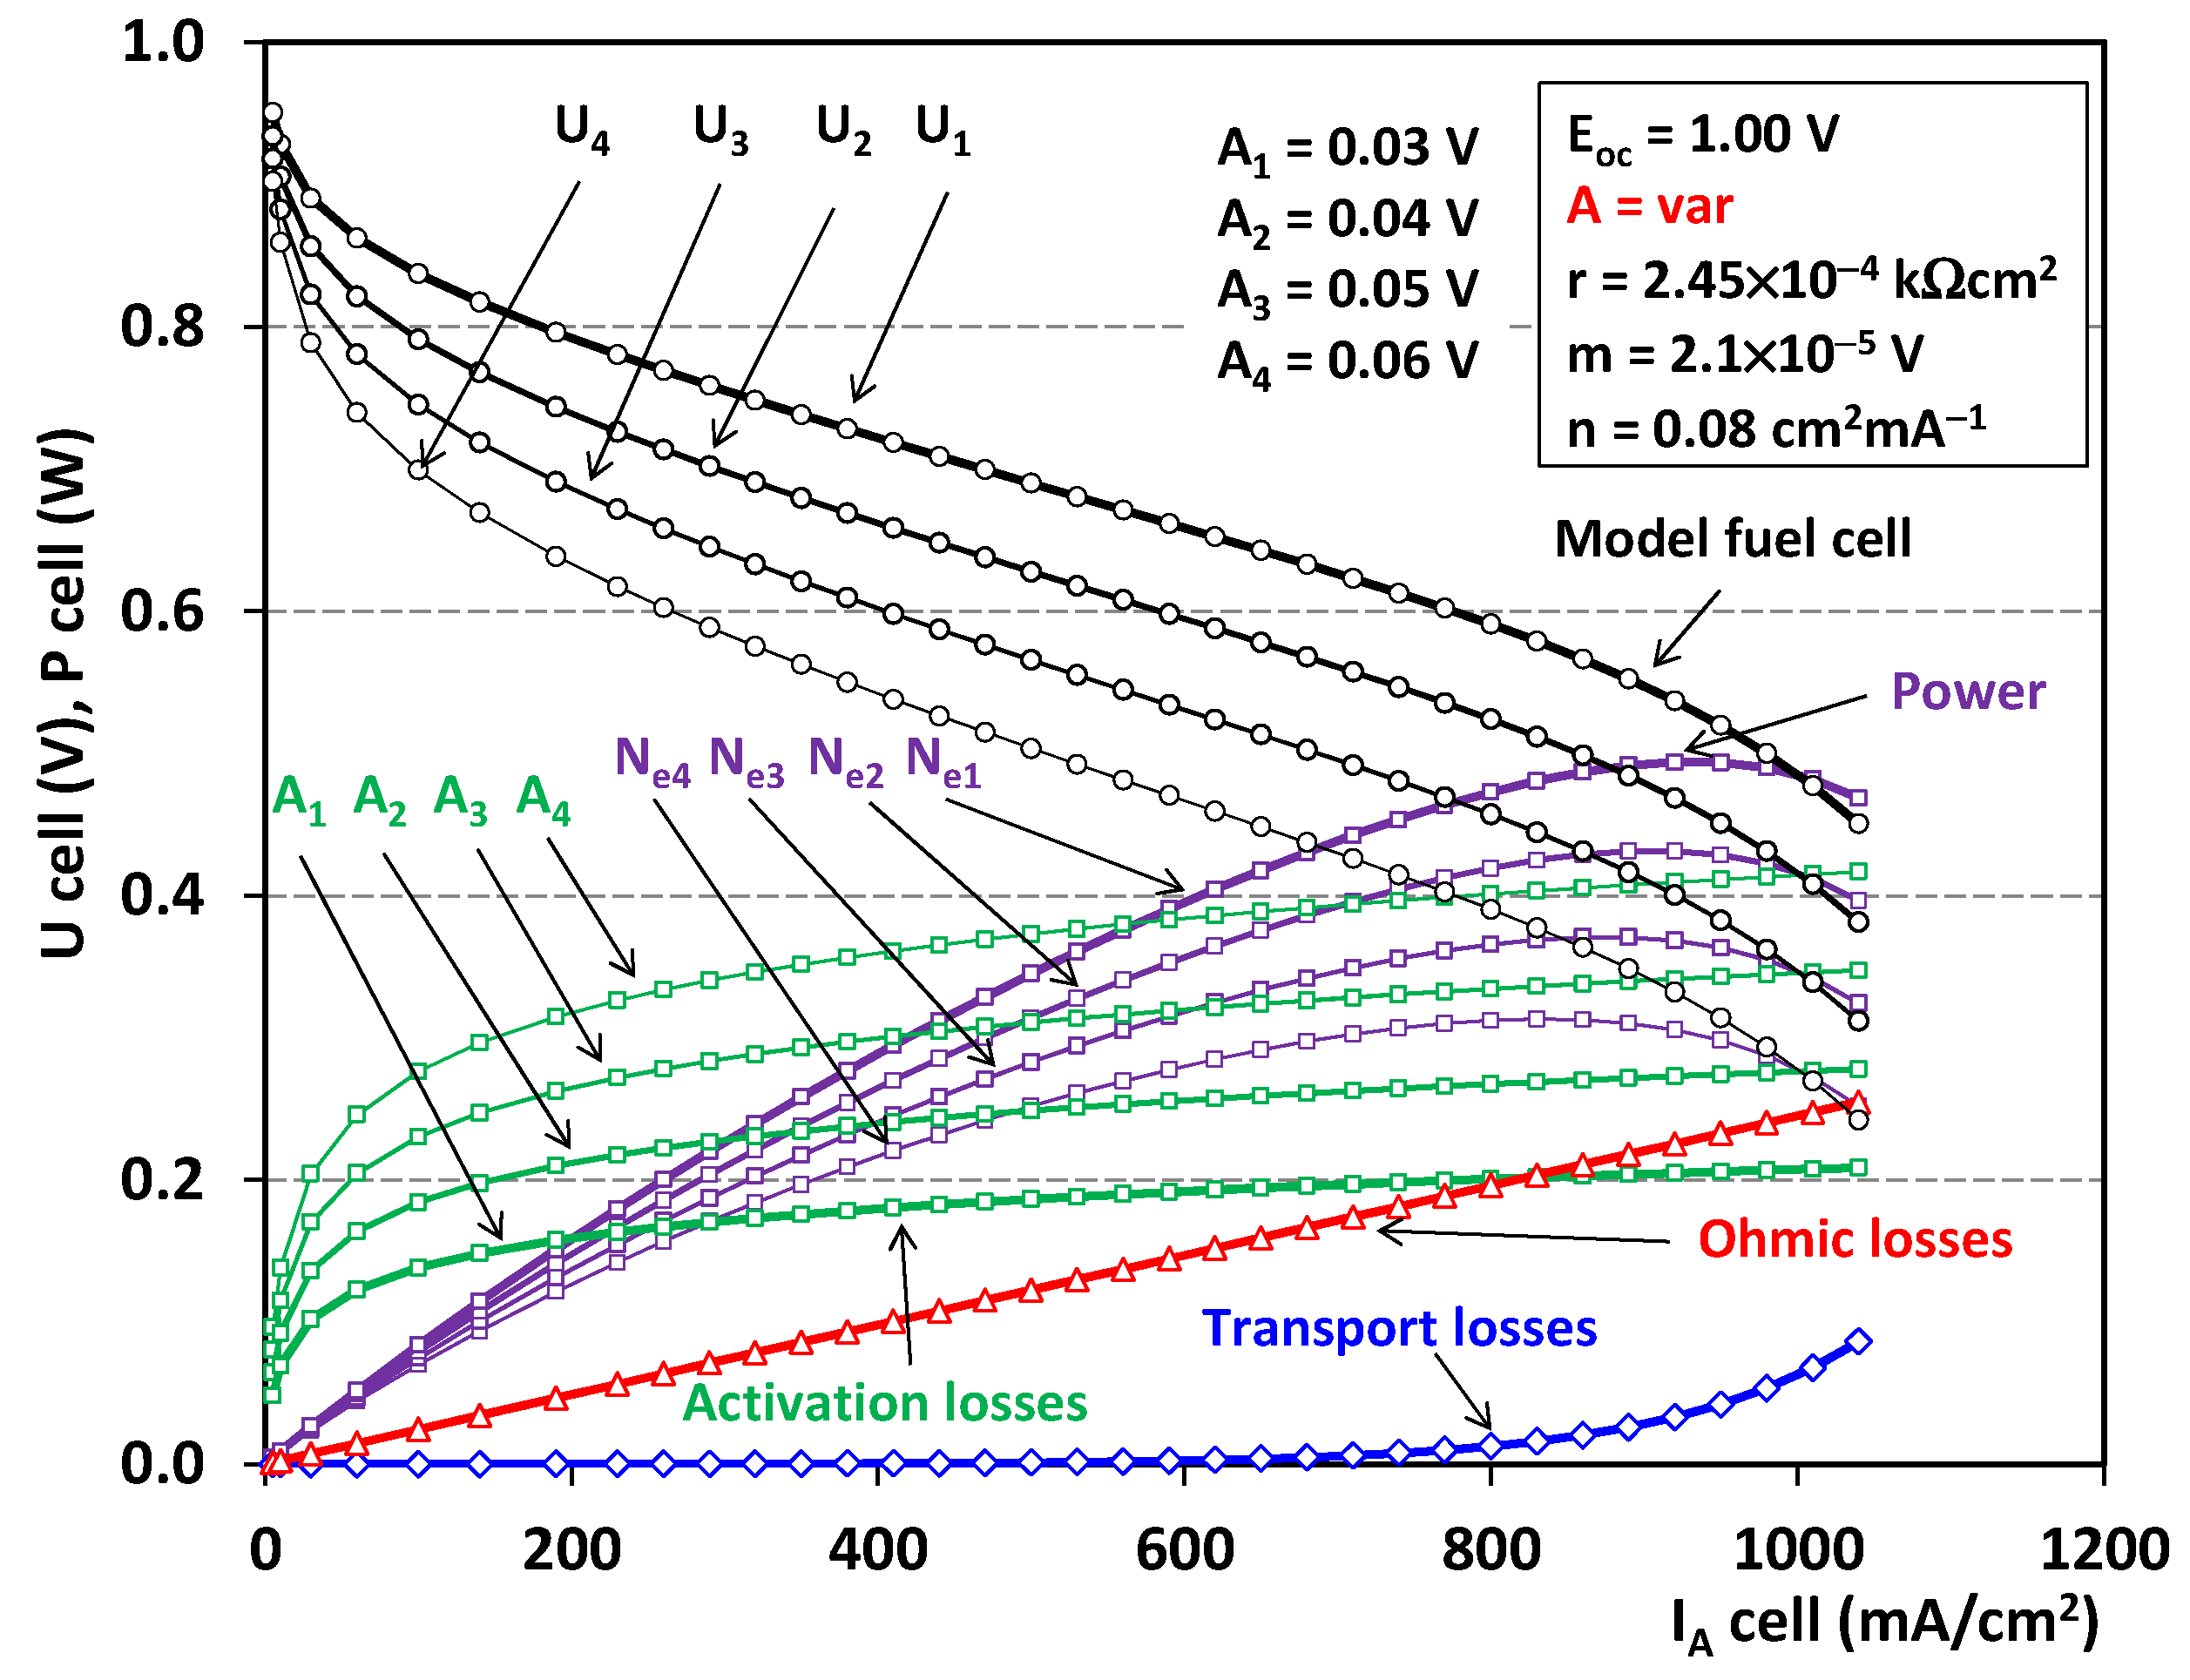
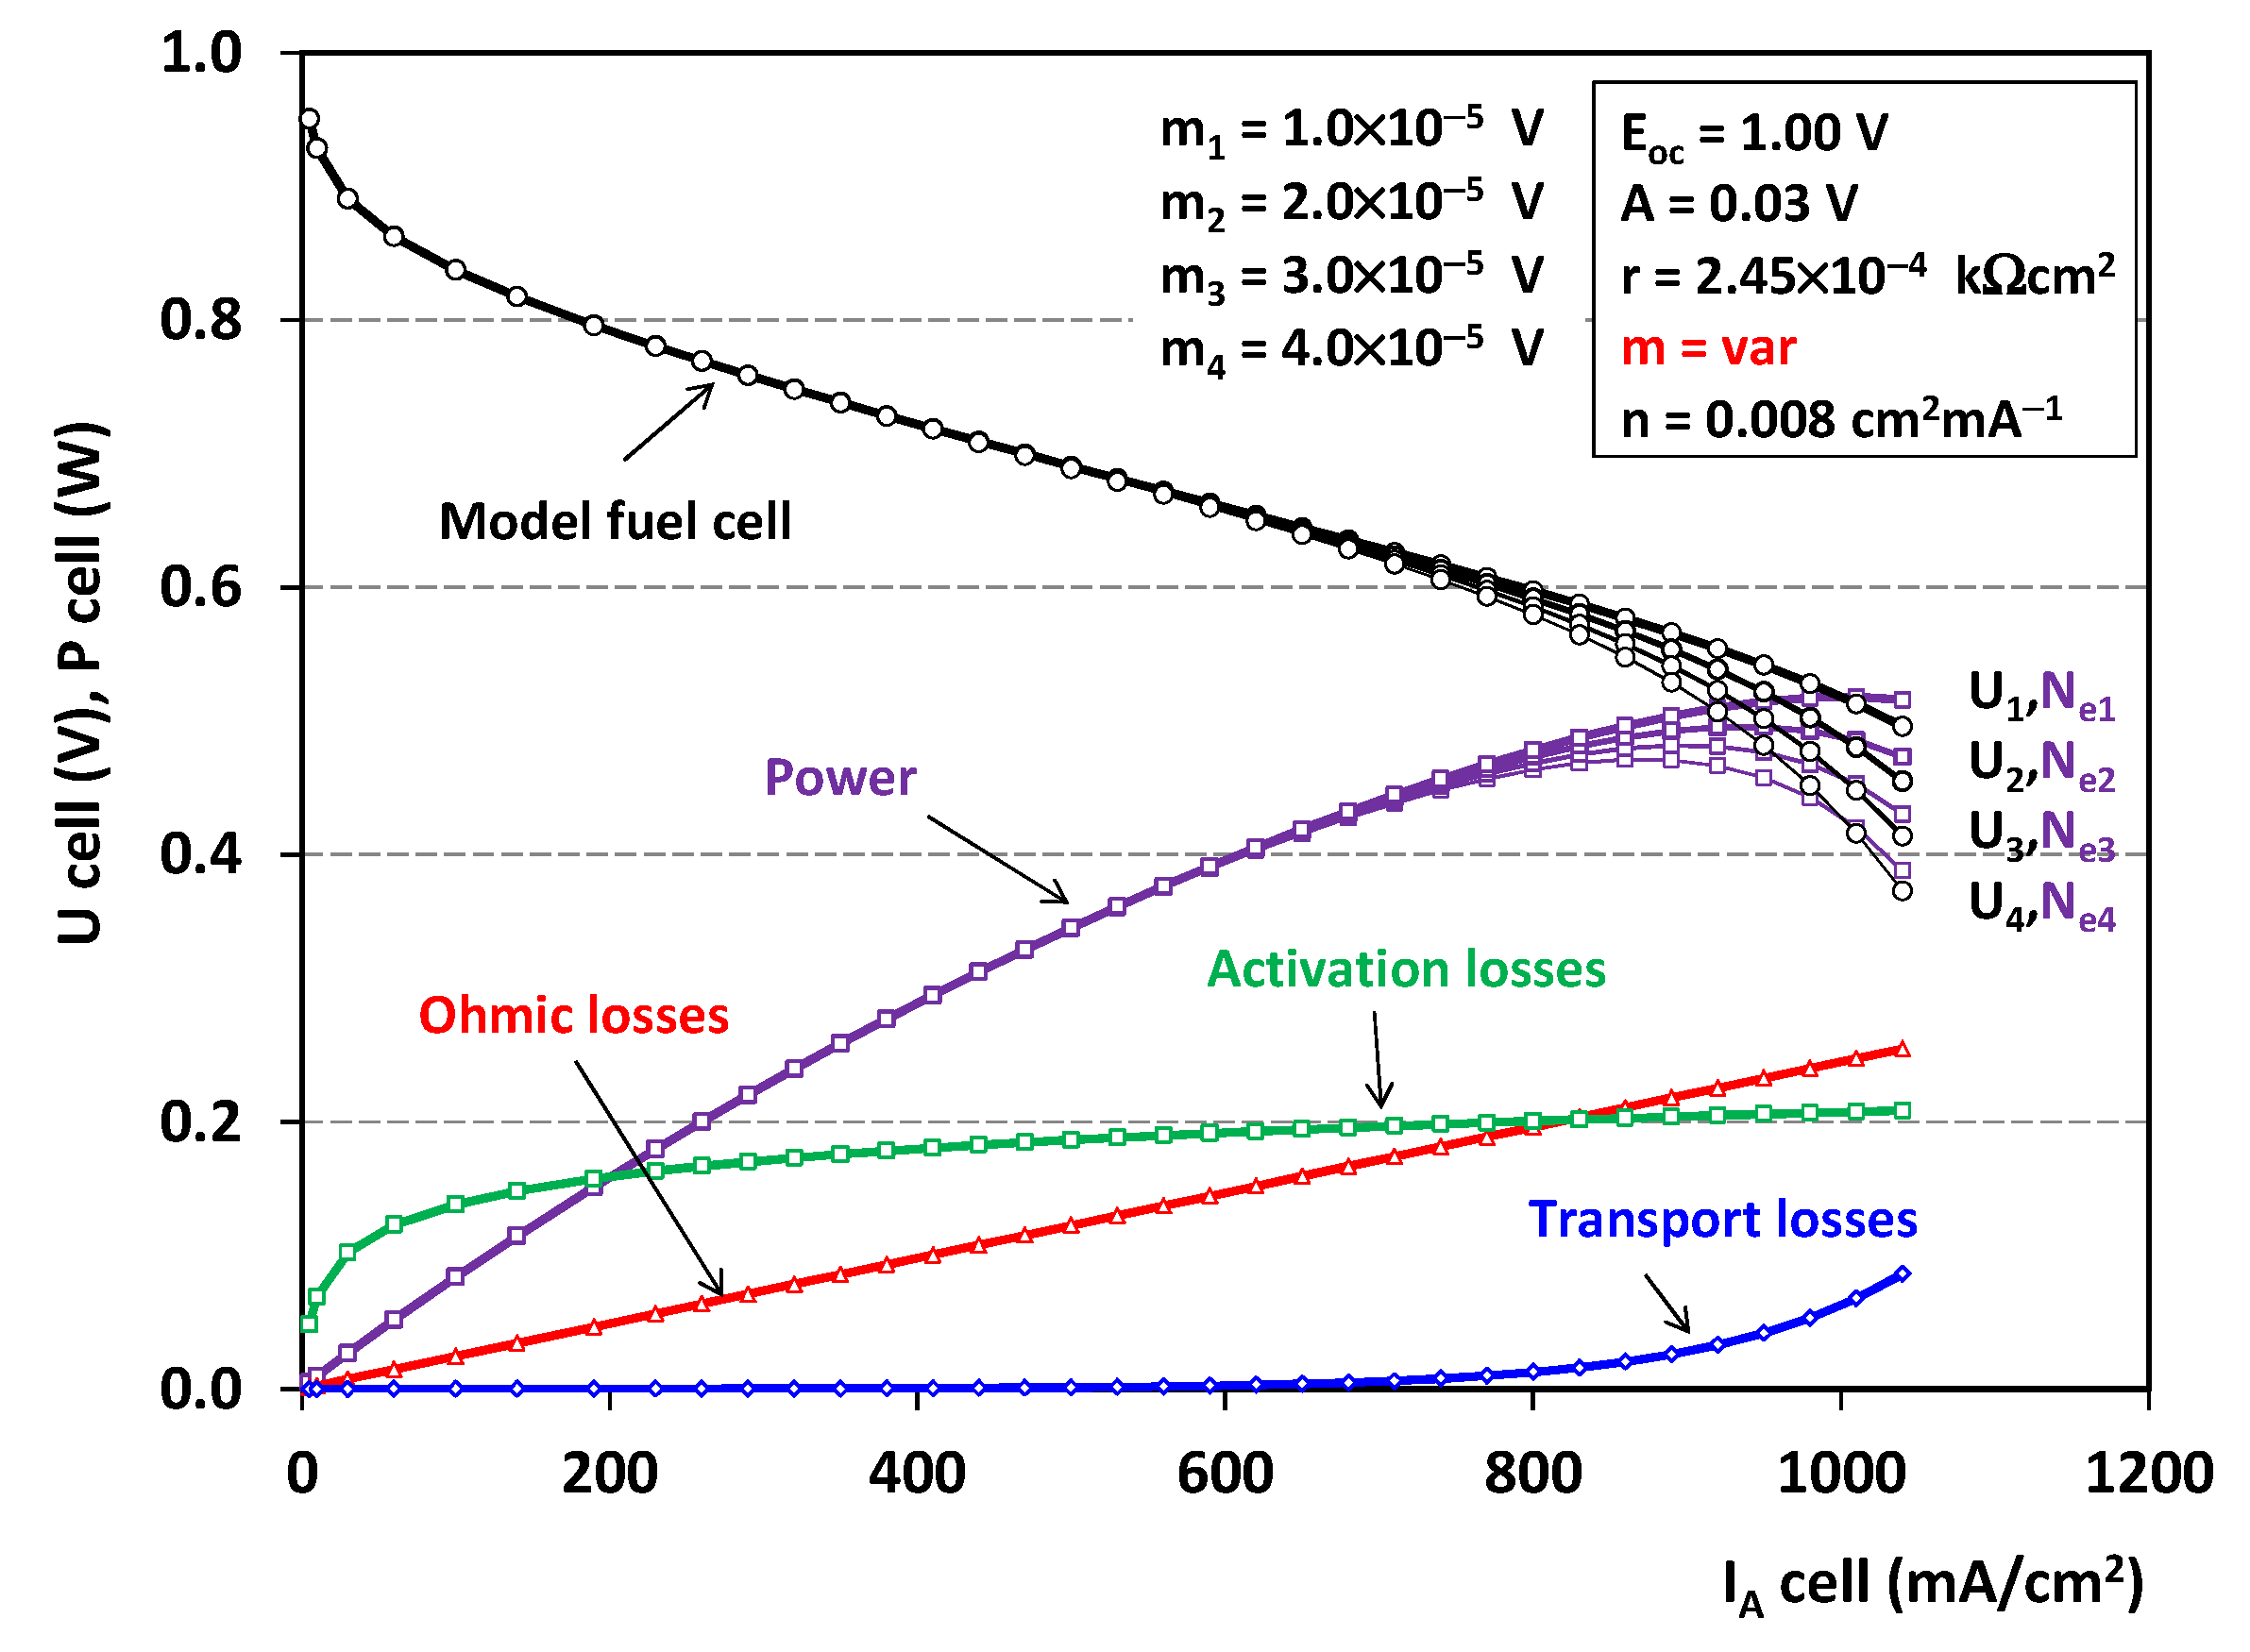
3. Modeling Fuel Cells

Modeling of fuel cells may include electrochemical [19,20,21], flow [21,22] and voltage losses calculations [23].
Based on the Butler–Volmer equation [24] relating to the equilibrium potential of a fuel cell, three separate voltage loss areas can be distinguished:
  • Voltage activation;
  • Resistive;
  • Mass transport.
The general equation that includes all types of voltage losses can be expressed as (Figure 4):
U FC = E + U act + U ohm + U trans ,
where UFC—fuel cell voltage, Uact—overvoltage (activation losses), Uohm—ohmic voltage losses, Utrans—losses of tension due to mass transport.
The voltage of the fuel cell with an open electrical circuit can be denoted as [25]:
E OC = Δ g f ¯ 2 · F
where Δ g f ¯ —Gibbs free energy, F—Faraday constant.
The effect of the voltage change with an open circuit and the associated fuel cell losses were shown in Figure 5. It should be noted that the change in EOC had an impact on the current–voltage characteristic values as well as on the cell power. However, it does not affect the value of the losses. The lack of impact that the EOC has on the cell losses results directly from Equation (1), which means that this value is not a component of the partial elements of the fuel cell losses.
The activation loss voltage Uact can be expressed as:
U act = A · ln ( i ) ,
where A—activation overvoltage, i—area-specific current (current density).
The effect of changing the A parameter on the cell characteristics was shown in Figure 6. Increasing the A value limits the cell voltage and its power. It also leads to a significant increase in activation losses.
Improvement in fuel cell performance through the current increase, and can be achieved by:
  • Increasing the cell temperature;
  • Use of effective catalysts;
  • Increasing the roughness of the electrodes’ surface, which increases the cell surface and leads to an increase in the current intensity;
  • Increasing the concentration of the reactants, e.g., using pure oxygen instead of air;
  • Increasing the reagents pressure.
Resistive (ohmic) voltage losses Uohm:
U ohm = r · i ,
where r—area specific resistance (internal resistance).
According to Equation (4), increasing the cell resistance r leads to an increase in resistive losses, which results in reduced cell voltage, especially in the linear range (Figure 7). The voltage drop results in a reduction of its power.
There are several options for reducing resistive losses:
  • Using electrodes with the highest possible conductivity;
  • Dilute the electrolyte to the maximum viable values.
Mass transport voltage losses Utrans:
U trans = m · exp ( n · i ) ,
where m—constants in the mass-transfer overvoltage, n—constants in the mass-transfer overvoltage.
Changes in the m factor primarily affect the last fragment of the voltage–current characteristic (Figure 8). There is an increase in mass transport losses and a reduction in the voltage of the fuel cell (and thus the power of the cell) at the same time.
Using all of the component Equations (2)–(5), one can write:
U FC = E OC A · ln ( i ) r · i m · exp ( n · i ) .
Equation (6) is the basis for determining the voltage losses of a fuel cell.
The power and energy of fuel cells were determined based on the values of UFC, IFC, and Δt by multiplying these quantities. The battery power was determined in a similar way by multiplying the UB and IB values. For a complete analysis of the equations defining the energy flow analysis, see [26].
The novelty of the work in relation to the current research and analyses is the undertaken attempt to estimate the differences in the use of fuel cells in two generations of hydrogen-powered propulsion solutions. Additionally, an attempt was made to mathematically model the fuel cells using their actual operating conditions in vehicles as the basis for the calculations.

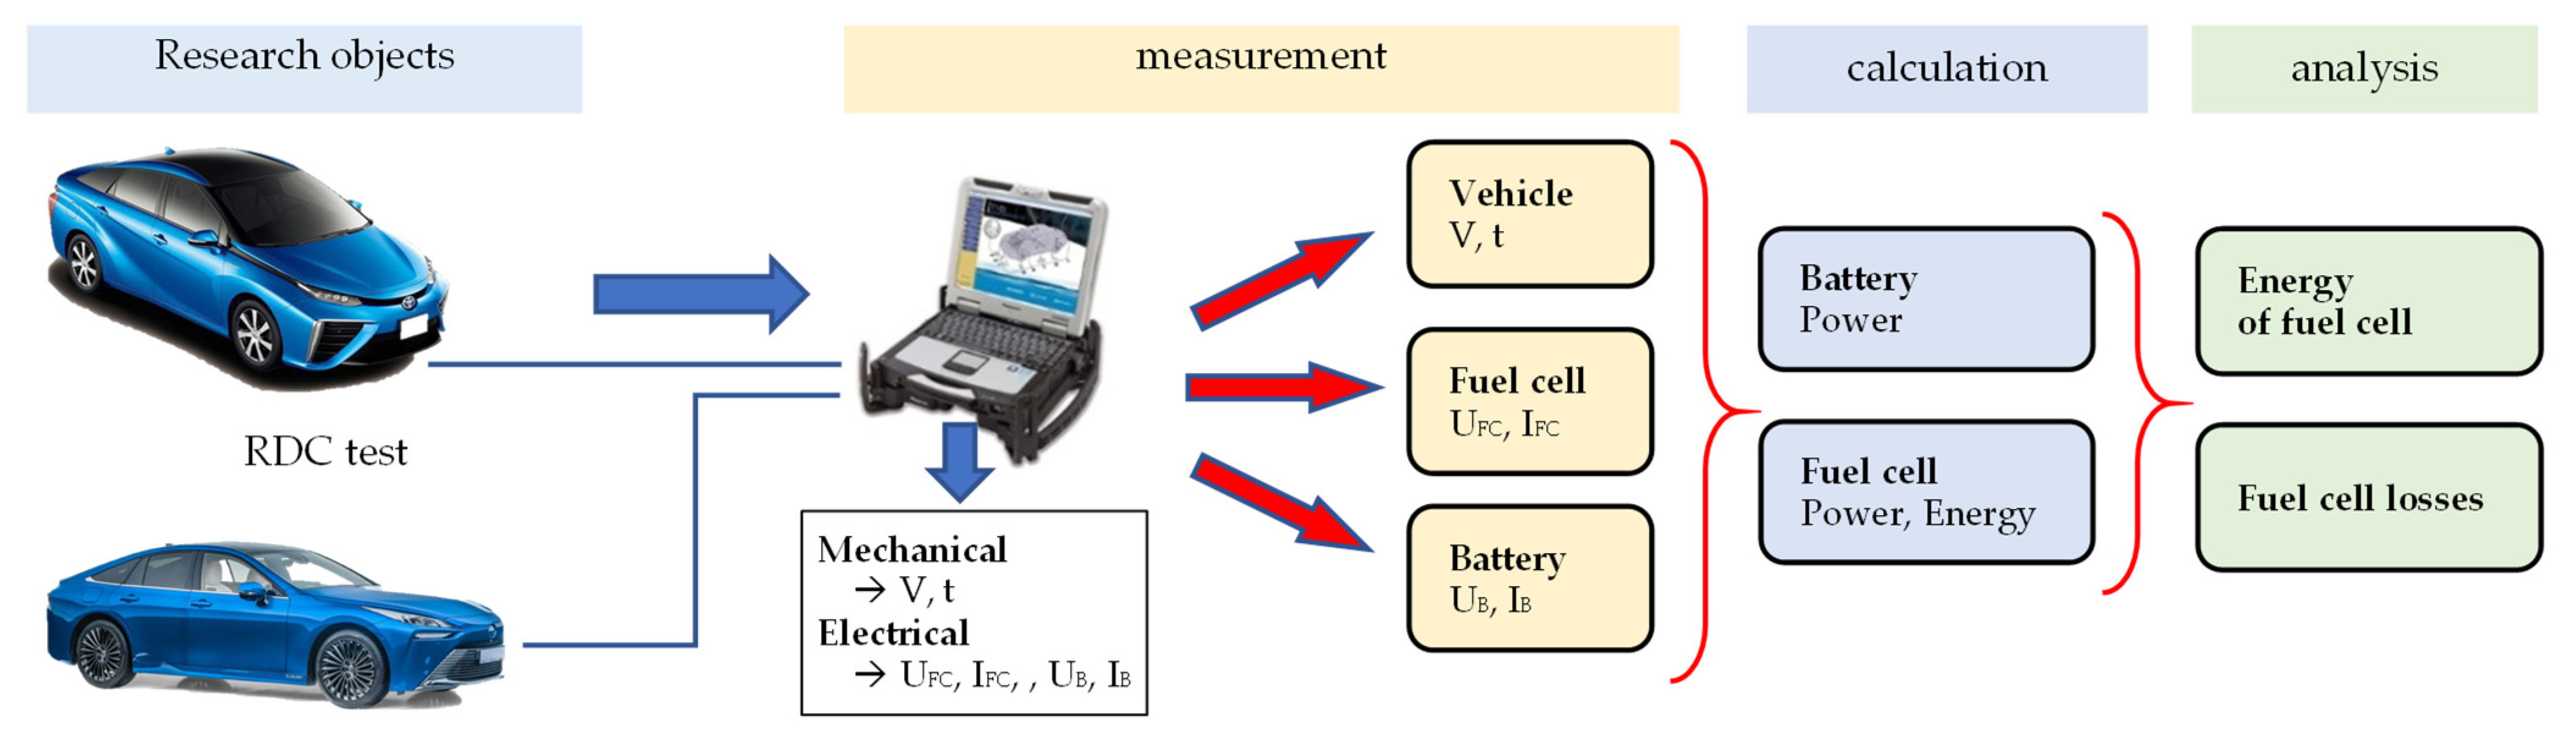
4. Materials and Methods

The research on fuel cell losses was carried out using as a basis two generations of the Toyota Mirai drive systems. The technical data of the drives was listed in Table 1. Both generations featured a hybrid drive system, which contained two sources of energy and propulsion. The system had the option to drive using battery power, fuel cell power, or both of these energy sources simultaneously. It was categorized as a parallel drive system as shown in Figure 5. It should be noted that, according to Table 1, the power of the fuel cell was about 4 times greater than the power provided by the battery (regardless of the energy generation in the system). This means that the fuel cell was the dominant power source in the vehicle. Both generations contain the same types of fuel cells (with slightly changed parameters) with different types of batteries. The newer generation of the drive includes Li-Ion batteries with a lower value of electric capacity but a higher value of operating voltage.
The drive system presented in Figure 9 was the same for both of the used system generations. The only differences were in the number of hydrogen storage cylinders (the newer generation of the drive had 3; while the older generation only had two) and in the drive and energy flow control method of the two generations (due to the change of system elements).
The research work was carried out in accordance with the RDE test requirements. Diagnostic data were obtained from a dedicated TechStream on-board diagnostic system. The data acquisition included parameters such as vehicle driving conditions (V, t), battery operating conditions (UB, IB), and fuel cell operating conditions (UFC, IFC)—Figure 10.
The mileage of the older generation Toyota Mirai (JPD10 model, production date 11 November 2015) was 40 thousand km, while the new generation (model JPD20, production date 24 November 2020)—was only 280 km. Obviously, the tested vehicles had a very different level of wear in their fuel cells. However, it was not possible to measure two generations of vehicles with the same mileage due to the production window of both these models.
Taking into account the small number of research tests, no correction factors for the difference in vehicle mileage have been introduced. Further scientific work will make it possible to identify and apply these variables to the final results of the model studies.

5. Results

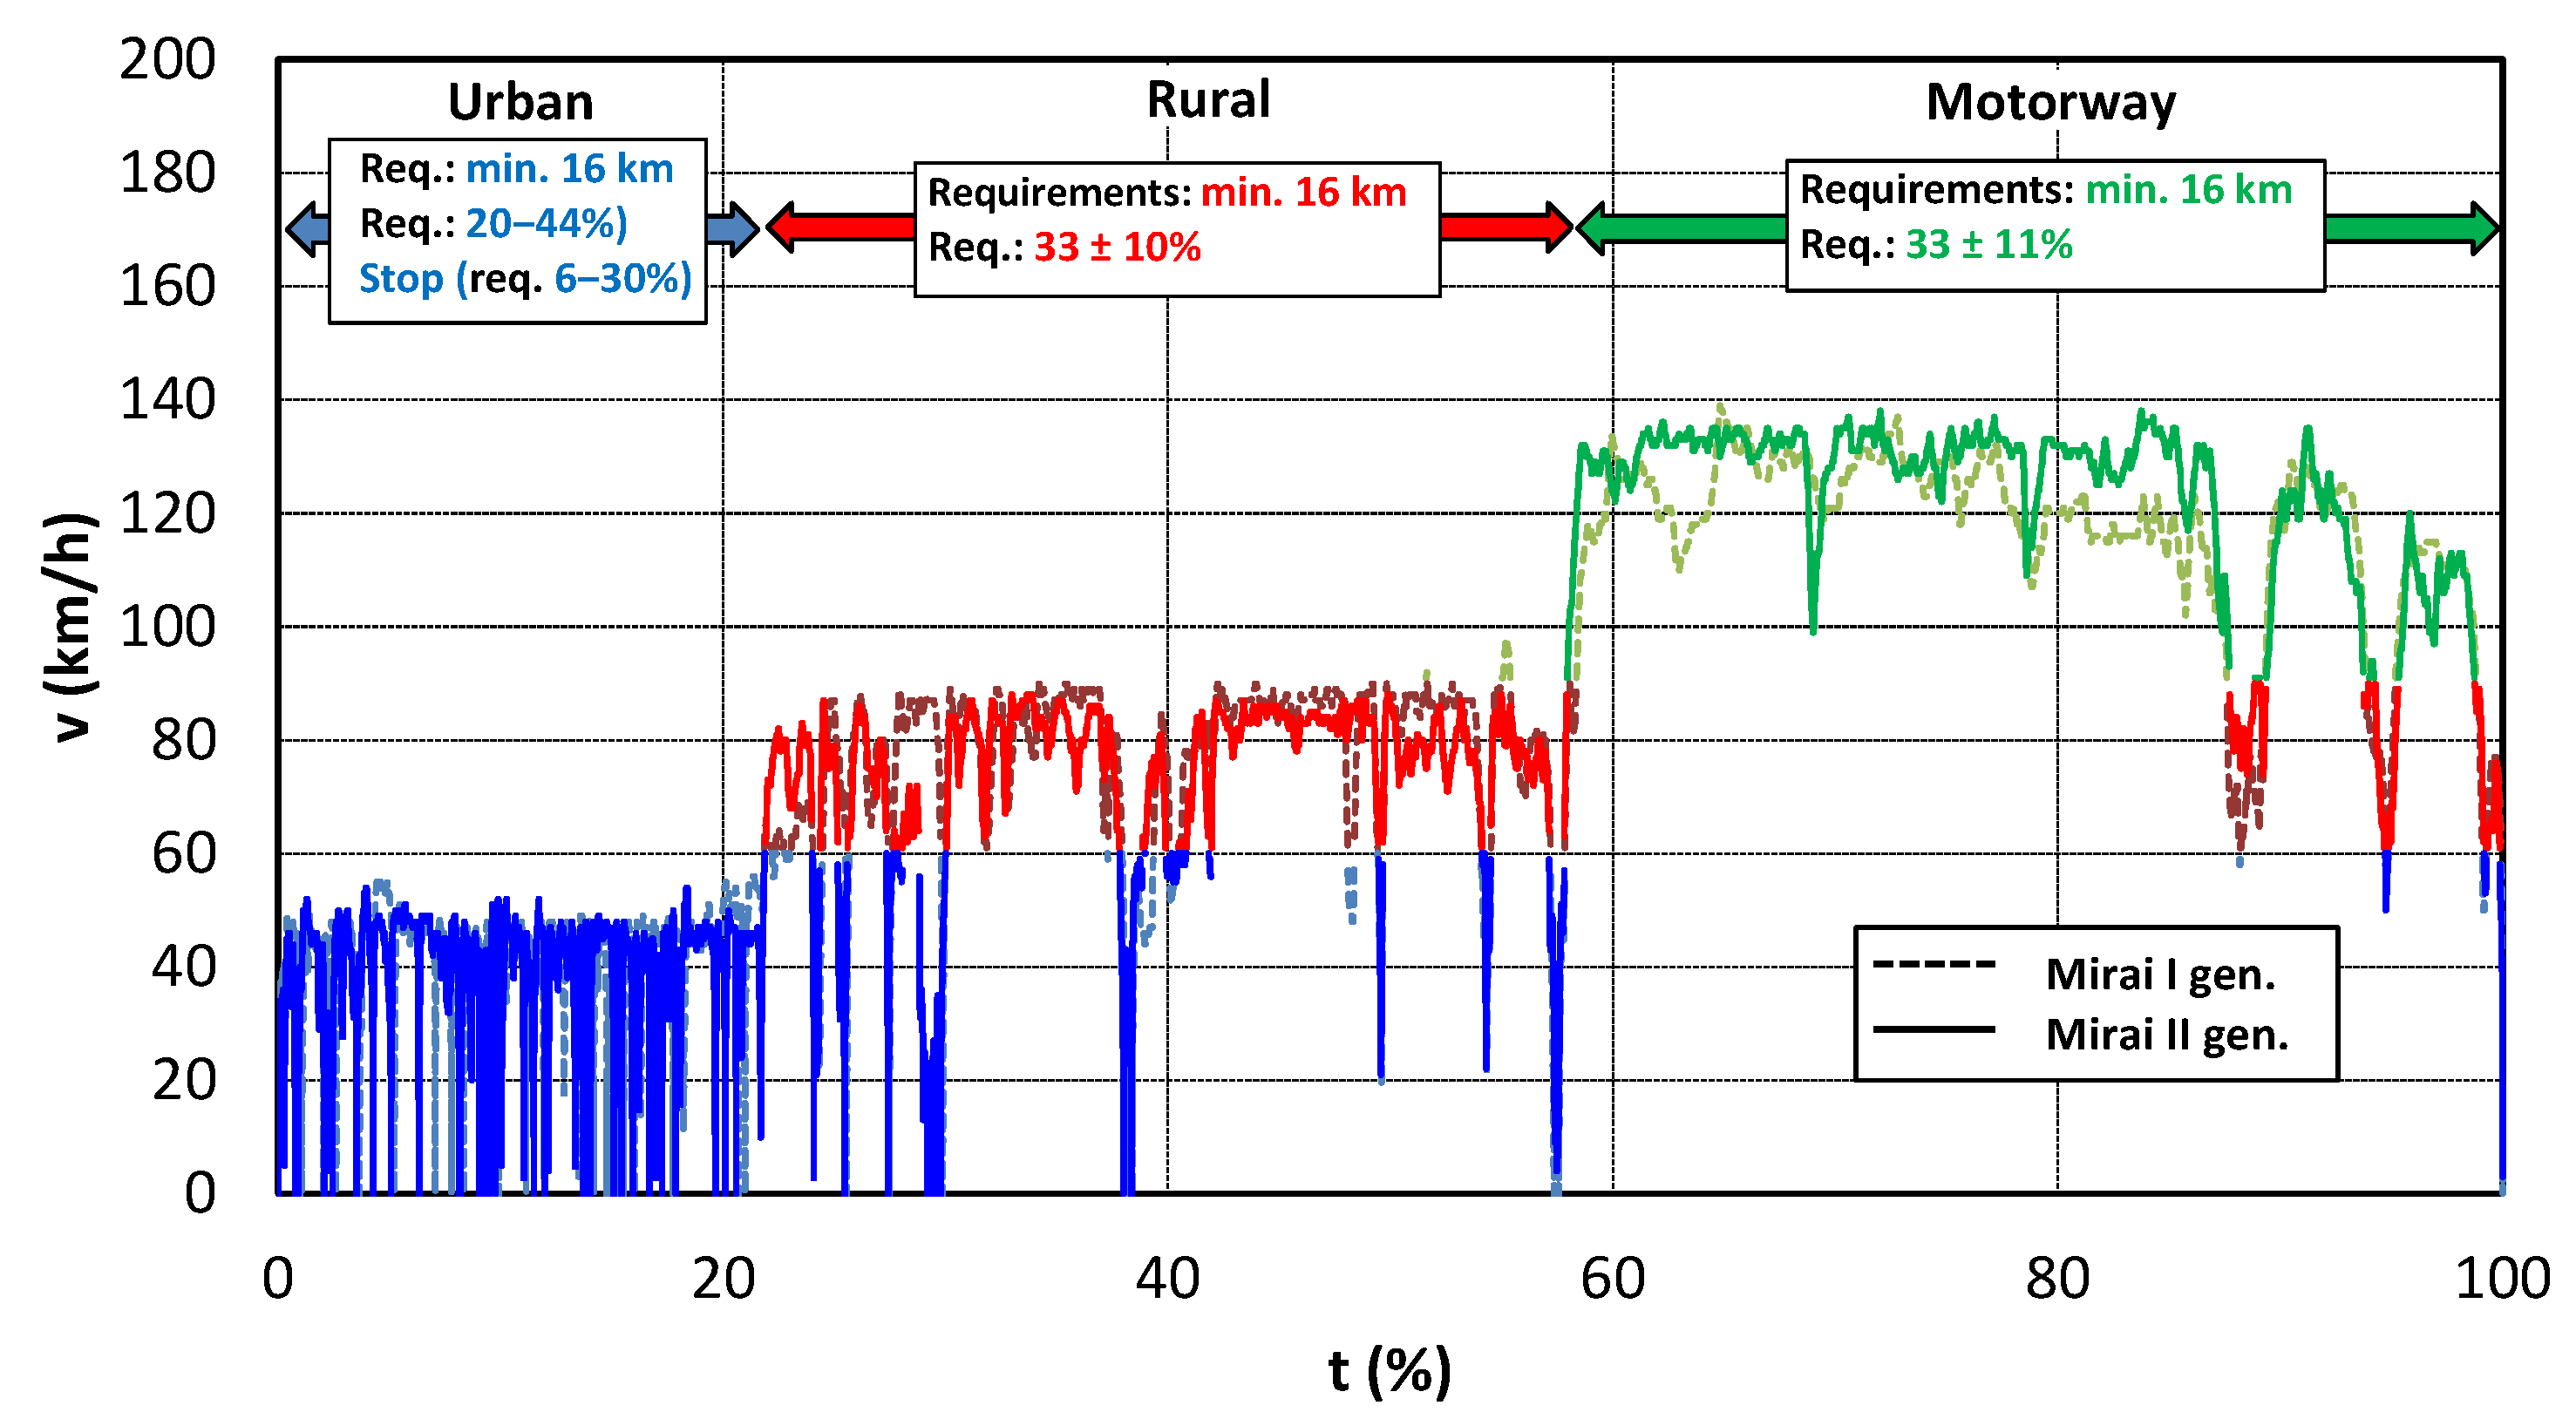
5.1. Driving Test Evaluation

Road tests were carried out on a test route selected by taking into account the urban, rural, and motorway conditions in the city of Warsaw and in the vicinity. The research route fulfilled the conditions set by the RDE (real driving emissions) research test requirements [27,28]. The tests were not used to analyze exhaust emissions and therefore should be referred to as RDC (real driving conditions) tests. The main test requirements and the speed profile of both drives were shown in Figure 11. Analysis of the data in Figure 11 showed much similarity between both the driving tests. Road tests reflect the real traffic conditions to a much greater extent. However, due to the lower repeatability of such tests, the scope of requirements includes a greater possibility of variation in parameters than is normally allowed during tests performed on a chassis dynamometer. The data in Figure 11 indicated the possibility of changing the ranges of the three test phases by up to 10%. In addition, the urban phase includes a very large range of requirements in terms of stopping the vehicle. This indicates the possibility of traffic in conditions of high traffic congestion.
The actual test conditions, as measured, were given in Table 2. The data showed much smaller differences than the permissible values that were presented in Figure 9. Small discrepancies between the two tests indicate that further analyses are more likely to produce useful results. This means that the travel conditions were similar, and thus the chosen route meets the requirements of the RDC test.
The differences in the test results listed in Table 2 were designated as relative values calculated with respect to the greater value. It should be noted that despite the large permitted variations in individual travel phases, the obtained overall differences were under 10%. The maximum differences can be found in the share of parking during the urban section amounting to 11.3% (the permissible variation may be 80%).

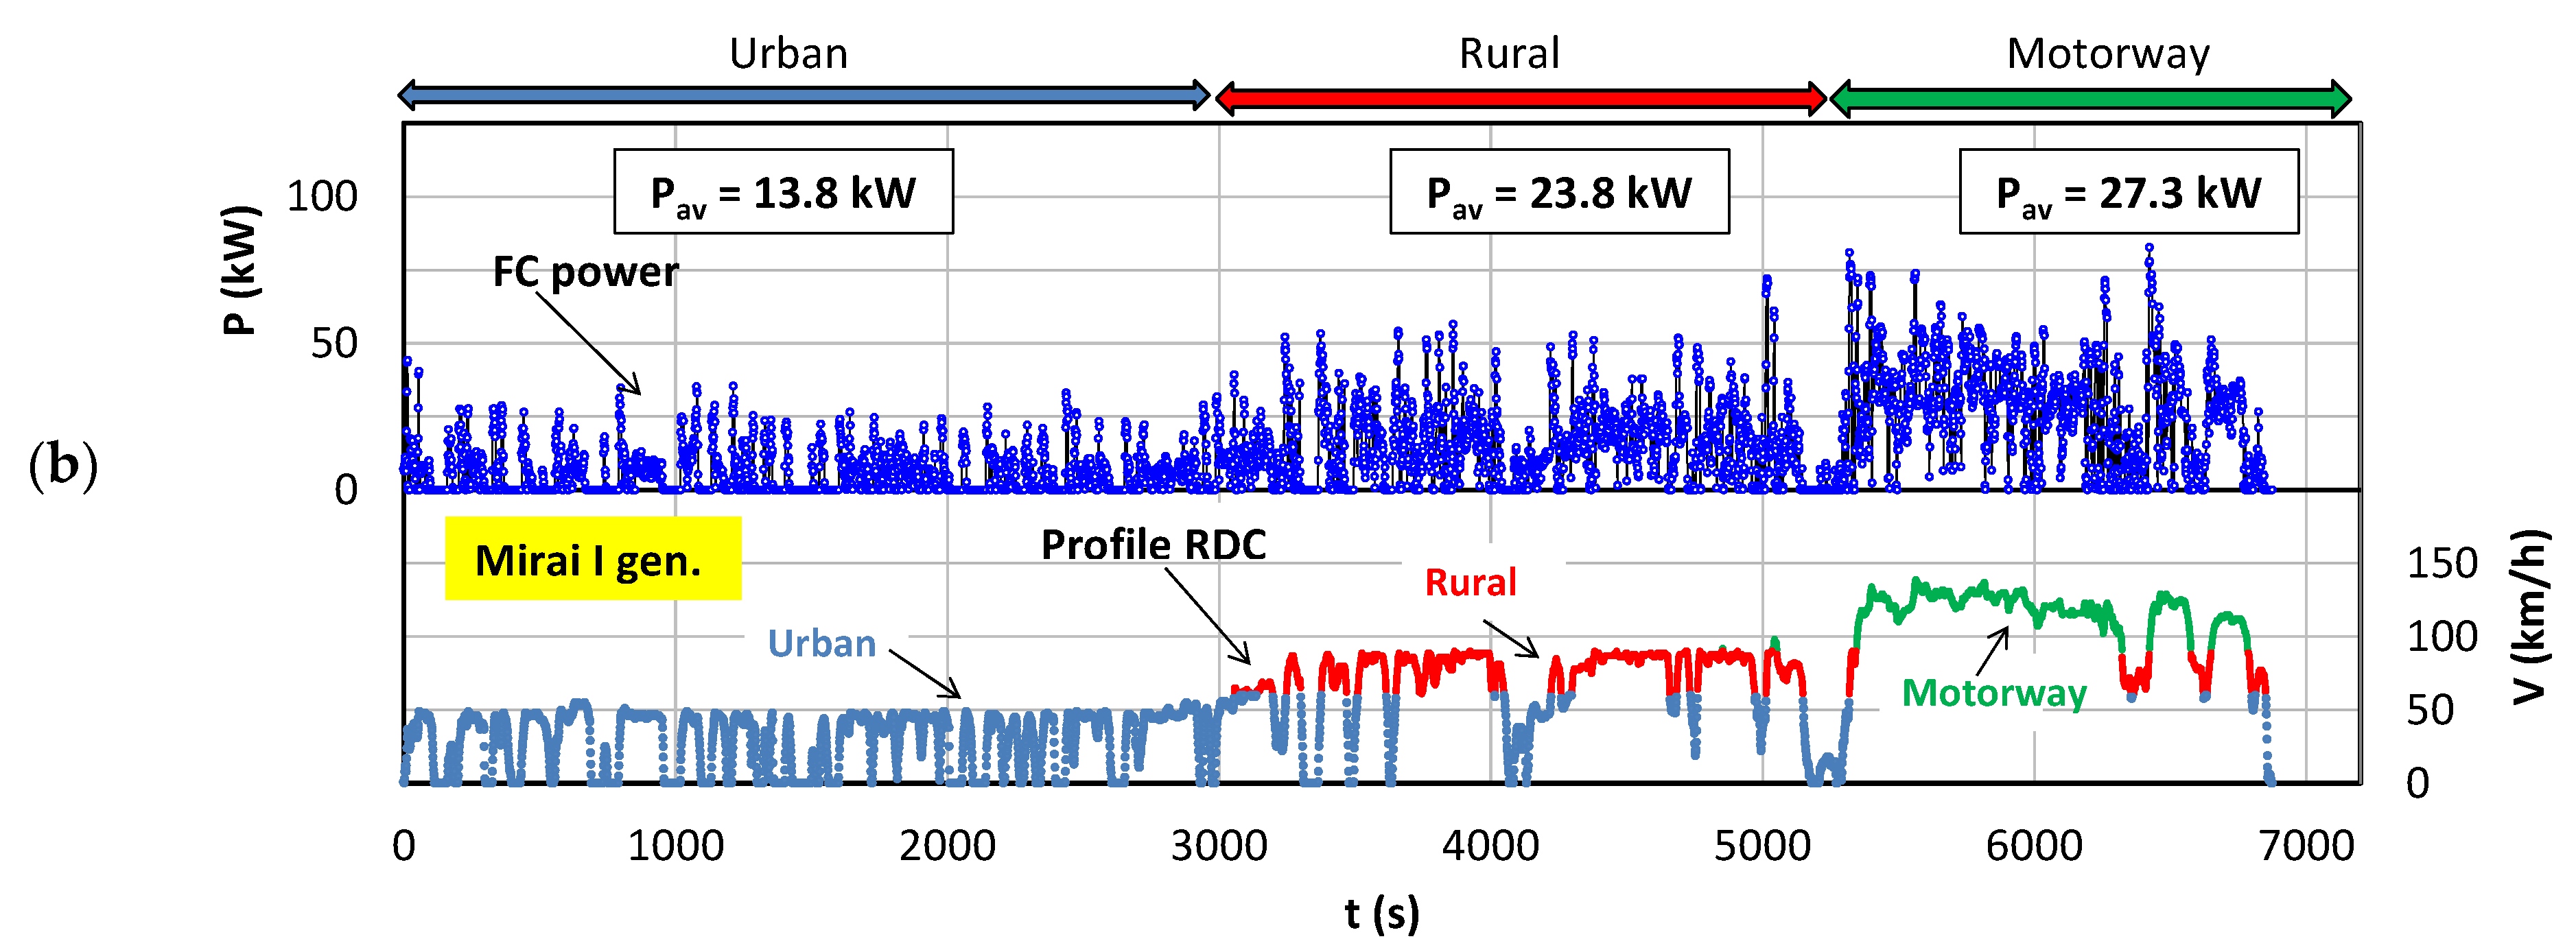
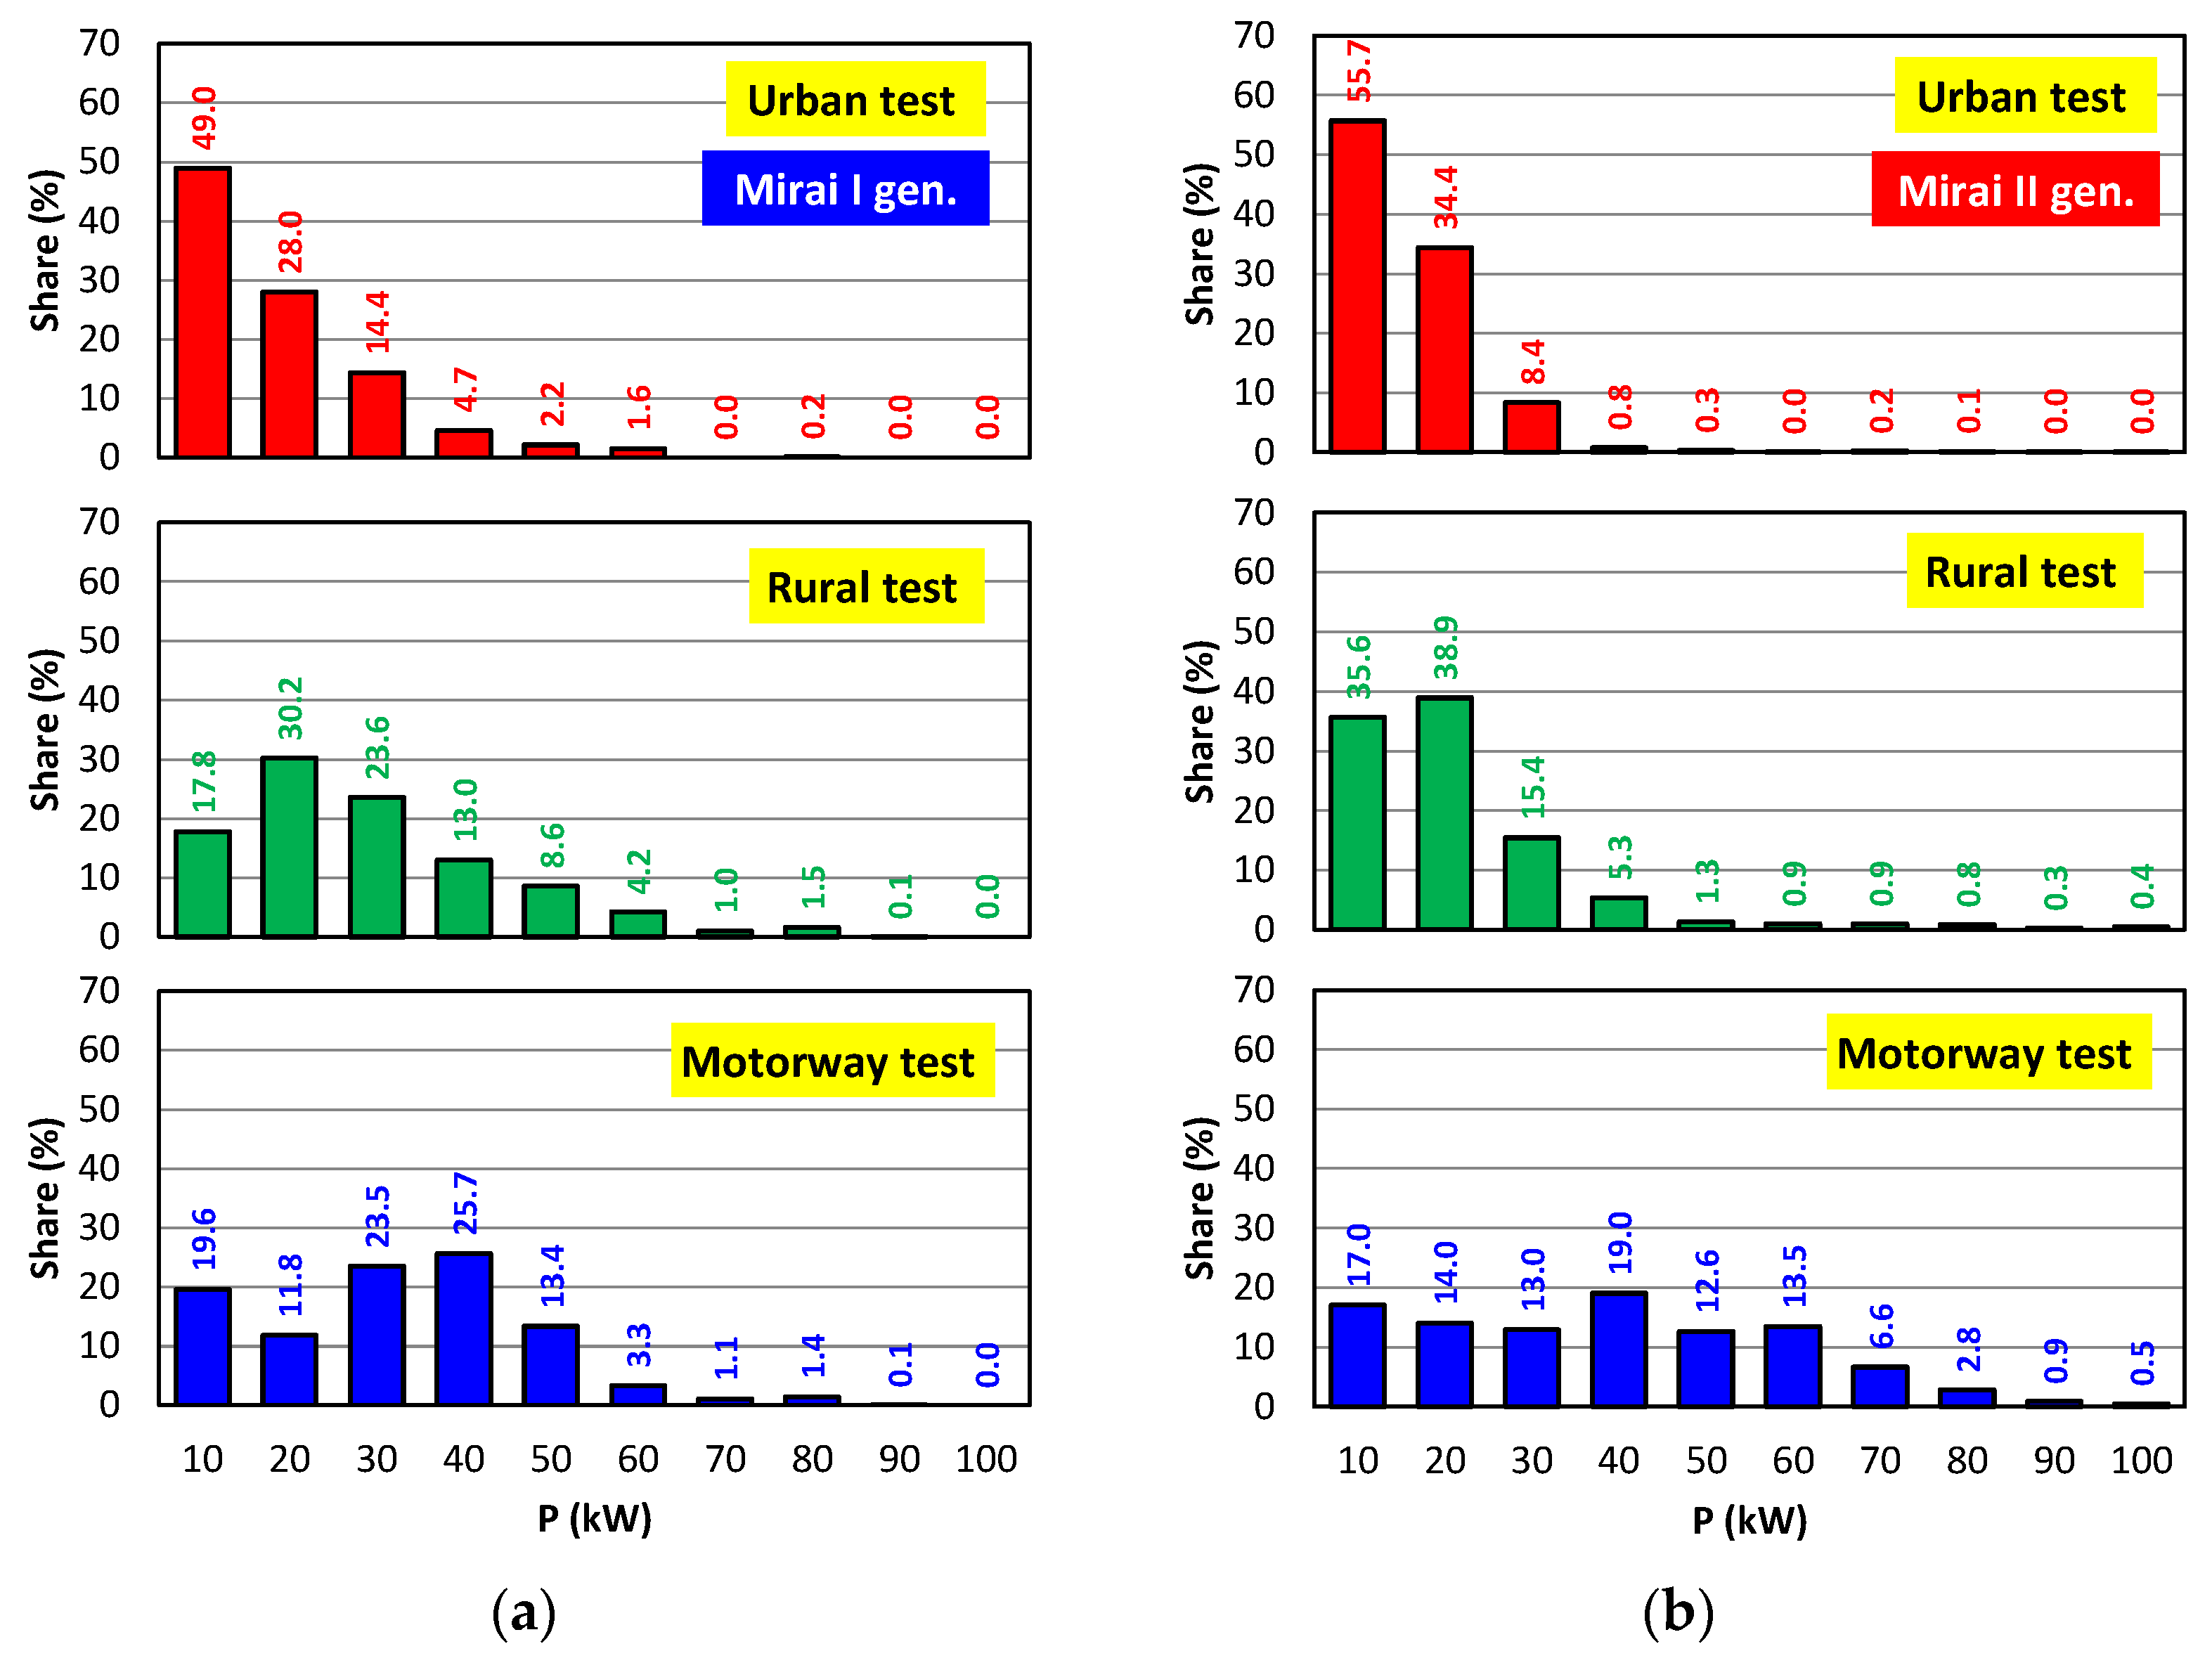
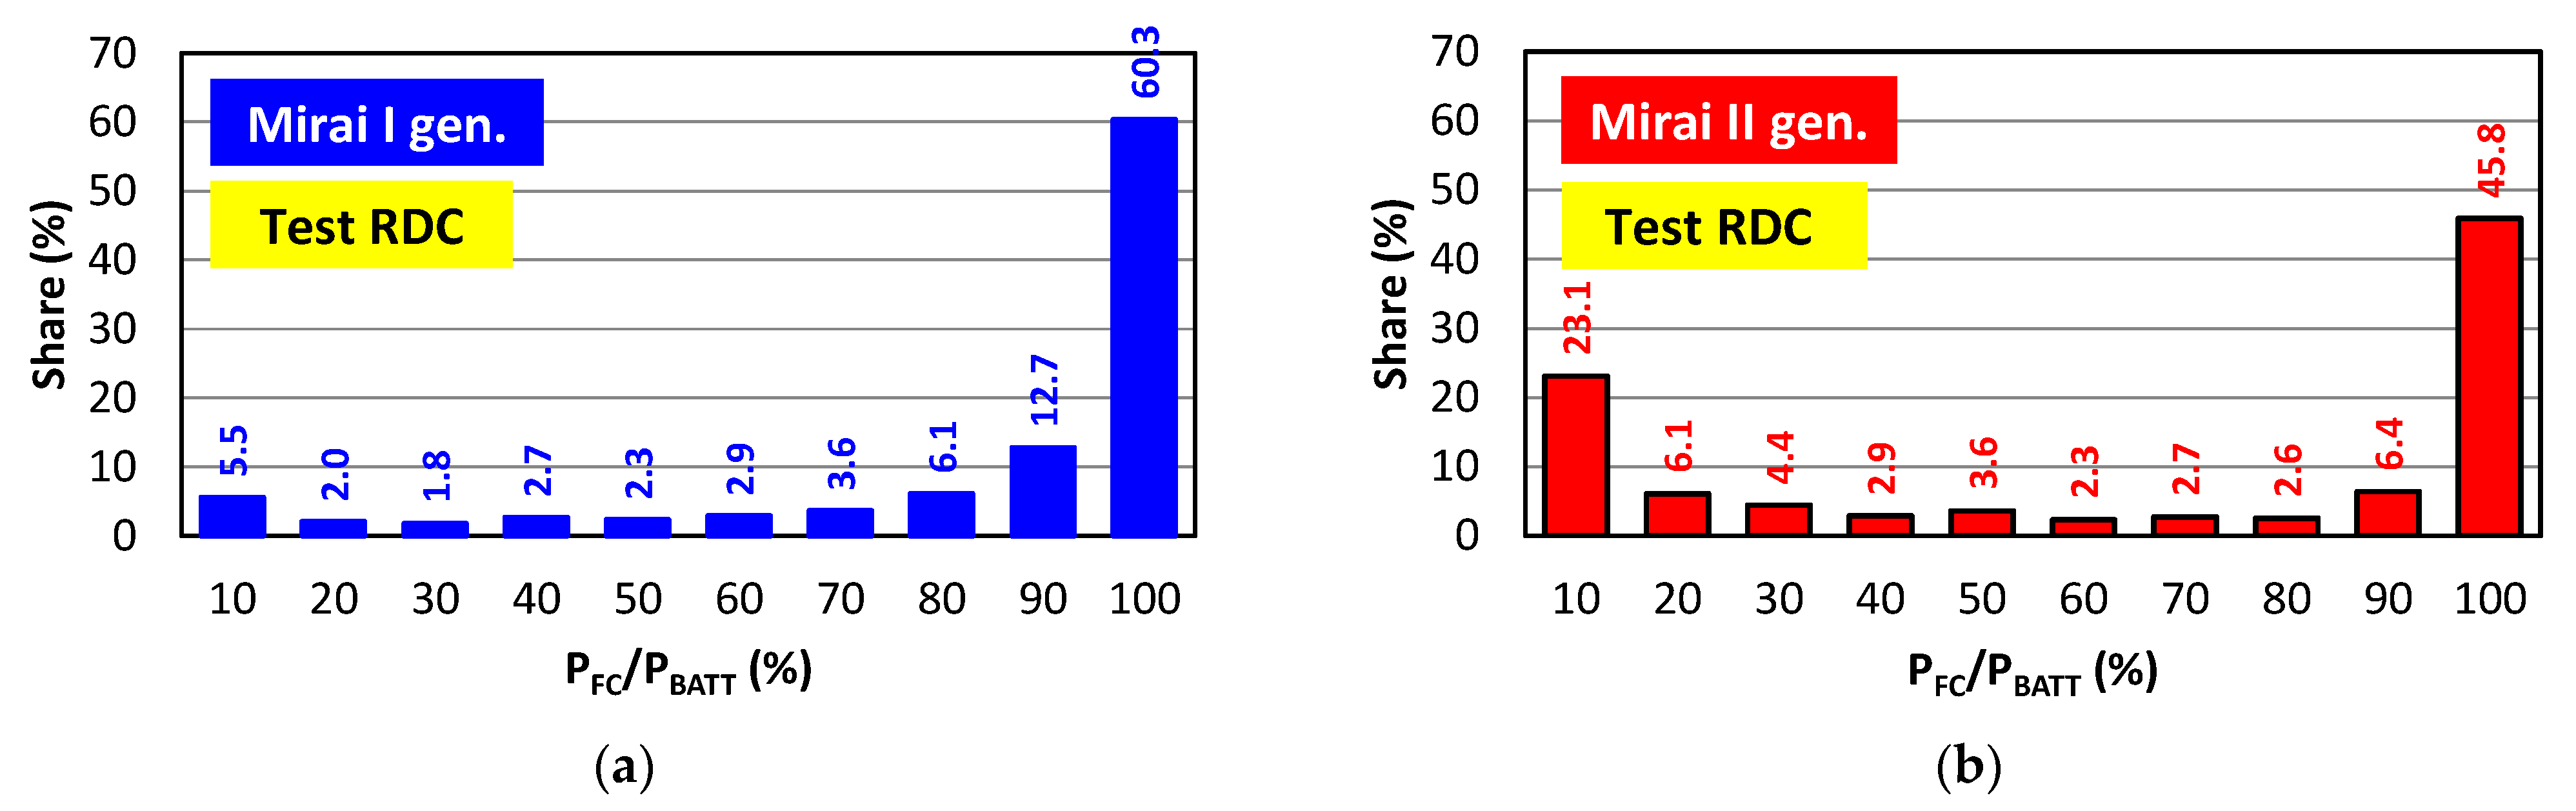
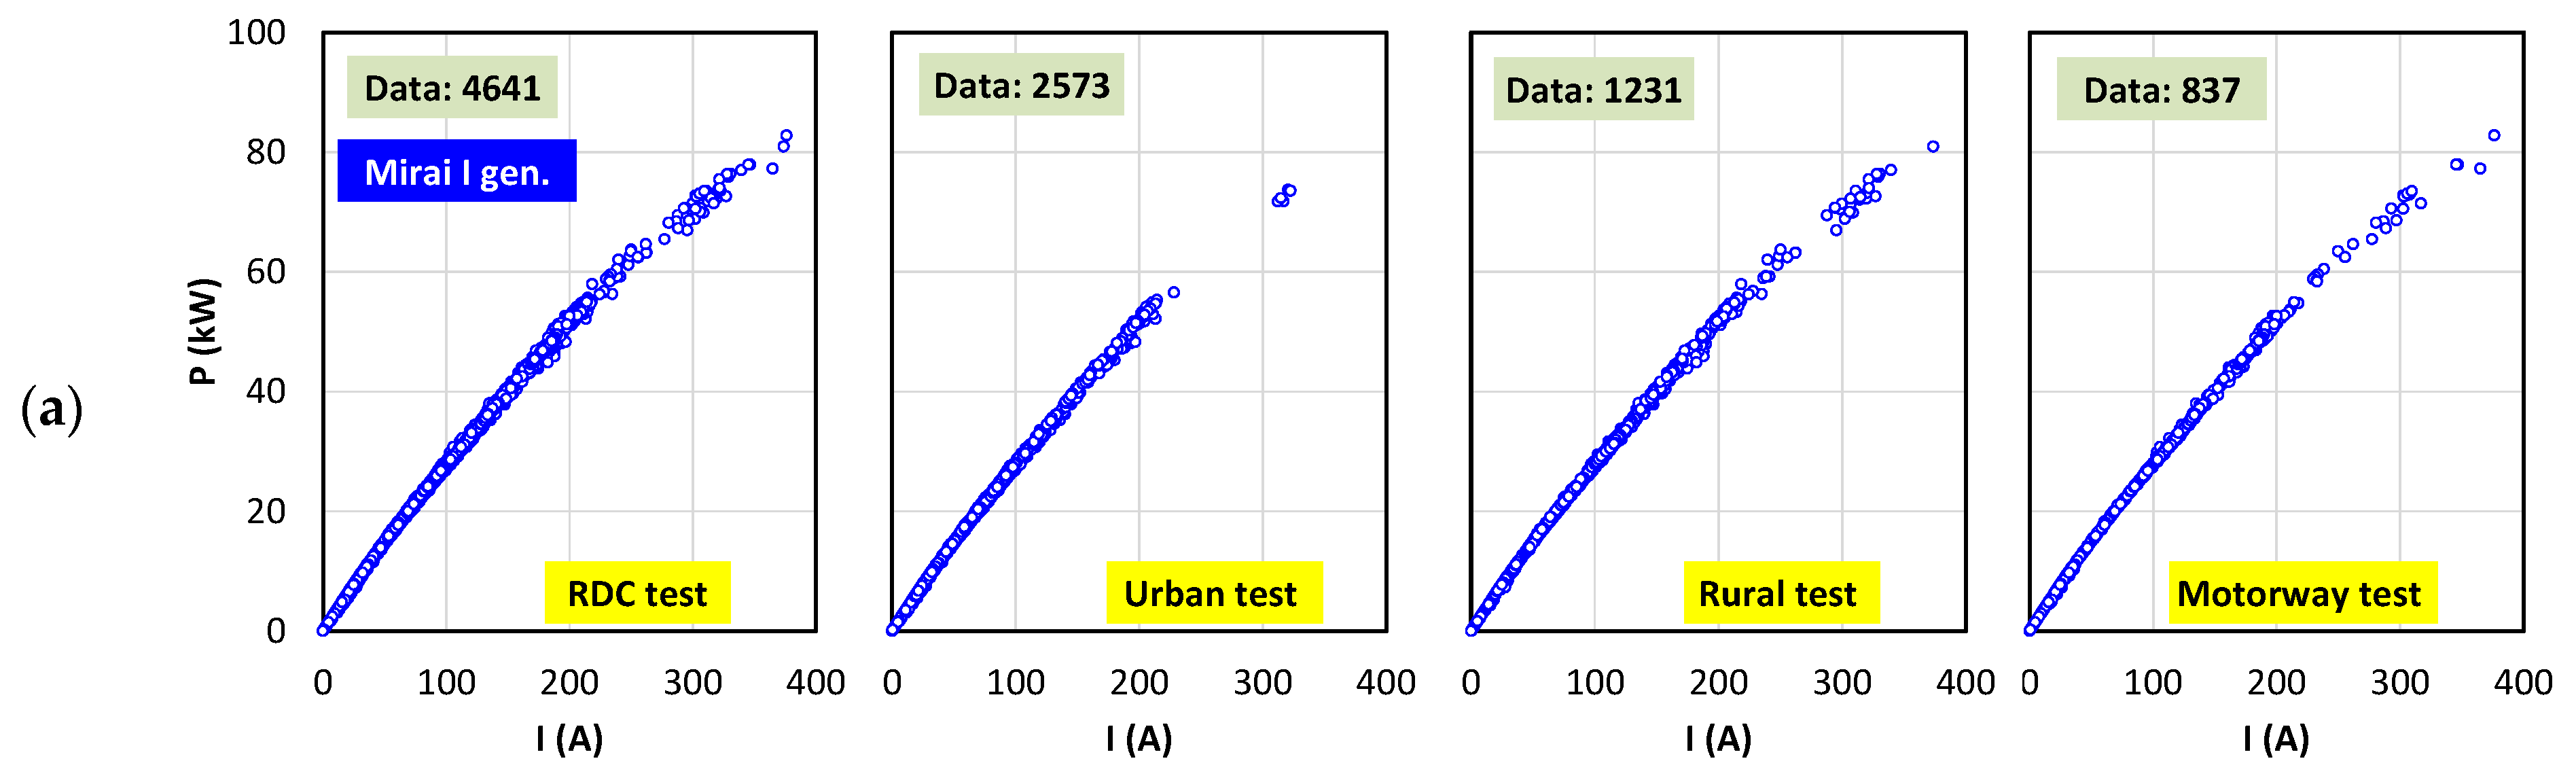
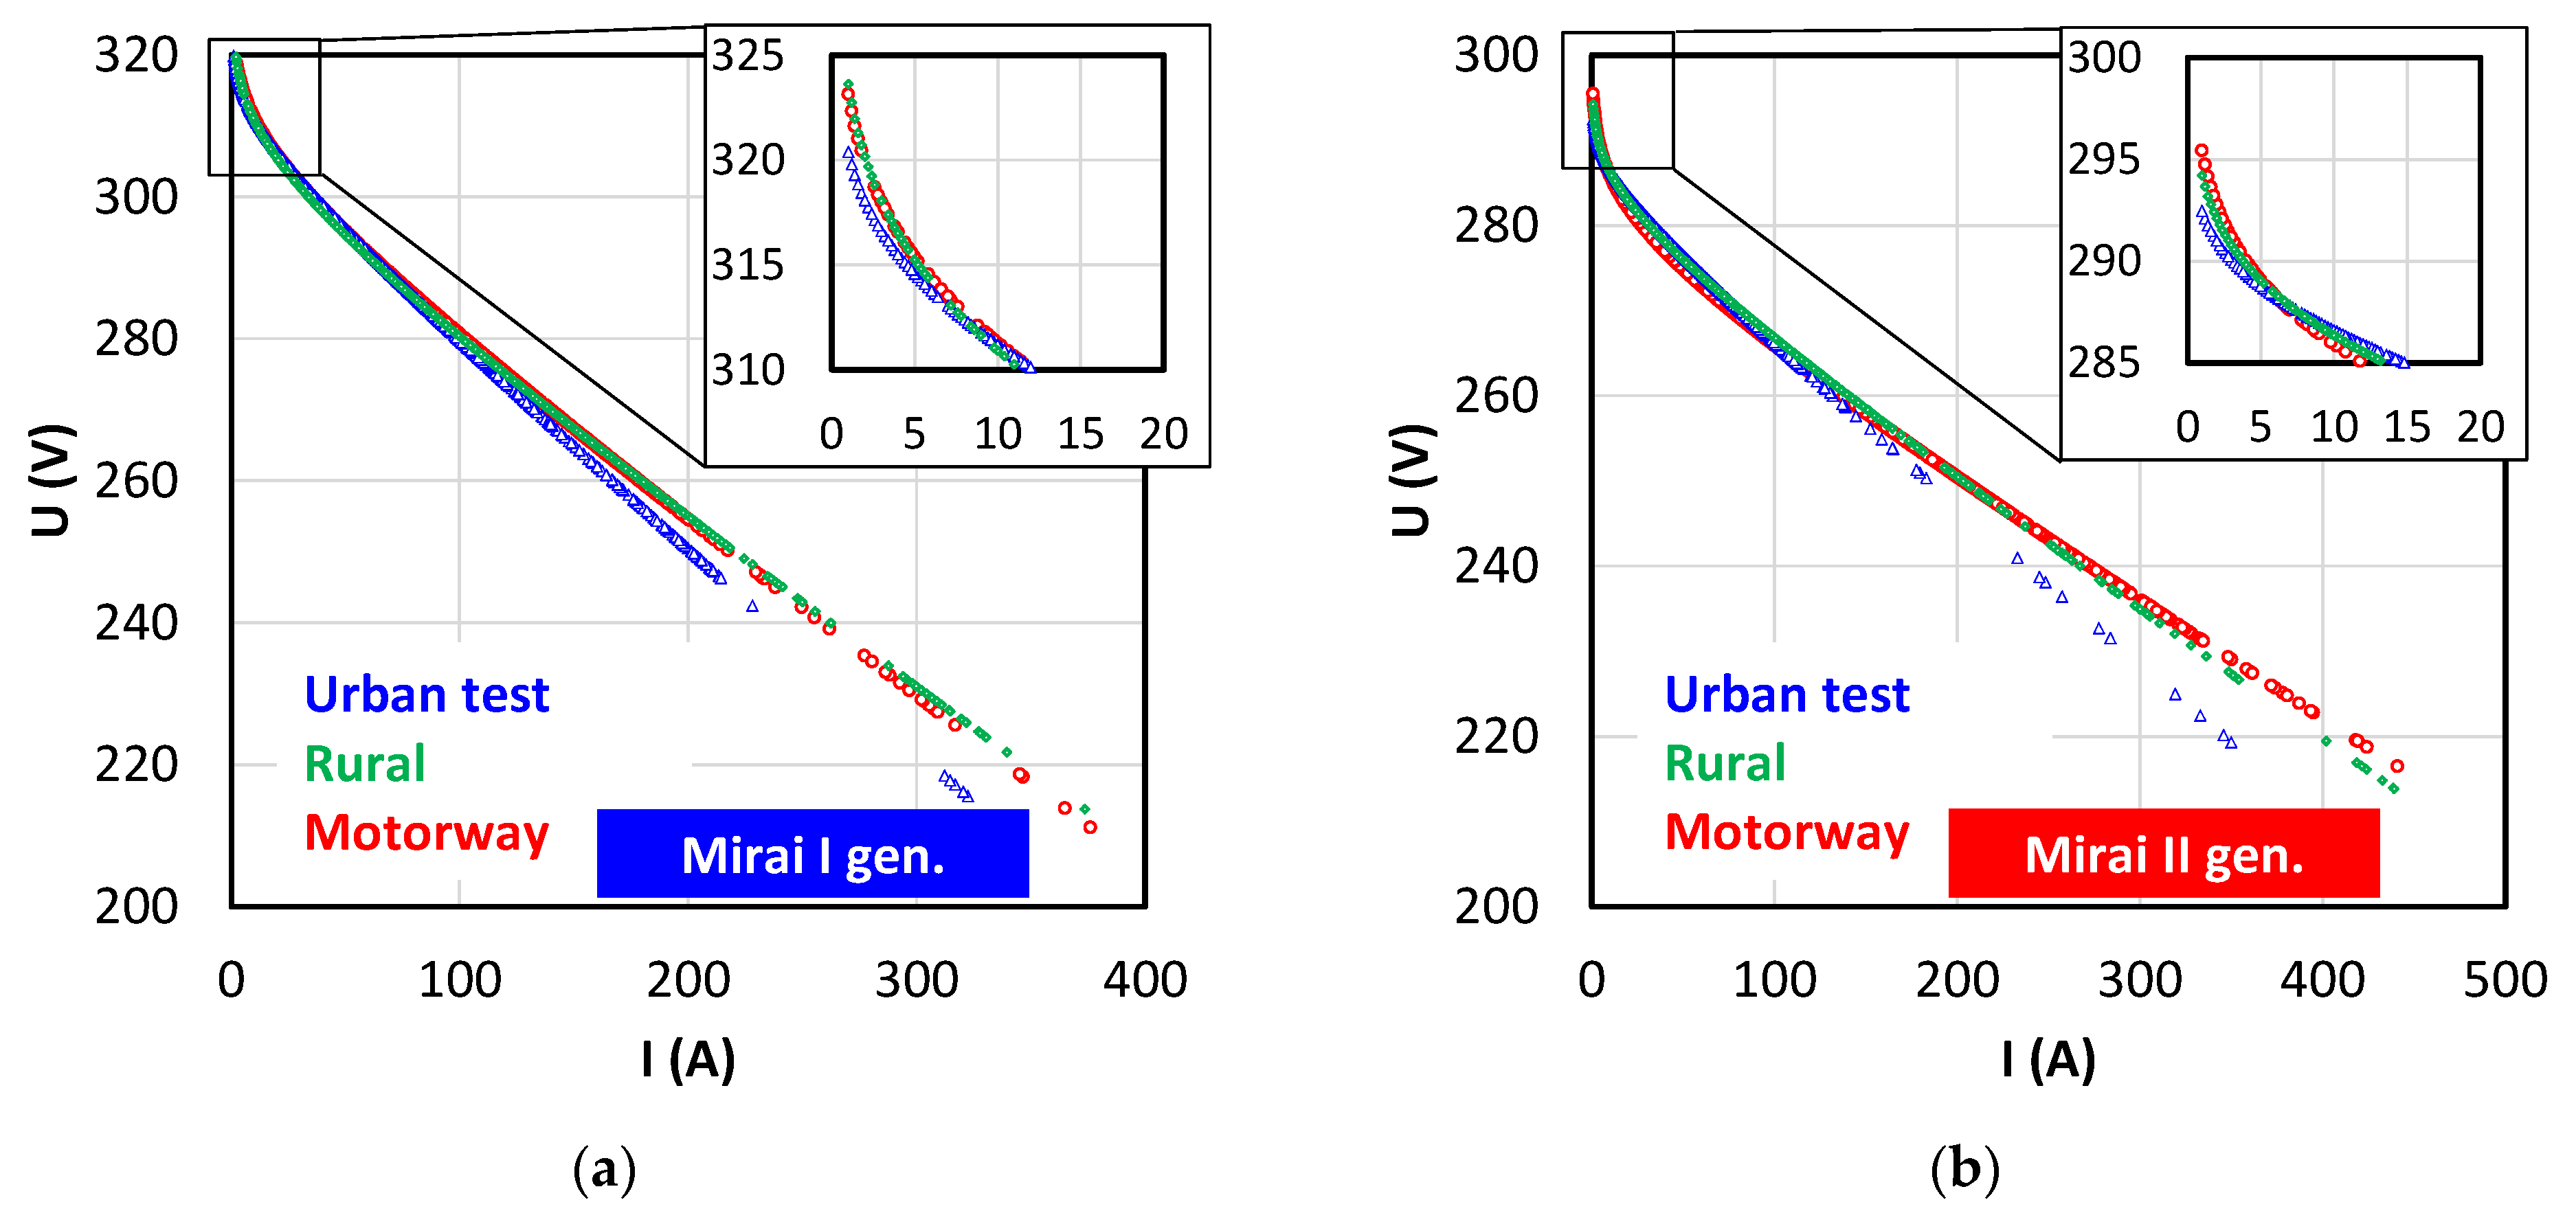
5.2. Fuel Cells Analysis

Based on the recorded fuel cell voltage and current intensity, the cell energy consumption was determined per 100 km of the route traveled in each of the driving phases (as well as in the entire test)—Figure 12. Despite the much greater weight of the new generation vehicle, the energy consumption in the entire test was found to be lower by 5.6% (1.11 kWh/100 km). The urban phase did not show any significant difference in energy consumption (2%—corresponding to 0.1 kWh/100 km). The greatest differences were observed in the rural driving phase. Here, the differences were around 17.3% in favor of the newer vehicle generation (a change of 1.03 kWh/100 km). The last phase—motorway driving, also does not bring any differences (max 1.0%).
The analysis of the constituent factors made it possible to determine the fuel cells power in particular phases of the road tests (Figure 12). Greater values of energy consumption by Toyota Mirai I generation resulted from greater values of cell power in the urban and rural phases of the drive test. The average power values in all test phases were presented in the speed and power profile of the fuel cells (Figure 13).
The average fuel cell power values in the first-generation Toyota Mirai were 26% greater than the average values of the second-generation Mirai. Similarly, greater powers occurred in the rural phase of the driving test (by 35%). The motorway phase was characterized by the greater average power of the second-generation Mirai vehicle. The greater cell power was partly responsible for the observed operating conditions, but also the batteries, also with a higher power in the second generation system.
Analysis of the share of the cell’s power in relation to the battery’s power was presented in Figure 14. The data analysis showed that, regardless of the fuel cell system generation, the share of their power in the entire test was the greatest at much greater power than the battery (PFC/PBATT > 90%). The second generation drive system also used a fairly large share of driving at the lowest system power, which means that the initial driving conditions could be achieved with battery drive alone. The transient conditions in which small shares of the cell’s power and high battery power were used turned out to be small. This was shown in Figure 14 in the 20–80% PFC/PBATT power ratio. Summarized, the operating conditions of cells and batteries in both drive generations were within 66–69% of the total share of operating time. PFC/PBATT shares close to 100% do not mean the maximum power of the fuel cell. They indicate the cell’s power is in the range of 90–100% greater than the battery power. This representation of the FC/BATT power ratio indicated that the system usually operates with the fuel cell providing significantly more power than that of the battery. Such a situation and vice versa were implemented in the second generation system. Cases could also be observed where the conditions were NBATT >> NFC. These are conditions labeled as NFC/NBATT < 10% (Figure 14b).
The analysis of the absolute power values of the fuel cell was presented in Figure 15. The fuel cell power shares were determined for each of the test phases. Although the maximum power was 114 and 128 kW, respectively, such values were not achieved in the tests, due to driving speeds required in the RDC test. The share of speeds above 145 km/h must be less than 3% of the motorway driving time (due to speed limits, the driving speed in the tests did not exceed 140 km/h).
In urban driving conditions, the maximum power values were up to 30 kW, with greater values occurring sporadically. This was due to the driving speeds during the test drive. Despite the vehicle being heavier, the share of fuel cell power in the range of up to 10 kW was greater for the second-generation vehicle than for the first-generation vehicle. This share was over 50% of the share of the remaining power values in the drive test.
In rural driving conditions, the power share of up to 20 kW is most significant for both vehicle drive generations. In such driving conditions, the power values in the second-generation vehicle were much lower, which was confirmed by the values presented in Figure 13. Additionally, the energy values determined in Figure 12 were confirmed. It was found there that the energy consumed in the rural phase of the test by the first-generation system was greater by over 17%. The fuel cell power share in the highway phase was not as significant as in the other sections. The largest share of work was in the power range of 50–60 kW. In both drive generations, the shares of power above 80 kW were not used very often. This means that the drive system had a fairly large reserve of fuel cell power.
To summarize, it can be stated that the fuel cell works most frequently in the driving test phases:
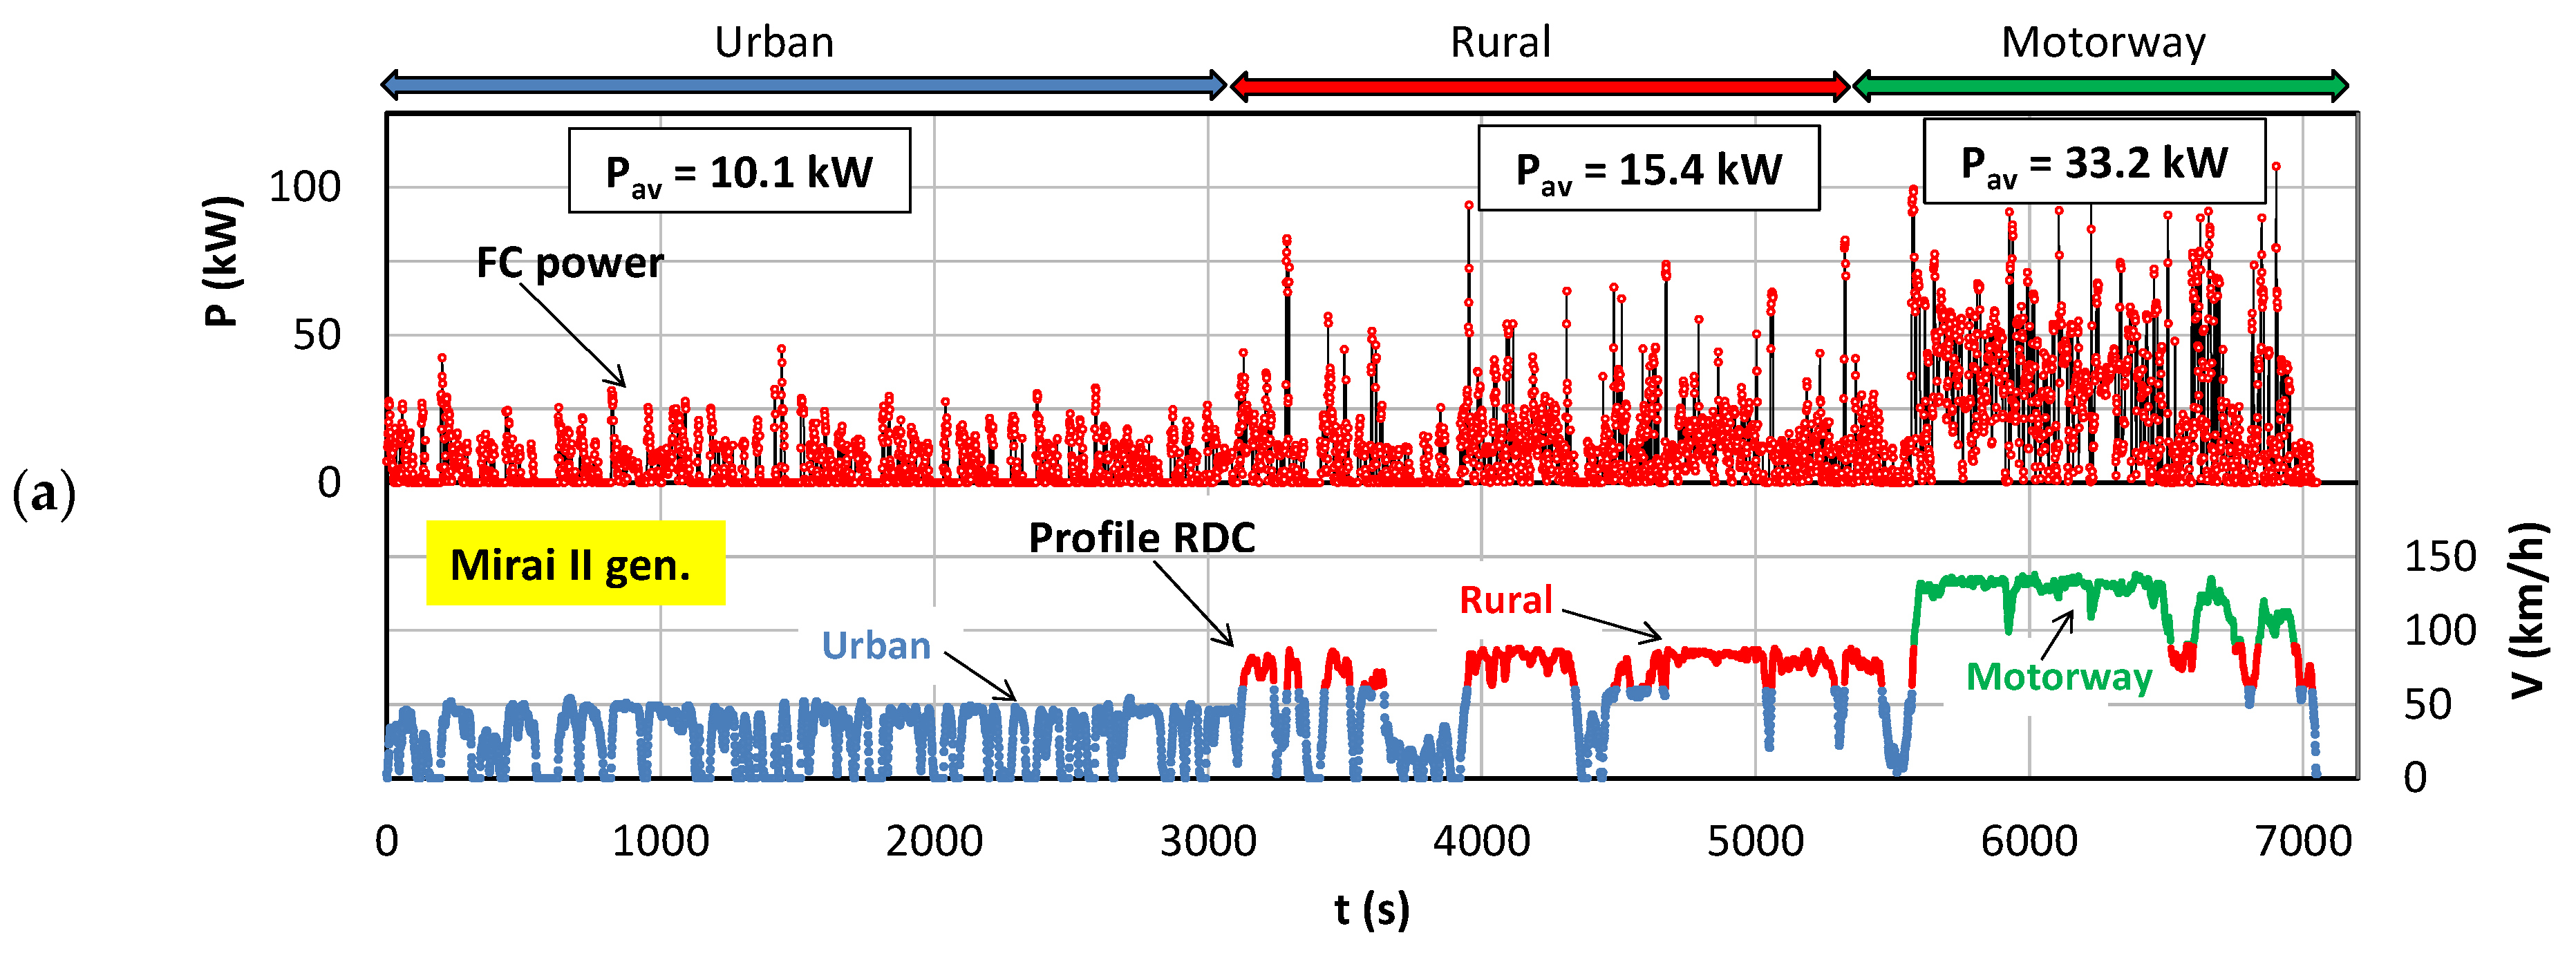
  • In the urban section: with power of up to 10 kW;
  • In the rural section: with power of up to 20 kW;
  • In the motorway section: with power of up to 30–40 kW.
As the maximum driving speed increased in the various test phases, the most frequently used power of fuel cells also increased. With each subsequent test phase (urban, rural, motorway), the most frequently used power from 10 kW in the urban phase increased by another 10 kW in each subsequent phase. The presented operating conditions of fuel cells indicate that their full power was not used, but only power of up to 70 kW was used (and that in the motorway phase only).

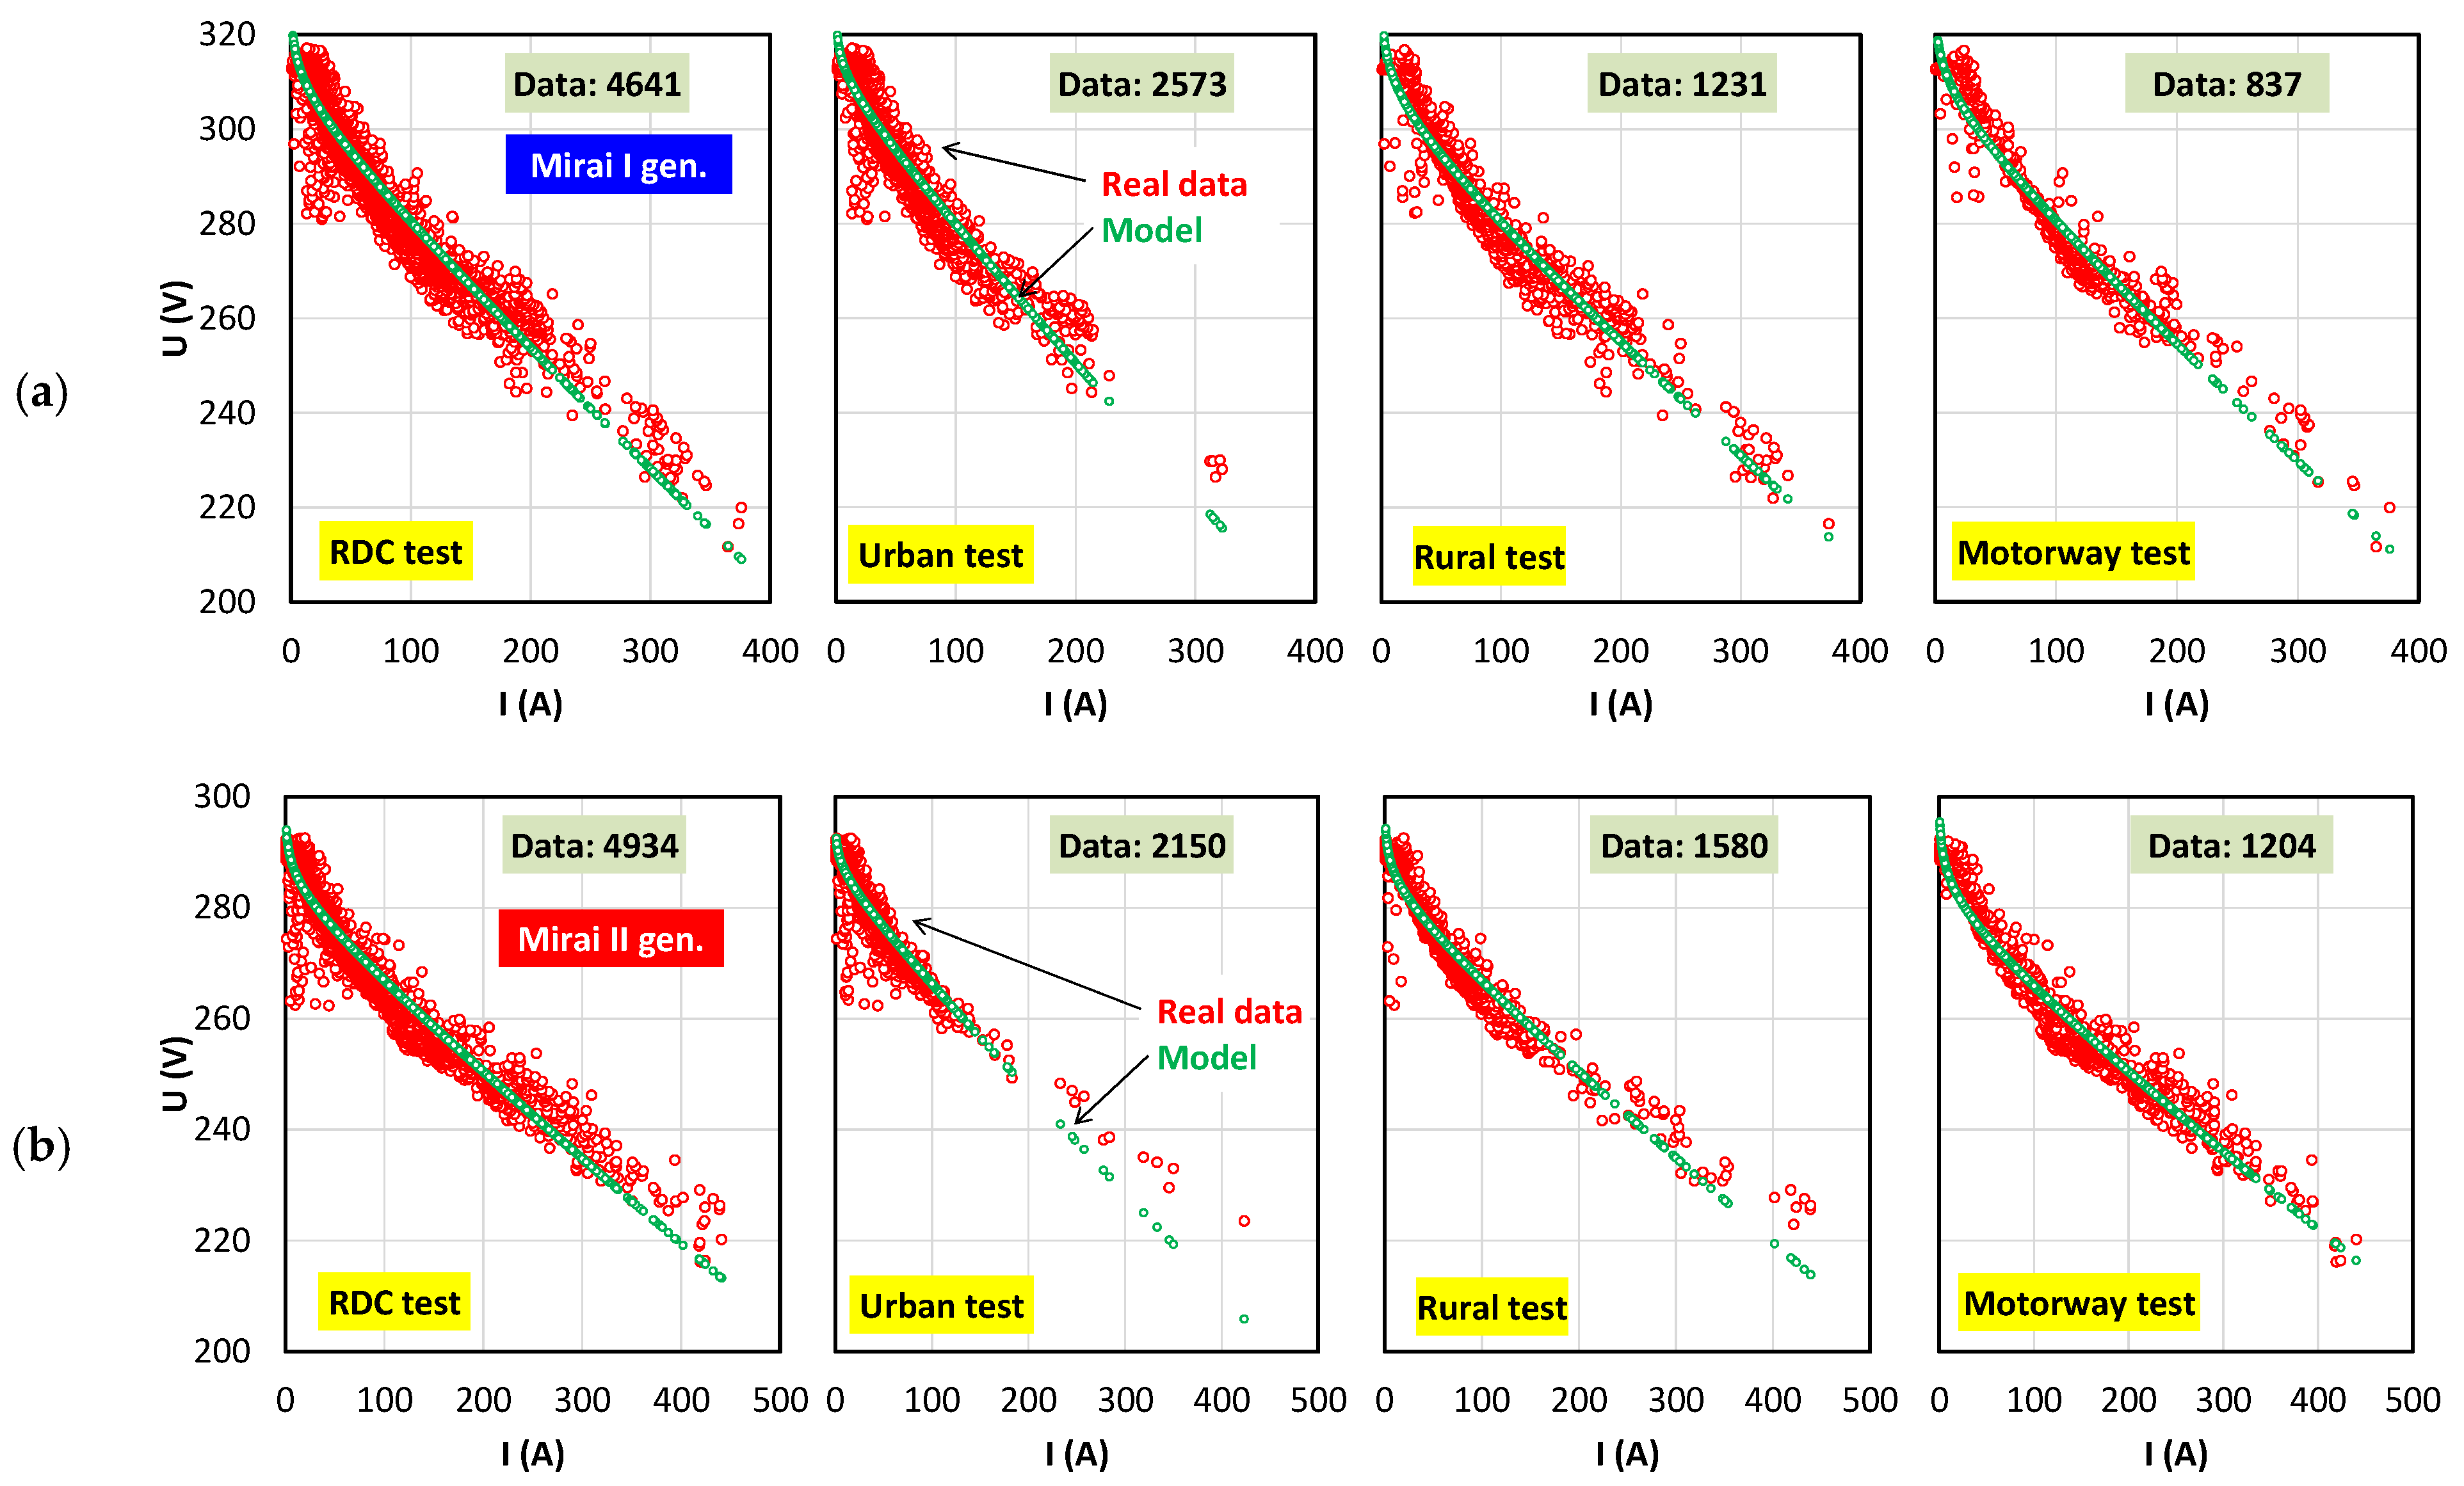
5.3. Modeling and Analysis of a Fuel Cell Stack Losses

Modeling of the fuel cell stack was started by modifying Equation (6) for a single fuel cell, taking into account the number of plates of the stack (nst) and the surface of the current flow (ast):
U st = n st · U FC
and
I = i a st .
Figure 16 shows the characteristics of fuel cells (cell stack current–cell stack power). Such characteristics were presented throughout the test and broken down into its individual phases. The presented characteristics already contain structured data, i.e., random data (significantly different from the typical characteristics) have been removed from the characteristics. Such conditions arise when reading data from a diagnostic tester as a result of high data sampling frequencies.
Figure 16 shows that the amount of data for both vehicle drive generations was similar (more than 4500 data points). As can be seen from the characteristics relating to individual phases, the share of higher values of the fuel cell stack power increased with the increase in the driving speed. The current values were about 20% greater for the second-generation vehicle than for the first-generation one. It is important that in both generations of cells there was no inflection of the characteristic (function local maximum), which would indicate the maximum power.
Modeling of fuel cells in order to determine their losses began with the presentation of their voltage–current characteristics. These characteristics were shown in Figure 17. Increased values of the current intensity in the second-generation system could be observed along with the decreased voltage values (by about 10%). These characteristics are presented for each of the test phases and for the entire drive test.
The initial conditions were adopted for the modeling of the cells with values as listed in Table 3. The initial conditions were adopted based on the literature [24,25] and technical data [8,10,15]. Based on them, further mathematical analyses were performed. The differences in the starting values were in the number of fuel cells. For the first-generation drive this value was a stack of 370 fuel cells, for the second-generation it was a stack of 330 fuel cells.
The modeling of fuel cells was based on the search for the minimum value of the objective function:
( V st _ x ) 2 min
where x were the consecutive values of current in the fuel cell stack.
The objective function is Equation (6) supplemented with changes presented in Equations (7) and (8). The result is the modeled voltage value of the fuel cell stack. Using the Solver add-in in the MS Excel package, the quantities meeting criterion (9), for which the initial values were presented in Table 3, were determined.
The non-linear generalized reduced gradient method was used for mathematical modeling [29,30,31]. This method allows solving the non-linear Equation (6) supplemented with Equations (7) and (8). It determines the central derivatives of the function, which leads to a solution to a certain range of variability of the initial conditions (not only in the positive direction). Taking central derivatives into account makes it possible to obtain the global minimum value of the function. Due to the iterative nature of this algorithm, the obtained data are approximate, not exact. The measure of the quality of the obtained results was the minimum sum of the squares of calculated and obtained values. It was assumed that all variables (Table 4) should be positive and non-zero (all fuel cell losses were taken into account).
The sums of squares for both generations of hydrogen drives in each test phase were determined using Equation (9)—Table 5. Additionally, the mean value of the square of the difference in size was also determined on this basis ( U o U ) 2 ¯ .
The data presented in Table 5 show that the results of measurements of a newer generation fuel cell drive system had a lower sum of square values. This means that a more accurate solution was found. The sum of squares as well as the mean value being lower in subsequent phases of the drive test results from the smaller number of measurement data in these phases.
The assessment of fuel cell losses was carried out using the analyses presented in Figure 18 and the data contained in Section 3.
The open circuit voltage changes in a similar way. For both drive system generations the lowest Eoc values were obtained in urban driving conditions (Figure 18). For rural conditions, the maximum Eoc values were obtained for the Mirai I gen. vehicle. For motorway conditions, the highest Eoc value was obtained for the newer generation drive—Mirai II gen. The data contained in Table 4 confirm these values. Additionally, Eoc in the case of the second-generation drive was about 0.5 V greater. In accordance with the previous provisions (Section 3), this voltage does not affect the values of the fuel cells losses.
The data in Table 4 indicated greater activation voltage losses in the first-generation drive. It was influenced by the A values, which were higher for the first-generation of fuel cells. For both generations, they are the smallest in urban driving conditions, and the largest in motorway driving conditions.
The resistive voltage losses were determined using the test results and data from Figure 7. This voltage turns out to be the lowest during the urban driving phase in both drive generations. In the case of higher driving speeds and the greater power of fuel cells, these losses were similar, due to the similar shape of the voltage–current curve. Increasing the resistive losses leads to a limitation of the cell voltage. These losses, according to Equation (4), increase with increasing system resistance. As shown in Table 4, these losses were significantly greater for the first-generation system.
The analysis of mass transport losses is difficult due to the discrepancy in resistive losses and the inability to analyze the characteristics at high cell powers. As only in those conditions could these losses be determined. The m and n coefficients for the second-generation cell were convergent with the first-generation cell only in urban driving conditions (Table 5). With greater power values, they also assume much greater values, which may indicate a reduction in mass transport (and at the same time an increase in these losses). The trends in fuel cell losses for each of the driving phases, taking both generations of fuel cells into account, were presented in Table 6.
It is planned to use the presented methodology for measuring fuel cell starts in aging conditions. Annual tests (or under specific climatic conditions) can be the basis for determining the weaknesses of fuel cells. At the same time, they can contribute to their development with regard to increasing their efficiency and reliability.

6. Conclusions

Based on the analytical work and road tests of two generations of drives with fuel cells, the following conclusions were formulated:
  • The fuel cell in the driving test phases works most often:
    • In the urban section: with a power of up to 10 kW;
    • In the rural section: with a power of up to 20 kW;
    • In the motorway section: with a power of up to 30–40 kW.
  • The share of fuel cells’ power use increased as the maximum driving speed increased in the various phases of the driving test. In the urban phase, this power was on average 10 kW. Each subsequent phase of the test (rural and motorway) increased the power demand by an average of 10 kW in each phase. The presented operating conditions of fuel cells indicated that their full power was not utilized, and the maximum power used reached up to 70 kW (in the motorway phase). This was about 70% of the maximum power.
  • The presented research methodology shows the possibilities of estimating the fuel cells’ voltage losses. It is possible to determine each component of these losses, but the mass transport losses require the fuel cells to be under maximum load to be measured properly (which is difficult to achieve in the RDC drive test due to its limitations).
  • The analysis of fuel cell losses showed the maximum values of activation voltage losses when cells were placed under high load (for both generations). The voltage of resistive losses reached its maximum in urban driving conditions, when the fuel cells were under a small load.

Funding

This research received no external funding.

Institutional Review Board Statement

Not applicable.

Informed Consent Statement

Not applicable.

Data Availability Statement

The data presented in this study are available on request from the corresponding author.

Acknowledgments

The author wish to thank Andrzej Szałek and Toyota Central Europe sp. z o.o. from Warsaw for providing the vehicles for the road tests.

Conflicts of Interest

The author declare no conflict of interest.

References

  1. Proposal for a Directive of the European Parliament and of the Council Amending Directive (EU) 2018/2001 of the European Parliament and of the Council, Regulation (EU) 2018/1999 of the European Parliament and of the Council and Directive 98/70/EC of the European Parliament and of the Council as Regards the Promotion of Energy from Renewable Sources, and Repealing Council Directive (EU) 2015/652. Available online: https://eur-lex.europa.eu/legal-content/EN/TXT/?uri=CELEX:52021PC0557 (accessed on 8 May 2022).
  2. Regulation (EU) 2019/631 of the European Parliament and of the Council of 17 April 2019 Setting CO2 Emission Performance Standards for New Passenger Cars and for New Light Commercial Vehicles, and Repealing Regulations (EC) No 443/2009 and (EU) No 510/2011. Available online: http://data.europa.eu/eli/reg/2019/631/oj (accessed on 4 May 2022).
  3. Zhang, W.; Wang, J.; Du, S.; Ma, H.; Zhao, W.; Li, H. Energy management strategies for hybrid construction machinery: Evolution, classification, comparison and future trends. Energies 2019, 12, 2024. [Google Scholar] [CrossRef]
  4. Das, H.S.; Tan, C.W.; Yatim, A.H.M. Fuel cell hybrid electric vehicles: A review on power conditioning units and topologies. Renew. Sustain. Energy Rev. 2017, 76, 268–291. [Google Scholar] [CrossRef]
  5. Zhou, S.; Fan, L.; Zhang, G.; Gao, J.; Lu, Y.; Zhao, P.; Wen, C.; Shi, L.; Hu, Z. A review on proton exchange membrane multi-stack fuel cell systems: Architecture, performance, and power management. Appl. Energy 2022, 310, 118555. [Google Scholar] [CrossRef]
  6. Nakagaki, N. The Newly Developed Components for the Fuel Cell Vehicle, Mirai. In SAE Technical; SAE International: Warrendale, PA, USA, 2015. [Google Scholar] [CrossRef]
  7. Yoshizumi, T.; Kubo, H.; Okumura, M. Development of High-Performance FC Stack for the New MIRAI. In SAE Technical; SAE International: Warrendale, PA, USA, 2021. [Google Scholar] [CrossRef]
  8. Konno, N.; Mizuno, S.; Nakaji, H.; Ishikawa, Y. Development of Compact and High-Performance Fuel Cell Stack. SAE Int. J. Altern. Powertrains 2015, 4, 123–129. [Google Scholar] [CrossRef]
  9. Commission Implementing Regulation (EU) 2019/1840 of 31 October 2019 Amending Implementing Regulation (EU) 2017/1153 as Regards the Reporting of WLTP CO2 Values for Certain Categories of New Passenger Cars and Adjusting the Input Data for the Correlation Tool. Available online: http://data.europa.eu/eli/reg_impl/2019/1840/oj (accessed on 8 May 2022).
  10. Toyota Mirai. Available online: https://www.techdoc-toyota.com (accessed on 6 May 2022).
  11. Hyundai Nexo Blue. Available online: https://www.hyundai.com/content/dam/hyundai/ww/en/images/footer/downloads/eco/e-brochure/nexo-fe-lhd-ebrochure-2019.pdf (accessed on 6 May 2022).
  12. Honda Leverages Older Name for New FCV: Clarity Fuel Cell Makes Its Debut at Tokyo; 435-Mile Range on JC08. Available online: https://www.greencarcongress.com/2015/10/20151027-clarity.html (accessed on 7 May 2022).
  13. Luo, Y.; Wu, Y.; Li, B.; Mo, T.; Li, Y.; Feng, S.-P.; Qu, J.; Chu, P.K. Development and application of fuel cells in the automobile industry. J. Energy Storage 2021, 42, 103124. [Google Scholar] [CrossRef]
  14. Hong, B.K.; Kim, S.H. Recent advances in fuel cell electric vehicle technologies of Hyundai. ECS Trans. 2018, 86, 3–11. [Google Scholar] [CrossRef]
  15. Enomoto, K.; Ida, A.; Harada, T.; Takeuchi, H. Development of Safety Performance for FC Stack in the New Toyota FCEV. In SAE Technical; SAE International: Warrendale, PA, USA, 2022. [Google Scholar] [CrossRef]
  16. Opel Begins Production and Deliveries of Hydrogen Vivaro van. Available online: https://www.greencarcongress.com (accessed on 6 May 2022).
  17. Bernier, A. Hyvia Exhibits the Renault Master Van H2-TECH. Available online: https://www.world-hydrogen-summit.com (accessed on 3 August 2022).
  18. Walters, M.; Wick, M.; Tinz, S.; Ogrzewalla, J.; Sehr, A.; Pischinger, S. Fuel cell system development: A strong influence on FCEV performance. SAE Int. J. Altern. Powertrains 2018, 7, 335–350. [Google Scholar] [CrossRef]
  19. Wurzenberger, J.C.; Rašić, D.; Tavcar, G.; Glatz, T.; Mele, I.; Katrasnik, T. FCEV Performance Assessment—Electrochemical Fuel Cell and Battery Modelling on Vehicle Level. In SAE Technical; SAE International: Warrendale, PA, USA, 2020. [Google Scholar] [CrossRef]
  20. Bagherabadi, K.M.; Skjong, S.; Pedersen, E. Dynamic modelling of PEM fuel cell system for simulation and sizing of marine power systems. Int. J. Hydrog. Energy 2022, 47, 17699–17712. [Google Scholar] [CrossRef]
  21. Zhang, G.; Wu, L.; Qin, Z.; Wu, J.; Xi, F.; Mou, G.; Wang, Y.; Jiao, K. A comprehensive three-dimensional model coupling channel multi-phase flow and electrochemical reactions in proton exchange membrane fuel cell. Adv. Appl. Energy 2021, 2, 100033. [Google Scholar] [CrossRef]
  22. Liu, Y.; Dirkes, S.; Kohrn, M.; Wick, M.; Pischinger, S. A high-fidelity real-time capable dynamic discretized model of proton exchange membrane fuel cells for the development of control strategies. J. Power Sources 2022, 537, 231394. [Google Scholar] [CrossRef]
  23. Bressel, M.; Hilairet, M.; Hissel, D.; Bouamama, B.O. Model-based aging tolerant control with power loss prediction of Proton Exchange Membrane Fuel Cell. Int. J. Hydrog. Energy 2018, 45, 11242–11254. [Google Scholar] [CrossRef]
  24. Barbir, F. Chapter 3—Fuel Cell Electrochemistry. In PEM Fuel Cells; Barbir, F., Ed.; Academic Press: Cambridge, MA, USA, 2005; pp. 33–72. [Google Scholar] [CrossRef]
  25. Larminie, J.; Dicks, A. Fuel Cell Systems Explained, 3rd ed.; John Wiley & Sons Ltd.: Hoboken, NJ, USA, 2018. [Google Scholar] [CrossRef]
  26. Pielecha, I.; Szałek, A.; Tchorek, G. Two generations of hydrogen powertrain—an analysis of the operational indicators in Real Driving Conditions (RDC). Energies 2022, 15, 4734. [Google Scholar] [CrossRef]
  27. Pielecha, J.; Skobiej, K.; Kurtyka, K. Exhaust emissions and energy consumption analysis of conventional, hybrid, and electric vehicles in Real Driving Cycles. Energies 2020, 13, 6423. [Google Scholar] [CrossRef]
  28. Andrych-Zalewska, M.; Chlopek, Z.; Merkisz, J.; Pielecha, J. research on exhaust emissions in dynamic operating states of a combustion engine in a Real Driving Emissions test. Energies 2021, 14, 5684. [Google Scholar] [CrossRef]
  29. Ferreira, M.E.; Oliveira, M.C.; Menezes, L.F.; Andrade-Campos, A. 3–Numerical Optimization Strategies for Springback Compensation in Sheet Metal Forming. In Woodhead Publishing Reviews: Mechanical Engineering Series, Computational Methods and Production Engineering; Davim, J.P., Ed.; Woodhead Publishing: Sawston, UK, 2017; pp. 51–82. [Google Scholar] [CrossRef]
  30. Arora, J.S. Introduction to Optimum Design, 4th ed.; Academic Press: Cambridge, MA, USA, 2017. [Google Scholar] [CrossRef]
  31. Facó, J.L.D. A generalized reduced gradient algorithm for solving large-scale discrete-time nonlinear optimal control problems. IFAC Proc. Vol. 1989, 22, 45–50. [Google Scholar] [CrossRef]
Figure 1. Specific energy vs. specific power of energy storage system [3].
Energies 15 06753 g001
Figure 2. Drive system diagrams employing fuel cell technology: (a) FCEV; (b) FCHEV (based on [4]).
Energies 15 06753 g002
Figure 3. Comparison of cell power vs. high voltage battery capacity [10,13,14,15].
Energies 15 06753 g003
Figure 4. Current_voltage characteristics with the specification of typical losses of a fuel cell.
Energies 15 06753 g004
Figure 5. Influence of fuel cell EOC open circuit voltage on the fuel cell characteristics and losses.
Energies 15 06753 g005
Figure 6. Impact of the changing A parameter of a fuel cell on the I–U characteristics and fuel cell losses.
Energies 15 06753 g006
Figure 7. Impact of a changing resistance r on the I–U characteristic and fuel cell power.
Energies 15 06753 g007
Figure 8. Impact of changes in mass m on the I–U characteristic and fuel cell power.
Energies 15 06753 g008
Figure 9. General schematic of the Toyota Mirai drive system.
Energies 15 06753 g009
Figure 10. Methodology of testing vehicles powered by fuel cells (data sampling frequency: 1 Hz).
Energies 15 06753 g010
Figure 11. Research test results in accordance with the RDC requirements.
Energies 15 06753 g011
Figure 12. Changes in fuel cell energy consumption of the two generations of Toyota Mirai.
Energies 15 06753 g012
Figure 13. Fuel cell stack power and speed profiles in the RDC test: (a) I generation HFCHEV drive; (b) II generation FCHEV drive.
Energies 15 06753 g013aEnergies 15 06753 g013b
Figure 14. The proportion of the fuel cell power share relative to the battery power: (a) for the 1st generation vehicle; (b) for the 2nd generation vehicle.
Energies 15 06753 g014
Figure 15. Fuel cells power usage conditions in particular phases of drive tests: (a) Mirai I gen.; (b) Mirai II gen.
Energies 15 06753 g015
Figure 16. Characteristics of a fuel cell stack in relation to the current intensity of the fuel cell stack and the power of the fuel cell stack: (a) I generation FCHEV drive; (b) II generation FCHEV drive.
Energies 15 06753 g016aEnergies 15 06753 g016b
Figure 17. Current–voltage characteristics of the fuel cell stack of hydrogen-powered drives with modeling results: (a) I generation FCHEV drive; (b) II generation FCHEV drive.
Energies 15 06753 g017
Figure 18. Comparison of model characteristics of the fuel cell stack for each phase of the road test: (a) I generation FCHEV drive; (b) II generation FCHEV drive.
Energies 15 06753 g018
Table 1. Toyota Mirai powertrain system [8,9,15].
ComponentParameterMirai I Gen.Mirai II Gen.
VehicleMass1850 kg2415 kg
Top speed179 km/h175 km/h
Acceleration 0 to 60 mph9.6 s9.2 s
Range (homologation cycle)Approx. 483 km650 km
Fuel cellTypePEM (polymer electrolyte)
Power114 kW (155 HP)128 kW (174 HP)
Power density2.8 kW/kg; 3.5 kW/dm3
(Excl. end plates)
5.4 kW/kg; 5.4 kW/dm3
(Excl. end plates)
Number of cells370330
Electric motorTypePermanent magnet synchronous
Peak power123 kW at 4500 rpm134 kW at 6940 rpm
Maximum torque335 N·m300 N·m
Maximum speed13,500 rpm16,500 rpm
BatteryTypeNickel metal hydride (Ni-MH)Li-Ion
Capacity6.5 Ah4 Ah
Output25.5 kW × 10 s31.5 kW × 10 s
Nominal voltage244.8 V (7.2 V × 34)310.8 V (3.7 V × 84)
Energy1.59 kWh1.24 kWh
Hydrogen storageInternal volume122.4 dm3142.2 dm3
Nominal pressure70 MPa70 MPa
Mass4.6 kg5.6 kg
Table 2. Selected conditions required for a valid RDC test.
ParameterMirai I Gen.Mirai II Gen.Diff. [%]Requirements
Urban route [km]32.9335.086.1>16
Rural route [km]37.5034.817.2>16
Highway route [km]42.9944.262.9>16
Total route [km]113.43114.150.6>48
Share of urban route [%]29.0330.735.529–44
Share of rural route [%]33.0630.497.833 ± 10
Share of highway route [%]37.9038.772.233 ± 10
Average speed in urban route [km/h]30.2329.512.415–40
Share of standstill in urban route [%]22.4019.8811.36–30
Test time [min]114.57119.494.190–120
Table 3. Initial conditions for modeling fuel cells.
ParameterSymbolMirai I Gen.Mirai II Gen.
Open circuit voltageEoc0.80.8
Activation overvoltageA0.008540.00854
Area-specific resistancer22.796622.7966
Constants in the mass-transfer overvoltage Equation (5)m0.000970.00097
Constants in the mass-transfer overvoltage Equation (5)n0.629170.62917
Active area of stockast52,056.252,056.2
Number of cells in the fuel stacknst370330
Table 4. The results of the fuel cell stack modeling study.
ParameterMirai I Gen.Mirai II Gen.
All TestUrbanRuralMotorwayAll testUrbanRuralMotorway
Eoc7.547 × 10−17.782 × 10−17.364 × 10−17.469 × 10−18.054 × 10−18.277 × 10−18.266 × 10−17.919 × 10⁻¹
A1.050 × 10−27.883 × 10−31.256 × 10−21.145 × 10−28.395 × 10−35.610 × 10−38.923E × 10−31.104 × 10⁻²
r3.370 × 1013.833 × 1013.098 × 1013.246 × 1012.292 × 1012.597 × 1012.308 × 1012.333 × 101
m1.000 × 10−71.000 × 10−71.000 × 10−71.000 × 10−79.697 × 10−41.000 × 10−72.112 × 10−31.367 × 10⁻²
n8.654 × 10−18.637 × 10−18.677 × 10−18.609 × 10−16.292 × 10−16.352 × 10−16.289 × 10−17.171 × 10⁻²
ast5.206 × 1045.206 × 1045.206 × 1045.206 × 1045.179 × 1044.794 × 1045.127 × 1045.927 × 104
nst3.712 × 1023.712 × 1023.710 × 1023.711 × 1023.284 × 1023.295 × 1023.195 × 1023.286 × 102
Table 5. Conditions for ending the search for the minimum of the objective function (Equation (9)).
ParameterMirai I Gen.Mirai II Gen.
All TestUrbanRuralMotorwayAll TestUrbanRuralMotorway
( U o U ) 2 109,82759,59129,24918,31751,58819,61615,96713,878
( U o U ) 2 ¯ 26.976323.160123.760921.884510.45569.124010.106211.5271
Table 6. Assessment of fuel cell losses taking into account both generations of fuel cell systems.
ParameterMirai I Gen.Mirai II Gen.
UrbanRuralMotorwayUrbanRuralMotorway
Open circuit voltage Eocminmaxmiddleminmiddlemax
Activation voltage lossesminmiddlemaxmiddleminmax
Resistive voltage lossesmaxminmiddlemaxmiddlemin
Mass transport voltage lossesminminminminmaxmax
Publisher’s Note: MDPI stays neutral with regard to jurisdictional claims in published maps and institutional affiliations.

