Article

Greenhouse Gas Emissions in the Process of Landfill Disposal in China

1
Institute of Urban-Rural Ecological Civilization, China Urban Construction Design & Research Institute Co., Ltd., Beijing 100120, China
2
School of Environment, Tsinghua University, Beijing 100084, China
3
CUCDE Environmental Technology Co., Ltd., Beijing 100120, China
*
Author to whom correspondence should be addressed.
Energies 2022, 15(18), 6711; https://doi.org/10.3390/en15186711
Submission received: 5 August 2022 / Revised: 6 September 2022 / Accepted: 11 September 2022 / Published: 14 September 2022
(This article belongs to the Section B: Energy and Environment)

Abstract

:
Quantitative accounting of greenhouse gas (GHG) emissions has become an important global focus. GHG emissions from the waste sector have high potential in GHG emissions reduction. We analyzed the GHG emissions inventory in the waste sector of the European Union, Germany, the United Kingdom, the United States of America, and Canada from 1990 to 2019. Landfill disposal was the main category of GHGs from the waste sector, with a contribution rate between 69% and 95%. Landfill disposal also played a prominent role in emission reduction, with a contribution rate higher than 86%. GHG emissions from landfill sites in China were calculated using the inventory analysis method recommended by the IPCC and combined with actual situations. The results showed that the highest GHG emissions from landfill disposal in China occurred in 2020, with an estimated 165 million tons of carbon dioxide (CO2) equivalent. In 2019, the per capita GHG emissions from landfill sites in China was 117 kg CO2 equivalent/person, which was higher than Germany (87 kg CO2 equivalent/person) but lower than the European Union (189 kg CO2 equivalent/person).

1. Introduction

Natural environmental changes and human activities have directly or indirectly altered the composition of the global atmosphere, leading to an unprecedented rate of climate change [1,2]. The excessive use of fossil fuels, such as coal and oil, during industrialization has increased emissions of greenhouse gases (GHGs), such as carbon dioxide (CO2) [3]. The Sixth Assessment Report of the United Nations Intergovernmental Panel on Climate Change (IPCC) indicates that human activity is the main cause of changes in GHG levels [4]. The main areas of the IPCC’s National Greenhouse Gas Inventory Guidelines include energy activities, industrial processes, agricultural activities, land use, land use change and forestry, and waste [5]. The contribution of the waste sector is ranked fourth following the energy, agricultural, and industrial sectors in the European Union [6]. It is also reported that GHG emissions from the waste sector have high potential in GHG emissions reduction [7]. According to IPCC, the waste sector is divided into four categories according to the treatment methods: 5.A solid waste disposal (landfill disposal), 5.B biological treatment of solid waste, 5.C incineration and open burning of waste, and 5.D wastewater treatment and discharge.
The IPCC provides internationally recognized methodologies that countries can use to estimate greenhouse gas inventories for reporting to the United Nations Framework Convention on Climate Change (UNFCCC). The main GHGs included in the guidelines are CO2, methane (CH4), and nitrous oxide (N2O). A series of assessments published by the IPCC has shown that GHG emissions from the waste sector have become important sources of anthropogenic GHGs. Landfill disposal is the main contributor to GHG emissions in the waste sector, with a contribution rate between 69% and 95%. Meanwhile, landfill disposal plays a prominent role in emission reduction, with a contribution rate higher than 86% [6]. Therefore, reducing GHG emissions from solid waste disposal, especially reducing GHG emissions from landfill sites, is an effective way to achieve national emission reductions.
According to the Statistical Yearbook of the Ministry of Housing and Urban-Rural Development of the People’s Republic of China, from 2006 to 2020 [8], the amount of urban and rural domestic garbage removal in China changed significantly. In 2006, China’s urban and rural domestic garbage removal was 211 million tons, of which 148 million tons came from cities and 63 million tons from counties. In 2020, China’s urban and rural domestic garbage removal was expected to reach 303 million tons, and the urban and county domestic garbage removal was expected to reach 235 million tons and 68 million tons, respectively. In the past ten years, the removal of urban domestic garbage has increased by 59%. On the one hand, due to the acceleration of urbanization in China, the rural population is constantly moving to cities; on the other hand, due to the development and improvement of China’s sanitation system, the removal area has been basically covered. The removal of domestic garbage in the county remained at about 70 million tons. China has submitted a total of five reports to the IPCC, which are used as the municipal solid waste treatment data in the years of 1994 [9], 2005 [10], 2010 [11], 2012 [12], and 2014 [13]. Since China is a developing country, the reports only cover the amount of municipal solid waste treatment and disposal data in urban cities and do not pay attention to the data in rural spaces, which, therefore, does not represent the current situation of greenhouse gas emissions in the field of domestic waste treatment in China, and thus cannot be compared directly with other countries. This study looked at both rural and urban data to represent the national GHG emission situation.
Since the 1950s, China’s warming rate has been significantly higher than the global average for the same period, and the region is a sensitive and significant area of global climate change. The UNFCCC for 1992 required countries around the world to assume considerable responsibilities and obligations in accordance with their level of economic development to achieve carbon dioxide reduction. To date, 54 countries have reached their peak carbon dioxide emissions [14]. The “Carbon Peak, Carbon Neutral” target was included in the Report on the Work of the Government and the Outline of Vision Goals for the Fourteenth Five-year Plan for National Economic and Social Development of China. At present, China’s carbon emissions are large and still growing; they have not yet reached their peak. Therefore, more effort should be put into reaching the carbon peak and achieving carbon neutrality targets. A clear understanding of China’s key areas of current carbon emissions is fundamental to developing scientific and reasonable emission reduction measures and pathways. However, the GHG emissions inventory is not clear in China, and further research is urgently needed.

2. Materials and Methods

2.1. Data Sources

This study focuses on the amount of solid waste landfill in China (including urban and rural) from 2010 to 2019. Statistical data for China, including the population and quantity of landfill disposal, were used [15]. The urban and rural solid waste treatment and disposal options for China are shown in Table 1.

2.2. Physical Component of Solid Waste

Generally, the proportion of carbon in solid waste is about 15% and fossil carbon in household waste accounts for approximately one third to one half. In our study, one ton of solid waste contained 100 kg of biomass carbon and 50 kg of fossil carbon [16]. The fossil source of carbon dioxide had a greenhouse effect and the biological source of carbon dioxide did not have a greenhouse effect [17].

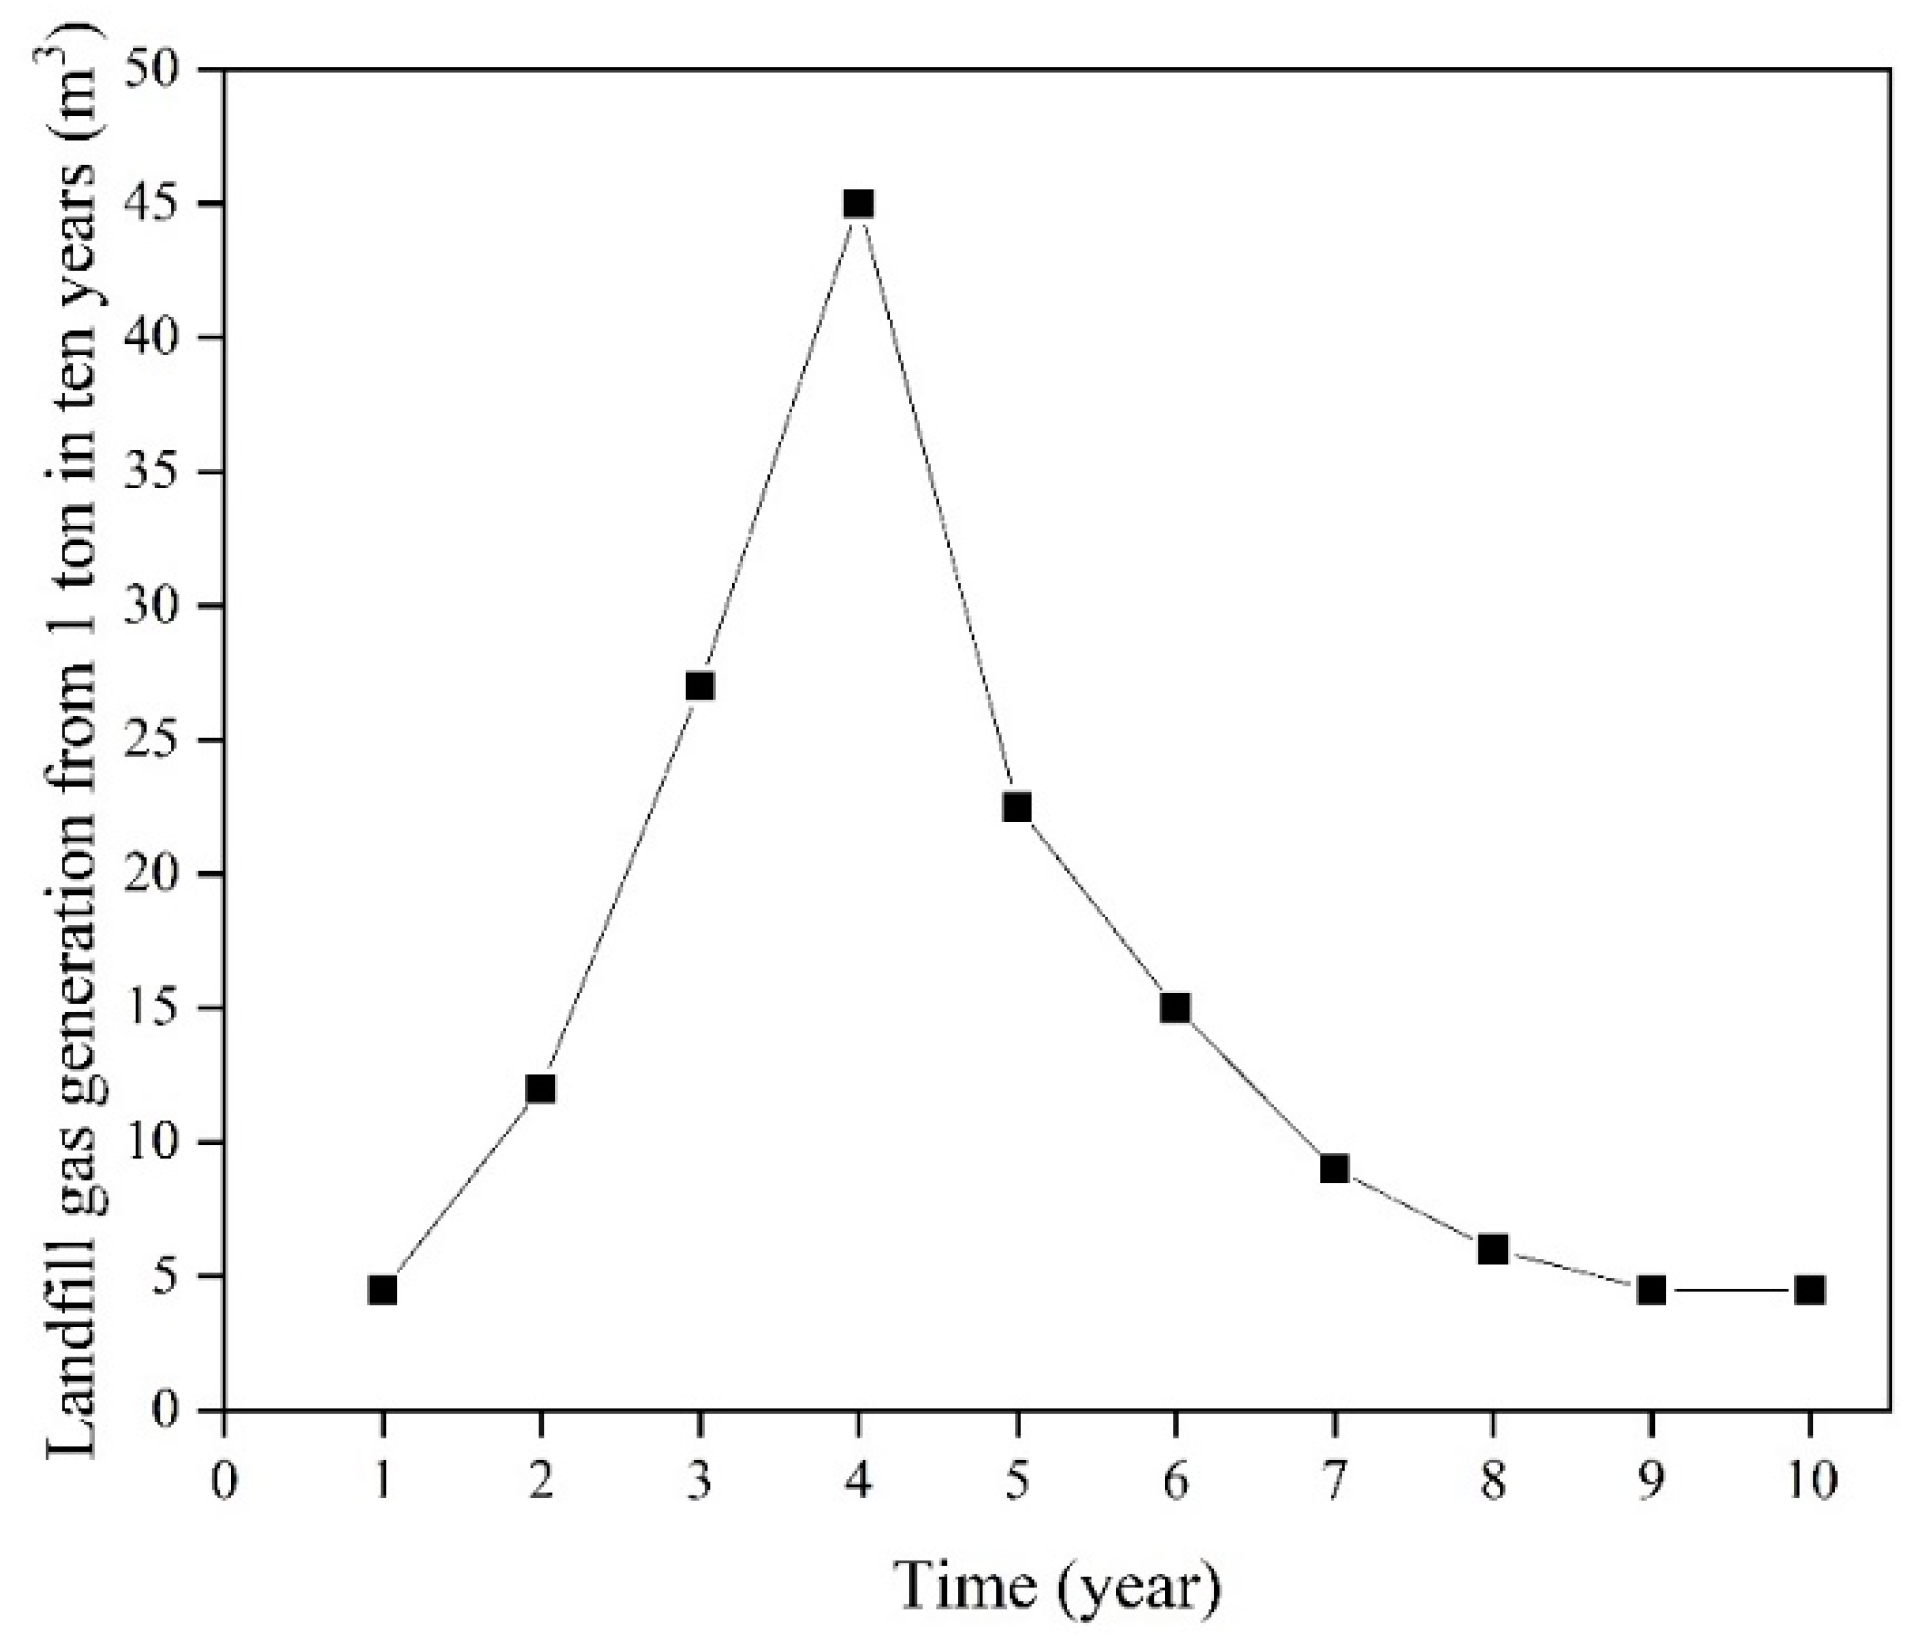
2.3. Landfill Gas Production

Since this study was a large-scale national study, which went on for decades, the seasonal, as well as regional, changes of the typical yield of landfill gas per mass unit of waste were ignored. During landfill, biomass carbon is converted to CH4 and CO2 with a volume proportion of 50% for each. Based on the results from the LandGEM Gas Emission Model (v3.02) [18] and empirical data on landfill gas generation from Chinese landfills, the landfill gas production potential was set as 150 m3/t waste during the whole process. Landfill gas releases continue for decades, but the rate of landfill gas production decreases after overlaying. Empirical measurements showed the period of landfill gas production was about 10 years and peak gas production was measured in the third or fourth year [19]. For convenient calculation, the landfill gas production from 1 ton of solid waste over 10 years (150 m3) was distributed to each year, as shown in Figure 1.

2.4. Emission Factors for GHG Inventory Calculation

The most commonly used and simplest methodology recommended by the IPCC combines information on the extent to which activities occur (known as “activity data” or “AD”), with a factor for quantifying emissions or removals per unit of activity. These coefficients are called “emission factors” (EFs). The basic equation is shown as Equation (1) [5]:
Emissions = AD × EF
The GHG emissions inventory factors for the waste sector are shown in Table 2. In general, methane emissions from landfill are the largest source of GHG emissions in the waste sector. In addition, carbon dioxide from waste incineration from fossil carbon (e.g., plastics), methane from composting and anaerobic digestion, and nitrogen oxides are major sources of greenhouse gases that need to be estimated and reported statistically. However, in the IPCC, GHG emissions from waste materials directly used as fuel or converted into fuel are reported in the energy sector [5].

3. Results

3.1. Amount of Solid Waste Landfill in China

In 2010, 221 million tons of solid waste in urban and rural areas were collected, while in 2019, there were 311 million tons. In the past 10 years, the amount of harmless disposal (such as sanitary landfill, incineration, and others) increased from 138 million tons to 306 million tons, while the ratio of harmless treatment increased from 64% to 99%.
As the level of harmless treatment continued to rise, non-harmless disposal, such as open dumping or unsanitary landfill showed a decreasing trend year by year. The volume of non-harmless waste decreased from 81 million tons in 2010 to 5 million tons in 2019.
The quantity of sanitary landfill grew from 111 million tons in 2010 to 171 million tons in 2017, and then fell to 161 million tons in 2019. The quantity of incineration continued to grow, from 24 million tons in 2010 to 135 million tons in 2019. Other disposal technology processing increased from 2 million tons in 2010 to 10 million tons in 2019 but accounted for less than 5% of total waste disposal.
Under the guidance of China’s policies, such as zero-waste cities construction, zero landfill, increasing the disposal capacity of incineration, and other policies, since 2010, the total quantity of landfill disposal has shown a continuous downward trend, but landfill disposal is still the main choice for waste disposal in urban and rural areas of China, accounting for more than 50%.

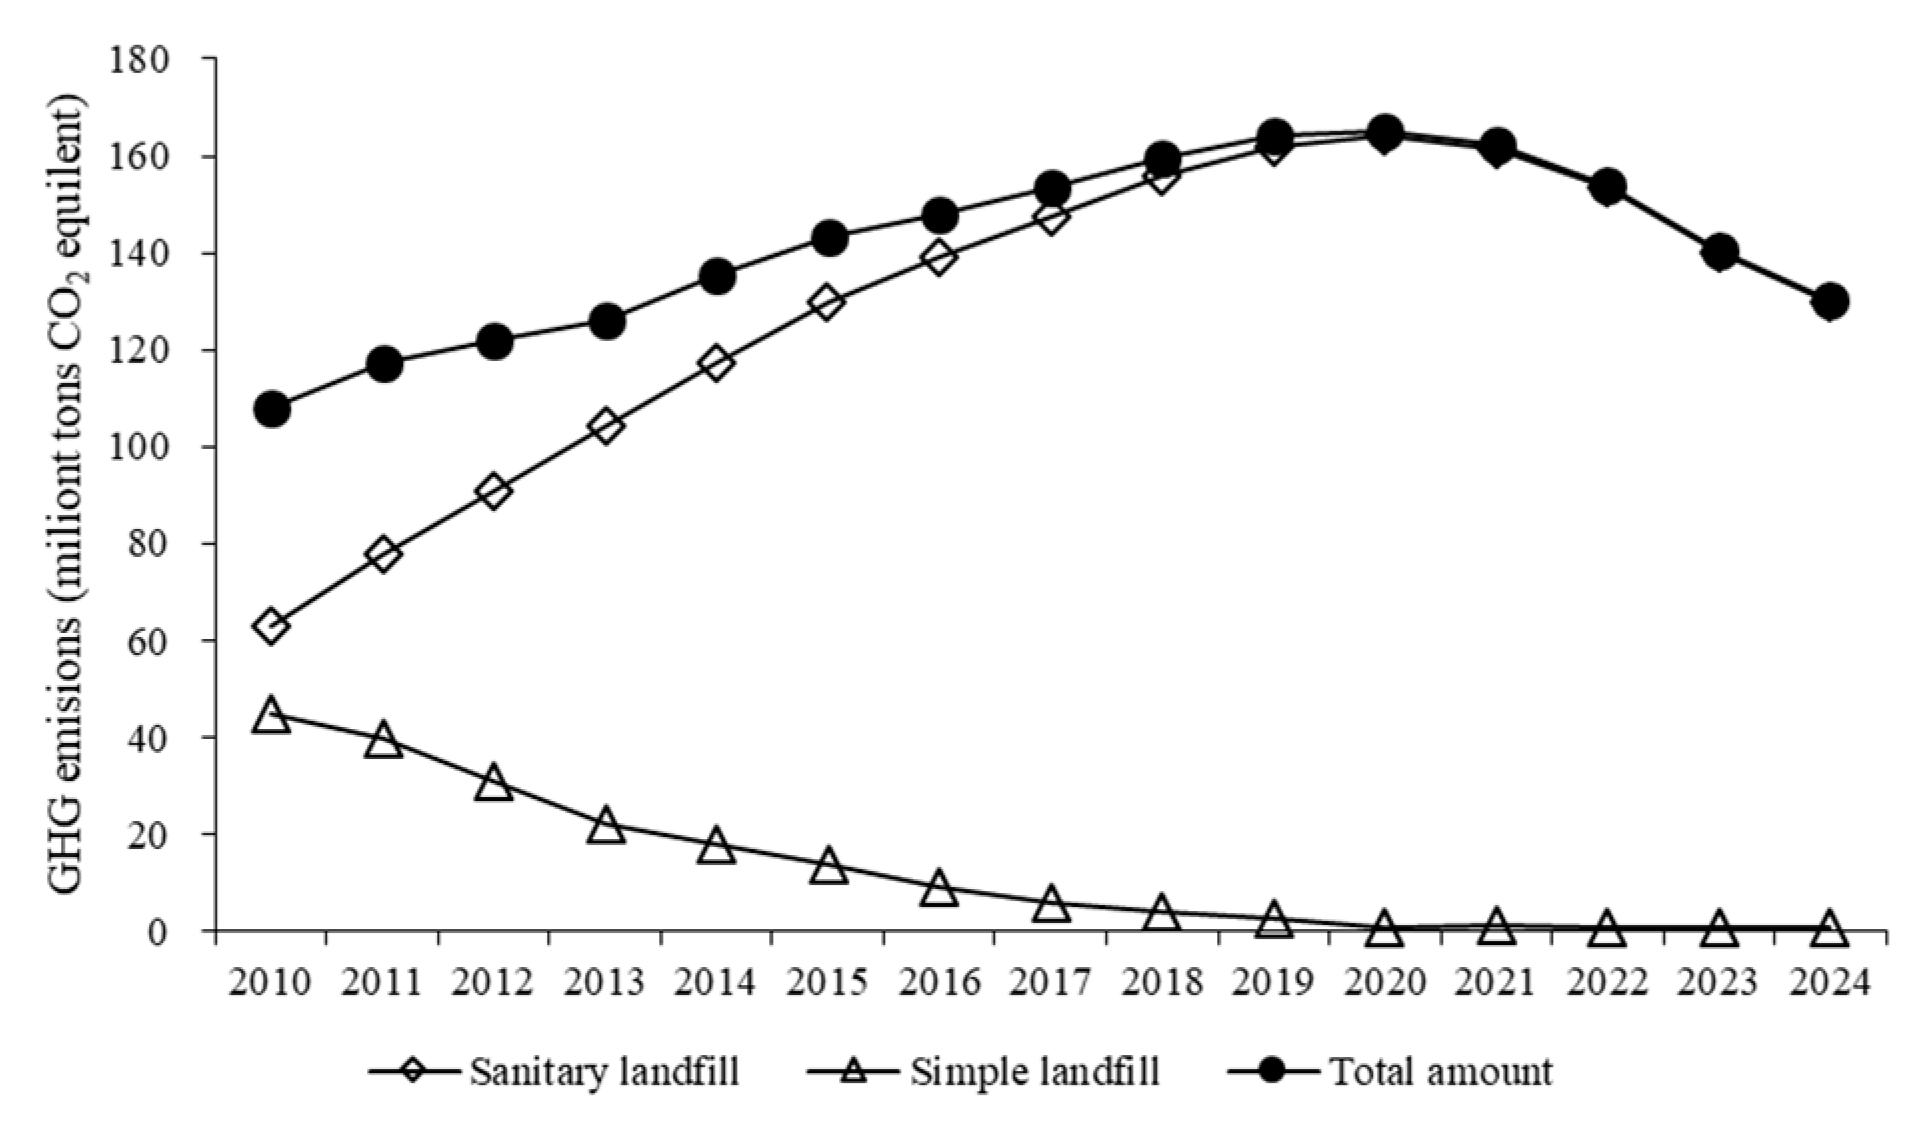
3.2. GHG Emissions from Landfill Sites in China

Even though the harmless treatment rate of solid waste is relatively high, some of the waste still cannot be treated harmlessly or called simple landfill. According to IPCC, the methane production rate of simple landfill is only 0.4 times that of regular anaerobic landfill because it is in the aerobic environment; we also assumed that all of the landfill gases were released in one year.
The landfill methane recovery rate in the European Union was relatively low. In 1990, only 4% of methane was collected and only 2.6% was used for energy recovery. Methane collection increased to 35% in 2019 and the amount used for energy recovery increased to 31.6% [6]. Based on empirical data in China, the level of 25% of methane used for energy recovery was applied in the current study.
According to the quantity of landfill from 2010 to 2019, and the landfill gas production regulation over the years, it was calculated that the maximum gas production occurred in 2020 (Figure 2). Under a collection ratio of 25% of sanitary landfill, most of the CH4 was released into the atmosphere, while in simple landfills, all of the CH4 was released. With an emission factor of 25 between CH4 and CO2, this was equivalent to 165 million tons of CO2 equivalent.
The amount of GHG emissions from landfill following the year 2020 was estimated, and according to the degree of harmless treatment is getting higher and higher; most of them are sanitary landfills, and according to the landfill gas emissions displayed in Figure 1, some of the GHG emissions after the year 2020 are generated by the waste that was landfilled in previous years, and the rest is generated by new landfilled waste. Therefore, as the number of landfills become lower and lower and most of them are harmless landfill disposals, there is a year-on-year decline in Figure 2 after 2020, and the total emissions are consistent with GHG emissions from sanitary landfill.

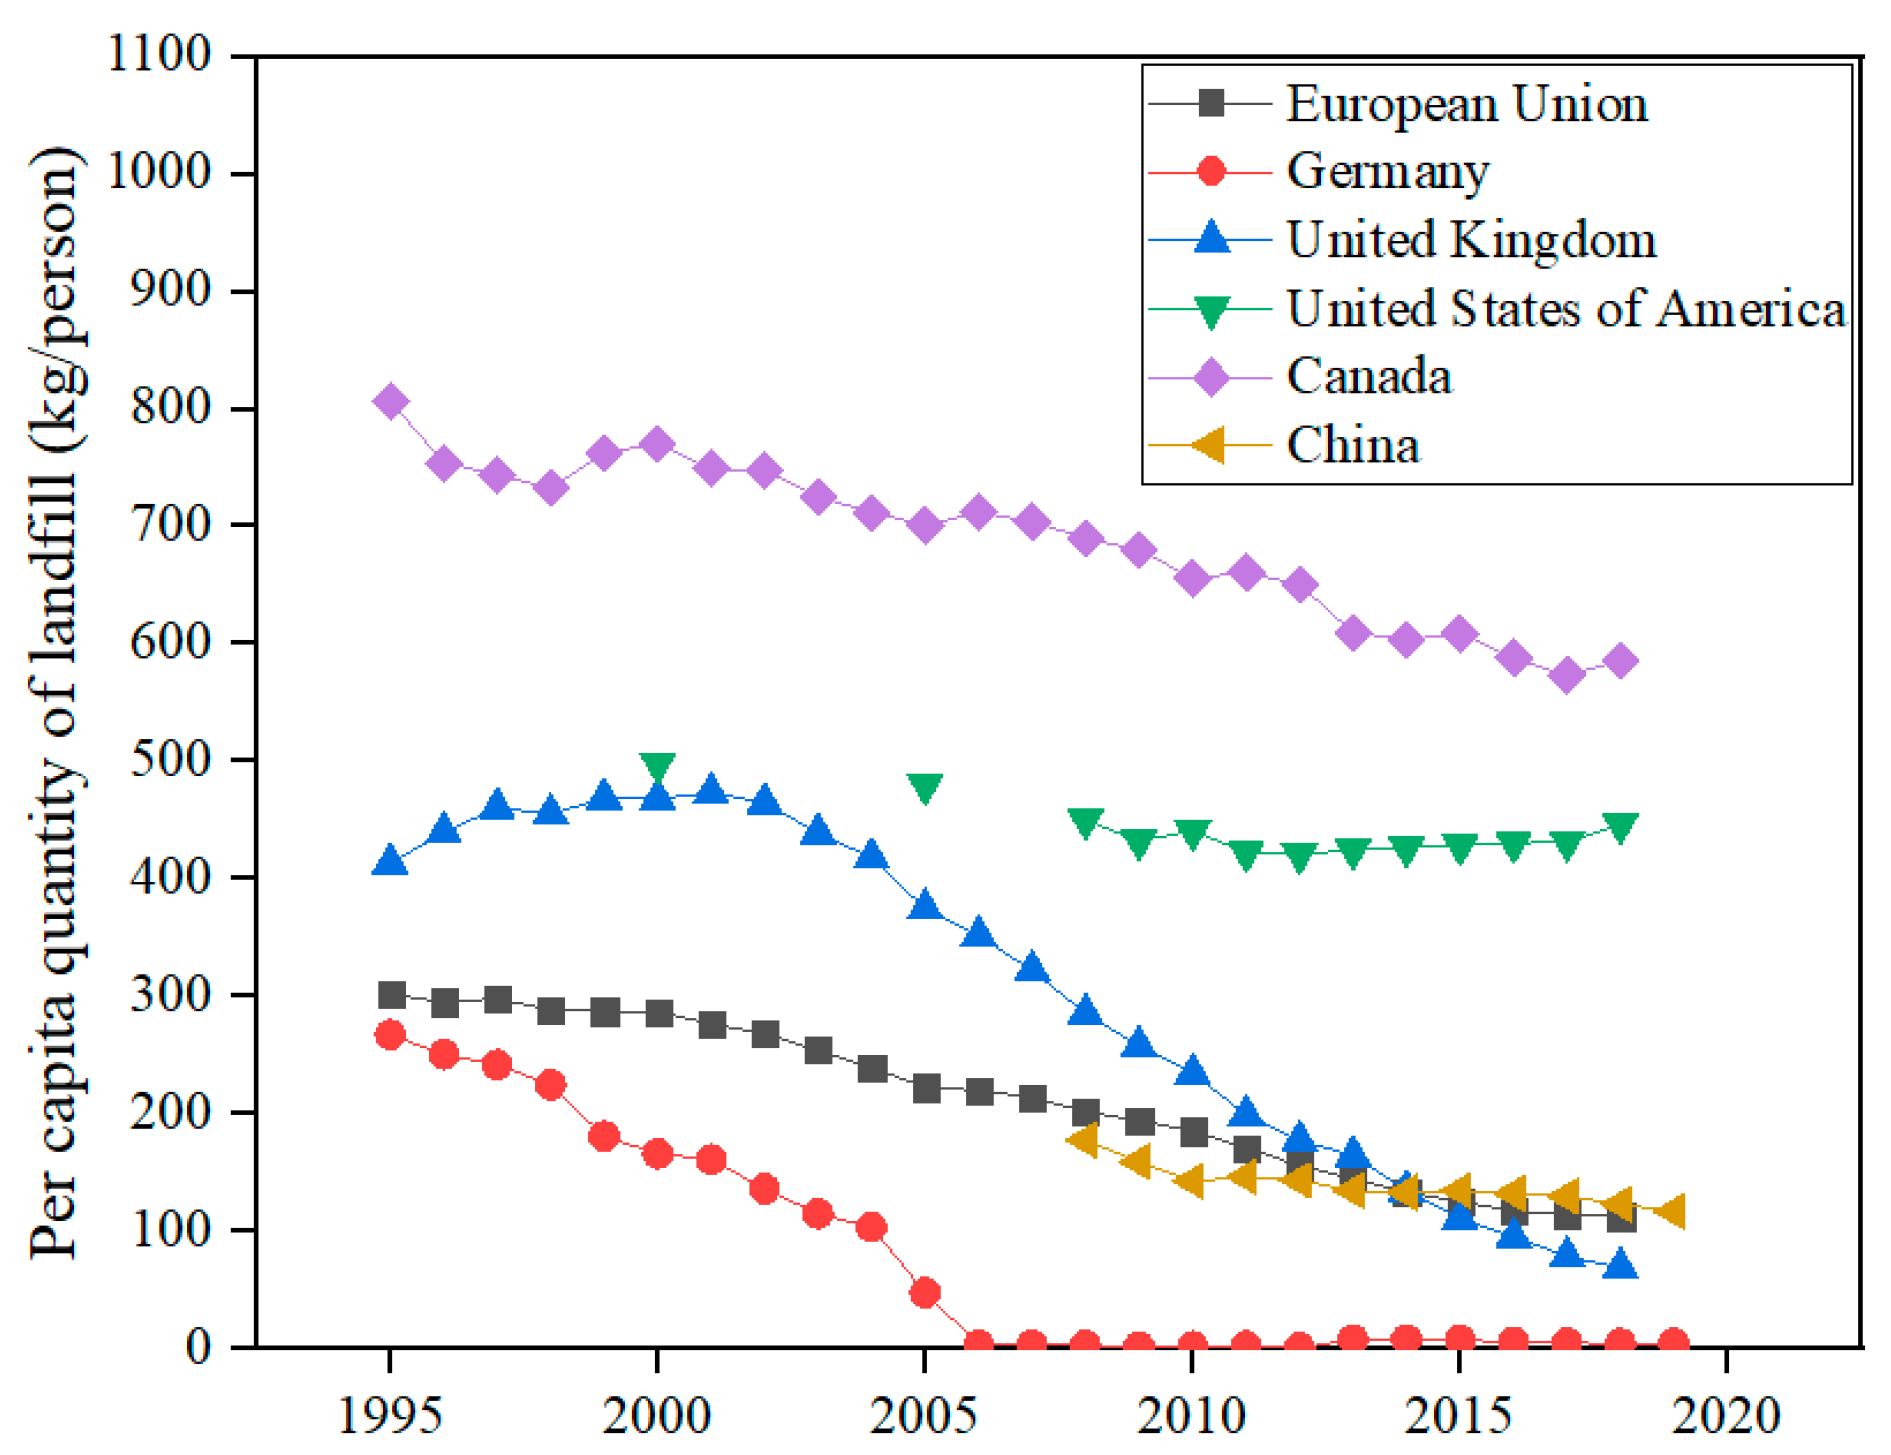
3.3. Per Capita Quantity of Landfill

In the past 30 years, the changes to the structure of municipal solid waste treatment and disposal is the main reason for the decrease in per capita quantity of landfill in the EU [6].
The per capita quantity of landfill generally showed a downward trend except for the United States (Figure 3). Germany and the United Kingdom had the largest declines, followed by the European Union.
In the past few years, the per capita quantity of landfill in the European Union decreased from 302 kg/person to 113 kg/person (a reduction of 62%). There was a high reduction rate in Germany from 267 kg/person to 5 kg/person. In the United Kingdom, the per capita quantity decreased from 414 kg/person to 70 kg/person (a reduction of 83%). In the United States, there was little change in the per capita amount of landfill, with values in the range of 420 kg/person to 500 kg/person. In Canada, there was a decrease from 806 kg/person to 586 kg/person, however, the per capita quantity of landfill was still the highest value in the current study. In China, the per capita quantity of landfill has decreased from 178 kg/person to 117 kg/person over the past ten years. There are many policies that have been created in recent years, such as zero-waste city construction, zero landfilled of organic waste, etc.; China are aiming to reduce the amount of waste into landfill, so the amount of per capita landfill has decreased, and the amount of incineration or biomass treatment has increased.

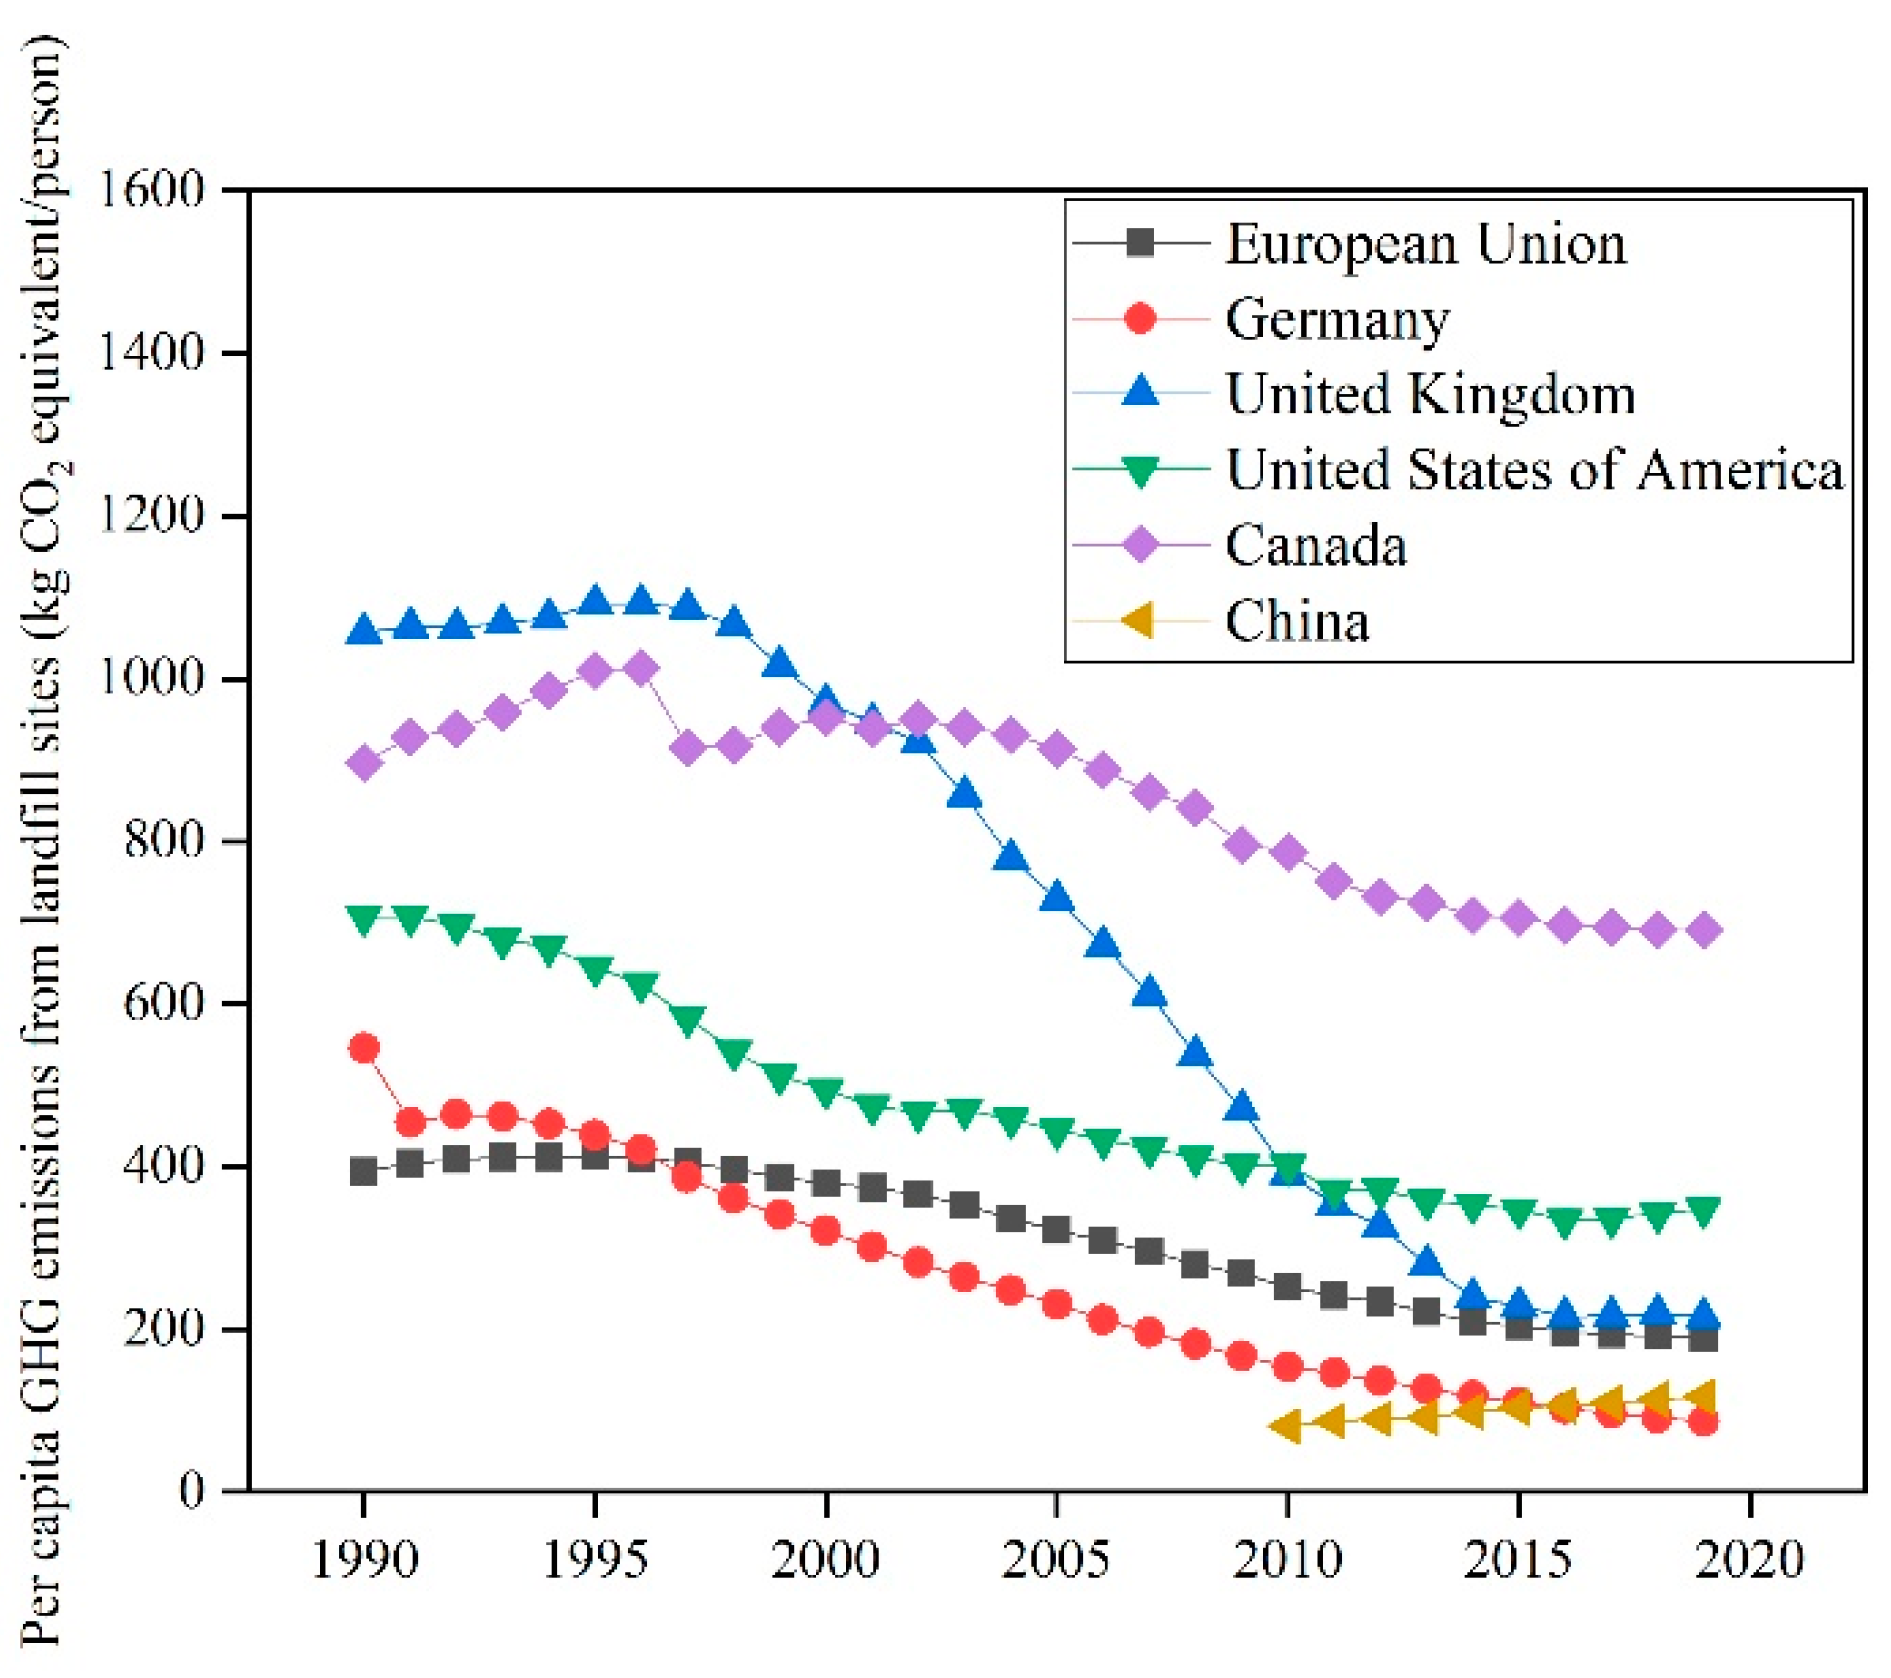
3.4. Per Capita GHG Emissions from Landfill Sites

The per capita GHG gas emissions from landfill disposal are shown in Figure 4. There is a noticeable downward trend. Germany and the United Kingdom had the largest declines, followed by the European Union and the United States.
Over the past 30 years, the per capita GHG emissions from landfill disposal in the European Union decreased by 52% from 394 kg CO2 equivalent/person to 189 kg CO2 equivalent/person. Emissions in Germany decreased from 546 kg CO2 equivalent/person to 87 kg CO2 equivalent/person. The United Kingdom has the biggest reduction in per capita GHG emissions, from 1057 kg CO2 equivalent/person to 215 kg CO2 equivalent/person. A decrease of 52% was recorded in the United States, with a decrease from 707 kg CO2 equivalent/person to 343 kg CO2 equivalent/person. The decline in Canada was not significant, decreasing 23% from 897 kg CO2 equivalent/person to 691 kg CO2 equivalent/person.
At present, Canada has the highest per capita GHG emissions from landfill sites, followed by the United States and Germany. In 2019, China’s per capita GHG emissions from landfill sites were 117 kg CO2 equivalent/person, higher than Germany (87 kg CO2 equivalent/person) but lower than the European Union (189 kg CO2 equivalent/person). The per capita GHG emissions from landfill sites in Canada are six times those of China.
The main reasons for the reduction in European Union countries [6] is that they have enacted decrees to limit the total amount of landfill, reduce the number of unmanaged landfill sites, and increase the collection and utilization of landfill gases. Improvements in methane recovery rates is another major reason for the reduction. Only 2.6% of methane in the European Union was recovered in 1990, while 31.6% of methane was collected for energy recovery in 2019. Nevertheless, there is still much room for improvement.
The main measure for Germany [20] to reduce emissions in the waste sector was domestic waste incineration instead of landfill, which reduced methane emissions, while in the United Kingdom, it was mainly due to the implementation of landfill gas recovery systems in landfills and reduced landfill capacity [21].

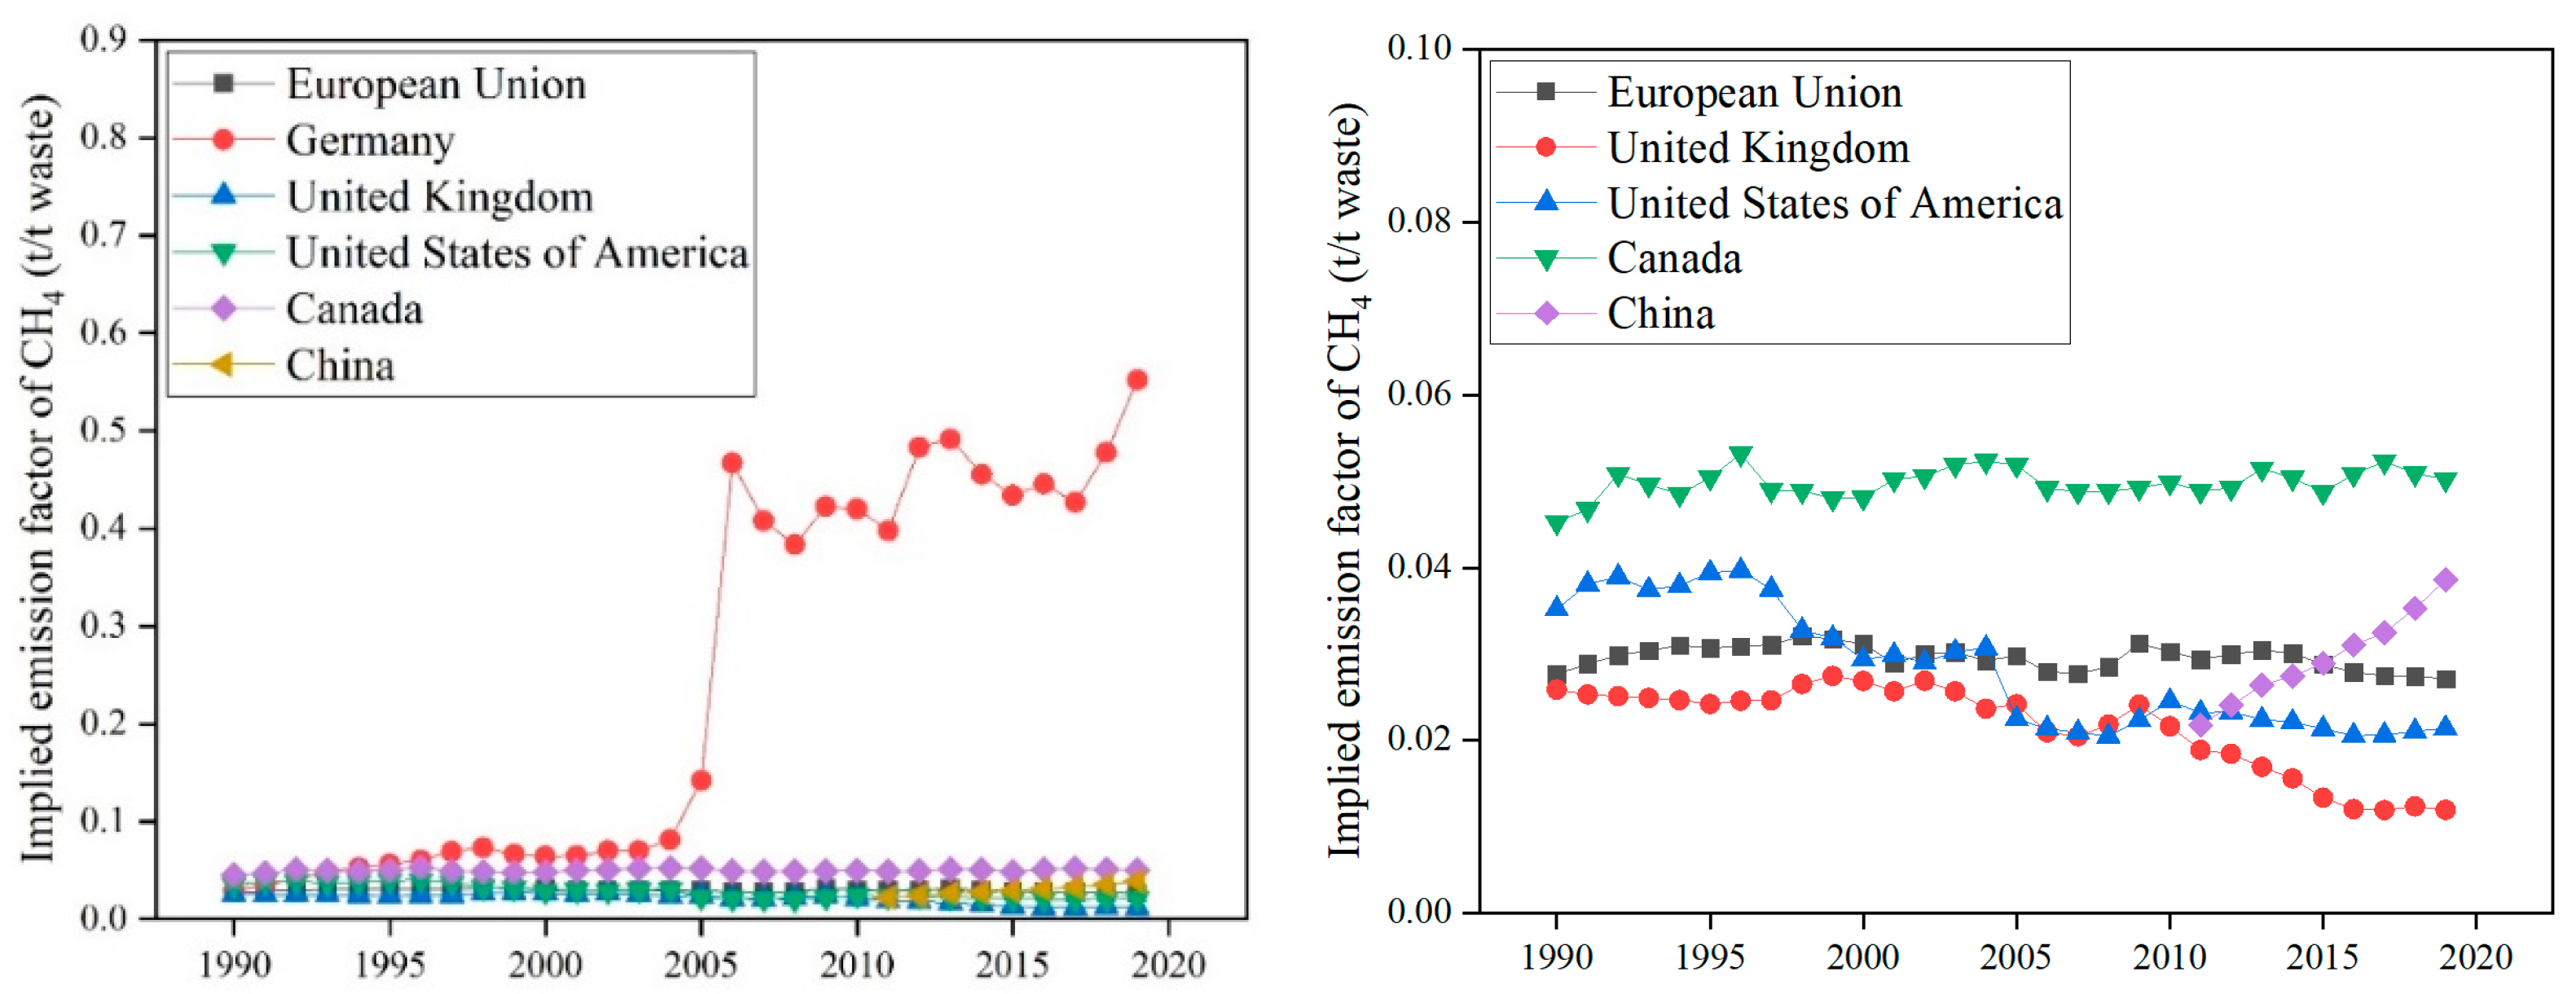
3.5. Implied Emission Factor of CH4 from Landfill

The greenhouse gas emission from landfill is calculated based on actual experiences in this paper, which is different from the method recommended by IPCC. The significance of discussing the implied emission factor of CH4 with other countries is to verify the new method’s reliability. The results show that the implied emission factor of CH4 calculated by the new method is similar with the data of other countries (except for Germany).
Data concerning the implied emission factor of CH4 are submitted to the IPCC by each country to represent the CH4 emission factor per ton of landfilled waste for the current year. The implied emission factor of CH4 from landfill sites is shown in Figure 5. There is a relatively stable trend except for Germany. With the improvement of the harmless treatment level, almost all landfill sites are managed. Although the implied emission factors are categorized as managed waste disposal sites, unmanaged waste disposal sites, and uncategorized waste disposal sites, we only selected the implied emission factor for managed waste disposal sites for analysis.
The Chinese implied emission factor of CH4 from landfill sites was calculated among 0.02 to 0.04 in the current study, which is consistent with international levels. In 2019, Germany had the highest value, 0.55, while the other countries in our study ranged from 0.01 to 0.05. There are two reasons for the high German values since 2005. Germany implemented a strict law following the year 2005, which meant zero primary waste could go to landfill; however, because of the waste previously landfilled, the waste was still releasing greenhouse gases, and this value was large. The trend in other countries is relatively stable and more comparable to that of our country. However, if countries were to tighten their grip on landfills, their trends would converge with Germany’s.
In the national greenhouse gas emission inventory reports submitted to the IPCC, many countries have conducted qualitative analysis of changes in the nearly 30 years from 1990 to 2019, and from the EU’s national greenhouse gas emission inventory report, we read the endogenous reasons for the reduction in carbon emissions in the field of solid waste treatment and disposal.
The changes in the per capita amount of landfill, the per capita GHG emissions from landfill sites, and the implied emission factor are mainly affected by changes in the choice of solid waste disposal. Methane production is also closely tied to the composition of waste landfill.
The choice of solid waste disposal in the European Union has changed between 1995 and 2019. In 1995, the majority (65%) of solid waste disposal was landfill. By 2019, the share of landfill disposal had decreased to 24%. However, there are significant differences in the selection of landfill as the main technology for solid waste disposal among European Union countries. In Bulgaria, Greece, Croatia, and Iceland, for example, landfill is the main method for solid waste disposal, generally more than 60%. In contrast, in countries, such as Germany, Denmark, Belgium, and the United Kingdom, landfill disposal accounts for less than 20%.
Since 1990, the German government has formulated and promulgated a series of laws and regulations and adopted many household waste collection and disposal control measures to reduce the amount of household waste in German cities. In 2004, there were about 330 landfill sites in Germany. Under the strict laws and regulations at the time, all landfills had to be equipped with landfill gas recovery and treatment equipment, which significantly reduced methane emissions from landfills. In 2005, Germany closed more than half its landfills. As a result, only about 150 household landfills are still in operation. In addition, since 2005, Germany has banned the dumping of organic waste directly, and organic waste must be pretreated by mechanical, biological, or thermal processes, limiting the formation of large amounts of methane from landfill sources. With the reduction in the quantity of methane emitted from old landfills, total emissions from landfills will be significantly reduced and will remain low in the long term. The experience of the German government has shown that reducing the amount of organic waste in landfills is more significant than recycling and using landfill gases.
In the United Kingdom, landfill disposal only consists of managed landfill sites; unmanaged landfill sites were closed by 1980 when the solid landfill legislation reform came into force. This category of GHG mainly refers to methane produced by landfill anaerobic decomposition. Carbon dioxide emitted from landfills is a biocarbon source and is not included in the statistics. Non-methane volatile organic compounds (NMVOCs) released from landfills are estimated to have an emission factor of 0.0036 kg NMOVC/ton of waste and are included in the statistics. Methane emissions from landfills depend largely on the carbon content of biodegradable waste and the ability to efficiently capture and recover fugitive methane gas. In both areas, the United Kingdom has developed a range of legal and regulatory measures for both source prevention and end-of-life governance. The most important measure is the Landfill Directive 1999, which calls for a reduction in biodegradable waste and improvements in the design, operation, and management of landfills. Since 1990, methane emissions from landfills have decreased significantly because of increased landfill gas recovery, reduced biodegradable material in landfills, and increased recovery and composting rates. In recent years, the landfill gas recovery rate has stabilized, which has led to a stabilization in GHG emissions.
Since landfills in the United States [22] are effectively managed, 5.A only includes methane emissions from managed landfills, ignoring emissions, such as trace amounts of nitrous oxide. According to statistical data in 2019, the United States operated 1700 to 2000 landfills and landfill methane emissions that were about 114 million tons of CO2 equivalent. Of these, urban household waste landfill emissions accounted for 87%, while industrial landfill emissions accounted for 13%.
In Canada [23], with the increasing population, more waste is being generated. Most of the solid waste is disposed of in landfill sites, and landfill gas collection and landfill covers are common requirements. In addition, there are bans on organic waste landfill, which contributes to a large increase on organic waste. To reduce the amount of waste, there is also a reduction target on per capita waste generation.

4. Conclusions

To clarify the GHG inventory of Chinese landfill sites, this paper conducted a systematic analysis of GHG emissions inventories from the waste sector in the European Union, Germany, the United Kingdom, the United States, and Canada. Results showed that landfill disposal was a key component of GHG emissions (69% to 95%) from the waste sector and was also a major source of emission reduction contributions (>86%). Using data on China’s solid waste landfill disposal and the IPCC inventory analysis method, the current study found that GHG emissions from landfill sites were estimated to have reached a peak of 165 million tons CO2 equivalent in 2020. The per capita quantity of landfill in China in 2019 was 117 kg/person, consistent with the European Union (113 kg/person). Since landfill is still the main choice for solid waste disposal (>52%), China has a large GHG emission reduction space. The following specific emission reduction pathways are recommended:
(1)
Strengthen the source reduction measures to reduce the amount of solid waste generation;
(2)
Increase the recycling and utilization of landfill gas;
(3)
Avoid the entry of the organic fraction of waste into landfill;
(4)
Screen the excavation of old landfills to avoid the continued release of methane gas;
(5)
Increase the proportion of incineration in the solid waste treatment system.

Author Contributions

Data curation, X.L.; Investigation, T.S. and B.B.; Methodology, H.X.; Software, H.G.; Supervision, J.L. and X.N.; Writing—review and editing, X.M. and Y.Y. All authors have read and agreed to the published version of the manuscript.

Funding

This research was funded by National Key R&D Program of China, grant number 2019YFC1906000, Independent Scientific Research Project of CUCD, grant number Y05H22005, and Research and Development Project of the Ministry of Housing and Urban-Rural Development of China, grant number 2022-K-139.

Institutional Review Board Statement

Not applicable.

Data Availability Statement

Not applicable.

Conflicts of Interest

The authors declare no conflict of interest.

References

  1. Ge, W.; Deng, L.; Wang, F.; Han, J. Quantifying the contributions of human activities and climate change to vegetation net primary productivity dynamics in China from 2001 to 2016. Sci. Total Environ. 2021, 773, 145648. [Google Scholar] [CrossRef] [PubMed]
  2. Michel, C.P.; Gerson, A.M.; Sandro, D.M.; Ana, P.B.; Jose, P.O.; Luiz, A.K. Municipal solid waste management: Integrated analysis of environmental and economic indicators based on life cycle assessment. J. Clean. Prod. 2020, 254, 119848. [Google Scholar] [CrossRef]
  3. Ren, L.; Zhou, S.; Peng, T.; Ou, X. Greenhouse gas life cycle analysis of china’s fuel cell medium- and heavy-duty trucks under segmented usage scenarios and vehicle types. Energy 2022, 249, 123628. [Google Scholar] [CrossRef]
  4. Masson-Delmotte, V.; Zhai, P.; Pirani, A.; Connors, S.L.; Péan, C.; Chen, Y.; Goldfarb, L.; Gomis, M.I.; Matthews, J.B.R.; Berger, S.; et al. IPCC, 2021: Summary for Policymakers. In Climate Change 2021: The Physical Science Basis. Contribution of Working Group I to the Sixth Assessment Report of the Intergovernmental Panel on Climate Change; Cambridge University Press: Cambridge, UK, 2021. [Google Scholar]
  5. IPCC, 2006. 2006 IPCC Guidelines for National Greenhouse Gas Inventories. In The National Greenhouse Gas Inventories Programme; IGES: Kanagawa, Japan, 2006. [Google Scholar]
  6. Pilzecker, A.; Fernandez, R.; Mandl, N.; Rigler, E. Annual European Union Greenhouse Gas Inventory 1990–2019 and Inventory Report 2021: Submission to the UNFCCC Secretariat; European Union: Minato, Tokyo, 2021. [Google Scholar]
  7. Magazzino, C.; Mele, M.; Schneider, N.; Sarkodie, S.A. Waste generation, wealth and GHG emissions from the waste sector: Is Denmark on the path towards circular economy? Sci. Total Environ. 2021, 755, 142510. [Google Scholar] [CrossRef] [PubMed]
  8. Ministry of Housing and Urban and Rural Development of the People’s Republic of China. Statistical Yearbook of Urban and Rural Construction. Available online: https://www.mohurd.gov.cn/gongkai/fdzdgknr/sjfb/tjxx/index.html (accessed on 1 May 2020).
  9. National Development and Reform Commission. The People’s Republic of China Initial National Communication on Climate Change; National Development and Reform Commission: Beijing, China, 2004. (In Chinese)
  10. National Development and Reform Commission. The People’s Republic of China Second National Communication on Climate Change; National Development and Reform Commission: Beijing, China, 2013. (In Chinese)
  11. National Development and Reform Commissiona. The People’s Republic of China Third National Communication on Climate Change; National Development and Reform Commission: Beijing, China, 2018. (In Chinese)
  12. National Development and Reform Commission. The People’s Republic of China First Biennial Update Report on Climate Change; National Development and Reform Commission: Beijing, China, 2016. (In Chinese)
  13. National Development and Reform Commission. The People’s Republic of China Second Biennial Update Report on Climate Change; National Development and Reform Commission: Beijing, China, 2018. (In Chinese)
  14. The People’s Republic of China; Zhiyuan, O.; Zuoting, S.; Minjun, S.; Dewei, Y.; Ruyin, L. Challenges and Countermeasures of “Carbon Peak and Carbon Neutrality”. J. Hebei Univ. Econ. Bus. 2021, 42. (In Chinese) [Google Scholar] [CrossRef]
  15. The Ministry of Housing and Urban-Rural Development is a ministry of the People’s Republic of China. Statistical Yearbook of Urban and Rural Construction (2010–2019). 2020. Available online: http://www.mohurd.gov.cn/xytj/tjzljsxytjgb/jstjnj/index.html (accessed on 1 May 2020).
  16. Pinjing, H.; Miao, C.; Na, Y.; Liming, S. GHG emissions from Chinese MSW incineration and their influencing factors-Case study of one MSW incineration plant in Shanghai. China Environ. Sci. 2011, 31, 402–407. [Google Scholar]
  17. Christensen, T.H.; Gentil, E.; Boldrin, A.; Larsen, A.W.; Weidema, B.; Hauschild, M.Z. C balance, carbon dioxide emissions and global warming potentials in LCA-modelling of waste management systems. Waste Manag. Res. 2009, 27, 707–715. [Google Scholar] [CrossRef]
  18. Córdoba, V.E.; Santalla, E.M. Estimation of long-term methane emissions from Mechanical-Biological Treatment waste through biomethane potential test. Environ. Technol. 2021, 1–13. [Google Scholar] [CrossRef]
  19. Dong, L.; YanTing, L.; HanWen, G.; WenJing, L.; HongTao, W. Study on the generation potential of methane and odorous compounds from the MSW with different landfill age. China Environ. Sci. 2018, 38, 4576–4580. [Google Scholar] [CrossRef]
  20. FEA. National Invenroty Report for the German Greenhouse Gas Inventory 1990–2019; FEA: Tallahassee, FL, USA, 2021. [Google Scholar]
  21. Brown, P.; Cardenas, L.; Choudrie, S.; Karagianni, E. UK Greenhouse Gas Inventory, 1990 to 2019. 2021. Available online: https://naei.beis.gov.uk/reports/reports?report_id=1015 (accessed on 1 May 2020).
  22. EPA. Inventory of U.S. Greenhouse Gas Emissions and Sinks: 1990–2019; EPA: Washington, DC, USA, 2021. [Google Scholar]
  23. ECCC. National Inventory Report 1990–2019: Greenhouse Gas Sources and Sinks in Canada; ECCC: Decatur, Georgia, 2021.
Figure 1. Actual gas production of landfill gas in ten years.
Energies 15 06711 g001
Figure 2. Quantity of GHG emissions from landfill sites.
Energies 15 06711 g002
Figure 3. Per capita quantity of landfill.
Energies 15 06711 g003
Figure 4. Per capita GHG emissions from landfill sites.
Energies 15 06711 g004
Figure 5. Implied emission factor of CH4 from landfill sites.
Energies 15 06711 g005
Table 1. Urban and rural solid waste treatment and disposal options in China.
2010201120122013201420152016201720182019
Collection amount (104 t)22,12123,13823,91923,74424,51825,79727,02828,26829,46131,078
Harmless treatment (104 t)
Sanitary landfill11,13512,51813,79114,39815,00616,17116,78017,12516,70016,093
Incineration2432280238764931567465777957932211,22613,492
others2184945133634805256187288371029
Non-harmless treatment (104 t)80717320573940523357252416731094684455
Harmless ratio (%)64687683869094969899
Quantity of landfill disposal (104 t)19,20619,83819,53018,45018,36318,69518,45318,21917,38416,548
Ratio for landfill disposal (%)86.8285.7481.6577.774.972.4768.2864.4559.0153.25
Table 2. Greenhouse gas emission factors for the waste sector.
EmissionSourceDisposalAtmosphere
Concentration Trend
Global Warming Potential
(100 Years)
CO2
(from Fossil C)
Burning of plasticIncineration treatmentIncrease+1
CO2
(from Biogenic C)
Biomass burns
Biological breathing
Incineration
Landfill
Composting
Anaerobic digestion
Stable0
CH4Biomass under anaerobic conditions
Break down methane
Anaerobic digestionIncrease+25
N2OReleased from the soil, fertilizer is producedFertilizer applicationsIncrease+298
Publisher’s Note: MDPI stays neutral with regard to jurisdictional claims in published maps and institutional affiliations.

