Article

Investigation of the Flow Intensity in an Inverted Seven-Point Well Pattern and Its Influence on the EOR Efficiency of S/P Flooding

1
Research Institute of Experimental Testing, Xinjiang Oilfield Company, Petro China, Karamay 834000, China
2
Key Laboratory of Exploration and Development of Conglomerate Reservoirs, Petro China, Karamay 834000, China
3
Xinjiang Conglomerate Reservoir Laboratory, Karamay 834000, China
4
Key Laboratory of Oilfield Chemistry, Xinjiang Oilfield Division, Petro China, Karamay 834000, China
5
State Key Laboratory of Petroleum Resources and Prospecting, China University of Petroleum (Beijing), Beijing 102249, China
*
Author to whom correspondence should be addressed.
Energies 2022, 15(18), 6632; https://doi.org/10.3390/en15186632
Submission received: 7 August 2022 / Revised: 28 August 2022 / Accepted: 31 August 2022 / Published: 10 September 2022
(This article belongs to the Special Issue Oil Field Chemicals and Enhanced Oil Recovery)

Abstract

:
Polymer and surfactant (S/P) binary flooding is a widely used chemical flooding technology for enhanced oil recovery (EOR). However, it is mostly used in the five-spot well pattern, and there is little research on the effect of well patterns on its flow law and EOR efficiency in the reservoir. In this paper, the flow intensity of S/P flooding in an inverted seven-spot well unit and its EOR efficiency are investigated. Based on the theoretical derivation and simulation, the flow distribution at different positions in the inverted seven-spot well pattern unit was calculated. The oil displacement efficiency was evaluated by simulating different flow intensities with various flow velocity. The microscopic residual oil of the core at the end of displacement was scanned and recognized. The 2D model was used to simulate the well pattern to clarify the EOR of S/P flooding. The results show that the swept area in the well unit can be divided into the strong swept region (>0.2 MPa); medium swept region (0.1–0.2 MPa); weak swept region (0.03–0.1 MPa); and invalid swept region (<0.03 MPa), according to the pressure gradient distribution. Compared to the five-spot well pattern, the inverted seven-spot well pattern featured a weak swept intensity, but a large swept area and lower water cut rise rate. Increasing the flow intensity can improve oil displacement efficiency, and disperse and displace continuous cluster remaining oil. The 2D model experiments show that the incremental oil recoveries by SP flooding after water flooding in the five-spot well pattern and inverted seven-spot well pattern are 25.73% and 17.05%, respectively. However, the ultimate oil recoveries of two well patterns are similar by considering the previous water flooding.

1. Introduction

With the development of the world economy, oil and gas resources will still be the world’s main energy sources in the next few decades, and the steady production of conventional oil fields is a significant guarantee of international energy security [1]. By technical means, oil exploitation is divided into three stages: primary oil recovery (by natural energy); secondary oil recovery (by water injection); and tertiary oil recovery (by EOR technologies). However, most oilfields in China are continental reservoirs, and the formation structure and fluid are complicated, leading to limited oil recovery from water flooding [2,3]. Considering the economic benefits and sustainable development of reservoirs, it is imperative to adopt other development methods to enhance oil recovery. To strengthen the development effect and improve the oil recovery, researchers have proposed many EOR methods based on a large number of indoor experiments and pilot applications. Chemical flooding [4,5,6,7], profile particles agent flooding [8,9,10], foam flooding [11,12], etc., are beneficial methods to continuously enhance oil recovery after water flooding. Moreover, the binary system of polymer and surfactant (S/P flooding) can fully combine the mobility control ability of the polymer and interfacial tension reduction ability of surfactant [13,14,15]. S/P flooding has been widely used in Shengli oilfield, Dagang oilfield, Karamay oilfield, etc., which can enhance the oil recovery by more than 20% in field tests [16].
In the production of oil and gas fields, the selection, deployment and adjustment of well pattern is an important part of the development plan design, and it is also one of the key factors to improve economic benefits [17,18]. S/P flooding is mostly used in the five-spot well pattern [19,20], and the injection-production unit is a one-injection-one-production development model. However, with the continuous development of the oil field, the depth of the reservoir increases, and productivity decreases will lead to decreases of economic benefit [21]. In order to achieve efficient development after water flooding, it is often necessary to dynamically change the well pattern [22,23]. Compared with the five-spot well pattern, the triangular inverted seven-spot well pattern unit is a one-injection-two-production development model, which has a large swept area and a weaker flow field intensity [24,25]. The practice of oilfield development shows that it is necessary to adjust the well pattern in the later stage of development, while it is difficult to adjust the existing square well pattern to a triangular well pattern [26,27]. Therefore, it is necessary to explore the adaptability of S/P flooding in the inverted seven-spot well pattern. For that, clarifying the influence of flow field intensity on oil displacement effect and remaining oil distribution becomes a particularly important issue [28]. The flow intensity directly determines the swept volume and strength of the injected fluid, which also affects the properties of the polymer and physical parameters such as the relative permeability of the reservoir. It can be theoretically deduced and calculated by the superposition principle of potential, and it can also be simulated and analyzed by numerical simulation software [29]. In petroleum engineering, the flow intensity is usually characterized by flow velocity and pressure gradient. Through the distribution of pressure gradient field and flow field, the swept volume and strength in the well pattern unit can be compared and analyzed.
Meanwhile, the intensity affects the occurrence of remaining oil [30,31]. The classification mechanism of remaining oil mainly includes the shape factor method [32,33] and the mechanical method [34,35]. According to the shape of the remaining oil and its contact relationship with the pores, the remaining oil types can be divided into cluster, slit, film, intergranular and corner [36]. When the flow intensity increases, its swept strength increases, dispersing the continuous cluster remaining oil. However, the channeling phenomena such as fingering increases significantly after the flow intensity increases, which affects the final oil displacement effect.
The above research has a mature understanding of the influence of flow field intensity on EOR and the distribution of remaining oil. However, there are few studies on the correlation between the flow field intensity and the well pattern, especially in the flow regularity and oil displacement effect of S/P system in the inverted seven-spot well pattern. Therefore, the pressure gradient and flow field distribution in the inverted seven-spot and five-spot well pattern are calculated by combining theoretical derivation and numerical simulation. Strong, medium, weak and invalid swept regions are divided according to the range of pressure gradient. The injection rate is used to characterize different flow field intensities, then, the displacement efficiency and remaining oil occurrence state of different swept intensities are determined. Combined with the two contents, different injection rates can be used to characterize the different areas between injection-production wells in the inverted seven-spot well pattern, and the remaining oil types and potential displace direction can be determined. Finally, the EOR effect of the inverted seven-spot and five-spot well pattern was compared through a large plate flooding experiment.

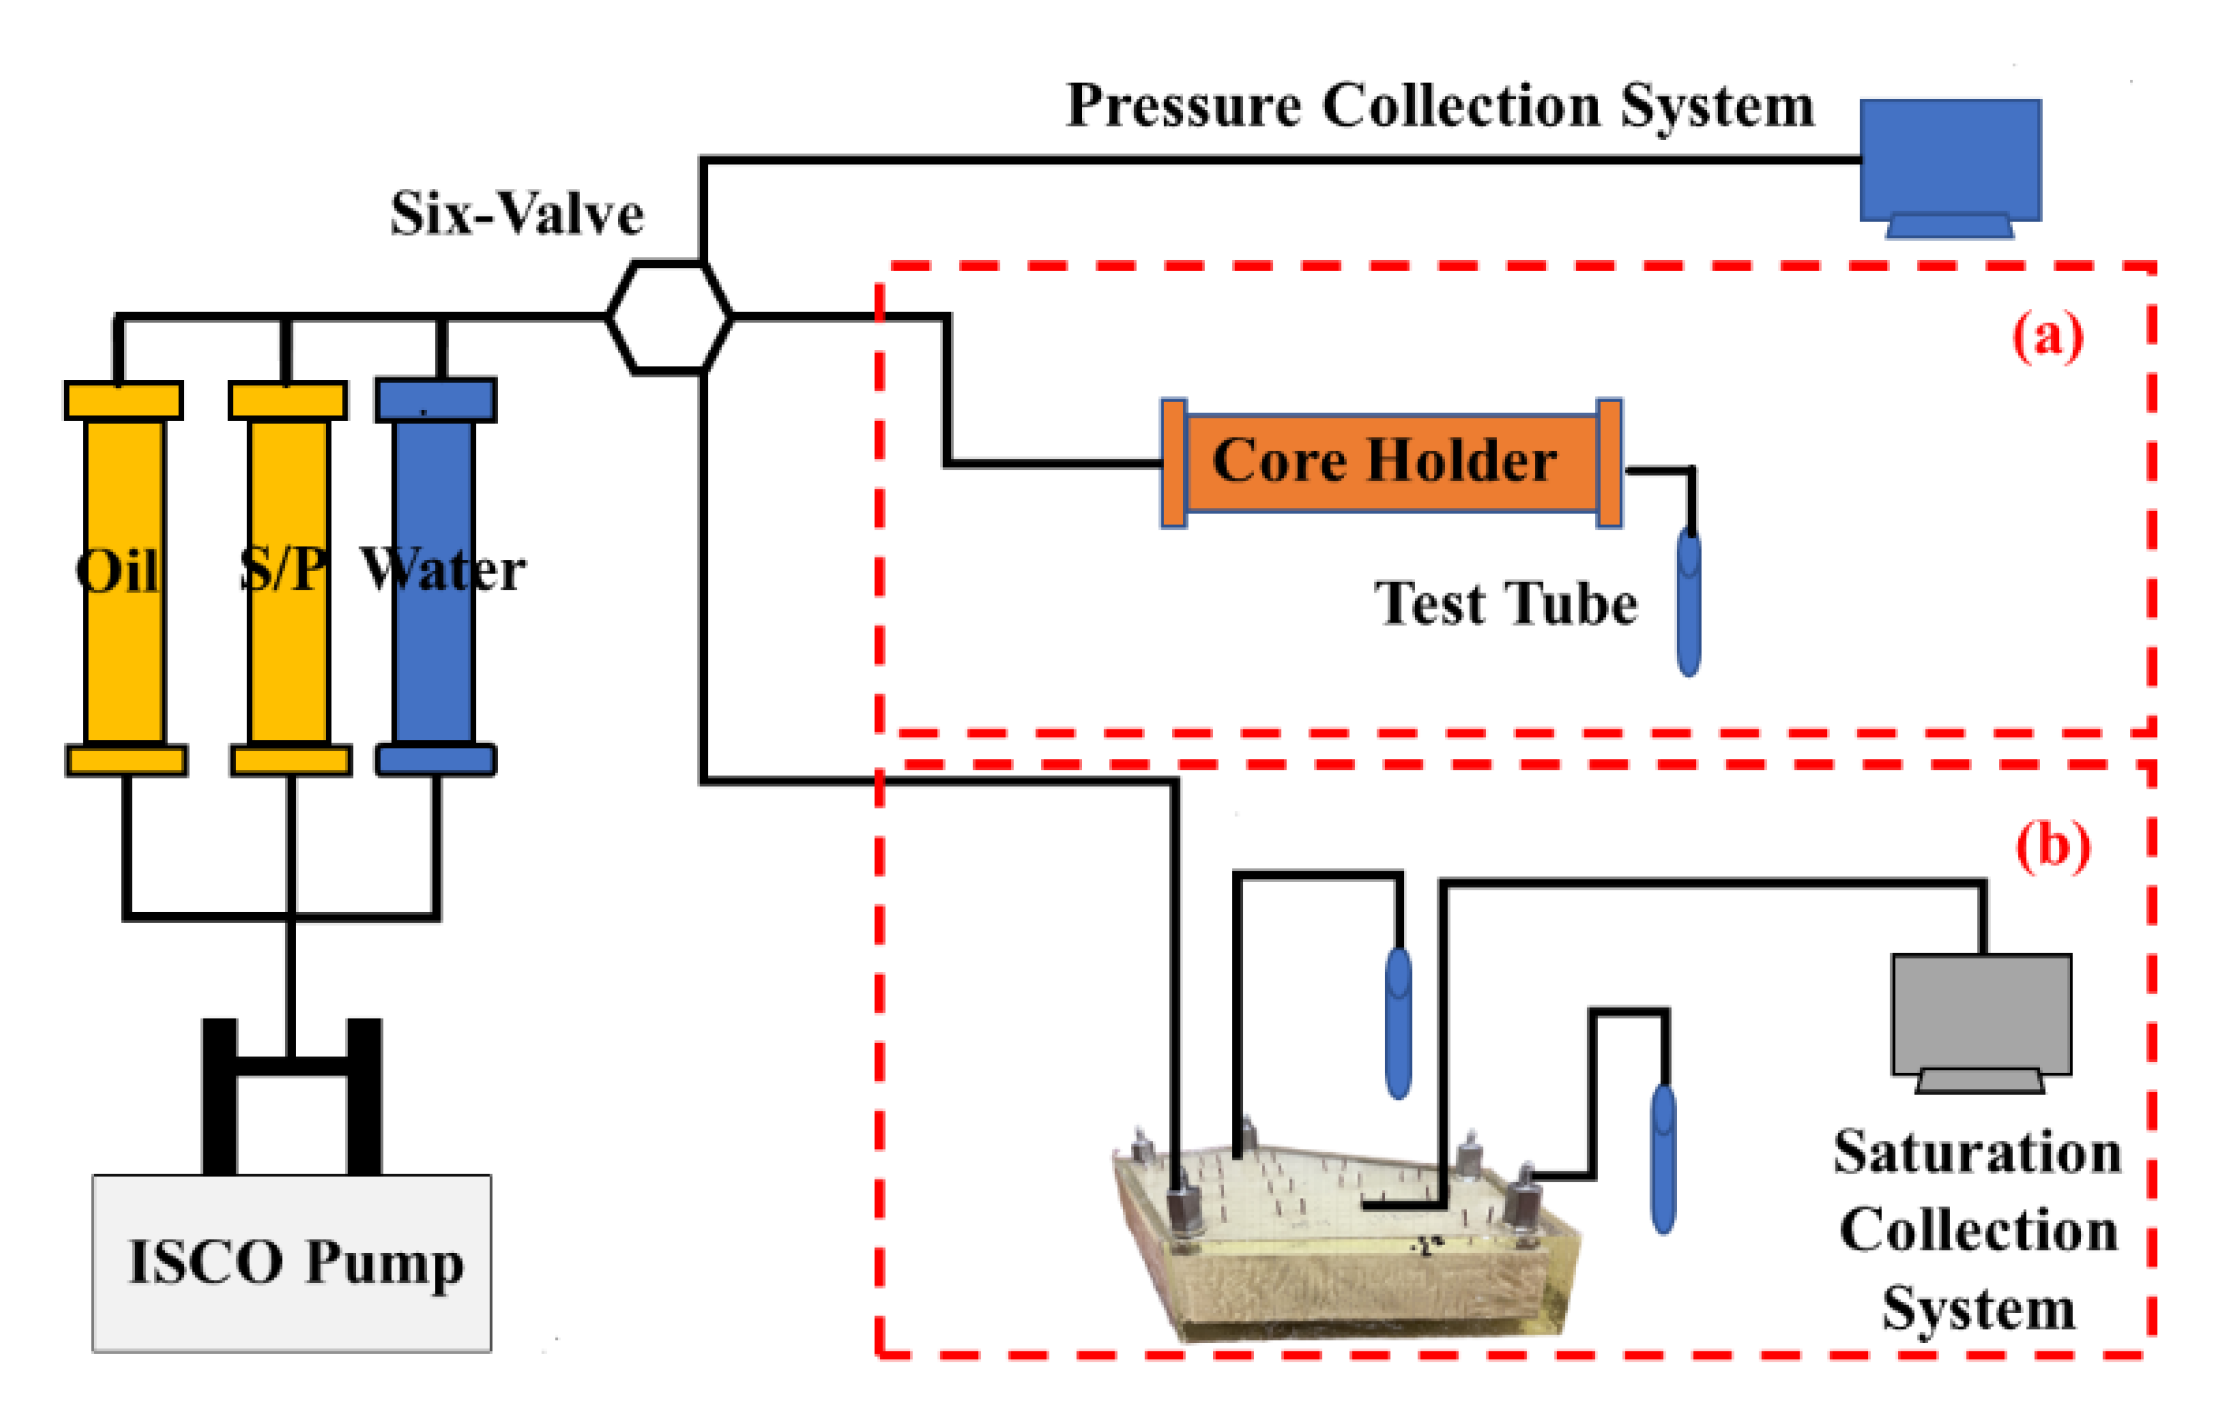
2. Materials and Methods

2.1. Material

Crude oil and solution: The oil used in the oil displacement experiments was crude oil from the Karamay Oil field in China, and the viscosity of the oil was 35.7 mPa·s at 35 °C. The simulated water was prepared based on the salt formation of water in the Karamay oil field by adding inorganic salt into deionized water, according to the formula shown in Table 1. The polymer was a common polymer purchased from Hengju Beijing Co. (Beijing, China) with a molecular weight of 1000 million. The surfactant was petroleum sulfonate produced in the Karamay oil field.
Cores: Artificial sandstone cylinder cores with a diameter of 2.5 cm, a length of 30 cm, and a permeability of 300 mD and 50 mD were used to conduct the core flooding experiments. The pentagonal plate core with an inverted seven-spot well pattern and a square plate core with a five-spot well pattern were used for the oil displacement experiments to compare the EOR effects of the two well patterns.

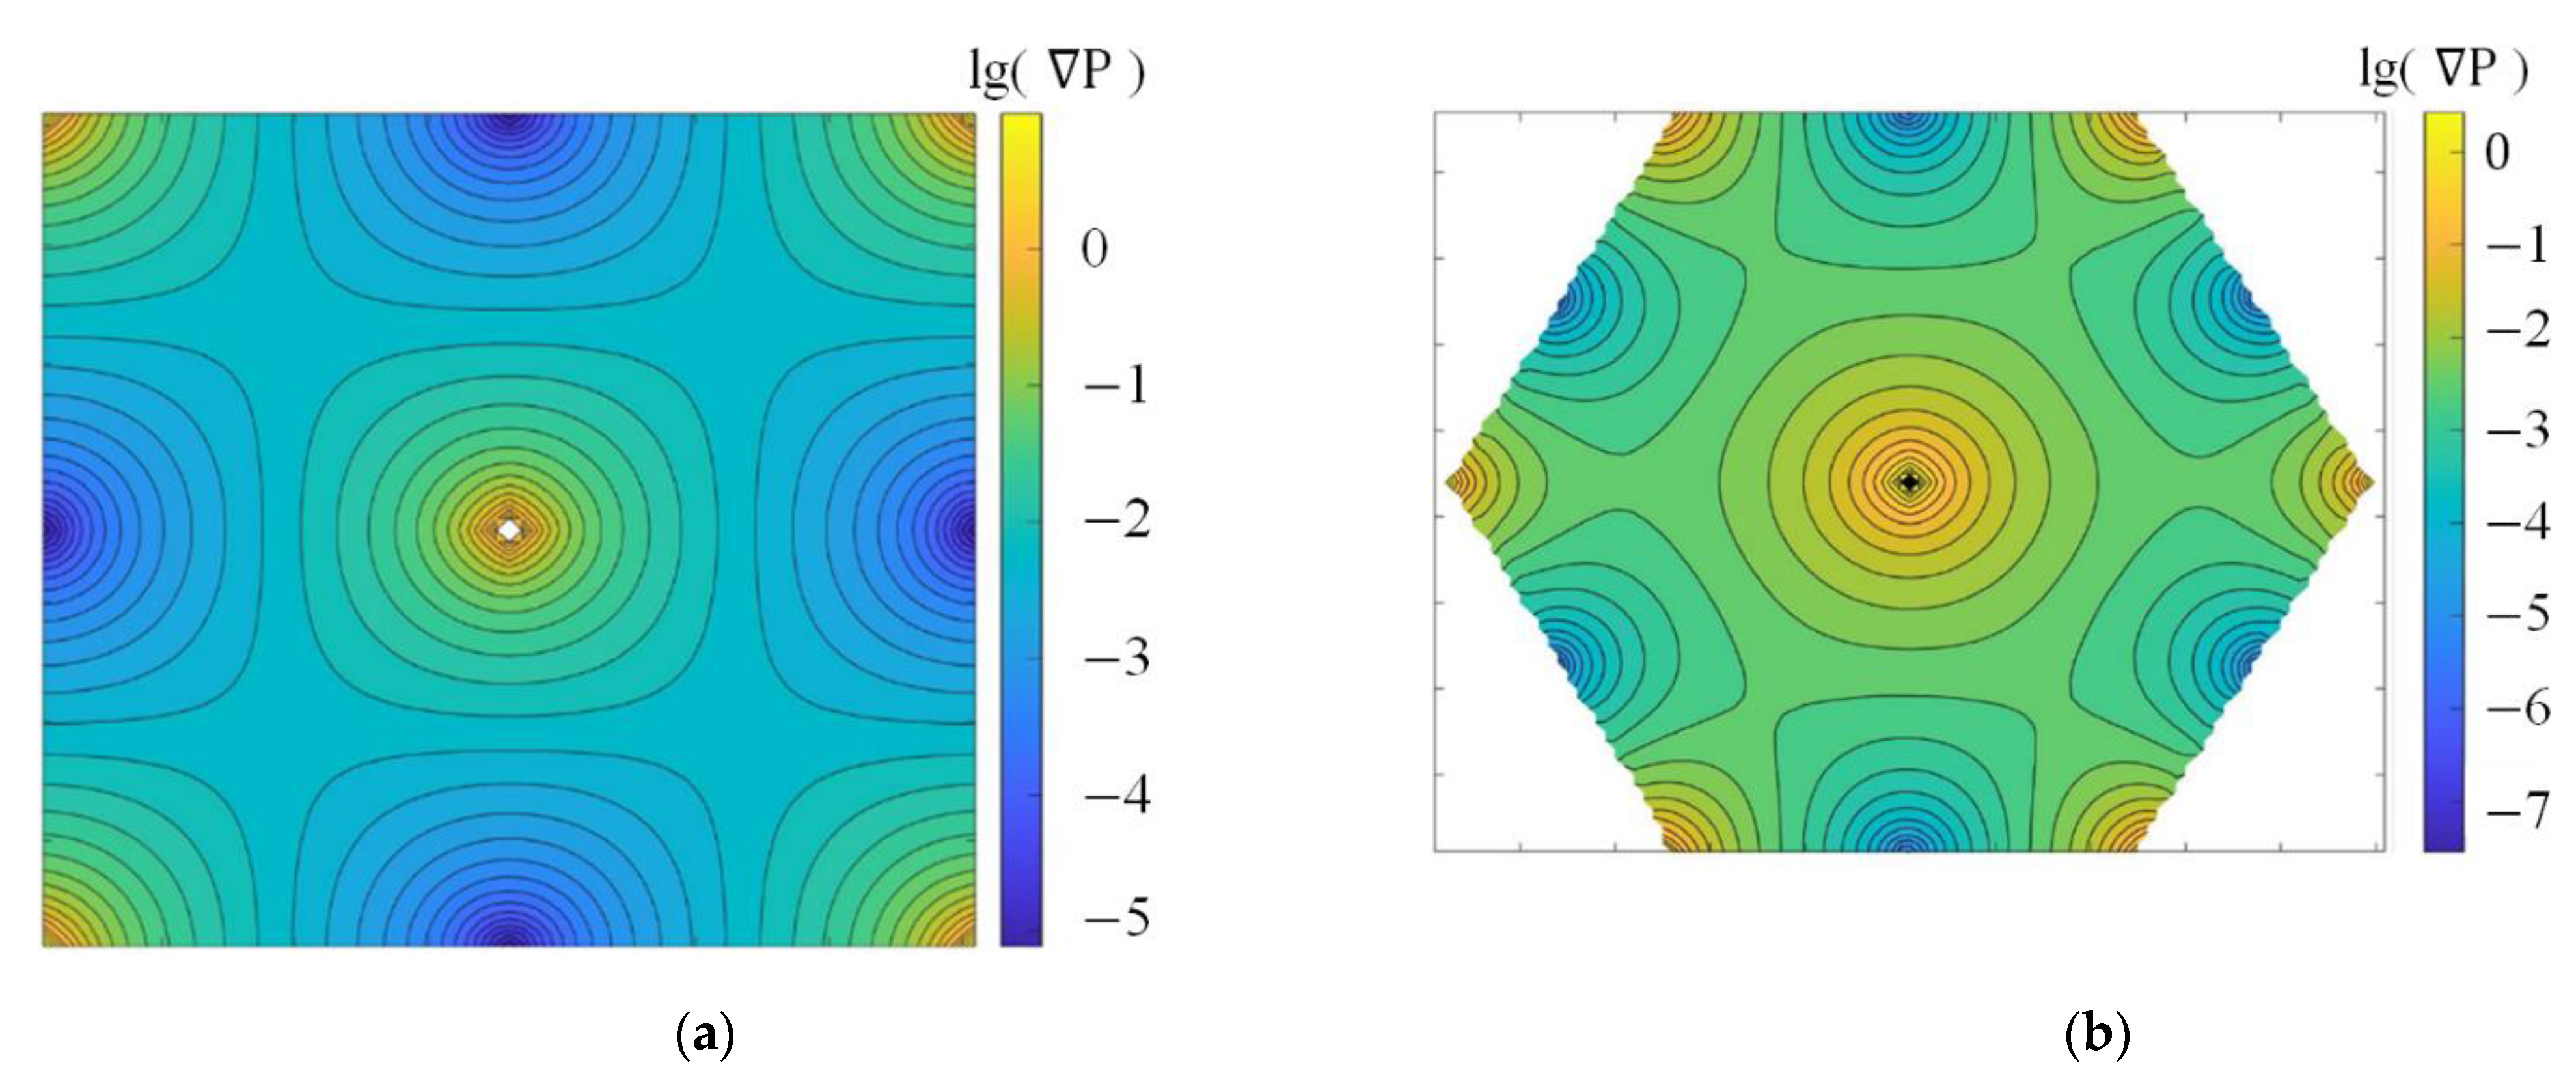
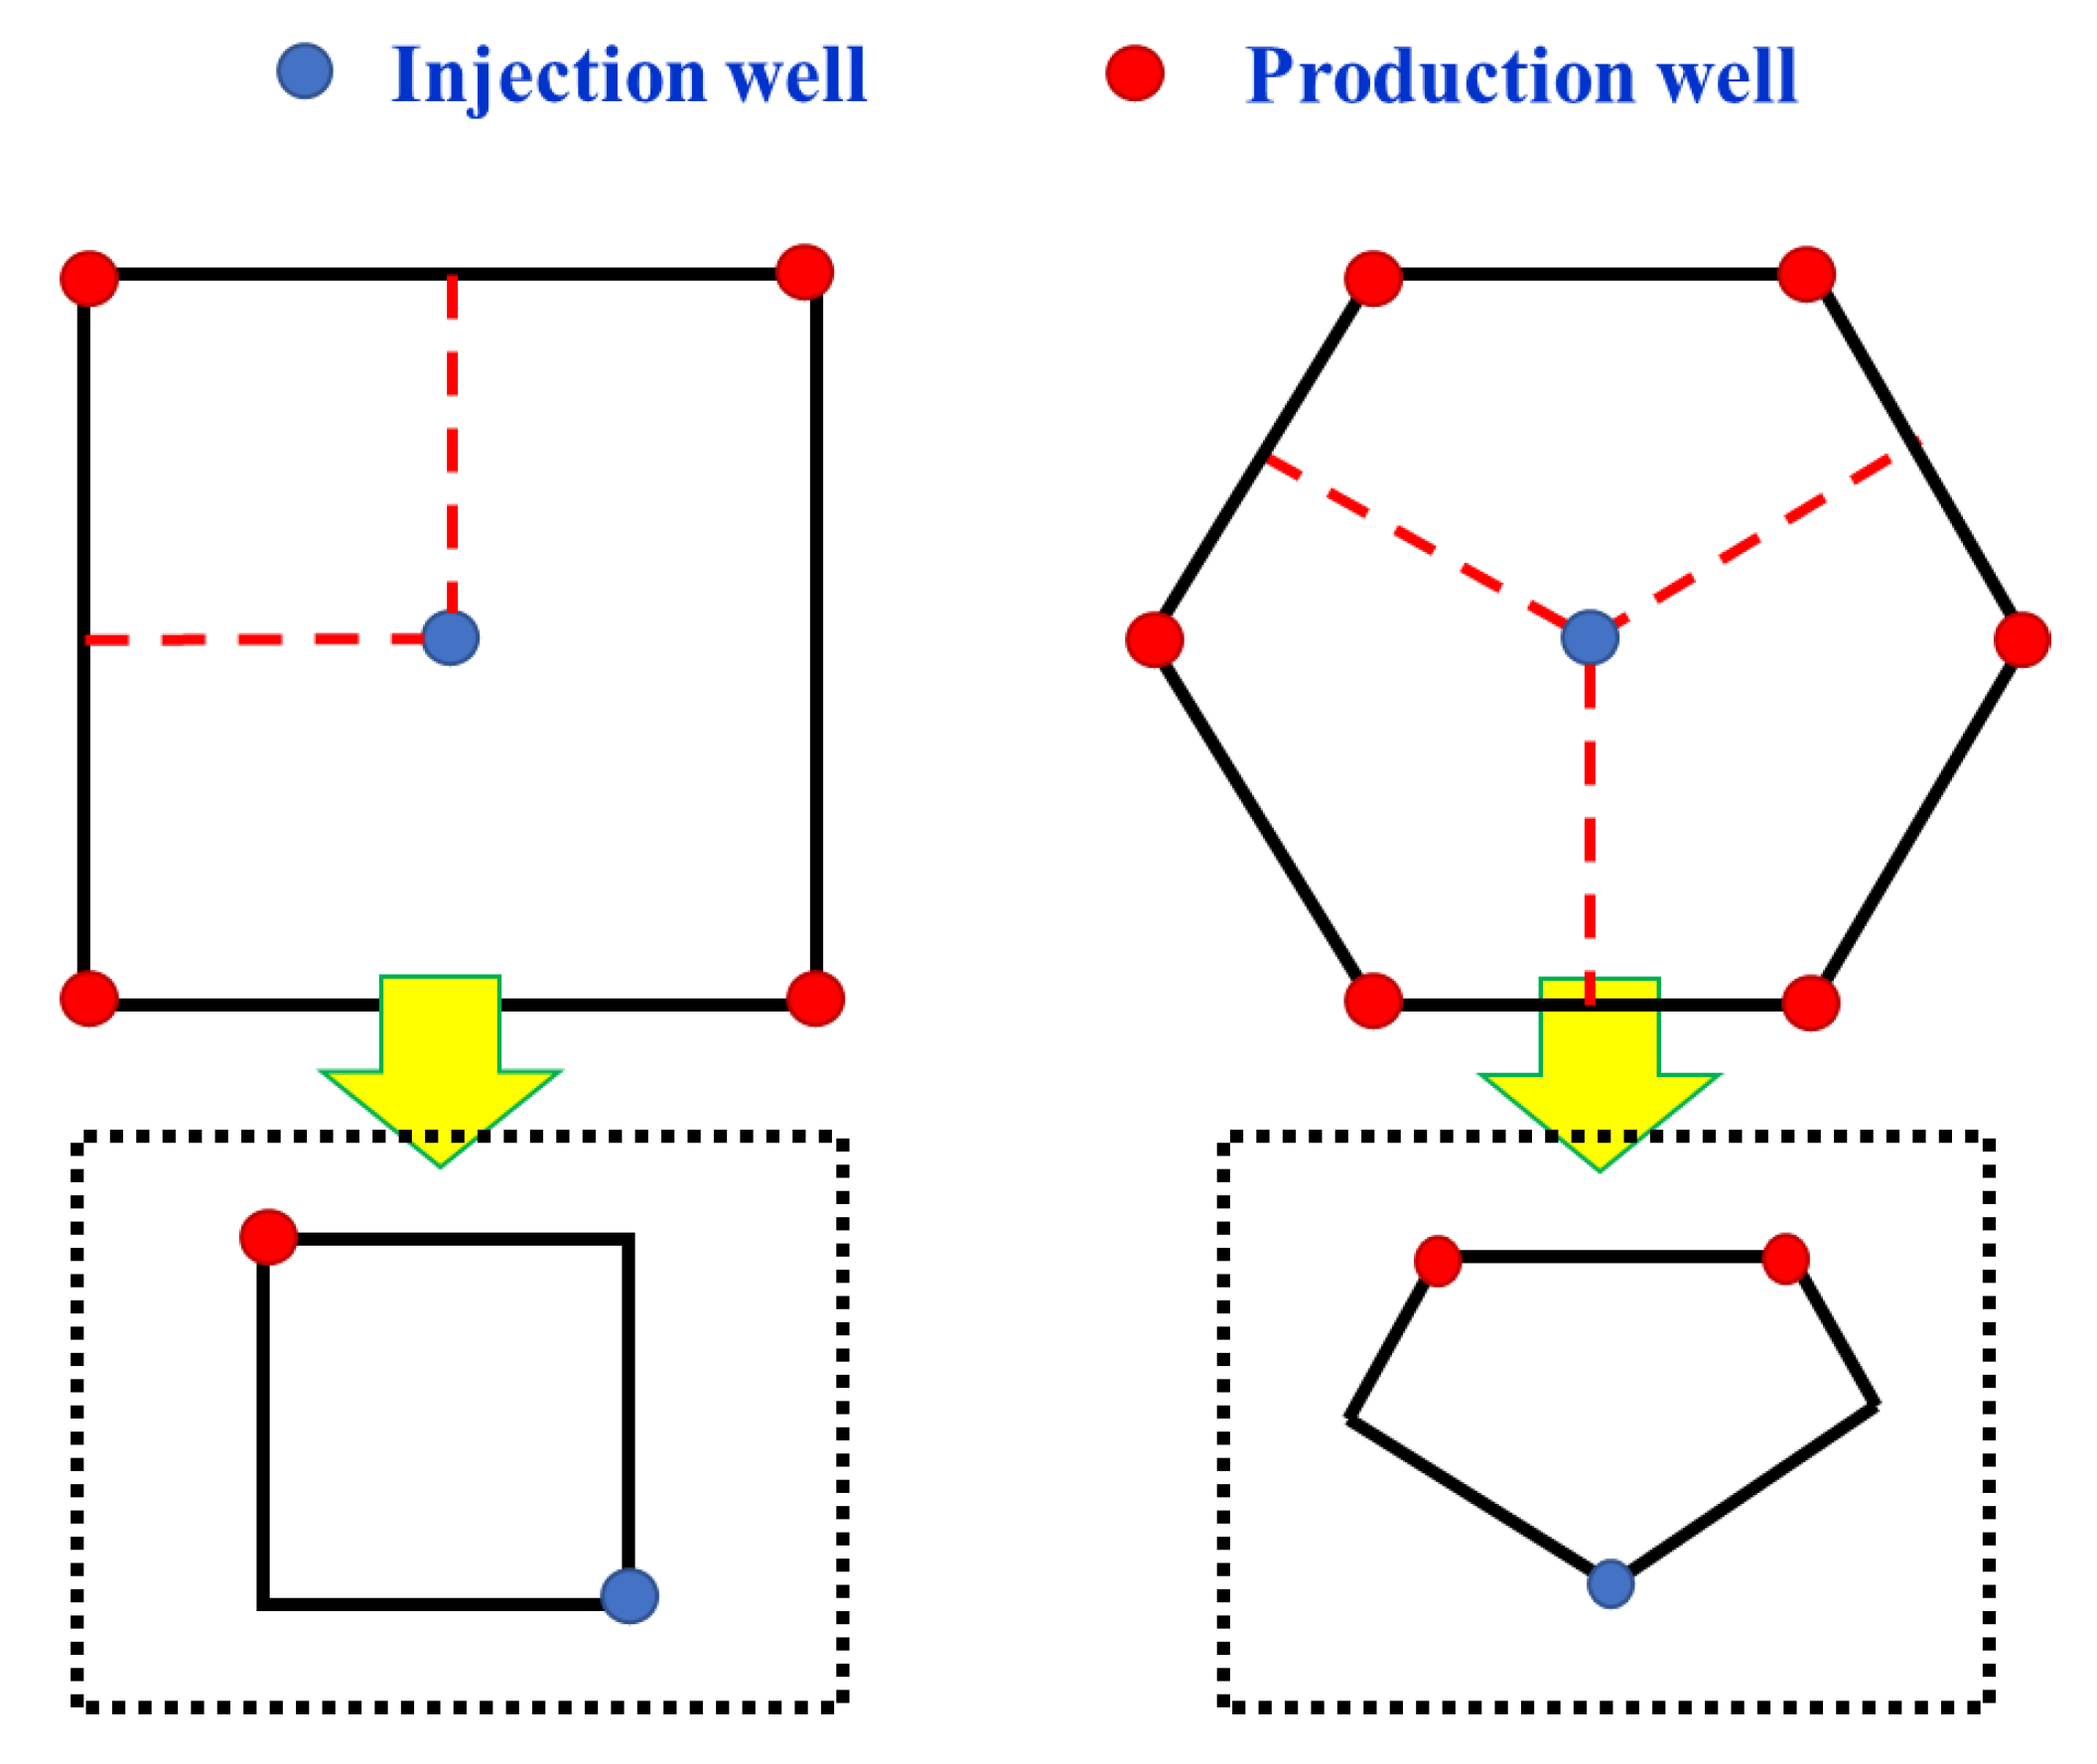
2.2. Calculation of the Flow Field Intensity of Inverted Seven-Spot Well Pattern

The five-spot well pattern is the main injection-production model applied by chemical flooding in the oil field. Compared with the one-injection and one-production unit of the five-spot well pattern, the inverted seven-spot well pattern is a one-injection and two-production unit. There are obvious differences in the distribution of the pressure gradient and flow field intensity between the two units, which ultimately affect the application efficiency of the S/P flooding. Here, the flow field intensity of the inverted seven-spot well pattern is characterized by theoretical calculation. The difference in pressure gradient and flow field between the two kinds of well patterns is compared by combination with the numerical simulation.
Assuming that there is an inverted seven-spot well pattern in the infinite homogeneous formation, one of the basic repeating units was selected as the research object, which is considered to not to be affected by the wells outside. The fluid flow is the stable plane flow of a homogeneous incompressible liquid. The injection-production well spacing is represented by A; the six production wells are A, B, C, D, E and F; the corresponding production is q a , q b , q c , q d , q e , and q f ; and the water injection volume of the central injection well is q o . The rectangular coordinate system x-o-y is established with the injection well as the coordinate origin, and the well location distribution is shown in Figure S1.
The pressure distribution in the basic unit is reflected by the superposition of potential, as shown in Equation (1).
Φ = K μ P
where Φ is the velocity potential, 10−3 μm2/(mPa·s)·MPa; K is the reservoir permeability, 10−3 μm2; μ is the viscosity of the oil, mPa·s; and P is the pressure, MPa.
Then, the pressure can be represented by Equation (2):
p ( r ) = Q μ 2 π K h ln r + C
where p is the production of per unit formation thickness, m3/(d·m); C is a constant determined by boundary conditions.
The final pressure gradient can be calculated by Equation (3).
d p d r = ( P O P A ) l n ( a ) 1 + β O ( 3 ) β C + β E ( 2 ) β D ( r w ) 1 + β O × x A x x x A 2 + y y A 2 + β B x B x x x B 2 + y y B 2 + β C x C x x x C 2 + y y C 2 + β D x D x x x D 2 + y y D 2 + β E x E x x x E 2 + y y E 2 + β F x F x x x F 2 + y y F 2 + β O x x O x x O 2 + y y O 2 2 + y A y x x A 2 + y y A 2 + β B y B y x x B 2 + y y B 2 + β C y C y x x C 2 + y y C 2 + β D y D y x x D 2 + y y D 2 + β Z y E y x x E 2 + y y E 2 + β F y F y x x F 2 + y y F 2 + β O y y O x x O 2 + y y O 2 2
where β B = q B q A , β C = q C q A , β D = q D q A , β E = q E q A , β F = q F q A , β O = q O q A .
Keeping the injection-production well space as 50 m, the distribution diagram of the pressure gradient can be drawn as Figure 1a under the constant pressure injection (25 MPa) and production (5 MPa). The effective swept area was defined as the pressure gradient being greater than 0.08 MPa/m, and the diagrams of the effective swept area are shown in Figure 1b, in which the effective swept area accounted for 50.2%.
The above equations can be used to calculate the pressure and flow field distribution of single-phase flow in the inverted seven-spot well pattern. The tNavigator (a simulator) was used to simulate the pressure field in the inverted seven-spot well pattern, and the results are shown in Figure 2a. The simulation results are consistent with those in Figure 1, which is derived from Equation (3). In order to further clarify the difference between the inverted seven-spot well pattern and five-spot well pattern, the tNavigator was used to simulate the two well patterns under the condition of single-phase flow and two-phase flow, and MATLAB was used for subsequent processing. The well spacing in the two models was 120 m to ensure the reliability of the results. The injection well was injected quantitatively, and the production well was produced at a constant pressure. The pressure simulation results are shown in Figure 2.
The stable pressure data are derived, and the central difference method in Equations (4) and (5) is used to solve the distribution of the pressure gradient in the X and Y directions. It should be noted that the solution at the grid boundary adopts the unilateral difference method, that is, the boundary grid and adjacent grid are used for difference (Figure S2).
P x | ( m , n ) = P ( m + 1 , n ) P ( m 1 , n ) 2 × Δ x P y | ( m , n ) = P ( m , n + 1 ) P ( m , n 1 ) 2 × Δ y
P x | ( M , N ) = P ( M , N ) P ( M 1 , N ) Δ x P y | ( M , N ) = P ( M , N ) P ( M , N 1 ) Δ y
Considering the actual conditions of the oil field, we divided the unit area into four regions, according to the pressure gradient: strong swept region, medium swept region, weak swept region, and invalid swept region. The specific classification criteria are shown in the Table 2.

2.3. Effect of Flow Field Intensity on S/P Flooding

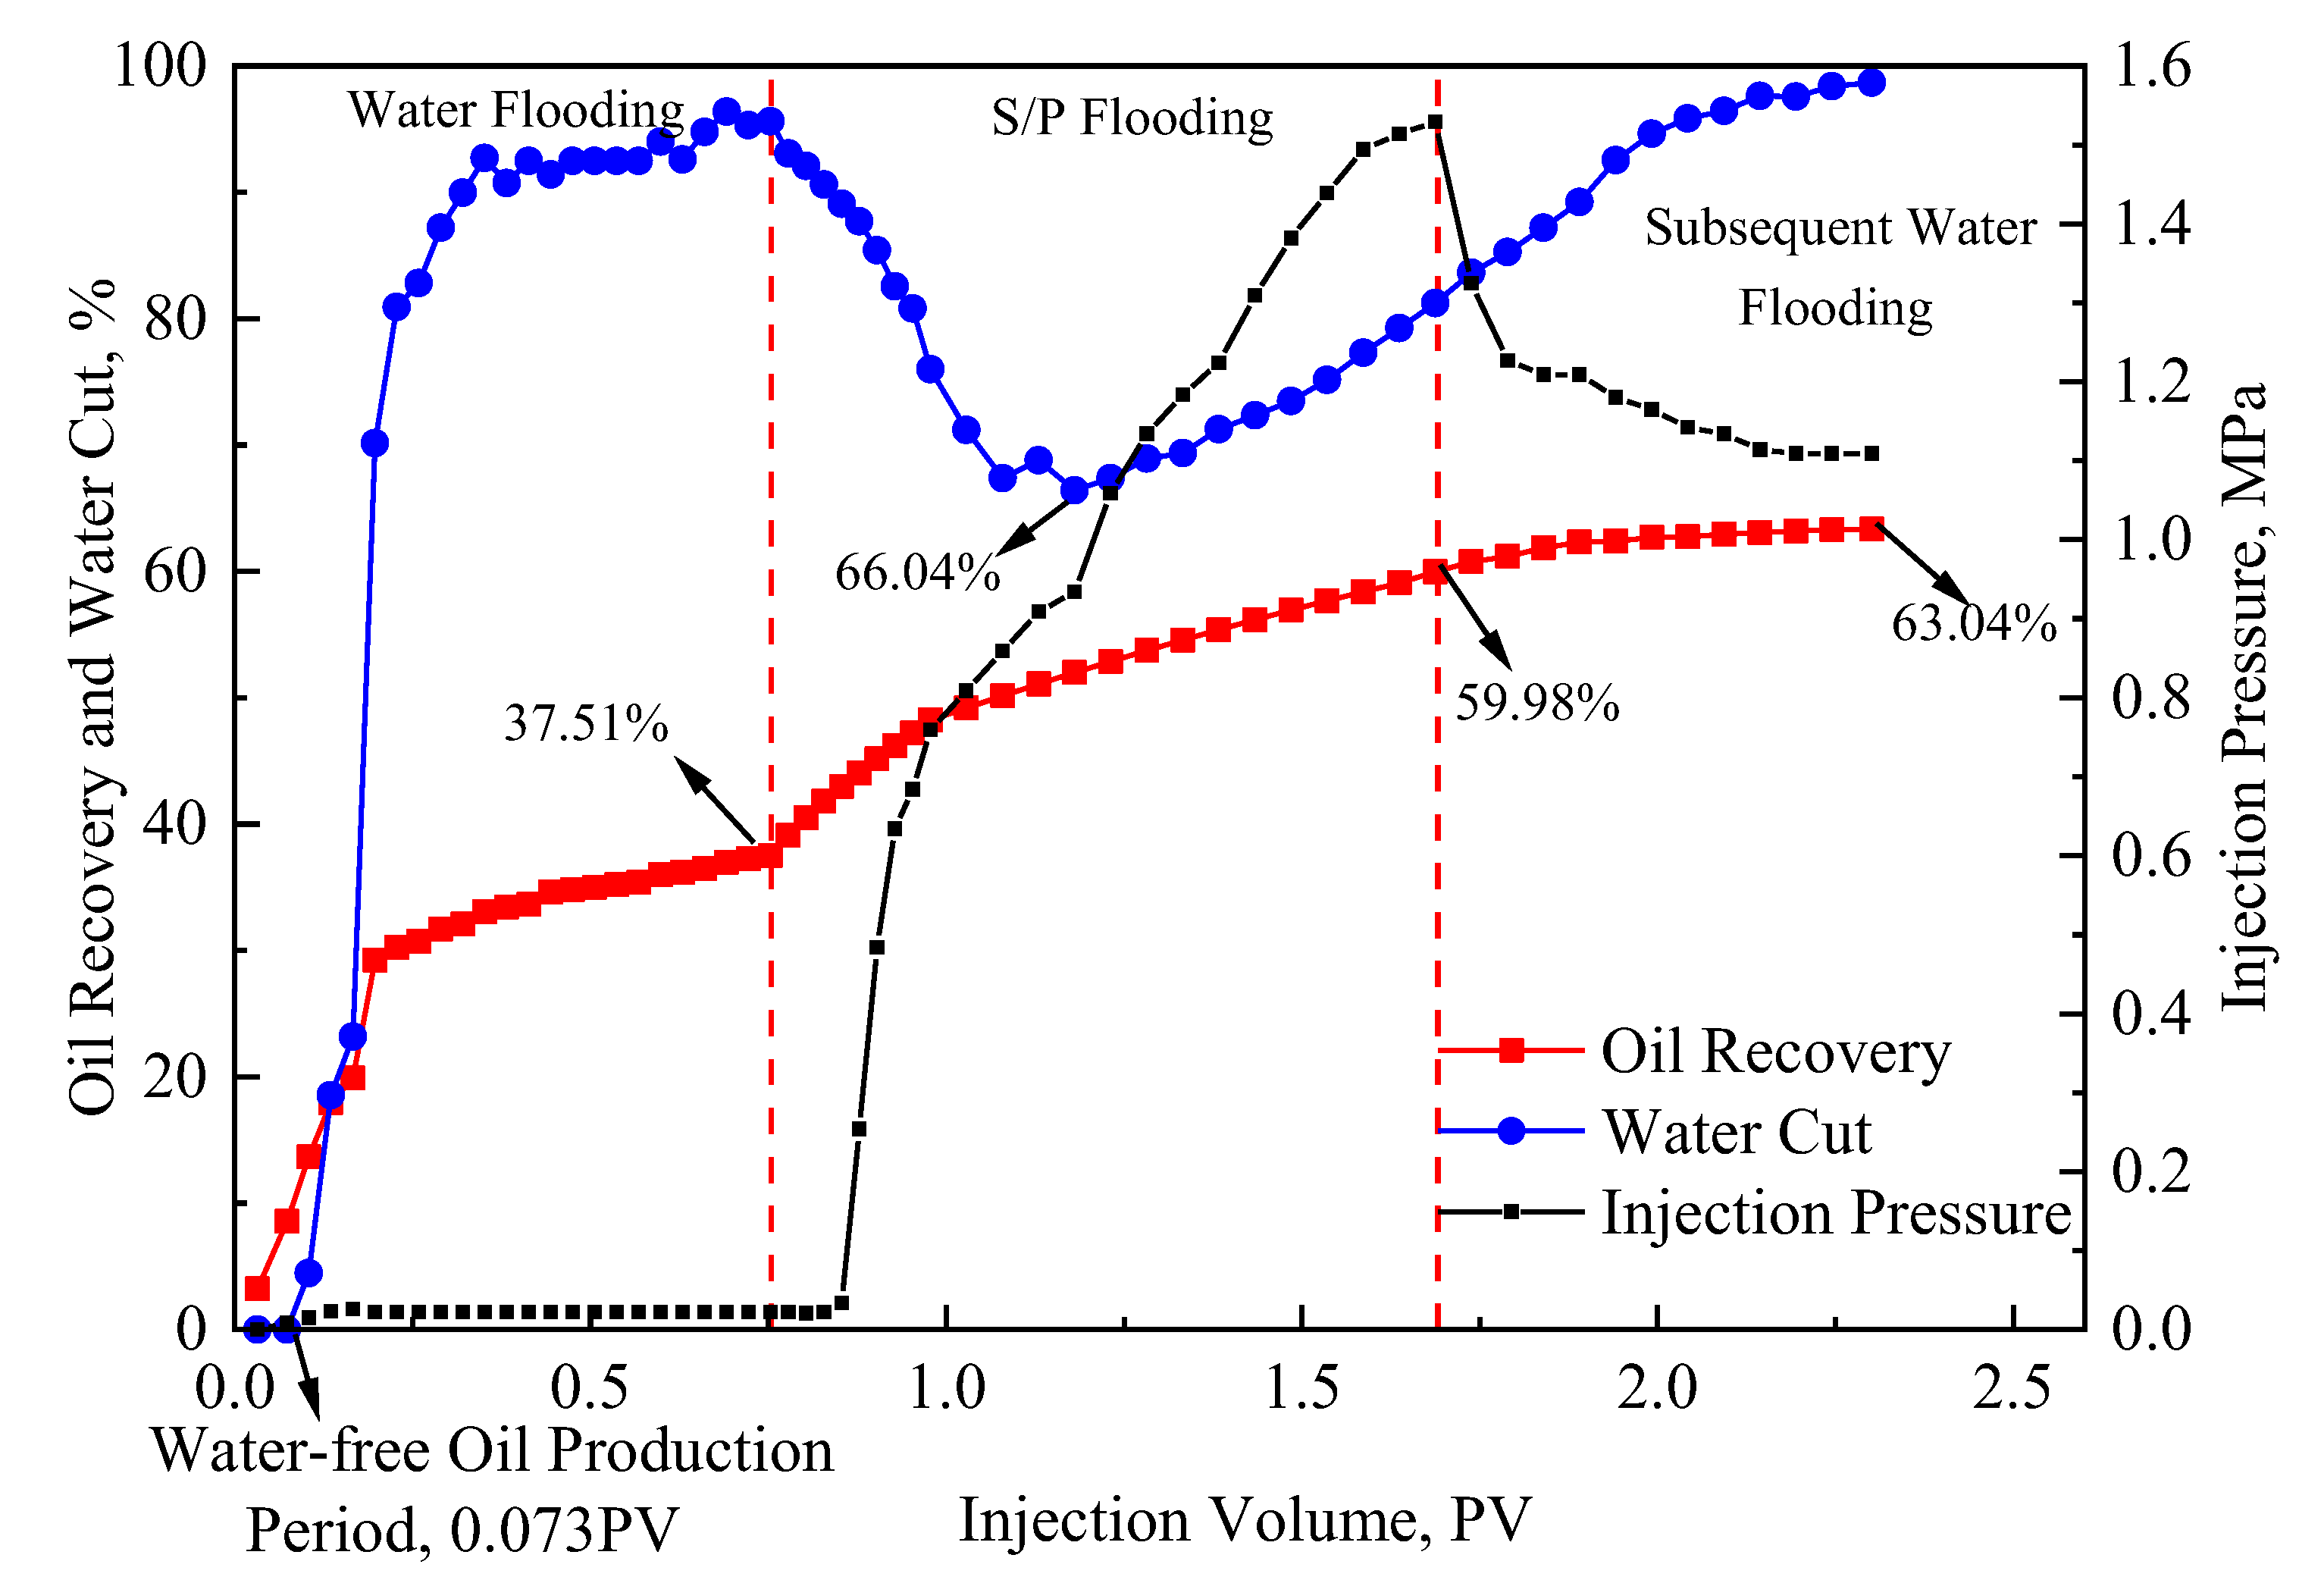
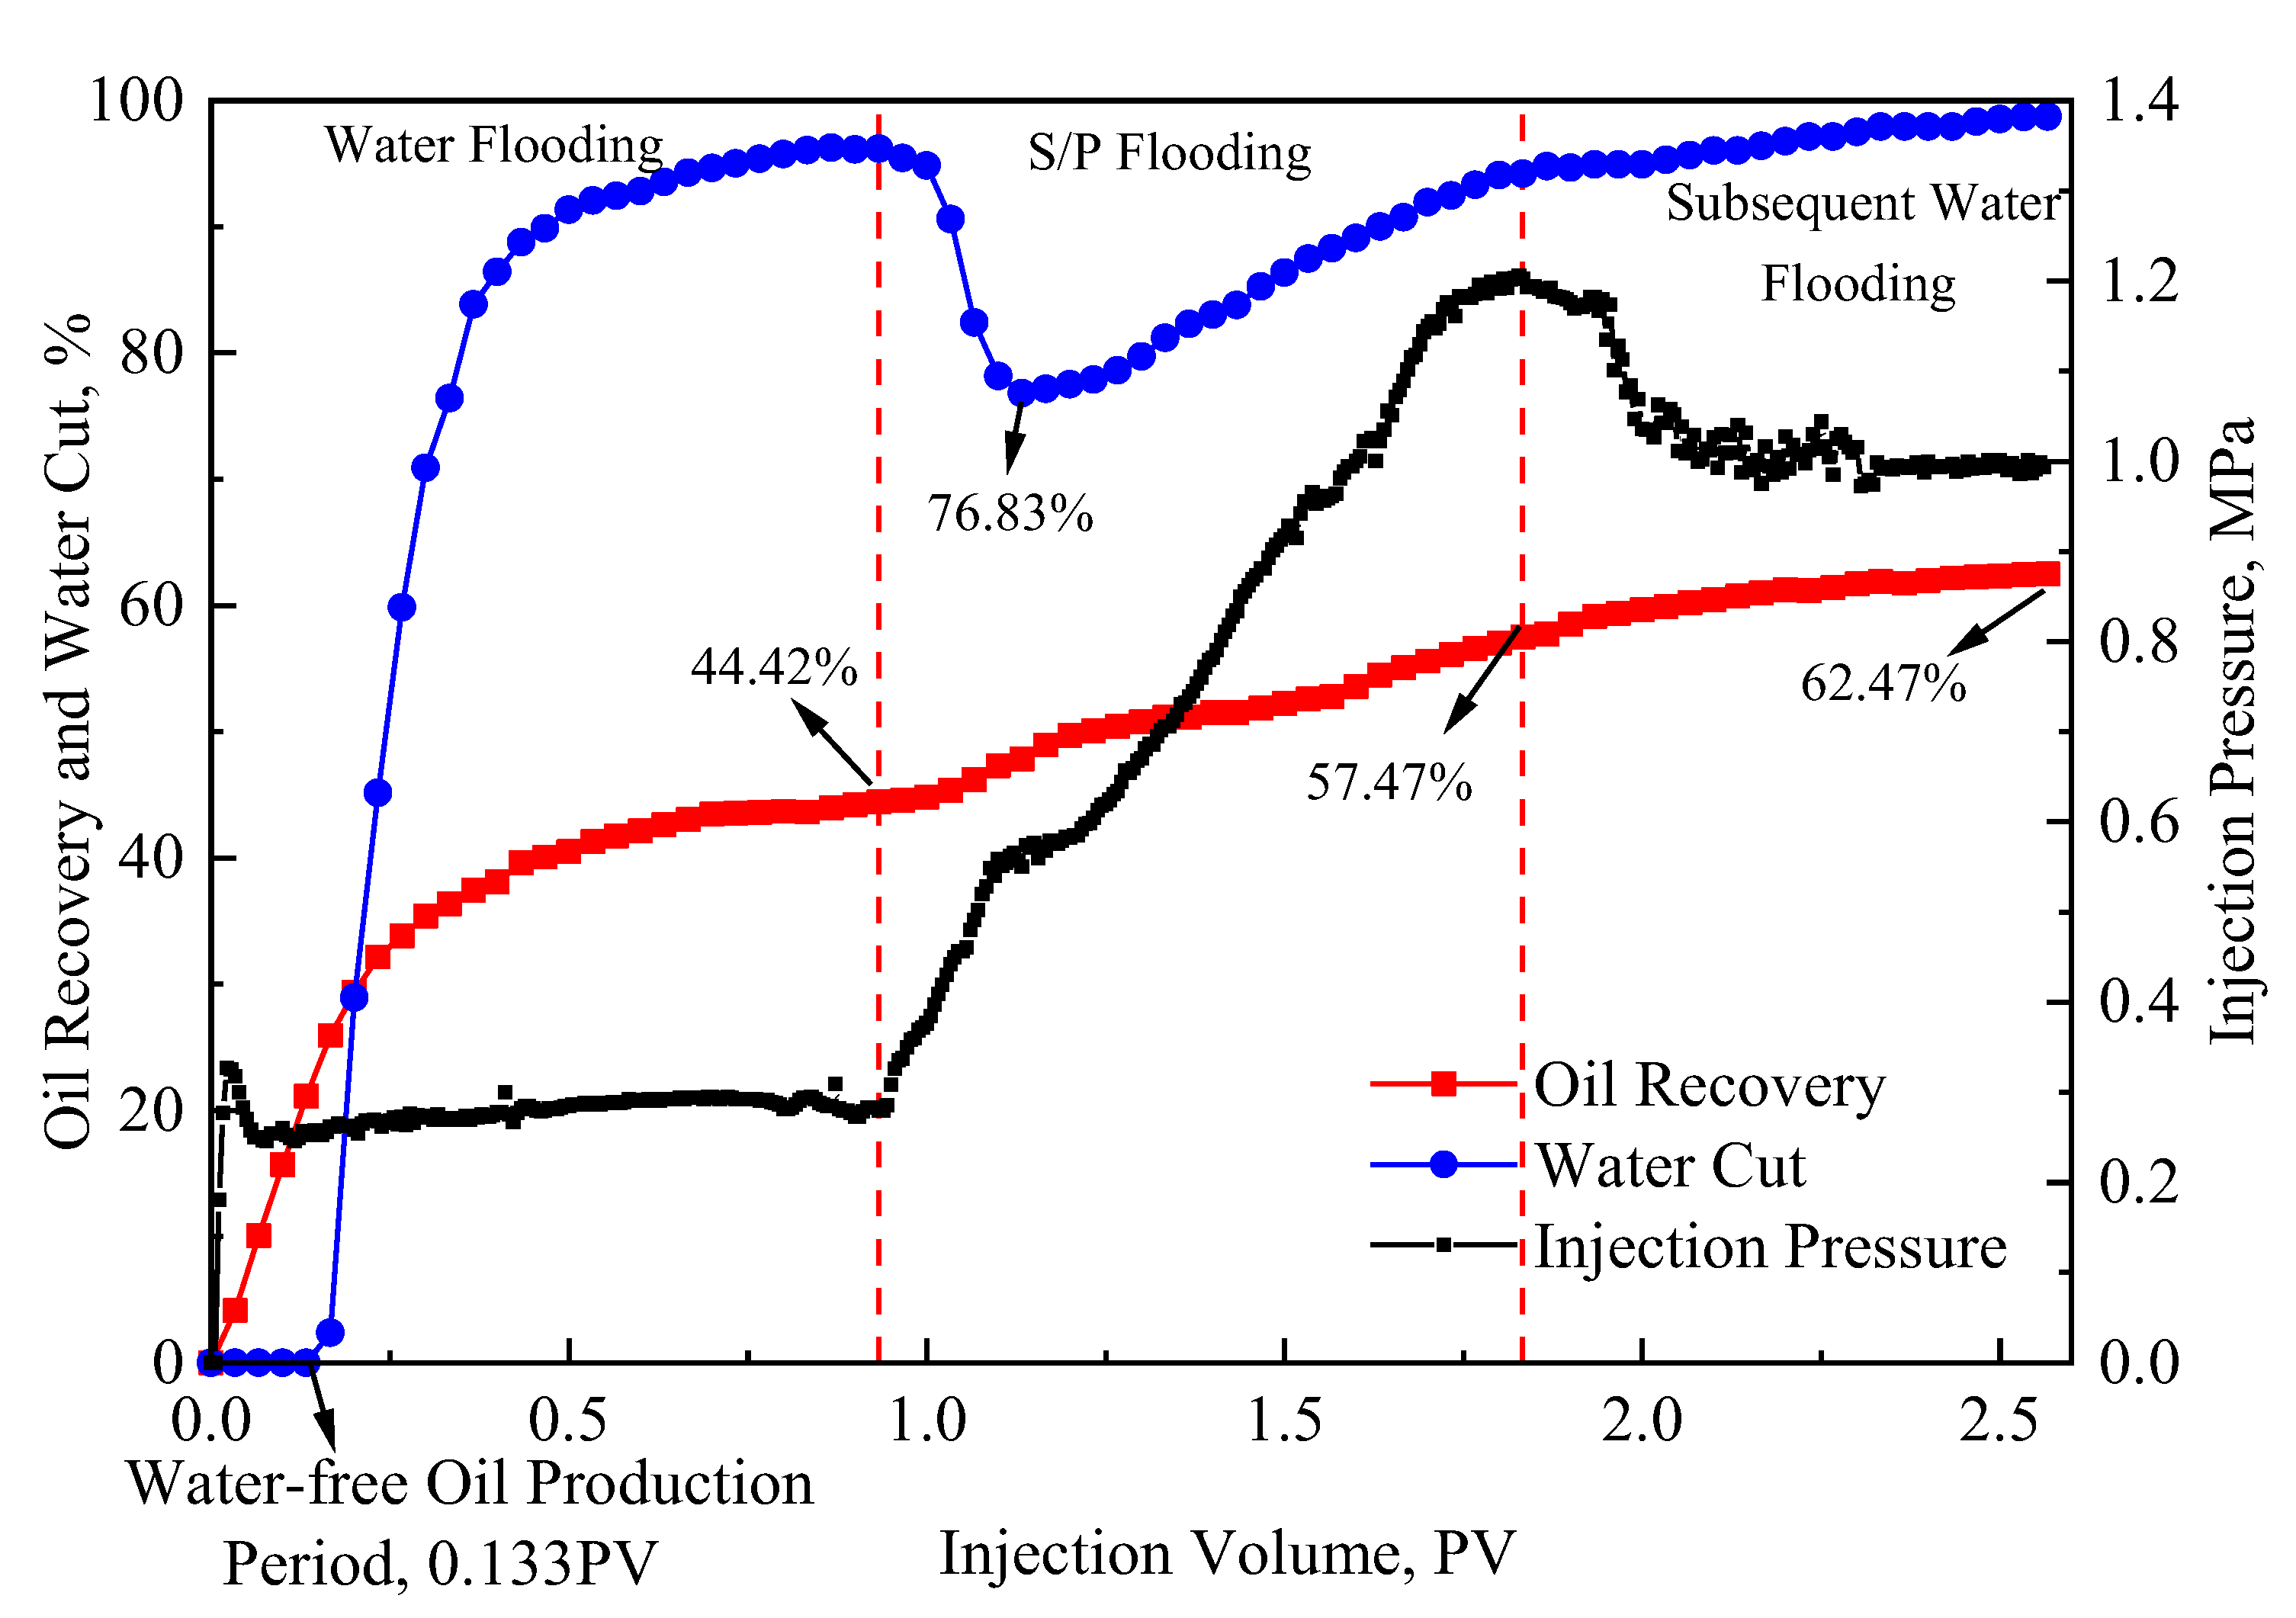
2.3.1. EOR Efficiency of S/P Flooding

Based on the calculation of the flow intensity of the inverted seven-spot well pattern, 12 groups of S/P flooding experiments were conducted at different injection rates, viscosity, and core permeability. The procedure is (1) vacuum the cores (cylinder core, 2.5 cm × 30 cm) using a vacuum pump for 2 h; (2) connect the experiment process shown in Figure 3a; (3) saturate water and calculate the porosity according to the mass conserved method; (4) saturate oil and age for 2 days at the formation temperature of 35 °C; (5) flood the S/P to the water cut (up to 98%); (6) change the experimental parameters according to the scheme shown in Table 3. The injection pressure and produced liquid were recorded during the whole experiment.

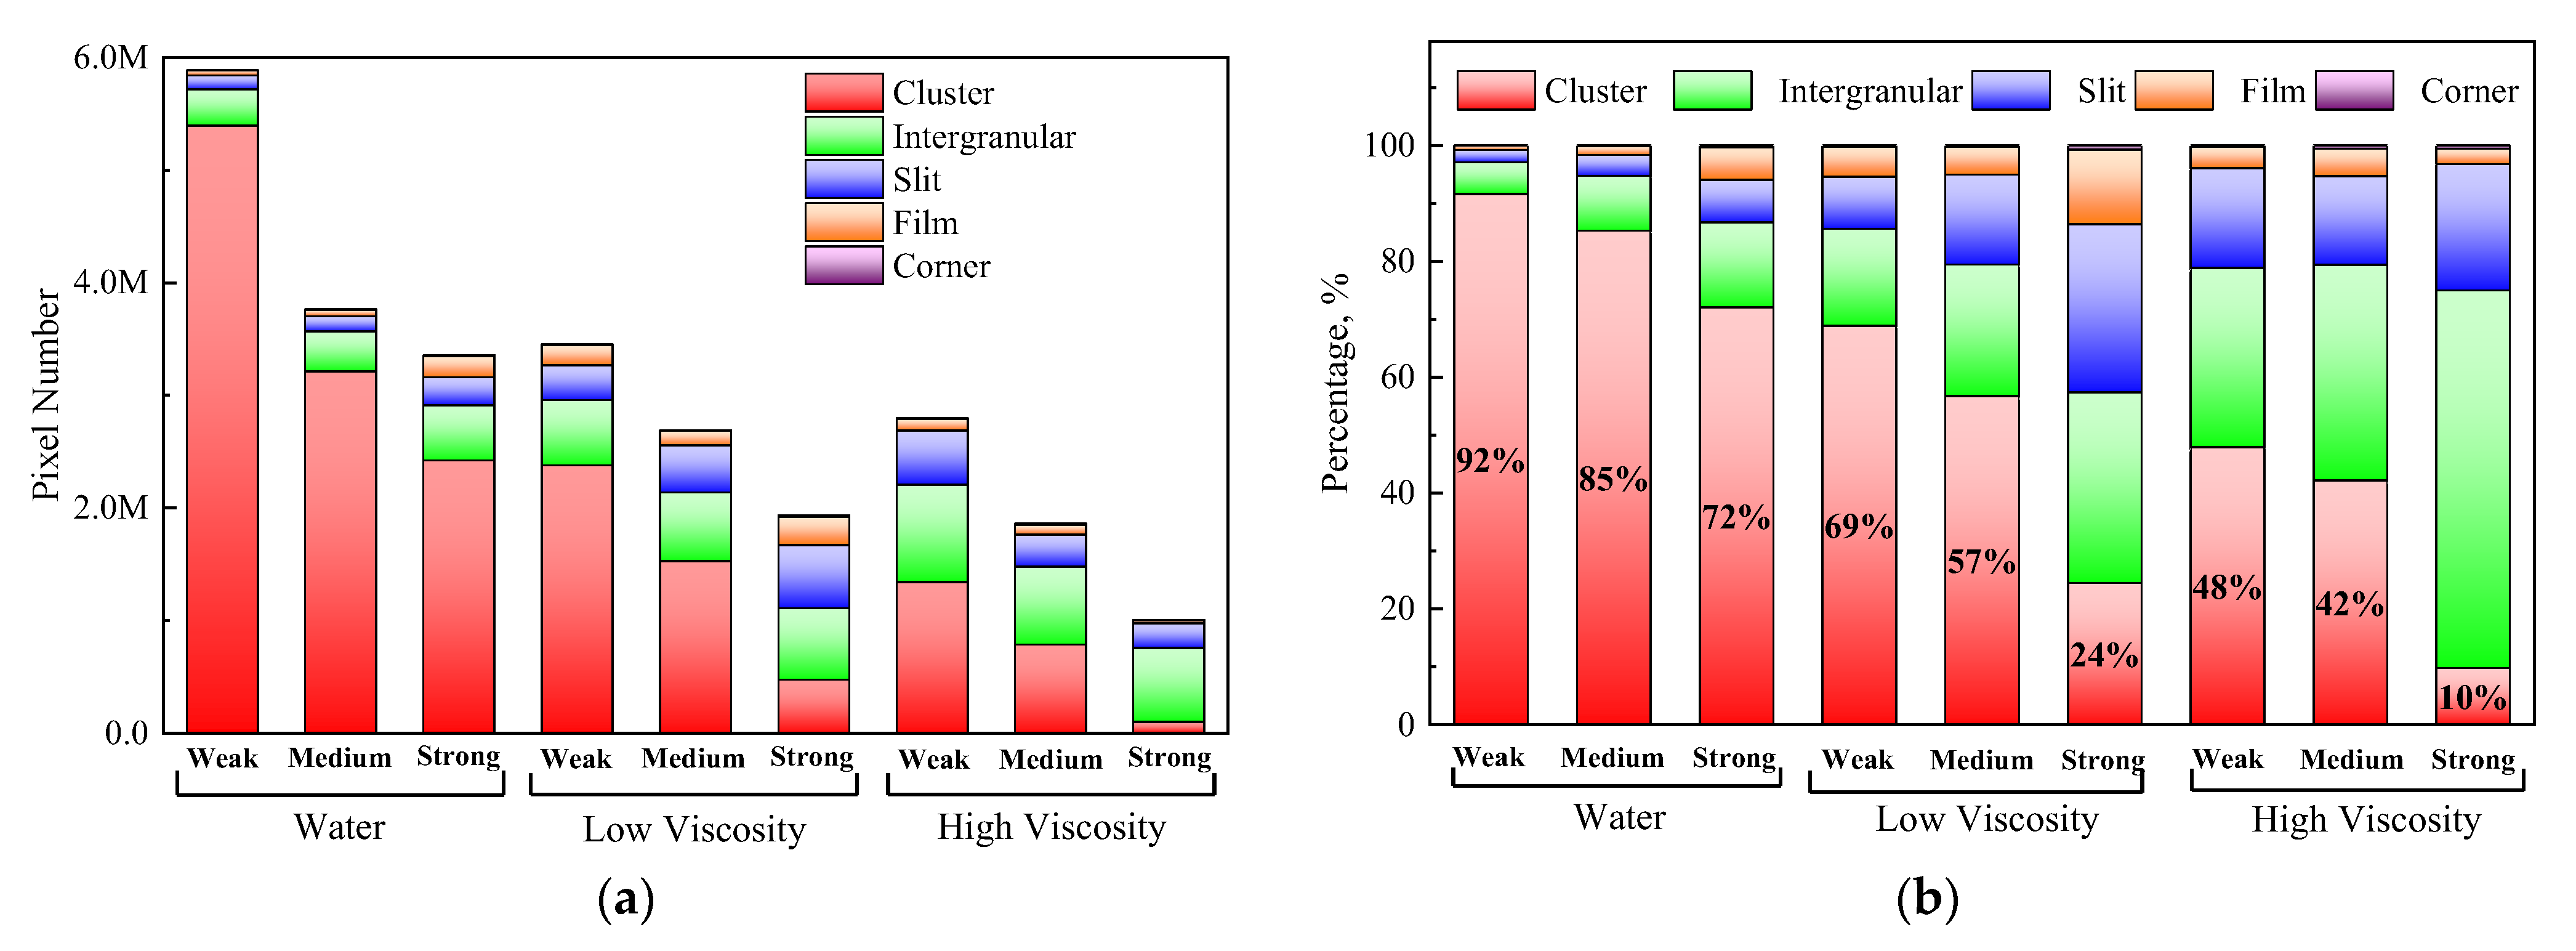
2.3.2. Occurrence Regularity of the Remaining Oil

The cores of 12 groups after displacement in Section 2.3.1 were sliced and made into core slices. Based on the properties of aromatic ring compounds in oil that can produce fluorescence under ultraviolet irradiation, the remaining oil can be identified by observing core slices with an ultraviolet fluorescence microscope. To avoid damage to the grain and pore structure during core slice fabrication, at least 3 flakes per core should be ground and 8 images should be taken for each slice. The remaining oil area can be identified by MATLAB, according to the color area of the image. The remaining oil can be divided into slit remaining oil, film remaining oil, cluster remaining oil, intergranular remaining oil, and corner remaining oil, according to the morphology and contact relationship with the pore and matrix. In order to compare the influence of S/P on remaining oil, the water flooding experiment under the same conditions was supplemented.

2.4. EOR Efficiency of S/P Flooding in Reverted Seven-Spot Well Pattern

A plate core with a reverted seven-spot well pattern was designed based on the injection-production ratio of 1:2, as shown in Figure 4. Then, the oil displacement experiment was carried out using the following process: (1) vacuuming the cores (plate core with reverted seven-spot well pattern) using a vacuum pump for 10 h; (2) connecting the experiment process shown in Figure 3b; (3) saturating water and calculating the porosity according to the mass conserved method; (4) saturating oil and aging for 2 days at the formation temperature of 35 °C; (5) flooding water to the water cut up to 95%, then injecting S/P solution for 0.9 PV and, finally, injecting the second water to the water cut up to 98%. In order to compare the influence of the well pattern on the EOR efficiency, an equal-area plate core with a five-spot well pattern was designed, and the displacement was conducted under the same condition.

3. Results and Discussion

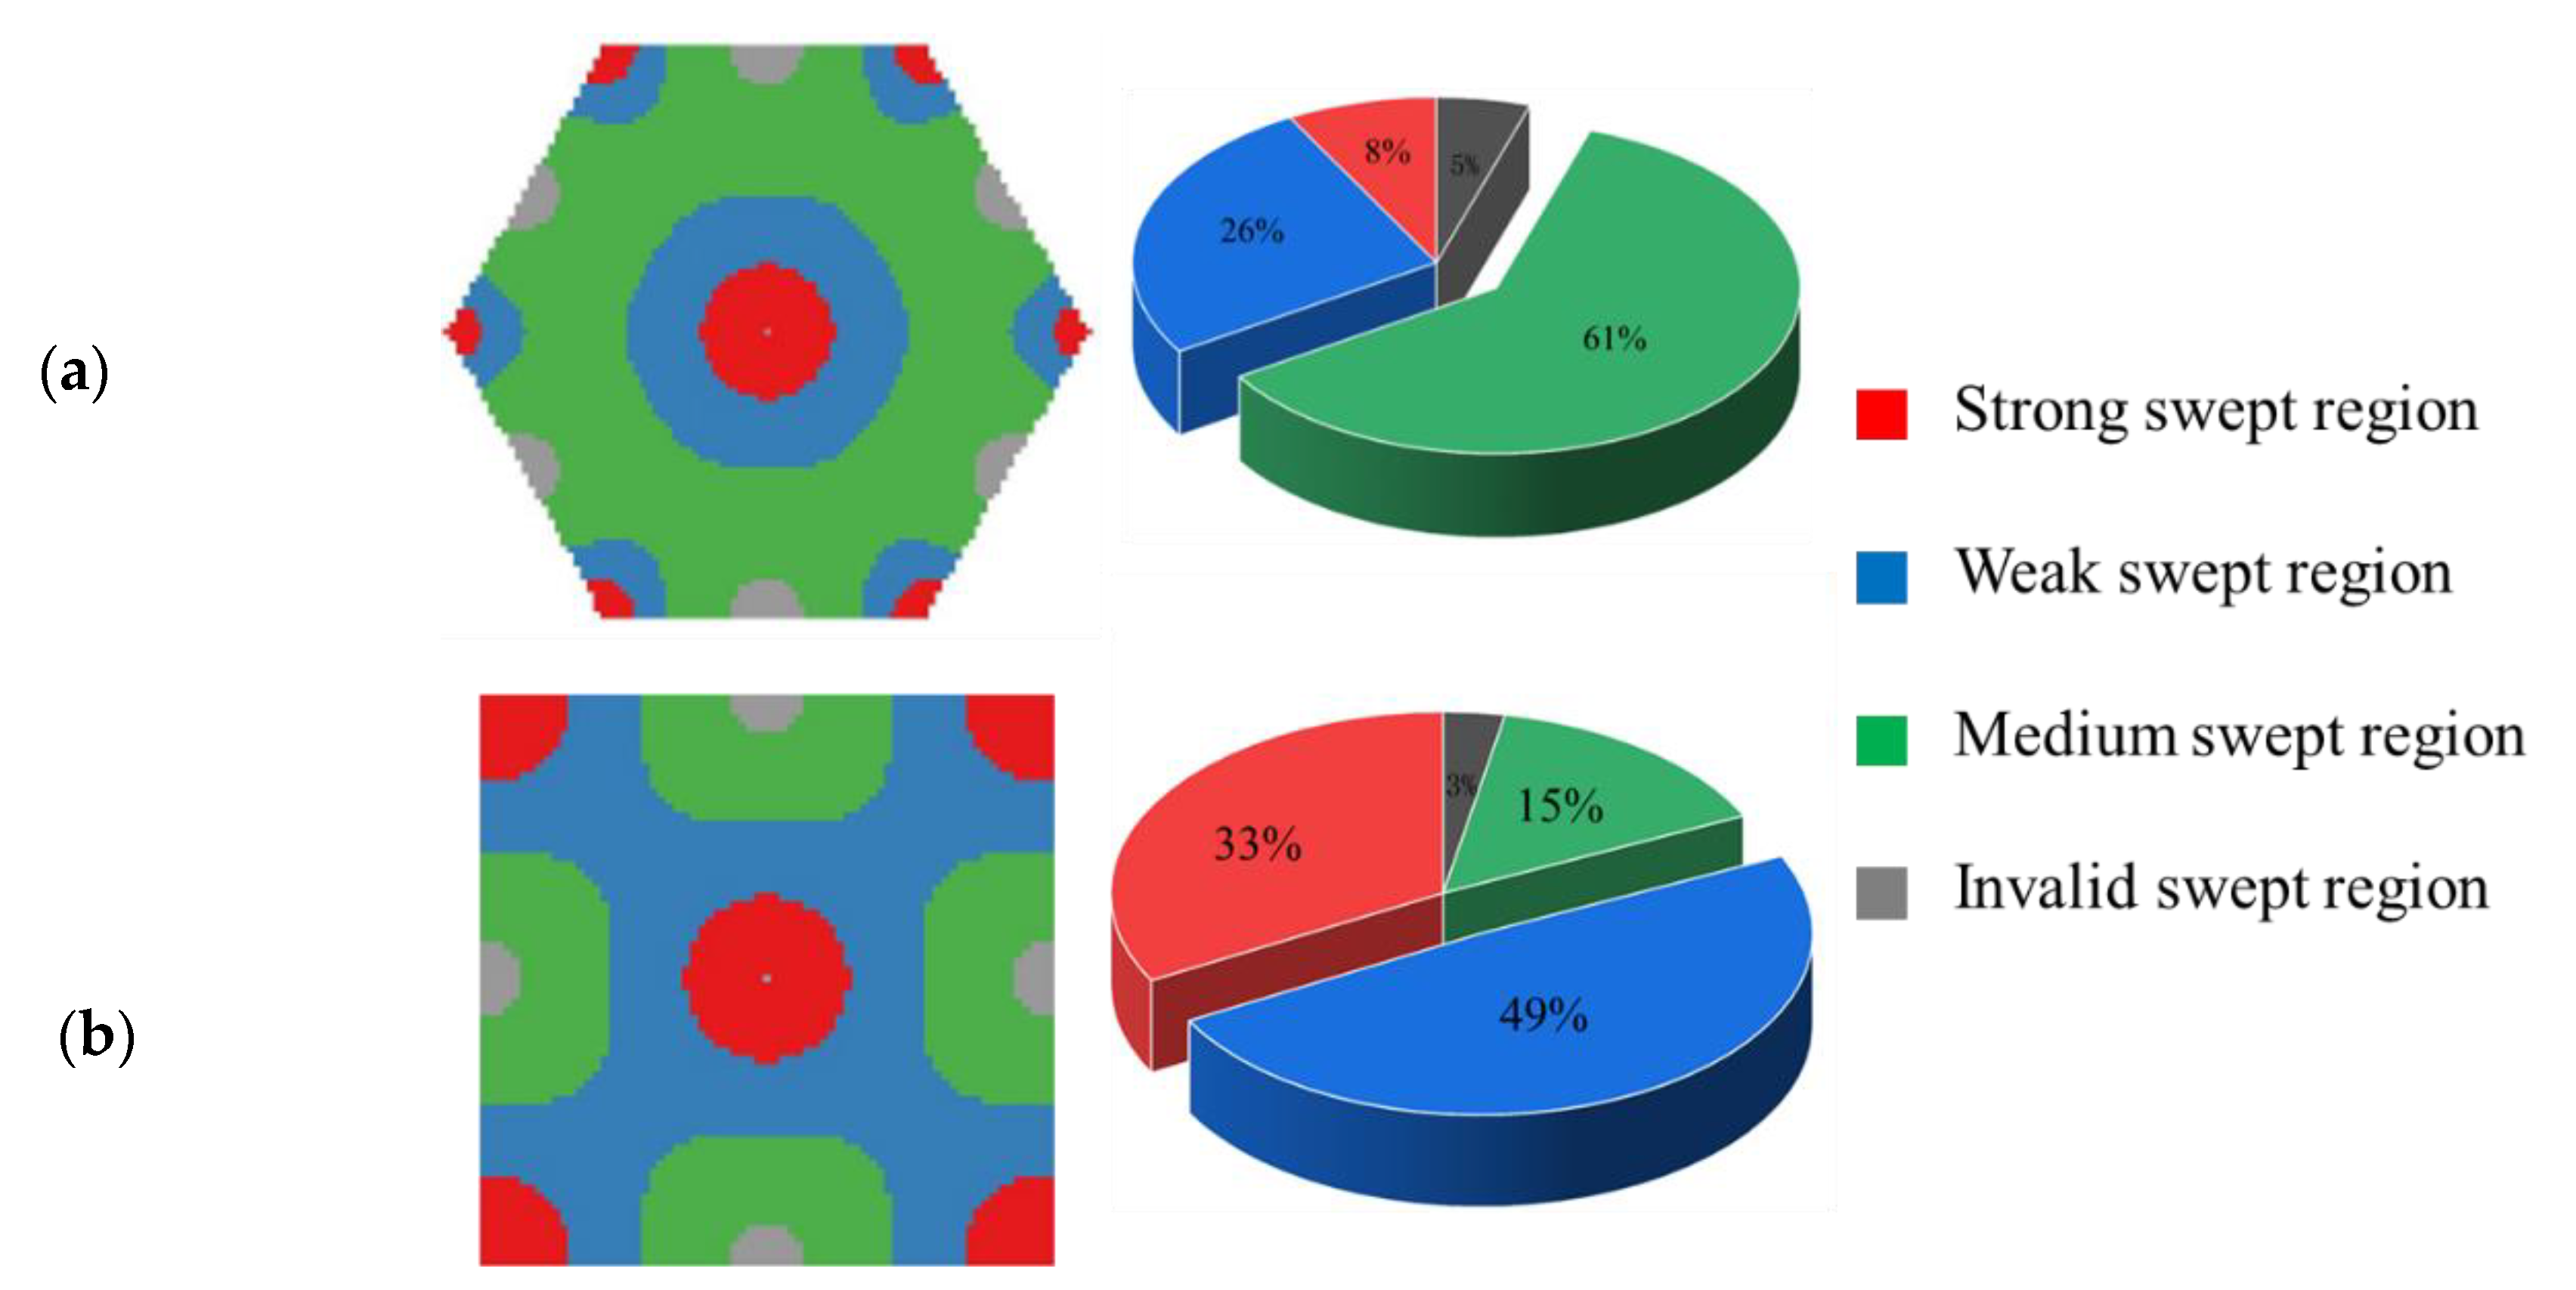
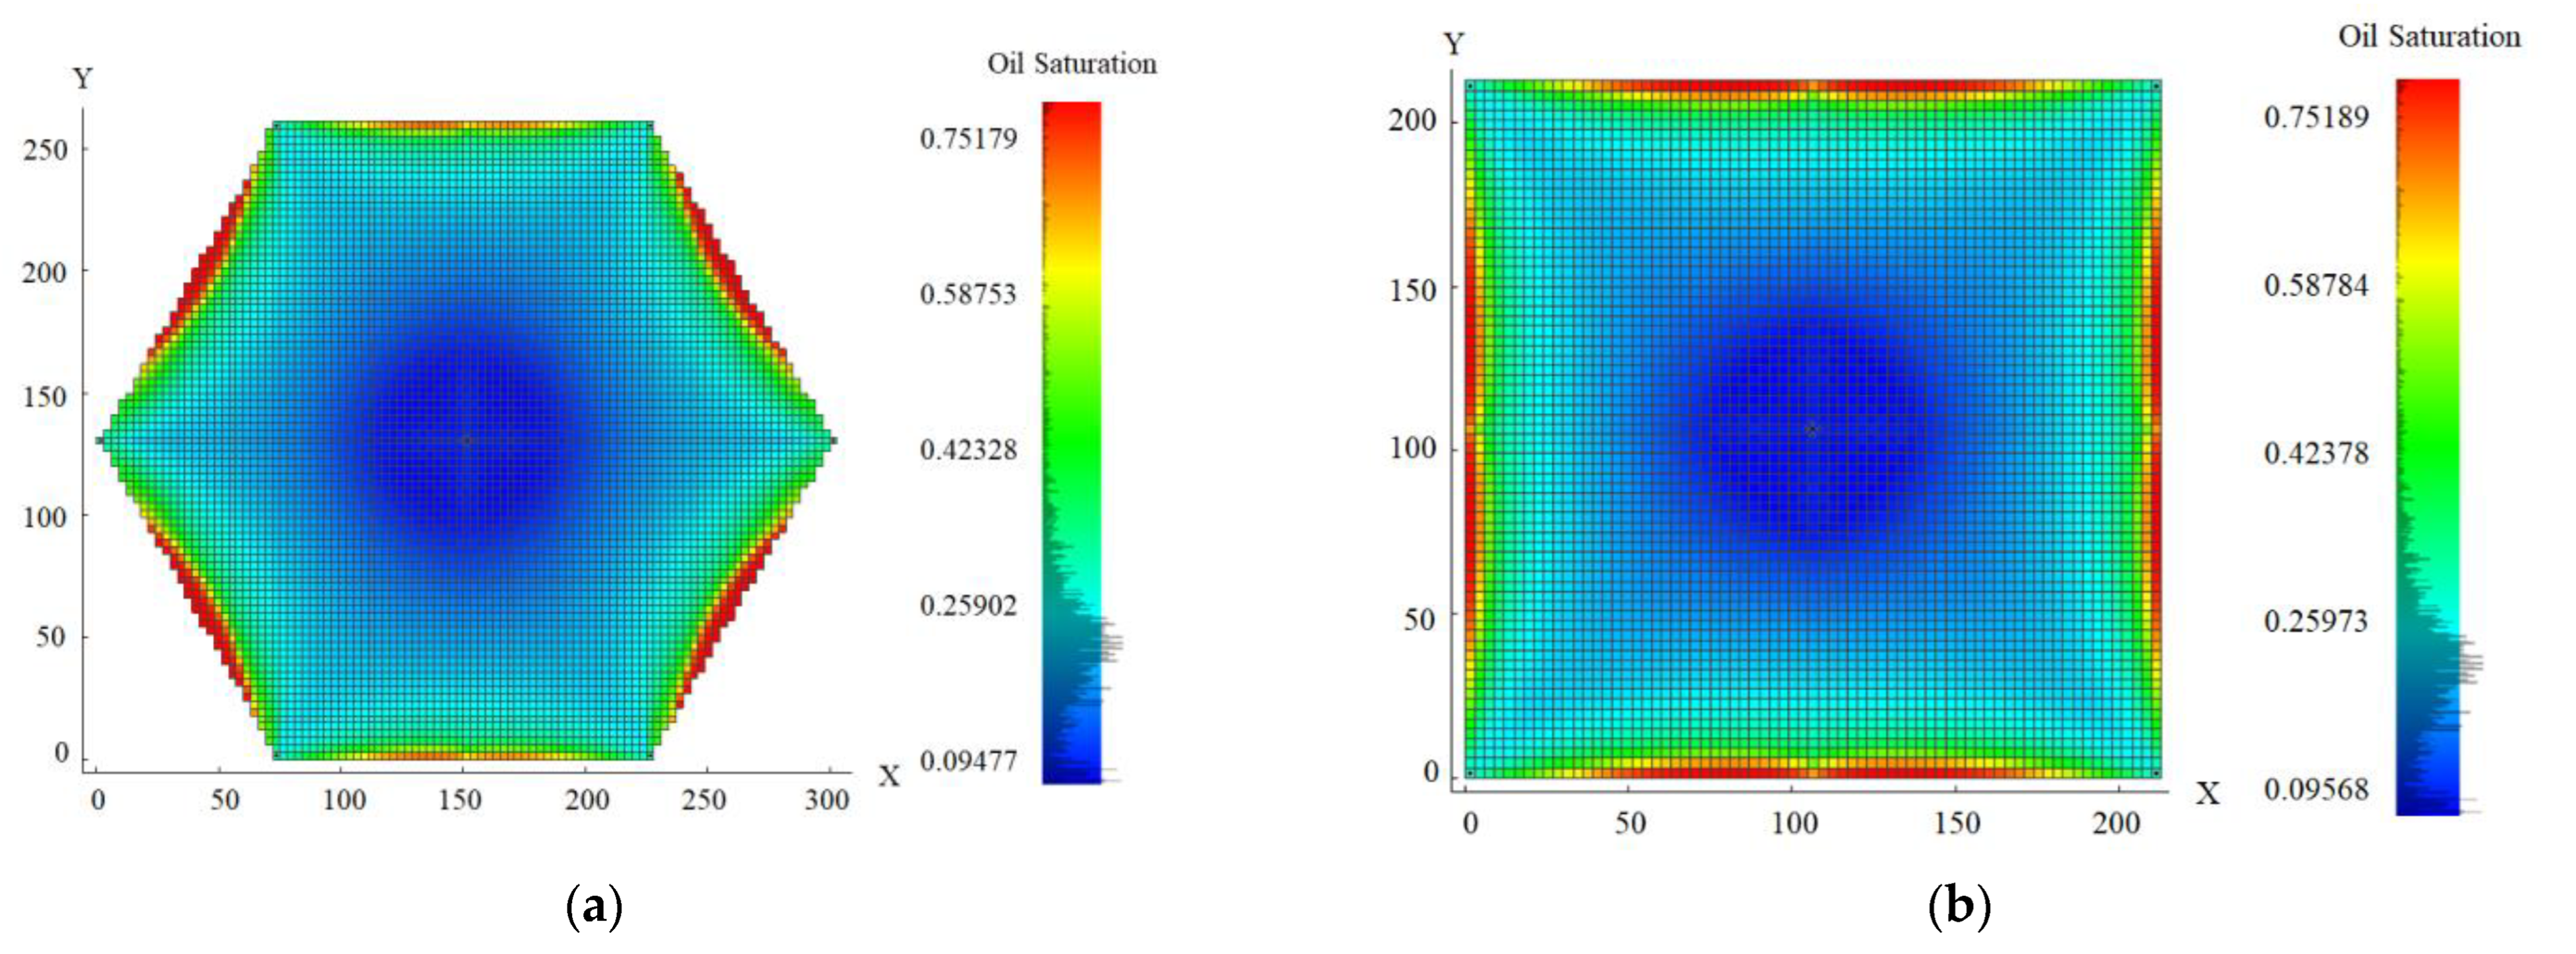
3.1. The Flow Intensity of the Reverted Seven-Spot Well Pattern

The flow intensity regions of the inverted seven-spot well pattern and five-spot well pattern in Figure 5 were divided based on Table 2. The pressure gradient distribution is a funnel shape between the injection and production well, in which both the well bottom is the strong swept region and the intermediate position of the two wells (far wellbore area) is the weak swept region. The center of the production well is an invalid swept region because of the flow field limitation. The swept intensity according to the pressure gradient distribution is different from the swept scope according to the streamline. Sweep scope focuses on the formation range that the injected fluid can sweep, while swept intensity focuses on the displacement degree of the affected area. By comparing the swept intensity pie chart of the five-spot well pattern and the inverted seven-spot well pattern, it can be found that the weak swept region of the inverted seven-spot well pattern is 61%, which is 46% higher than that of the five-spot well pattern. Consistent with the essential property of the weak injection-production intensity of the inverted seven-spot well pattern, it is also mainly in the weak swept region. The reduction in swept intensity will inevitably affect the displacement effect of the S/P system, but the reduction in displacement intensity is beneficial to alleviate the cross-flow problems such as injection fluid fingering. Therefore, this paper compares the flow difference between the five-spot well pattern and inverted seven-spot well pattern from the perspective of water cut and oil saturation.
The tNavigator is used to simulate the change process of water cut in the process of elastic unstable two-phase displacement, and the oil saturation diagram is shown in Figure 6. The high water cut period is divided with the comprehensive water cut of 90% as the limit. The low water cut period of the inverted seven-spot well pattern is longer, which is 26% later than that of the five-spot well pattern. Taking a 15% decrease in grid oil saturation as the threshold to demarcate effective swept scope, the swept scope of five-spot pattern is 85.2%, which is 5.1% lower than that of the inverted seven-spot well pattern.
The above analysis shows that although the swept intensity of inverted seven-spot well pattern is low, its swept scope and low water cut period are obviously higher. The above factors determine the final oil displacement effect of S/P flooding. Therefore, it is necessary to carry out research on the influence of flow field intensity on oil displacement efficiency and the occurrence of remaining oil, in order to provide data and theory support for the subsequent use of residual oil in the inverted seven-spot well pattern.

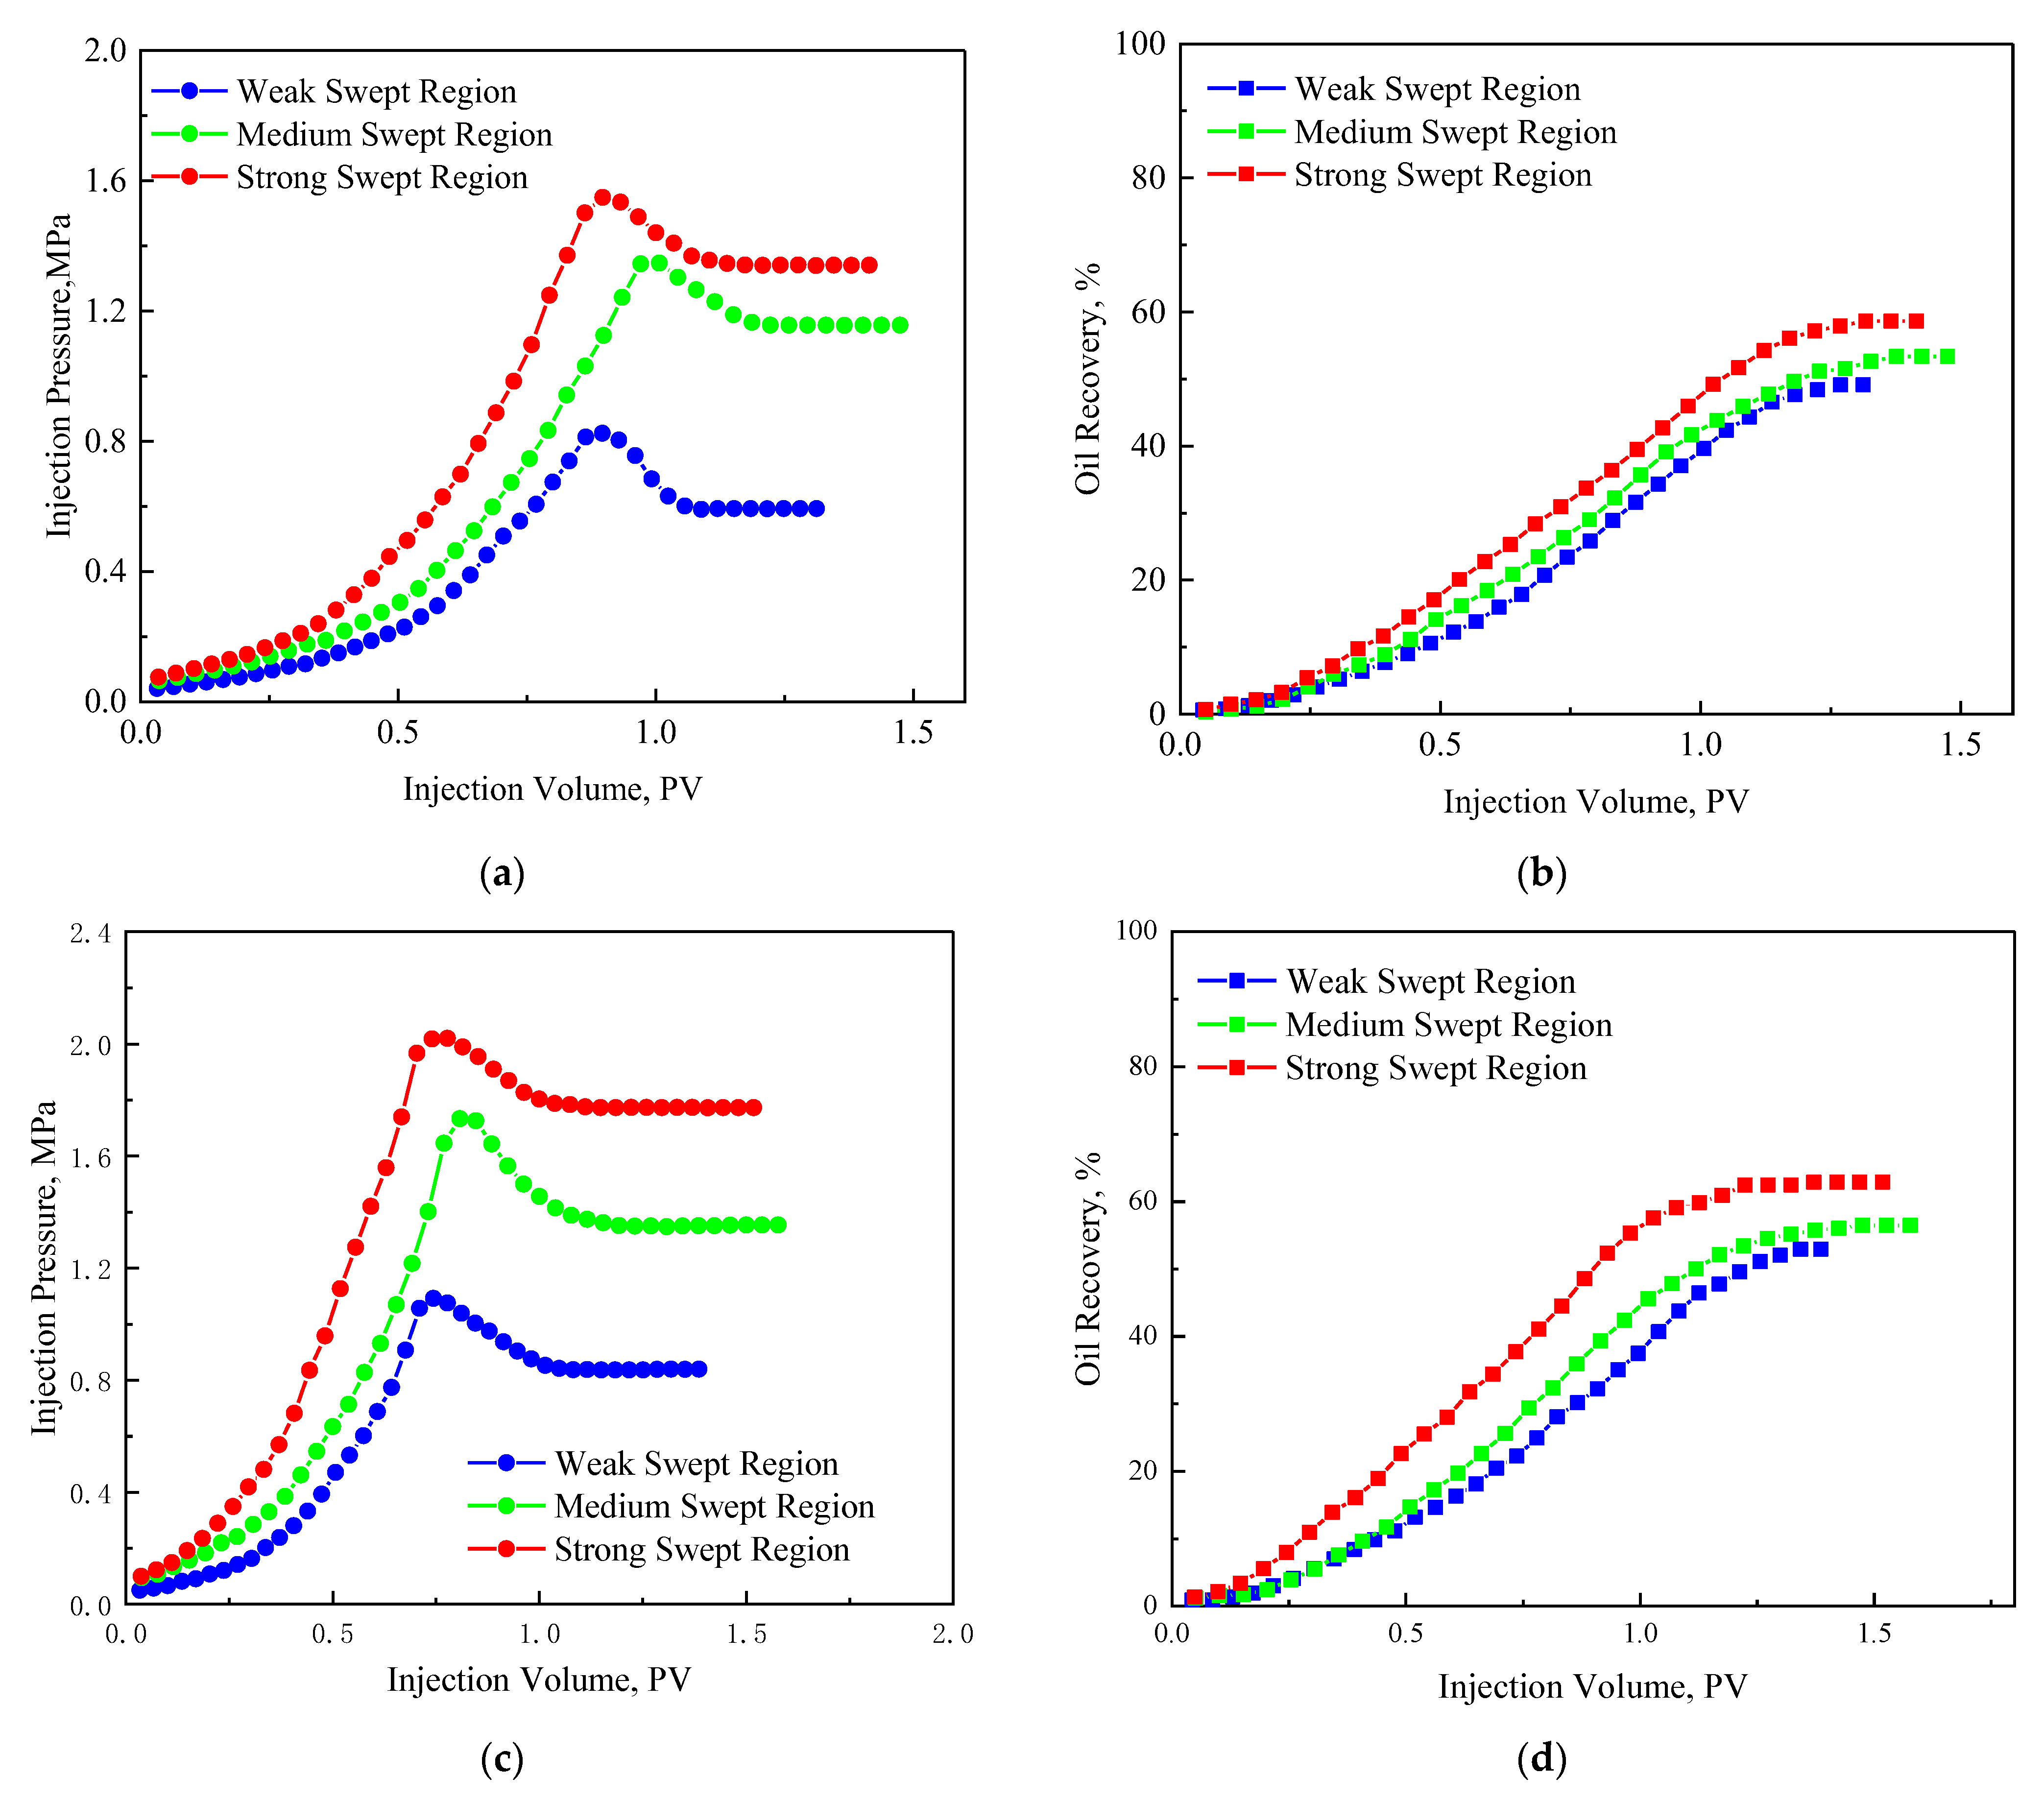
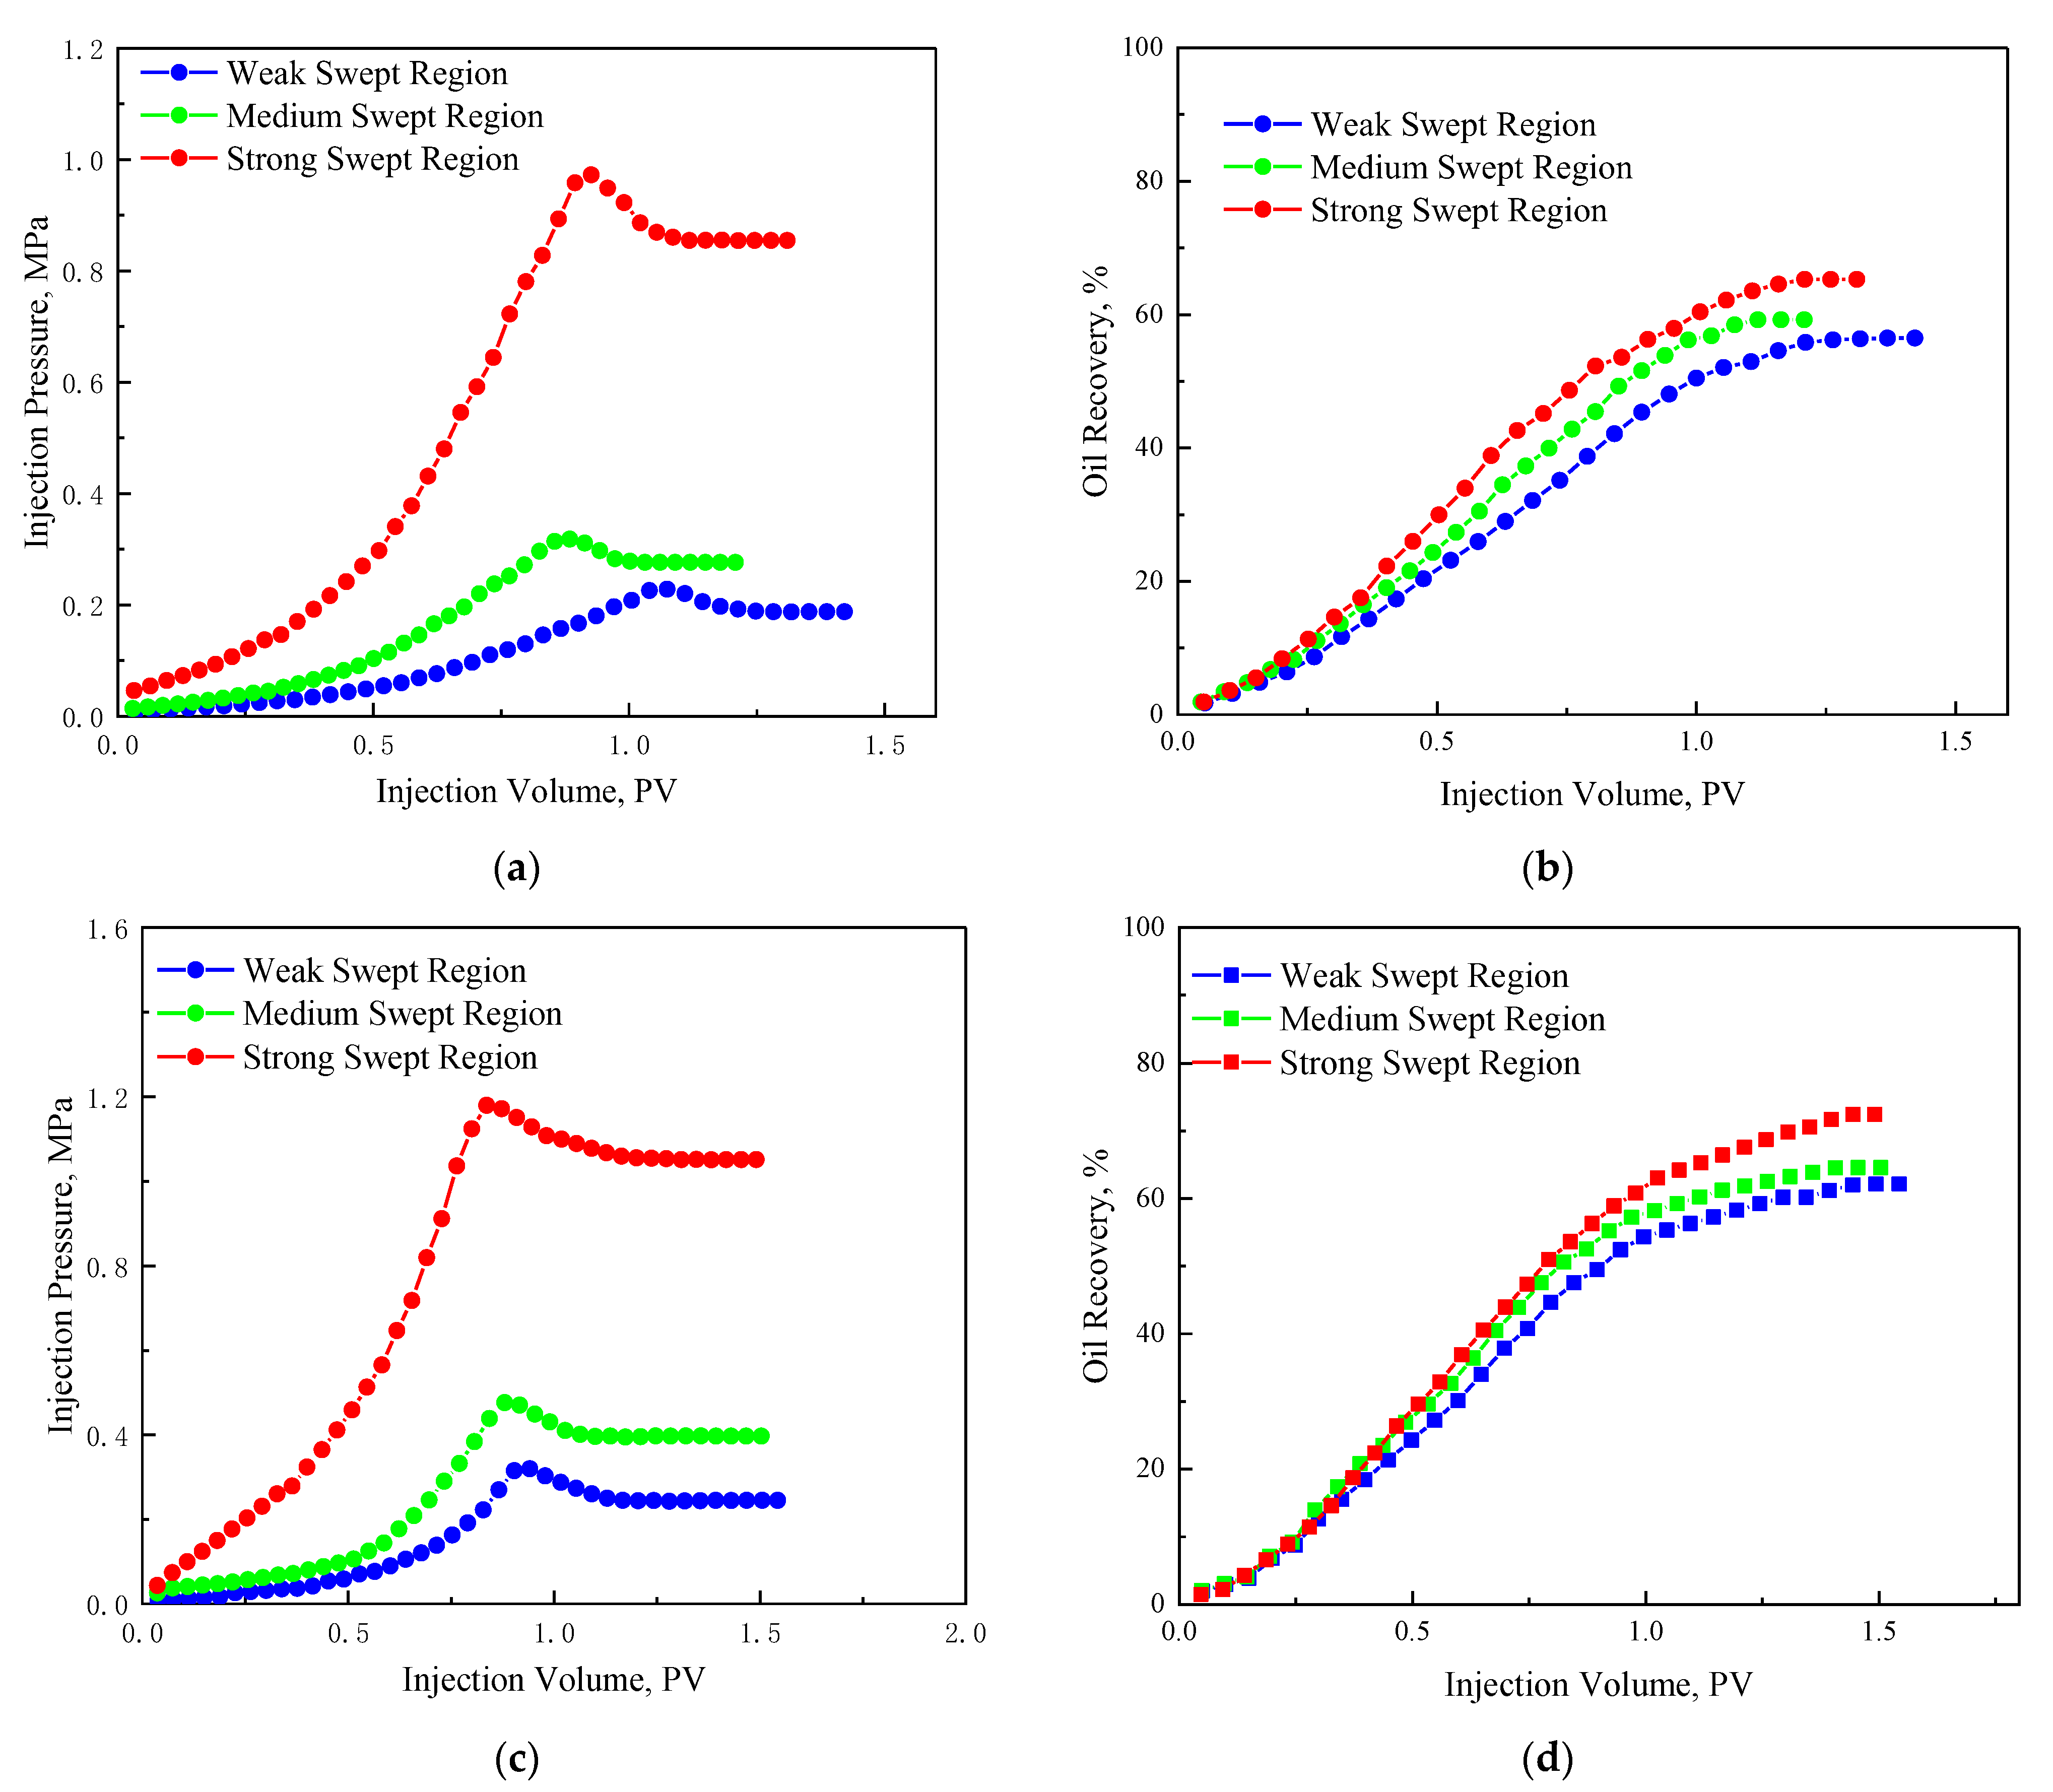
3.2. The Influence of Flow Intensity on the Oil Displacement Efficiency

The influence of flow intensities on the injection pressure and oil recovery for the S/P flooding with two viscosities at the permeability of 50 mD is shown in Figure 7. The three injection rates designed in Table 3 refer to the strong swept region, medium swept region, and the weak swept region. Figure 7a,c show that the injection pressure first increases to the maximum value, then decreases slightly and remains stable. Meanwhile, the injection pressure and oil recovery of S/P flooding increases with the increase in injection rate, but the increased amplitude reduces with the increase in injection rate. This is mainly because the shearing action is enhanced when the strength of the flow intensity increases, which reduces the effect of the polymer. On the other hand, a higher injection rate can achieve higher recovery, and there is limited EOR space for a further increase in viscosity (within the scope of the experiment). The timing of the high viscosity S/P system reaching the peak of injection pressure is earlier, indicating that the high viscosity S/P can displace crude oil faster and achieve the balance of polymer adsorption and production.
The influence of flow intensities on the injection pressure and oil recovery for the S/P flooding with two viscosities at the permeability of 300 mD is shown in Figure 8. The variation of injection pressure with S/P viscosity and injection rates is consistent with that of the 50 mD core. The comparison of Figure 7 and Figure 8 shows that with the increase in permeability, the injection pressure decreases, and oil recovery slightly increases. By comparing Figure 7a,c with Figure 8a,c it can be seen that the injection pressure is obviously low when the injection rate of the 300 mD core is less than 0.1 mL/min. Figure 7b,d and Figure 8b,d show a higher oil recovery for 300 mD cores under the same conditions. This indicates that reservoir properties and injection parameters together determine the ultimate oil recovery factor. The above analysis indicates that injection with medium flow intensity can achieve a higher oil recovery, while ensuring good injectivity for the 300 mD cores.

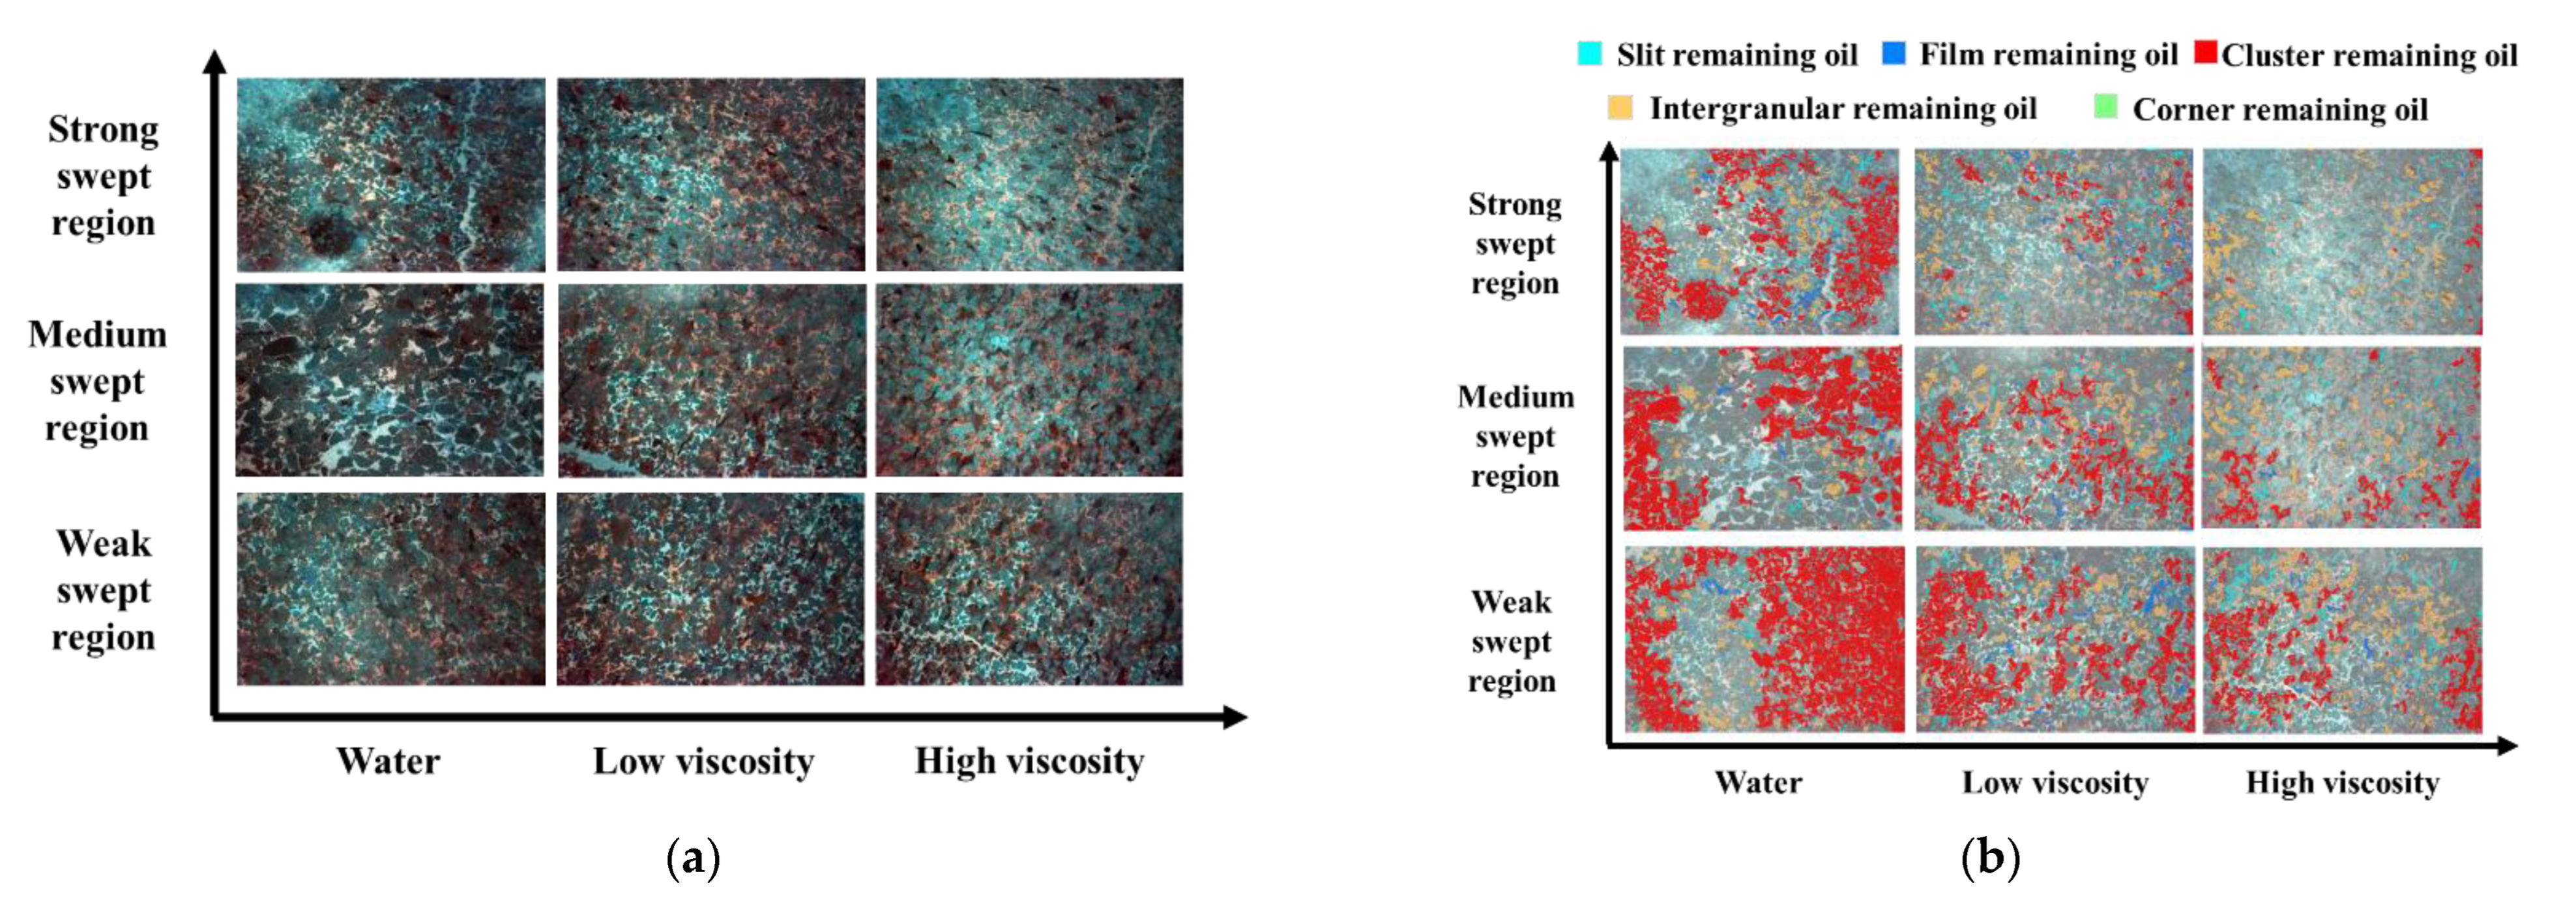
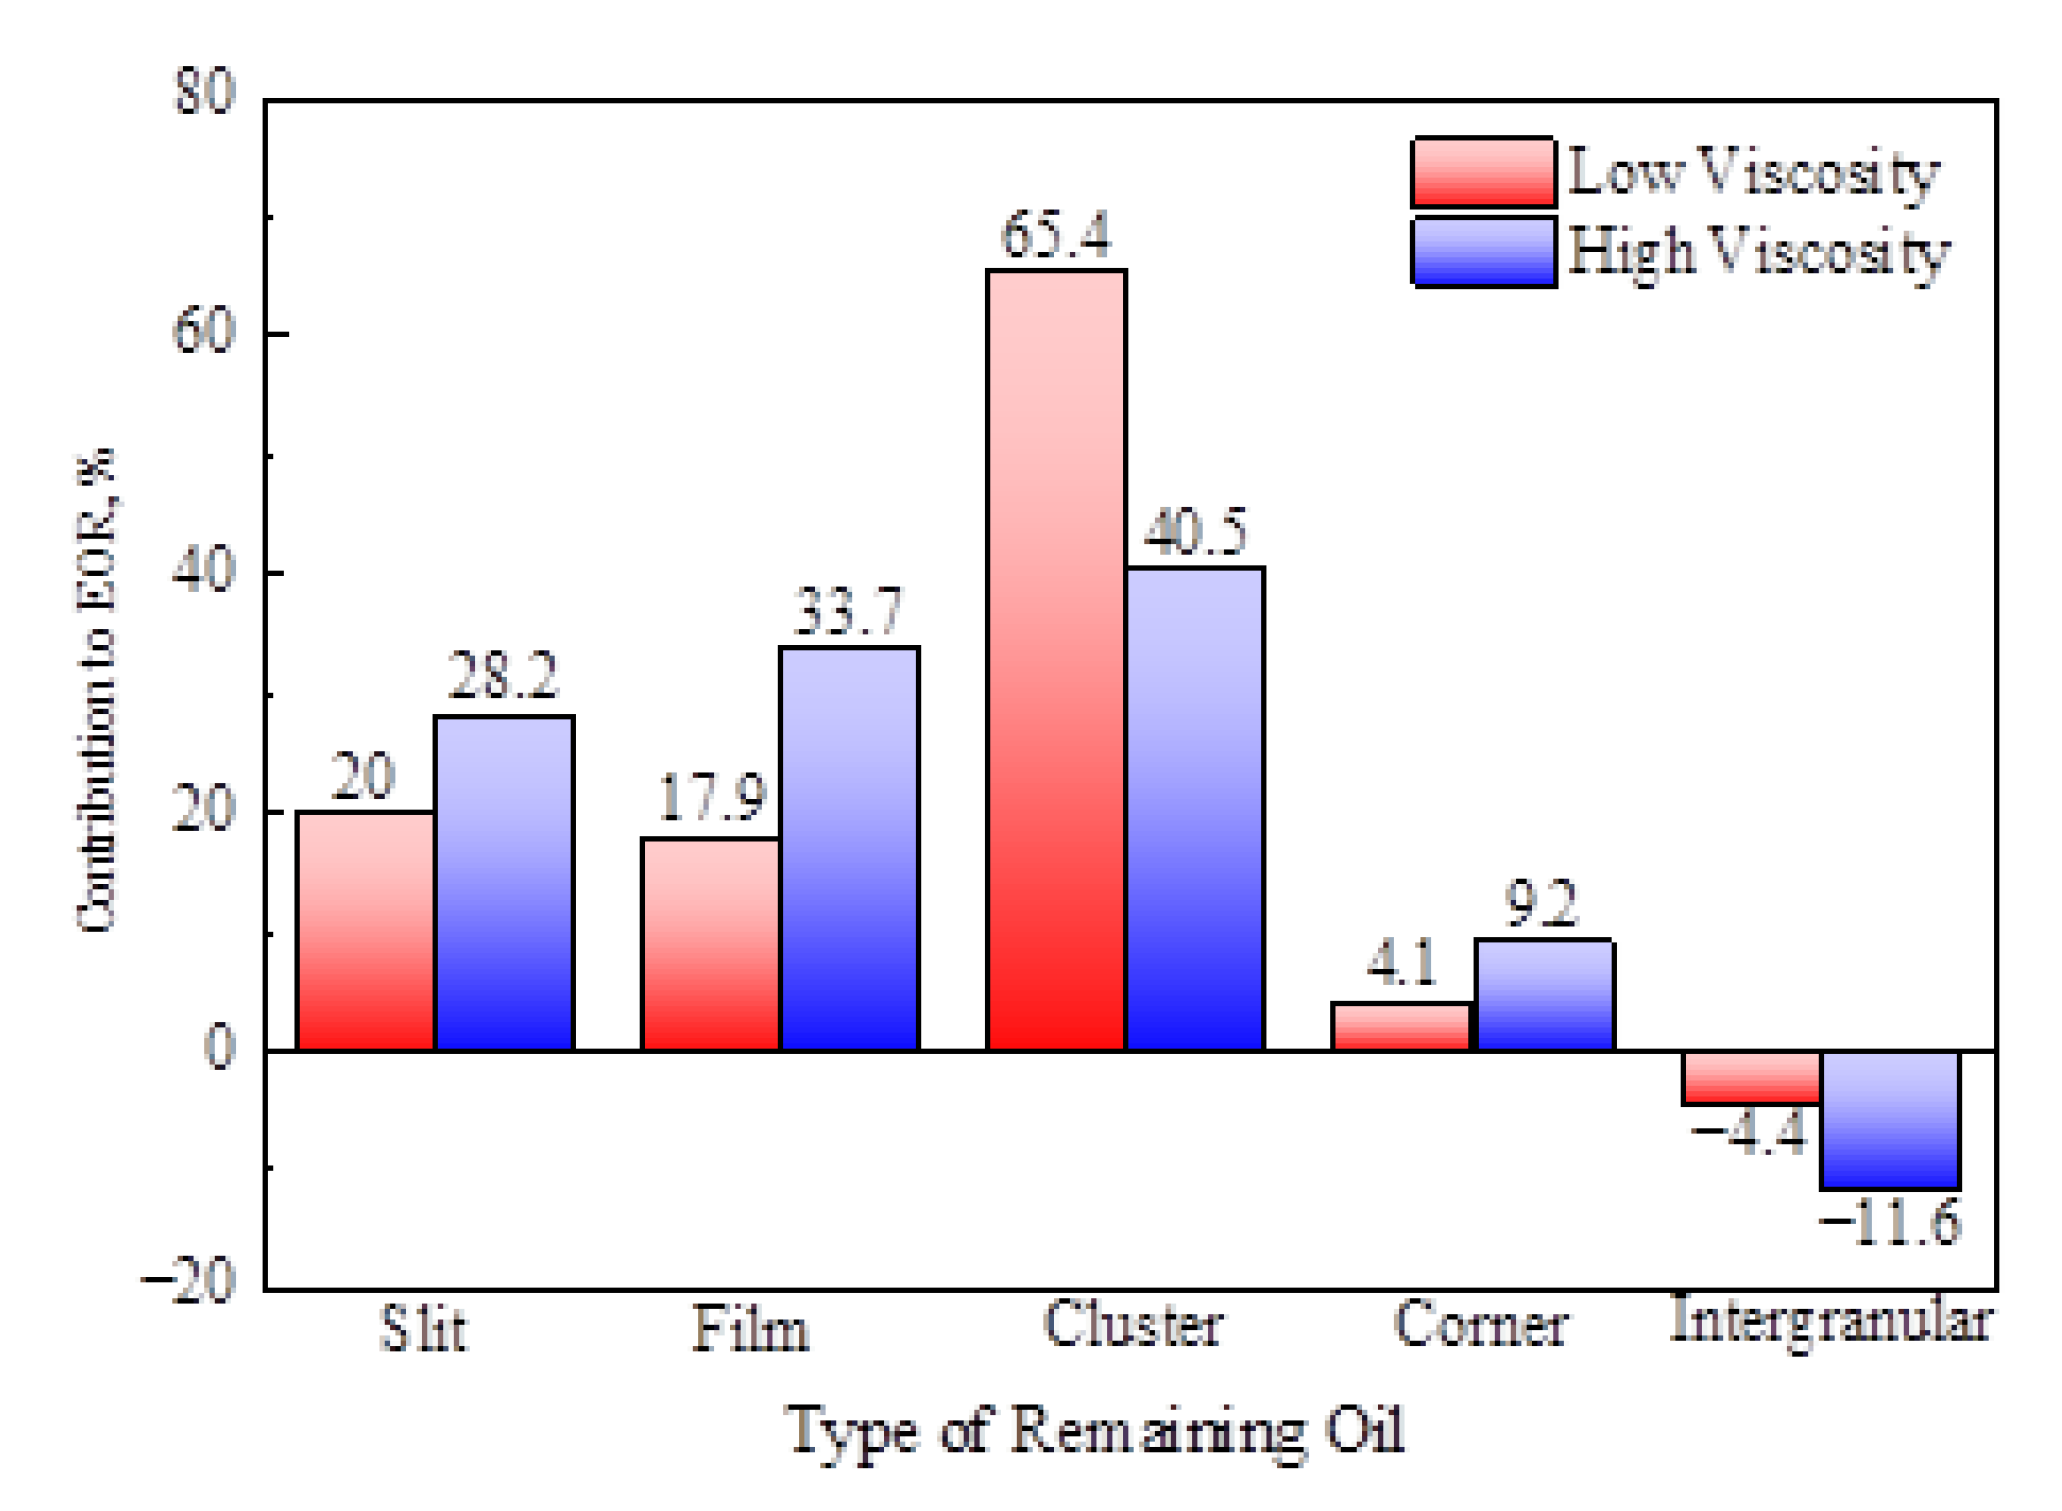
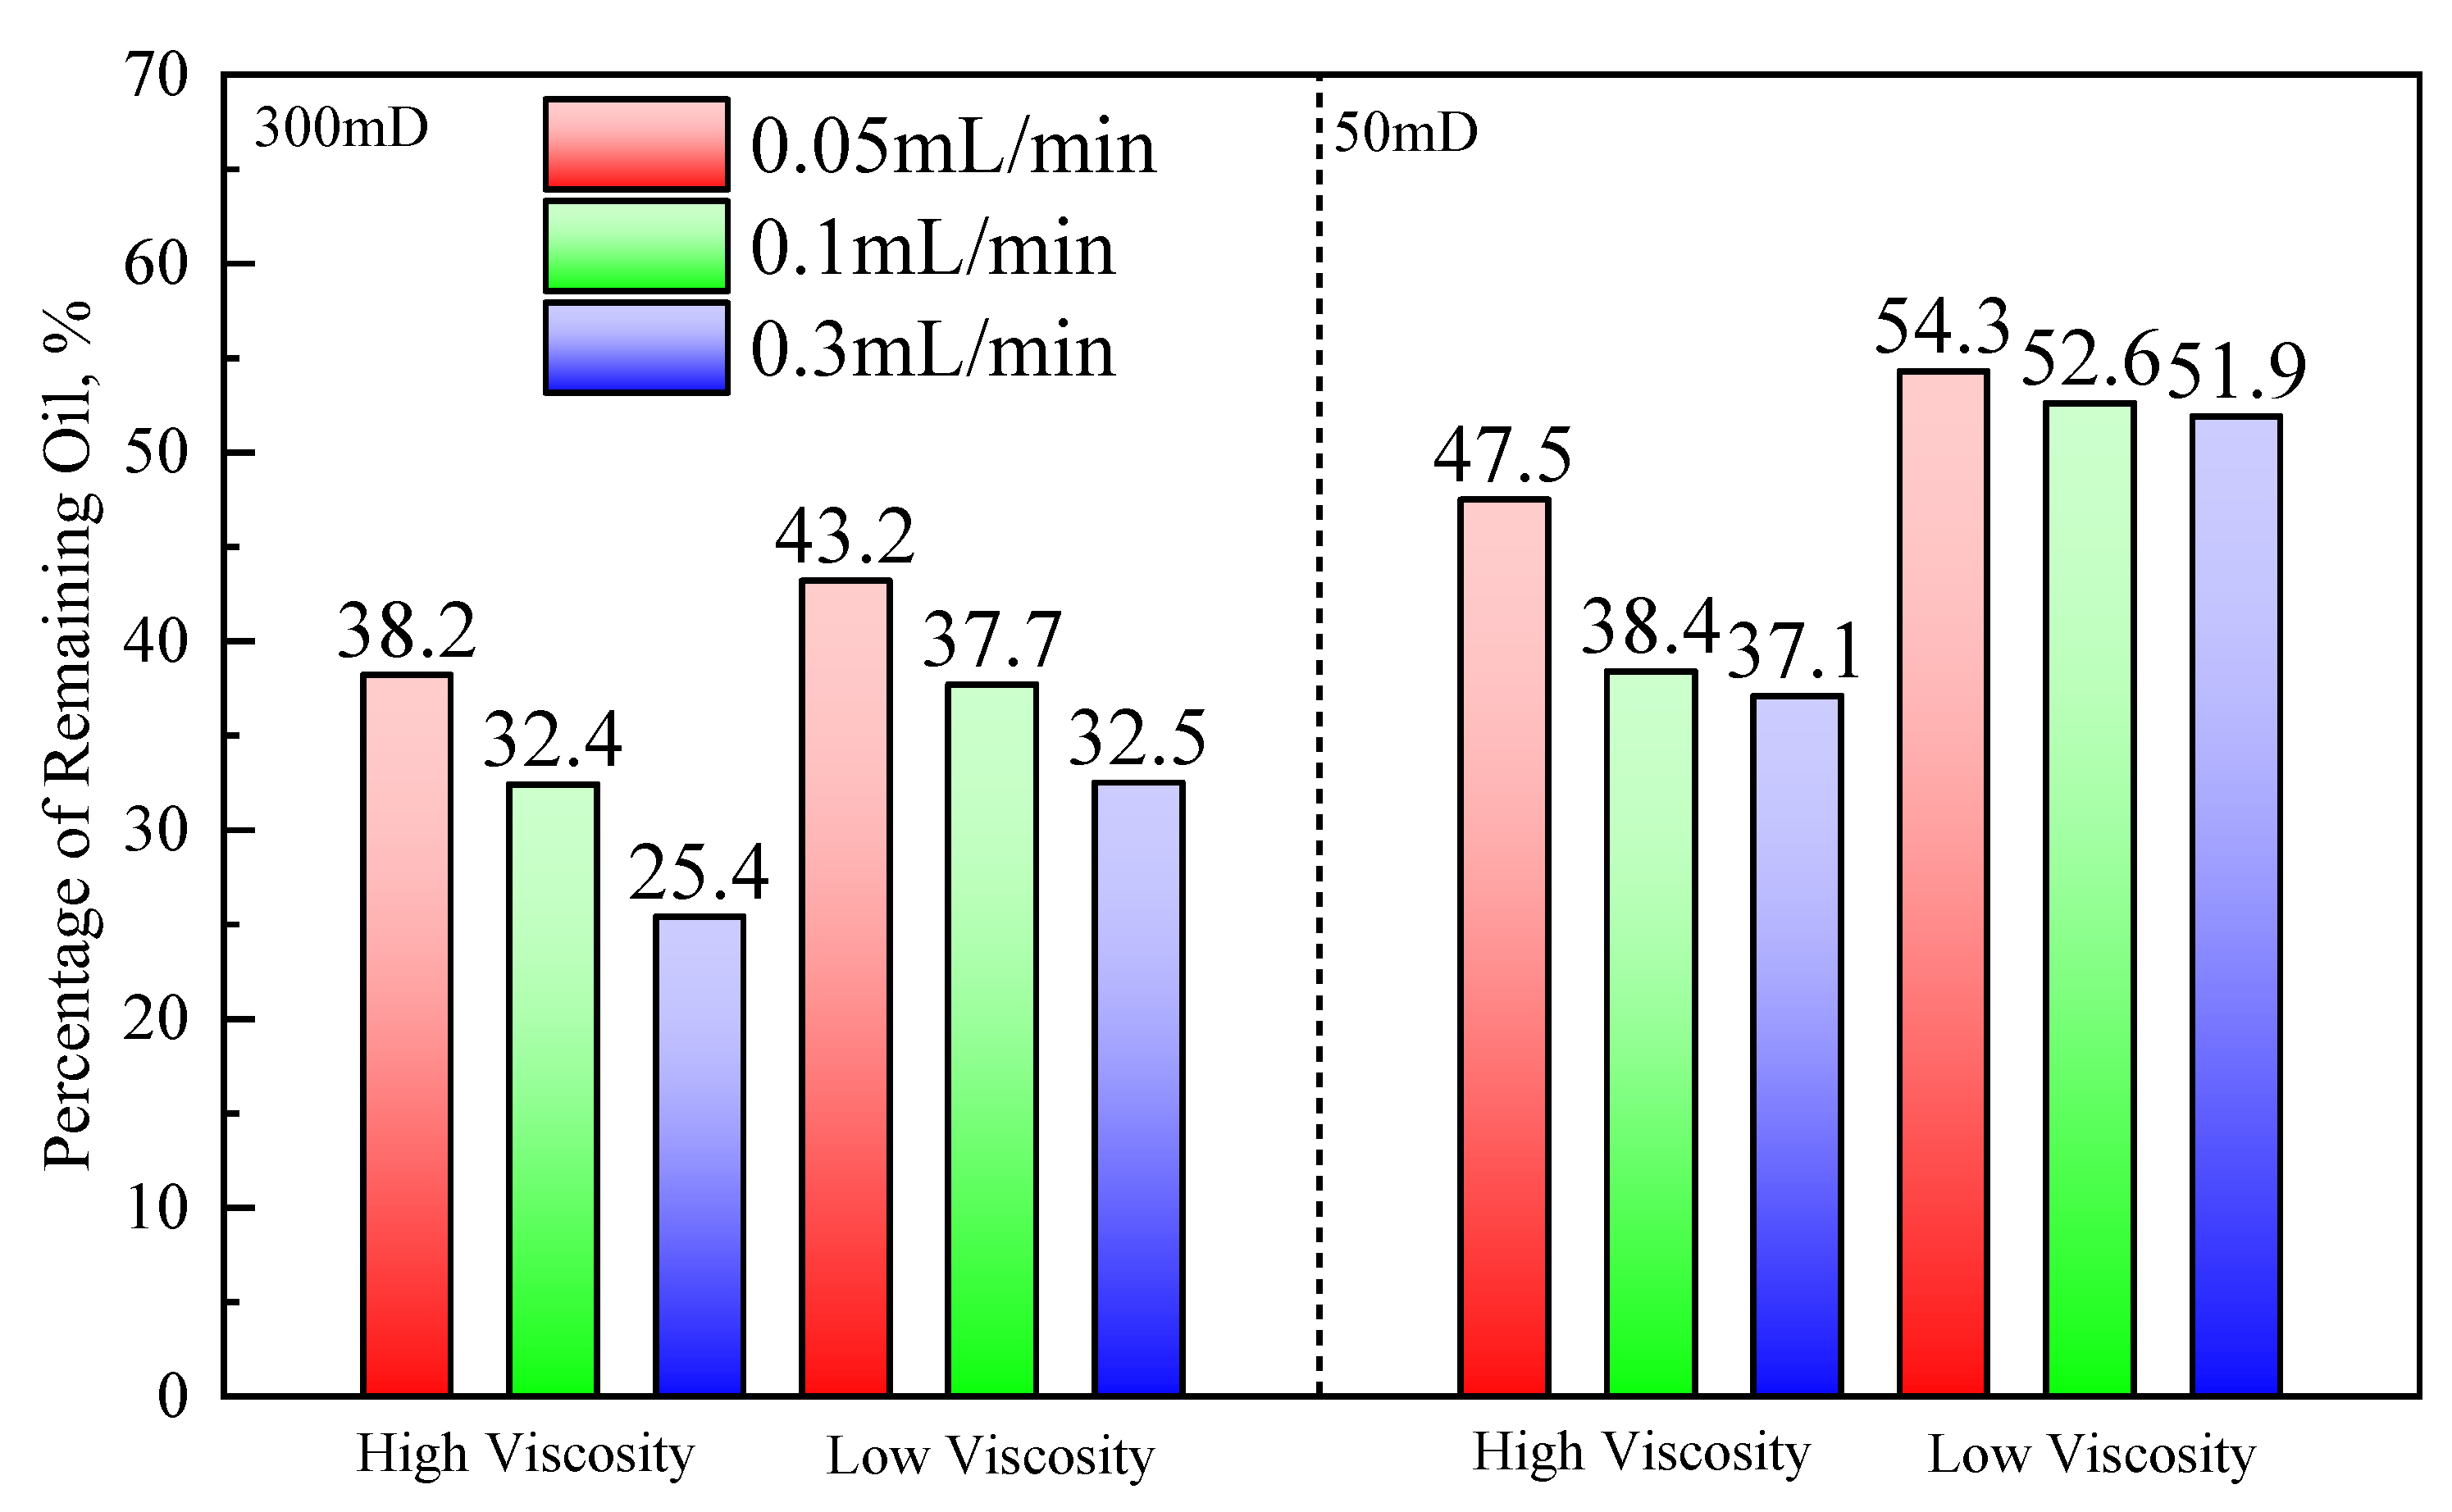
3.3. The Influence of Flow Intensity on the Occurrence of Remaining Oil

Taking the core permeability of 300 mD as an example, the ultraviolet fluorescence images and the occurrence of remaining oil for water and S/P flooding at three flow intensities are shown in Figure 9. Figure 9a shows that the fluorescence of the remaining oil is light yellow, orange, and reddish-brown; the pore-throats are white or highly bright under fluorescence; and the rock skeleton is dark. Figure 9b shows that the remaining oil will obviously reduce and be dispersed when the flow intensity strength and the S/P viscosity increase. The continuous cluster remaining oil dominates the remaining oil after the water flooding, while the intergranular remaining oil increases significantly in S/P flooding. The yellow area shows that the intergranular remaining oil will be larger than the red area, which represents the cluster remaining oil in Figure 9b when the intensity further increases. In order to quantitatively analyze the influence of the S/P viscosity and flow intensity on the occurrence of the remaining oil, the absolute content and relative proportion of the five types of remaining oil were plotted in Figure 10.
It can be found that the content sharply decreases when the flow intensity increases from the weak swept region to the medium swept region in Figure 10a, but it does not decrease significantly when the flow intensity continues to increase to the strong swept region. While the remaining oil decreases once the flow intensity is increased in the S/P flooding, even the remaining oil content is much lower than the water flooding in the weak swept region. This shows that the S/P flooding is more sensitive to the flow intensity. Figure 10b shows that the relative content of cluster remaining oil after water flooding is more than 70%. Although the remaining oil of the S/P flooding is obviously dispersed, the cluster remaining oil is still dominant at the flow intensity below the medium swept region. The intergranular remaining oil will dominate when the flow intensity is in the strong swept region. The potential of remaining oil after S/P flooding should be exploited mainly in the weak swept area in the far well zone, while the dispersed intergranular and film remaining oil should be utilized in the near well zone.
The contribution rates of different types of remaining oil to enhanced oil recovery are defined in Equation (1), according to which the contribution of each remaining oil in two viscosity S/P flooding to enhanced oil recovery under strong swept conditions is shown in Figure 11. Figure 11 shows that the contiguous cluster remaining oil is the main EOR component of the S/P flooding relative to water flooding. The cluster remaining oil is dispersed by the S/P system, part of which is produced, and the other part of which is transformed into other types of remaining oil. Therefore, the contribution rate of intergranular remaining oil to EOR is negative, which is the result of the dispersion and transformation of cluster remaining oil. The contribution rate of the cluster remaining oil in the low viscosity system is significantly higher than that in the high viscosity system, while the contribution rate of the cluster remaining oil, slit remaining oil, and film remaining oil in the high viscosity system is relatively average. This indicates that the high viscosity S/P system has a strong ability to disperse the cluster remaining oil. Meanwhile, it can more likely carry them out. Therefore, there are fewer remaining oil residuals, and they are converted to other types of remaining oil.
R i = A w i A S / P i A w A S / P × 100 %
where A w is the total pixel number of oil area in the fluorescence image after water flooding; A S / P is the total pixel number of oil area in the fluorescence image after water flooding; i represents the types of remaining oil.
Figure 12 compares the difference in overall remaining oil content between high permeability (300 mD) and low permeability (50 mD) cores. It can be found that the remaining oil content of the high permeability layer is obviously lower than that of the low permeability layer because of better reservoir physical properties. The remaining oil content of low viscosity S/P displacement in the low permeability reservoir is obviously higher, and, under the three flow intensities the remaining oil is close to each other. This shows that the high viscosity system can better displace the low permeability layer on the premise of ensuring its injectivity.

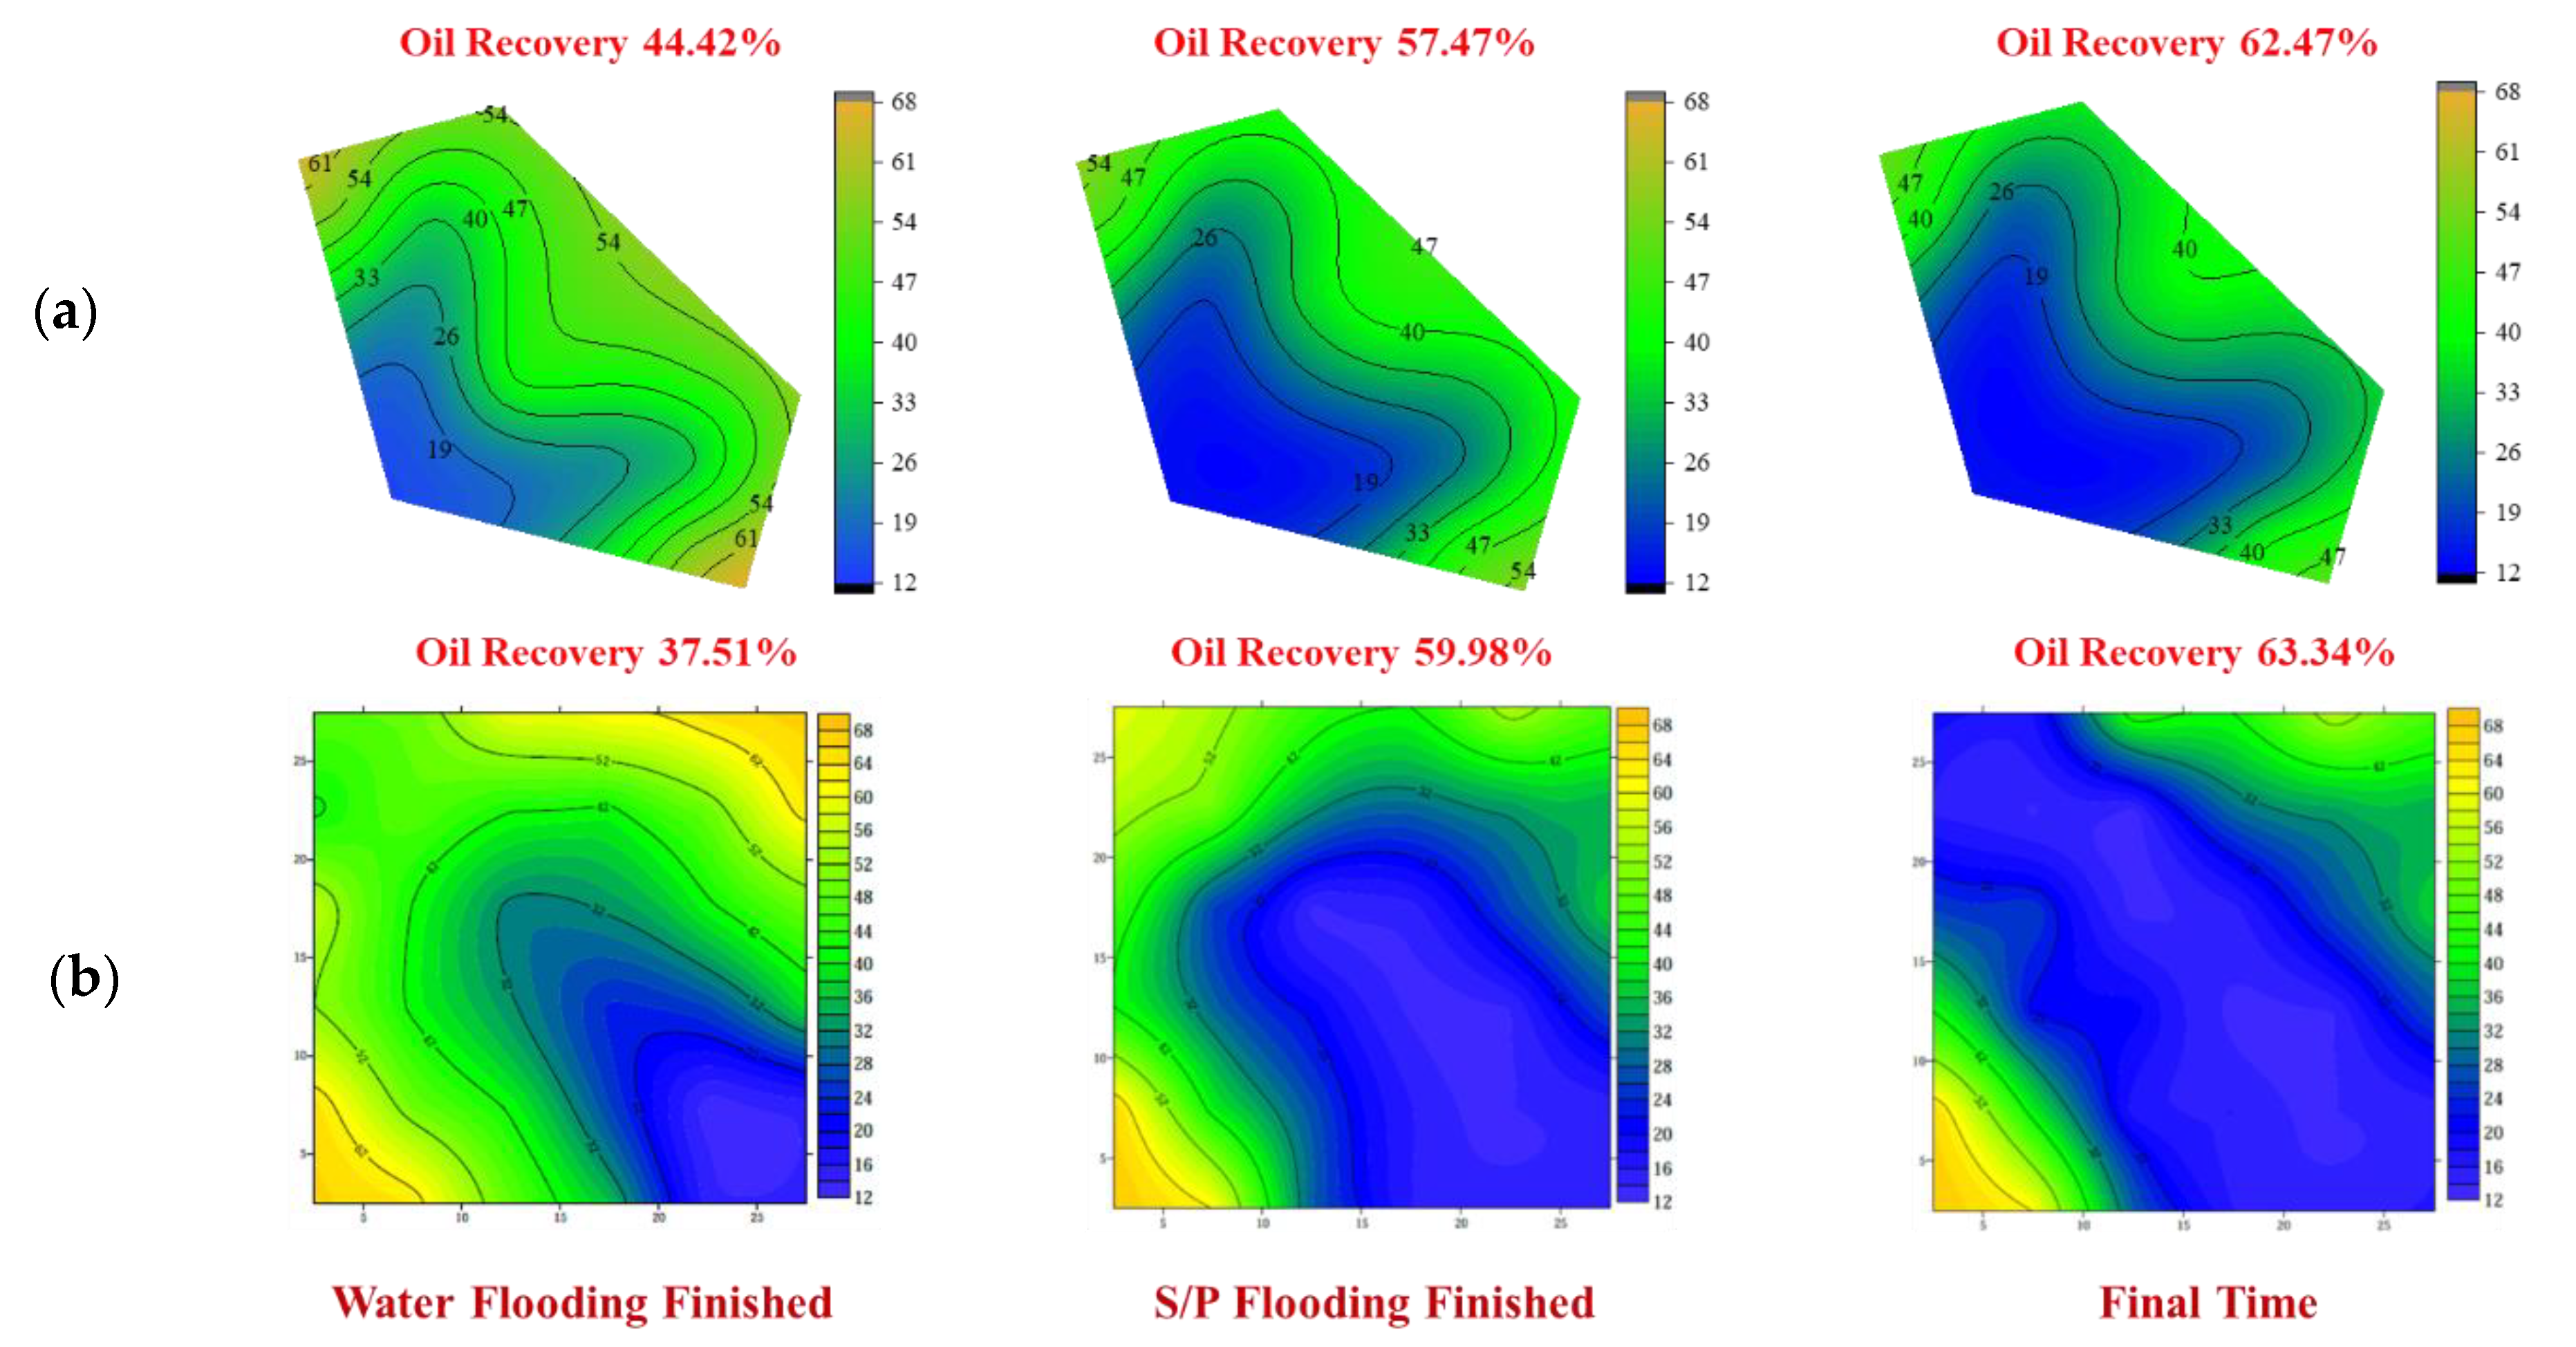
3.4. The EOR Efficiency of S/P Flooding in the Inverted Seven-Spot Well Pattern

Figure 13 shows the injection pressure, oil recovery and water cut curves during the S/P injection process of the five-spot well pattern. The water-free oil production period of the five-spot well pattern is 0.073 PV. The injection volume is 0.753 PV, and the oil recovery is 37.51% when the water cut is up to 95%. After injecting the S/P system, the injection pressure increases significantly, and the water cut decreases to 66.04%, which could increase the oil recovery by 22.47% on the basis of water flooding. After the subsequent water flooding, the injection pressure decreases and tends to be stable, and the oil recovery can be further improved to 63.04%.
Figure 14 shows the injection pressure, oil recovery, and water cut of the S/P flooding in the inverted seven-spot well pattern. Compared with the five-spot well pattern, the water-free oil production period of the inverted seven-spot well pattern was extended to 0.133 PV, and the water flooding recovery rate was 44.42%, which was 6.91% higher than that of the five-spot well pattern. After injecting the S/P system, the injection pressure increased significantly, but was slightly lower than that of the five-point well pattern. The minimum water cut is 76.83%, which is significantly higher than that of the five-spot well pattern, and the oil recovery can be increased by 18.05% on the basis of water flooding. After the subsequent water flooding, the injection pressure decreases and tends to be stable, and the recovery factor can be further improved to 62.47%.
The laboratory experiment results of the plate model displacement show that in a limited well pattern unit, the water breakthrough and water cut rise rates of the five-spot well pattern are higher than those of the inverted seven-spot well pattern. This makes the waterflooding recovery of the inverted seven-spot well pattern higher than that of the five-spot well pattern. After injecting the S/P system, due to the greater flow intensity, the displacement effect in the swept area of the five-spot well pattern is better, resulting in a more obvious reduction in water cut and enhanced oil recovery.
Figure 15 shows the oil saturation phase graph of each displacement stage comparing the inverted seven-spot well pattern and the five-spot well pattern. After S/P flooding, the orange-yellow high oil saturation area in the inverted seven-spot well pattern is significantly smaller, and it has a larger sweeping range, while the blue area of the five-spot well pattern is larger, corresponding to a larger flow intensity. The final recovery factor of the five-spot well pattern is 0.87% higher than that of the inverted seven-spot well pattern, indicating that the oil displacement effect of the five-spot well pattern is better than that of the reverse seven-spot well pattern. The application of S/P flooding in the inverted seven-spot well pattern can still obtain good application results.

4. Conclusions

In this paper, the distribution of flow field intensity in the inverted seven-spot well pattern and five-spot well pattern unit is characterized by theoretical derivation and simulation calculation. The core flooding efficiency experiments were carried out according to different flow intensities and the remaining oil occurrence was quantitatively identified. Finally, the oil displacement effects of the inverted seven-spot well pattern and the five-spot well pattern plate model were compared. The specific conclusions are as follows.
(1) Combining the results of theoretical and simulation calculations, the swept area in the well pattern unit can be divided into strong swept region (>0.2 MPa), medium swept region (0.1–0.2 MPa), weak swept region (0.03–0.1 MPa), and invalid swept region (<0.03 MPa), according to the pressure gradient distribution. The five-spot well pattern unit has a larger swept intensity, but the two-phase flow saturation field map shows that the inverted seven-spot well pattern has a larger swept range and water cut rise rate.
(2) The core flooding efficiency experiment shows that the increase in S/P viscosity and core permeability increase the S/P flooding efficiency. Further, under different experimental parameters, S/P flooding has a higher injection pressure and ultimate recovery factor under higher flow intensity. The oil recovery can be improved by ~10% in the strong swept region compared with the weak swept region.
(3) The remaining oil after water flooding is dominated by continuous cluster remaining oil (>70%), and the content of intergranular and slit remaining oil increases significantly after S/P flooding. The effect of dispersing and producing the remaining oil in the strong swept region is more obvious, and the remaining oil is mainly in the form of intergranular (>65%). S/P flooding mainly produces cluster remaining oil, some of which is converted into intergranular remaining oil that is difficult to produce effectively.
(4) The plate flooding experiment shows that the recovery factor of the water flooding stage in the inverted seven-spot well pattern is 6.91% higher than that of the five-spot well pattern. In the S/P flooding stage, the injection pressure of the five-spot well pattern is higher, and the effect of EOR is better. The incremental oil recovery of SP flooding in the five-spot well pattern and inverted seven-spot well pattern is 25.73% and 17.05%, respectively. The S/P system presents a good application potential in the inverted seven-spot well pattern.

Supplementary Materials

The following supporting information can be downloaded at: https://www.mdpi.com/article/10.3390/en15186632/s1, Figure S1 Schematic diagram of the inverse seven-point well pattern unit; Figure S2 The solve method of central difference method at the inner and boundary of the grid.

Author Contributions

Conceptualization, T.Q. and Z.L.; methodology, X.C. and H.L.; software, J.C.; validation, D.G., X.C. and X.T.; formal analysis, Q.Y.; investigation, X.C.; resources, X.N.; data curation, X.T.; writing—original draft preparation, X.C.; writing—review and editing, Z.L.; visualization, X.T.; supervision, X.N.; project administration, T.Q.; funding acquisition, T.Q. All authors have read and agreed to the published version of the manuscript.

Funding

This research was funded by China National Petroleum Corporation Scientific Research and Technology Development Project [2021DJ16].

Institutional Review Board Statement

Not applicable.

Informed Consent Statement

Not applicable.

Data Availability Statement

Not applicable.

Conflicts of Interest

The authors declare no conflict of interest.

References

  1. Conti, J.; Holtberg, P.; Diefenderfer, J.; LaRose, A.; Turnure, J.T.; Westfall, L. International Energy Outlook 2016 with Projections to 2040; USDOE Energy Information Administration (EIA): Washington, DC, USA, 2016. [Google Scholar] [CrossRef]
  2. Jia, C.; Zou, C.; Yang, Z.; Zhu, R.; Chen, Z.; Zhang, B.; Jiang, L. Significant progress of continental petroleum geological theory in basins of Central and Western China. Pet. Explor. Dev. 2018, 45, 573–588. [Google Scholar] [CrossRef]
  3. Zhiqiang, F.; Zihui, F.; Wei, H.; Jiangping, L.; Wei, Q.; Bo, Z. Exploration of the Daqing Oilfield for 50 years: A great practice of continental origin petroleum theory. Chin. J. Geol. 2009, 44, 349–364. [Google Scholar]
  4. Liu, Z.; Chai, M.; Chen, X.; Hejazi, S.H.; Li, Y. Emulsification in a microfluidic flow-focusing device: Effect of the dispersed phase viscosity. Fuel 2021, 283, 119229. [Google Scholar] [CrossRef]
  5. Liu, Z.; Li, Y.; Chen, X.; Chen, Y.; Lyu, J.; Sui, M. The Optimal Initiation Timing of Surfactant-Polymer Flooding in a Waterflooded Conglomerate Reservoir. SPE J. 2021, 26, 1–14. [Google Scholar] [CrossRef]
  6. Li, Y.; Chen, X.; Liu, Z.; Liu, R.; Liu, W.; Zhang, H. Effects of molecular structure of polymeric surfactant on its physico-chemical properties, percolation and enhanced oil recovery. J. Ind. Eng. Chem. 2021, 101, 165–177. [Google Scholar] [CrossRef]
  7. Liu, Z.; Li, Y.; Luan, H.; Gao, W.; Guo, Y.; Chen, Y. Pore scale and macroscopic visual displacement of oil-in-water emulsions for enhanced oil recovery. Chem. Eng. Sci. 2019, 197, 404–414. [Google Scholar] [CrossRef]
  8. Chen, X.; Li, Y.; Liu, Z.; Li, X.; Zhang, J.; Zhang, H. Core- and pore-scale investigation on the migration and plugging of polymer microspheres in a heterogeneous porous media. J. Pet. Sci. Eng. 2020, 195, 107636. [Google Scholar] [CrossRef]
  9. Chen, X.; Li, Y.; Liu, Z.; Zhang, J.; Chen, C.; Ma, M. Investigation on matching relationship and plugging mechanism of self-adaptive micro-gel (SMG) as a profile control and oil displacement agent. Powder Technol. 2020, 364, 774–784. [Google Scholar] [CrossRef]
  10. Chen, X.; Li, Y.; Liu, Z.; Zhang, J.; Li, X.; Zhang, H. Mechanism Investigation and Optimization of Conformance Control by Polymer Microsphere in Heterogeneous Offshore Oil Fields. In Offshore Technology Conference Asia; OnePetro: Kuala Lumpur, Malaysia, 2020. [Google Scholar] [CrossRef]
  11. Kong, D.; Li, Y.; Yu, M.; Ma, R.; Guo, H.; Peng, Y.; Xu, S.; Yan, H. Experimental investigation on block and transport characteristics of foam in porous media for enhanced oil recovery processes. Colloids Surf. A Physicochem. Eng. Asp. 2019, 570, 22–31. [Google Scholar] [CrossRef]
  12. Jones, S.; van der Bent, V.; Farajzadeh, R.; Rossen, W.; Vincent-Bonnieu, S. Surfactant screening for foam EOR: Correlation between bulk and core-flood experiments. Colloids Surf. A Physicochem. Eng. Asp. 2016, 500, 166–176. [Google Scholar] [CrossRef]
  13. Gupta, A.; Pandey, A.; Kesarwani, H.; Sharma, S.; Saxena, A. Automated determination of interfacial tension and contact angle using computer vision for oil field applications. J. Pet. Explor. Prod. Technol. 2022, 12, 1453–1461. [Google Scholar] [CrossRef]
  14. Kesarwani, H.; Khan, F.; Tandon, A.; Azin, R.; Osfouri, S.; Sharma, S. Performance improvement of the surfactant polymer flooding using bio synthesized calcium carbonate nanoparticles: An experimental approach. Arab. J. Sci. Eng. 2022, 1–18. [Google Scholar] [CrossRef]
  15. Tandon, A.; Khan, F.; Shukla, R.; Saxena, A.; Sharma, S.; Biswas, K.G. 3-D Micromodel for Visualization & Experimental Analysis of Flow Behavior, Surface Tension and Polymer Concentration on Enhanced Oil Recovery. In Offshore Technology Conference Asia; OnePetro: Kuala Lumpur, Malaysia, 2022. [Google Scholar] [CrossRef]
  16. Jie-Cheng, C. Field test performance of alkaline surfactant polymer flooding in Daqing oil field. Acta Pet. Sin. 2002, 23, 37. [Google Scholar] [CrossRef]
  17. Onwunalu, J.E.; Durlofsky, L. A new well-pattern-optimization procedure for large-scale field development. SPE J. 2011, 16, 594–607. [Google Scholar] [CrossRef]
  18. Humphries, T.D.; Haynes, R.D.; James, L.A. Simultaneous and sequential approaches to joint optimization of well placement and control. Comput. Geosci. 2014, 18, 433–448. [Google Scholar] [CrossRef]
  19. Gu, H.; Yang, R.; Guo, S.; Guan, W.; Yue, X.; Pan, Q. Study on Reservoir Engineering: ASP Flooding Pilot Test in Karamay Oilfield. In SPE International Oil and Gas Conference and Exhibition in China; OnePetro: Beijing, China, 1998. [Google Scholar] [CrossRef]
  20. Liu, F.; Wu, X.; Zhou, W. Application of Well Pattern Adjustment for Offshore Polymer Flooding Oilfield: A Macro-Scale and Micro-Scale Study. Chem. Technol. Fuels Oils 2020, 56, 441–452. [Google Scholar] [CrossRef]
  21. Sun, R.; Chen, Y.; Huang, Y.; Cao, G.; Huang, A.; Liu, L.; Liu, Z. Well Pattern Modification and Injection-Production Optimization for Extra-High Water Cut Oilfield. In IOP Conference Series: Earth and Environmental Science; IOP Publishing: Guangzhou, China, 2020; p. 012025. [Google Scholar] [CrossRef]
  22. Song, X.; Li, Y. Optimum development options and strategies for water injection development of carbonate reservoirs in the Middle East. Pet. Explor. Dev. 2018, 45, 723–734. [Google Scholar] [CrossRef]
  23. Bellout, M.C.; Ciaurri, D.E.; Durlofsky, L.J.; Foss, B.; Kleppe, J. Joint optimization of oil well placement and controls. Comput. Geosci. 2012, 16, 1061–1079. [Google Scholar] [CrossRef]
  24. Stahl, C.D. Areal sweepout of normal and inverted seven-spot and nine-spot patterns. Prod. Mon. 1967, 31 Pt. 2. [Google Scholar]
  25. Bellout, M.C.; Ciaurri, D.E.; Durlofsky, L.J.; Foss, B.; Kleppe, J. Sensitivity analysis of water-alternating-CO2 flooding for enhanced oil recovery in high water cut oil reservoirs. Comput. Fluids 2014, 99, 93–103. [Google Scholar] [CrossRef]
  26. Singhal, A. Physical model study of inverted seven-spot steamfloods in a pool containing conventional heavy oil. J. Can. Pet. Technol. 1980, 19, PETSOC-80-03-08. [Google Scholar] [CrossRef]
  27. Gazi, N.H.; Abdulla, F.; Al-Naqi, M.; Al-Kandari, I.; Dashti, L.; Al-Qattan, A.; Al-Farhan, F.A.; Maizeret, P.D. Design and Analysis of Interference Tests–Application to a Seven-Spot Inverted-Pattern Waterflood Pilot in the Wara Formation of the Greater Burgan Field, Kuwait. In SPE Middle East Oil and Gas Show and Conference; OnePetro: Kuala Lumpur, Malaysia, 2013. [Google Scholar] [CrossRef]
  28. Fan, H.; Wang, X.; Cao, W.; Yan, K.; Xie, K.; Lu, X.; He, M. Influence of Well Pattern Type on Remaining Oil Saturation and Distribution after Development. Energies 2022, 15, 2438. [Google Scholar] [CrossRef]
  29. Sheth, S.M.; Younis, R.M. Localized linear systems in sequential implicit simulation of two-phase flow and transport. SPE J. 2017, 22, 1542–1569. [Google Scholar] [CrossRef]
  30. Mirchi, V.; Sabti, M.J.; Piri, M.; Goual, L. Microscale Investigation of the Impact of Surfactant Structure on the Residual Trapping in Natural Porous Media. Ind. Eng. Chem. Res. 2019, 58, 9397–9411. [Google Scholar] [CrossRef]
  31. Hou, J.; Zhang, S.; Zhang, Y.; Wang, R.; Luo, F. Prediction of Microscopic Remaining Oil Distribution Using Fuzzy Comprehensive Evaluation. Transp. Porous Media 2011, 89, 533–545. [Google Scholar] [CrossRef]
  32. Zhang, R.; Yang, G.; Ma, K.; Song, Z.; Li, J.; Jiang, H. Influence factors and effect prediction model of the tertiary migrations of remaining oil. J. Pet. Explor. Prod. 2021, 11, 1–10. [Google Scholar] [CrossRef]
  33. Fang, H.; Xu, H.; Wang, Z.; Jiang, T.; Zhao, Y.; Li, J. Formation mechanism of the Donghe Sandstone residual oil zone in the Tarim Basin, NW China. J. Pet. Sci. Eng. 2018, 171, 1023–1032. [Google Scholar] [CrossRef]
  34. Zhang, L.; Yue, X.A.; Guo, F. Micro-mechanisms of residual oil mobilization by viscoelastic fluids. Pet. Sci. 2008, 5, 56–61. [Google Scholar] [CrossRef]
  35. Zhang, L.-j.; Yue, X.-a. Displacement of polymer solution on residual oil trapped in dead ends. J. Cent. South Univ. Technol. 2008, 15, 84–87. [Google Scholar] [CrossRef]
  36. Wenbin, G.; Yiqiang, L.; Shumei, H.; Deng, P.; Mingxi, L.; Cuo, G. Classification method of occurrence mode of remaining oil based on fluorescence thin sections. Acta Pet. Sin. 2020, 41, 1406. [Google Scholar] [CrossRef]
Figure 1. The pressure gradient distribution and the swept area, β B = β C = β D = β E = β F = 1 , β Z = 2 . (a) Pressure gradient; (b) swept area.
Energies 15 06632 g001
Figure 2. Pressure gradient distribution of five-spot and inverted seven-spot well patterns simulated by the tNavigator. (a) Five-spot well pattern, (b) inverted seven-spot well pattern.
Energies 15 06632 g002
Figure 3. Diagram of the displacement for EOR efficiency of S/P flooding in (a) the cylinder core and (b) the plate core.
Energies 15 06632 g003
Figure 4. The design of the plate core with reverted seven-spot well pattern and five-spot well pattern.
Energies 15 06632 g004
Figure 5. The distribution of swept intensity. (a) Inverted seven-spot well pattern; (b) five-spot well pattern.
Energies 15 06632 g005
Figure 6. The distribution of oil saturation. (a) Inverted seven-spot well pattern; (b) five-spot well pattern.
Energies 15 06632 g006
Figure 7. The injection pressure and oil recovery curves of the experiment at the core permeability is 50 mD. (a) Injection pressure curve with S/P viscosity is 23.5 mPa·s; (b) oil recovery curve with S/P viscosity is 23.5 mPa·s; (c) injection pressure curve with S/P viscosity is 44.6 mPa·s; (d) oil recovery curve with S/P viscosity is 44.6 mPa·s.
Energies 15 06632 g007
Figure 8. The injection pressure and oil recovery curves of the experiment at the core permeability is 300 mD. (a) Injection pressure curve with S/P viscosity is 23.5 mPa·s; (b) oil recovery curve with S/P viscosity is 23.5 mPa·s; (c) injection pressure curve with S/P viscosity is 44.6 mPa·s; (d) oil recovery curve with S/P viscosity is 44.6 mPa·s.
Energies 15 06632 g008
Figure 9. The occurrence of the remaining oil. (a) The ultraviolet fluorescence images; (b) the recognized remaining oil.
Energies 15 06632 g009
Figure 10. The occurrence of the remaining oil at different injection rates. (a) The remaining oil content; (b) the proportion of the remaining oil.
Energies 15 06632 g010
Figure 11. Contribution of different types of residual oil to enhanced oil recovery.
Energies 15 06632 g011
Figure 12. Variation of residual oil content in the displacement of two binary systems under different flow intensity.
Energies 15 06632 g012
Figure 13. The injection pressure, water cut, and oil recovery of S/P flooding of five-spot well pattern.
Energies 15 06632 g013
Figure 14. The injection pressure, water cut, and oil recovery of S/P flooding of inverted seven-spot well pattern.
Energies 15 06632 g014
Figure 15. The field diagrams at water flooding, S/P flooding, and subsequent water flooding. (a) Inverted seven-spot well pattern; (b) five-spot well pattern.
Energies 15 06632 g015
Table 1. The formula of the simulation formation of water.
IonsHCO3ClSO42−Ca2+Mg2+N+, K+TotalpH
Concentration, mg/L1674.527388.722.26208.0627.045145.6614,466.247.45
Table 2. The classification criteria of the four swept regions.
Strong Swept RegionMedium Swept RegionWeak Swept RegionInvalid Swept Region
>0.2 MPa/m0.1–0.2 MPa/m0.03–0.1 MPa/m<0.03 MPa/m
Table 3. The scheme of the displacement efficiency experiments.
NumberCoresPermeability, mDPorosity, %Viscosity, mPa·sInjection Rate, mL/minProcess
1Cylinder
1.5 cm × 30 cm
5023.5218.50.05S/P
flooding
till the
water cut is 98%
25023.2118.50.1
35024.0218.50.3
45023.6737.60.05
55023.6937.60.1
65023.3637.60.3
730024.6918.50.05
830025.2318.50.1
930024.6018.50.3
1030024.2637.60.05
1130024.1937.60.1
1230025.0637.60.3
Publisher’s Note: MDPI stays neutral with regard to jurisdictional claims in published maps and institutional affiliations.

