Abstract
In recent years, the microgrid system (MGS) has become an important method for the consumption of renewable energy sources (RES). In the actual operation process, the uncertainties of RES add to the complexity of the MGS operation. Furthermore, the MGS is often operated by multiple subsystem operators. The benefit distribution among subsystem operators is an important factor affecting the overall stable operation of the MGS. In order to resist the interference of the above factors, a two-stage optimization method is proposed in this paper, which includes a bi-level robust optimization (BRO) model in the overall scheduling stage of the MGS and a nucleolus-based cooperative game (NCG) model in the internal cost allocation stage among the subsystem operators. The simulations demonstrated the following outcomes: (1) the P2G device can reduce the operating cost of the MGS by converting electricity into natural gas when the electricity price is low; (2) the two-stage optimization method can ensure the stable operation of the MGS by resisting the disturbance of uncertain wind power outputs in the overall scheduling stage and realizing a reasonable cost allocation among the subsystem operators in the internal cost allocation stage.
1. Introduction
Clean and efficient energy use is gaining traction as global energy consumption keeps increasing and the problem of global warming becomes more prominent. As a result, the microgrid system (MGS) has been discussed more frequently among researchers [1,2]. The MGS integrates multiple energy facilities and loads and connects with the external power grid (PG) and natural gas pipeline network (NGPN) [3,4]. It is regarded as an effective way to promote the consumption of RES due to the characteristics of realizing energy cascade utilization and reducing environmental pollution [5,6,7]. However, the inherent intermittency and volatility of RES add to the complexity of the cogeneration operation of the MGS and lead to the consumption problem of clean energy [8]. In addition, the MGS is often operated by different subsystem operators, and whether the fair and reasonable cost (or benefit) allocation among the subsystem operators is an important guarantee for the overall stable operation of the MGS. Therefore, when researching the optimal operation strategy of the MGS, the interference of both the external uncertain RES output and the internal cooperative willingness among subsystem operators should be considered.
In recent years, many studies have been carried out for optimizing MGS operation using different strategies and optimization methods. Early studies assume accurate forecast predictions for RES and loads and focused on multi-objective optimization strategies. For instance, Elsied proposed an energy management system for the MGS, which achieved the best economic and environmental benefits while giving priority to the use of RES [9]. Wang introduced the ladder carbon trading mechanism into the operation of the regional integrated energy system (IES) to build an economic dispatching model [10]. Ju proposed a three-layer coordinated control system framework for the MGS (including a distribution management system, an MG central controller and MG controllable elements) and proposed an optimal scheduling strategy for the MGS in grid-connected and islanding modes [11]. Liu proposed a decentralized collaborative dispatch framework of IMMG based on a multi-agent consensus algorithm to solve the real-time dispatch of MGS in island mode [12]. Wang proposed a cooperative game-based approach to optimize the operation of integrated energy systems and presented an operation strategy that can simultaneously reduce system operation costs and carbon emissions [13]. Zhu proposed an interactive dispatching model of the MGS and an active distribution network, enabling the MGS to dynamically update its strategies [14]. Baron proposed a differential evolutionary particle swarm optimization (DEEPSO) algorithm to optimize the MGS operations under different scenarios and help users obtain optimal operation schemes [15].
With the increasing penetration of RES, the prediction errors for RES outputs seriously affect the efficient operation of the MGS. Therefore, scholars began to use indeterministic optimization methods to realize the economic dispatch of the MGS. For example, [16,17] proposed a stochastic optimization (SO) model to operate the combined cooling, heat and power (CCHP) system while considering the uncertainties of energy demand and prices. Chen focused on the wind-photovoltaic-based MGS in a business district in China and established a stochastic programming model for its optimal operation [18]. Alizadeh Bidgoli presented a deep learning artificial neural network (DLANN) for a microgrid system (MGS) and scheduled in daily energy management, which improved the accuracy of the system’s prediction of RES output [19]. Nguyen proposed an enhanced sparrow search algorithm to solve microgrid operation planning issues [20]. Wang proposed a robust-based multi-objective scheduling method for the MGS [21]. Zhang constructed a two-stage robust optimization (RO) model to dispatch CCHP operation with consideration for the uncertain wind power outputs and loads [22]. Lv and Li proposed the RO model to improve the IES flexibility for enhancing uncertainty adaptability [23,24].
The above studies researched optimization strategies for the MGS under the disturbance of wind power output uncertainties (WPOU), which aimed to improve the RES consumption capacity of MGS. In fact, except for the overall system optimal operation, due to the self-interest of the subsystem operators in the MGS, ensuring reasonable cost (or benefit) allocation is the premise of their cooperation. According to this, the Shapley model was built to guarantee the integration of P2G and IES [25]. Yang pointed out that the IES includes three internal subcenters and constructed an improved Shapley method to distribute the benefits among them [26]. However, with the increase in subsystem operators, the allocation result based on the Shapley value can be problematic for union combination solution explosion [27]. It is necessary to introduce a new method to optimize the cost (or benefit) allocation mechanism among the subsystem operators in MGS.
In addition, the power-to-gas (P2G) technology comes up on the stage recently, which is regard as a promising option for solving the challenge of long-term electricity storage and RES consumption [28]. Li proposed a CCHP-P2G microgrid system and proved the role of P2G in reducing operation cost [3]. Zhou introduced P2G equipment into the IES and established a RO model to schedule the system while considering the uncertain environments [29]. Therefore, this paper also introduces P2G into the MGS to achieve better operation economy and stability.
Based on the shortcomings of the above studies, this paper establishes a two-stage operation optimization method to achieve the optimal scheduling of the overall MGS and the reasonable benefit distribution among subsystem operators in the MGS. Specifically, in the overall scheduling stage, a bi-level robust optimization (BRO) model is introduced to realize the operation optimization of the MGS under the WPOU. In the internal cost allocation stage, a cooperative game theory is applied to establish a nucleolus-based cooperative game (NCG) model to ensure the cooperative operation of subsystems in the MGS. The novelties and contributions of this paper are as follows:
- Different from most studies that research the optimal operation strategy of the MGS, this paper not only focuses on the overall optimal scheduling of the MGS, but also pays attention to the cooperative game among the internal subsystem operators. This paper expands the research framework of the MGS and has a certain innovation of the research vision.
- A two-stage operation optimization method is proposed in this paper, which includes the BRO model in the overall scheduling stage and the NCG model in the internal cost allocation stage. The two-stage operation optimization method can resist the disturbance of the WPOU and realize the reasonable cost allocation among the subsystem operators, so as to ensure the economic and stable operation of the MGS.
- Five cases are designed and compared in the simulation. On the one hand it verifies the advantages of introducing P2G in improving the economy of system operation. On the other hand, it reveals the effectiveness of the two-stage operation optimization method, which can achieve the robust operation of the overall MGS and the reasonable cost allocation scheme among the subsystem operators.
The remainder of the paper is structured as follows: Section 2 describes the structure of the MGS and the component model. Section 3 establishes the two-stage operation optimization strategy. Section 4 introduces the model solving method. Section 5 displays the case study simulation results. Section 6 provides a conclusion.
2. System Description and Components Modeling
2.1. System Description
2.1.1. Overall Description of the MGS
In this section, the framework of the proposed MGS and its internal subsystems are explained, and the group components of the MGS and their energy interaction mechanisms are mainly analyzed. As shown in Figure 1, the electricity hub, gas hub and heat hub (denoted as ⨁ in Figure 1) are set up in the proposed MGS so as to couple the various devices and energy and convert the external wind, electricity and NG into different forms of energy to meet the electrical load (EL), cooling load (CL), and heating load (HL). Specifically, wind turbine (WT), power grid (PG) and microturbine (MT) sources can provide power for the MGS. The heat energy of the MGS comes from the gas boiler (GB), and the MT waste heat is absorbed by the heat recovery device (HR). In addition, the energy conversion devices, including the P2G device, electrical chiller (EC) and absorption chiller (AC), can realize the conversion of electricity, natural gas, cooling and heating energy. In addition, the energy storage devices include the electrical storage device (ES), gas storage device (GS) and heat storage device (HS).
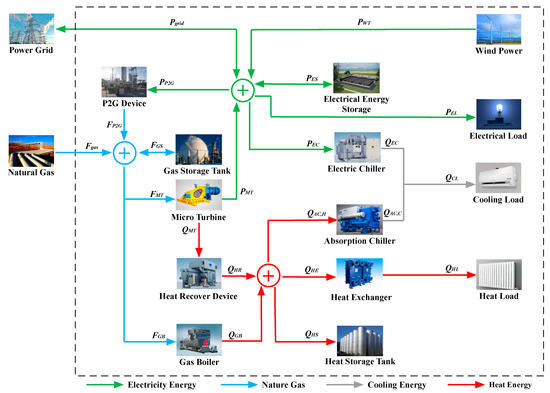
Figure 1.
Schematic diagram of the MGS.
2.1.2. Introduction of the Subsystem Operators in the MGS
As shown in Figure 2, the above-mentioned MGS is composed of the electricity power subsystem operator (EPSO), the gas subsystem operator (NGSO) and the cooling-heating subsystem operator (C-HSO). Specifically, the EPSO is composed of an MT and ES. By using the MT device to generate electricity, the EPSO can provide power to the other subsystem operators and the EL. Meanwhile, the waste heat generated by the MT can be provided to the C-HSO. The NGSO is composed of a P2G, WT and GS, which can provide NG to other subsystems by purchasing NG from the NGPN and using the P2G to produce natural gas. As for the C-HSO, it can provide cooling and heating energy for the CL and HL, and is mainly composed of a GB, EC, AC, HE and HS. Among the devices, the GB can convert NG into heat energy, and the HR can collect the waste heat generated by the EPSO. Furthermore, the AC can convert heating energy into cooling energy, and the EC can convert electricity into cooling energy.
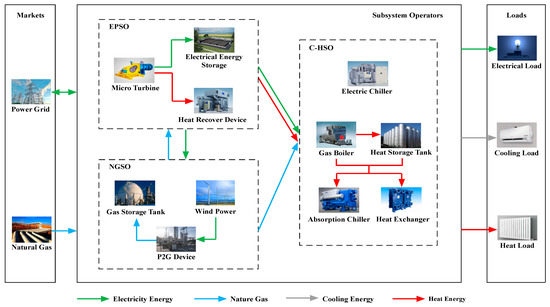
Figure 2.
Schematic diagram of subsystem operators.
In summary, the operators of the three subsystems mentioned above can cooperate and support each other through multiple energy exchanges, thereby reducing the operating costs of the whole system. However, the operators of each subsystem pursue individual interests, therefore, the possibility and stability of cooperation is determined by the cost allocation results of the cooperation process. Based on the above characteristics, a BRO model for the MGS is established in Section 3, so the entire system can achieve the minimum cost. Then, an NCG model is proposed to ensure that every subsystem operator can decrease its own cost by joining the cooperation.
2.2. Components Modeling
As described above, the MGS includes many units and devices. This sub-section introduces the output mathematical expression and output constraints of each component in the system.
- P2G device
The NG production of P2G can be calculated as follows, where represents the operation state of P2G [30]:
- 2.
- Microturbine and heat recovery device
The natural gas consumption and the heating capacity of the MT are shown in Equations (3)–(6) [31], in which and indicate the ramping rate and the operation state, respectively:
Correspondingly, the heating capacity of the HR can be calculated as:
- 3.
- Gas boiler, electrical chillers and absorption chillers
The GB, EC and AC are mainly used to meet the heating and cooling demands in the MGS. Their output performance can be modeled as:
- 4.
- Energy storage devices
The MGS proposed in this paper includes ES, GS and HS. Taking ES as an example, the energy states and energy charging/discharging processes of the energy storage devices can be formulated as follows [32]:
3. The Two-Stage Operation Optimization Method
3.1. The BRO Model in the Overall Scheduling Stage
3.1.1. Objective Function
For the whole MGS, the operation strategy aims at minimizing the total operation cost. Considering the errors between the real-time output of a WT and the predicted value, this paper constructs a BRO model. The objective function of the model is as follows:
- Day-ahead scheduling level (DSL): In each time interval, DSL determines the amount of trading power declared by the external PG, and the amount of trading NG reported to the NGPN based on the predicted wind power output to minimize the total cost of the system.
- Real-time adjusting level (RAL): Due to the error of WT output, it is necessary to adjust the flexible resources of the MGS in real-time. Therefore, in order to meet the energy supply and demand balance, the system causes corresponding scheduling costs in RAL. The robustness of the objective function is to optimize the system scheduling result under the worst wind power output error, which causes the largest cost in RAL.
3.1.2. Operational Constraints
In addition to meeting the output constraints of each component, the system also needs to meet the constraints of energy balance and external resource output constraints during the MGS operation.
- Constraints of DSL
- (1)
- energy balance constraints:
Equations (12)–(15) enforce the supply–demand balances of electricity, natural gas, heating and cooling for the MGS.
- (2)
- power exchange with PG and NGPN constraints:
In Equations (15) and (16), and , respectively, represent the energy interaction state between the MGS and the external PG and NGPN.
- (3)
- wind power curtailment constraints:
- 2.
- Constraints of RAL
Furthermore, in RAL, the actual output value of wind power may deviate from the predicted value, and the errors () can be calculated as:
In order to resist the interference of wind power output errors, the MGS needs to schedule the available flexibility resources in RAL. The actual outputs of these flexibility resources can be formulated as follows:
According to the Equations (27) and (28), the flexibility resources in the MGS include P2G, MT, ES, GS, HS, EC, AC and the external PG and NGPN. is the vector of the flexibility resources in DSL, and indicates the vector of adjusted outputs of the flexibility resources in RAL. Similarly, in RAL, should meet all the components output constraints and energy balance constraints corresponding to the DSL.
3.1.3. Formulations for Wind Power Forecasting Error Uncertainties
In this paper, the wind power output is regard as the source of uncertainty, which has negative impact on the MGS operation. In order to further define the range of wind power output errors, this paper introduces the uncertainty set construction method from [21]. The uncertainty set of the wind power output errors can be formulated as:
In Equation (29), the wind power output errors are limited in the fluctuation range of the historical data, and the conservative parameter can be adjusted to the boundaries and ranges of the uncertainty set.
3.2. The NCG Model in the Internal Cost Allocation Stage
3.2.1. A Brief Introduction of Cooperative Game
Cooperative game theory focuses on analyzing the agents’ interaction between individuals or groups in a cooperative environment and solving the problem of extra benefit or total cost allocation resulting from the coordinated action of multiple stakeholders [33]. The set of players in a cooperative game can be expressed as , and different players can form a coalition , which is a subset of , according to the needs of their own interests. Several other related definitions are listed as follows:
- 1.
- A characteristic function indicates the maximum earnings that the coalition can achieve no matter what kind of strategy is adopted by the players outside the coalition .
- 2.
- An allocation vector is a function value that describes the earnings of players in a cooperative game.
- 3.
- The following assumptions are true in the cooperative game [34]:
If for all , the allocation is individually rational;
If , the allocation is efficient;
If for all the subsets , the allocation is coalitional rational.
There are three common methods to solve cooperative game problems: core, Shapley and nucleolus. The core refers to the set of distribution vectors that cannot be superior to any coalition, but the core solution does not have unique existence [35]. Shapley value refers to the marginal contribution brought by members joining the alliance, but this method is easily subject to the problem of combination solution explosion. In order to solve these problems, Schmeider proposed the concept of nucleolus [36]. The nucleolus-based cooperative game model is introduced in the next sub-section.
3.2.2. The Nucleolus-Based Cooperative Game Model
In order to understand it, we first define the excess value, which is the difference between the maximum earnings generated when the coalition operates separately and the total cost allocated to the coalition . The excess value can be formulated as:
Obviously, the larger the value is, the less ideal the allocation is for coalition , and the less satisfied the coalition is with the allocation. The basic idea of NCG model is to minimize the dissatisfaction of the coalition with the worst cost allocation result to the allocation scheme.
The NCG method has the following characteristics [37]:
- It satisfies individual rationality and coalitional rationality;
- Each cooperative game problem has one and only one nucleolus;
- The distribution results of players in symmetrical position are the same.
These characteristics show that the NCG method has the advantages that other methods do not and can ensure the stability of the coalition. Then, according to the definitions above, the fundamental idea of nucleolus is to minimize the dissatisfaction of the most dissatisfied coalition. The objective function of the NCG model can be formulated as:
Equation (32) encompasses all the coalitions except for the empty set and the grand coalition.
4. Model Solving Method
As we can see, both the BRO model and the NCG model established above are min–max problems, which are impossible to solve directly. Therefore, in this paper, the Column and Constraint Generation (C&CG) method and the Benders Decomposition (BD) method were adopted to decompose the two models into the corresponding subproblem (SP) and master problem (MP), respectively. Then, the model solving methods can be proposed as an iterative procedure.
4.1. BRO Model Transformation
For the proposed BRO model in this paper, combined with the C&CG method, the transformed bi-level optimization model can be formulated as:
- 1.
- Transformation of the MP of the BRO model
- (1)
- Introduce variable , which satisfies the following condition:
- (2)
- Then the original objective function can be transformed into the objective function of the MP:
- (3)
- Constraints of the MP:
Firstly, the MP should meet the component output constraints of Equations (1)–(17) and operation constraints of Equations (19)–(29). Additionally, according to the principle of the BRO model, the MP needs to meet the constraints of the worst-case scenario of wind power output errors. This paper defines as the error in , which has the worst effect on the MGS operation in DSL, and is the index set of . indicates the vector of schedulable flexible resources in the system under . The MP also needs to meet the following constraint in RAL:
- 2.
- Transformation of the SP of the BRO model
- (1)
- According to the scheduling results of the MP, the objective function of the SP can be formulated as:
In Equation (36),, , , , and are slack variables, which are introduced to better meet the equality constraints of RAL.
- (2)
- Constraints of the SP:
Similar to the constraints of the MP, the SP should first meet the corresponding output constraints of the flexible resources in RAL. In addition, the SP should meet the following constraints, which include the slack variables:
It should be pointed out that there is still a min–max structure in the SP, but the difficulty of transforming its dual problem is much lower. In addition, the BRO model can be solved by multiple iterations between the MP and SP, and the last solution of the MP is the optimized scheduling result of the MGS.
4.2. NCG Model Transformation
According to the BD method, the above-mentioned NCG model can be further decomposed into the following subproblem and master problem [34]:
- 1.
- Transformation of the SP of the NCG model
- 2.
- Transformation of the MP of the NCG model
- (1)
- Introduce variable , which satisfies the following condition:
- (2)
- Then, the original objective function can be transformed into the objective function of the MP:
The MP of the NCG model takes the solution of the SP as the parameter and aims to find the allocation , which minimizes the dissatisfaction of the alliance output by the SP, so as to determine the lower bound of the BD method. Equation (43) is a Benders cut generated from the SP in the first-order approximate form of the Taylor series expansion. Because the MP is linear, the NCG model can be solved by iteration between the SP (the upper bound) and the MP (the lower bound).
4.3. Model Solving Procedure
The two-stage operation optimization method constructed in this paper is solved by finding the solution to the BRO model in the overall scheduling stage and the NCG model in the internal cost allocation stage. The solving procedure mainly includes the following steps, which is also depicted in Figure 3 [3,38]:
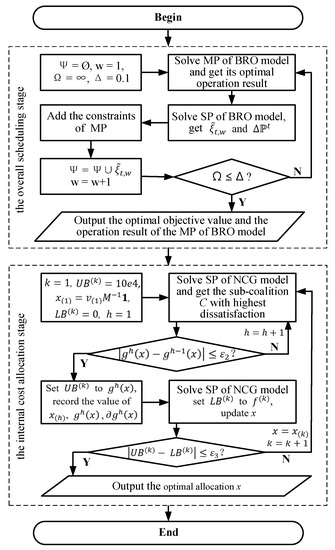
Figure 3.
Algorithm flow chart for the model solving procedure.
- (1)
- , the error tolerance of the MP is defined as ;
- (2)
- Solve the MP of the BRO model and obtain the optimal operation result in DSL;
- (3)
- According to the operation result in DSL, solve the SP of the BRO model and obtain and ;
- (4)
- Based on , add the constraints of the MP of the BRO model,
- (5)
- If , enter (6), otherwise return to (2);
- (6)
- Finish the solving procedure of the overall scheduling stage and output the optimal objective value and the operation result of the MP of the BRO model.
- (7)
- ,, , , , the error tolerance of the SP of the NCG model is defined as , and error tolerance of the MP of the NCG model is defined as ;
- (8)
- Solve the SP of the NCG model and obtain the sub-coalition with highest dissatisfaction;
- (9)
- If , enter (10), otherwise, and return to (8);
- (10)
- Set to , record the value of , and ;
- (11)
- Solve the MP of the NCG model and set to , update x;
- (12)
- If , enter (13), otherwise, , and return to (8);
- (13)
- Finish the solving procedure of the internal cost allocation stage and output the optimal allocation .
5. Simulations
5.1. Data Description
In this paper, an MGS in Sweden was selected for the simulations. As shown in Figure 1, the MGS is connected with the external PG and NGPN and integrates multiple energy facilities to meet multiple energy demands. Table 1 shows the parameters of the components in the MGS. Hourly data of electricity price and forecasted wind power output are shown in Figure 4. Specifically, the electricity price was obtained from the Nord Pool market [39], and the forecasted wind power output data was calculated according to the forecasted wind speed data in TENNET [40,41]. Based on the errors of the forecasted wind speed in TENNET, this paper obtained the data for the wind power output errors. In addition, the multiple loads in the MGS are shown in Figure 5.

Table 1.
Relevant parameters for components in the MGS.
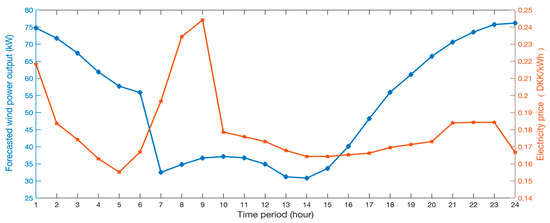
Figure 4.
Hourly data of forecasted wind power output and electricity price.
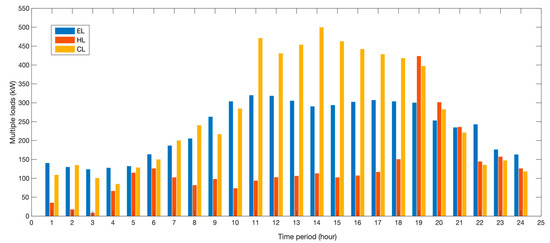
Figure 5.
Hourly data of multiple loads.
5.2. Scenario Settings
In this sub-section, five scenarios were set to test the advantage of the MGS structure and the effect of the two-stage operation optimization method. Specifically, Case 1 and Case 2 were designed to jointly verify the effectiveness of the two-stage operation optimization method proposed in this paper. Case 3–Case 5 aimed to verify the advantages of the proposed system and model by comparison with Case 1 and Case 2. It should be noted that since the SO model is also commonly used to solve similar issues, Case 4 was particularly designed to verify the advantages of the model proposed in this paper compared to the SO model. Case 4 is referred to [42], and adds the constraints related to the P2G device on its basis. In addition, Case 5 was set for comparison with Case 2 to verify the effectiveness of the proposed NCG model and the advantages of cooperation. The five scenarios are as follows:
Case 1: Carrying out the BRO model on the proposed MGS as shown in Figure 1;
Case 2: Carrying out the NCG model on the basis of Case 1;
Case 3: Carrying out the BRO model on an MGS without P2G;
Case 4: Carrying out an SO model on the proposed MGS as shown in Figure 1;
Case 5: The subsystems in the MGS operate independently.
5.3. Operation Results Analysis
The results of the above cases are described and compared in this sub-section, so as to verify the structural advantage of the MGS and the effectiveness of the two-stage operation optimization method proposed in this paper.
- Optimization results of Case 1
The optimal objective value is 2180.87 DKK, and the dispatching results of multiple energies in the MGS are shown in Figure 6a–d.
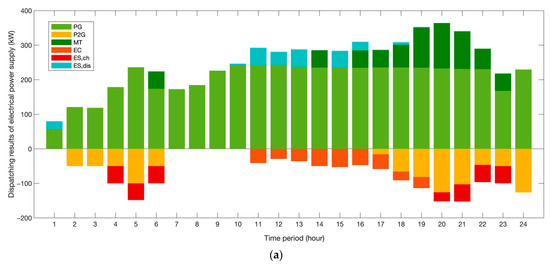
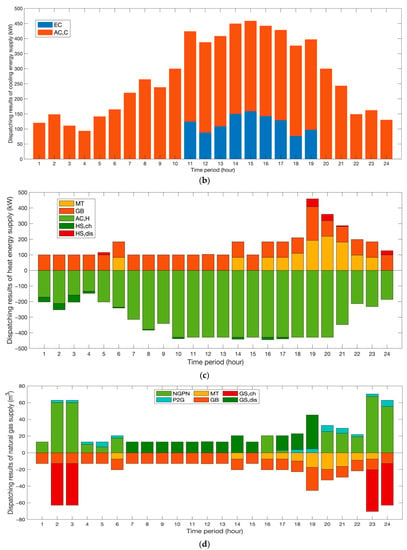
Figure 6.
Optimal operation results of Case 1. (a) Electrical power optimal scheduling results; (b) Cooling energy optimal scheduling results; (c) Heat energy optimal scheduling results; (d) Natural gas optimal scheduling results.
According to Figure 6a, the MGS gave priority to dispatching the electricity purchased from the external PG except during the peak period (e.g., during the 7–9 h time period). This is because, in most periods, purchasing electricity directly from the PG is more cost-effective than using the MT for power generation. Moreover, in order to improve the economy and stability of the MGS operation, the ES discharged to the system (e.g., during the 10–15 h time period) when WT generation was reduced, and EL was at its peak, and the ES charged in the period of low electricity price (e.g., during the 4–6 and 20–23 h time periods).
As shown in Figure 6b,c, the cooling energy mainly came from the AC, and the EC only worked at the peak of the CL (e.g., during the 11–19 h time period). The HL mainly depended on the GB, but when the MT worked, the system preferentially used its waste heat to improve the economy. Similarly, the GS was mainly scheduled to supplement the insufficient heat energy of the system during the peak of the HL (e.g., during the 19–21 h time period).
As for the natural gas, the optimal scheduling results are shown in Figure 6d, and the NG required by the MGS mainly came from the external NGPN. The GS charge was concentrated during the two periods when the NG supply by the NGPN was at its peak (e.g., during the 2–3 and 23–24 h time periods), while the GS discharged more slowly, with essentially the same amount of NG released during the 7–15 h time period. Furthermore, the P2G turned electricity into NG when the electricity price was low, and WT output increased.
- 2.
- Benefit verification for integrating P2G into the MGS
In this sub-section, a comparative analysis of Case 1 and Case 3 was carried out to further demonstrate the benefit of P2G on system energy scheduling. The optimal objective value of the MGS without P2G is 2248.72 DKK, while the operation cost of Case 1 is 2180.87 DKK, which is lower than that of Case 3. Specifically, as shown in Figure 7, the MGS purchased more electricity from the PG when the electricity price was low, while the MGS without P2G purchased more NG to meet multiple loads, which explains the higher operation costs of Case 3. To sum up, the MGS proposed in this paper purchased cheaper electrical power from the PG and converted it to NG by P2G. This NG can be stored to reduce the amount of NG purchased, thus reducing the operating costs of the MGS.
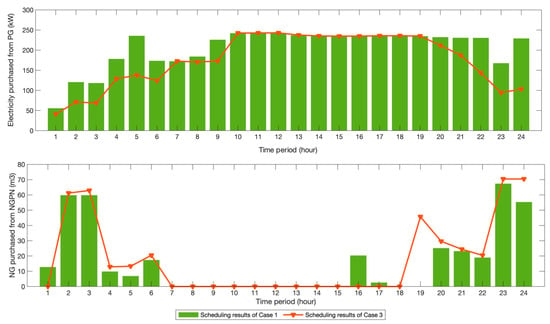
Figure 7.
Purchases of NG and electricity in Cases 1 and Case 3.
- 3.
- Advantage verification for the BRO model
The comparative analysis of the optimization results of Case 4 and Case 1 was carried out in this sub-section to verify the advantage of the BRO model. Based on the premise that the probability distribution of the wind output errors is the same in the two cases, a sample average framework that aims to obtain the lowest expected operation cost was used. Then, the SO and BRO models were solved based on different sample sizes. In addition, the Monte Carlo method was applied to generate another 10,000 wind power forecasting error scenarios to test the performance of the two models, and the results are shown in Figure 8.

Figure 8.
The MCAC of Case 1 and Case 4 with different sample sizes.
It was found that the MCAC of Case 1 and Case 4 showed a downward trend with the increase in sample size, but the MCAC of Case 1 was always less than Case 4. When the sample size was small, the MCAC of Case 4 was much higher than that of Case 1. This is because when the historical data is insufficient, the wind power output errors are large. In this scenario, the SO model’s ability to resist the uncertainties of wind power output was lower than the BRO model, which may lead to higher wind abandonment, resulting in additional penalty costs. To summarize, compared with the BRO model, the SO model required larger sample size to achieve the same MCAC, in other words, the BRO model showed a better robustness for the same level of sample sizes.
Furthermore, Table 2 shows that the BRO model has an obvious advantage in calculation convenience. With the increase in sample size, the number of scenes generated by the SO model increases explosively, resulting in increased computational complexity and longer computing times.

Table 2.
Computational times of Case 1 and Case 4 with different sample sizes.
- 4.
- Effectiveness verification for the NCG model
In order to verify the effectiveness of the proposed NCG model, this sub-section compares and analyzes the operating costs of each subsystem operator in Case 2 and Case 5. Firstly, based on the optimal operation cost of Case 1, the BD method was applied to solve the NCG model to obtain the operating cost of each subsystem operator in the cooperation scenario. Secondly, according to the setting of Case 5, the operating costs of each subsystem operator in the scenario of independent operation was calculated. Then, a comparison of the reduction of operating costs of the whole system and each subsystem operator. The specific results are shown in Table 3.

Table 3.
Operating costs of Case 1 and Case 5.
According to Table 3, when each subsystem in the system cooperated, the individual operation cost and the overall operation cost of the MGS was reduced. It should be emphasized that when the subsystems operate independently, the NGSO mainly converts wind power into NG, which can generate corresponding profits, so its operation cost is −233.66 DKK. When the subsystems operate cooperatively, the operating cost allocated to the NGSO using the NCG model was −299.32 DKK, which produced excess profit. Through the comparative analysis of Case 4 and Case 5, it can be concluded that the cooperative operation of each subsystem is better than the separate operation, and the NCG model can ensure reasonable cost allocation.
6. Conclusions
The MGS is an important support for “building a clean, low-carbon, safe and efficient modern energy system”. This paper introduces the integration of P2G into the MGS and proposes a two-stage operation optimization method to realize the economic and stable operation of the system. Specifically, in the overall scheduling stage, the BRO model was constructed to optimize the system operation while considering the wind power output uncertainties. In the internal cost allocation stage, the NCG model was established to reasonably allocate the operation cost among subsystem operators. The conclusions are summarized as follows:
- The introduction of P2G into the MGS can reduce the operation cost of the system. The main reason is that P2G can convert the additional power into NG when the electricity price is low, which reduces the amount of NG purchased by the system from the NGPN so as to reduce the operation cost.
- In the overall scheduling stage, compared with the SO model, the BRO model has better robustness and lower computational complexity. When the sample size is small, the SO model is often unable to resist the wind power output errors, resulting in a higher optimal objective value. When the sample size is large, the SO model will consider too many scenarios, resulting in a rapid increase in its computational complexity.
- In the internal cost allocation stage, when the subsystems operate cooperatively, it can not only ensure the overall operation stability of the MGS but also bring lower operation costs. In this scenario, the NCG model proposed in this paper can realize the reasonable cost allocation among all subsystems, reduce their operation costs and increase their willingness to cooperate.
In future studies, the optimal operational strategy for carbon capture, utilization and storage (CCUS) participation in the MGS can be further discussed in order to achieve zero carbon emissions of the MGS.
Author Contributions
Conceptualization, F.Z.; methodology, Y.S. and F.Z.; software, F.Z.; investigation, J.Z.; writing—original draft preparation, Y.S. and F.Z.; writing—review and editing, F.Z.; supervision, Y.L.; funding acquisition, Y.L. All authors have read and agreed to the published version of the manuscript.
Funding
This research was funded by the Beijing Municipal Natural Science Foundation, grant number 9224037 and 9222028. The APC was funded by the Beijing Municipal Natural Science Foundation.
Data Availability Statement
Not applicable.
Conflicts of Interest
The authors declare no conflict of interest. The funders had no role in the design of the study; the data collection, analyses, or interpretation; the writing of the manuscript; or the decision to publish the results.
Nomenclature
| Constants: | |
| the price of electricity in power grid | |
| the price of natural gas | |
| the heat value of natural gas | |
| the power efficiency of P2G | |
| the power efficiency of microturbine | |
| the coefficient of performance for microturbine | |
| the coefficient of performance for gas boiler | |
| the coefficient of performance for electrical chiller | |
| the coefficient of performance for absorption chiller | |
| the recovery efficiency of heat recovery device | |
| the exchange efficiency of heat exchange device | |
| the initial residual energy of electrical storage device | |
| the minimum energy storage limit of electrical storage device | |
| the rated capacity of electrical storage device | |
| the charging efficiency of electrical storage device | |
| the discharging efficiency of electrical storage device | |
| the predicted output of wind turbine | |
| the actual output of wind turbine during period t | |
| the wind power abandonment punishment | |
| Variables: | |
| the wind power abandonment at time interval t | |
| the electricity exchanged with external power grid at time interval t | |
| the natural gas purchased from the external pipeline network at time interval t | |
| the power of P2G at time interval t | |
| the microturbine generation at time interval t | |
| the natural gas consumption of microturbine at time interval t | |
| the natural gas consumption of gas boiler at time interval t | |
| the gas boiler heat energy generation at time interval t | |
| the electrical chiller cooling energy generation at time interval t | |
| / | the charge/discharge rate of electrical storage device at time interval t |
| the energy level of electrical storage device at time interval t | |
| the electrical load at time interval t | |
| the cooling load at time interval t | |
| the heating load at time interval t | |
| the wind power output error at time interval t | |
| the vector of adjusted outputs of the flexibility resources in RAL at time interval t | |
| the uncertainty set of wind power output errors | |
| , , , , , , , , , and are binary variables, which indicate the operation state. 1 if the device is in the released status during period t; 0 otherwise. | |
References
- Adefarati, T.; Bansal, R.C. Reliability, economic and environmental analysis of a microgrid system in the presence of renewable energy resources. Appl. Energy 2019, 236, 1089–1114. [Google Scholar] [CrossRef]
- Lekvan, A.A.; Habibifar, R.; Moradi, M.; Khoshjahan, M.; Nojavan, S.; Jermsittiparsert, K. Robust Optimization of Renewable-Based Multi -Energy Micro-Grid Integrated with Flexible Energy Conversion and Storage Devices. Sustain. Cities Soc. 2021, 64, 102532. [Google Scholar] [CrossRef]
- Li, Y.; Zhang, F.; Li, Y.; Wang, Y. An Improved Two-Stage Robust Optimization Model for CCHP-P2G Microgrid System Considering Multi-Energy Operation under Wind Power Outputs Uncertainties. Energy 2021, 223, 120048. [Google Scholar] [CrossRef]
- Sun, Q.; Chen, Y.; Sun, Q.; Chen, Y. Multi-energy flow calculation method for we-energy based energy internet. In Proceedings of the IEEE International Conference on Energy Internet, Beijing, China, 17–21 April 2017. [Google Scholar]
- Xing, J.; Sun, S.; Cheng, Y.; Liu, Y.; Yu, P.; Wang, Y.; Wang, S.; Zhang, X.; Zhou, G.; Wang, N.; et al. Optimal Dispatching of Integrated Energy System Based on Multi-Energy Complementation. J. Phys. Conf. Ser. 2022, 2195, 012014. [Google Scholar] [CrossRef]
- Huang, Y.; Wang, Y.; Liu, N. A Two-Stage Energy Management for Heat-Electricity Integrated Energy System Considering Dynamic Pricing of Master-Slave Game and Operation Strategy Optimization. Energy 2021, 244, 122576. [Google Scholar] [CrossRef]
- Wang, Y.L.; Huang, Y.J.; Wang, Y.D.; Zeng, M.; Yu, H.Y.; Li, F.; Zhang, F. Optimal scheduling of the RIES considering time-based demand response programs with energy price. Energy 2018, 164, 773–793. [Google Scholar] [CrossRef]
- Li, Y.; Wang, C.; Li, G.; Wang, J.; Zhao, D.; Chen, C. Improving operational flexibility of integrated energy system with uncertain renewable generations considering thermal inertia of buildings. Energy Convers. Manag. 2020, 207, 112526. [Google Scholar] [CrossRef]
- Elsied, M.; Oukaour, A.; Gualous, H.; Hassan, R. Energy management and optimization in microgrid system based on green energy. Energy 2015, 84, 139–151. [Google Scholar] [CrossRef]
- Wang, Y.; Wang, Y.; Huang, Y.; Yang, J.; Ma, Y.; Yu, H.; Zeng, M.; Zhang, F.; Zhang, Y. Operation optimization of regional integrated energy system based on the modeling of electricity-thermal-natural gas network. Appl. Energy 2019, 251, 113410. [Google Scholar] [CrossRef]
- Ju, L.; Zhang, Q.; Tan, Z.; Wang, W.; Xin, H.; Zhang, Z. Multi-Agent-System-Based Coupling Control Optimization Model for Micro-Grid Group Intelligent Scheduling Considering Autonomy-Cooperative Operation Strategy. Energy 2018, 157, 1035–1052. [Google Scholar] [CrossRef]
- Liu, Z.; Yi, Y.; Yang, J.; Tang, W.; Zhang, Y.; Xie, X.; Ji, T. Optimal Planning and Operation of Dispatchable Active Power Resources for Islanded Multi-microgrids under Decentralised Collaborative Dispatch Framework. IET Gener. Transm. Distrib. 2019, 14, 408–422. [Google Scholar] [CrossRef]
- Wang, Y.; Liu, Z.; Cai, C.; Xue, L.; Ma, Y.; Shen, H.; Chen, X.; Liu, L. Research on the Optimization Method of Integrated Energy System Operation with Multi-Subject Game. Energy 2022, 245, 123305. [Google Scholar] [CrossRef]
- Zhu, Z.; Wing Chan, K.; Bu, S.; Zhou, B.; Xia, S. Real-Time Interaction of Active Distribution Network and Virtual Microgrids: Market Paradigm and Data-Driven Stakeholder Behavior Analysis. Appl. Energy 2021, 297, 117107. [Google Scholar] [CrossRef]
- Baron, C.; Al-Sumaiti, A.S.; Rivera, S.R. Impact of Energy Storage Useful Life on Intelligent Microgrid Scheduling. Energies 2020, 13, 957. [Google Scholar] [CrossRef]
- Wang, Y.; Yang, Y.; Tang, L.; Sun, W.; Zhao, H. A stochastic-CVaR optimization model for CCHP micro-grid operation with consideration of electricity market, wind power accommodation and multiple demand response programs. Energies 2019, 12, 3983. [Google Scholar] [CrossRef]
- Kuang, J.; Zhang, C.; Sun, B. Stochastic Dynamic Solution for Off-Design Operation Optimization of Combined Cooling, Heating, and Power Systems with Energy Storage. Appl. Therm. Eng. 2019, 163, 114356. [Google Scholar] [CrossRef]
- Chen, Y.; He, L.; Li, J. Stochastic dominant-subordinate-interactive scheduling optimization for interconnected microgrids with considering wind-photovoltaic-based distributed generations under uncertainty. Energy 2017, 130, 581–598. [Google Scholar] [CrossRef]
- Alizadeh Bidgoli, M.; Ahmadian, A. Multi-Stage Optimal Scheduling of Multi-Microgrids Using Deep-Learning Artificial Neural Network and Cooperative Game Approach. Energy 2022, 239, 122036. [Google Scholar] [CrossRef]
- Nguyen, T.-T.; Ngo, T.-G.; Dao, T.-K.; Nguyen, T.-T.-T. Microgrid Operations Planning Based on Improving the Flying Sparrow Search Algorithm. Symmetry 2022, 14, 168. [Google Scholar] [CrossRef]
- Wang, L.; Li, Q.; Ding, R.; Sun, M.; Wang, G. Integrated scheduling of energy supply and demand in microgrids under uncertainty: A robust multi-objective optimization approach. Energy 2017, 130, 1–14. [Google Scholar] [CrossRef]
- Zhang, C.; Dong, Z.Y.; Xu, Y.; Chen, Y. A two-stage robust operation approach for combined cooling, heat and power system. In Proceedings of the IEEE Conference on Energy Internet and Energy System Integration, Beijing, China, 26–28 November 2017; IEEE: New York, NY, USA, 2017; pp. 1–6. [Google Scholar]
- Lv, C.; Yu, H.; Li, P.; Wang, C.; Xu, X.; Li, S.; Wu, J. Model predictive control based robust scheduling of community integrated energy system with operational flexibility. Appl. Energy 2019, 243, 250–265. [Google Scholar] [CrossRef]
- Li, X.; Wang, W.; Wang, H. A novel bi-level robust game model to optimize a regionally integrated energy system with large-scale centralized renewable-energy sources in Western China. Energy 2021, 228, 120513. [Google Scholar] [CrossRef]
- Yang, S.; Tan, Z.; Zhao, R.; De, G.; Li, H.; Ju, L.; Zhou, F. Operation optimization and income distribution model of park integrated energy system with power-to-gas technology and energy storage. J. Clean. Prod. 2020, 247, 119090. [Google Scholar] [CrossRef]
- Yang, S.; Tan, Z.; Lin, H.; Li, P.; De, G.; Zhou, F.; Ju, L. A two-stage optimization model for Park Integrated Energy System operation and benefit allocation considering the effect of Time-Of-Use energy price. Energy 2020, 195, 117013. [Google Scholar] [CrossRef]
- Yu, Q.; Xie, J.; Chen, X.; Yu, K.; Gan, L. Loss and emission reduction allocation in distribution networks using MCRS method and Aumann–Shapley value method. IET Gener. Transm. Distrib. 2018, 12, 5975–5981. [Google Scholar] [CrossRef]
- Jentsch, M.; Trost, T.; Sterner, M. Optimal use of power-to-gas energy storage systems in an 85% renewable energy scenario. Energy Procedia 2014, 46, 254–261. [Google Scholar] [CrossRef]
- Zhou, S.; Sun, K.; Wu, Z.; Gu, W.; Wu, G.; Li, Z.; Li, J. Optimized operation method of small and medium-sized integrated energy system for P2G equipment under strong uncertainty. Energy 2020, 199, 117269. [Google Scholar] [CrossRef]
- Heinisch, V. Effects of power-to-gas on power systems: A case study of Denmark. In Proceedings of the 2015 IEEE Eindhoven PowerTech, Eindhoven, The Netherlands, 29 June–2 July 2015. [Google Scholar]
- Mohammadkhani, N.; Sedighizadeh, M.; Esmaili, M. Energy and emission management of CCHPs with electric and thermal energy storage and electric vehicle. Therm. Sci. Eng. Prog. 2018, 8, 494–508. [Google Scholar] [CrossRef]
- Luo, Y.; Yin, Z.; Yang, D.; Zhou, B. A new wind power accommodation strategy for combined heat and power system based on Bi-Directional conversion. Energies 2019, 12, 2458. [Google Scholar] [CrossRef]
- Songhuai, D.; Xinghua, Z.; Lu, M.; Hui, X. A novel nucleolus-based loss allocation method in bilateral electricity markets. IEEE Trans. Power Syst. 2006, 21, 28–33. [Google Scholar] [CrossRef]
- Du, Y.; Wang, Z.; Liu, G.; Chen, X.; Yuan, H.; Wei, Y.; Li, F. A cooperative game approach for coordinating multi-microgrid operation within distribution systems. Appl. Energy 2018, 222, 383–395. [Google Scholar] [CrossRef]
- Osicka, O.; Guajardo, M.; van Oost, T. Cooperative game-theoretic features of cost sharing in location-routing. Int. Trans. Oper. Res. 2020, 27, 2157–2183. [Google Scholar] [CrossRef]
- Stamtsis, G.C.; Erlich, I. Use of cooperative game theory in power system fixed-cost allocation. IEE Proc. Gener. Transm. Distrib. 2004, 151, 401–406. [Google Scholar] [CrossRef]
- Parlar, M.; Sharafali, M.; Goh, M. Optimal control and cooperative game theory based analysis of a by-product synergy system. J. Clean. Prod. 2019, 233, 731–742. [Google Scholar] [CrossRef]
- Freire, L.; Street, A.; Lima, D.A.; Barroso, L.A. A hybrid MILP and benders decomposition approach to find the nucleolus quota allocation for a renewable energy portfolio. IEEE Trans. Power Syst. 2015, 30, 3265–3275. [Google Scholar] [CrossRef]
- Nord Pool Market. Available online: https://www.nordpoolgroup.com/ (accessed on 5 September 2022).
- Wang, Y.; Yang, Y.; Tang, L.; Sun, W.; Li, B. A Wasserstein based two-stage distributionally robust optimization model for optimal operation of CCHP micro-grid under uncertainties. Int. J. Electr. Power Energy Syst. 2020, 119, 105941. [Google Scholar] [CrossRef]
- TenneT. Available online: https://www.tennet.eu/ (accessed on 5 September 2022).
- Cheng, L.; Liu, C.; Wu, Q.; Gao, S. A stochastic optimal model of micro energy internet contains rooftop PV and CCHP system. In Proceedings of the 2016 International Conference on Probabilistic Methods Applied to Power Systems (PMAPS), Beijing, China, 16–20 October 2016. [Google Scholar]
Publisher’s Note: MDPI stays neutral with regard to jurisdictional claims in published maps and institutional affiliations. |
© 2022 by the authors. Licensee MDPI, Basel, Switzerland. This article is an open access article distributed under the terms and conditions of the Creative Commons Attribution (CC BY) license (https://creativecommons.org/licenses/by/4.0/).