Article

A Comprehensive Assessment of Products Management and Energy Recovery from Waste Products in the United States

Department of Earth and Environmental Engineering, Columbia University, New York, NY 10027, USA
*
Author to whom correspondence should be addressed.
Energies 2022, 15(18), 6581; https://doi.org/10.3390/en15186581
Submission received: 10 August 2022 / Revised: 3 September 2022 / Accepted: 5 September 2022 / Published: 8 September 2022
(This article belongs to the Special Issue Big Data and Advanced Analytics in Energy Systems and Applications)

Abstract

:
This study uses the U.S. EPA data and classification of products, which includes three main categories: durables with a lifetime over 3 years, non-durables with a lifetime below 3 years, and containers and packages, which are consumed within one year. It builds connections between the management of waste products and the energy sector, by evaluating the potential contribution of such products to the U.S. energy grid, and assessing the opportunity to substitute fossil fuels, both for electricity and residential heat production. Finally, this study conducts a vis-à-vis comparison between the U.S. and the EU progress on waste management, and the associated GHG emissions. Sankey diagrams were produced to represent the flows of products management from 1990 to 2018, and the results were assessed by considering the amounts produced, the composition, and the disposition methods used, the energy potential of waste products landfilled, and the associated greenhouse gases (GHG) emissions. The results indicate that the recycling of containers and packages have increased significantly during the 28-year period and became the dominant method of managing such products in the U.S. in 2015. Durable and non-durable products are mainly landfilled, and the situation has remained unchanged in the 2010s. Assuming that 30% of waste products landfilled in the U.S. were combusted for energy instead, it would have resulted in the substitution of <5% of fossil fuels used for electricity, but up to a 68% substitution of fossil fuels, such as propane, used for residential space and water heating. In the U.S., over 85% of GHG emissions are associated with the landfilling of waste materials, and although improvements in capturing and beneficially utilizing methane are implemented, the total GHG emissions have remained almost the same since 2015, with a tendency to increase. The European experience has shown that recycling and waste-to-energy are complementary in diverting materials from landfills, in enhancing energy security, and in significantly reducing GHG emissions from waste management. Future directions are discussed.

1. Introduction

The current waste hierarchy upon which the U.S. waste policy and legislation is based, is often described by the 3Rs: Reduce-Reuse-Recycle. Preventing waste is the preferred option, then in descending order is “preparing for re-use”, “recycling”, “other recovery”, e.g., energy recovery through waste-to-energy (WTE) for non-recyclable waste, and as a last resort the “disposal” of waste, including incineration without energy recovery and landfilling [1]. Sanitary landfilling is given a lower priority than WTE [2], although it is less costly to implement. One reason for this is that sanitary landfilling requires a lot of land and also has much higher environmental impacts than WTE. In addition, the Global Methane Pledge [3] requires actions to reduce methane produced from several sectors of our economy, with a great emphasis on landfills, since they are the third largest methane producer in the U.S., after agriculture and natural gas and petroleum systems [4,5,6]. Therefore, sustainable waste management is usually focused on diverting materials from landfills towards recycling, and non-recyclables towards WTE. However, in the U.S., in 2018, approximately 50% of wastes produced were disposed of in landfills [7,8].
Studies on waste management typically consider materials, which compromise the products consumed in our societies. For instance, researchers used the types of waste materials, such as plastics, paper, metals, glass, etc., and evaluated their relationship with the economic growth in the U.S., by using the consumer price index (CPI) [9]. Similarly, scientists from the North Carolina State University, used a comprehensive list of waste materials to develop a solid waste optimization life-cycle framework [10], and later on a streamlined life cycle analysis (LCA) for solid waste management systems [11], but also, to evaluate recycling facilities [12]. Other studies have focused on the potential of waste materials to produce energy and recyclable materials, by conducting country- or city-level assessments [13,14,15,16], or by evaluating different life cycle scenarios in regard to policy directions, such as the circular economy [17,18,19,20,21]. However, the focus was again on the specific waste materials, and not on products consumed. Furthermore, there are no studies to evaluate the energy potential of waste products in the US in regard to their contribution to the energy mix.
This study uses a classification, which is based on consumer products, such as batteries, major appliances, etc., and not on the types of wastes produced, such as plastic, glass, metal, etc. The results of this study can therefore be used to approach a broad range of audience interested in the management of consumer products in the U.S. In addition, this study builds connections between the management of waste products and the energy sector by evaluating the potential contribution of such products to the U.S. energy grid, and assessing the opportunity to substitute fossil fuels, both for electricity and residential heat production. Finally, this study conducts a vis-à-vis comparison between the U.S. and the EU progress on waste management, and the associated GHG emissions, and identifies some of the key policy elements required to create a more circular/sustainable development path for waste management in the U.S.

2. Materials and Methods

2.1. Product Classification and Sources Used

Data from the U.S. EPA were used [8]. The products were classified into three main categories, according to the U.S. EPA definitions: durables, non-durables, and packaging and containers [22]. Durables are products with a lifetime above 3 years, and durables are products with a lifetime below three years. Containers and packaging are products with a lifetime within a year, usually, but they are classified as an independent category, which relates to the high number of wastes produced [13]. In total, twenty-two products were assessed in terms of amounts produced and disposition method, by using data from U.S. EPA, from 1990 to 2018 [13]. Durables contain seven products, non-durable eight, and packaging and containers include seven products. The numbers refer to the total products collected for recycling, landfilling, and energy recovery. A list of the products considered in each category is provided in Table 1. A period from 1990 to 2018 was considered for the analysis, but additional years were considered, such as 1980, and 2005, to support some of the observations of the study. Data on the composition of the broad categories assessed, related to the materials, such as plastics, glass, etc., included in durable, non-durable products, and containers and packages, were obtained from the U.S. EPA [23]. However, data for 2018 are only available.
The Python package used for producing the Sankey diagrams is Holoview [24], which uses the Bokeh package as the dependency [25]. For all the other figures, the Matplotlib package is used [26].

2.2. Changes in the Total Amount and Disposal Rates of Products Managed in the U.S.

Python was used to conduct material flow analysis and describe the flows of durable and non-durable products, containers, and packaging, from the collection to the disposition. Sankey diagrams were produced, the recycling, landfilling, and energy recovery rates were estimated, and the changes in the rates and amounts were compared in four intervals: 1990, 2000, 2010, and 2018. Data on the composition of the broad categories assessed; in terms of materials included, such as plastics, glass, metal, paper, etc., along with the disposition of these materials, were evaluated. Graphs summarizing the results were produced, using Python.

2.3. Potential Contribution of Waste Products to the U.S. Energy Grid

Data from the Energy Information Association (EIA) were used on the electricity and residential space and water heating demand [27] in the U.S. For the conversion of the amount of fossil fuels used, such as cubic feet of natural gas, to the amount of energy produced, such as MWh, the EIA energy conversion calculator was used [28]. A hypothetical scenario was developed, where 30% of the residual products, i.e., products with no value in the market or recycling potential, would be combusted for energy instead of landfilled. This assumption is based on three key points:
(i)
WTE is a more preferable option for non-recyclable materials, compared to landfilling, according to the U.S. EPA hierarchy [1].
(ii)
The most successful paradigms of sustainable waste management achieved up to 60–70% recycling and the rest is used as fuel in WTE plants [29].
(iii)
Recent studies concluded that even if nations achieve ambitious recycling targets by 2035, there will still be a fraction of up to 30% at least, of residual materials, which should be used as fuels in WTE plants [30].
Therefore, the 30% WTE represents a rather conservative scenario for the use of WTE in diverting materials from landfills. A second assumption was made in regard to the energy recovery of combustion-based WTE plants. WTE recovers two forms of energy from the combustion of residual MSW (depends on the calorific value): (a) electricity (~0.5 MWh/tonne of waste), and/or (b) steam (~1.5 MWh/tonne) that can be used for: (i) district heating/cooling, and/or (ii) the industries, such as desalination, wastewater plants, paper mills, etc. [31]. Thus, these energy factors, along with the amounts landfilled in 2018, were used to estimate the potential contribution of waste products to the U.S. energy grid. It should be noted that these factors are typically used to evaluate with the ‘rule-of-thumb’ the viability of WTE plants. The energy potential of waste products is mainly driven by their calorific value [27,30,31]. Thus, in practice, these factors are expected to be higher, considering that the categories assessed in this paper do not contain any organic fraction, which relates to a low heating value, compared to other consumables, such as plastic and paper materials [27,31].

2.4. GHG Emissions from Waste Management in the U.S. and the EU

Data from the U.S. EPA were used, on the total amount of wastes produced, recycled, combusted for energy, and landfilled [32], but also on the associated GHG emissions [33] from 1990 to 2018. In comparison, data from the Eurostat were used to assess the relationship between waste disposition methods [34] and associated GHG emissions [35]. Both the EU and U.S. National GHG Inventory Systems, consider the direct impacts from waste management activities, and exclude indirect benefits, for example, the substitution of primary resources from recycling products, and the substitution of fossil fuels by WTE. Both inventories are consistent with Intergovernmental Panel on Climate Change (IPCC) “good practice,” the 2006 IPCC Guidelines for National Greenhouse Gas Inventories, and the latest United Nations Framework Convention on Climate Change (UNFCCC) transparency requirements. Both inventories use the 100-time horizon to convert emissions to CO2-eq. Methane, CH4, has an emission factor of 28*CO2 [5]. Python was used to produce the graphs.

3. Results and Discussion

3.1. Management of Waste Products in the U.S.

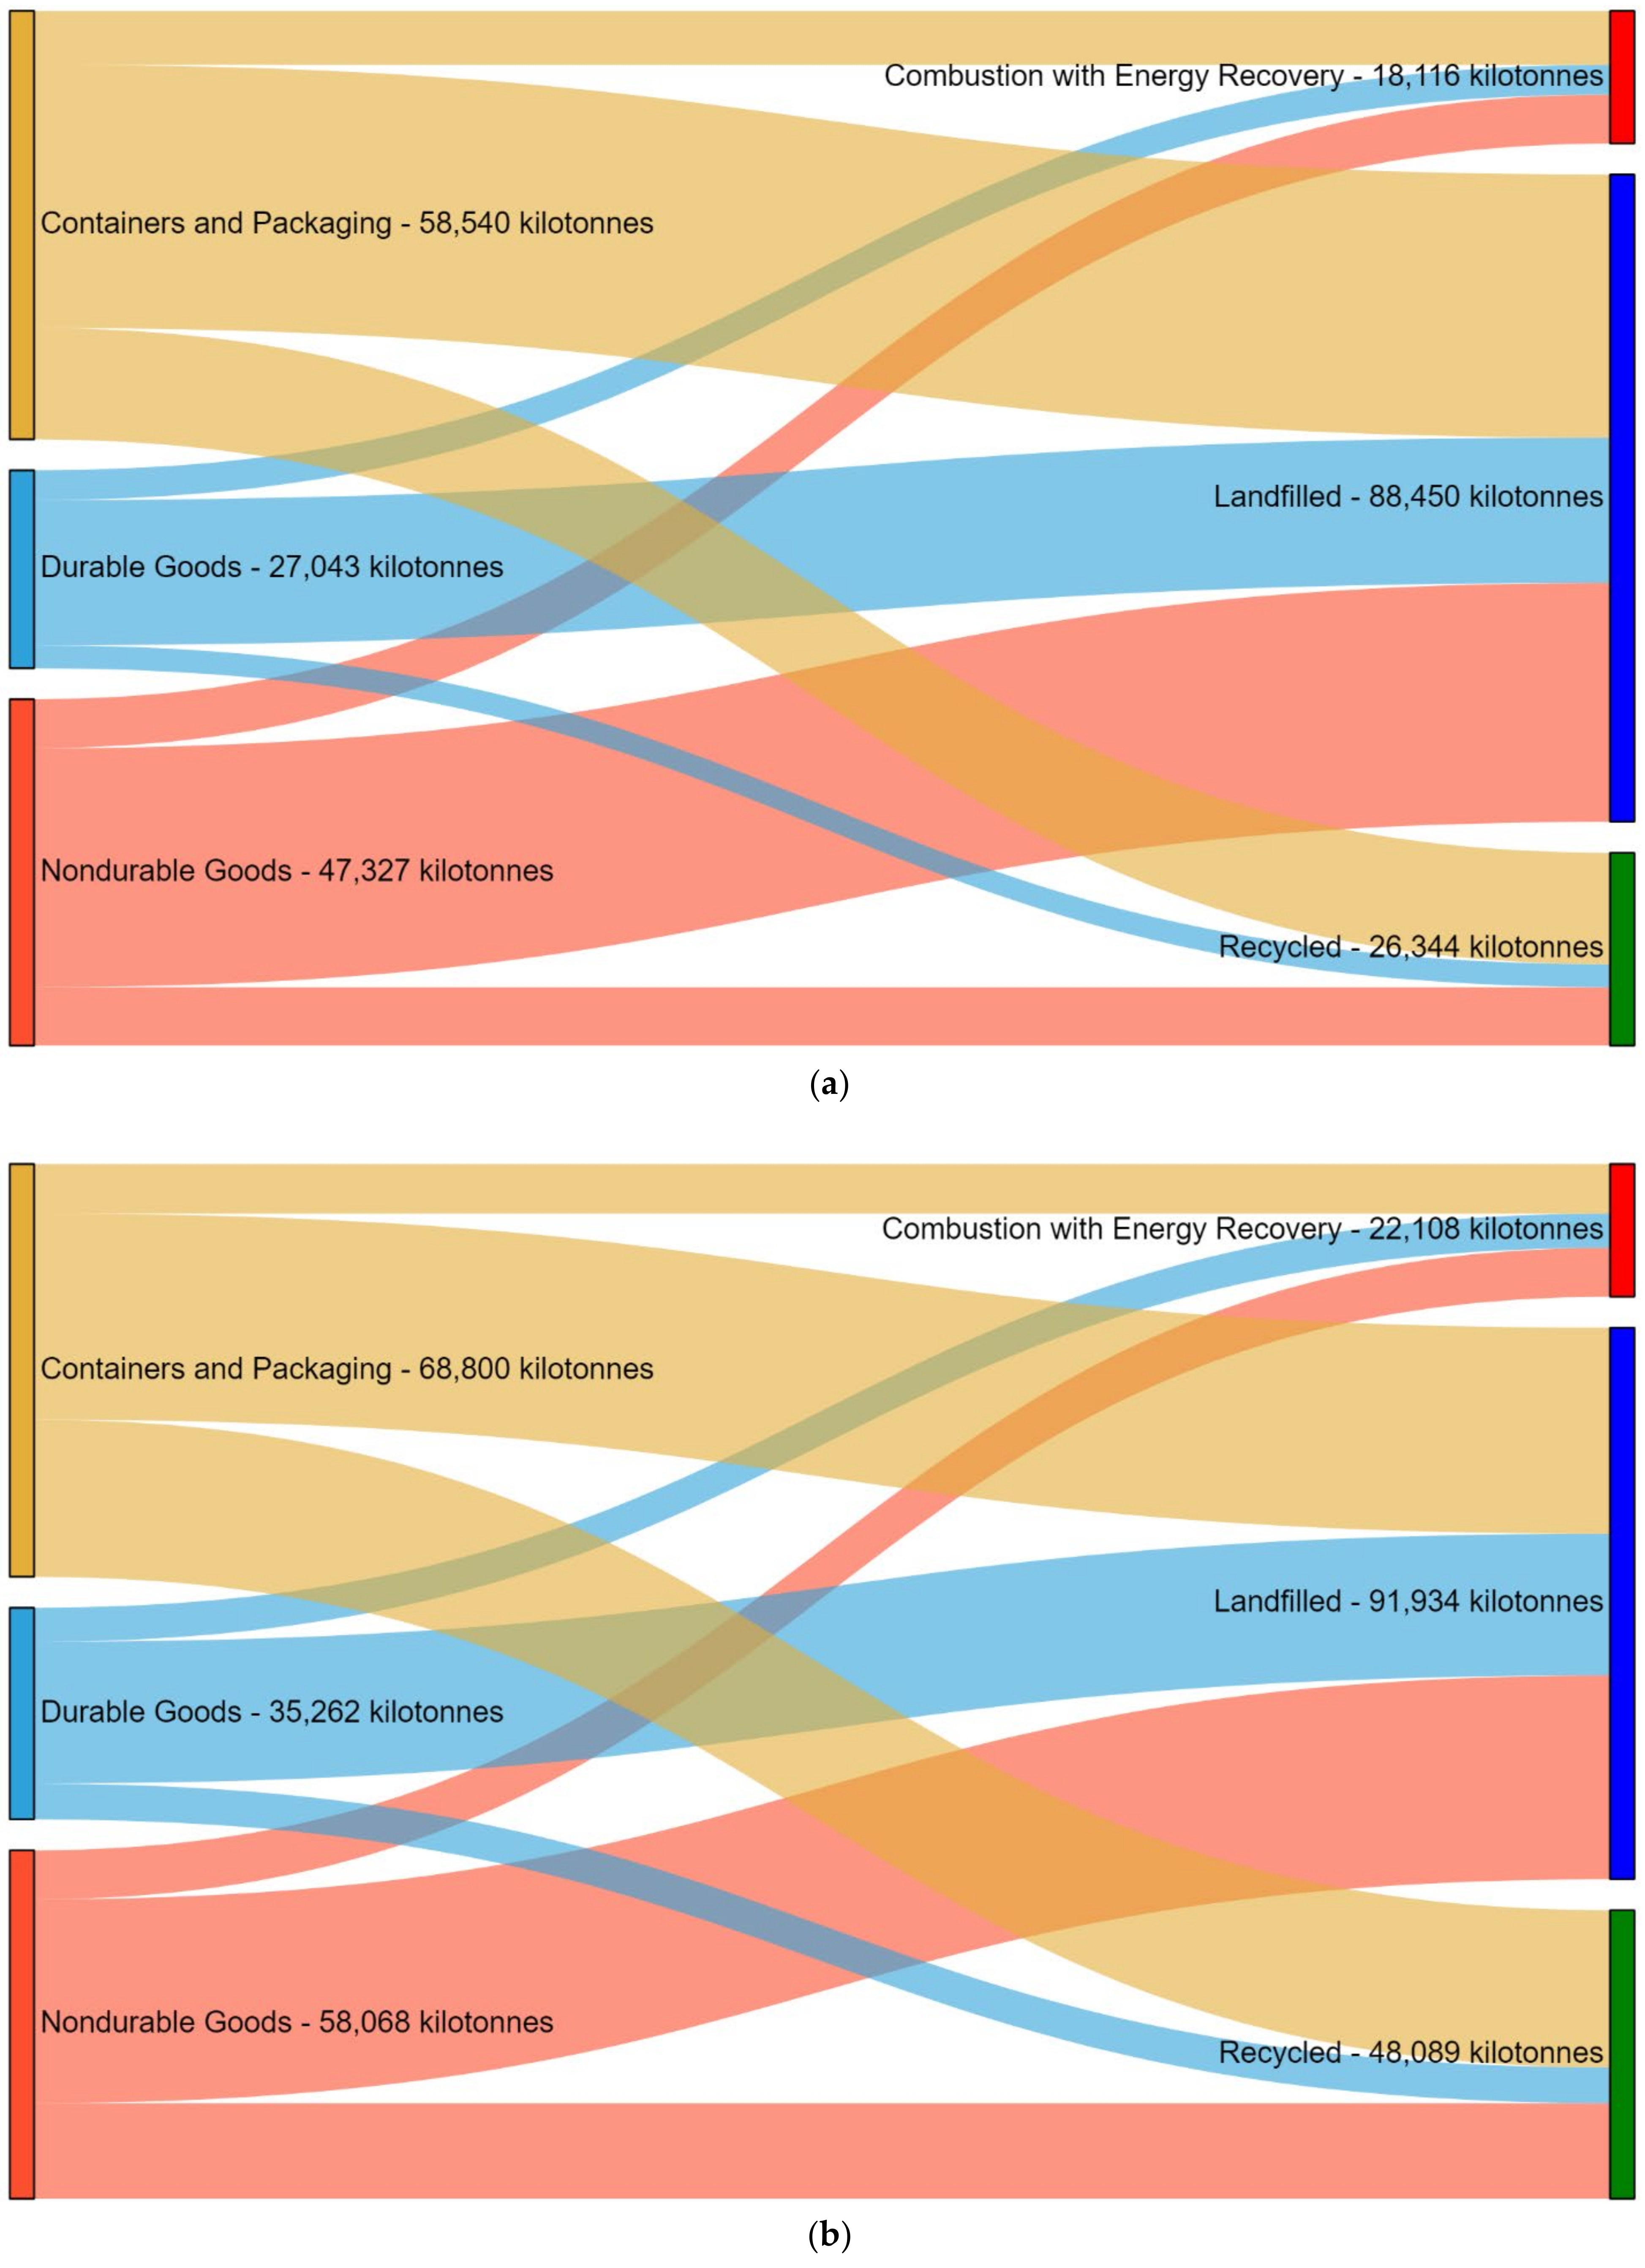
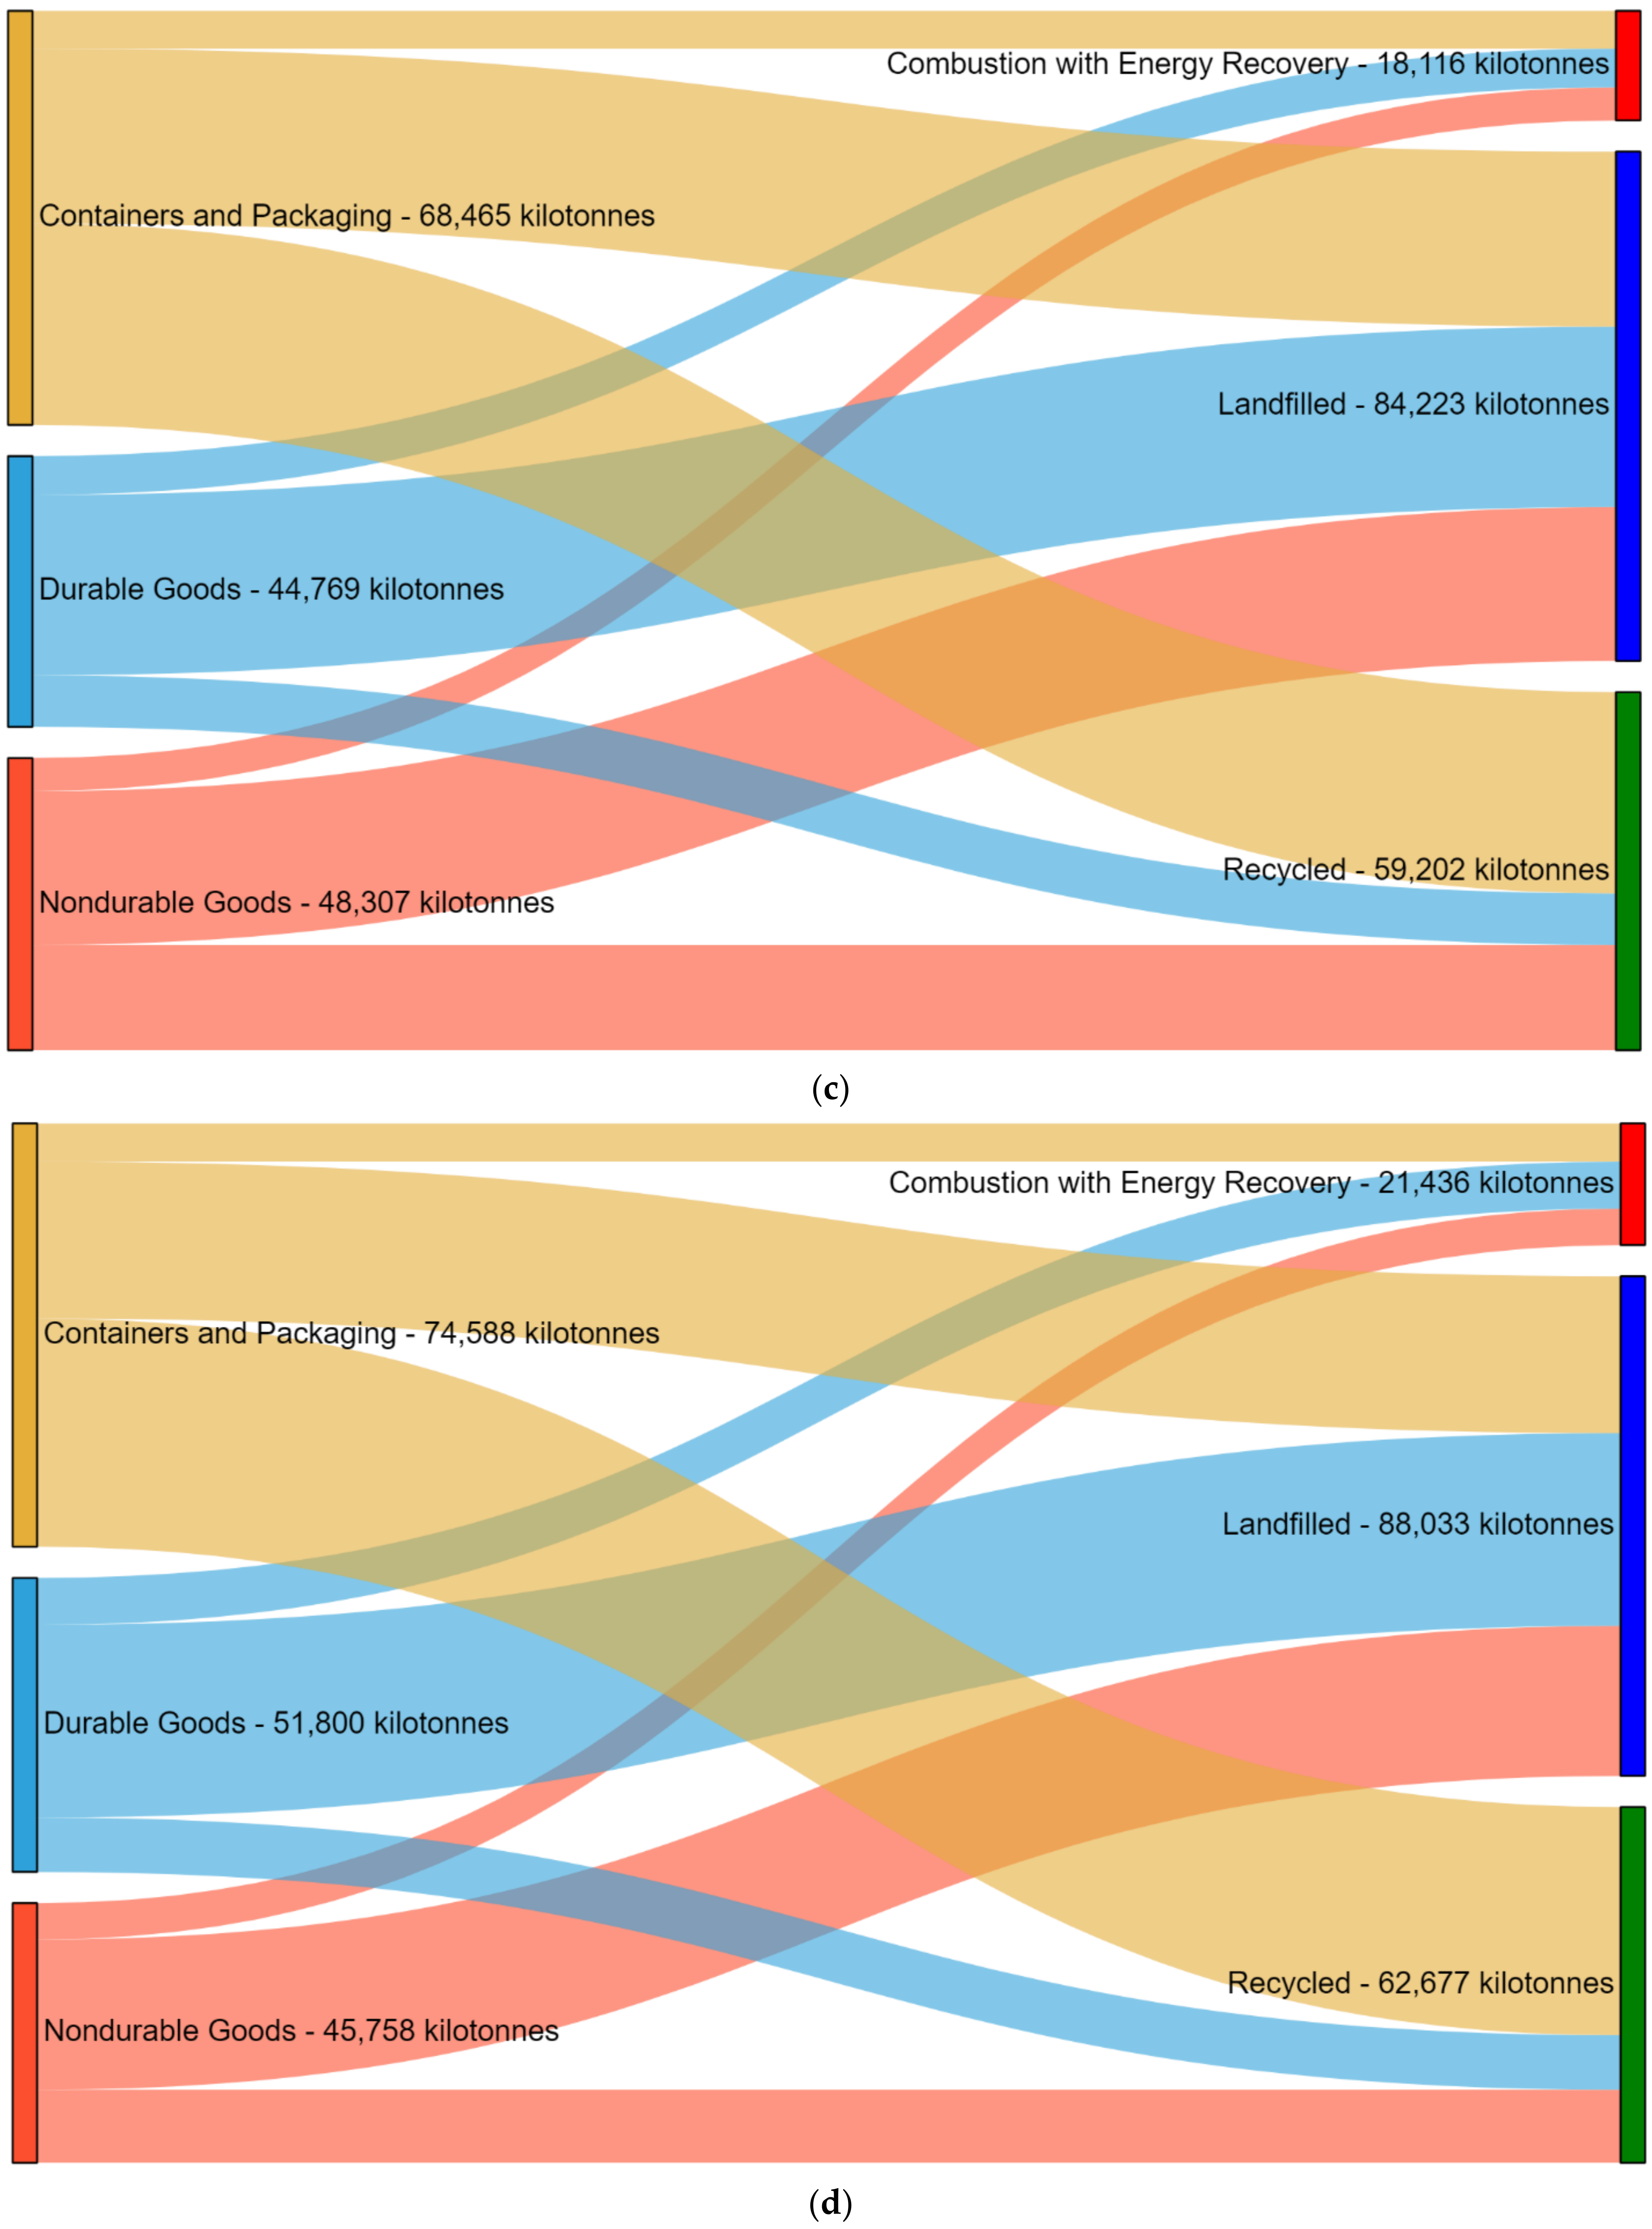
3.1.1. Generation and Management of Total Products in Durables, Non-Durables, and Containers and Packages in the U.S.

Figure 1 presents the Sankey diagrams produced to represent the flows of products in regard to the disposal method in the U.S. for four periods: 1990, 2000, 2010, and 2018. Additional graphs for 1980 and 2005, are included in the Supplementary Materials, S1. The total amount of products in the municipal waste stream increases steadily with years. Among the main categories of products, the amount of durable goods increased by over 90%, in the 28-year period. Non-durable goods slightly decreased, by approximately 3.3%, and containers and packaging products increased by approximately 27%.
Waste management in the U.S. mainly relies on landfills, and the current efforts mainly focus on improving the capture and utilization efficiency of methane produced in landfills [36]. The landfilling of products in the U.S. has remained almost the same since 1990. The amount of products landfilled indicated an increase during the 1990s and 2000s, and a decrease during the 2010s. This is mainly associated with the decrease in the amounts of non-durable and containers and packaging products landfilled, and the increase in the amounts of durable products landfilled. Specifically, the landfilling of durable products increased by slightly over 70%. The landfilling of non-durable products increased by approximately 10% during the 28-year period, and the amount of containers and packages landfilled decreased by approximately 23%.
A significant increase of over 80% in the amount of products recycled in the U.S. was observed during the 1990s, and an increase of approximately 23% was observed during the 2000s. The amount of recycling slightly increased, by approximately 5.8% during the 2010s, but with the tendency to decline, mainly as a result of the National Sword policy of China, which affected the recycling rates since the demand mainly for plastic and paper wastes declined [37], whereas the supply increased [38,39]. In the main categories assessed, over a 200% increase in the recycling of durable products was observed from 1990 to 2018. An increase of approximately 60% was observed in the recycling of non-durable products during the 28-year period, and an increase of approximately 165% was observed in the recycling of containers and packages. WTE rates have remained almost unchanged since 2000, which is mainly due to the public opposition these projects face [40,41]. The combustion of waste products for the production of energy increased significantly during the 1980s, by approximately 950% (Sankey diagram in Supplementary Materials) and an increase of approximately 22% was observed during the 1990s. Since then, the amount decreased by approximately 18% in the 2000s, and increased by another 18% in the 2010s, indicating no particular increase in the amount since 2000. In the main categories assessed, in 2018, the amount of durable combusted almost doubled, whereas both the combustion of non-durable products and containers and packaging, decreased by approximately 4% and approximately 8.5%, accordingly.

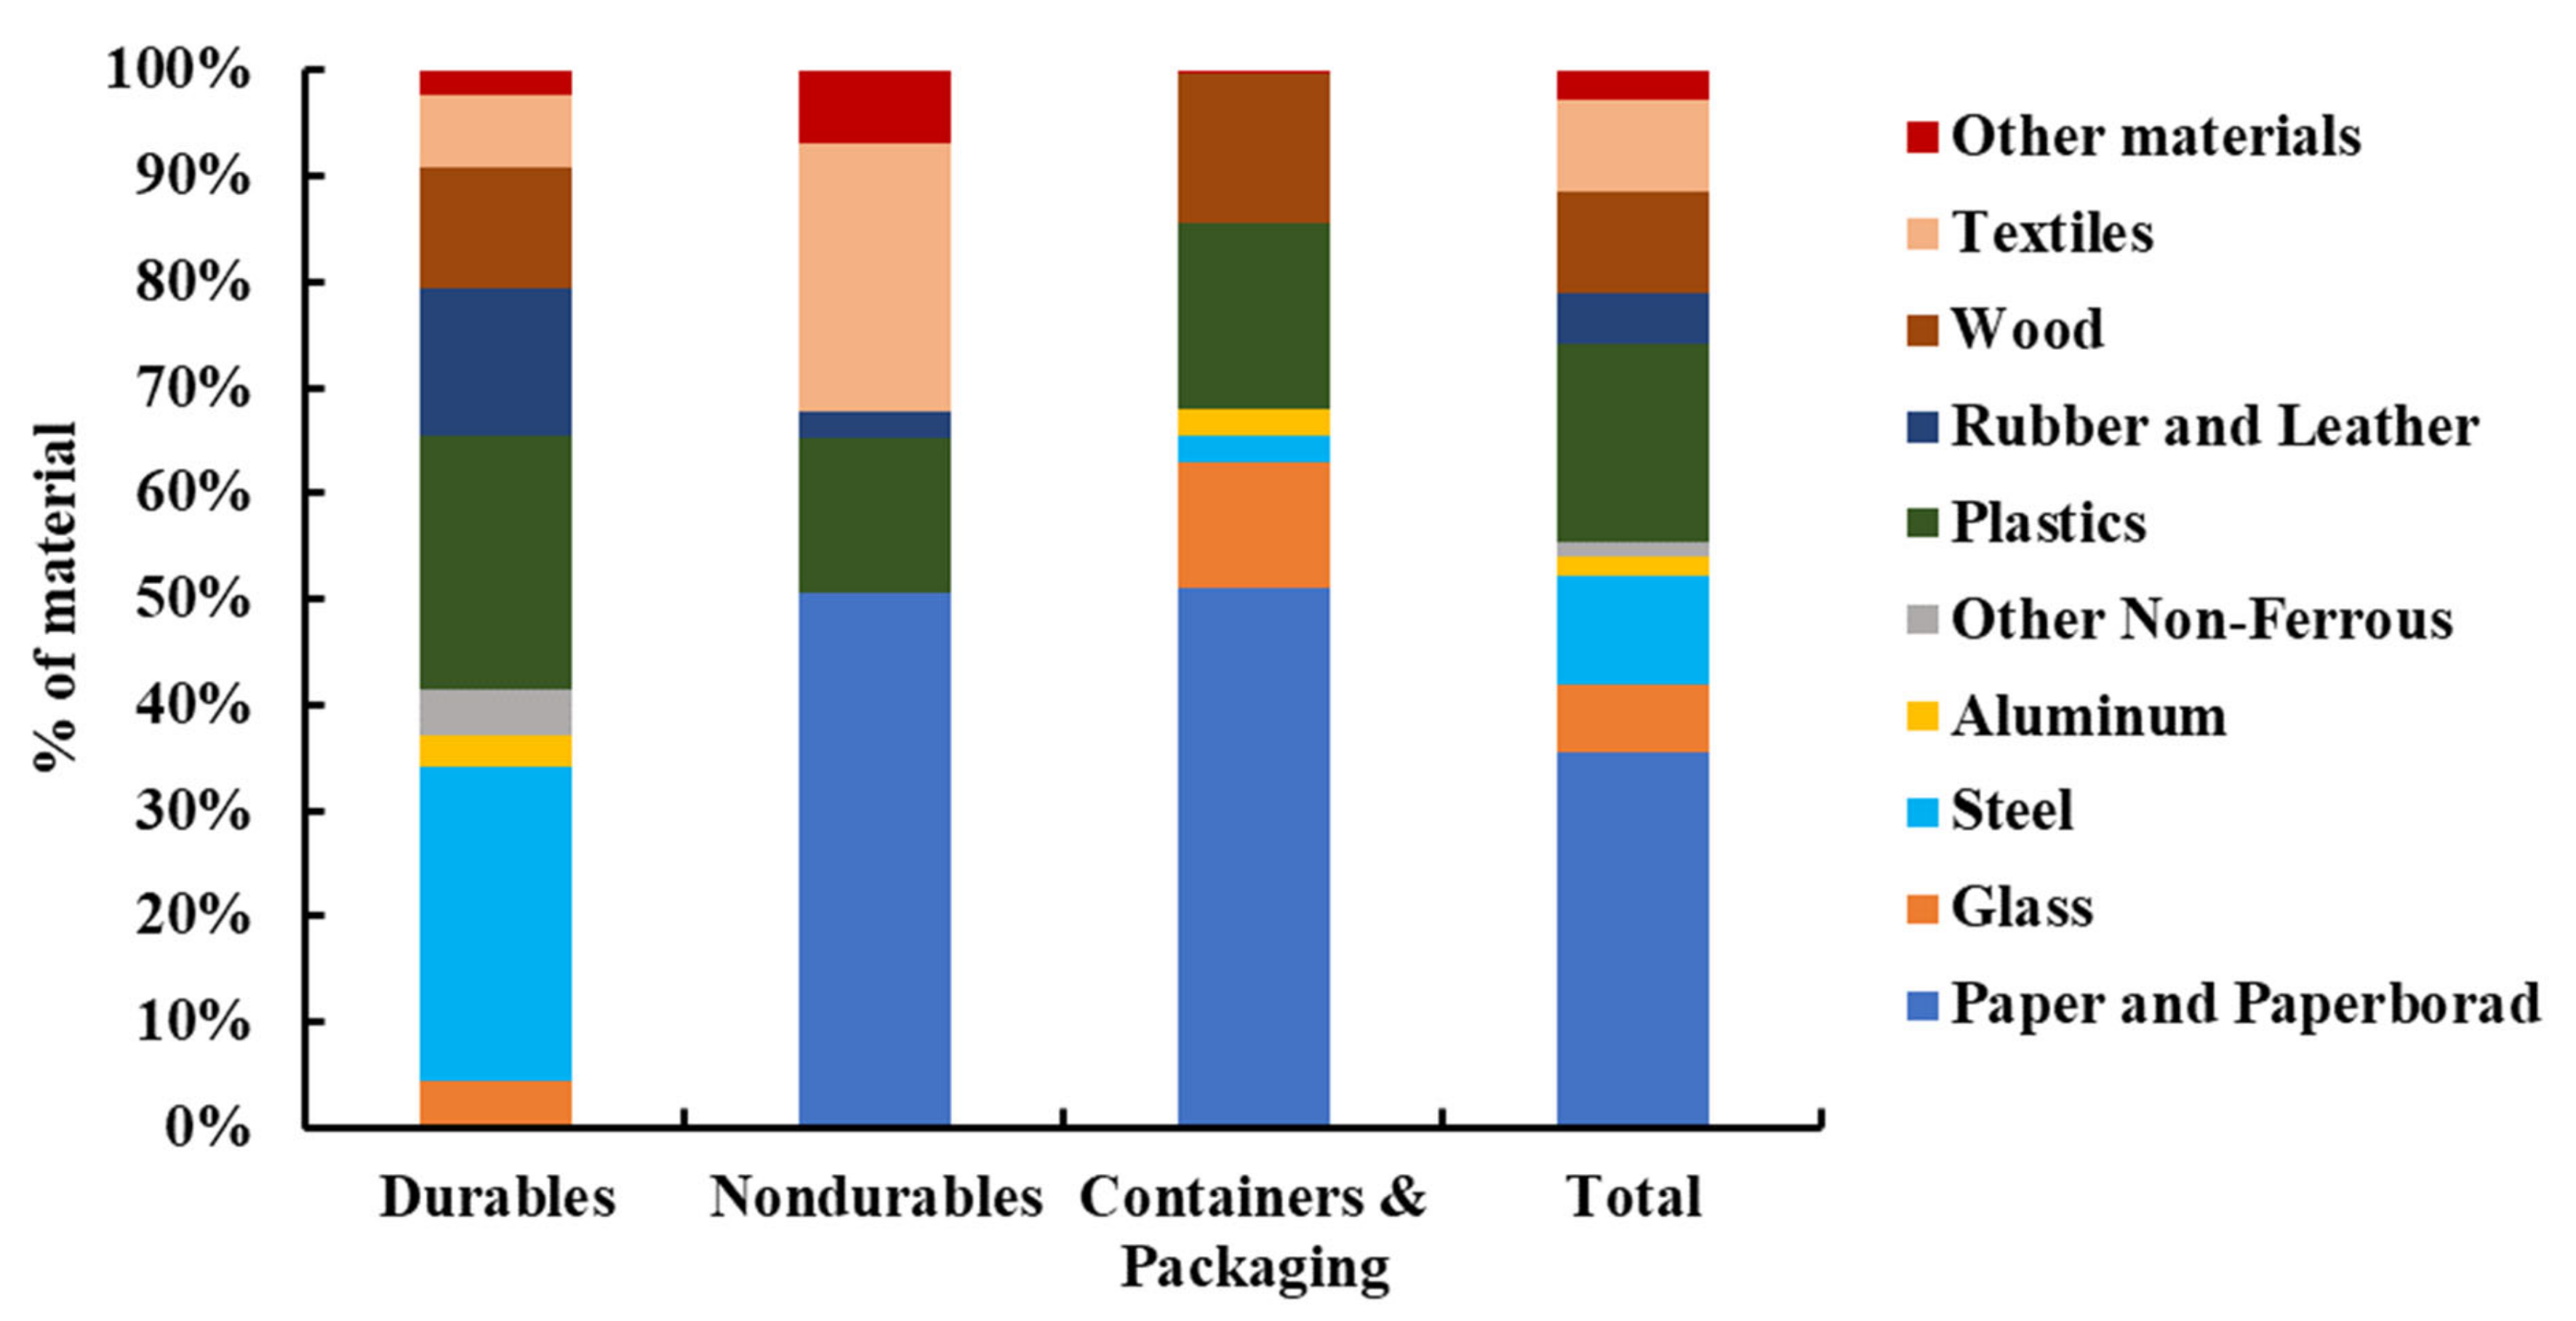
3.1.2. Composition of Durables, Non-Durables, and Containers and Packages, and Management of Materials Contained in Broad Categories

Figure 2 presents the composition of waste products in the U.S. in 2018, by considering the types of materials contained in the broad categories assessed. Durable products contain mainly steel, slightly below 30%, plastics, approximately 24%, and rubber and leather, approximately 14%. Wood (11.4%), textiles (6.8%), other non-ferrous, mainly lead from batteries (approximately 4.4%), glass (4.3%), aluminum (approximately 3%), and other materials (2.3%), are also included in durable products. Non-durable products contain mainly paper and cardboard, 50.5%, textiles, 25.5%, and plastics, 14.8%. Other materials, 6.8%, and rubber and leather, 2.3%, are also contained in non-durable products. Containers and packages mainly contain paper and cardboard, 51%, plastics, 17.7%, wood, 14.1%, and glass, 11.9%. Steel, 2.7%, aluminum, 2.3%, and other materials, 0.4%, are also included in containers and packages.
Figure 3 shows the disposition of materials produced in the U.S. in 2018, under the broad categories assessed. The recycling of paper and cardboard is mainly contributed by containers and packages, which indicate slightly over 80% recycling, and the rest is contributed by non-durable products, which indicate a recycling rate of approximately 45%. The landfilling of paper and cardboard in containers and packages, is slightly above 15%, and combustion for energy, approximately 5%. Approximately 35% of paper and cardboard contained in non-durable products is landfilled, and approximately 10% is combusted for energy.
The recycling of glass (slightly over a 30% recycling rate), aluminum (approximately 35%), and wood (approximately 25%) are only contributed by containers and packages. However, in these three categories, landfilling was the dominant method of disposition, with glass in containers and packages indicating an approximate 55% landfilling rate, aluminum slightly over 50%, and wood approximately 60%. The combustion for energy of glass, aluminum, and wood in containers and packages, ranged from 10 to 15%. Glass, aluminum, and wood contained in durable products, are mainly landfilled, indicating rates between 80 and 85% in 2018. The combustion for energy for these three products, ranged from 12 to 13% for glass to 17 to 18% for wood. The recycling of steel contained in containers and packages reached over 70% in 2018, and of steel contained in durable products slightly below 30%. Slightly over 20% of steel in containers and packages was landfilled, and approximately 5% was combusted for energy. The landfilling of steel in durable products was approximately 60%, and 12% was combusted for energy. The recycling of other non-ferrous metals, in durable products, was slightly above 65%, with approximately 30% landfilling, and approximately 5% combustion for energy. The recycling of plastics was very little, with durable products indicating an approximate 5% recycling rate, non-durable products 2–3%, and containers and packages 12–13%. Landfilling was the dominant method, with containers and packages indicating an approximate 70% landfilling rate, and durable and non-durable products, approximately 80%. Approximately 10% of plastics in durable products, approximately 15% of plastics in containers and packages, and approximately 20% of plastics in non-durables, are used as fuels in combustion plants. The recycling of rubber and leather occurs only in durable products, which indicated approximately 20% recycling. Approximately 30% is combusted for energy, and approximately 50% is landfilled. Rubber and leather contained in non-durable products is mainly landfilled, slightly over 80%, and the rest is combusted for energy. The recycling of textiles in durable and non-durable products, was approximately 15%. Textiles contained in both products are mainly landfilled, with durables indicating an approximate 60% landfilling rate, and non-durables approximately 70%. Approximately 25% of textiles in durables, and approximately 15% in non-durables, were used in combustion plants. The recycling of other materials occurs only in durables, which indicates a rate of slightly over 70%. Approximately 25% is landfilled, and slightly below 5% is combusted for energy. Other materials contained in non-durables and containers and packages are mainly landfilled, which indicates a rate of approximately 80%, with the rest combusted for energy.

3.1.3. Generation of Specific Waste Products Contained in Durables, Non-Durables, Containers, and Packages in the U.S.

Figure 4 presents the recycling, combustion, and landfilling rates, and the amount of products (bubble size) recycled, combusted to produce energy, and landfilled in the U.S. in 1990, 2000, 2010, and 2018. Additional Sankey diagrams of the specific twenty-one subcategories and products in the municipal waste stream, are presented in the Supplementary Materials, which are used mainly for the discussion on the amounts of waste products generated and managed in the U.S.
In the subcategories assessment, the amount of all durable products produced was almost doubled, except small appliances, which indicated an increase of approximately 4600% from 1990 to 2018. The total amount of miscellaneous durables, which is the major category in the durable products, almost doubled during the 28-year period. The second in the total amounts is furniture and furnishings, which indicated an approximate 80% increase. The amount of rubber tires, major appliances, and carpets and rugs increased by approximately 81%, approximately 59%, and over 100%, accordingly. Batteries, including lead-acid, increased by approximately 92%.
In the non-durables, the other paper products indicate the highest amounts and a moderate decrease compared to the amount in 1990; an approximate 21% decrease. Clothing and footwear indicated a significant increase of approximately 220%, whereas the amount of newspapers/mechanical papers significantly decreased by approximately 64% in the 28-year period. The first increase can be explained by the use of fast fashion products, and the second from the use of technology. Disposable diapers and other miscellaneous nondurables indicated the same amount in 2018, and both products showed an increase of approximately 52% and 19% since the 1990s, respectively. The amount of towels, sheets, and pillowcases almost doubled since 1990, and the amount of plastic plates and cups and trash bag wastes increased by approximately the same rate, 58%, during the same period.
Paper and paperboard packaging, which is the material with the highest amounts produced in the containers and packaging subcategory, increased by approximately 22% during the 1990s. It then decreased by approximately 5.6% in the 2000s and increased by approximately 11.2% in the 2010s. The amount of wood packaging indicated an increase of approximately 5.3% during the 1990s, and further increases of approximately 13.5% and 18% were observed during the 2000s and 2010s, respectively. Plastics packaging, gradually increased by approximately 62% in the 1990s, and approximately 22.3% and 6.2% during the 2000s and 2010s, accordingly. Other packaging products increased by approximately 160% during the 28-year period. Glass packaging decreased by approximately 21% from 1990 to 2010, and then increased by approximately 4.6% from 2010 to 2018. Aluminum packaging remained almost the same during the 28-year period. Steel packaging indicated a decrease in the amount produced by 23.5% from 1990 to 2018.

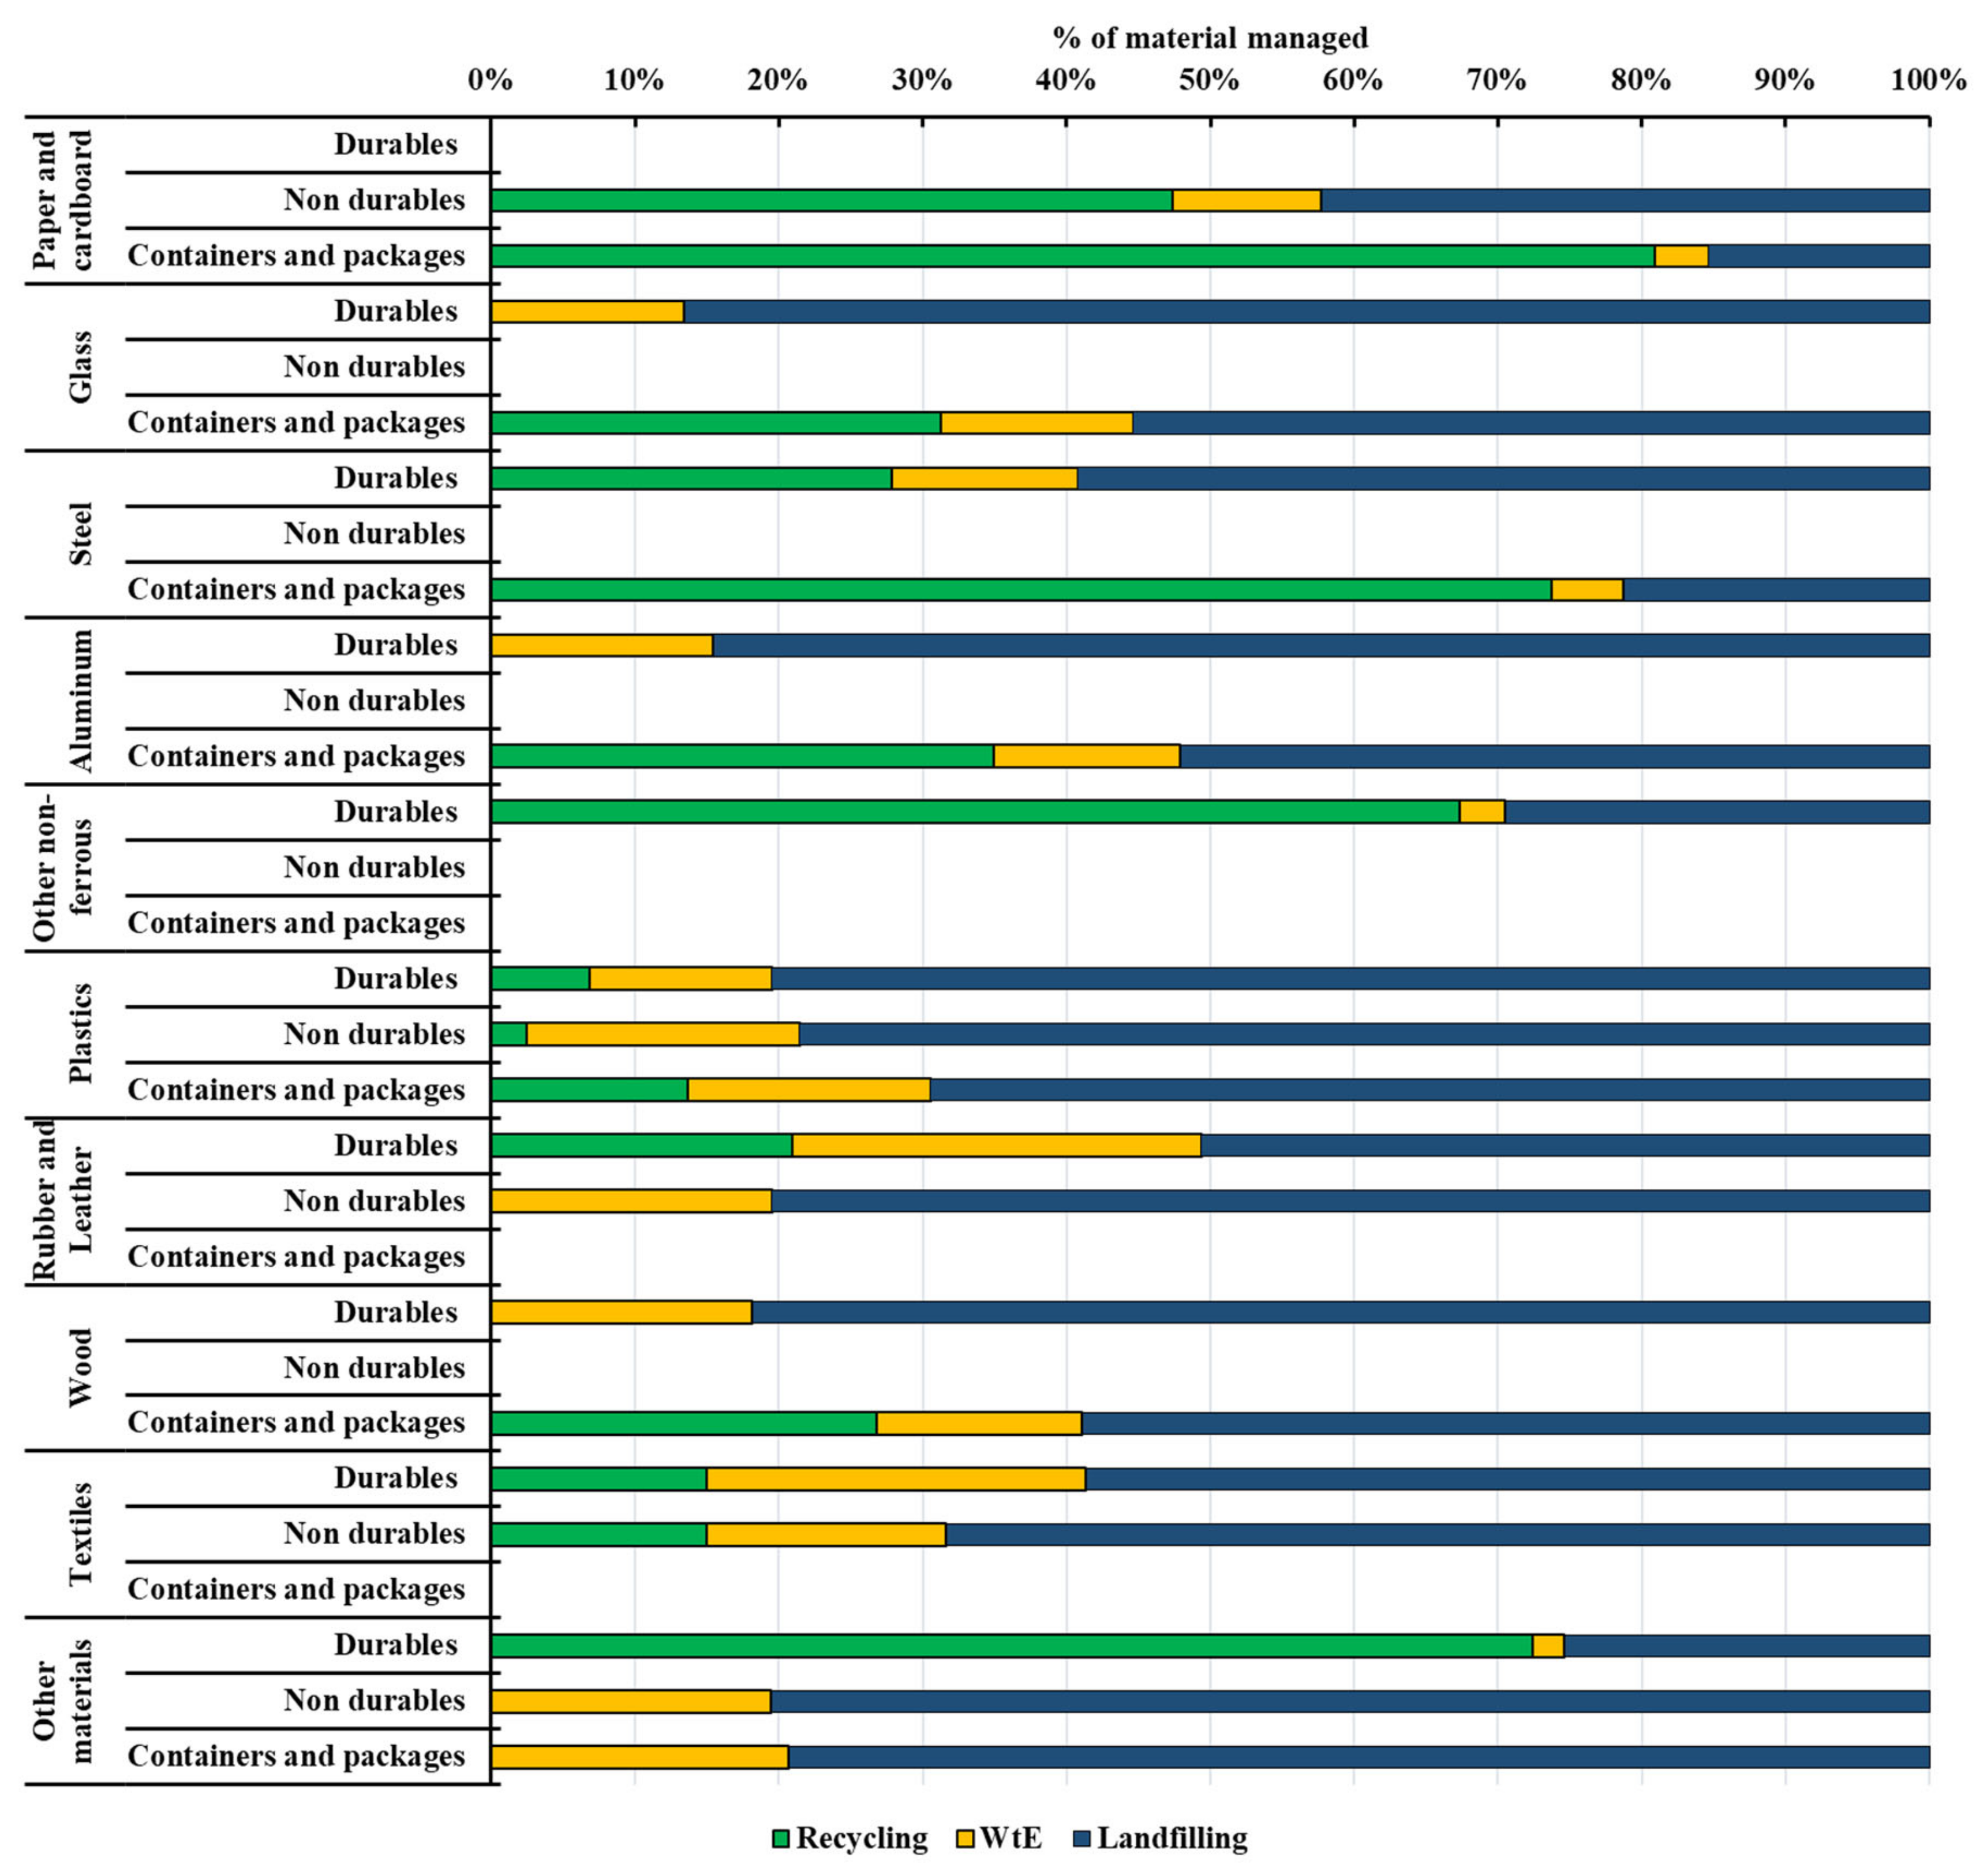
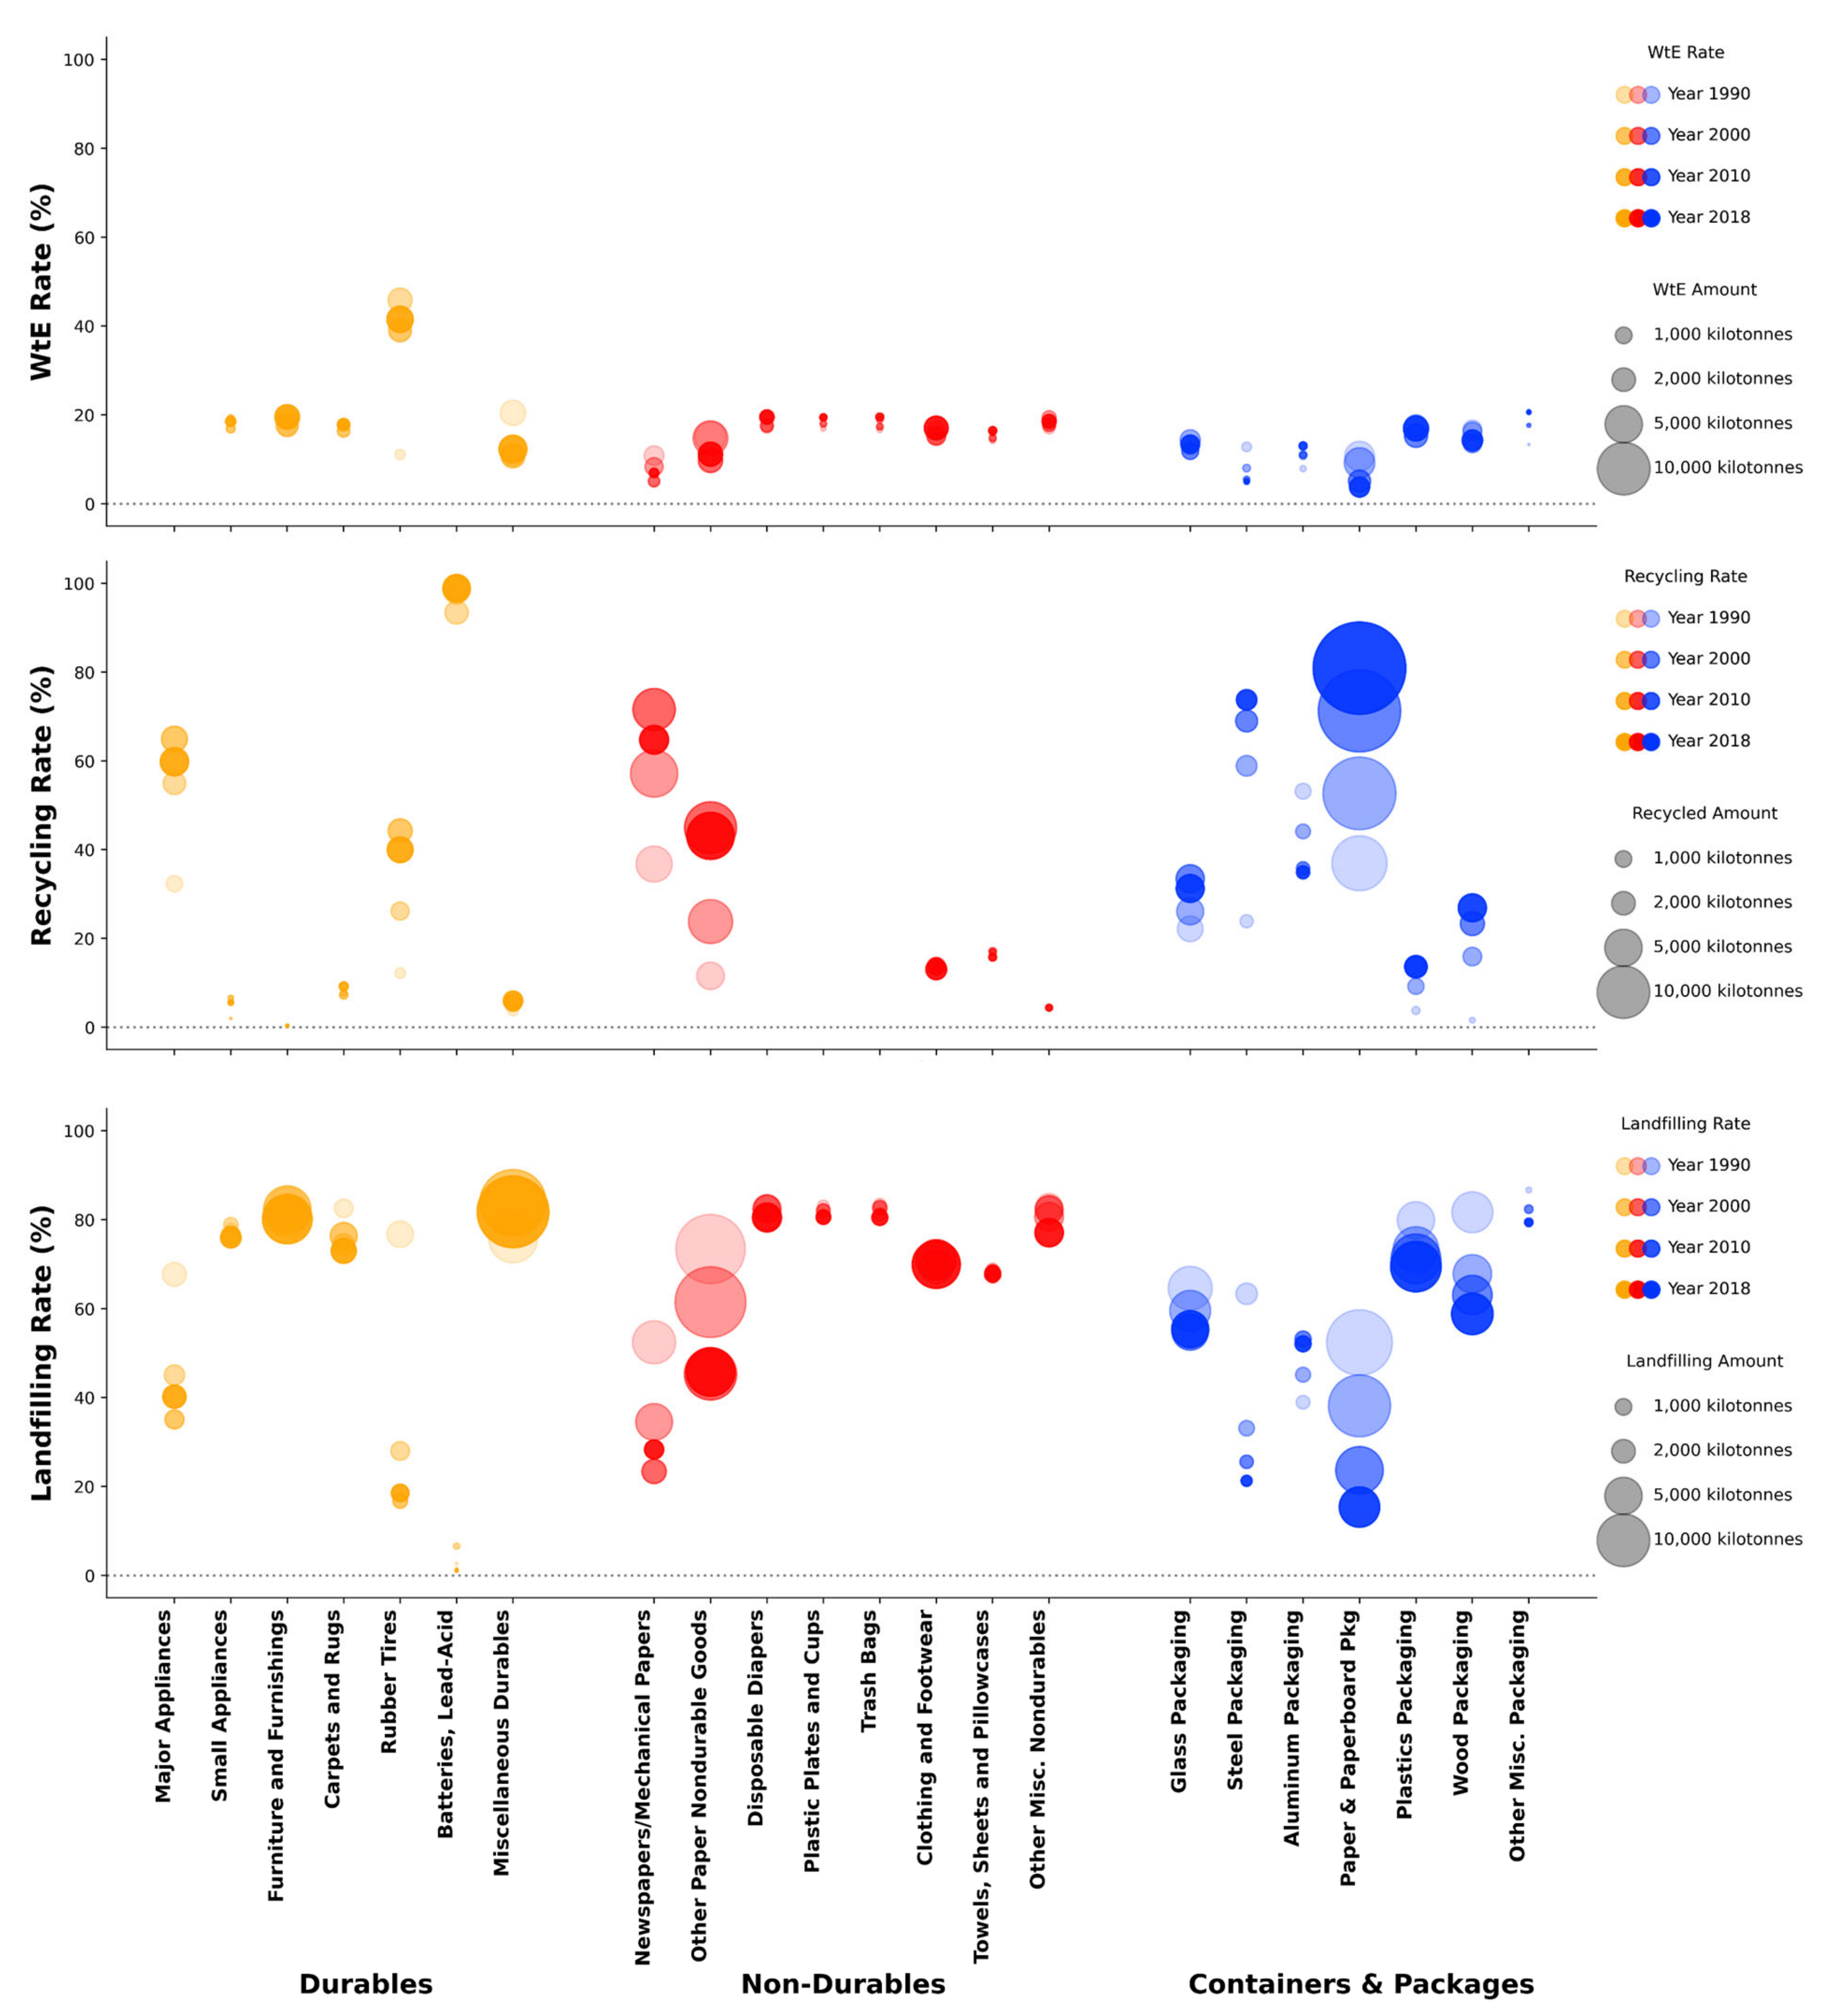
3.1.4. Change in the Disposal Rates of Specific Products Managed in the U.S.

Durables

The landfilling/recycling rates of major appliances changed from ~65/35% in 1990 to ~40/60% in 2018, since combustion for energy is not used for major appliances. The landfilling rates of major appliances decreased gradually during the 1990s and 2000s, indicating a difference of −25% and −15%, respectively, which was accompanied by an equal increase in the recycling rates. However, during the 2010s, a decrease in the recycling rates was observed, which amounted at approximately 5%, with a subsequent equal increase in the landfilling rates. Small appliances did not indicate a notable change in the landfilling/combustion/recycling rates during the 28-year period, showing ratios of approximately 70–75/20/5–10%. For small appliances, the landfilling rates slightly decreased, <2% decrease, during the 28-year period. The rates of recycling small appliances increased by approximately 5% during the 1990s and the 2000s, but slightly decreased during 2010–2018. The rates of combustion of small appliances decreased by <3% from 2000–2010% and increased at approximately the same amount from 2010 to 2018. The rates of combustion of small appliances did not change from 1990 to 2000. Furniture and furnishings recycling was negligible during the 28-year period, and the difference in the rates of combustion for energy decreased by <2% during the 2000s and increased by <2% during the 2010s. These products were mainly diverted from landfills to combustion plants, considering the similar increase and subsequent decrease in the difference of the rates during the 2000s and the 2010s, respectively. The landfilling/combustion/recycling rates were approximately 80/20/<1% for the 28-year period. The landfilling rates of carpets and rugs decreased by approximately 10% during the 1990s and increased by approximately 2% in the 2000s, but indicating a decrease of approximately 5% in the 2010s. The reverse but similar differences observed for the difference in the recycling, and combustion for energy rates of carpets and rugs during the 1990s, 2000s, and the 2010s, indicating that during this period, carpet and rugs were repurposed from landfills mainly toward combustion for energy production and recycling. The landfilling/combustion/recycling rates changed from 80/10/10 in 1990 to 70/<20/>10%. Similarly, rubber tires indicated a decrease of 50% in the difference of the landfilling rates during the 1990s, and at the same time, an increase of 15% in the recycling and of 35% in the combustion for energy rates. During the 2000s, rubber tires were redirected from combustion facilities and landfills toward recycling, since the difference in the recycling rates accounts for ~17%, which equals the negative difference obtained from the combustion and landfilling rates. During the 2010s, a decrease in the difference of the recycling rates of rubber tires is observed, which is associated with the use of products in combustion facilities, ~2%, and landfills, ~1%. Overall, the landfilling/combustion/recycling rates of rubber tires changed from 80/10/10 in 1990 to 20/40/40 in 2018. Batteries recycling decreased during the 1990s but increased during the 2000s and the 2010s to almost 100% and remained nearly at the same levels since then. Miscellaneous durables were mainly redirected from combustion plants towards landfills, which indicated an increase in the difference of the rates of approximately 10%. The rates have remained almost the same from 2000 to 2018. The landfilling/combustion/recycling rates of miscellaneous durables changed from 77–78/20–21/<1% in 1990 to 80/15/5 in 2018.

Non-Durables

Newspapers/mechanical papers indicated a significant decrease of approximately 13% in the 1990s, and a decrease of approximately 10% in the 2000s, in the difference of the landfilling rates. The landfilling rates showed an increase of approximately 5% in the 2010s. The recycling rates increased by approximately 20% in the 1990s and by approximately 15% in the 2000s but decreased by approximately 8% in the 2010s. The rates of the combustion of newspapers/mechanical papers for energy production slightly decreased from 1990 to 2010 but increased by ~2% in the 2010s. The landfilling/combustion/recycling rates of newspapers/mechanical papers changed from 50/10/40 in 1990 to approximately 20/10/70 in 2018. Other paper non-durable goods recycling rates increased by approximately 12% in the 1990s, and by approximately 20% in the 2000s, but slightly decreased in the 2010s. Landfilling rates decreased by approximately 12% in the 1990s and by approximately 20% in the 2000s, with combustion for energy rates decreasing by approximately 5–6% in the 2000s, and by <1% in the 1990s. Landfilling rates further reduced by approximately 15–18%, and combustion rates indicated a decrease of 4–5%, in the 2010s, which were products diverted towards recycling. The landfilling/combustion/recycling rates of other paper non-durable goods changed from 76–77/10/13–14 in 1990 to 45/10/45 in 2018.
The changes in the rates of the other products included in the non-durables were below +−2%, except for the other miscellaneous non-durables, which showed a decrease of approximately 5% in the landfilling rates in the 2010s, followed by an increase in the recycling rates of ~5% during the same period. All the other non-durable products indicated landfilling rates between 70 and slightly over 80%, combustion rates between 15 and 20%, and recycling between 5 and 10%. As discussed before, disposable diapers, plastic plates and cups, and trash bags indicated zero recycling during the 28-year period.

Containers and Packaging

Glass packaging indicated a decrease of approximately 5% in the landfilling rates during the 1990s and 2000s, which was accompanied by an increase in the recycling rates by 5–7% during the same periods. Recycling rates slightly decreased, <4%, during the 2010s, with a subsequent increase in the rates of combustion for energy, and an increase of <1% in the landfilling rates. The landfilling/combustion/recycling rates of glass packaging changed from 70/10/20 in 1990 to <60/10/30 in 2018. Steel packaging showed a decrease in the landfilling rates of approximately 30% during the 1990s, and a decrease in the combustion for energy rates of approximately 5%, which were related to an increase of over 30% in the recycling rates during the same period. The decrease in the landfilling rates continued during the 2000s and 2010s, although at a more moderate rate of approximately 10%. From 2000 to 2018, recycling rates increased between 5 and 10%, and the combustion for energy rates decreased by below 3% in both periods. The landfilling/combustion/recycling rates of steel packaging changed from 70/10/20 in 1990 to approximately 20/6–7/73–74 in 2018. The rates of aluminum packaging landfilled, increased by approximately 5–7% during the 1990s and the 2000s, and remained nearly the same during the 2010s. At the same time, the combustion for energy increased but by a small amount of <2%, and recycling decreased by approximately 7–8% in the 1990s and 2000s and remained almost the same during the 2010s. The landfilling/combustion/recycling rates changed from 45/10/45 in 1990 to approximately 55/15/30 in 2018. Paper and paperboard packaging landfilling decreased by approximately 10–12% in each of the periods examined, recycling increased between 10 and 15%, and the combustion for energy decreased by below 3%. The landfilling/combustion/recycling rates of paper and paperboard packaging changed from 50/10/40 in 1990 to approximately 15/5/80 in 2018. The rates of landfilling of plastics packaging decreased between 2 and 7% in each of the periods examined, with recycling increasing between 5 and 7% during the 1990s and 2000s and remaining almost the same in the 2010s. The rates of combustion of plastic packaging for energy decreased by below 2% during the 2000s and increased by below 1% during the 2010s. The landfilling/combustion/recycling rates of plastic packaging changed from 80/15/5 in 1990 to approximately 70/20/10 in 2018. Wood packaging recycling increased by approximately 10% during the 1990s and 5% during the 2000s, and approximately 3% during the 2010s, with a subsequent decrease in the landfilling rates. The changes in combustion for energy were below 1% in the 28-year period. The landfilling/combustion/recycling rates of wood packaging changed from 80/<20/>1 in 1990 to approximately 60/15/25 in 2018.
The rates of landfilling other miscellaneous packaging products decreased by approximately 7–8% during the 1990s, which was followed by an increase of approximately 5% during the 2000s and a decrease of approximately 4–5% during the 2010s. The recycling of other packaging products is negligible during the 28-year period. The change in the rates of combustion of other packaging products for energy had a similar but reverse relation with the landfilling rates, indicating the diversion of other packaging products from landfills towards the combustion for energy, but the amount produced and managed was very small compared to the other products. The landfilling/combustion rates of other miscellaneous packaging changed from 85/15 in 1990 to 75/25 in 2018.

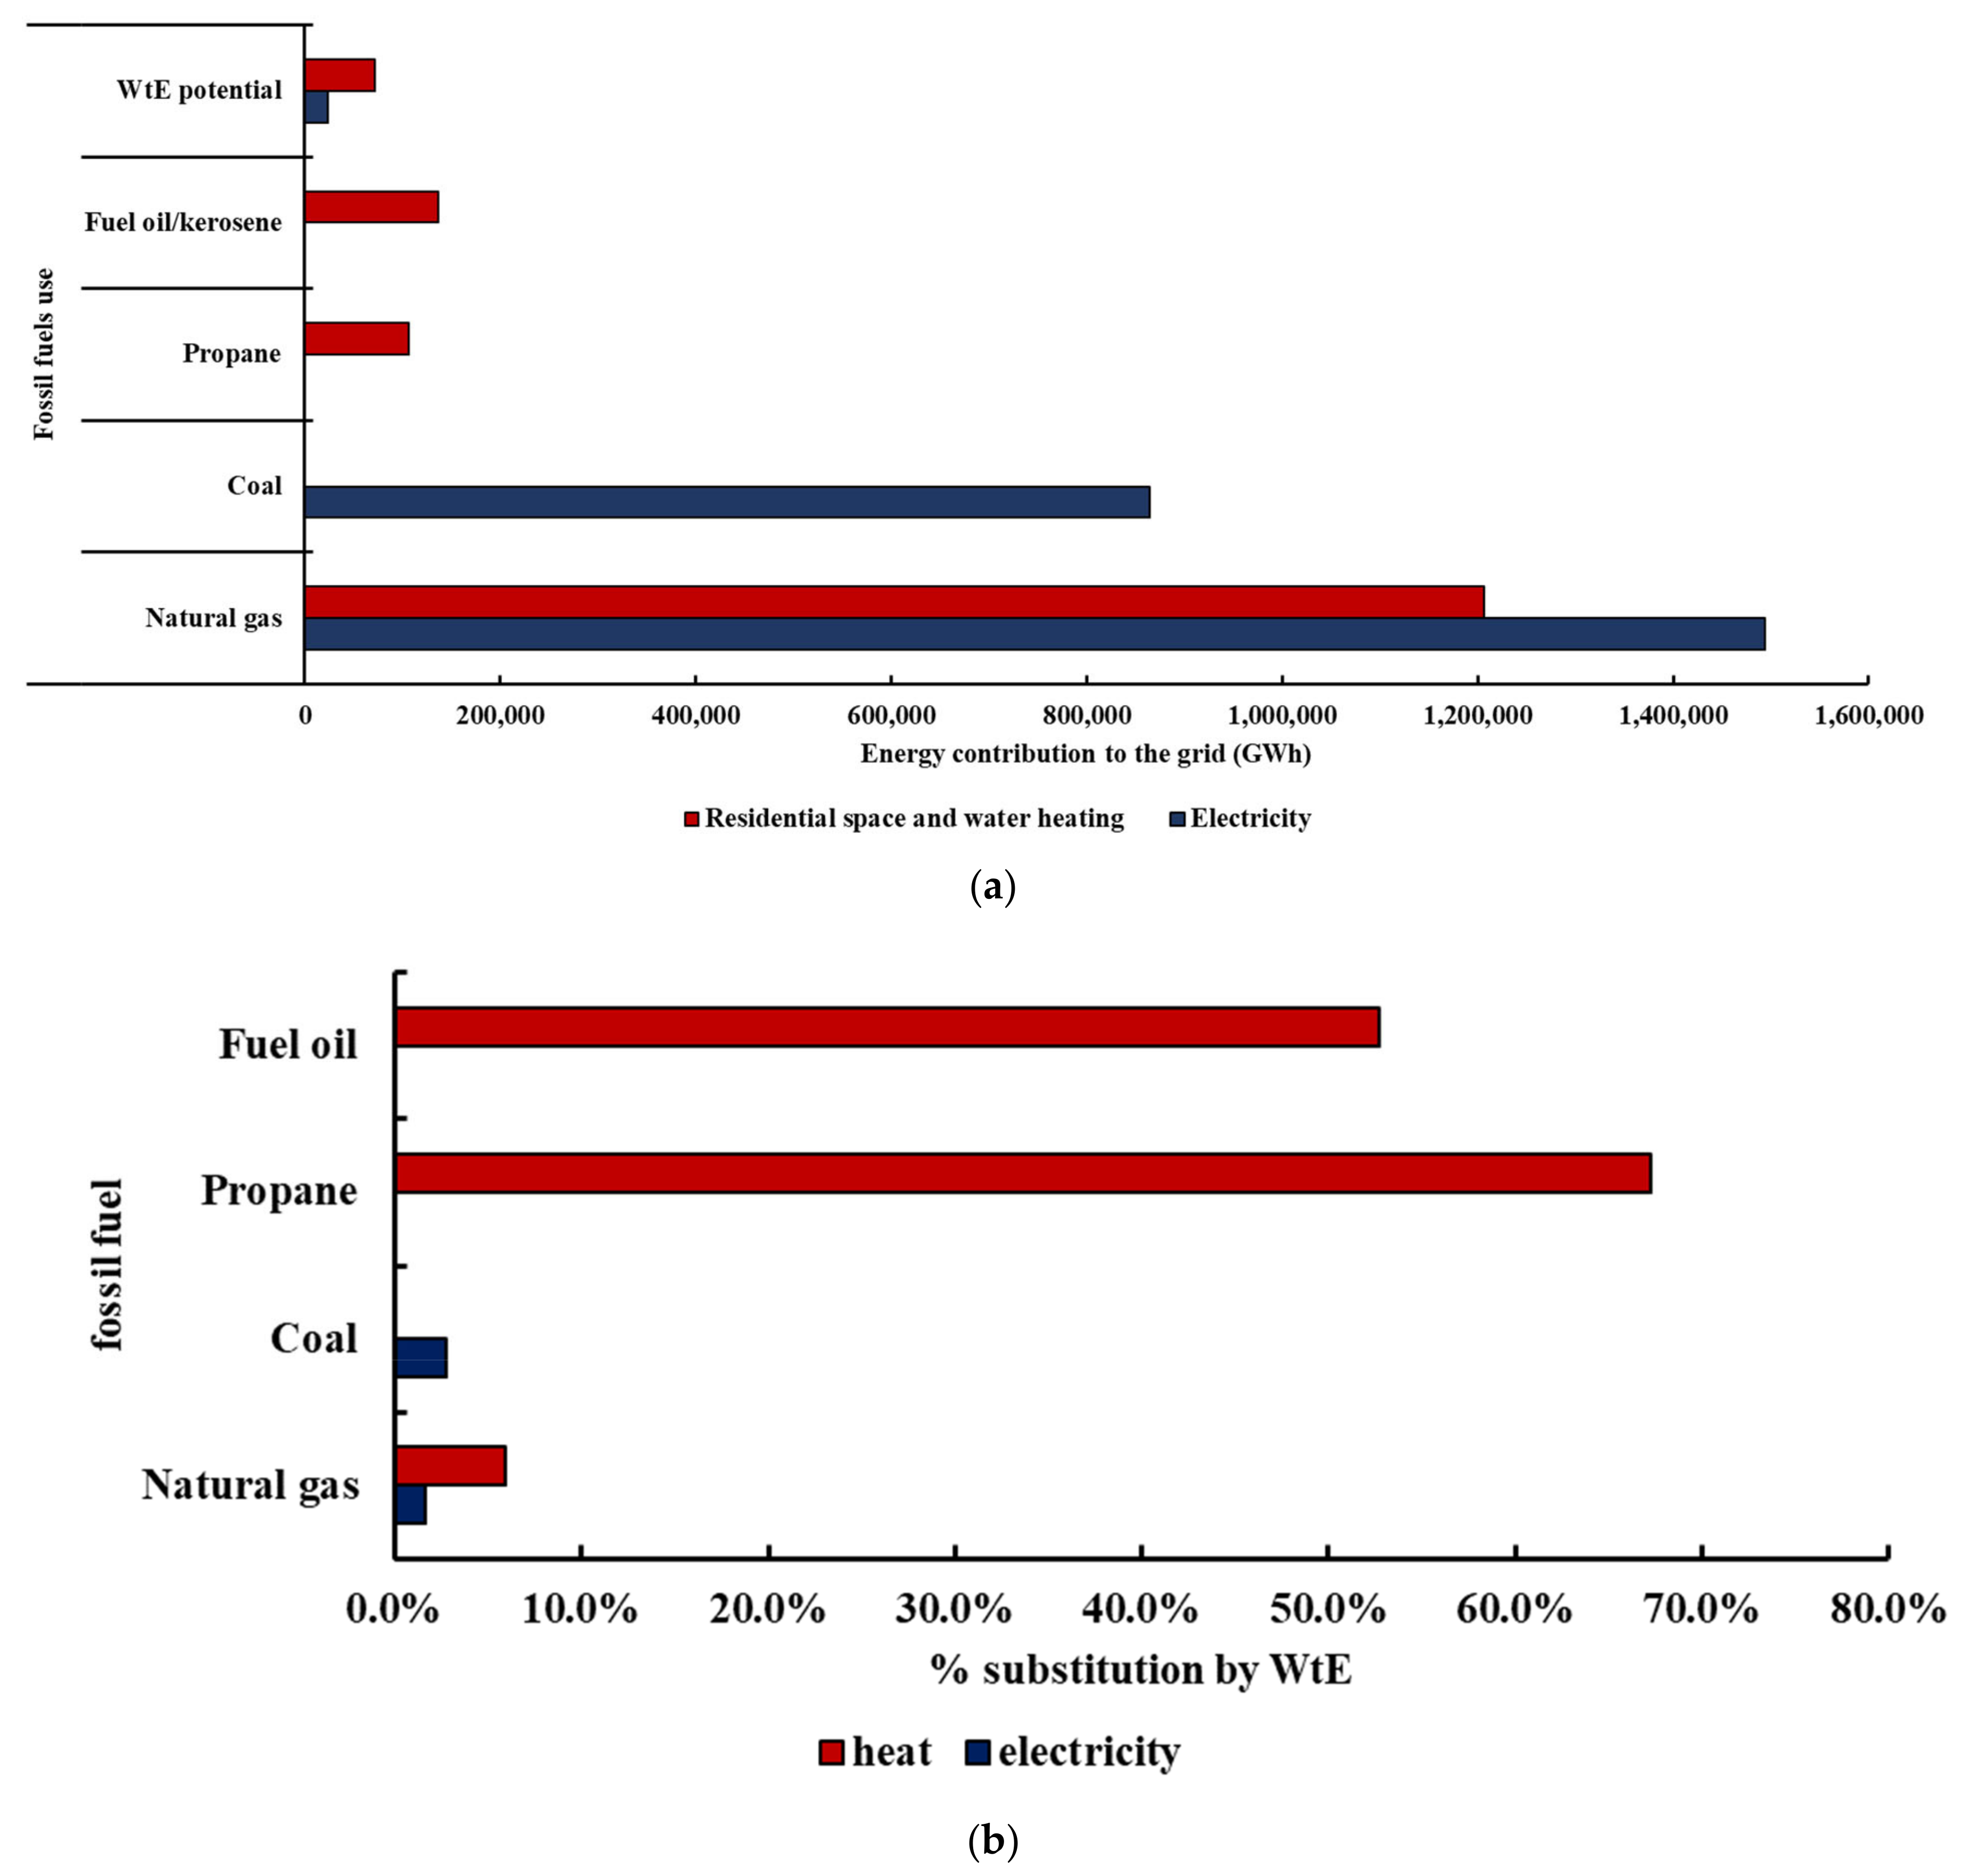
3.2. Potential Contribution of Waste Products to the U.S. Energy Grid

Figure 5 presents the total energy produced from fossil fuels in the U.S. for electricity and residential space and water heating, and the potential of WTE to substitute fossil fuels in the energy mix. In terms of electricity production, WTE is a low-hanging fruit, considering that it can substitute either up to 2.8% of coal or up to 1.6% of natural gas. However, WTE can contribute significantly to the substitution of fossil fuels used for heat, which includes space and water heating. The results showed that the amount of energy produced from WTE plants can substitute either up to 68% of propane, or approximately 53% of fuel oil, or up to 6% of natural gas. However, cities utilizing WTE heat should include district heating networks.
District heating (DH) is defined as the distribution of thermal energy from a central heat source to many residential, commercial, and/or industrial areas, by conveying steam or hot water through a network of insulated pipes. Hot water DH systems are used widely in Europe and in Asia and are gaining in popularity in the U.S. The development of DH systems relies on the fuel dependence of a country. For example, the Danish government provided strong incentives for the production of energy from alternative sources, including WTE, as a result of the oil crisis of the 1970s. As a result, in 2015, in Denmark, WTE provided to the district heating network approximately 35% of the total heating demand. During summer, the heat is provided for district cooling purposes. Similar is the situation in S. Korea, where WTE contributes significantly to the DH demand of the nation [13,20,42,43]. The United Nations Environment Programme identifies modern district energy as the most effective approach for many cities in the transition to sustainable heating and cooling, by improving energy efficiency and enabling higher shares of renewables. WTE is presented as a way to produce low-cost heat and often initiate development of a city’s district heating network, utilizing the energy content embedded in the waste [44].

3.3. GHG Emissions from Waste Management in the U.S. and the EU

After 2015, the GHG emissions from solid waste management in the U.S. has remained the same, and with a tendency to increase, as shown in Figure 6. The GHG emissions are mainly driven by the landfilling of waste materials, which is responsible for over 85% of the GHG emissions produced from waste management. It should be noted that in the U.S., the amount of municipal solid waste (MSW) disposed of in landfills increases steadily over the years, and reached 146 million tons in 2018, according to the U.S. EPA [8]. However, studies based on surveys concluded that the amount of MSW disposed of in the U.S. is significantly higher than the U.S. EPA estimate, and ranged between 220 and 262 million tons in 2012–2013 [45,46,47]. As discussed earlier, the U.S. federal government and the EU announced a Global Methane Pledge that aims to cut global methane pollution by at least 30 percent by 2030 [3]. According to current GHG inventories, landfills are the 3rd largest source of anthropogenic methane globally and in the U.S. [4]. Thus, the Global Methane Pledge creates a significant opportunity for the U.S. to reduce its reliance on landfills and reduce the associated methane and GHG emissions [48,49,50].
As a comparison with the waste management situation in the U.S., the data shown in Figure 7 provide the information on the waste management and the associated GHG emissions across Europe [34,35]. Countries operating the most sustainable MSW management typically use integrated systems with efficient collection and source separation systems that achieve maximum, commercially viable, extraction and recycling of valuable materials. The post-recycled MSW is recovered for energy production in WTE facilities that meet appropriate environmental operating standards, such as the Industrial Emissions Directive (2010/75/EC) [51]. As shown in Figure 7, the use of WTE correlates positively to increased recycling as it enables the recovery of additional materials not targeted by source separation recycling programs, and actually reduces the amount that goes to landfilling [17,52,53]. Thus, significant reductions in the GHG emissions from waste management were observed in Europe, which indicated a decrease from approximately 140 million tonnes CO2-equivalent in 1995 to approximately 80 million tonnes in 2020, and a downward trend.

3.4. Practical Implications

The European experience has showed that federal regulations play a key role in sustainable waste management [53,54,55]. For example, in 1999, the EU passed the EU Landfill Directive (1999/31/EC), which required a progressive reduction of MSW to 75% of the 1995 disposal level by 2010 and 35% reduction by 2020. The result was some different solid waste management programs being adopted. There was the Pay-Per-Bag scheme in Belgium and Italy; a plastic bag levy in Ireland; a weight-based charging scheme in Denmark and Sweden; and many other MSW management schemes throughout the EU.
In the EU, a planned approach was used with targets set by the national governments for SWM development and amount allocated to recycling and WTE growth. SWM was recognized as an integral part of growth, both economically and socially. A combination of tax policies, tax exemptions, loan guarantees, and pricing on energy and materials production and effective public and private partnerships (PPPs) were used. For example, governments increased the landfill tax and considered a credit for recycling and WTE for energy production, e.g., a feed in tariffs or the issuance of a tradable green certificate with a guaranteed minimum market value for capacity installed. The European industry has preferred using public and private partnerships (PPP), and often the design–build–operate–transfer (DBOT) or design–build–operate–own (DBOO) structure when it comes to financing SWM projects, as it allows financial risk to be shared among parties [53,56,57,58]. A similar model was used in China, where a significant growth in the construction of WTE plants has been observed since 2000. The national government instituted policies, such as a credit of USD 30 per MWh of WTE electricity that resulted in the construction, by 2020, of 510 WTE plants with an annual WTE capacity of 193 million tons [59].
Overall, the design of integrated sustainable waste management systems and access to public funding to support such projects, should be based on a life cycle case by case value-based and technology-neutral approach in line with the waste hierarchy and the principles of the circular economy [60,61,62,63]. The waste should be recognized as products and materials with value. In this context, policies should place more emphasis on the value of potential materials and their contribution to the actual economy (material inputs and economic outputs) [60,64,65,66,67]; counting also for the potential environmental impact of the preferred treatment methods, e.g., reusables, recyclables/compostable, and combustibles [60,68,69,70,71]. By using value-based life cycle models, the interconnections of waste management with other sectors of the economy can be identified, and thus, create more robust decision-making on the distribution of financial resources over waste management and other sectors, such as energy, and transportation [72,73]. In order to manage the risk of the high investments that may be required for SWM, results-based (blended) financing, such as environmental impact bonds, can be used, which directly address the construction, operation, and counterparty risks in infrastructure investments. For instance, municipal bonds, as used extensively in the U.S. and Europe, can have a significantly positive impact to advance SMW, and are instruments, which can be used by the public entities in the U.S., which have the financial, legal, and institutional capacity [74]. Furthermore, the establishment of (or the coordination with existing) regulatory authorities is often key to ensure the continuous monitoring of the operations, and to advance the confidence of the public and the investors. For example, if the waste management plan of a city is the construction of a WTE plant, an official governmental body should monitor the potential emissions constantly, and ensure the WTE plant complies with strict pollution standards, such as the Industrial Emissions Directive [75]. Furthermore, it should ensure that the WTE bottom ashes are either disposed of properly, or ideally, are turned into valuable products with the recovery of metals as well as for use in construction of roads, bridges, etc., and fly ashes from the WTE operation are disposed of in a sustainable and safe manner; in line with existing stringent leaching standards, such as the Leaching Assessment Framework of U.S. EPA [76].

4. Conclusions

The aim of this study is to conduct a comprehensive assessment of waste products and energy recovery from wastes in the U.S. Data on products management in the US included in the assessment were from 1990 to 2018 and obtained from the U.S. EPA. EIA data were considered to assess the energy potential of wastes landfilled in the US. The main conclusions can be summarized as follows:
  • The amount of all durable products produced was increased, and most of the non-durable and packages and containers products indicated an increase during the 28-year period.
  • The highest increase in the amounts of products recycled was observed with packaging and containers, which became the dominant method of managing such products in the U.S. in 2015. Non-durables and durables were mainly landfilled.
  • Clothing and footwear, disposable diapers, plastic cups, trash bags, and other miscellaneous packaging are materials with negligible recycling rates during the 28-year period, and the only option to divert these materials from landfills is sophisticated WTE.
  • On a conservative scenario, WTE can substitute either up to 2.8% of coal, or up to 1.6% of natural gas for electricity generation. However, WTE can substitute either up to 68% of propane, or 53% of fuel oil, or up to 6% of natural gas used for residential space and water heating.
  • Over 85% of GHG emissions in the U.S. are associated with the landfilling of materials. The EU experience has shown that recycling and waste to energy are complementary in diverting materials from landfills, in enhancing energy security, and the associated GHG emissions, which includes both direct, such as the diversion of materials from landfills, and indirect benefits, such as the substitution of fossil fuels.
  • Value-based life cycle models can be used to evaluate the contribution of waste materials in the U.S. economy, and to identify mutually beneficial opportunities with other sectors, such as energy and transportation. Result-based financing, such as environmental impact bonds, can be used to address the counterparty risks of the investment throughout the lifecycle of the project, along with public and private partnerships, which are associated with multiple benefits, such as a share of risk among the entities.

Supplementary Materials

The following supporting information can be downloaded at: https://www.mdpi.com/article/10.3390/en15186581/s1, Figures in S1: Products in the Municipal Waste Stream, in kilotonnes, years: 2005 and 1980; Figures in S2: Products in broad categories examined, durables, non-durables, containers and packages, in kilotonnes, years: 1980, 1990, 2000, 2005, 2010, and 2018.

Author Contributions

Conceptualization, A.C.B.; methodology: A.C.B. and T.S.; software, T.S. and Y.T.; validation, A.C.B., T.S. and Y.T.; writing—A.C.B. and T.S.; supervision, A.C.B. All authors have read and agreed to the published version of the manuscript.

Funding

This research received no external funding.

Data Availability Statement

Acknowledgments

This study was supported by the Columbia Engineering summer program for graduate students. It did not receive any additional financial support.

Conflicts of Interest

The authors declare no conflict of interest.

References

  1. United States Environmental Protection Agency (USEPA). Sustainable Materials Management: Non-Hazardous Materials and Waste Management Hierarchy. Available online: https://www.epa.gov/smm/sustainable-materials-management-non-hazardous-materials-and-waste-management-hierarchy (accessed on 15 August 2022).
  2. European Commission. Communication from the Commission to the European Parliament, the Council, the European Economic and Social Committee and the Committee of the Regions—The Role of Waste-to-Energy in the Circular Economy; European Commission: Brussels, Belgium, 2017. [Google Scholar]
  3. The White House. Joint US-EU Press Release on the Global Methane Pledge. Available online: https://www.whitehouse.gov/briefing-room/statements-releases/2021/09/18/joint-us-eu-press-release-on-the-global-methane-pledge/ (accessed on 15 August 2022).
  4. United States Environmental Protection Agency (USEPA). Overview of Greenhouse Gases. Available online: https://www.epa.gov/ghgemissions/overview-greenhouse-gases#methane (accessed on 15 August 2022).
  5. United States Environmental Protection Agency (USEPA). Inventory of U.S. Greenhouse Gas Emissions and Sinks: 1990–2019. Available online: https://www.epa.gov/ghgemissions/inventory-us-greenhouse-gas-emissions-and-sinks-1990-2019 (accessed on 15 August 2022).
  6. Intergovernmental Panel on Climate Change (IPCC). Climate Change 2021: The Physical Science Basis. Available online: https://www.ipcc.ch/report/ar6/wg1/#FullReport (accessed on 15 August 2022).
  7. Kumar, V.; Garg, N. National and Regional Waste Stream in the United States: Conformance and Disparity. Environ. Res. Infrastruct. Sustain. 2021, 1, 031002. [Google Scholar] [CrossRef]
  8. United States Environmental Protection Agency (USEPA). Advancing Sustainable Materials Management: Facts and Figures Report. Available online: https://www.epa.gov/facts-and-figures-about-materials-waste-and-recycling/advancing-sustainable-materials-management (accessed on 15 August 2022).
  9. Tsiamis, D.A.; Torres, M.; Castaldi, M.J. Role of Plastics in Decoupling Municipal Solid Waste and Economic Growth in the U.S. Waste Manag. 2018, 77, 147–155. [Google Scholar] [CrossRef] [PubMed]
  10. Wang, Y.; Levis, J.W.; Barlaz, M.A. Development of Streamlined Life-Cycle Assessment for the Solid Waste Management System. Environ. Sci. Technol. 2021, 55, 5475–5484. [Google Scholar] [CrossRef]
  11. Levis, J.W.; Barlaz, M.A.; Decarolis, J.F.; Ranjithan, S.R. Systematic Exploration of Efficient Strategies to Manage Solid Waste in U.S Municipalities: Perspectives from the Solid Waste Optimization Life-Cycle Framework (SWOLF). Environ. Sci. Technol. 2014, 48, 3625–3631. [Google Scholar] [CrossRef]
  12. Pressley, P.N.; Levis, J.W.; Damgaard, A.; Barlaz, M.A.; DeCarolis, J.F. Analysis of Material Recovery Facilities for Use in Life-Cycle Assessment. Waste Manag. 2015, 35, 307–317. [Google Scholar] [CrossRef] [PubMed]
  13. Bourtsalas, A.C.; Seo, Y.; Tanvir Alam, M.; Seo, Y.C. The Status of Waste Management and Waste to Energy for District Heating in South Korea. Waste Manag. 2019, 85, 304–316. [Google Scholar] [CrossRef]
  14. Ryu, C. Potential of Municipal Solid Waste for Renewable Energy Production and Reduction of Greenhouse Gas Emissions in South Korea. J. Air Waste Manag. Assoc. 2010, 60, 176–183. [Google Scholar] [CrossRef] [PubMed]
  15. Thermelis, N.J.; Kim, Y.H.; Brady, M.H. Energy Recovery from New York City Municipal Solid Wastes. Waste Manag. Res. 2002, 20, 223–233. [Google Scholar] [CrossRef]
  16. Danish Energy Agency. Regulation and Planning of District Heating in Denmark; Danish Energy Agency: København, Denmark, 2016. [Google Scholar]
  17. Malinauskaite, J.; Jouhara, H.; Czajczyńska, D.; Stanchev, P.; Katsou, E.; Rostkowski, P.; Thorne, R.J.; Colón, J.; Ponsá, S.; Al-Mansour, F.; et al. Municipal Solid Waste Management and Waste-to-Energy in the Context of a Circular Economy and Energy Recycling in Europe. Energy 2017, 141, 2013–2044. [Google Scholar] [CrossRef]
  18. Tunesi, S. LCA of Local Strategies for Energy Recovery from Waste in England, Applied to a Large Municipal Flow. Waste Manag. 2011, 31, 561–571. [Google Scholar] [CrossRef]
  19. Kaplan, P.O.; Decarolis, J.; Thorneloe, S. Is It Better to Burn or Bury Waste for Clean Electricity Generation? Environ. Sci. Technol. 2009, 43, 1711–1717. [Google Scholar] [CrossRef] [PubMed]
  20. Varjani, S.; Shahbeig, H.; Popat, K.; Patel, Z.; Vyas, S.; Shah, A.V.; Barceló, D.; Hao Ngo, H.; Sonne, C.; Shiung Lam, S.; et al. Sustainable Management of Municipal Solid Waste through Waste-to-Energy Technologies. Bioresour. Technol. 2022, 355, 127247. [Google Scholar] [CrossRef]
  21. Lombardi, L.; Carnevale, E.; Corti, A. A Review of Technologies and Performances of Thermal Treatment Systems for Energy Recovery from Waste. Waste Manag. 2015, 37, 26–44. [Google Scholar] [CrossRef]
  22. United States Environmental Protection Agency (USEPA). Guide to the Facts and Figures Report about Materials, Waste and Recycling. Available online: https://www.epa.gov/facts-and-figures-about-materials-waste-and-recycling/guide-facts-and-figures-report-about#Products (accessed on 15 August 2022).
  23. United States Environmental Protection Agency (USEPA). Advancing Sustainable Materials Management: 2018 Fact Sheet; United States Environmental Protection Agency (USEPA): Washington, DC, USA, 2020.
  24. Holoviews Sankey Element. Available online: https://holoviews.org/reference/elements/bokeh/Sankey.html (accessed on 15 August 2022).
  25. Bokeh Bokeh Documentation. Available online: https://docs.bokeh.org/en/latest/ (accessed on 15 August 2022).
  26. Matplotlib Matplotlib: Visualization with Python. Available online: https://matplotlib.org/ (accessed on 15 August 2022).
  27. United States Energy Information Administrtion. Residential Energy Consumption Survey (RECS). Available online: https://www.eia.gov/consumption/residential/index.php (accessed on 15 August 2022).
  28. United States Energy Information Administration. Units and Calculators Explained Energy Conversion Calculators. Available online: https://www.eia.gov/energyexplained/units-and-calculators/energy-conversion-calculators.php (accessed on 15 August 2022).
  29. Eurostat Waste Statistics. Available online: https://ec.europa.eu/eurostat/statistics-explained/index.php?title=Waste_statistics#Waste_treatment (accessed on 15 August 2022).
  30. CEWEP (Confederation of European Waste-to-Energy Plants). Circular Economy Calculation Tool. Available online: https://www.cewep.eu/circular-economy-calculations-2/ (accessed on 15 August 2022).
  31. Themelis, N.J.; Elena, M.; Barriga, D.; Estevez, P.; Velasco, M.G. Guidebook for the Application of Waste to Energy Technologies in Latin America and the Caribbean; Earth Engineering Center, Columbia University: New York, NY, USA, 2013. [Google Scholar]
  32. United States Environmental Protection Agency (USEPA). National Overview: Facts and Figures on Materials, Wastes and Recycling. Available online: https://www.epa.gov/facts-and-figures-about-materials-waste-and-recycling/national-overview-facts-and-figures-materials (accessed on 15 August 2022).
  33. United States Environmental Protection Agency (USEPA). Inventory of U.S. Greenhouse Gas Emissions and Sinks: 1990–2019; United States Environmental Protection Agency (USEPA): Washington, DC, USA, 2021; Volume April. Available online: https://www.epa.gov/sites/default/files/2021-04/documents/us-ghg-inventory-2021-main-text.pdf (accessed on 15 August 2022).
  34. Eurostat Municipal Waste Statistics. Available online: https://ec.europa.eu/eurostat/statistics-explained/index.php?title=Municipal_waste_statistics#Municipal_waste_treatment (accessed on 15 August 2022).
  35. Eurostat Climate Change—Driving Forces. Available online: https://ec.europa.eu/eurostat/statistics-explained/index.php?title=Climate_change_-_driving_forces#Emissions_from_waste (accessed on 15 August 2022).
  36. Anshassi, M.; Smallwood, T.; Townsend, T.G. Life Cycle GHG Emissions of MSW Landfilling versus Incineration: Expected Outcomes Based on US Landfill Gas Collection Regulations. Waste Manag. 2022, 142, 44–54. [Google Scholar] [CrossRef] [PubMed]
  37. Wang, W.; Themelis, N.J.; Sun, K.; Bourtsalas, A.C.; Huang, Q.; Zhang, Y.; Wu, Z. Current Influence of China’s Ban on Plastic Waste Imports. Waste Dispos. Sustain. Energy 2019, 1, 67–78. [Google Scholar] [CrossRef]
  38. Brooks, A.L.; Wang, S.; Jambeck, J.R. The Chinese Import Ban and Its Impact on Globalplastic Waste Trade. Sci. Adv. 2018, 4, eaat0131. [Google Scholar] [CrossRef]
  39. Wang, C.; Zhao, L.; Lim, M.K.; Chen, W.Q.; Sutherland, J.W. Structure of the Global Plastic Waste Trade Network and the Impact of China’s Import Ban. Resour. Conserv. Recycl. 2020, 153, 104591. [Google Scholar] [CrossRef]
  40. Sovacool, B.K. Exploring and Contextualizing Public Opposition to Renewable Electricity in the United States. Sustainability 2009, 1, 702–721. [Google Scholar] [CrossRef]
  41. Gandy, M. Political Conflict over Waste-to-Energy Schemes. The Case of Incineration in New York. Land Use Policy 1995, 12, 29–36. [Google Scholar] [CrossRef]
  42. Quicker, P.; Consonni, S.; Grosso, M. The Zero Waste Utopia and the Role of Waste-to-Energy. Waste Manag. Res. 2020, 38, 481–484. [Google Scholar] [CrossRef]
  43. Hoang, A.T.; Varbanov, P.S.; Nižetić, S.; Sirohi, R.; Pandey, A.; Luque, R.; Ng, K.H.; Pham, V.V. Perspective Review on Municipal Solid Waste-to-Energy Route: Characteristics, Management Strategy, and Role in Circular Economy. J. Clean. Prod. 2022, 359, 131897. [Google Scholar] [CrossRef]
  44. United Nations Environment Programme. Waste to Energy Considerations for Informed Decision-Making; United Nations Environment Programme: Nairobi, Kenya, 2019. [Google Scholar]
  45. Powell, J.T.; Townsend, T.G.; Zimmerman, J.B. Estimates of Solid Waste Disposal Rates and Reduction Targets for Landfill Gas Emissions. Nat. Clim. Chang. 2016, 6, 162–165. [Google Scholar] [CrossRef]
  46. Themelis, N.J.; Bourtsalas, A.C. Methane Generation and Capture of U.S. Landfills. J. Environ. Sci. Eng. A 2021, 10, 199–206. [Google Scholar] [CrossRef]
  47. Staley, B.; Kantner, D. Quantification of Municipal Solid Waste Management in the United States—With Comparative Analysis to Other Estimates. Multidiscip. J. Waste Resour. Residues 2018, 3, 167–170. [Google Scholar] [CrossRef]
  48. Sauve, G.; Van Acker, K. The Environmental Impacts of Municipal Solid Waste Landfills in Europe: A Life Cycle Assessment of Proper Reference Cases to Support Decision Making. J. Environ. Manag. 2020, 261, 110216. [Google Scholar] [CrossRef]
  49. Mühle, S.; Balsam, I.; Cheeseman, C.R. Comparison of Carbon Emissions Associated with Municipal Solid Waste Management in Germany and the UK. Resour. Conserv. Recycl. 2010, 54, 793–801. [Google Scholar] [CrossRef]
  50. Habib, K.; Schmidt, J.H.; Christensen, P. A Historical Perspective of Global Warming Potential from Municipal Solid Waste Management. Waste Manag. 2013, 33, 1926–1933. [Google Scholar] [CrossRef]
  51. EUR-Lex Access to European Union Law Directive 2010/75/EU of the European Parliament and of the Council of 24 November 2010 on Industrial Emissions (Integrated Pollution Prevention and Control) Text with EEA Relevance. Available online: http://data.europa.eu/eli/dir/2010/75/oj (accessed on 15 August 2022).
  52. Department for Environment Food & Rural Affairs. Energy from Waste A Guide to the Debate; Department for Environment Food & Rural Affairs: London, UK, 2014.
  53. Scharff, H. Landfill Reduction Experience in The Netherlands. Waste Manag. 2014, 34, 2218–2224. [Google Scholar] [CrossRef]
  54. Gharfalkar, M.; Court, R.; Campbell, C.; Ali, Z.; Hillier, G. Analysis of Waste Hierarchy in the European Waste Directive 2008/98/EC. Waste Manag. 2015, 39, 305–313. [Google Scholar] [CrossRef]
  55. Castillo-Giménez, J.; Montañés, A.; Picazo-Tadeo, A.J. Performance and Convergence in Municipal Waste Treatment in the European Union. Waste Manag. 2019, 85, 222–231. [Google Scholar] [CrossRef]
  56. Marconsin, A.F.; Rosa, D.D.S. A Comparison of Two Models for Dealing with Urban Solid Waste: Management by Contract and Management by Public-Private Partnership. Resour. Conserv. Recycl. 2013, 74, 115–123. [Google Scholar] [CrossRef]
  57. Tičar, B.; Zajc, K. Public-Private Partnerships in Slovenia: Recent Developments and Perspectives. Rev. Cent. East Eur. Law 2010, 35, 191–215. [Google Scholar] [CrossRef]
  58. Pires, A.; Martinho, G.; Chang, N. Bin Solid Waste Management in European Countries: A Review of Systems Analysis Techniques. J. Environ. Manag. 2011, 92, 1033–1050. [Google Scholar] [CrossRef] [PubMed]
  59. Thermelis, N.J.; Ma, W. Waste to Energy (WTE) in China: From Latecomer to Front Runner. Waste Dispos. Sustain. Energy 2021, 3, 267–274. [Google Scholar] [CrossRef]
  60. van Ewijk, S.; Stegemann, J.A. Recognising Waste Use Potential to Achieve a Circular Economy. Waste Manag. 2020, 105, 1–7. [Google Scholar] [CrossRef]
  61. Fiorentino, G.; Ripa, M.; Protano, G.; Hornsby, C.; Ulgiati, S. Life Cycle Assessment of Mixed Municipal Solid Waste: Multi-Input versus Multi-Output Perspective. Waste Manag. 2015, 46, 599–611. [Google Scholar] [CrossRef]
  62. Tejaswini, M.S.S.R.; Pathak, P.; Ramkrishna, S.; Ganesh, P.S. A Comprehensive Review on Integrative Approach for Sustainable Management of Plastic Waste and Its Associated Externalities. Sci. Total Environ. 2022, 825, 153973. [Google Scholar] [CrossRef]
  63. Allesch, A.; Brunner, P.H. Material Flow Analysis as a Decision Support Tool Forwaste Management: A Literature Review. J. Ind. Ecol. 2015, 19, 753–764. [Google Scholar] [CrossRef]
  64. Organisation for Economic Co-operation and Development (OECD). Material Resources, Productivity and the Environment: Key Findings; OECD: Paris, France, 2011. Available online: http://www.oecd.org/greengrowth/MATERIAL_RESOURCES,_PRODUCTIVITY_AND_THE_ENVIRONMENT_key_findings.pdf (accessed on 15 August 2022).
  65. Fernández-González, J.M.; Grindlay, A.L.; Serrano-Bernardo, F.; Rodríguez-Rojas, M.I.; Zamorano, M. Economic and Environmental Review of Waste-to-Energy Systems for Municipal Solid Waste Management in Medium and Small Municipalities. Waste Manag. 2017, 67, 360–374. [Google Scholar] [CrossRef]
  66. Thorneloe, S.A.; Weitz, K.; Jambeck, J. Application of the US Decision Support Tool for Materials and Waste Management. Waste Manag. 2007, 27, 1006–1020. [Google Scholar] [CrossRef] [Green Version]
  67. Makarichi, L.; Techato, K.A.; Jutidamrongphan, W. Material Flow Analysis as a Support Tool for Multi-Criteria Analysis in Solid Waste Management Decision-Making. Resour. Conserv. Recycl. 2018, 139, 351–365. [Google Scholar] [CrossRef]
  68. Buttol, P.; Masoni, P.; Bonoli, A.; Goldoni, S.; Belladonna, V.; Cavazzuti, C. LCA of Integrated MSW Management Systems: Case Study of the Bologna District. Waste Manag. 2007, 27, 1059–1070. [Google Scholar] [CrossRef] [PubMed]
  69. Feo, G.; De Malvano, C. The Use of LCA in Selecting the Best MSW Management System. Waste Manag. 2009, 29, 1901–1915. [Google Scholar] [CrossRef] [PubMed]
  70. Wang, D.; Tang, Y.T.; Sun, Y.; He, J. Assessing the Transition of Municipal Solid Waste Management by Combining Material Flow Analysis and Life Cycle Assessment. Resour. Conserv. Recycl. 2022, 177, 105966. [Google Scholar] [CrossRef]
  71. Chan, K.S.; Chan, H.K.; Zhang, T.; Xu, M. Proceedings of the 2020 International Conference on Resource Sustainability—Sustainable Urbanisation in the BRI Era, IcRS Urbanisation 2020; Springer: Berlin/Heidelberg, Germany, 2020; ISBN 9789811596049. [Google Scholar]
  72. Anshassi, M.; Laux, S.J.; Townsend, T.G. Approaches to Integrate Sustainable Materials Management into Waste Management Planning and Policy. Resour. Conserv. Recycl. 2019, 148, 55–66. [Google Scholar] [CrossRef]
  73. Mayer, F.; Bhandari, R.; Gäth, S.A.; Himanshu, H.; Stobernack, N. Economic and Environmental Life Cycle Assessment of Organic Waste Treatment by Means of Incineration and Biogasification. Is Source Segregation of Biowaste Justified in Germany? Sci. Total Environ. 2020, 721, 137731. [Google Scholar] [CrossRef] [PubMed]
  74. World Bank Group. Innovative Finance Solutions for Climate-Smart Infrastructure: New Perspectives on Results-Based Blended Finance for Cities; World Bank Group: Washington, DC, USA, 2019. [Google Scholar]
  75. European Commission Industrial Emissions Directive. Available online: https://ec.europa.eu/environment/industry/stationary/ied/legislation.htm (accessed on 15 August 2022).
  76. United States Environmental Protection Agency (USEPA). Leaching Environmental Assessment Framework (LEAF) Methods and Guidance. Available online: https://www.epa.gov/hw-sw846/leaching-environmental-assessment-framework-leaf-methods-and-guidance (accessed on 15 August 2022).
Figure 1. Products in the municipal waste stream, types, and disposition, in thousands of tonnes, years: (a) 1990, (b) 2000, (c) 2010, and (d) 2018.
Energies 15 06581 g001aEnergies 15 06581 g001b
Figure 2. Composition of waste products in the U.S. in 2018. Other non-ferrous include mainly lead from lead-acid batteries.
Energies 15 06581 g002
Figure 3. Management of materials contained in broad categories assessed, in 2018. Other non-ferrous contain mainly lead from lead-acid batteries.
Energies 15 06581 g003
Figure 4. Recycling, energy recovery, and landfilling rates of products managed in the US in 1990, 2000, 2010 to 2018. Bubble size represents the amount of products recycled, combusted for energy, and landfilled.
Energies 15 06581 g004
Figure 5. Fossil fuels used and WTE potential to substitute fossil fuels in the U.S.: (a) total amounts, and (b)% substitution by WTE (WTE/fossil fuel).
Energies 15 06581 g005
Figure 6. Changes in U.S. generation and disposition of MSW, and associated GHG emissions, from 1990 to 2018.
Energies 15 06581 g006
Figure 7. Changes in EU generation and disposition of MSW, and associated GHG emissions, from 1995 to 2020 [34,35].
Energies 15 06581 g007
Table 1. Products considered in this study [22].
CategoryProductProducts Included
DurablesMajor appliances or white goodsRefrigerators, washing machines, and water heaters
Small appliancesToasters, hair dryers, and electric coffee pots
Furniture and furnishingsSofas, tables, chairs, and mattresses
Carpets and rugsN/A
Rubber tiresN/A
Batteries, lead acidAutomobiles, trucks, and motorcycles
Miscellaneous durablesElectronics and consumer electronics such as television sets, videocassette recorders, personal computers, luggage, and sporting equipment
Non-durablesNewspapers/mechanical paperN/A
Other paperBrochures, reports, menus, invitations, posters, photographic papers, cards, and games
Disposable diapersInfant diapers and adult incontinence products
Plastic plates and cupsPlastic plates, cups, glasses, dishes and bowls, hinged containers, and other containers used in food service at home, in restaurants and other commercial establishments, and in institutional settings such as schools
Trash bagsHigh-density polyethylene and low-density polyethylene for both indoor and outdoor use
Clothing and footwearTextiles, rubber and leather are the major material components of this category, with some plastics present as well
Towels, sheets, and pillowcasesN/A
Other miscellaneous non-durablesThe primary material component is plastics, although some aluminum, rubber, and textiles are also present
Containers and packagingGlass packagingBeer and soft drink bottles, wine and liquor bottles, as well as bottles and jars for food and juices, cosmetics, and other products
Steel packagingSteel food cans and other cans, and other steel packaging (e.g., strapping, and steel barrels and drums)
Aluminum packagingBeer and soft drink cans (including all carbonated and non-carbonated soft drinks, tea, tonic, waters and juice beverages), other cans, and foil and closures (including semi-rigid foil containers, caps, closures, and flexible packaging)
Paper and paperboard packagingCorrugated boxes, milk and juice cartons, and other products packaged in gable top cartons and liquid food aseptic cartons, folding cartons (e.g., cereal boxes, frozen food boxes, some department store boxes), bags and sacks, wrapping papers, and other paper and paperboard packaging (primarily set-up boxes such as shoe, cosmetic, and candy boxes)
Plastics packagingPolyethylene terephthalate (PET) soft drink and water bottles, high-density polyethylene (HDPE) milk and water jugs, film products (including bags and sacks) made of low-density polyethylene (LDPE) and other containers and packaging (including clamshells, trays, caps, lids, egg cartons, loose fill, produce baskets, coatings, and closures) made up of polyvinyl chloride (PVC), polystyrene (PS), polypropylene (PP), and other resins.
Wood packagingWood pallets and wood crates
Other miscellaneous packagingBags made of textiles and small amounts of leather
Publisher’s Note: MDPI stays neutral with regard to jurisdictional claims in published maps and institutional affiliations.

