Article

Wind Turbine Gust Load Alleviation with Active Flow Control

Center for Wind Energy, Department of Mechanical Engineering, University of Texas at Dallas, 800 W. Campbell Road, Richardson, TX 75080, USA
*
Author to whom correspondence should be addressed.
Energies 2022, 15(17), 6474; https://doi.org/10.3390/en15176474
Submission received: 11 July 2022 / Revised: 20 August 2022 / Accepted: 27 August 2022 / Published: 5 September 2022
(This article belongs to the Special Issue Innovative Methods for the Control of Very Large Wind Turbines)

Abstract

:
Large wind turbine rotors are becoming more common in utility-scale wind power, especially for offshore wind plants. However, the trend toward large rotors can be limited by their ability to manage dynamic and extreme loads. To provide a safety margin for the rotor design and avoid catastrophic events such as tower strikes, extreme loads need to be controlled. The objective of this study is to develop and evaluate a feedback control system to alleviate extreme loads and reduce blade deflections under gust events using active flow control devices. We also propose a modification in the turbine controller to achieve further reduction in extreme loads. The extreme load reductions are evaluated under gust wind conditions with direction changes according to the IEC standard. The effects of the gust alleviation controller on turbine performance and fatigue loads are investigated as well. With the deployment of the gust alleviation controller and modified turbine baseline controller, the extreme loads and deflections reduce by up to 23%. The energy captured by the turbine is not affected by the proposed gust alleviation controller. The fatigue loads of various wind turbine components are either reduced or remain unchanged.

Graphical Abstract

1. Introduction

Dynamic and extreme structural loads on turbine components are critical for wind turbine design as rotor diameter increases. In general, mitigating these structural loads leads to an increase in lifetime and safer operation of the wind turbines, especially with large rotors. Thus, a reduction in extreme and fatigue loads can lead to a reduction in Levelized Cost of Energy (LCOE) [1,2,3]. Individual Pitch Control (IPC) is a well-known method that has been utilized to reduce dynamic and extreme loads on wind turbines [4,5,6]. However, load control using IPC can cause excessive wear in the pitch bearings because of the increased oscillating cycles and starved lubrication [7], which limits the IPC’s operating time.
Active Flow Control (AFC) devices offer an attractive alternative to IPC. These devices can modulate the lift along the blade span. These devices include trailing edge flaps, microtabs, shape changing blades and plasma actuators. Some of these devices, such as Dielectric Barrier Discharge (DBD) plasma actuators, have no moving parts and can be used without extensive wear and tear during operation. Sectional Lift Actuators (SLAs) have been developed to emulate DBD plasma actuators [8] and have been utilized to reduce dynamic fatigue loads on the blades using the so-called Sectional Lift Control (SLC) [3,9,10].
Apart from fatigue damage due to dynamic loads, extreme loads under gust conditions can also cause serious and sometimes catastrophic damage to the turbine, e.g., tower strike [11]. Studies have been conducted to evaluate the extreme loads reduction using dynamic load control approaches such as IPC and Individual Flap Control (IFC). Bottasso et al. [6] proposed a load mitigation strategy using IPC to reduce the ultimate loads under extreme events. Lower peak loads for the main bearing, yaw bearing and tower were achieved, while no significant reduction in blade load was observed. Lackner and van Kuik [12] investigated the performance of smart rotor control approaches (IPC and IFC) during extreme load events. These approaches, designed for fatigue load reduction, were ineffective at reducing the blade loads during uniform gusts. However, the IFC designed for rotor speed control had additional benefit of reducing blade loads. Bernhammer et al. [13] analyzed the fatigue and extreme loads reduction with an individual flap controller designed for fatigue load reduction. The blade root bending moments and tip deflections were not affected significantly under gust events during power production. Based on these studies, we can conclude that the dynamic load controllers, designed for fatigue load reduction, have limited capability for reducing extreme loads, especially the blade root moments. This is because the gust wind induces a thrust force in the rotor, which requires a collective rather than a cyclic control to reduce the extreme loads.
Load alleviation systems aiming to reduce extreme loads have also been designed and evaluated in the literature. Kanev and van Engelen [14] proposed an extreme event control strategy. A wind gust and direction change recognition algorithm was designed based on an extended Kalman filter to detect extreme events using blade root bending moments measurements. Upon detection of an extreme event, the extreme event control was activated. The rotor overspeed was controlled by collectively manipulating the blade pitch angles, and the blade root dynamic loads were mitigated with individual pitch control. Consequently, the extreme gust loads at the blade root were reduced. The normal turbine pitch and torque controllers were switched off under extreme event control. Carcangiu et al. [15] proposed two strategies to mitigate the extreme loads. A pattern recognition artificial neural network was used to detect extreme wind events using anemometer measurements. Upon gust detection, the first strategy called ‘ride-through’ changed the collective blade pitch to a threshold pitch angle to reduce the loads. Another strategy called ‘early stop’ initiated a controlled stop when the gust event was detected. Overall, the ride-through strategy performed better. The extreme loads of blade root and tower base were reduced by up to 20% and 30%. Schlipf et al. [16] presented a load reduction controller using LIDAR measurements for wind prediction. A nonlinear model predictive controller with LIDAR measurement was designed and its performance was compared with a baseline controller without wind prediction (i.e., look ahead) information. The results showed up to 50% extreme gust load reduction on the tower base fore-aft bending moment.
Barlas et al. [17] evaluated the capability of active trailing edge flaps for extreme load alleviation. Collective and individual flap controllers were designed to alleviate extreme and fatigue loads using feedback of the blade root flapwise bending moments. The collective flap controller aimed to reduce the extreme blade load when the loads exceeded the predefined threshold. The flaps were commanded to a predefined angle with a maximum rate to reduce extreme loads. The individual flap controller focused on reducing the blade root fatigue loads in the above-rated conditions under normal operation. The load analysis discovered that the extreme blade root flapwise bending moment was reduced by 12%.
In this study, we focus on a feedback control approach given its simplicity and propose a Gust Alleviation Controller (GAC) to reduce extreme loads and blade-tip deflections using SLAs. A switching logic is designed to integrate the GAC with the existing fatigue load controller (SLC) from [9] such that SLC is switched off and only GAC is activated during a gust event, while the SLC remains active during the normal operation of the turbine. The GAC proposed in this paper is similar to the one described in [17], with blade root flapwise bending moment sensors used for feedback. Since the turbine controller also plays a critical role in performance and loads, we investigate and propose a modification to the NREL ROSCO turbine controller [18], which leads to further reduction of extreme loads and lower out-of-plane tip deflections.
This paper has three contributions. Firstly, we propose a load analysis methodology for design and evaluation of the GAC following the industry IEC standard [19]. The performance of GAC is evaluated under gust wind condition in terms of reductions in extreme loads and structural deflections. We also evaluate GAC’s effects on turbine performance and fatigue loads under turbulent wind condition. Secondly, we describe a procedure to design the GAC by utilizing the SLAs (Section Lift Actuators). A switching logic with hysteresis is proposed to ensure that the GAC is active when the loads exceed the threshold, and does not affect the normal operations of the turbine with SLC. The optimal load thresholds for the GAC are selected based on a weighted sum of the normalized metrics of interest. The designed GAC shows reductions in extreme loads and deflections by up to 10% under the Extreme Coherent guest with Direction change (ECD). No significant changes are observed in turbine performance and the fatigue damage by activating the GAC. Lastly, we propose a modification in the ROSCO turbine controller by adding a back-calculation anti-windup scheme to improve the saturation management and system dynamics. The GAC with modified ROSCO can reduce the extreme loads and deflections by up to 23%. Standard deviation of the turbine performance indicators such as rotor speed, pitch angle and generator power are reduced by up to 6.2%, which results in a relatively stable turbine operation. The modification in ROSCO also achieves additional reductions in fatigue loads by up to 6.9% under turbulent wind as compared to the case with SLC and original ROSCO only.
The particular wind turbine model and actuator configuration used in our study results in different reductions in extreme loads as compared to prior work using feedback only [14,15,17]. Thus, a quantitative comparison with prior feedback techniques is not quite feasible because results in the open literature use different turbine models. Furthermore, there are differences in wind conditions and turbine operational modes (e.g., “power production”, “power production plus occurrence of fault”) used for the evaluation of ultimate loads. It should be noted that our study involves active flow control using plasma-based actuators (with no moving parts) acting on a particular blade section and does not require installation of LIDAR or pitching the whole blade.
The paper is organized as follows. The turbine setup is described in Section 2. The turbine model, lift actuator model and controllers including baseline controller and dynamic load controller are briefly introduced. Section 3 describes the load analysis methodology for GAC development. The IEC standard-based analyses are proposed for gust wind and normal turbulent wind conditions to evaluate the controller performance. The corresponding evaluation metrics are also discussed. Section 4 discusses the details of the GAC and modified ROSCO (turbine controller). The optimal thresholds selection of the GAC are established based on the weighted sum of selected metrics of interest. The proposed controller configurations are then evaluated and compared in Section 5 following the load analysis methodology. The extreme load/deflection reduction results under gust wind, as well as the GAC’s effects on turbine performance and fatigue loads are analyzed. Conclusions are in Section 6.

2. Turbine Details

The IEA 3.4A turbine described in [3] is used in this study. Key parameters for the turbine are summarized in Table 1. This turbine is based on the IEA 3.4-MW turbine [20] and is redesigned to integrate controllable Gurney flaps with DBD plasma actuators for the dynamic load control. NREL’s OpenFAST [21] simulation tool is used for the numerical analysis. The OpenFAST model of the turbine and controllers, including baseline and load controllers, are implemented in SIMULINK. The tools IECWind [22] and TurbSim [23] are used for deterministic and stochastic wind profiles generation. The post-processor MLife [24] is used for fatigue load analysis measured by Damage Equivalent Load (DEL).

2.1. Lift Actuator

The Gurney flap and the plasma actuator work together as a lift actuator, which allows a sectional lift coefficient change ( Δ C L ) between 0.2 and + 0.2 with respect to the baseline lift coefficient at a given angle of attack range. The lift actuator is assumed to be effective from 14 degrees to 20 degrees angle of attack. Figure 1 shows the baseline and actuated lift coefficient for the blade section.
A single lift actuator is mounted on each blade of the turbine. The aerodynamic properties of the actuated sections are modified according to the actuator commands. Figure 2 shows the blade plot with chord length at percentage span locations. The actuated section is shown with the shaded area with a coverage of 24 % of the blade length. It starts from the blade span of 47.9 m and extends to the blade tip at 63 m.

2.2. Turbine Controller

NREL’s Reference Open-Source Controller (ROSCO) [18] is used in this study as the turbine baseline controller. ROSCO is a newly designed framework which generalizes and simplifies the controller design process. It uses a PI torque controller to track the optimal TSR based on the estimated/measured wind speed for the below-rated operation. In the above-rated condition, a gain-scheduled collective pitch PI controller is used to regulate the rotor speed. ROSCO incorporates new functionalities such as the Tip-Speed Ratio (TSR) tracking torque controller and the set-point smoothing logic. The TSR tracking makes a controller more representative of the controllers in the field. The set-point smoothing logic enables the controller to handle the transition between below-rated and above-rated regimes smoothly, thus reducing the loads and preventing unnecessary switching between torque and pitch controllers, which is known to be an issue for the legacy NREL baseline controller [25].
Figure 3 shows a simplified block diagram of ROSCO. The measurements used by the controller are generator speed ω g , collective pitch angle β , generator torque τ g and rotor spatial averaged wind speed V avg . The actuator commands are generator torque and collective pitch angle. In below-rated conditions, the torque controller commands the torque to maintain the optimal TSR while the pitch is held constant at the minimum pitch angle. In the above-rated conditions, the torque controller keeps the torque fixed at the rated torque while the pitch controller maintains the rated generator speed.
The torque and pitch PI controllers are in the form of Equation (1),
u ( t ) = k p e + k i 0 t e ( τ ) d τ
with error signal e = ω ref , T ω g for the torque controller and e = ω ref , P ω g for the pitch controller. Low-pass filters in ROSCO for the signal processing are omitted for simplicity in this block diagram.
For this study, ROSCO parameters for the 3.4A turbine are generated using ROSCO toolbox. The natural frequency and damping ratio of the closed-loop torque and pitch PI controllers are chosen to be 0.2 rad/s and 1.0 respectively, which are the same as the IEA 3.4-MW turbine controller. Filtered rotor-disk-averaged relative wind speed is used as the wind speed estimate to calculate the reference generator speed for the PI controllers.

2.3. Fatigue Load Controller

A dynamic load reduction controller, denoted as SLC, has been incorporated to the 3.4 A turbine to reduce the amplitude variations of the blade-root flapwise bending moments. The controller and dynamic fatigue load reductions achieved have been described in [9] and briefly described here. The SLC controller was designed in the non-rotating frame based on the Multi-Blade Coordinate transformation (MBC), with the objective to reduce the blade root flapwise dynamic loads at 1P (one-per-revolution) and the neighboring frequencies. The SLC reduced the Damage Equivalent Loads (DELs) of the blade root flapwise bending moments by up to 12% under IEC Design Load Case (DLC) 1.2 in the above-rated wind condition. The other loads, such as blade root edgewise bending moment DELs and tower base bending moment DELs, were not affected significantly. The SLC’s effect on the blade tip deflections were also minimal, with small reductions in its 95th percentile and Standard Deviation (STD). Moreover, the operation of SLC did not affect the turbine performance indicators such as generated power, collective pitch angle and rotor speed. In addition, the SLC achieved DEL reduction in below-rated conditions, which led to a further 34% decrease in Weibull-weighted DELs for blade root flapwise bending moments and 1.65–3.11% LCOE reduction [3].

3. Load Analysis Methodology

This study focuses on incorporating the gust alleviation controller into the existing baseline and SLC controllers during the normal power production. Therefore, the design situations considered are normal power production under gust wind and normal turbulence wind. The evaluation metrics are created for both situations to analyze controller performance.

3.1. Design Load Cases

The International Electrotechnical Commission (IEC) standard 61400-1 [19] is used as a reference for the simulation cases. The simulations are conducted under gust wind condition to evaluate the extreme load alleviation effect on deflections. Then, turbulent wind condition simulations are conducted to evaluate the effects on power production, turbine performance and fatigue loads.

3.1.1. DLC 1.4

The gust event during normal power production leads to Design Load Case (DLC) 1.4 in the IEC standard. The DLC 1.4 requires an Extreme Coherent gust with Direction change (ECD). The ECD is defined as a combination of change in amplitude V ( z , t ) and direction θ ( t ) of the wind as shown in Equations (2) and (3),
V ( z , t ) = V 0 ( z ) , for t < 0 V 0 ( z ) + 0.5 V c g ( 1 cos ( π t / T ) ) , for 0 t T V 0 ( z ) + V c g , for t > T
θ ( t ) = 0 ° , for t < 0 ± 0.5 θ c g ( 1 cos ( π t / T ) ) , for 0 t T ± θ c g , for t > T
where V 0 ( z ) denotes the wind speed prior to gust as a function of height z. The magnitude of the total change in wind speed due to extreme coherent gust V c g is defined to be 15 m/s and the rise time T to be 10 s. The magnitude of the total change in direction due to gust θ c g is defined as
θ c g ( V hub ) = 180 ° , for V hub < 4 m / s 720 °   m / s V hub , for 4 m / s V hub < V ref
where V ref is the reference wind speed average over 10 min. It is determined based on the wind turbine class. The hub height wind speed is denoted by V hub .
Figure 4 shows a visualization of the ECD for the IEA 3.4A turbine with V hub = 9.8 m / s (rated wind speed). The downwind direction is marked in the figure with X i . The size and direction of the arrows represent the wind speed magnitudes and directions. The gust wind starts at 100 s and stabilizes at 110 s. Note that the arrows are scaled down by 70% to provide a better visualization.
Three wind speeds are recommended for DLC 1.4, where hub height wind speed equals to V rated 2 m / s , V rated and V rated + 2 m / s . However, in this study, we focus on the rated wind speed as it corresponds to the largest extreme flapwise bending moment. Figure 5 shows the time series of the blade root flapwise bending moments under three recommended wind speeds. The extreme flapwise bending moments for the rated wind speed are always higher than those in the other two cases. The case of V rated 2 m / s leads to a wind direction change of more than 90 degrees in less than 10 s. The turbine stops producing power due to this. Given the maximum yaw rate of this turbine is 0.25 deg/s, the turbine can only yaw 2.5 degrees in 10 s. Therefore, the yaw error stays at around 90 degrees during the transient and shortly after. The case of V rated + 2 m / s shows lower loads because the pitch angle is higher than the pitch at rated wind speed, as the lift is reduced by pitching to feather. Thus, only the rated wind speed with the highest peak loads is considered for the purpose of this study.
For deterministic wind, IECWind is used to generate the wind profile. The time to start the gust is set to be 100 s to avoid the initial transient. Given the gust wind duration is 10 s for ECD, the maximum speed of 24.8 m / s and direction change of 73.47 degrees occur at 110 s. The extreme condition is chosen to last for another 10 s for the dynamics to settle down. Thus, 120 s of total simulation time is used for this gust event analysis.
The ultimate strength analysis in DLC 1.4 can be interpreted as comparing the worst-case transient value with the characteristic value of the material property with safety factors taken into account. For the gust event analysis, we compare the worst-case transient values under different controller configurations to quantify the performance since the safety factors and material properties remain constant.

3.1.2. DLC 1.2

Simulations under turbulent wind conditions are conducted to evaluate the impact on power production, turbine performance and fatigue loads (DELs) with GAC. The fatigue analysis in normal power production uses DLC 1.2. Turbulent wind defined by Normal Turbulence Model (NTM) is required for this analysis. Wind speeds range from cut-in to cut-out are recommended for DLC 1.2. However, we focus on the rated mean wind speed as it is the GAC’s main focus, which is also consistent with the DLC 1.4 analysis. Thus, simulations are conducted following the IEC standard at the rated mean wind speed ( 9.8 m / s ).
Turbulent wind files of a duration of 700 s are generated using TurbSim with six different random seeds. The first 100 s of the simulation are removed to ignore the initial transient. Therefore, the total duration of the simulation is 6 × 600 s, which is one hour. The effect of different controller configurations are evaluated using DELs and statistics of turbine performance metrics. The fatigue load reduction capability is examined with DELs calculated by MLife [24]. Power production and turbine performance metrics such as rotor speed and pitch activity are compared using mean and standard deviation for stochastic analysis. The full evaluation criteria are discussed in Section 3.2.
The design load cases considered for this study are summarized in Table 2. Note that the safety factors in the standard are not applied to any results in this study as we only investigate the percentage changes.

3.2. Evaluation Metrics

To analyze the performance of the proposed controller configurations, two sets of metrics are proposed. The first set of metrics is for gust wind conditions analysis. It consists of worst-case (maximum absolute) transient values of interest for the DLC 1.4 analysis. The second set of metrics is to examine the turbine performance under normal turbulence wind. The mean and standard deviation of generator power, rotor speed and collective pitch are used to evaluate if the proposed controllers affect the normal turbine operation. Table 3 summarizes the evaluation criteria of interest and classify the metrics into primary and secondary criteria. The primary criteria are the focus of the gust controller as they are closely related to the catastrophic events, such as tower strike and overspeed failures.

4. GAC Controller Design

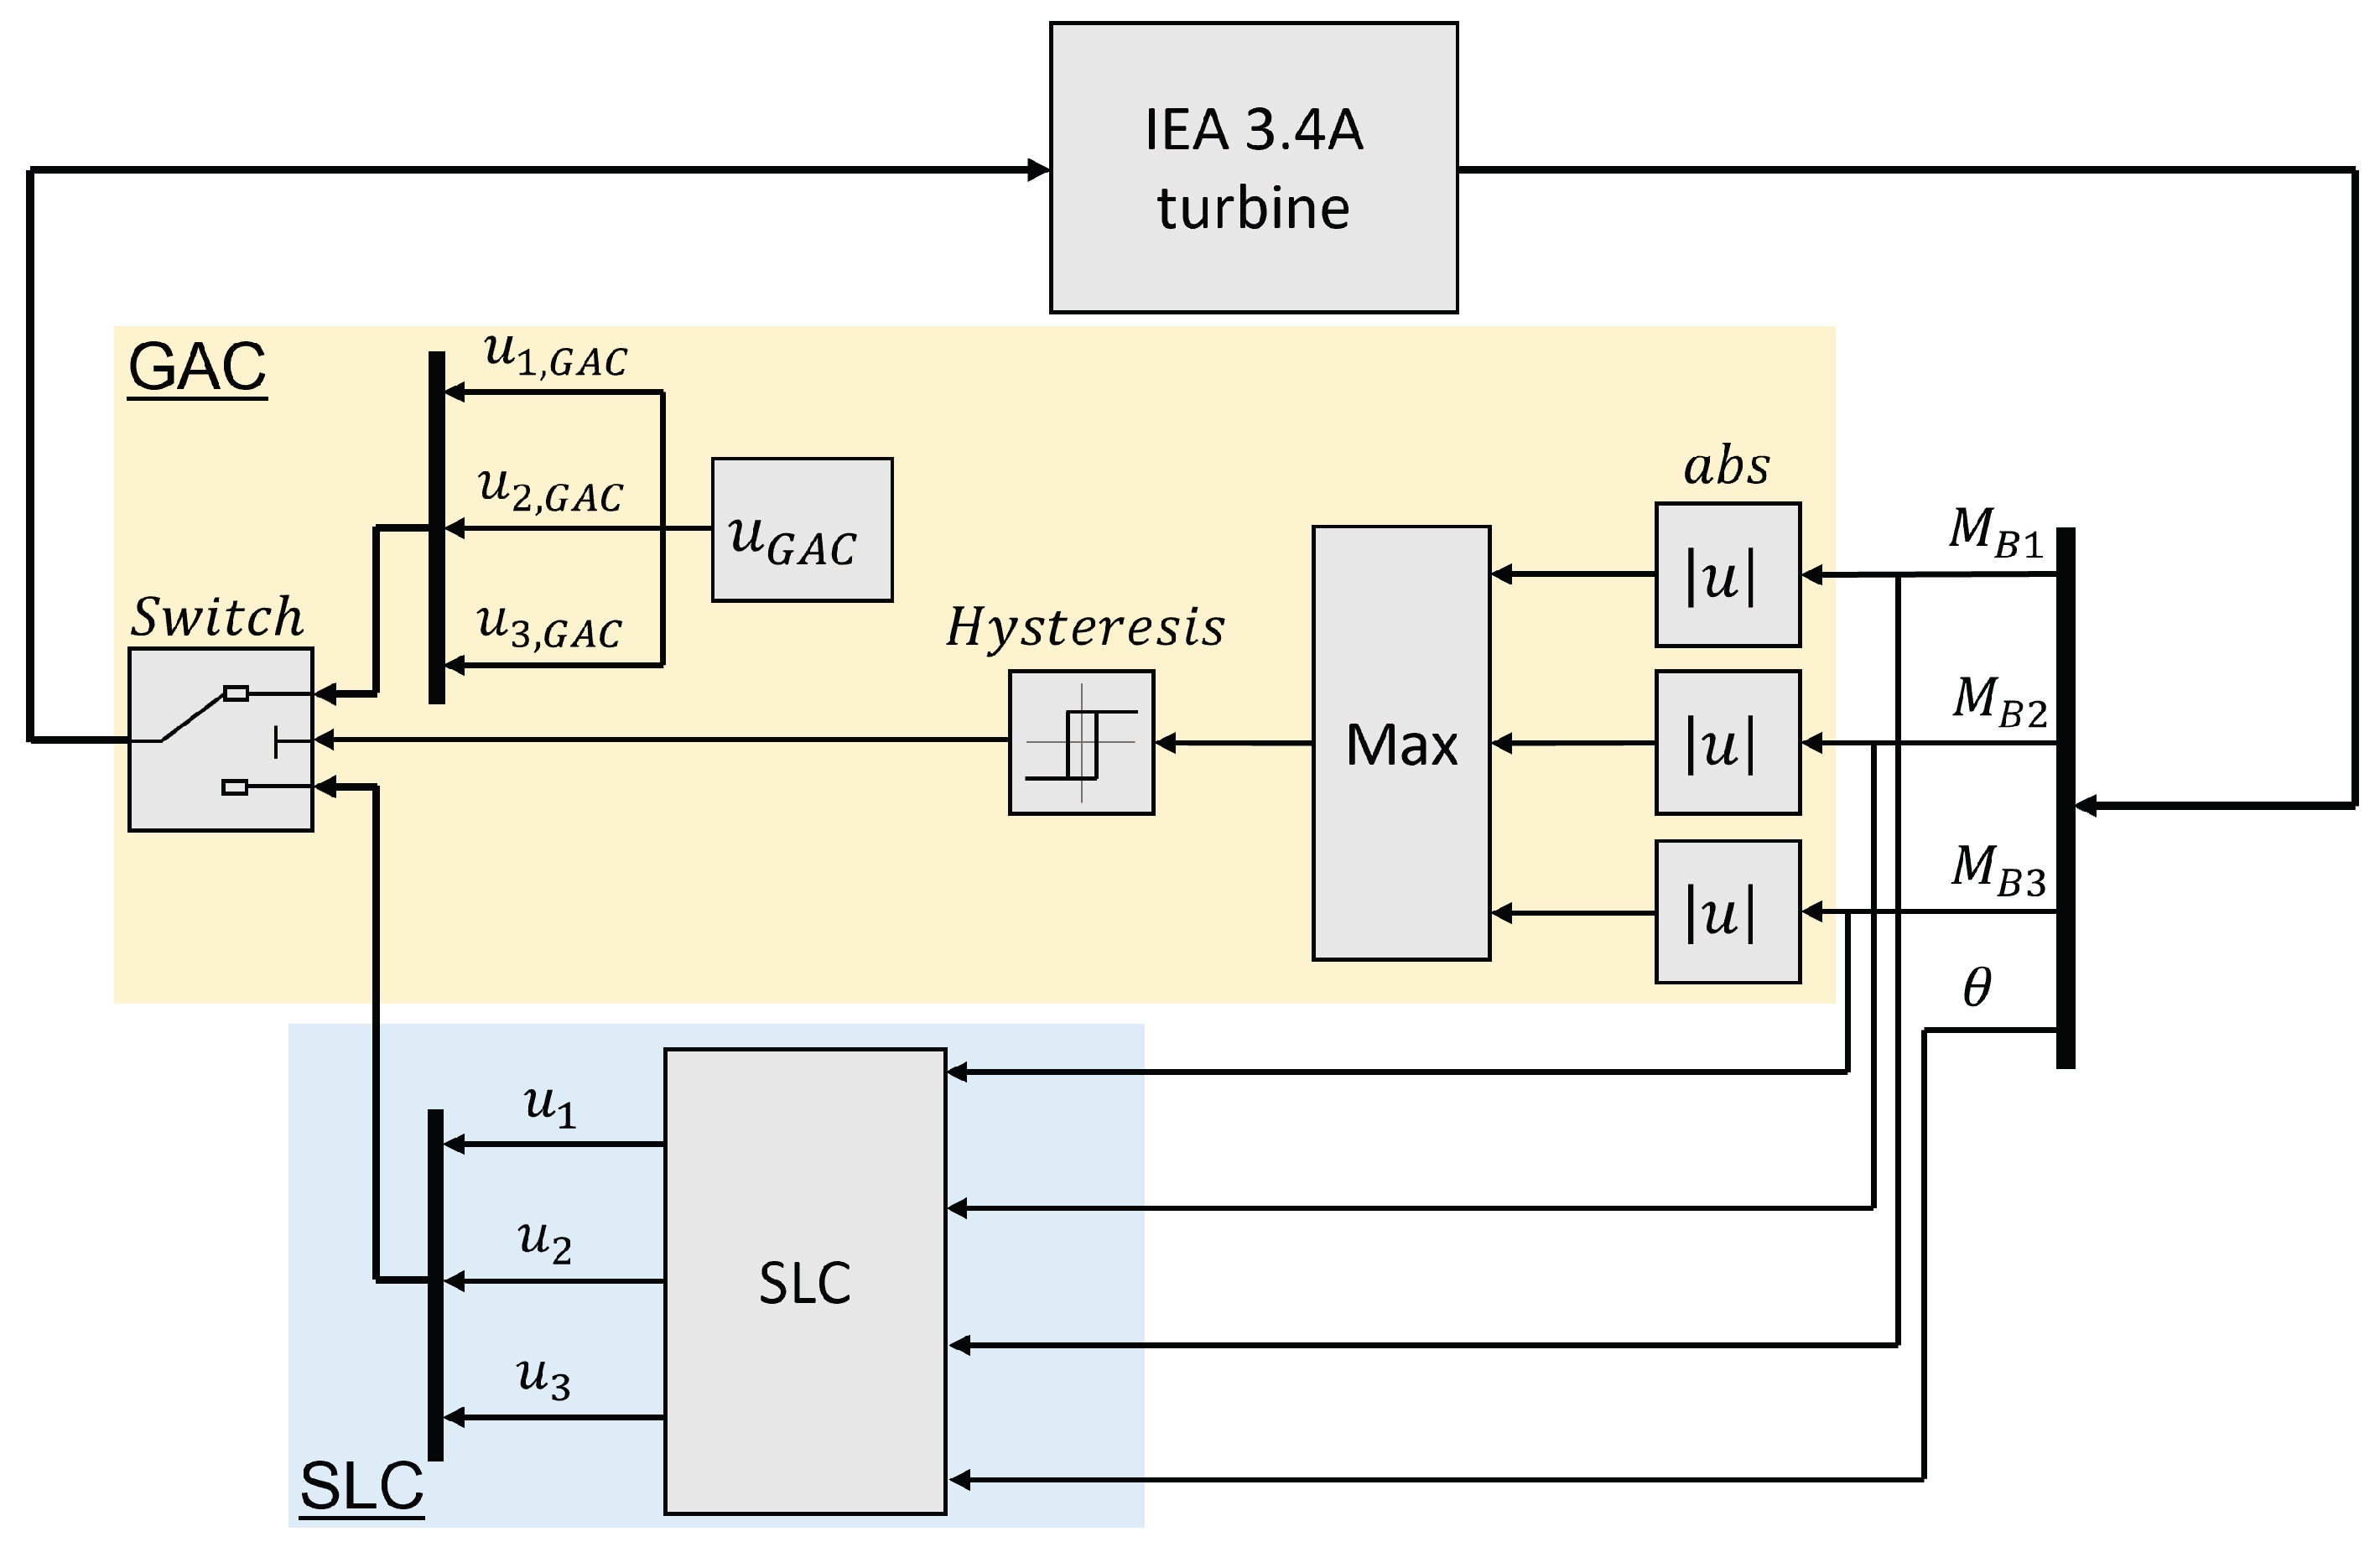
A gust induces a thrust force in the rotor, which requires a collective rather than a cyclic control to reduce the extreme transient loads. The blade responses such as blade root flapwise bending moments are used as the feedback signals. The GAC is designed such that once the flapwise bending moment of any of the three blades reaches a predefined upper load threshold, the SLA actuator commands for all the blades switch to a predefined value ( u GAC ) to reduce extreme loads.
We implement a switching logic with hysteresis to ensure that the only the GAC remains active during a gust event or under extreme loads and does not affect the normal operations of the turbine including SLC. The switching logic ensures that the actuator commands switch back to the normal turbine operation (with SLC) once all the bending moments are below a predefined lower load threshold. Figure 6 shows the block diagram of this switching logic.

4.1. Modifications to the ROSCO

When a large set-point change or disturbance occurs, e.g., due to a gust wind, the turbine PI controller commands may reach actuator limits such as saturation and rate limits. In this case, the system can be considered to be open-loop since the actuator remains at its limit regardless of the plant outputs. For the controllers with an integrator, a saturated actuator causes a non-zero error signal that continues to be integrated. This is the so-called integrator windup. In this case, integrator anti-windup is needed to restore controller effectiveness [26]. 
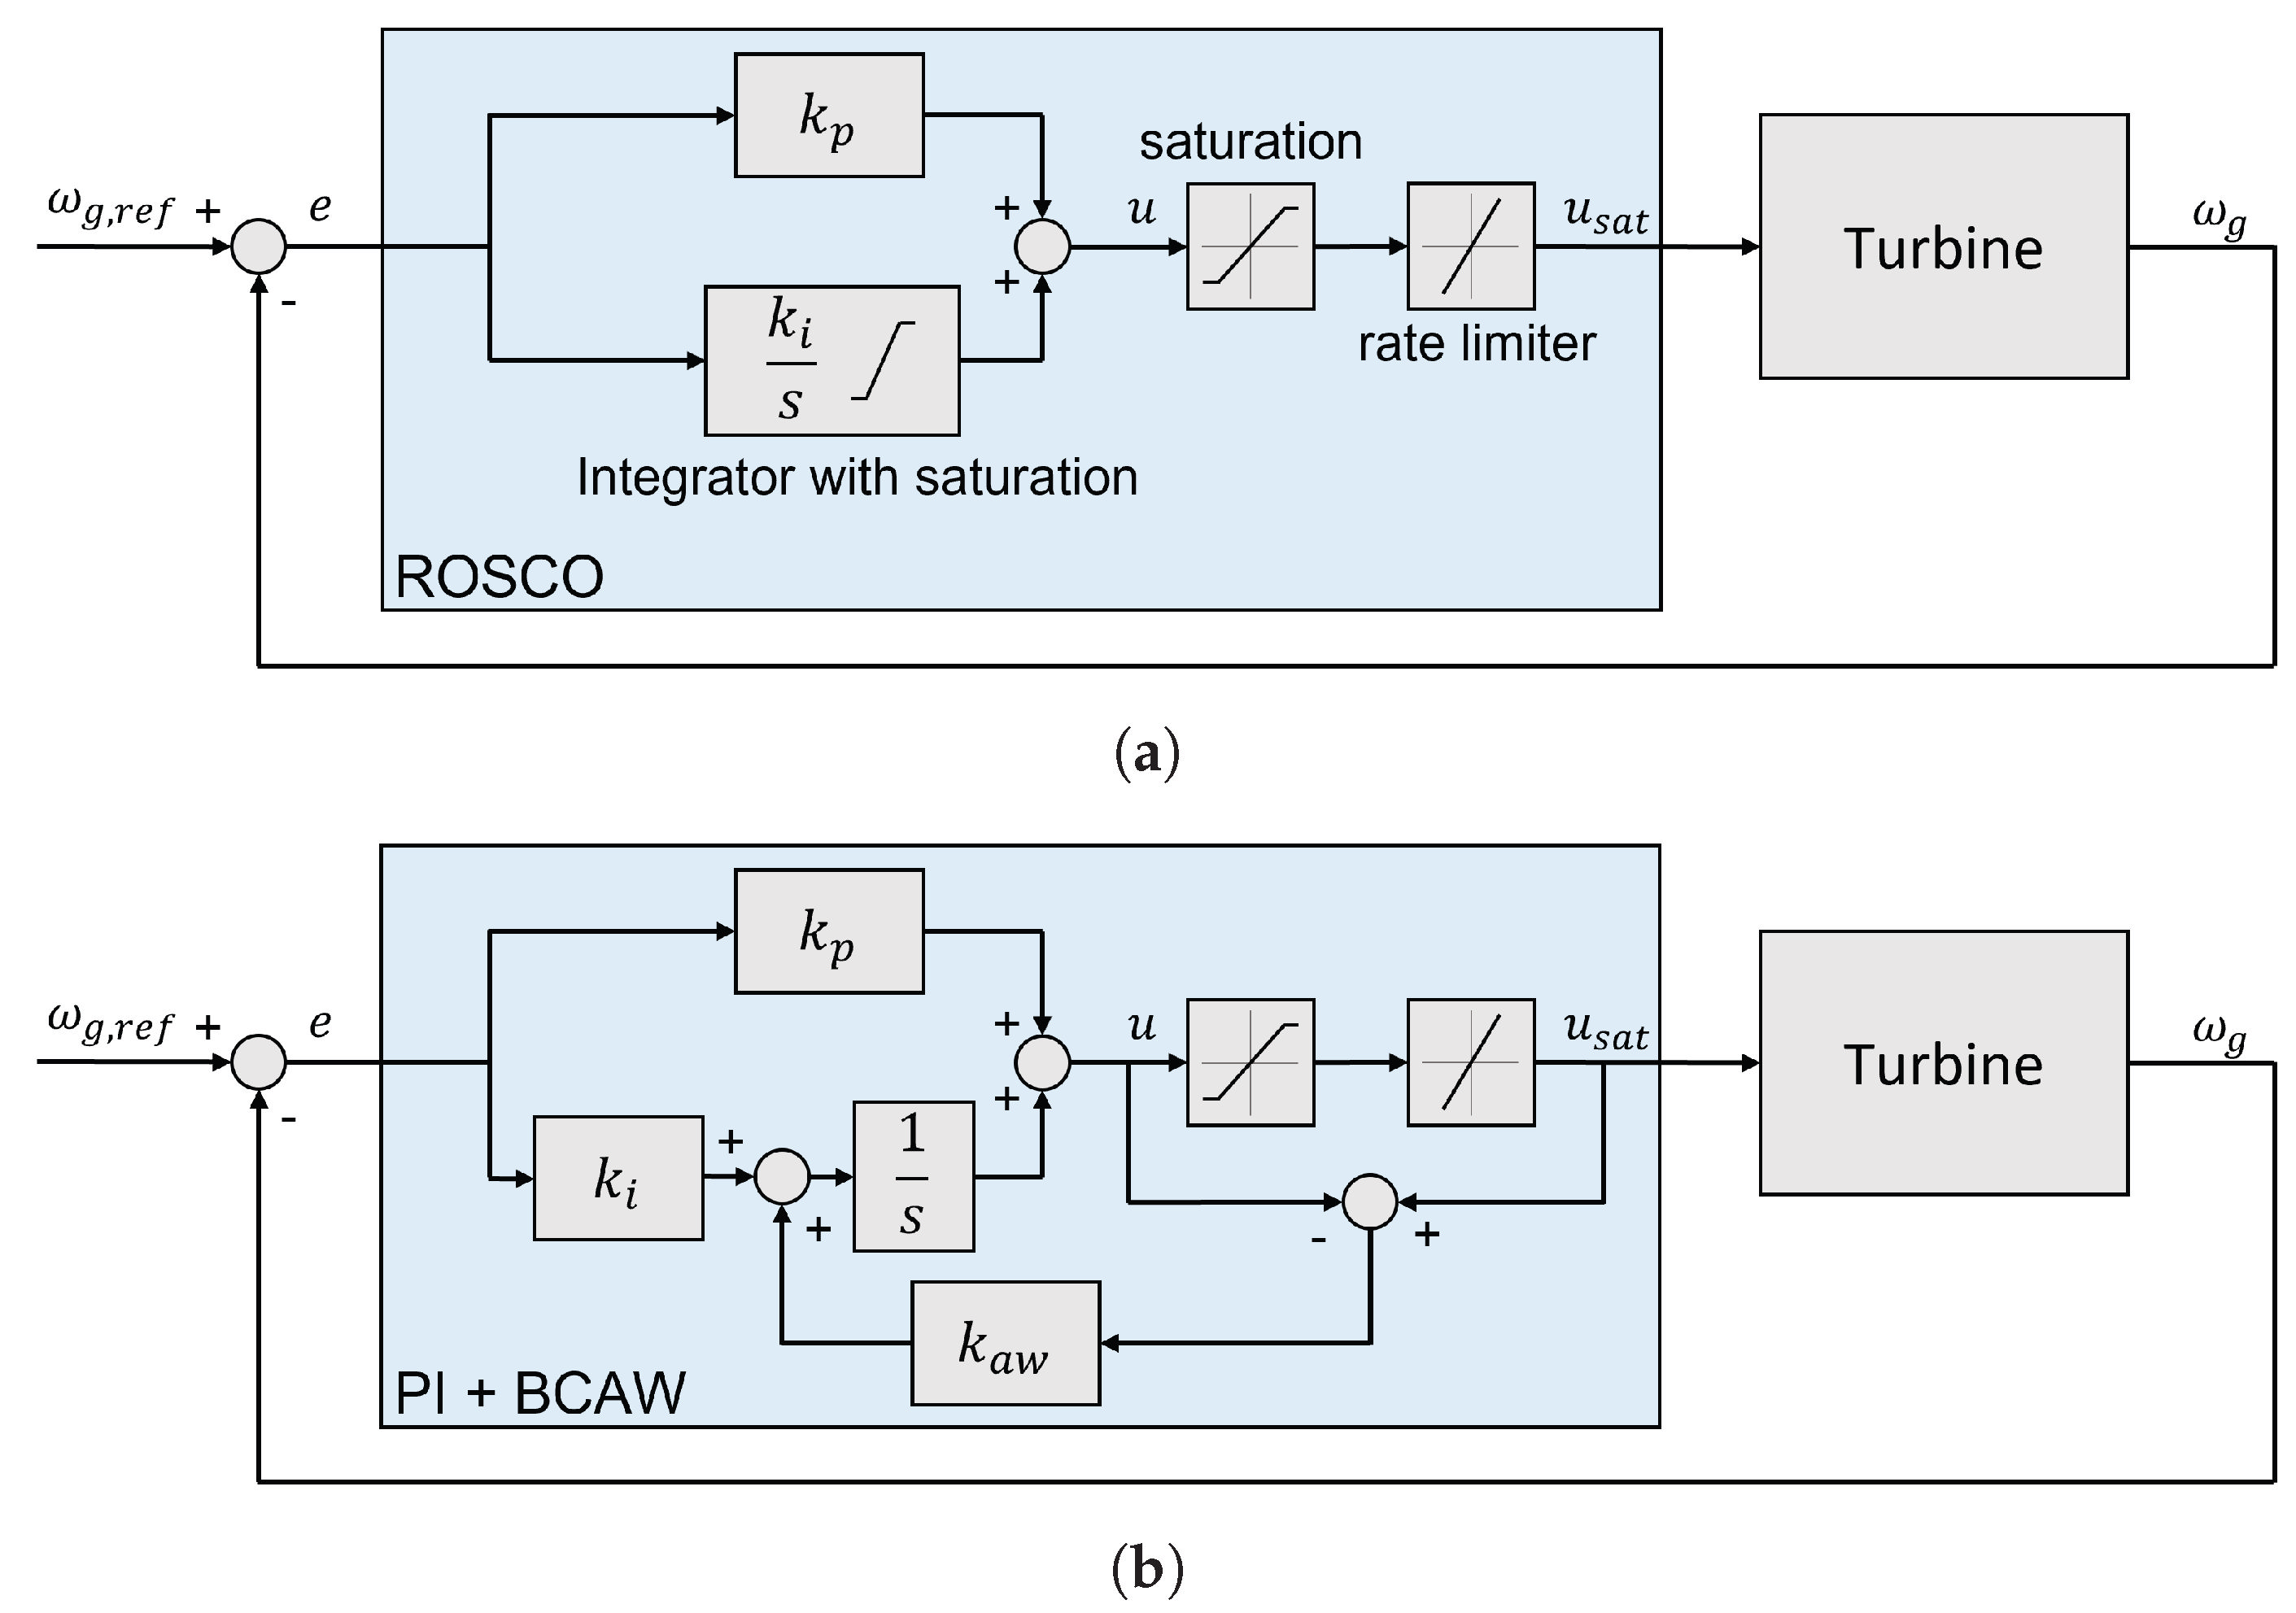
Figure 7a shows the block diagram of the PI controller in ROSCO. The integrator term in ROSCO has built-in saturation to limit its output, but due to the presence of the proportional term, the actuator command can still exceed the actuator limits which causes the system to become open-loop. A better approach to this problem is to remove the integral saturation and implement an anti-windup scheme in the entire PI loop.
To prevent actuator saturation and improve transients, Back-Calculation Anti-Windup (BCAW) is added to the ROSCO PI controllers. With the BCAW, when the output saturates, the input to the integrator is recalculated such that the actuator commands remains close to the saturation limit. The error signal between the output of the controller (u) and the actuator output ( u sat ) is fed to the input of the integrator through gain k a w . It is an extra dynamic feedback path with a tracking time constant T t such that k a w = 1 T t . The time constant determines how fast the integrator is reset. This error signal remains zero when actuator is not saturated. When the actuator saturates, the anti-windup feedback loop drives the integrator input such that the actuator command tracks the actuator saturation limit and thus, integrator windup is prevented.
Figure 7b shows the block diagram of the PI controller with BCAW. This configuration is implemented in both pitch and torque PI controllers. The tracking time constant is chosen to be equal to the integral time constant T i of each controller, which follows the rule of thumb suggested by [27].
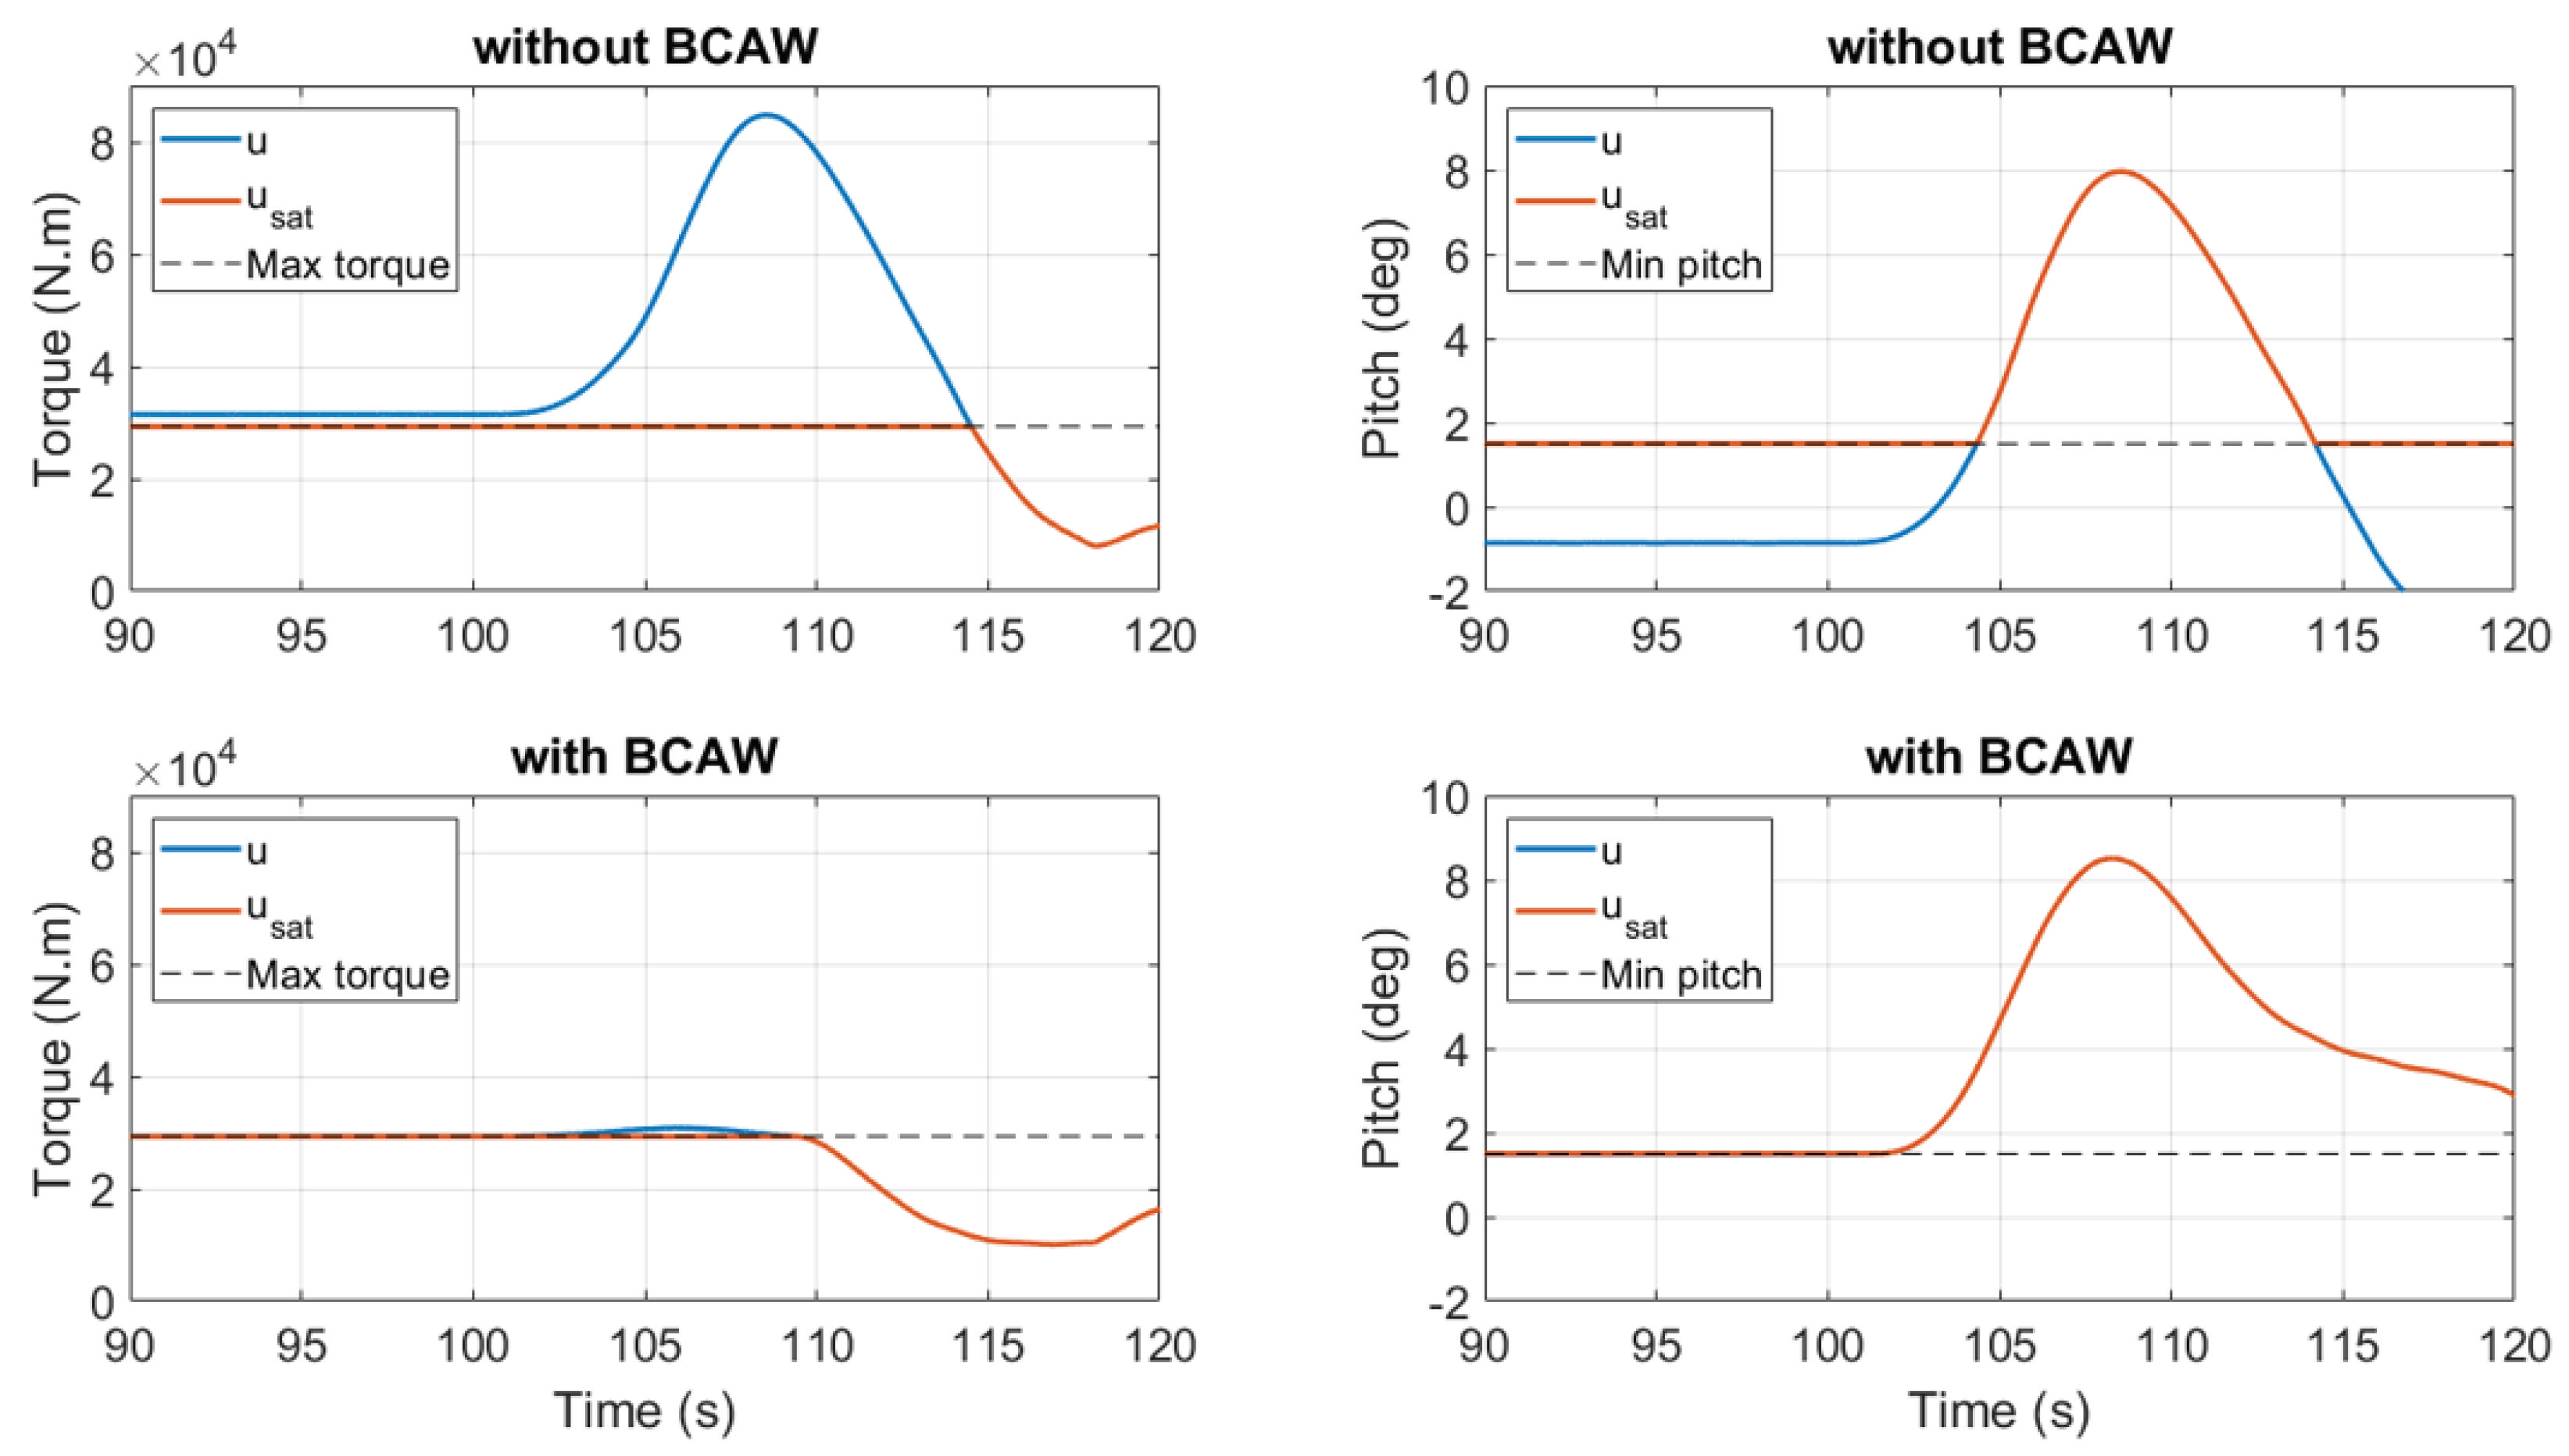
Undesired transitions such as the slow response of pitch controller are observed during the gust event with ROSCO (without BCAW). The controller outputs are compared here to show the differences between two configurations. Figure 8 shows the controller outputs and saturated commands under the ECD wind described in Section 3.1.1. Two upper plots show the dynamics of ROSCO torque and pitch controllers, lower plots are with the proposed BCAW configuration. The saturation limits of the torque and pitch are plotted with black dashed lines. By comparing the saturated commands u sat of pitch and torque controllers, we can see the controllers without BCAW stay at the limit for an additional 2 to 5 s as compared to controllers with BCAW. Under gust wind, a small delay could lead to huge difference in load and turbine performance. Furthermore, the improvement in turbine performance is also observed with BCAW under normal turbulence wind, as will be shown in Section 5.2.

4.2. Optimal Threshold Selection

The switching logic in the GAC is based on predefined load thresholds ( T lower , T upper 
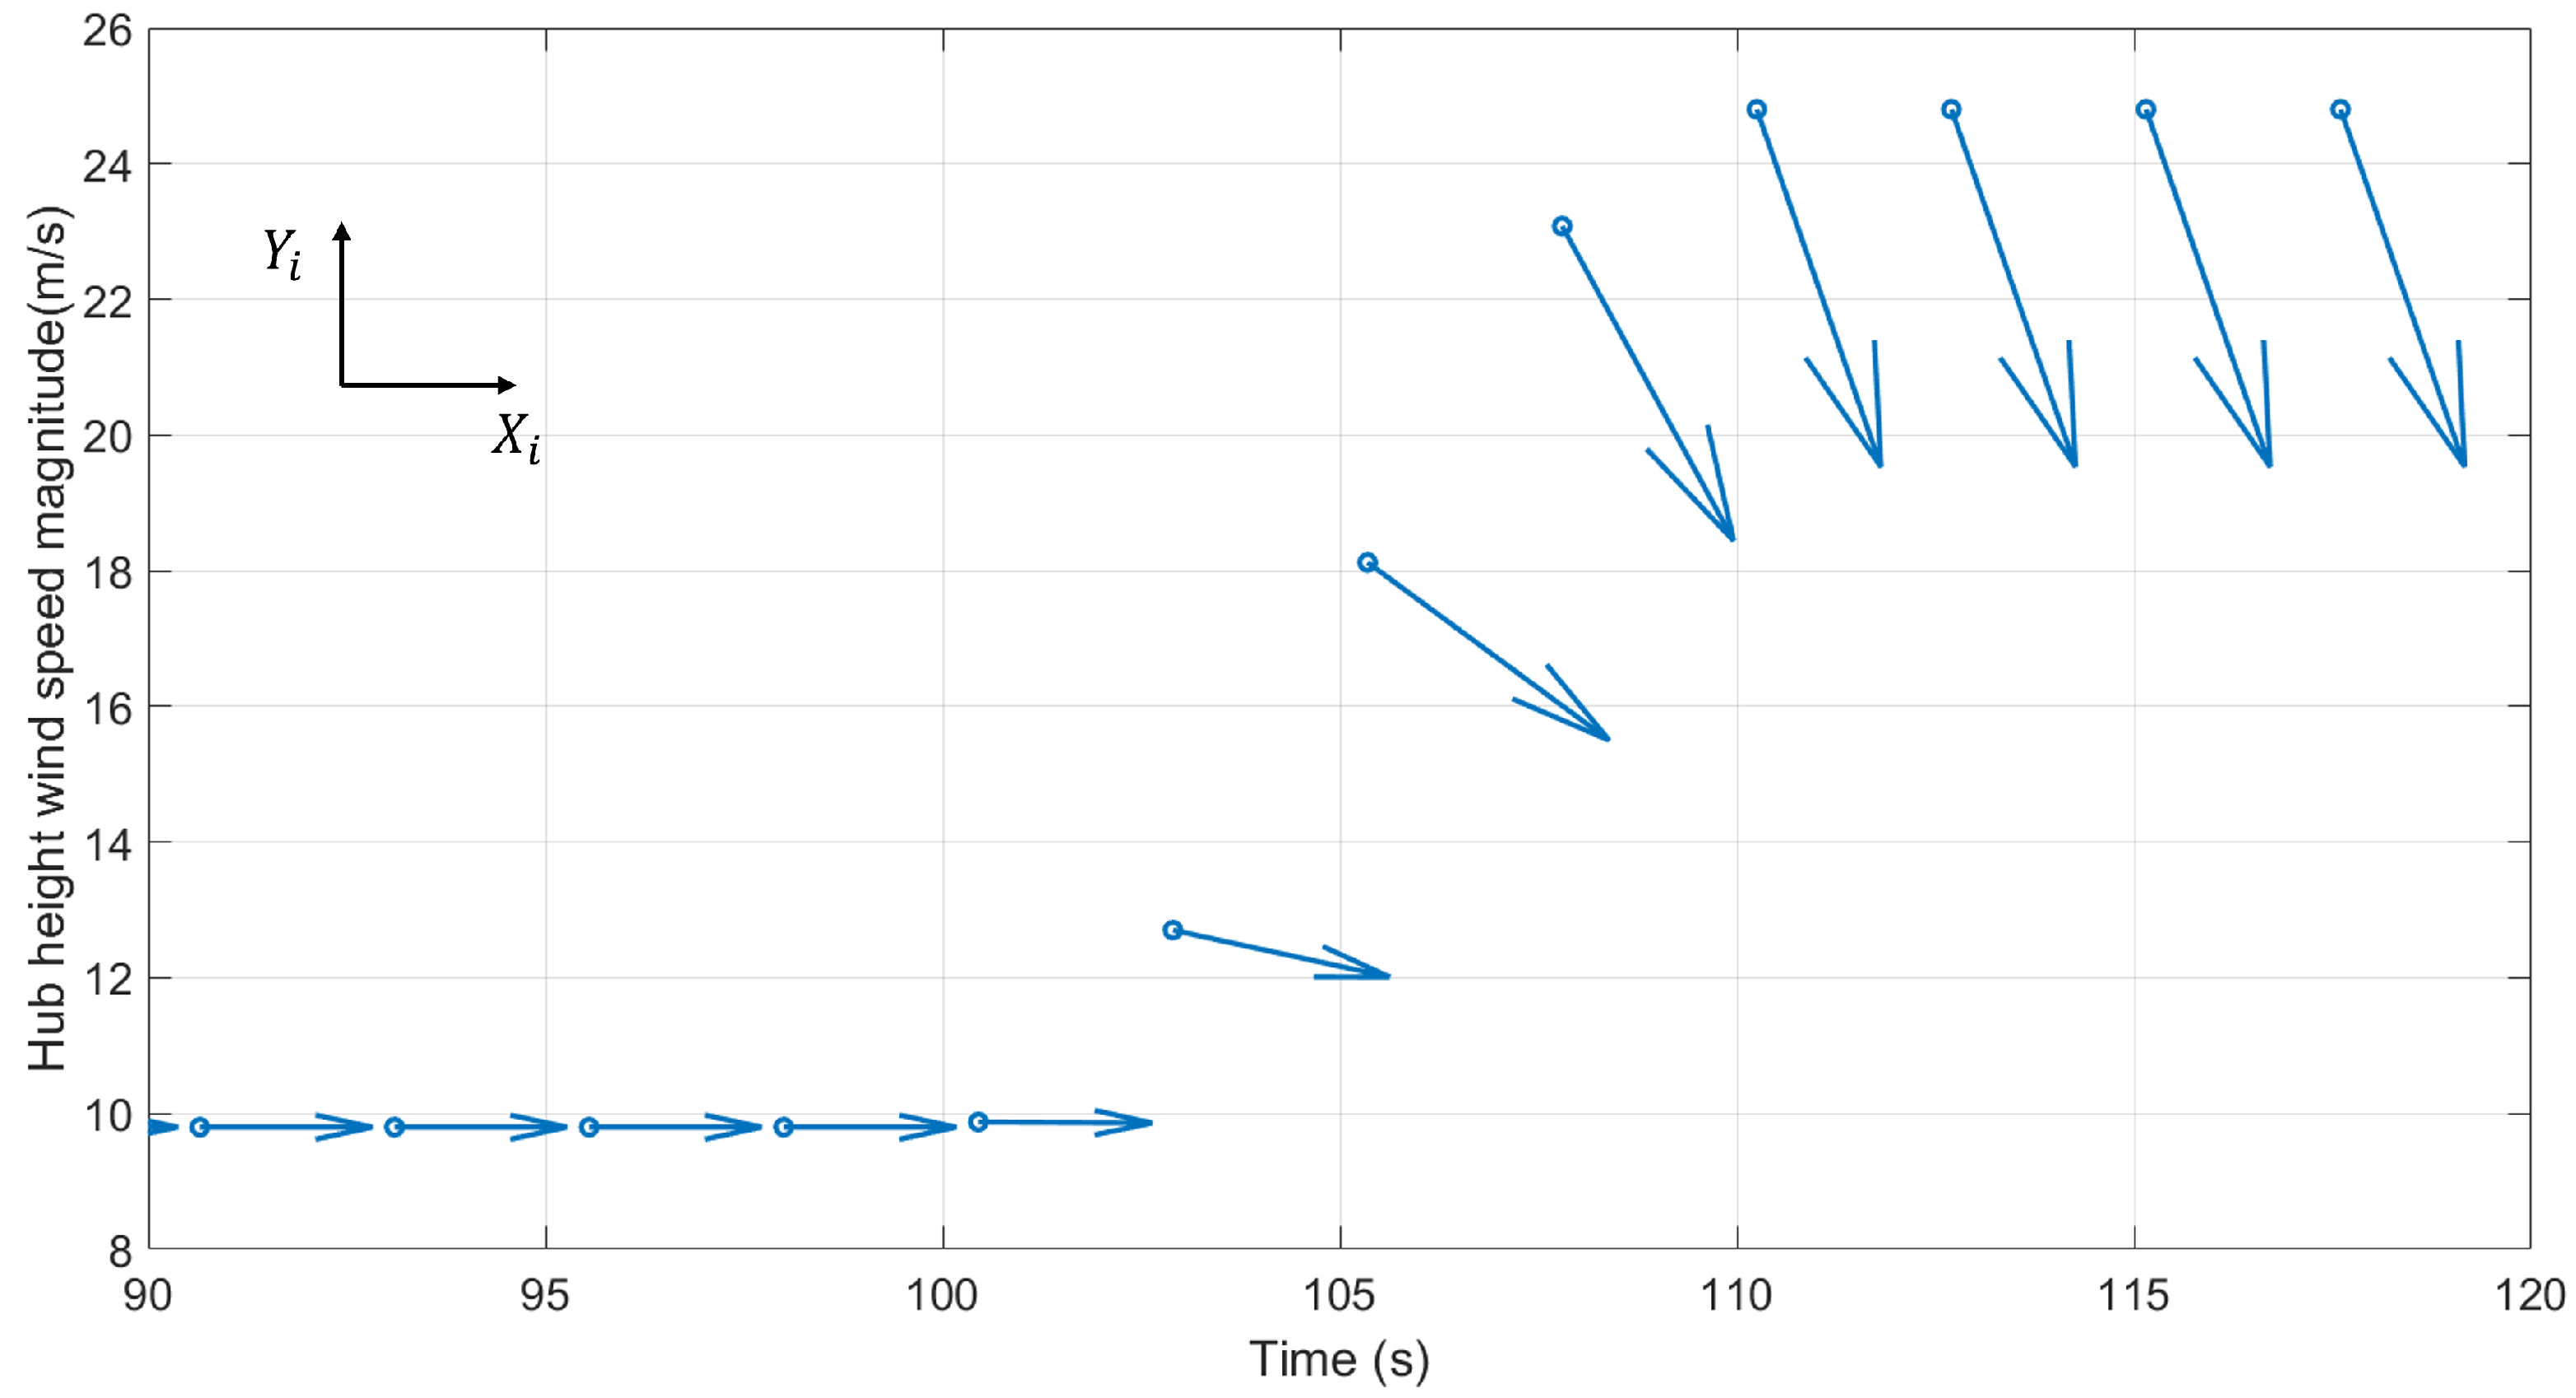
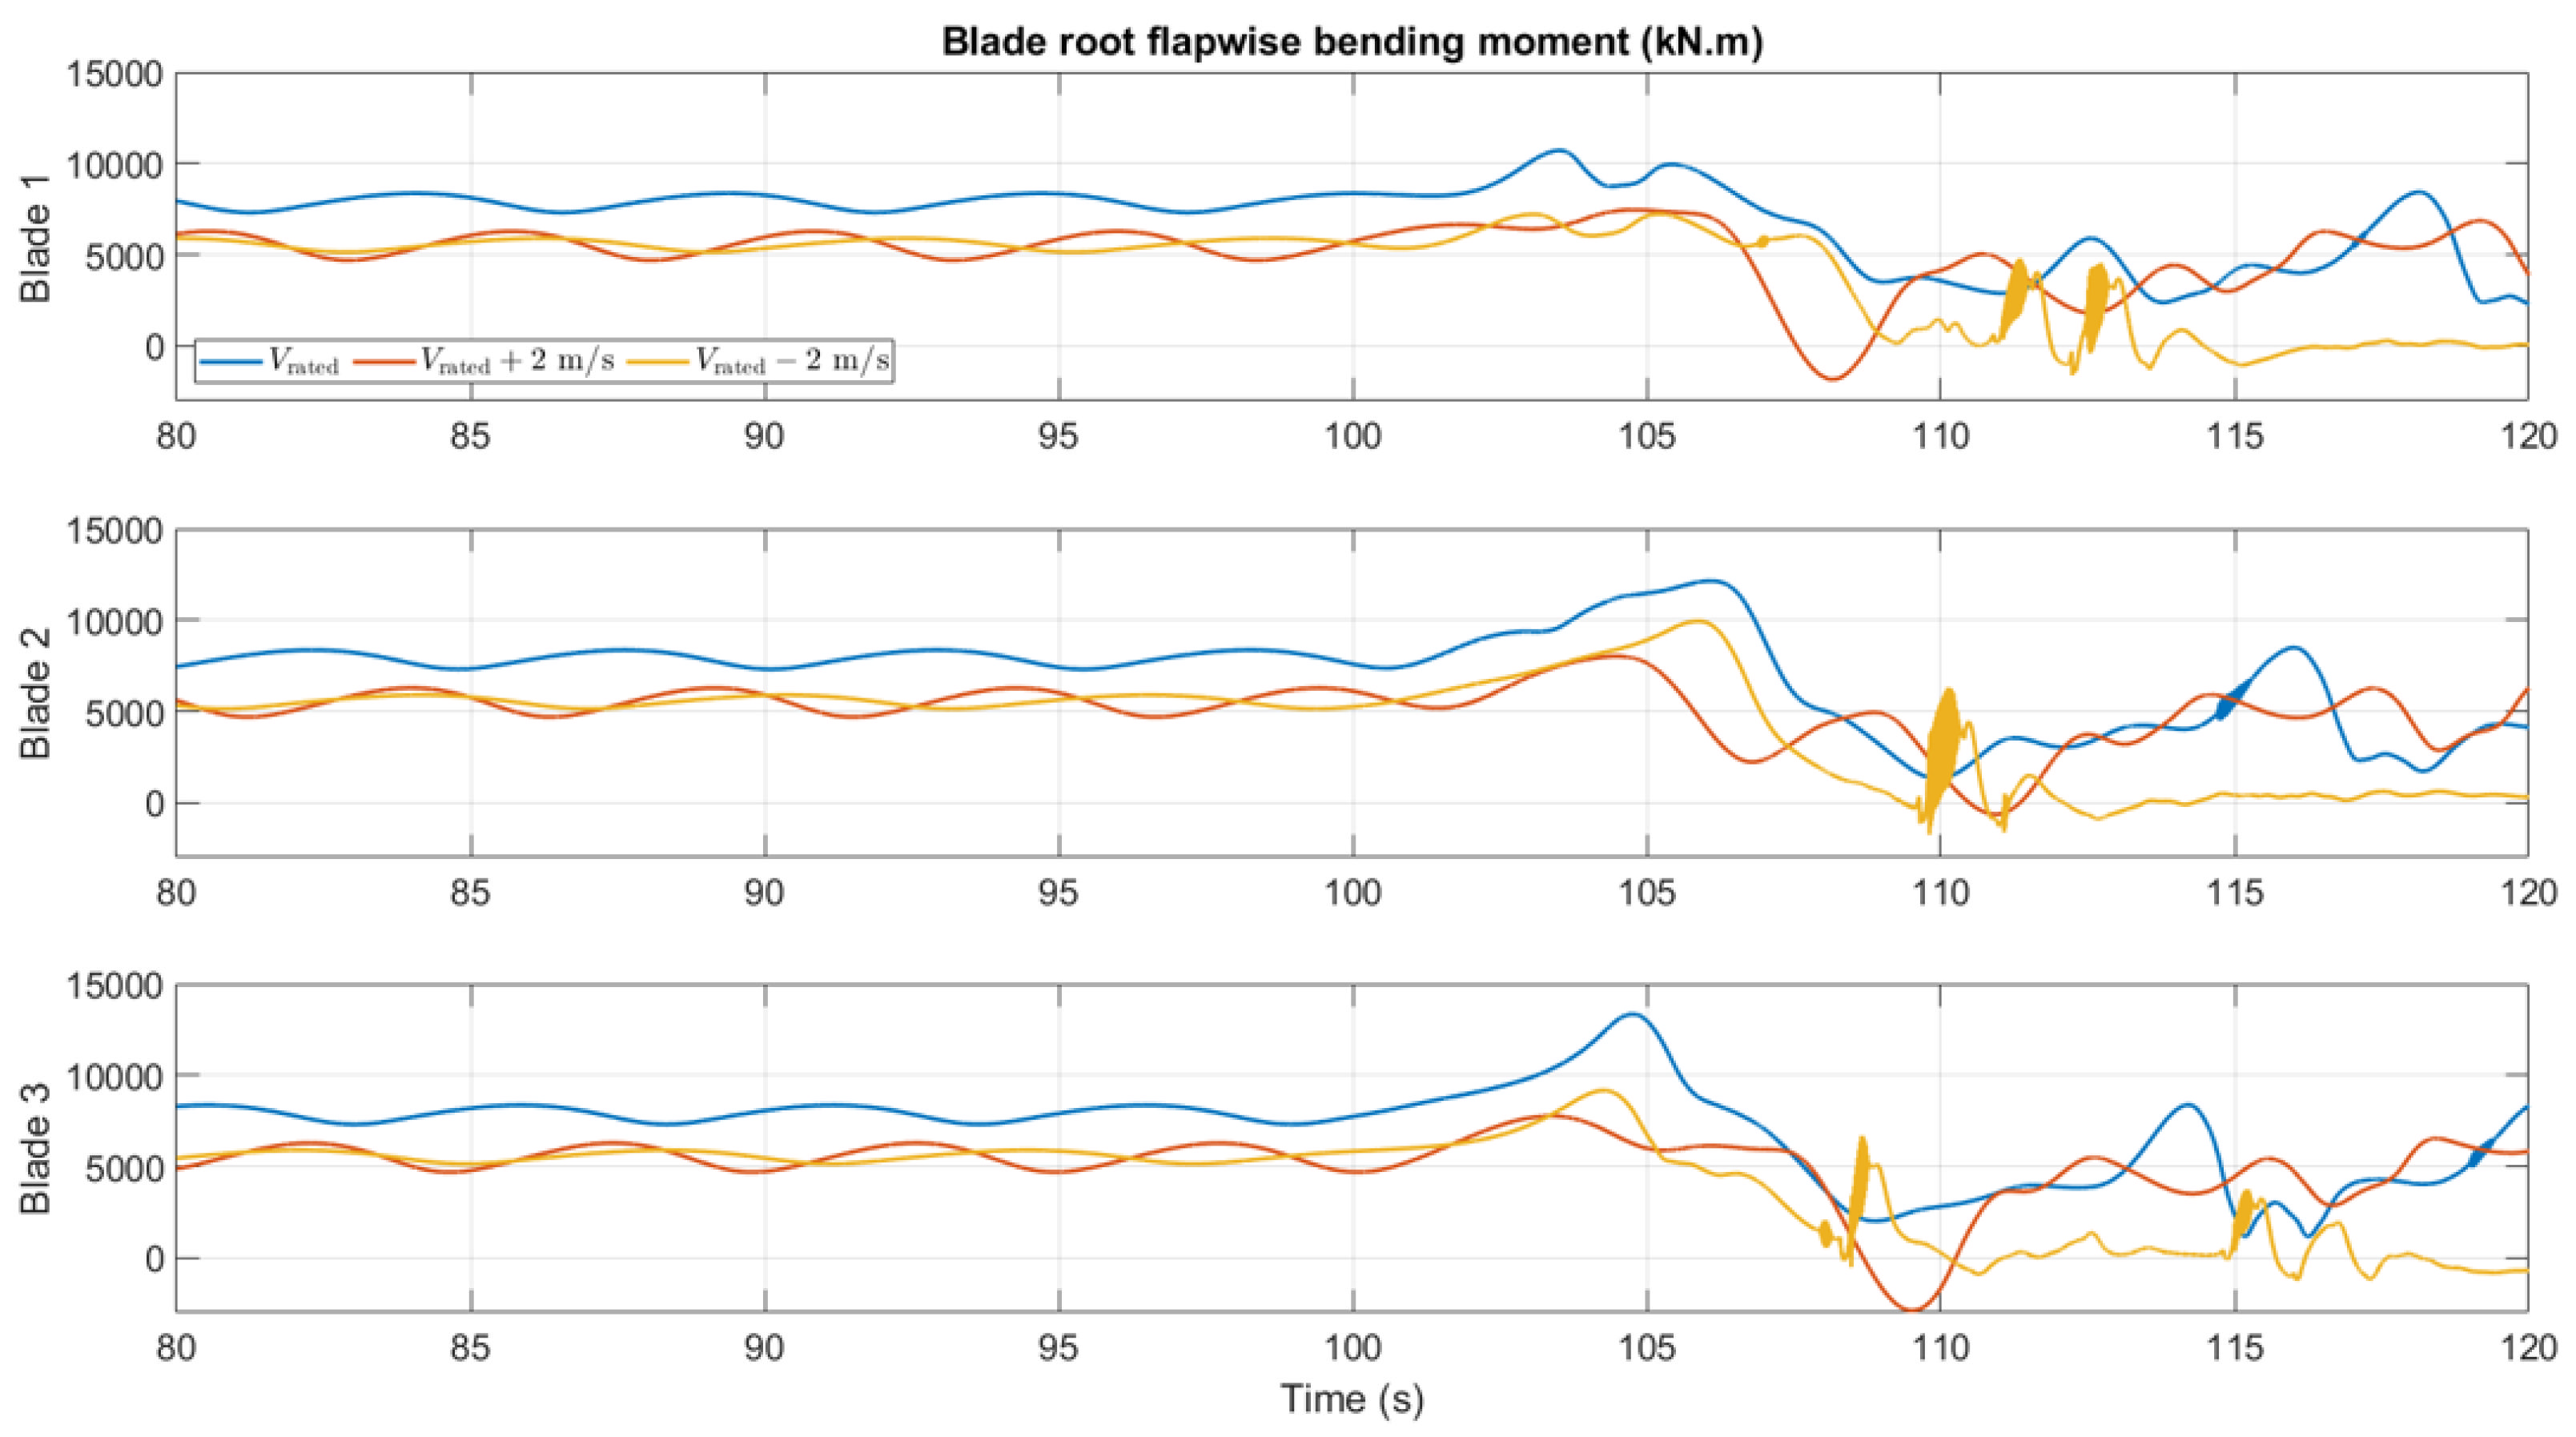
) on the blade root flapwise bending moments. Since the threshold and hysteresis determine when the GAC is turned on and off, they impact the loads and turbine performance. In our experience, the mean of the bending moments grows as the wind speed increases in below-rated conditions and reaches the peak level at rated wind speed. It then decays due to the change of aerodynamic properties (change in blade pitch). Figure 5 shows the bending moment profile under ECD at three different hub height wind speeds ( V rated a n d V rated ± 2 m / s ). Before the gust (before time t = 100 s), the bending moments under rated wind speed are at the highest level. The bending moments for the remaining wind speeds have comparable mean values, and both are smaller than the case with rated wind speed. After the gust impinges on the rotor (after time t = 100 s), the peak loads from highest to the lowest are in the sequence of V rated > V rated 2 m / s > V rated + 2 m / s . Therefore, the threshold and hysteresis for one wind speed may not be appropriate for the other wind speeds.
In this section, we propose a method for the optimal thresholds selection based on the metrics defined in Section 3.2. The highest transient load during the gust shows up at the rated wind speed as shown in Figure 5. Thus, the case with V hub = V rated is used for optimal threshold selection. Figure 5 also shows the range of the bending moments variation during the ECD, based on which the threshold range can be selected.
To find the optimal thresholds, a group of contours are plotted for all the metrics under different load thresholds ( T lower , T upper ). Then, an overall performance map with all the metrics taken into account is generated using a normalized weighted sum based on the metrics interest. The optimal point/region is used as a reference to select the optimal load thresholds. It should be noted that the lower bound ( T lower ) needs to be higher than the mean bending moment before the gust impinges on the rotor to avoid affecting the normal turbine operation, while the upper bound ( T upper ) needs to be smaller than the peak value to activate the GAC and reduce the peak loads. In these simulations, the SLC is turned on, the BCAW is added to the ROSCO, and the GAC is activated based on the corresponding thresholds.
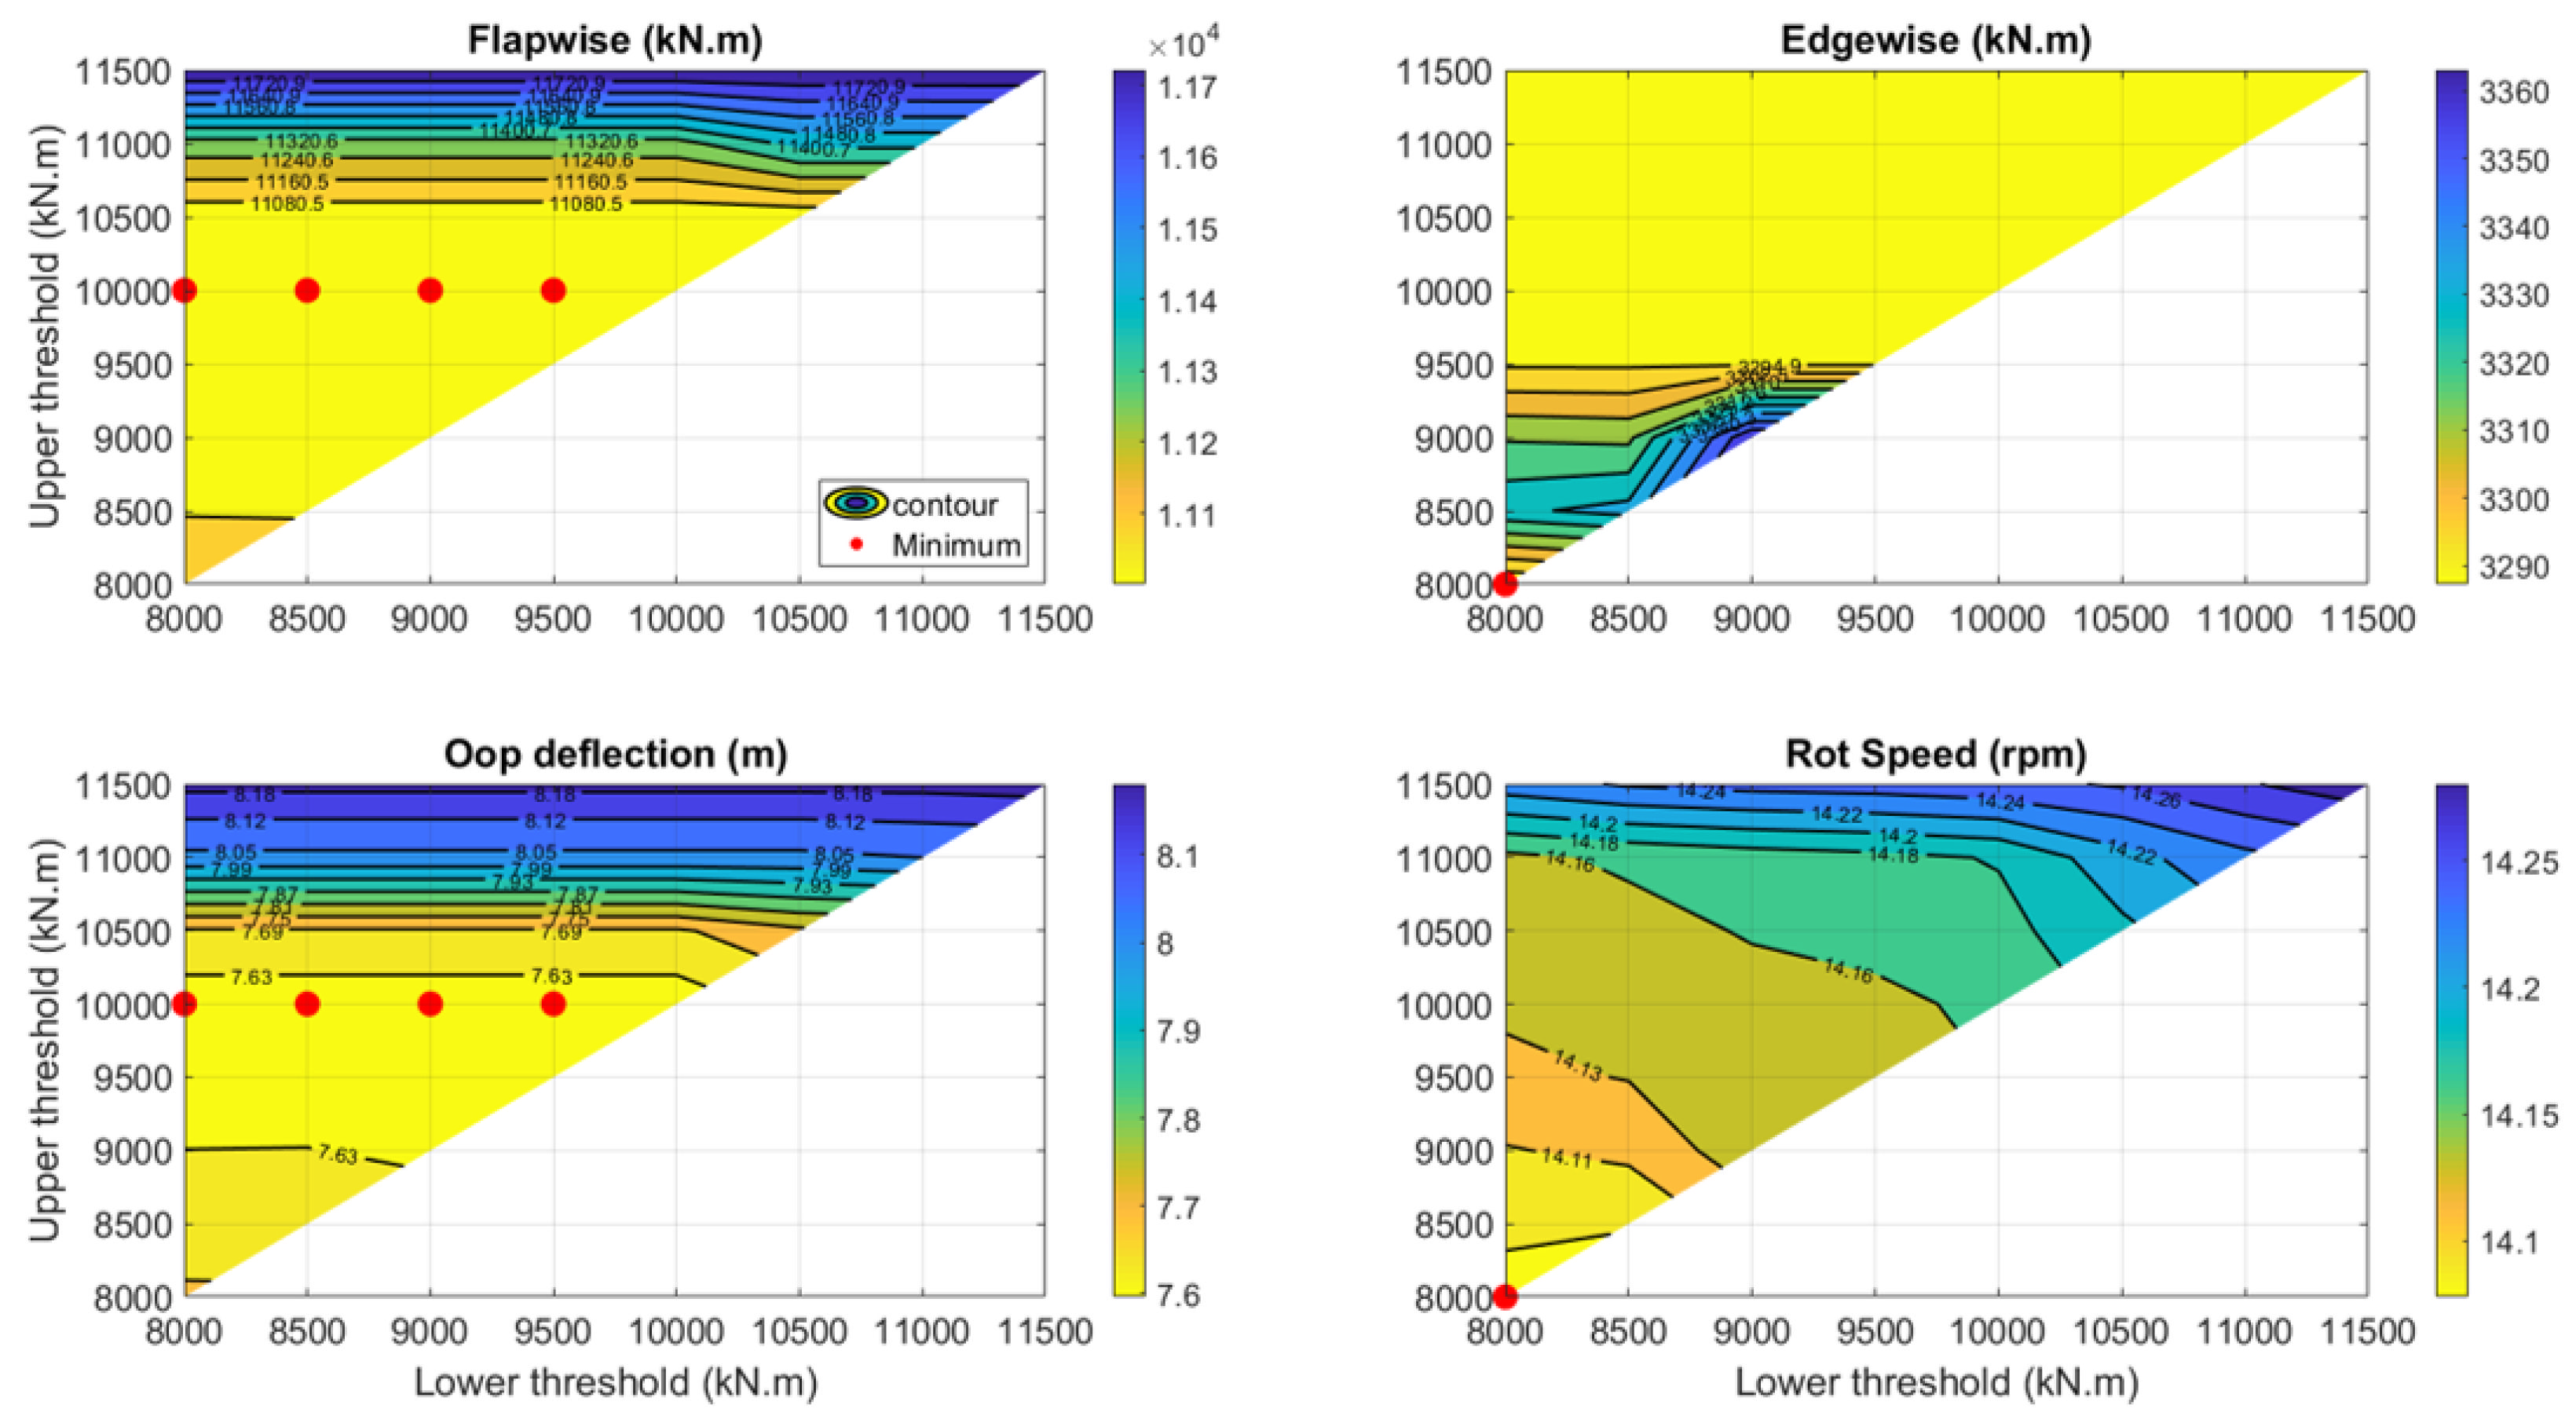
Figure 9 shows the contour plots for the primary evaluation criteria. Each contour plot shows the changes in the maximum transient value with respect to the thresholds. The maximum transient value is found within the 20 s window after the gust impinges on the rotor (100 to 120 s). The colorbars are shown to the right of the contour plots. Lighter color in the plot represents a lower peak value, which is favorable. The regions in yellow contain the best thresholds. The minimum peak values are marked with red dots for all the contour plots. Since the thresholds have to satisfy T upper T lower , the contour map is in a triangle shape. With all the above considered, the thresholds for this case are from 8000 kN·m to 11,500 kN·m with increment of 500 kN·m. A total of 36 simulations are conducted to generate the contour maps.
The contour lines are mostly flat for the blade root bending moments and out-of-plane blade tip deflections. Therefore, we can either choose large hysteresis to avoid turning the controller on and off frequently, which is also beneficial with a noisy measurement, or to reduce the actuator-on time with smaller hysteresis.
From Figure 9, we note that the contour plots of the blade root flapwise bending moments and out-of-plane deflections have the optimal region located in the middle region of the plots. This implies neither turning on the GAC too early nor too late is effective. For the edgewise bending moments, the minimum point is located at (8000 kN·m, 8000 kN·m). However, there is another optimal (yellow) region in the upper region of the plot. The minimum overspeed is at the (8000 kN·m, 8000 kN·m) point in the rotor speed contour plot. This is expected since the GAC can reduce the collective lift forces. The earlier we activate the GAC, the lower the overspeed can be achieved. The blade root edgewise bending moments and the rotor speed have less than 2% changes as compared to their minimum values. Thus, these two metrics are not significantly affected by the GAC.
To find the optimal combination of the upper and lower thresholds for the GAC, we need to take all the primary metrics into account. Normalization is needed since the metrics have different units. The metrics are first normalized with their minimum values on the contour plot. Then the percentage changes are calculated using Equation (5),
y N ( T upper , T lower ) = y ( T upper , T lower ) y min y min × 100
where y ( T upper , T lower ) are the peak values for metric y with the thresholds ( T upper , T lower ) , y min is the minimum value over all the calculated values, and y N is the %-change value.
To combine the primary metrics, the weighted sum of the %-change map is calculated using Equation (6),
Y ( T upper , T lower ) = i = 1 n w i × y i , N ( T upper , T lower )
where n is the number of metrics, y i , N ( T upper , T lower ) is the i th %-change from Equation (5), w i is the weighting factor associated with metric y i , N , and Y ( T upper , T lower ) is the weighted sum of all the metrics. For this study, the weighting factors are all chosen to be one, thus assigning the same importance to all the primary metrics. However, the factors can vary based on the design requirements and operating constraints.
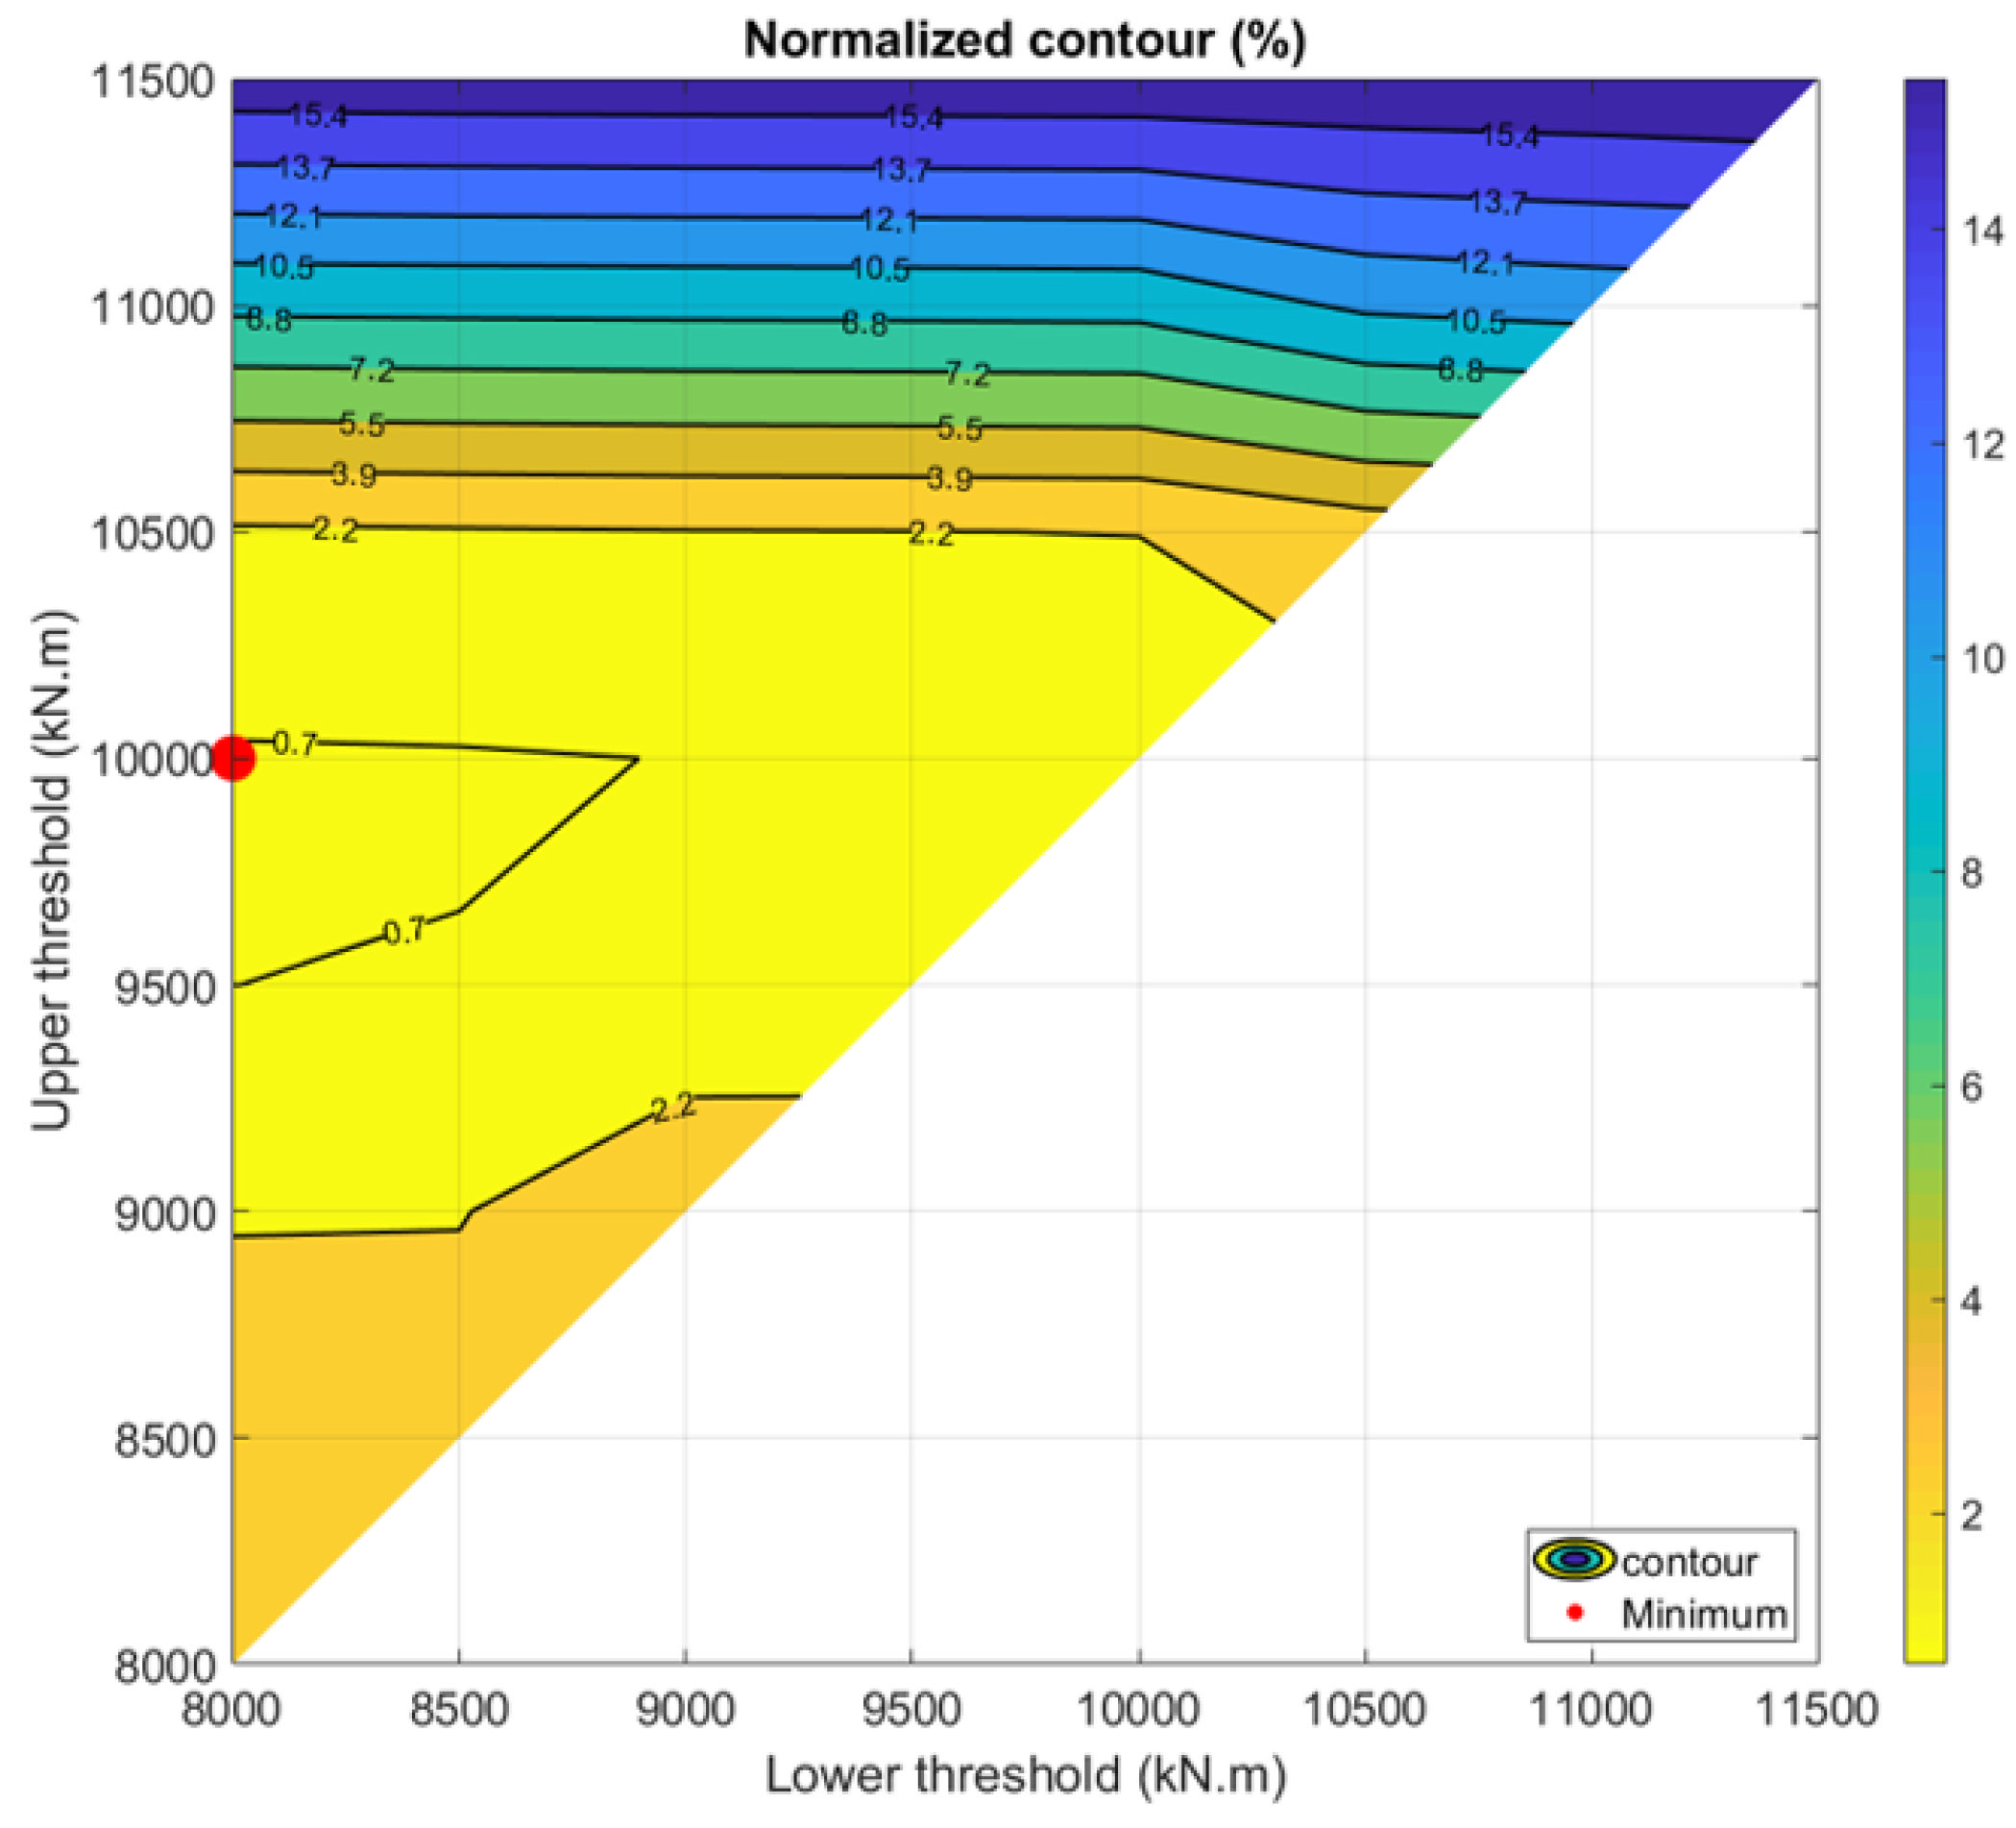
Figure 10 shows the %-change weighted sum contour plot. Theoretically, the optimal combination of the upper and lower thresholds would correspond to a point whose value equals zero, which means the combination has the lowest peak value on all the metrics. However, since the minimum points in each metric are attained with different thresholds, the minimum value under the current settings is 0.59 % , which is shown with a red dot.
There are three points located in the optimal region (within the contour line of 0.7 % ) with little difference. For noisy measurements, large hysteresis is favorable. It can prevent turning the GAC on and off frequently, which can be considered an extra disturbance to the system. Thus, the optimal thresholds combination which minimizes overall percentage change metric and maximizes the hysteresis window is selected. The optimal thresholds T upper = 10 , 000 kN · m , T lower = 8000 kN · m are chosen for this study. The numerical values for the parameters of ROSCO, SLC, and GAC controllers are summarized in Table A1, Table A2 and Table A3, respectively, in Appendix A.

5. Results

In this section, simulation results of selected DLC 1.2 and 1.4 cases described in Section 3.1 are presented and analyzed. Performance of the GAC with optimal thresholds is evaluated and the peak values of primary and secondary responses introduced in Table 3 are given. The GAC’s effects on turbine performance are evaluated under normal turbulence wind conditions following DLC 1.2. This is done because the gust events have a very short duration and would not affect the long-term turbine performance. The fatigue loads on blade root and tower base are also calculated under normal turbulence wind conditions in terms of DELs to check if there are any noticeable degradations in the fatigue loads due to deployment of the GAC. Three configurations are analyzed to evaluate the performance of the GAC: (1) ‘SLC Only’ (2) ‘SLC + GAC’ and (3) ‘SLC + GAC + BCAW’ (back-calculation anti-windup added to the ROSCO).

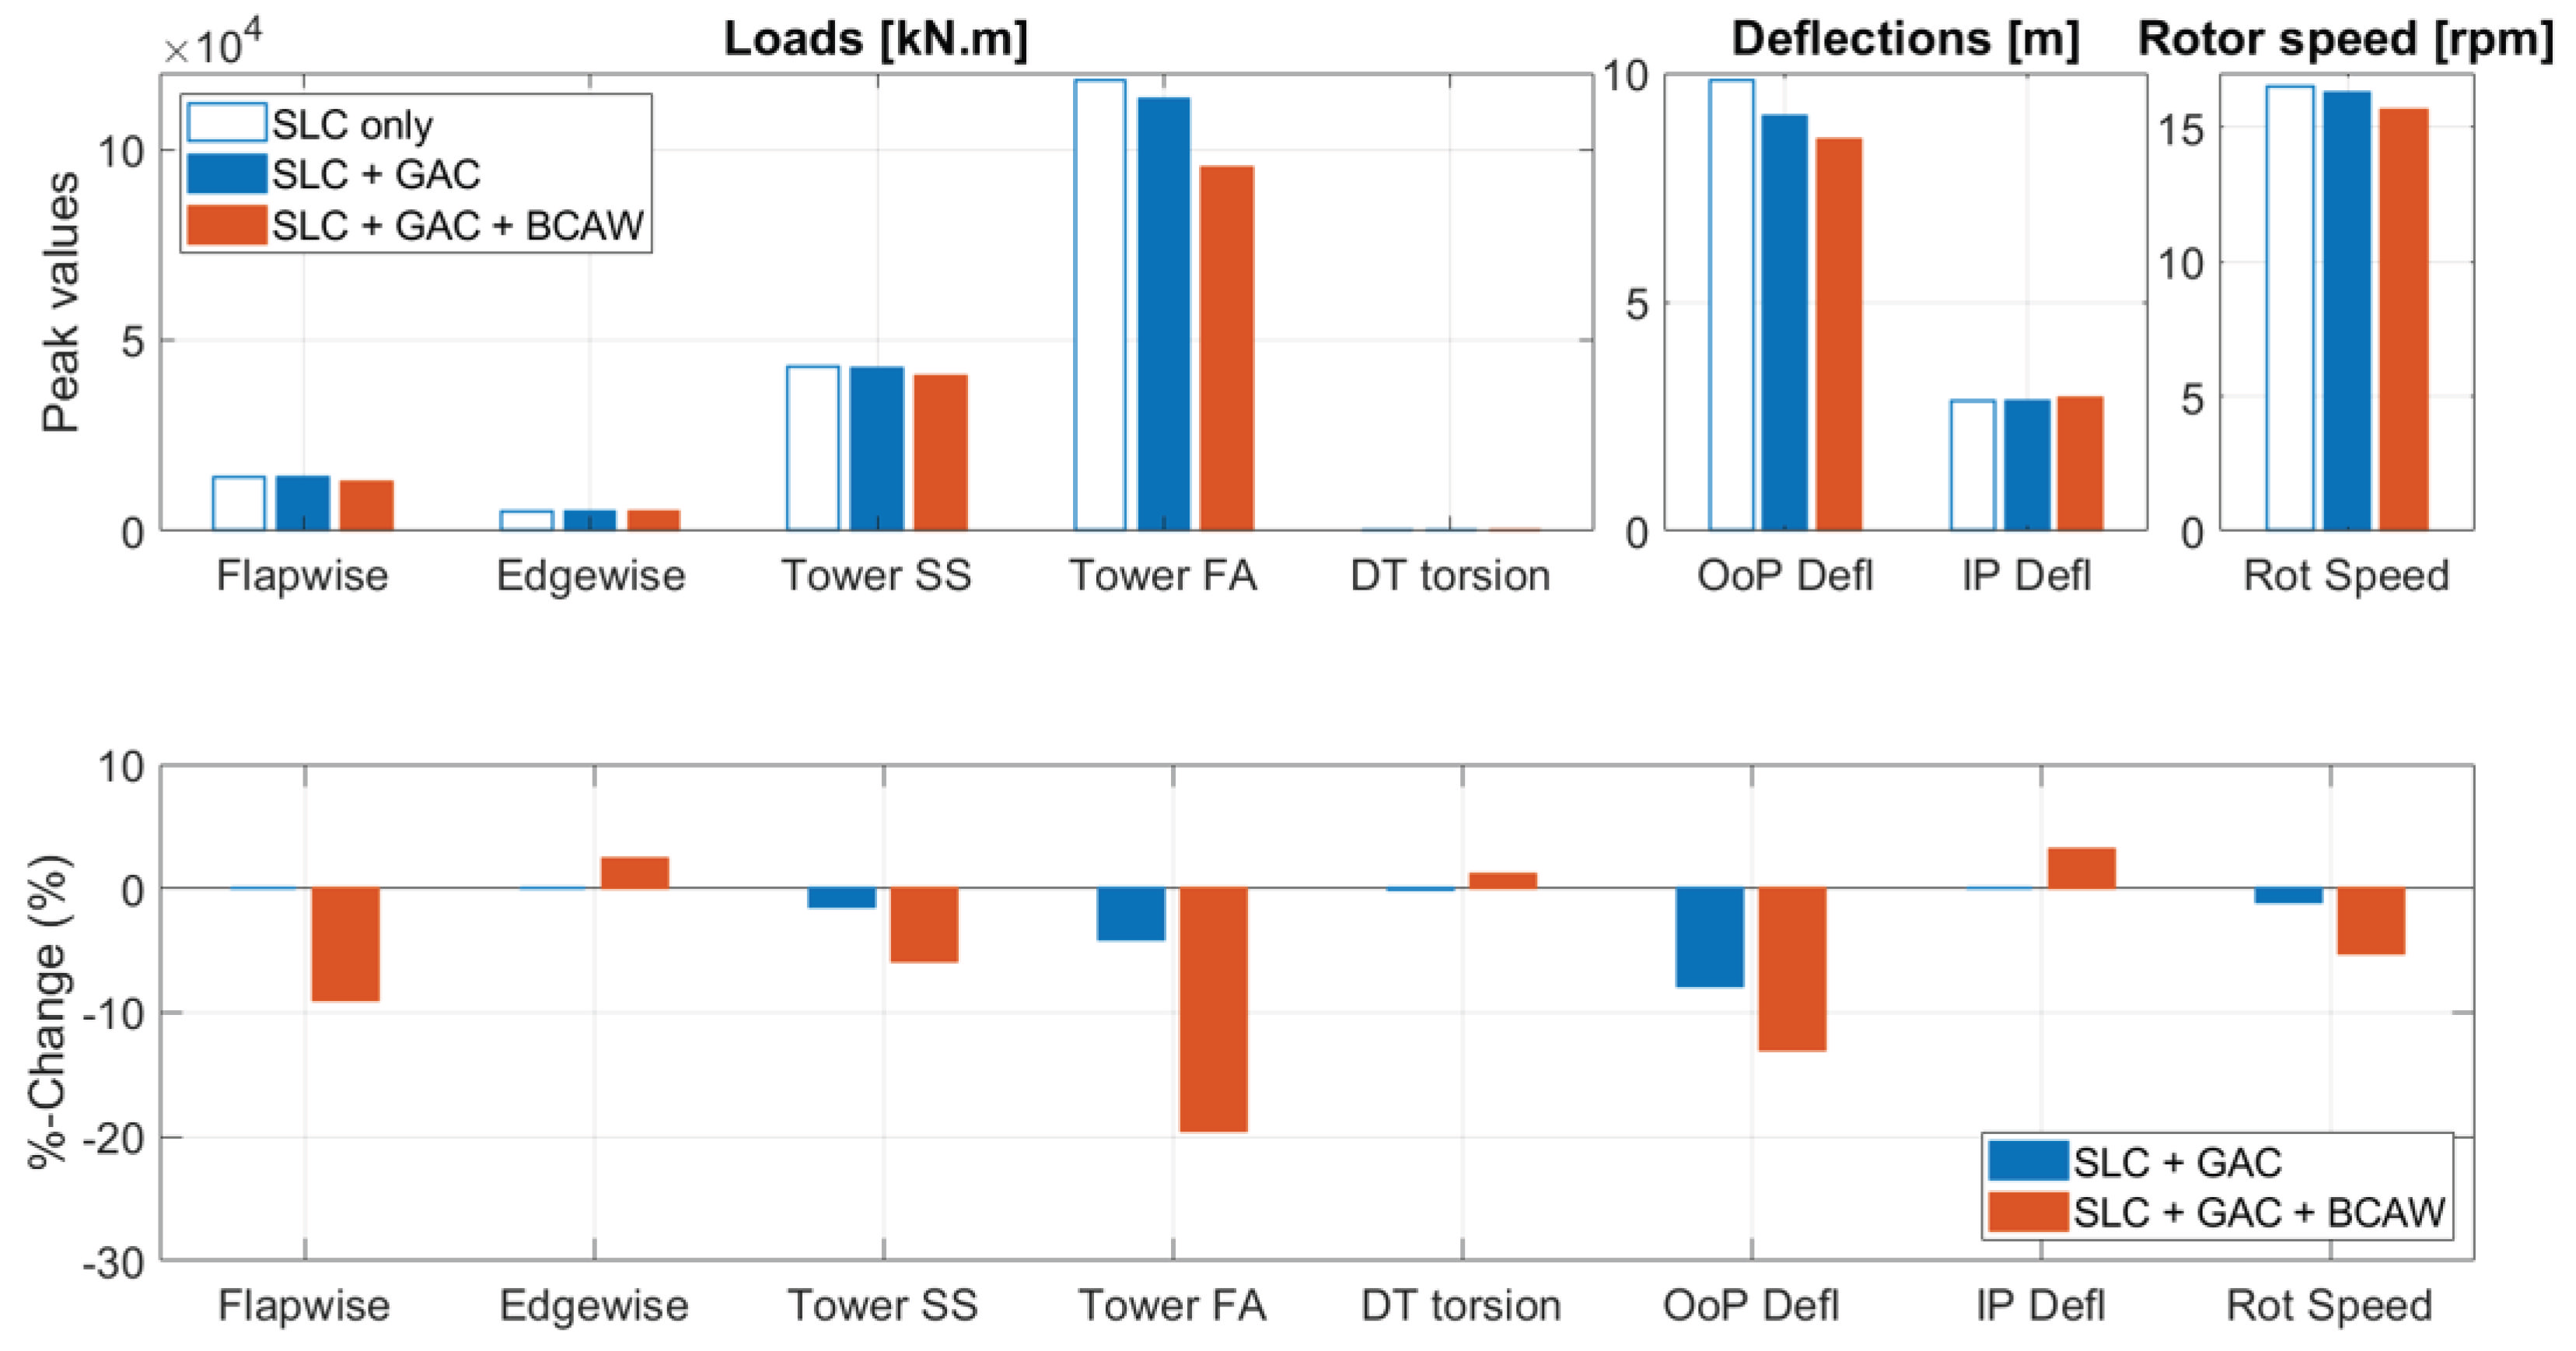
5.1. Primary and Secondary Criteria under Gust Wind

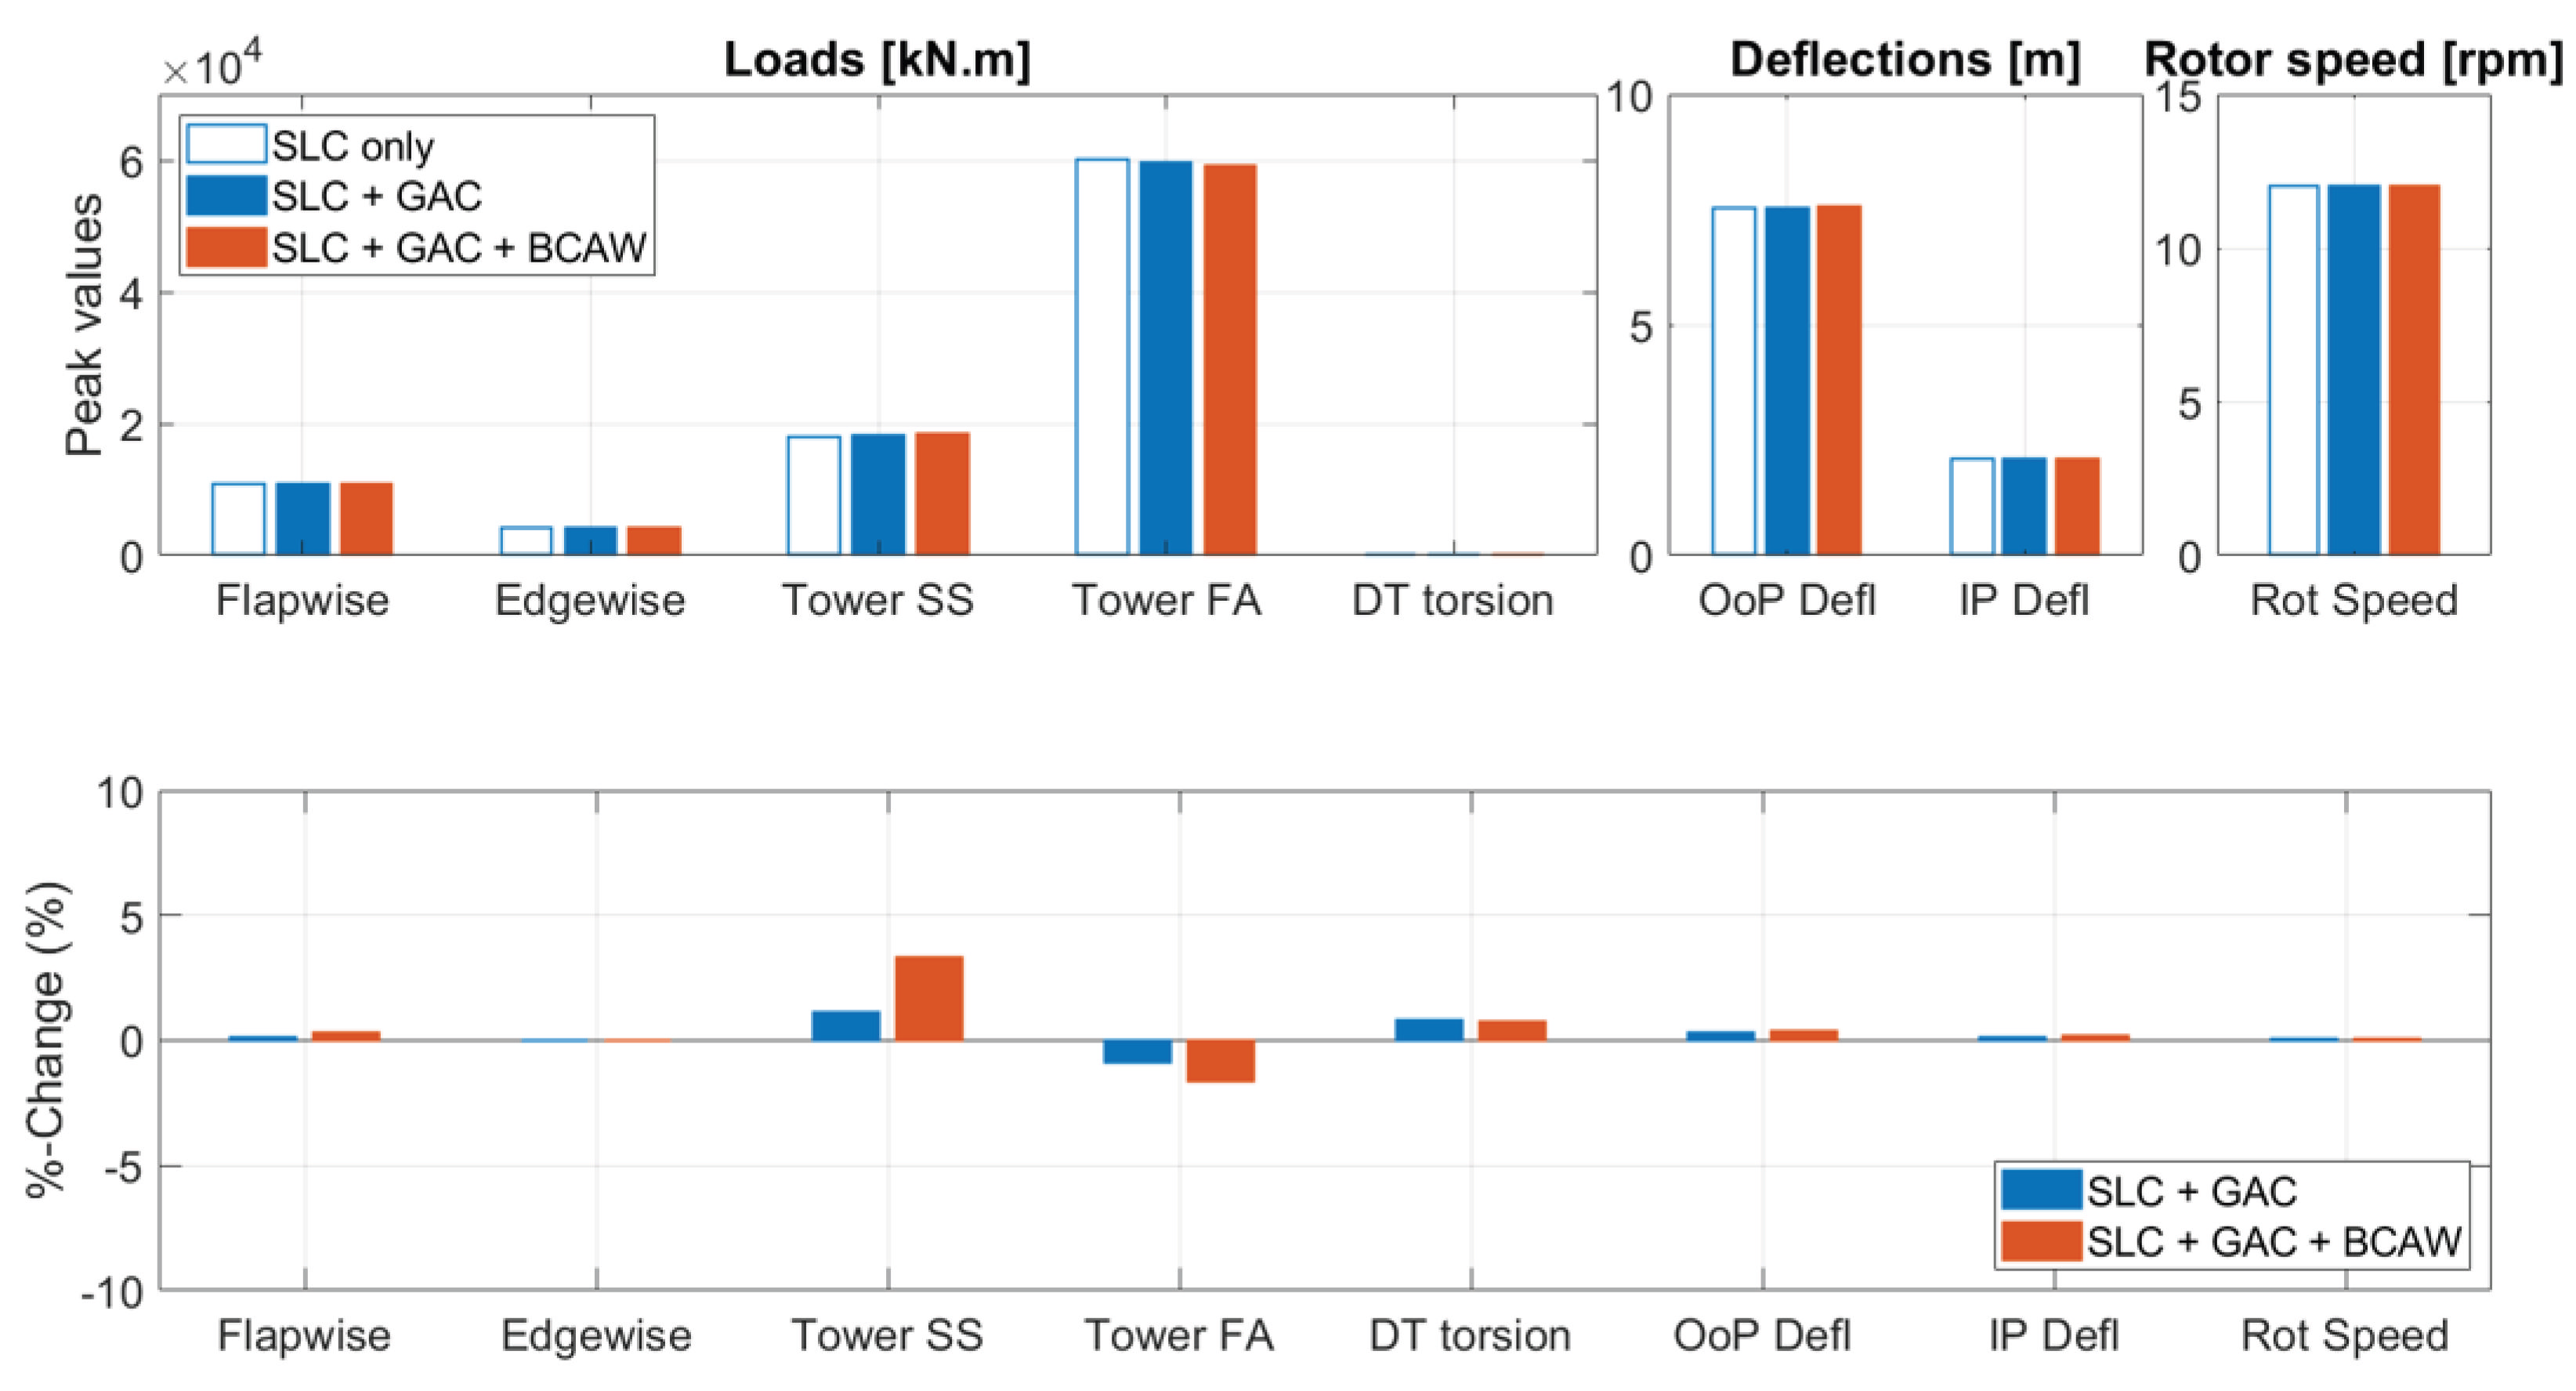
Figure 11 shows the results for all metrics in the evaluation criteria under gust wind. The top plot shows the maximum absolute transient (peak) values. The corresponding percentage changes with respect to ‘SLC only’ case are plotted in the bottom graph.
By comparing the ‘SLC Only’ with the ‘SLC + GAC’, we observe that by adding the GAC, all metrics either reduce or remain at the same level. Specifically, the GAC can reduce the peak bending moments on the blade root and tower base by up to 6%, and can reduce the peak blade tip out-of-plane and in-plane deflections by up to 10%. No significant reductions in drive-train torsional moment, blade root edgewise bending moments and rotor speed are observed.
We also investigate and quantify the improvement in gust alleviation by modifying the baseline turbine controller (ROSCO) to include BCAW. By comparing the ‘SLC + GAC’ with the ‘SLC + GAC + BCAW’, we observe that the BCAW can further reduce the peak value of some metrics without any significant drawbacks. With BCAW, peak values of blade root flapwise bending moments, tower base fore-aft bending moment, and out-of-plane deflections are reduced by 18%, 14% and 23% respectively. All of the metrics, except the blade tip in-plane deflections, show a higher reduction as compared to the ‘SLC + GAC’.

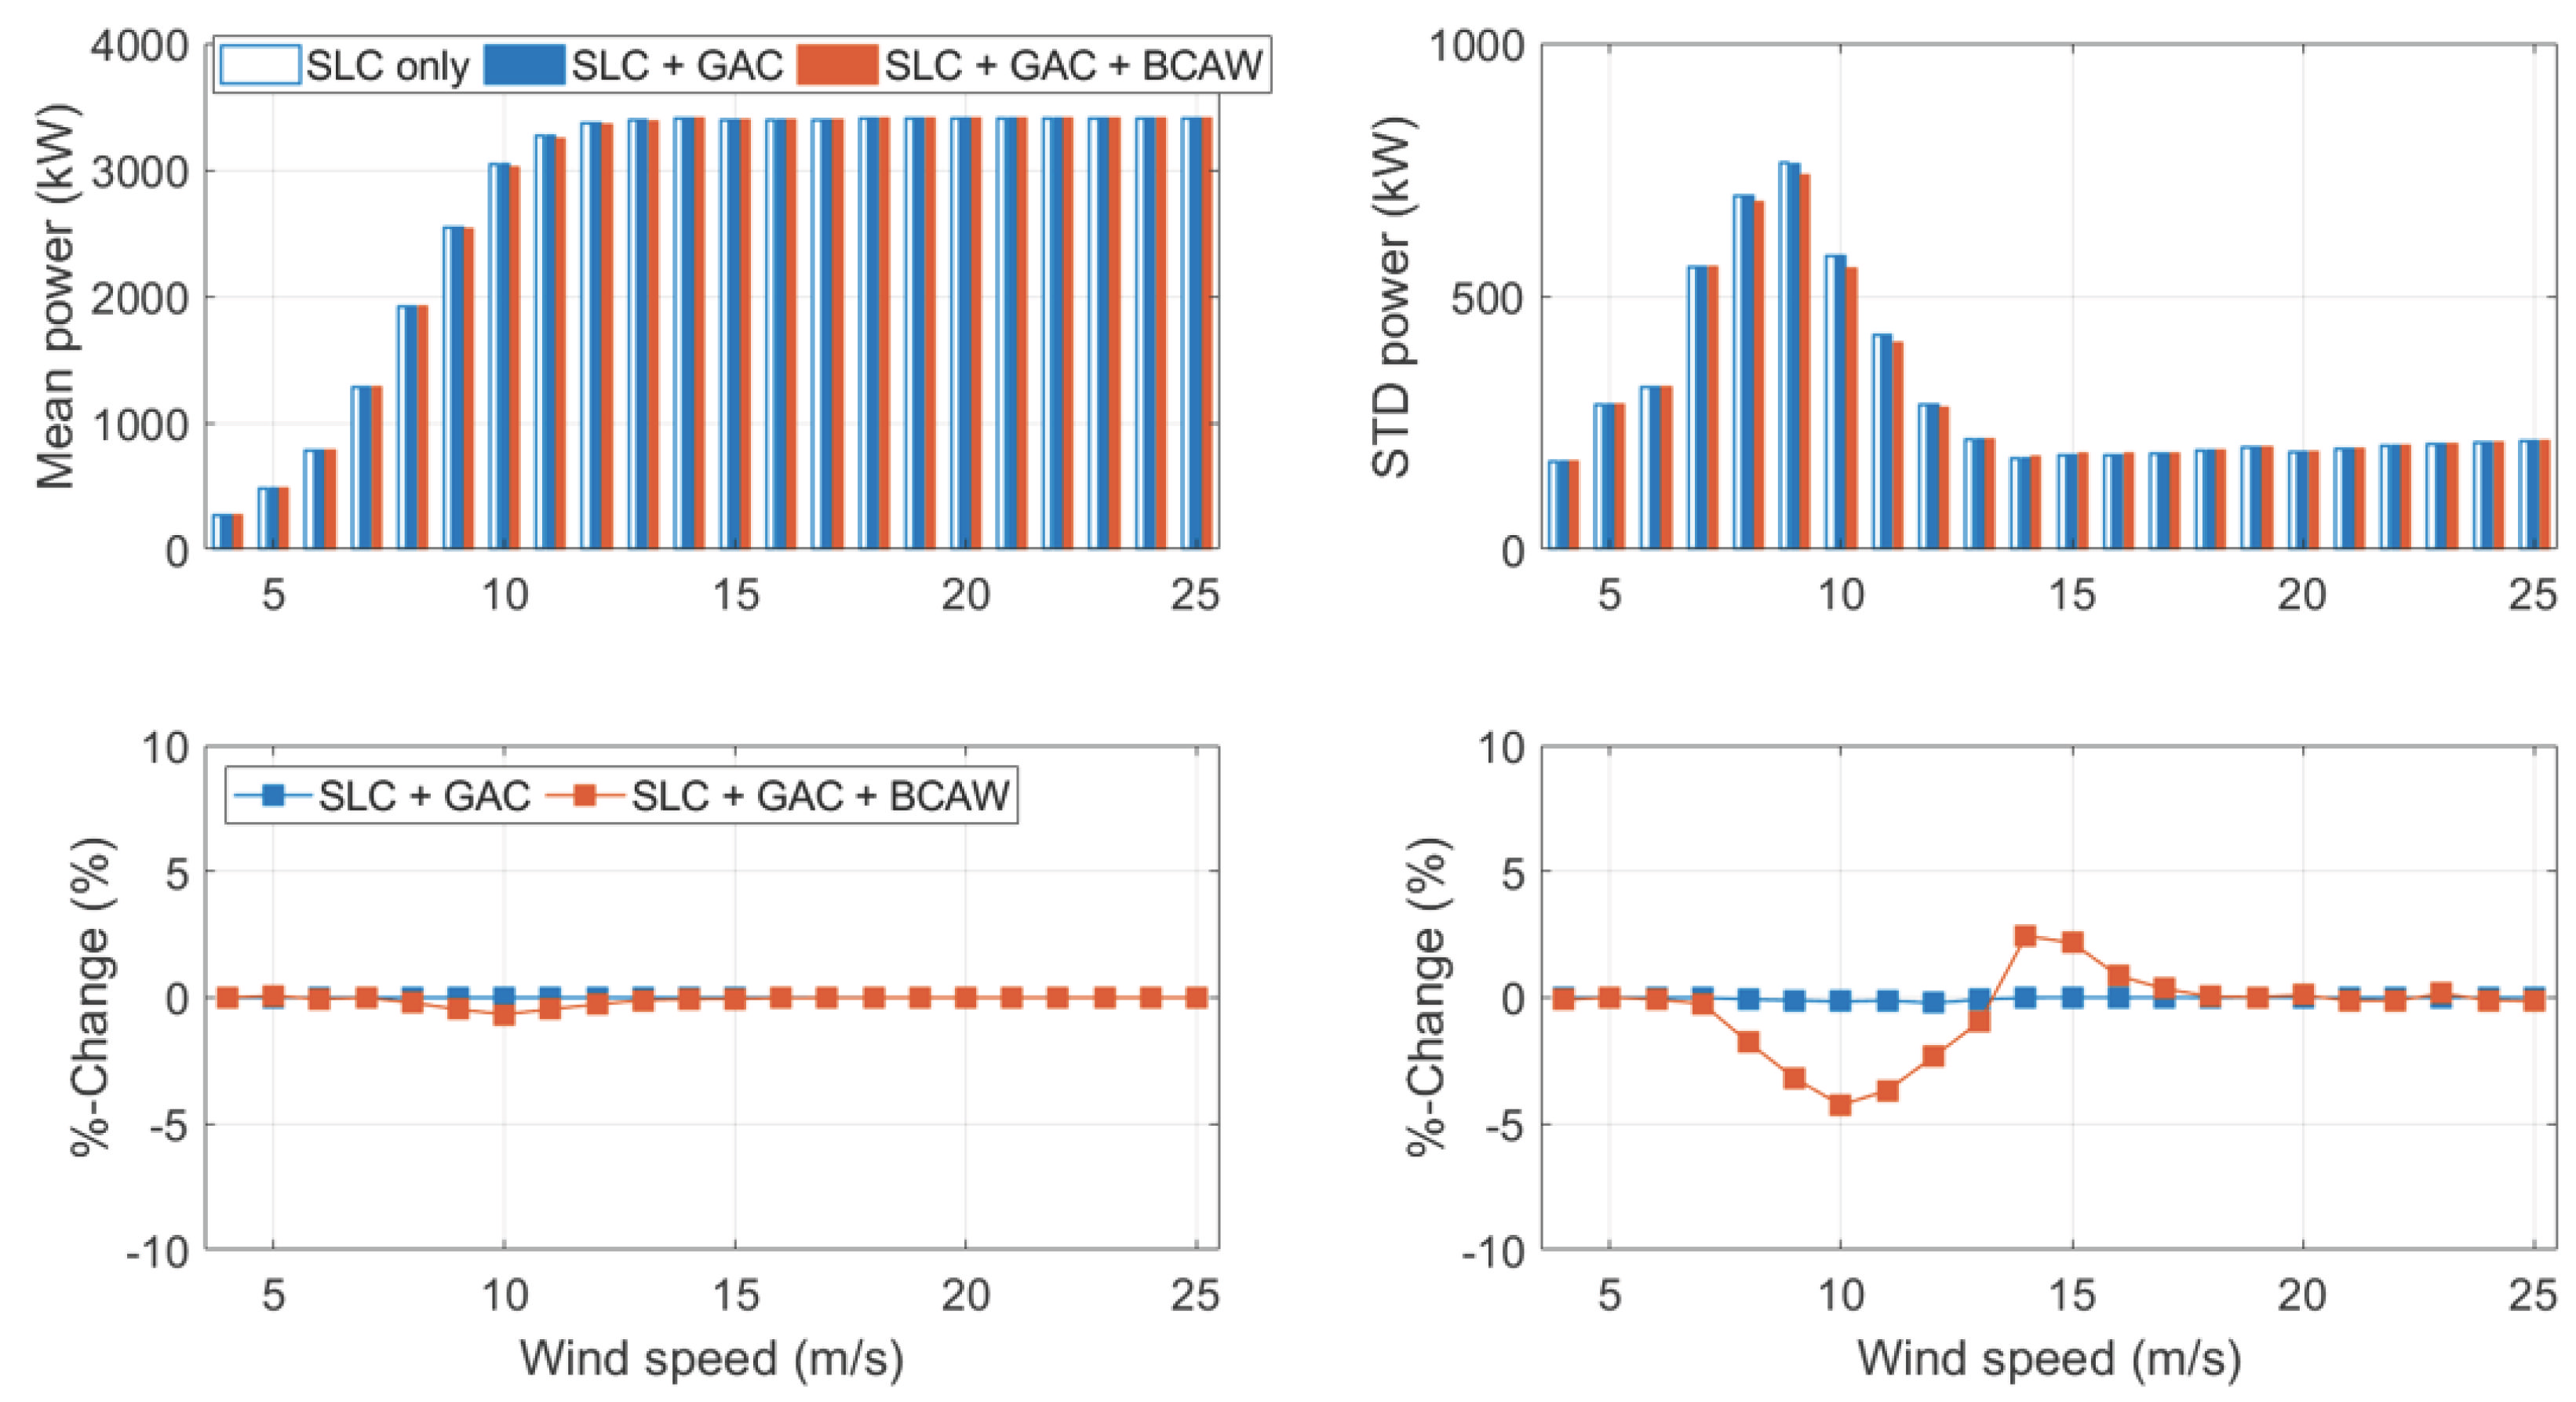
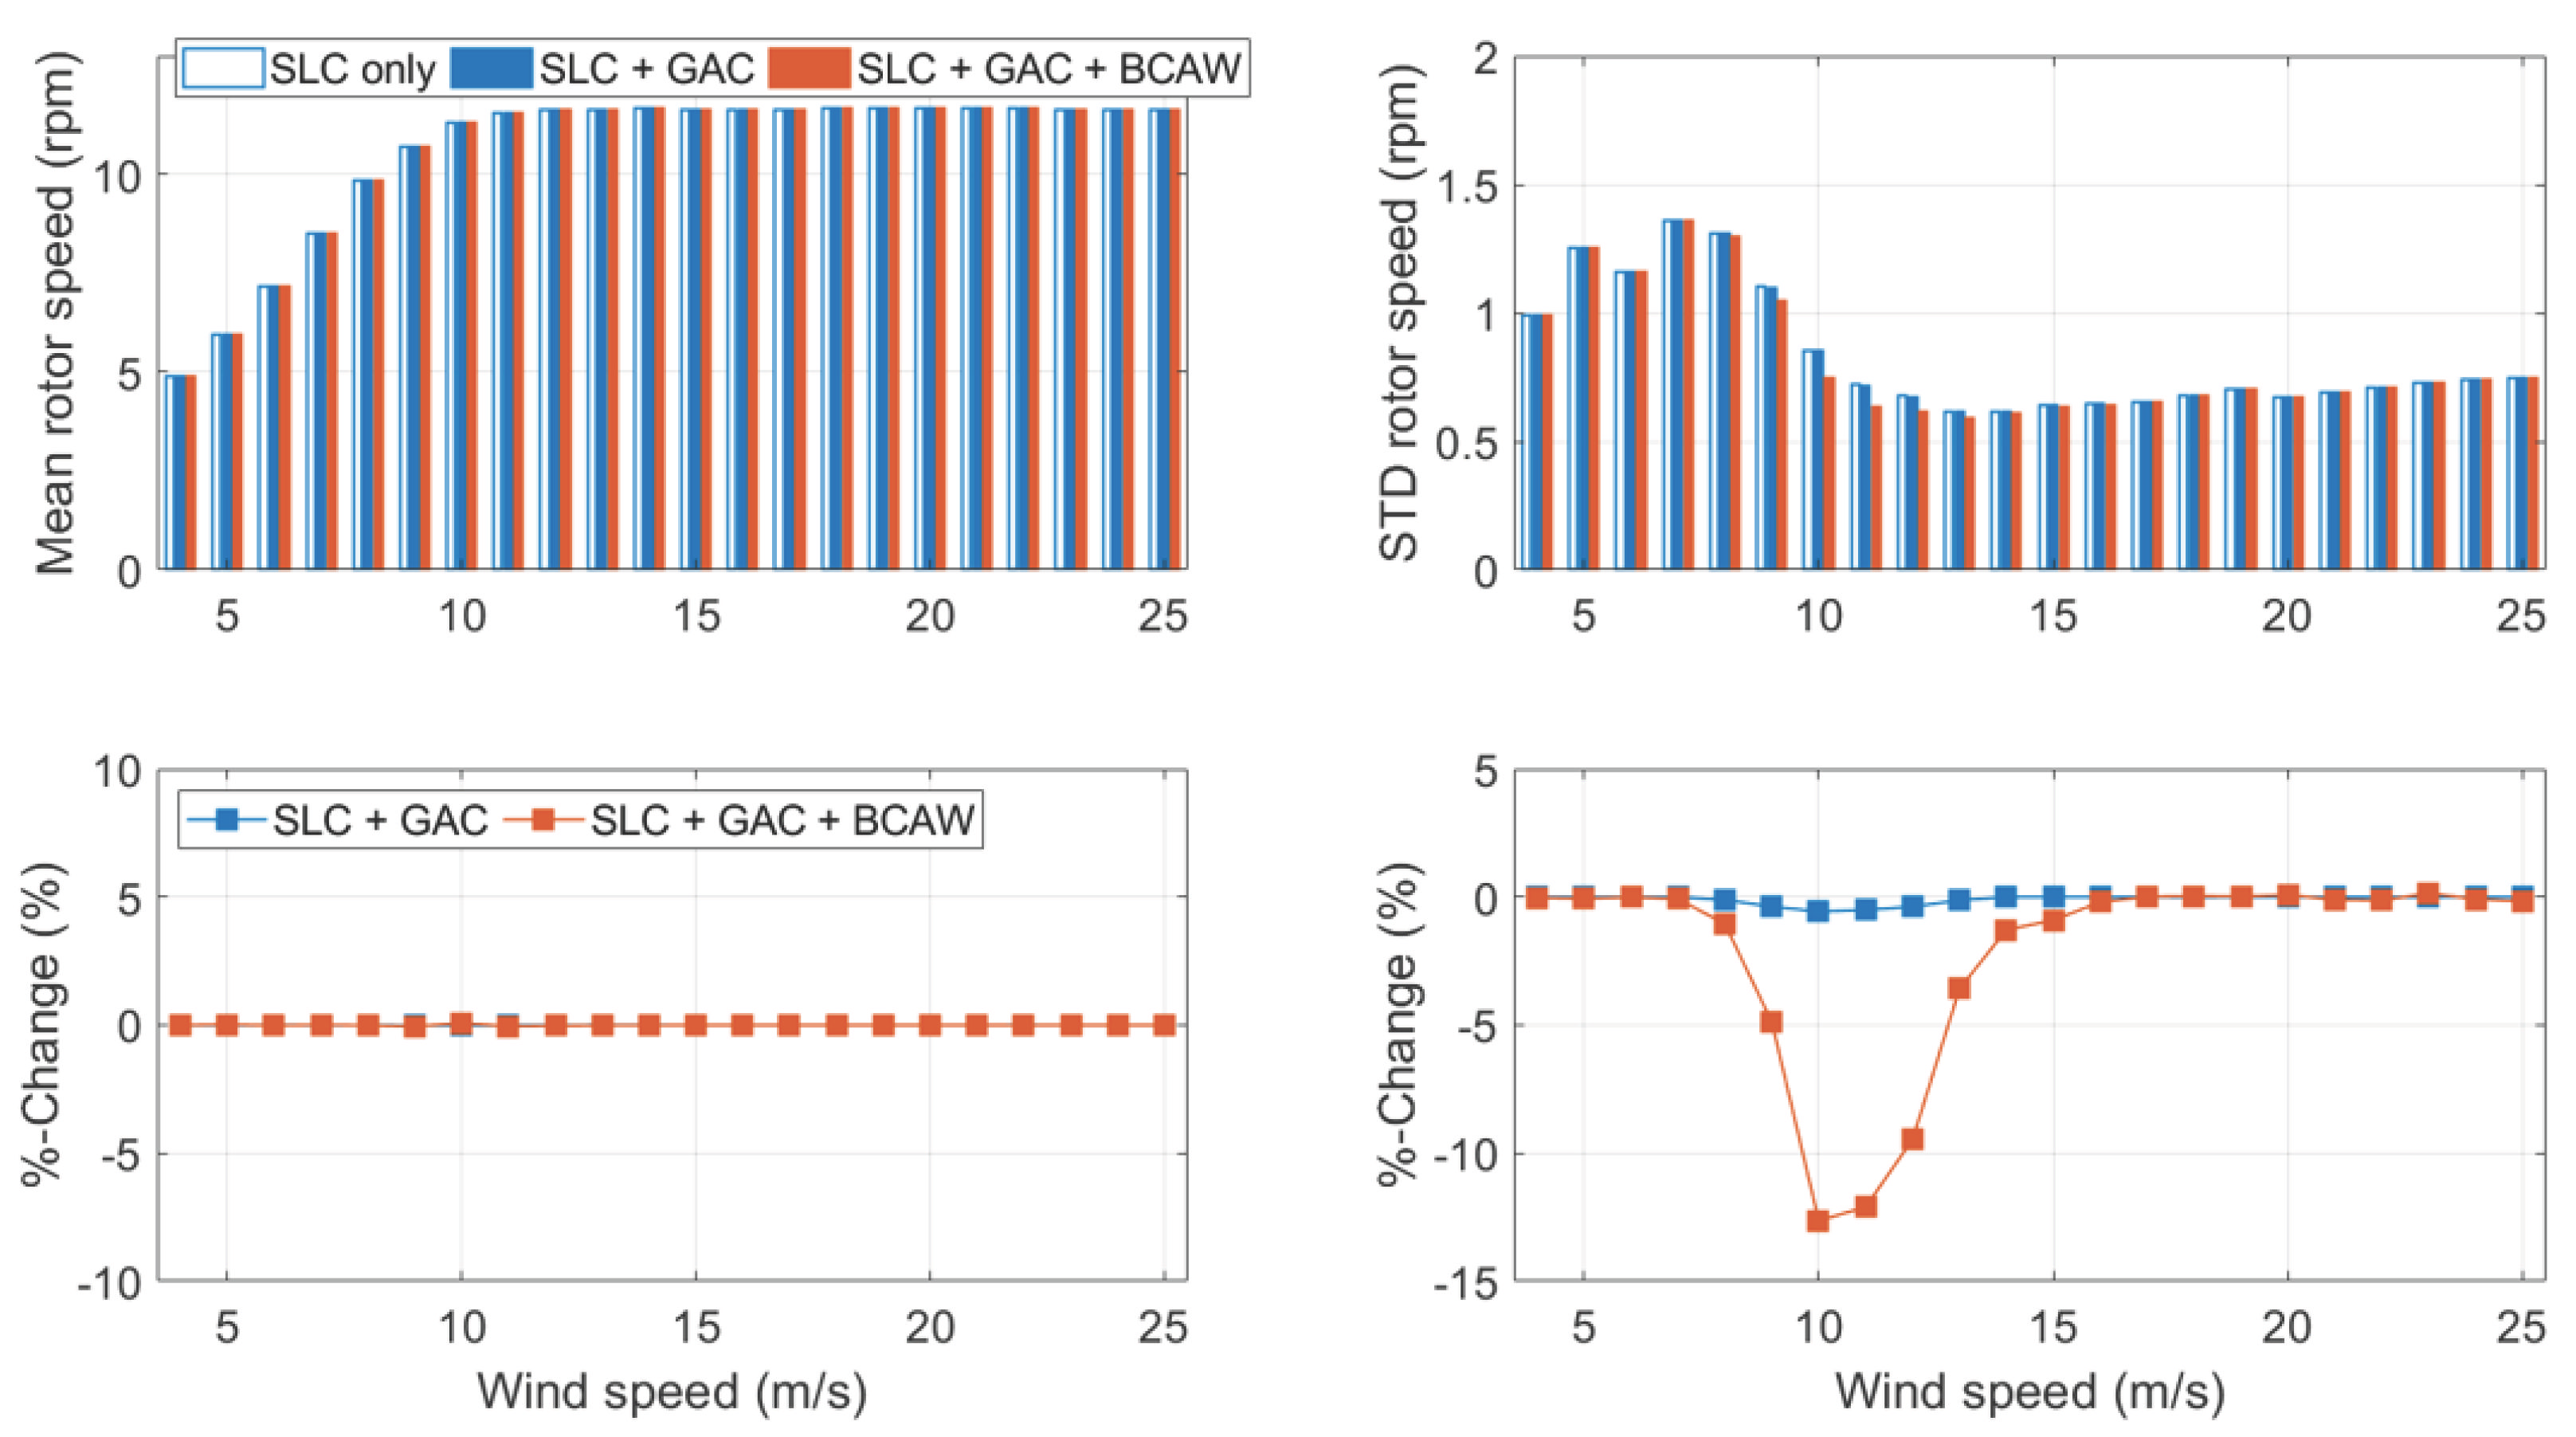
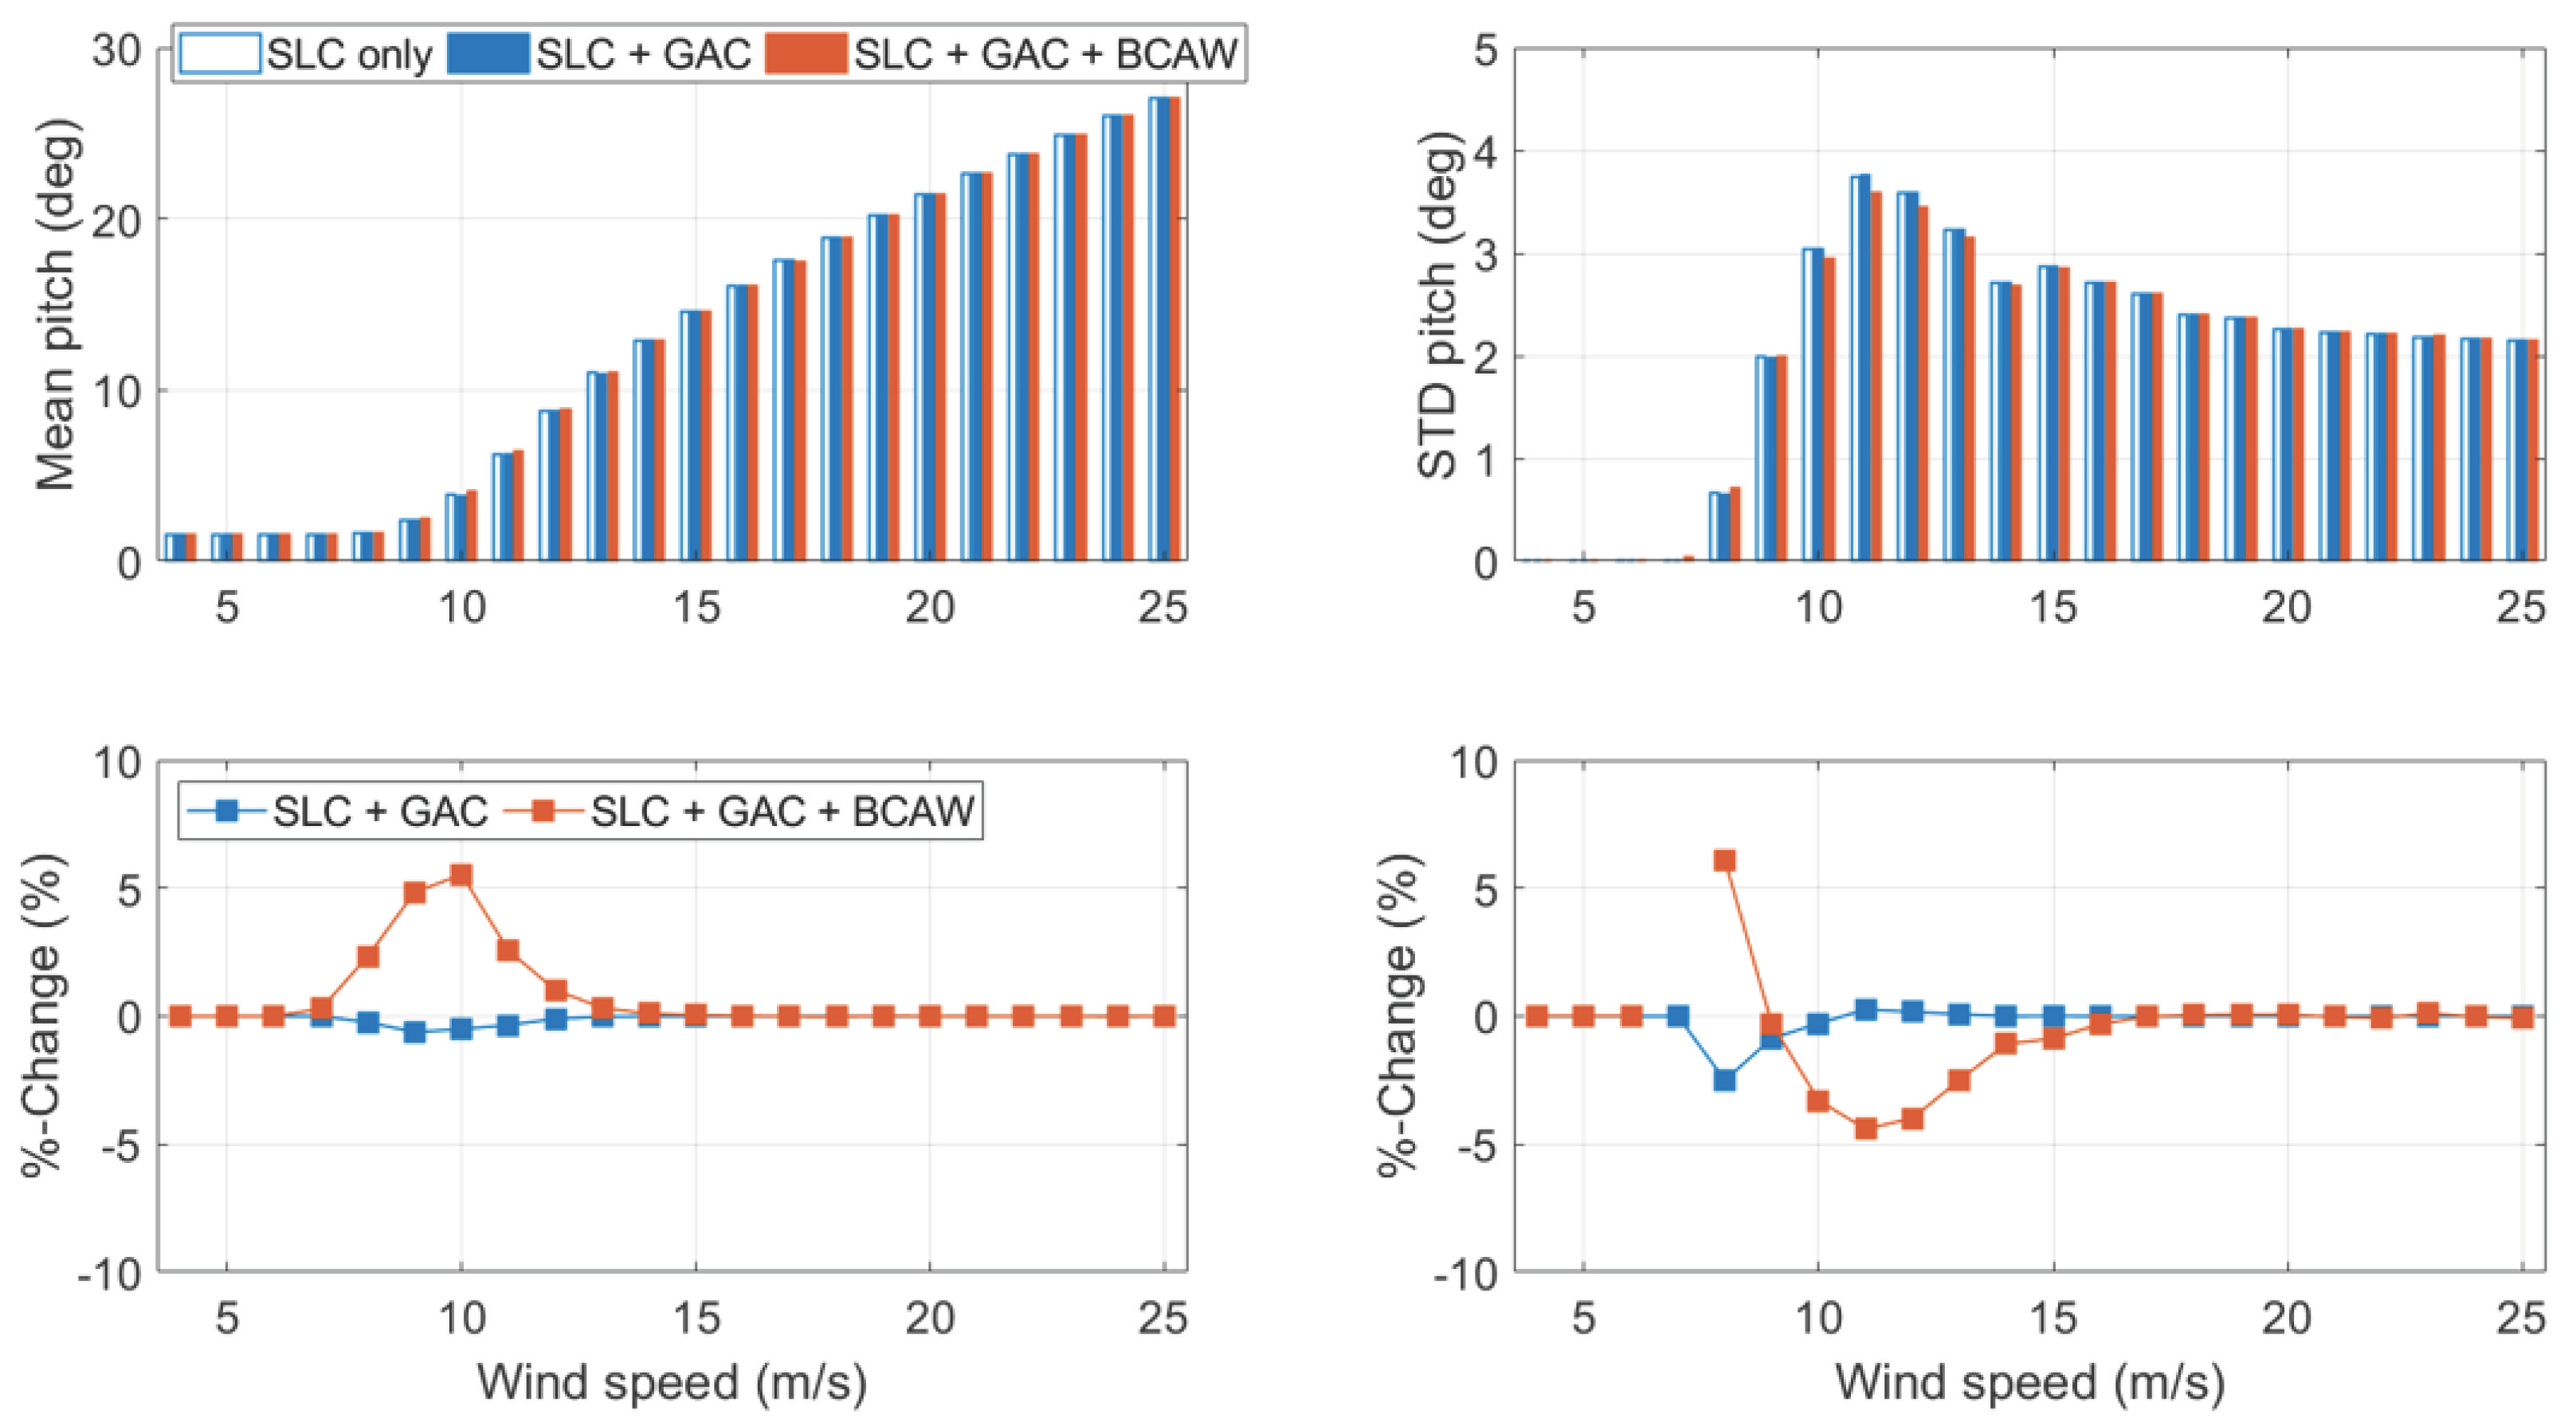
5.2. Effect on Turbine Performance under Normal Operating Conditions

The peak value comparison in the previous section demonstrates extreme load reduction under gust wind conditions. Since the loads can go beyond the threshold in the presence of turbulence as well, the GAC could affect the turbine performance under normal turbulence wind conditions. Therefore, the mean and standard deviation of rotor speed, pitch angle, and generator power are evaluated in this section to ensure that the turbine outputs are not affected by GAC during normal turbine operation.
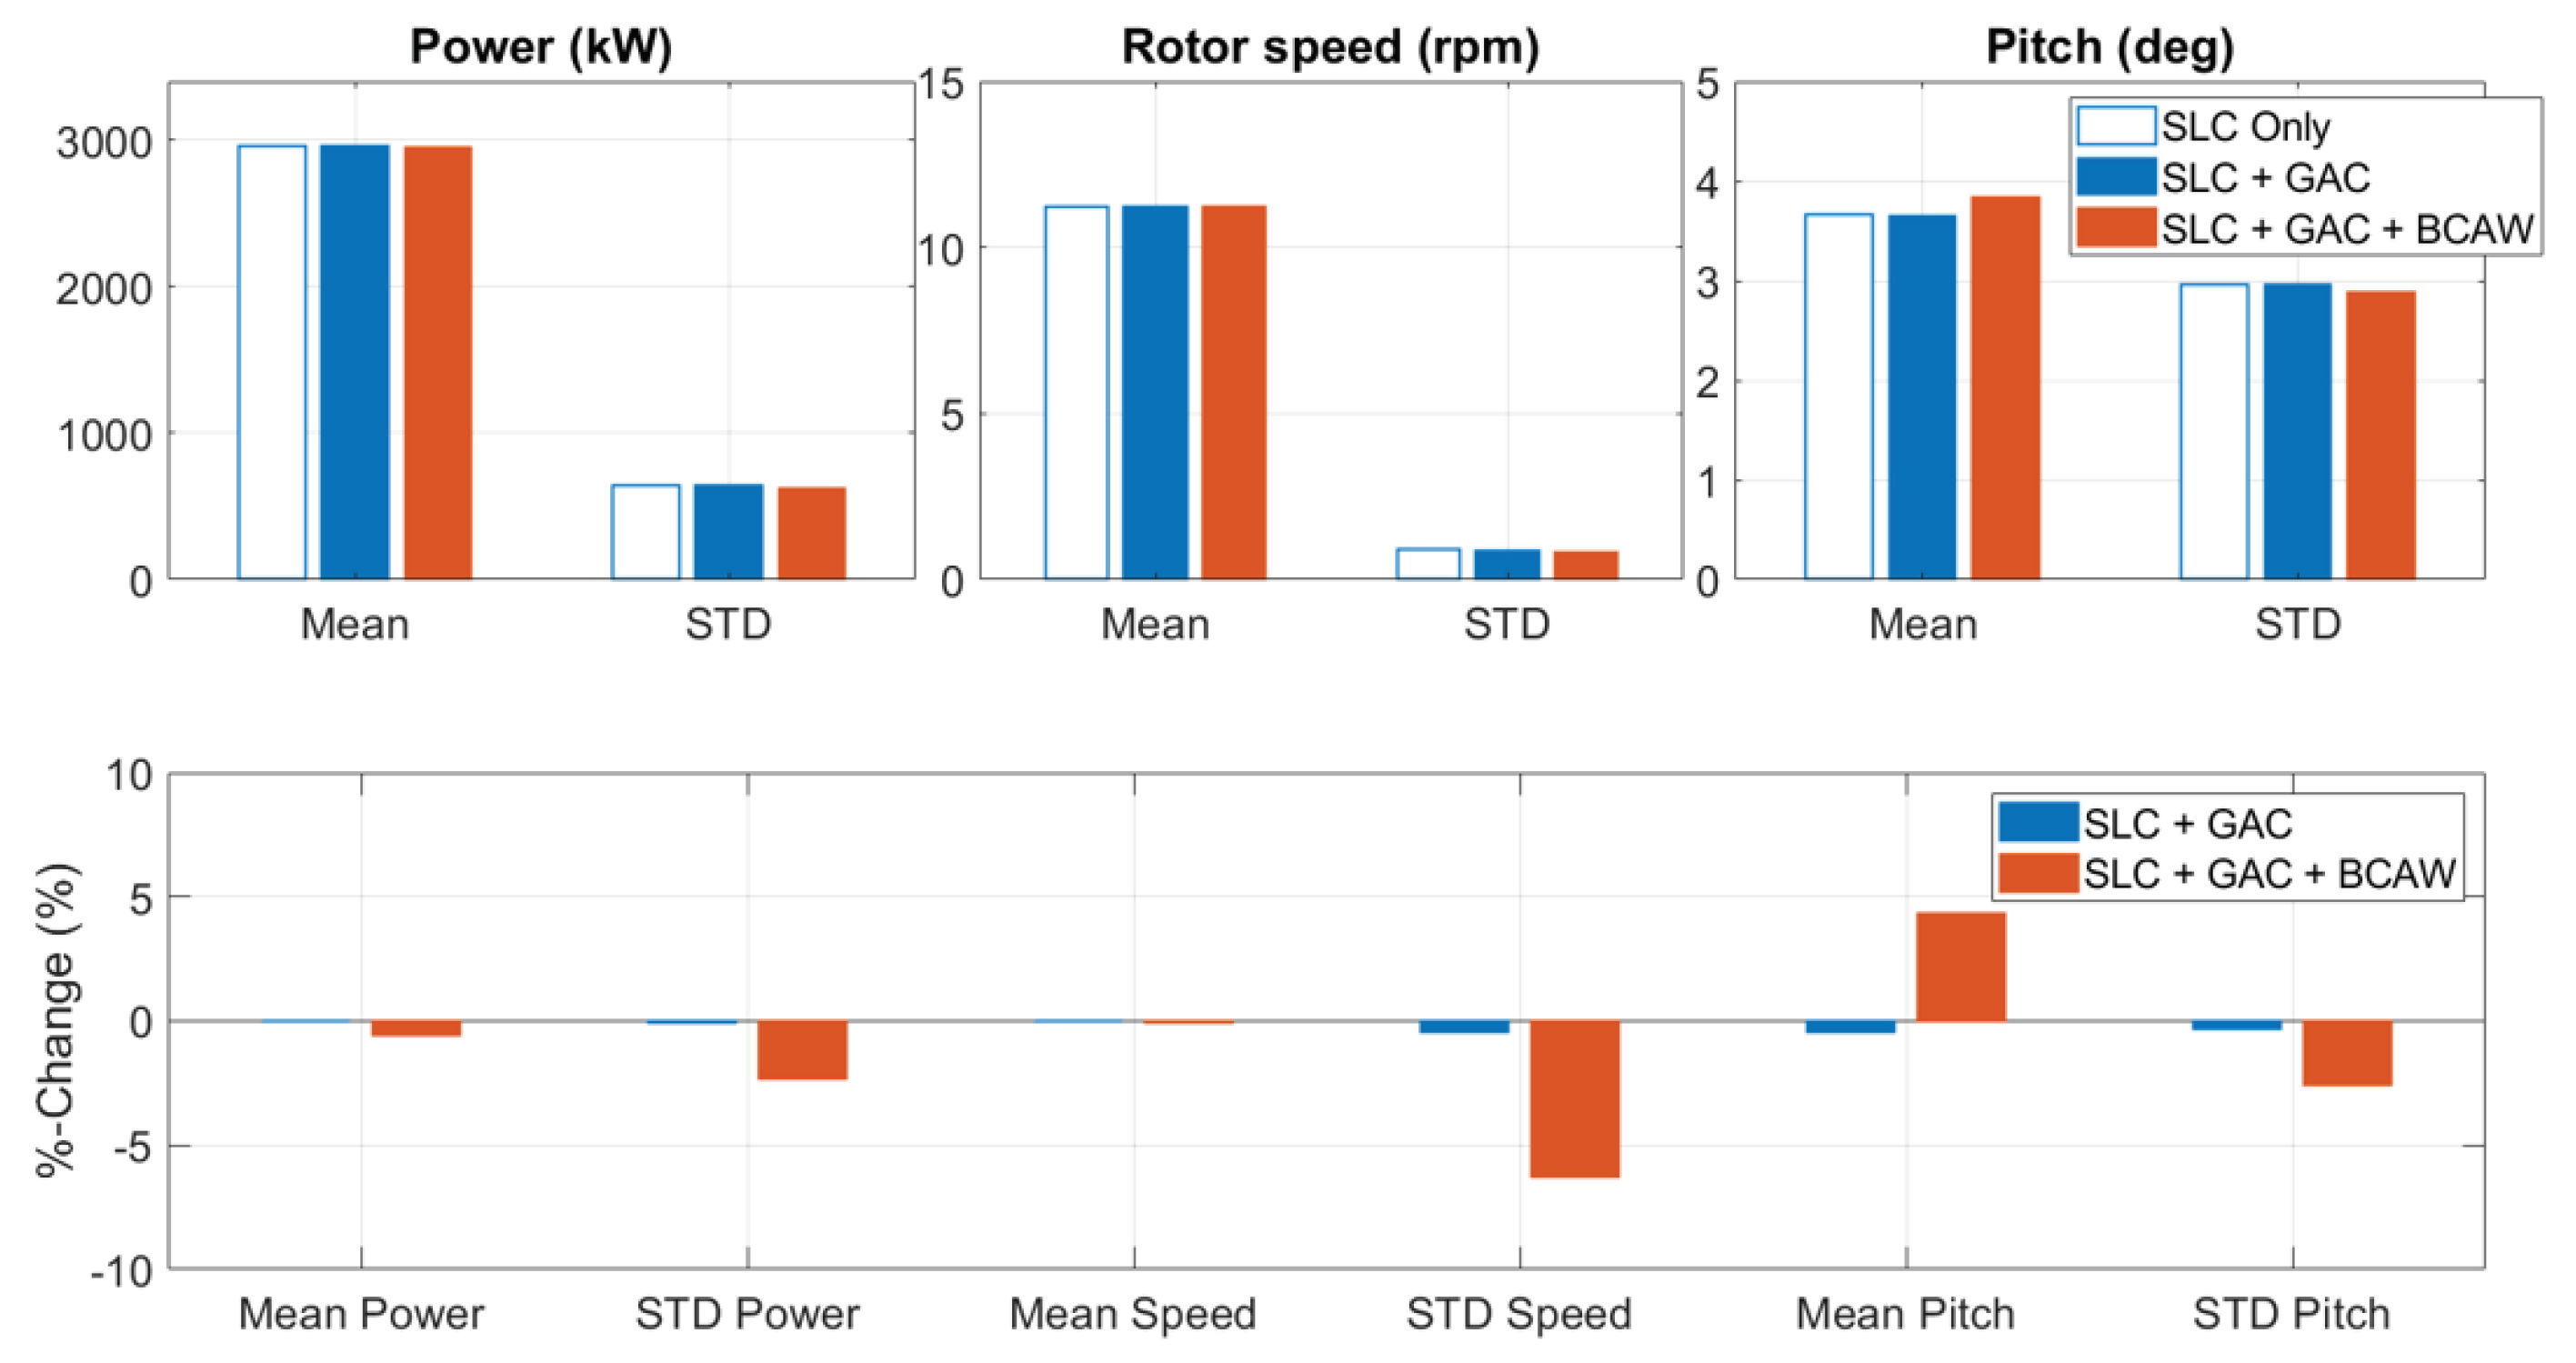
Figure 12 shows the absolute values and the percentage changes in the turbine performance under different controller configurations. By comparing the ‘SLC Only’ with the ‘SLC + GAC’, we observe that all performance metrics are virtually unaffected (within 0.5% change). This means the GAC with the optimal thresholds does not have any negative effects on the turbine performance. This is as expected since the loads go beyond the threshold for a very small amount of time under the normal turbulence wind.
By comparing the ‘SLC + GAC’ with the ‘SLC + GAC + BCAW’, we observe that the BCAW results in lower standard deviations and similar mean values except for the mean pitch angle. Specifically, mean power and mean rotor speed are virtually the same (within 0.5% change). The increase in the mean pitch angle is because the BCAW can bring the pitch command out of saturation faster than standard ROSCO, which allows better tracking when the turbulent wind exceeds its rated value. Standard deviations of power, rotor speed and pitch are reduced by 2.3%, 6.2% and 2.5%, respectively. The reduction of standard deviation shows that the turbine is operating in a relatively stable condition.

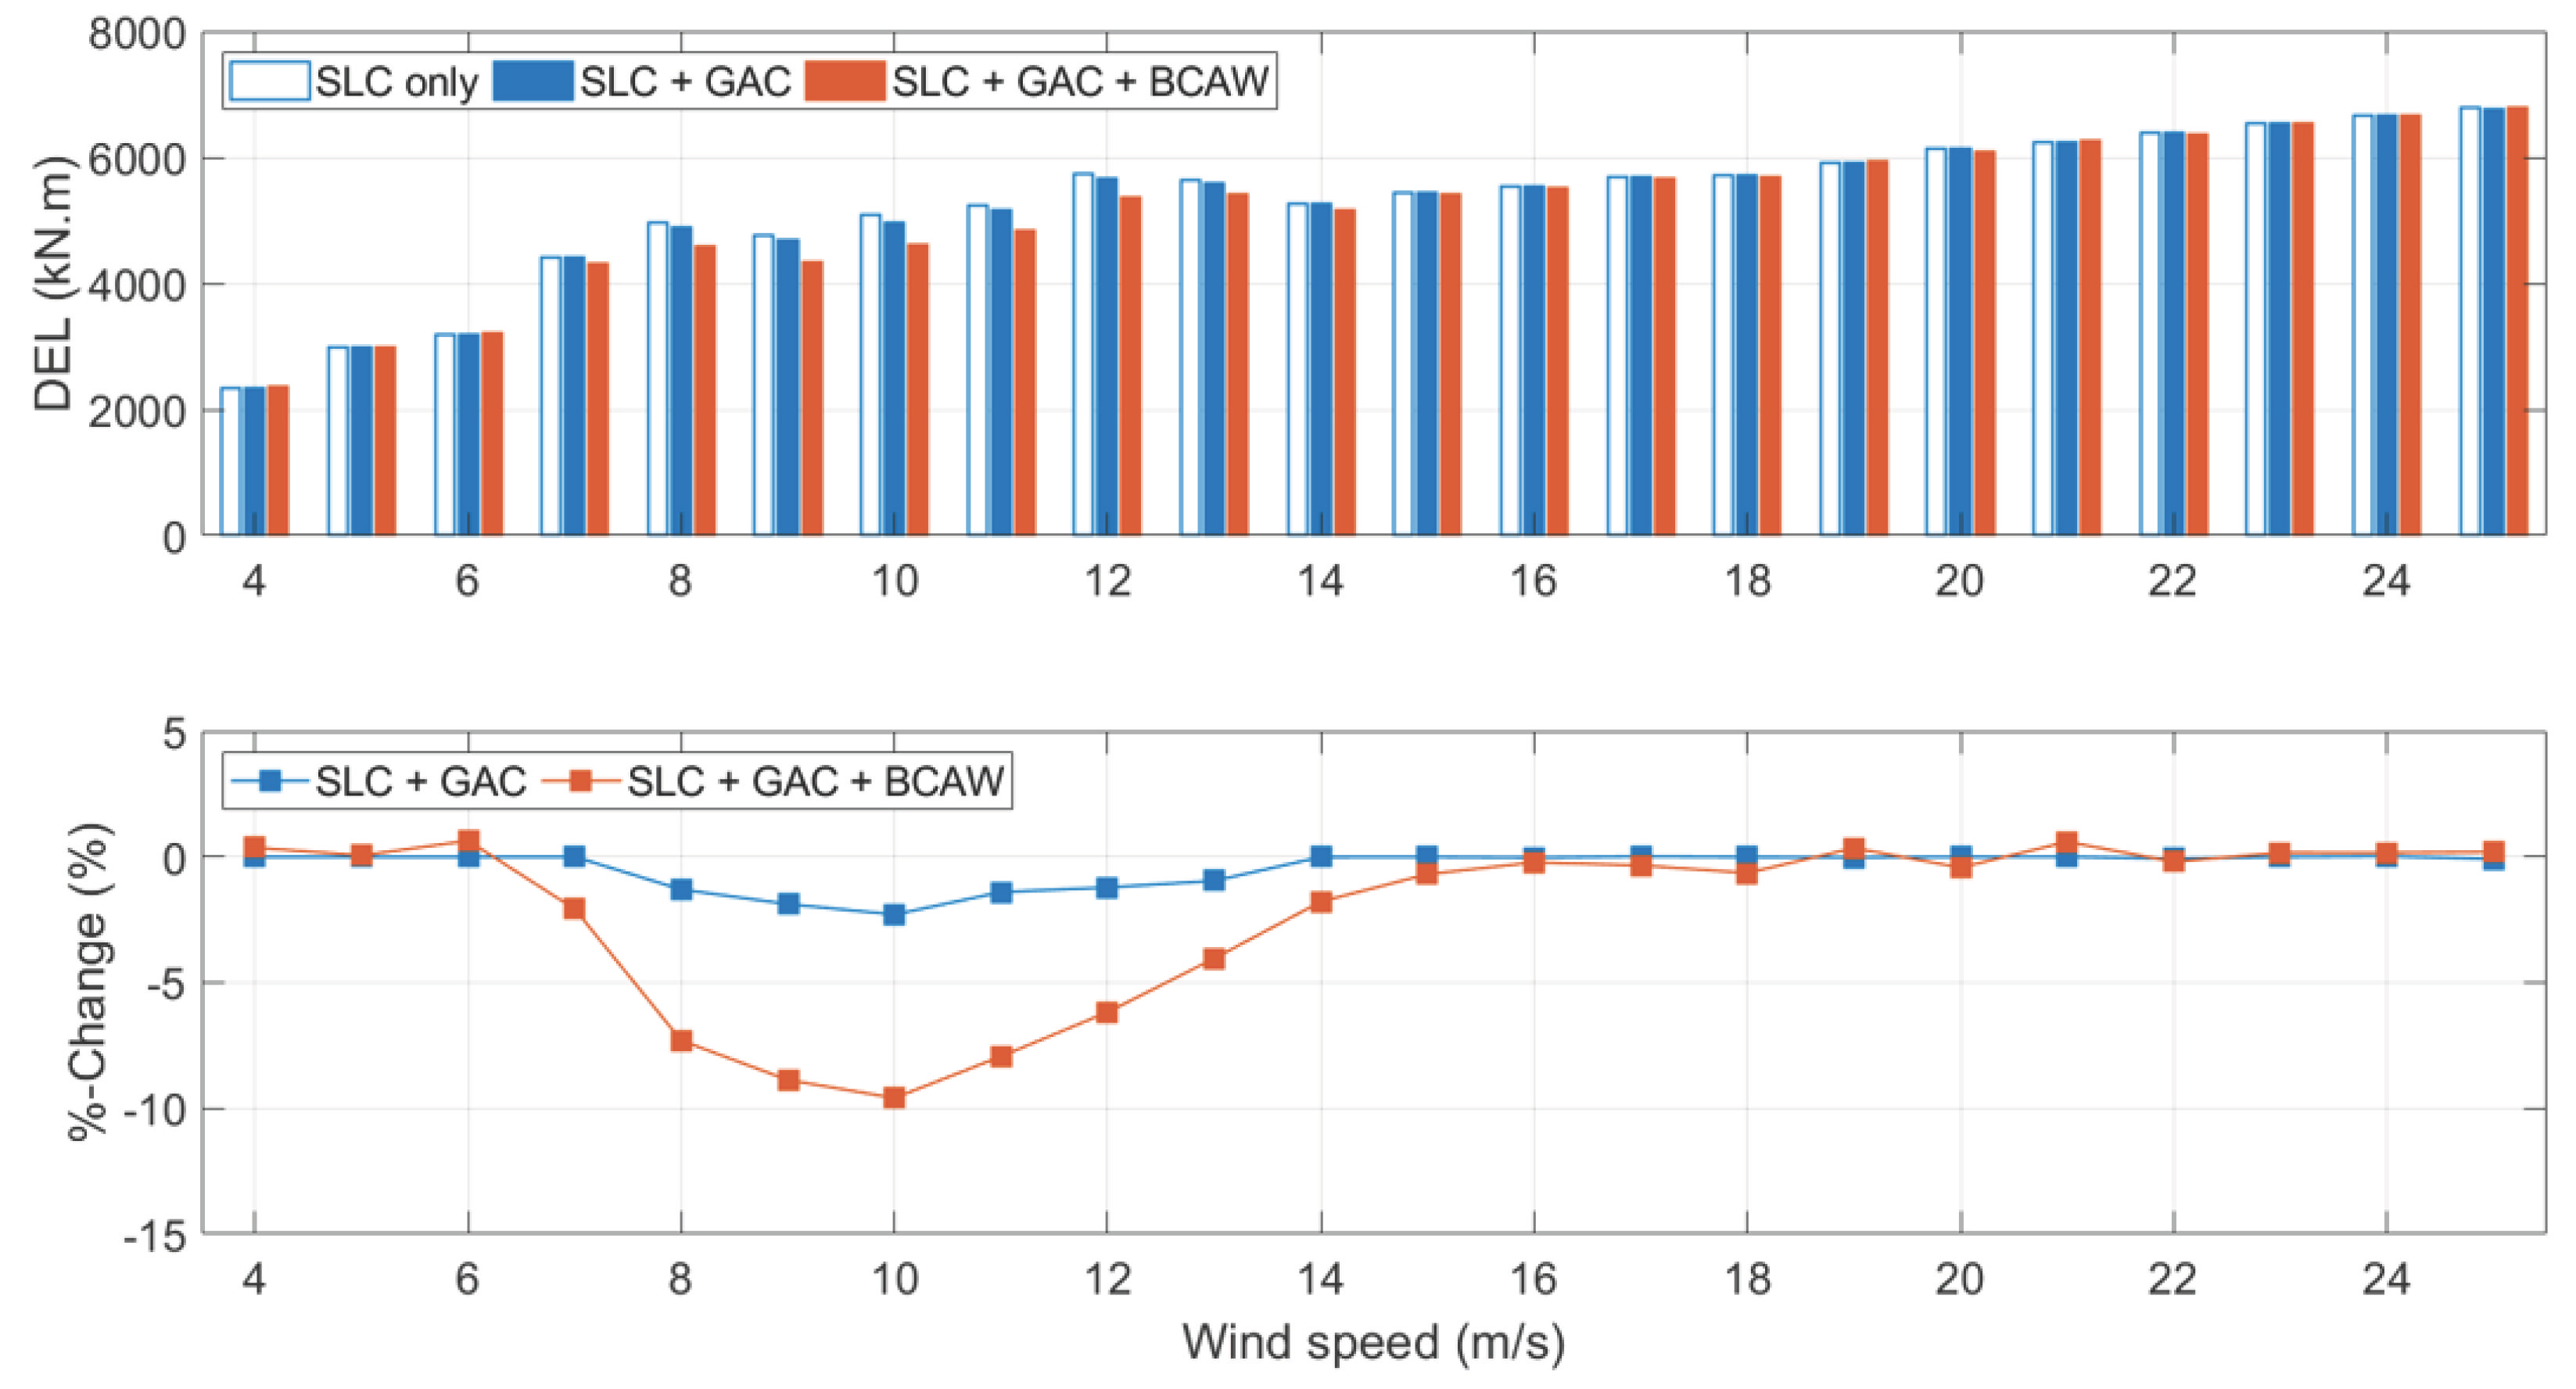
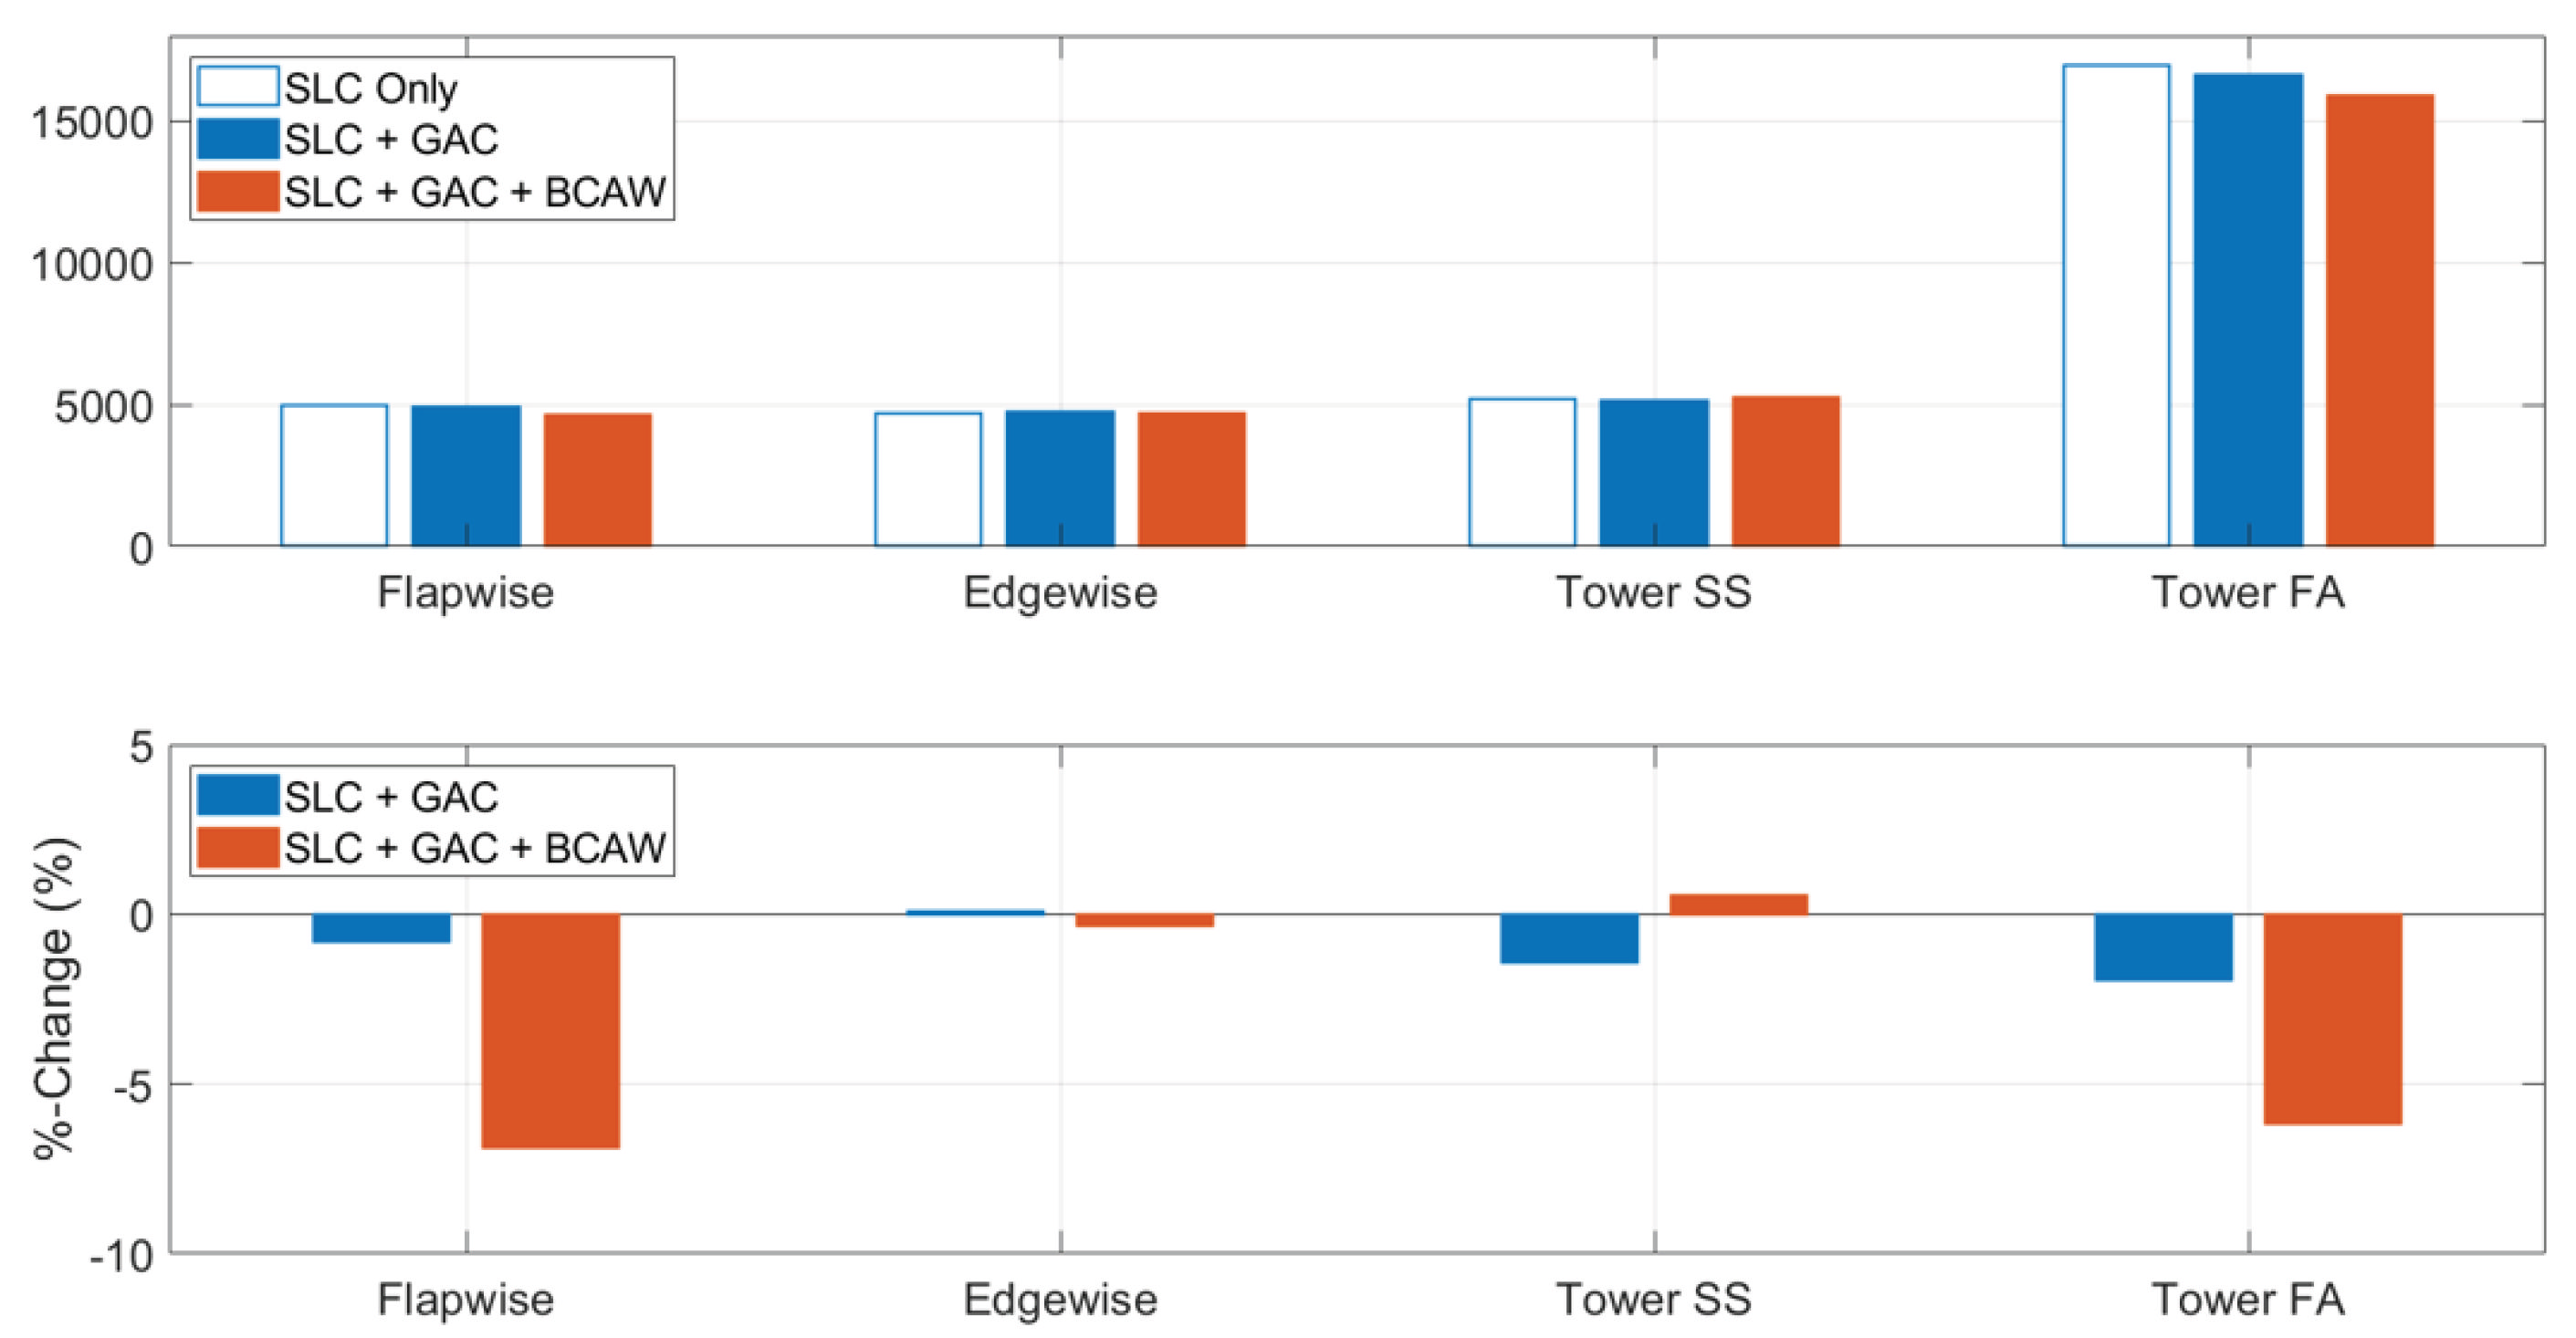
5.3. Fatigue Load Evaluation under Normal Operating Conditions

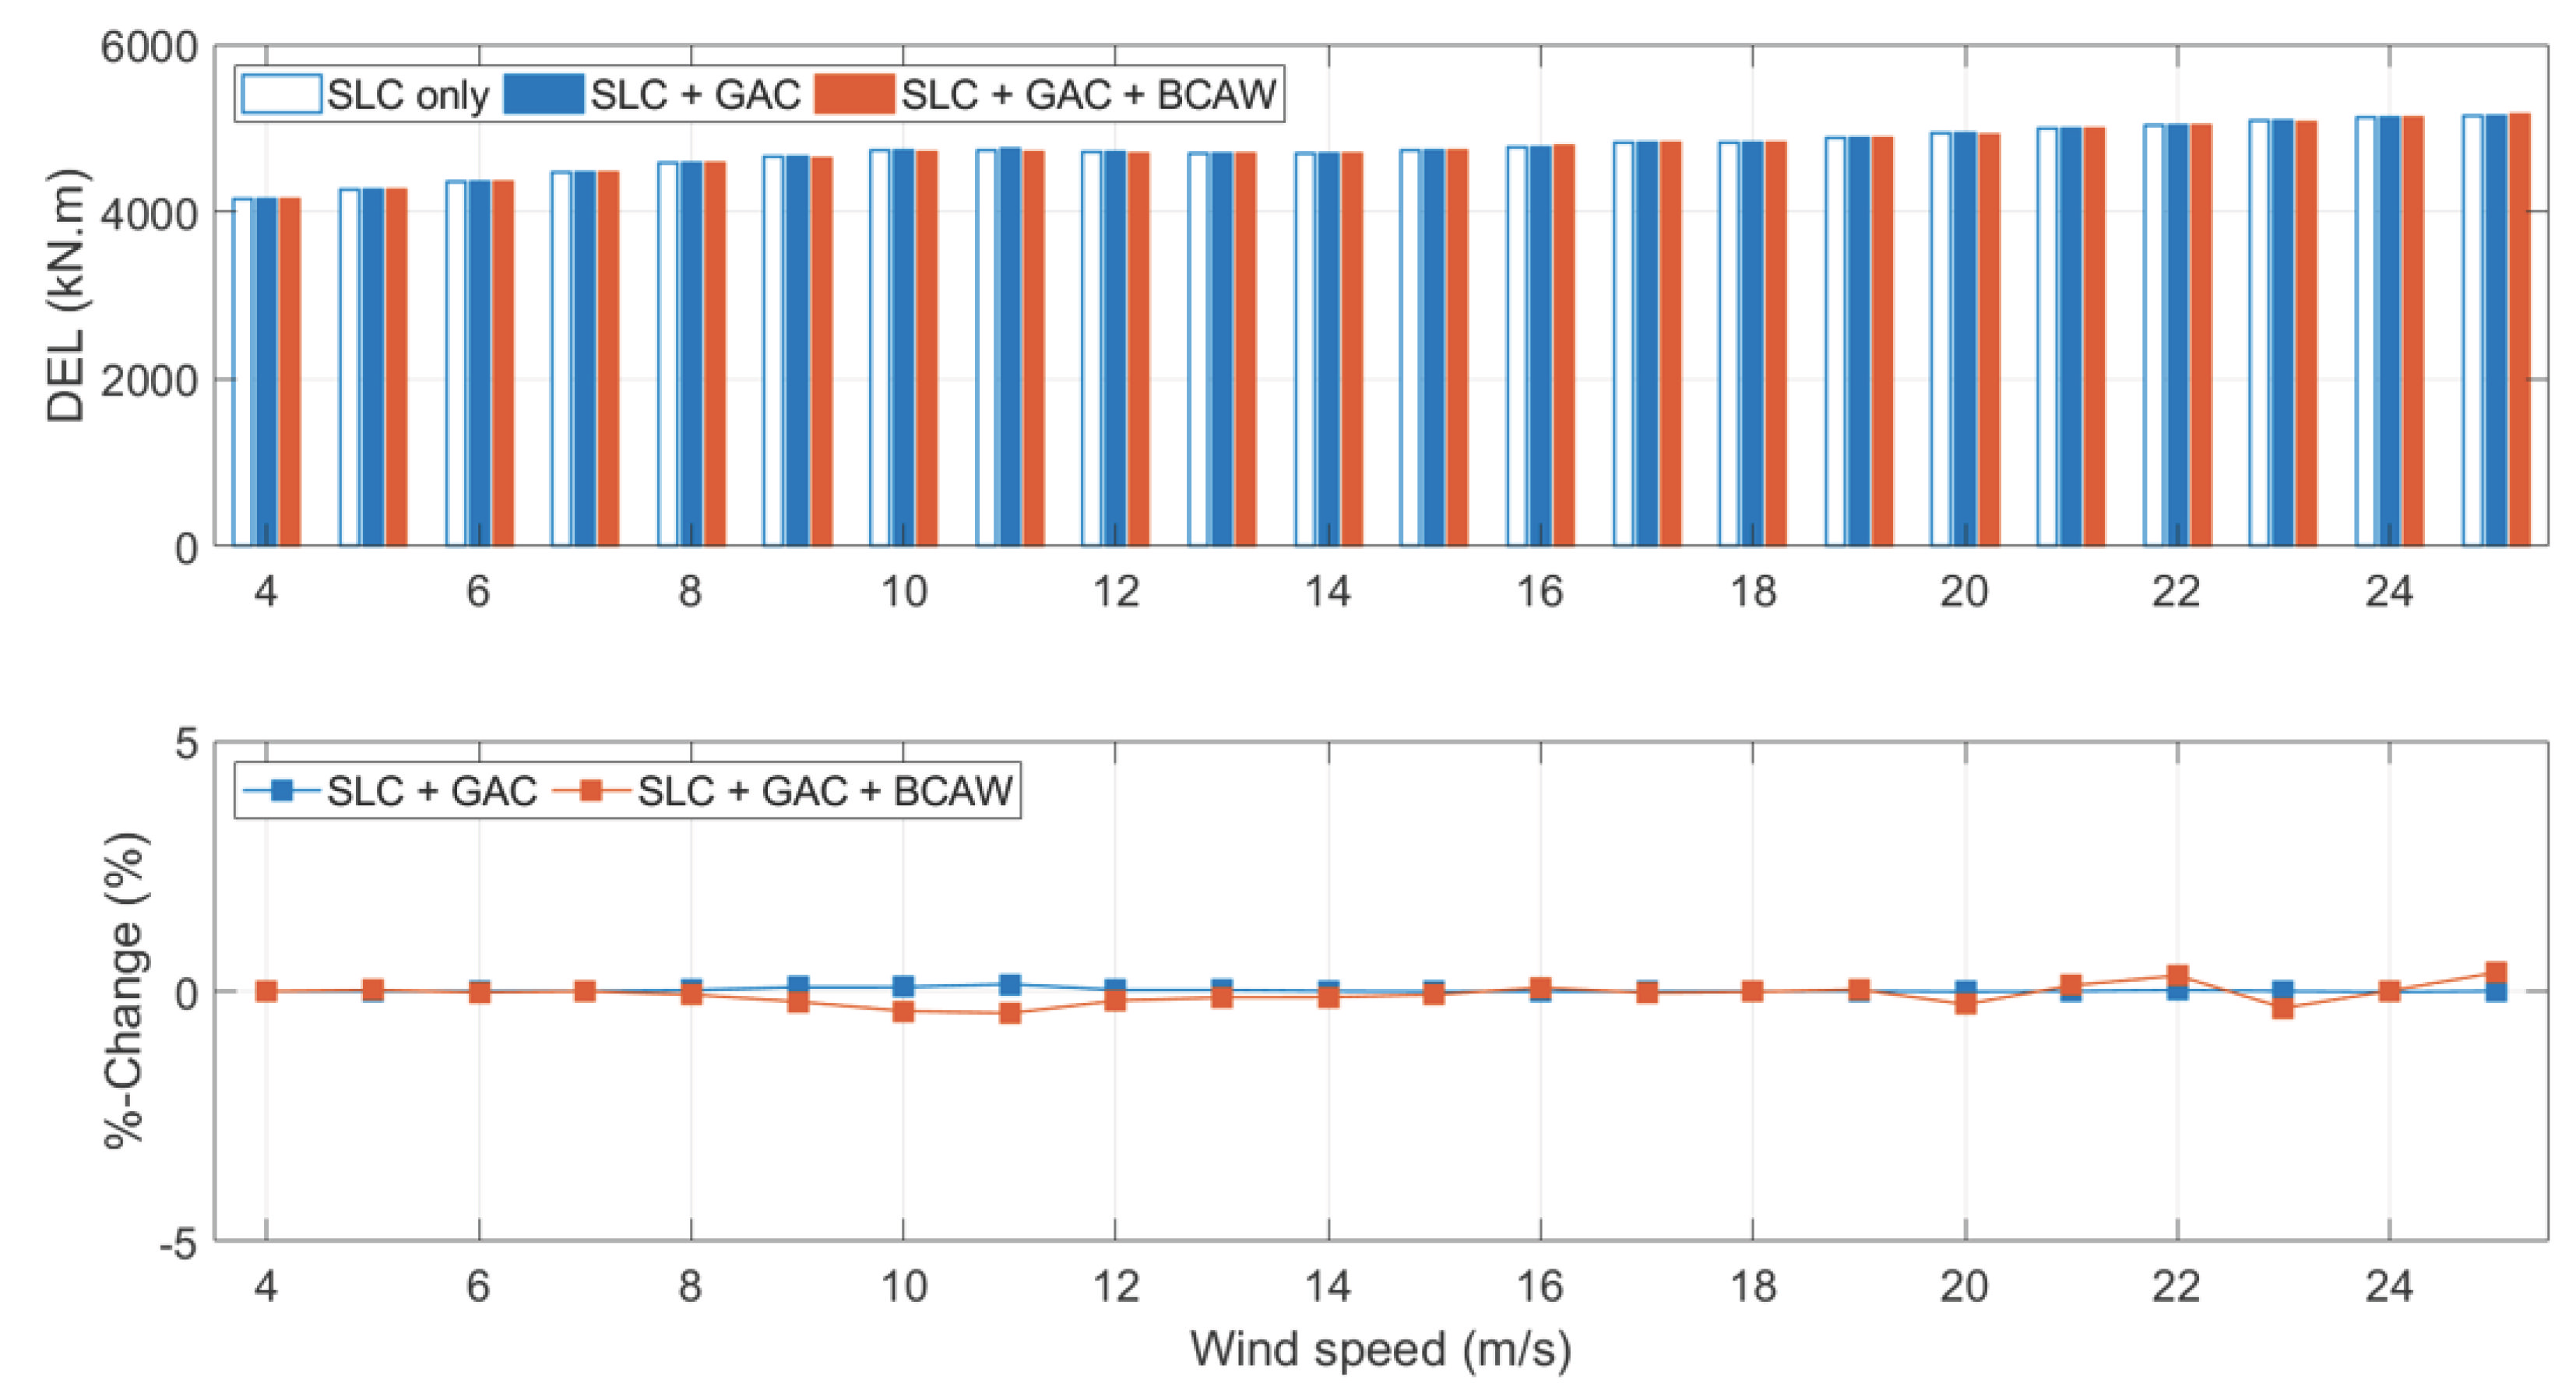
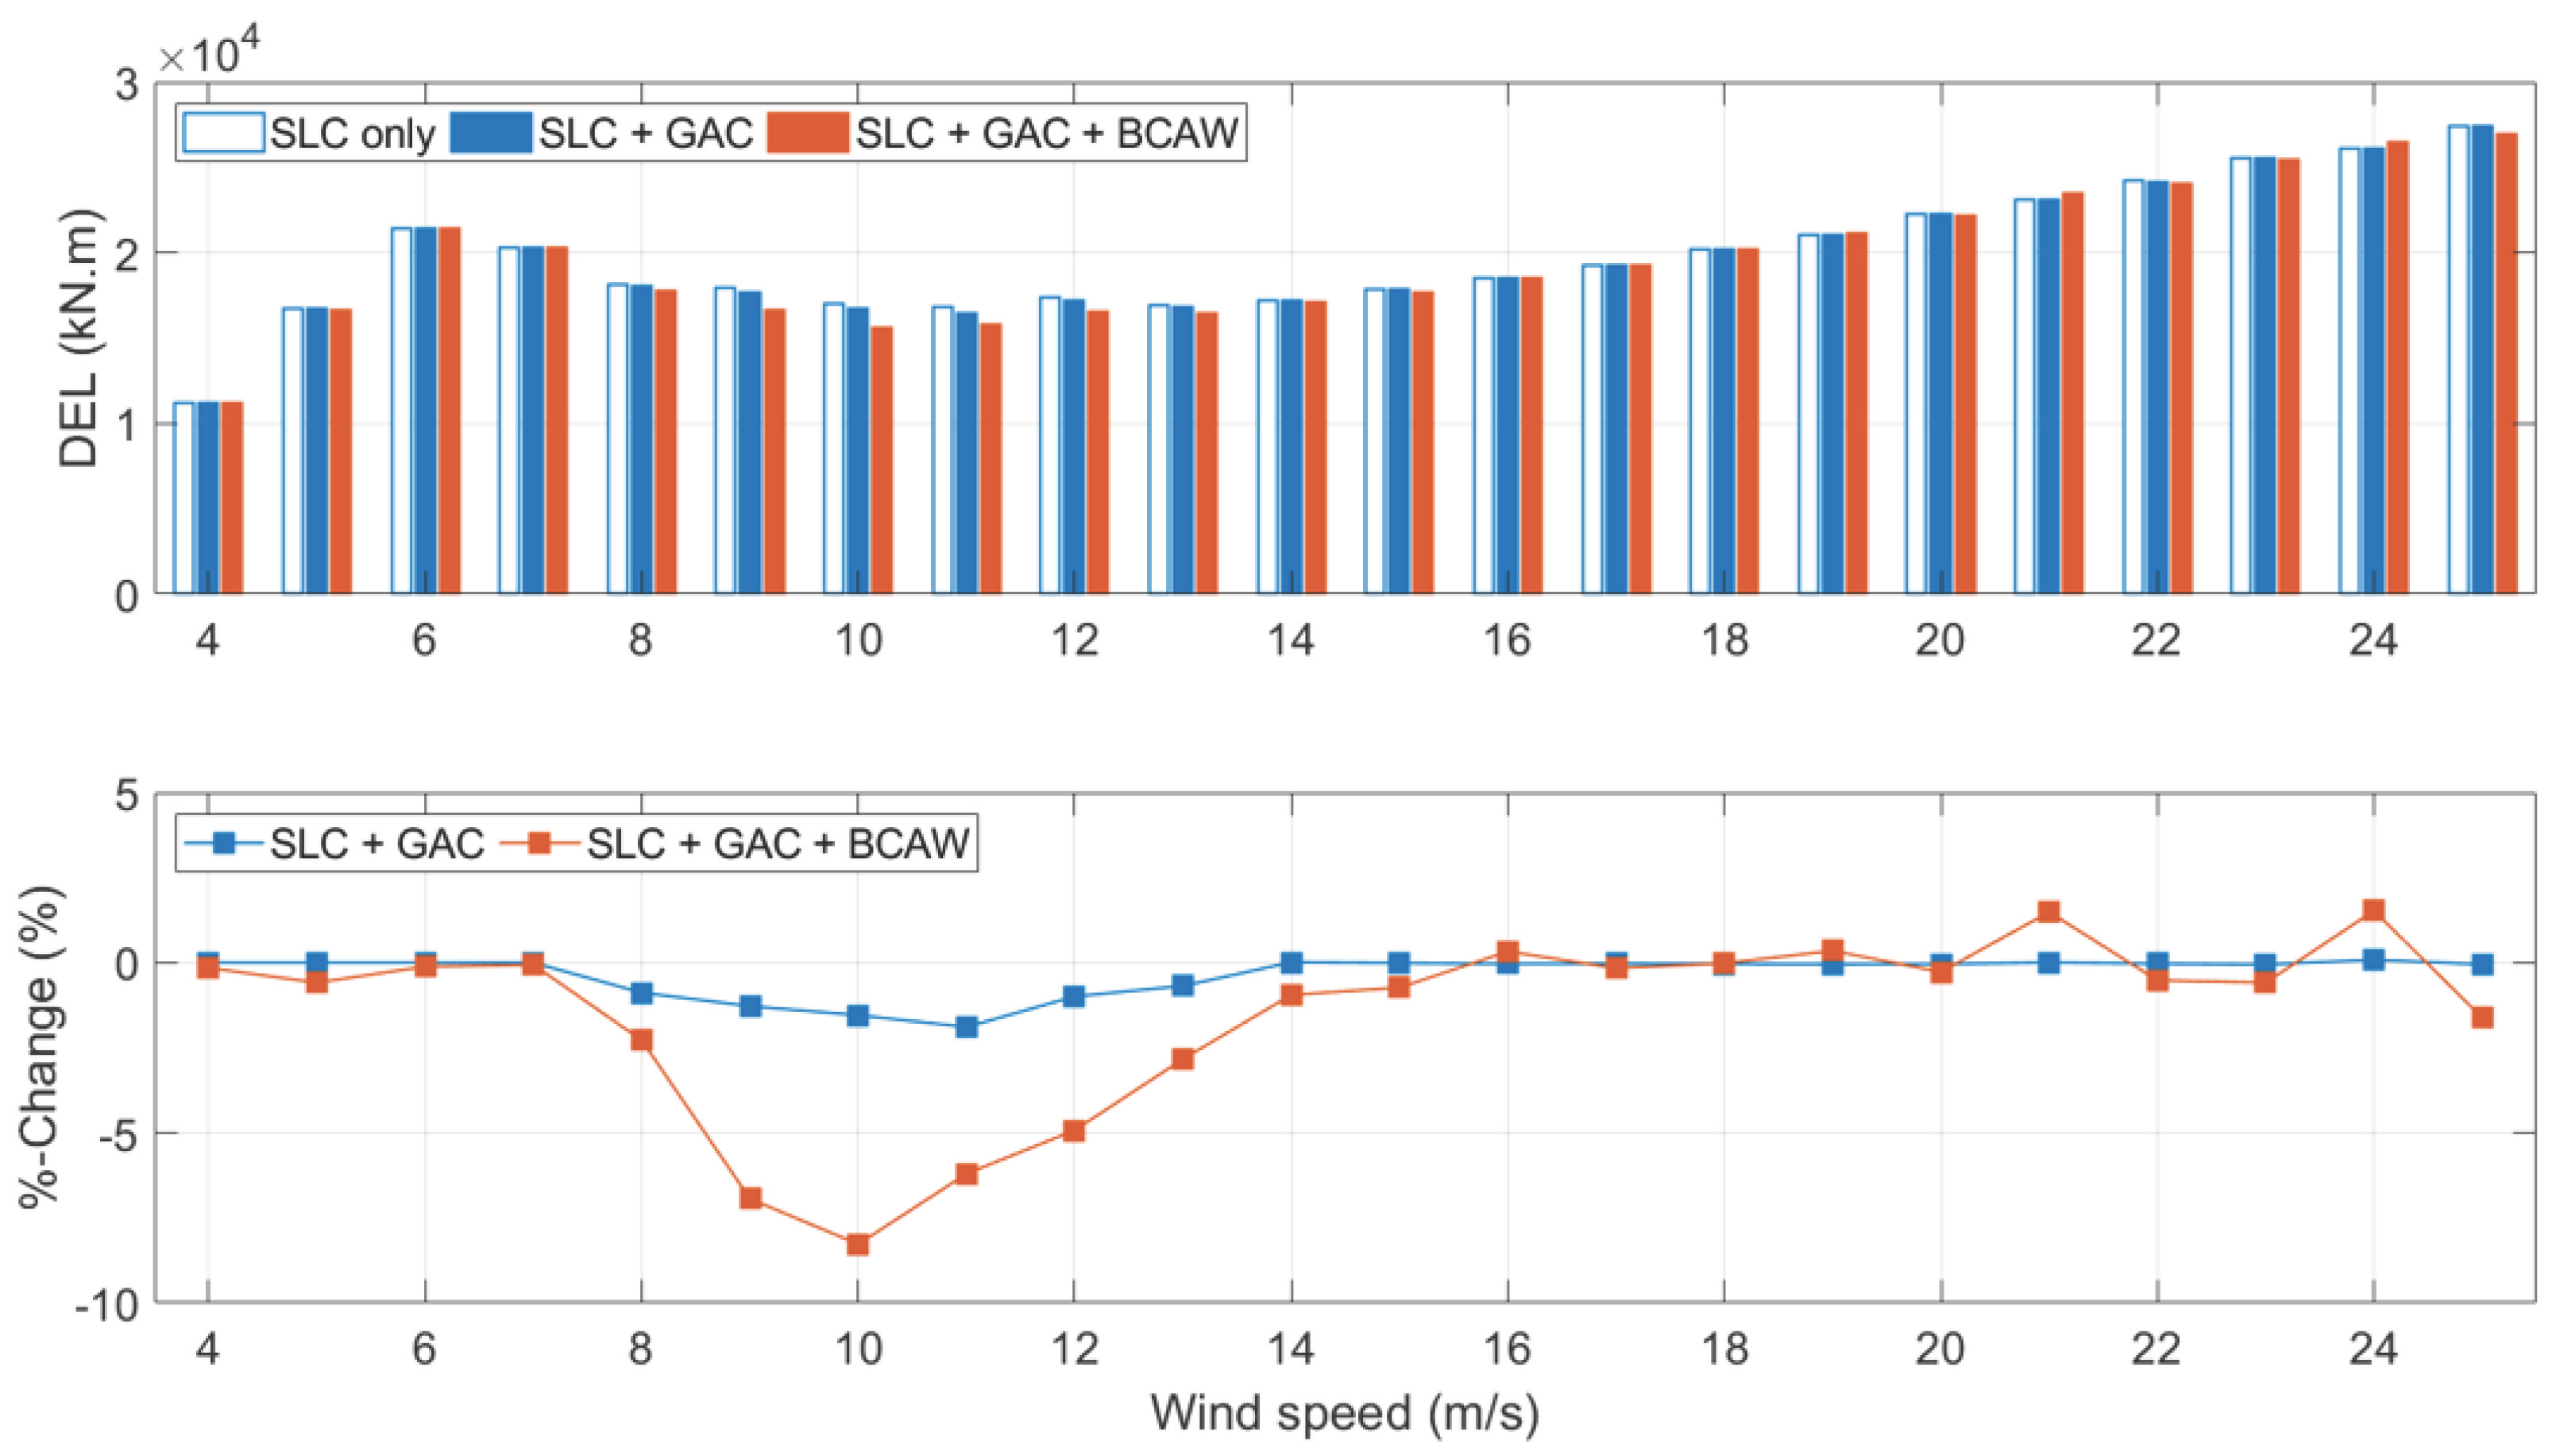
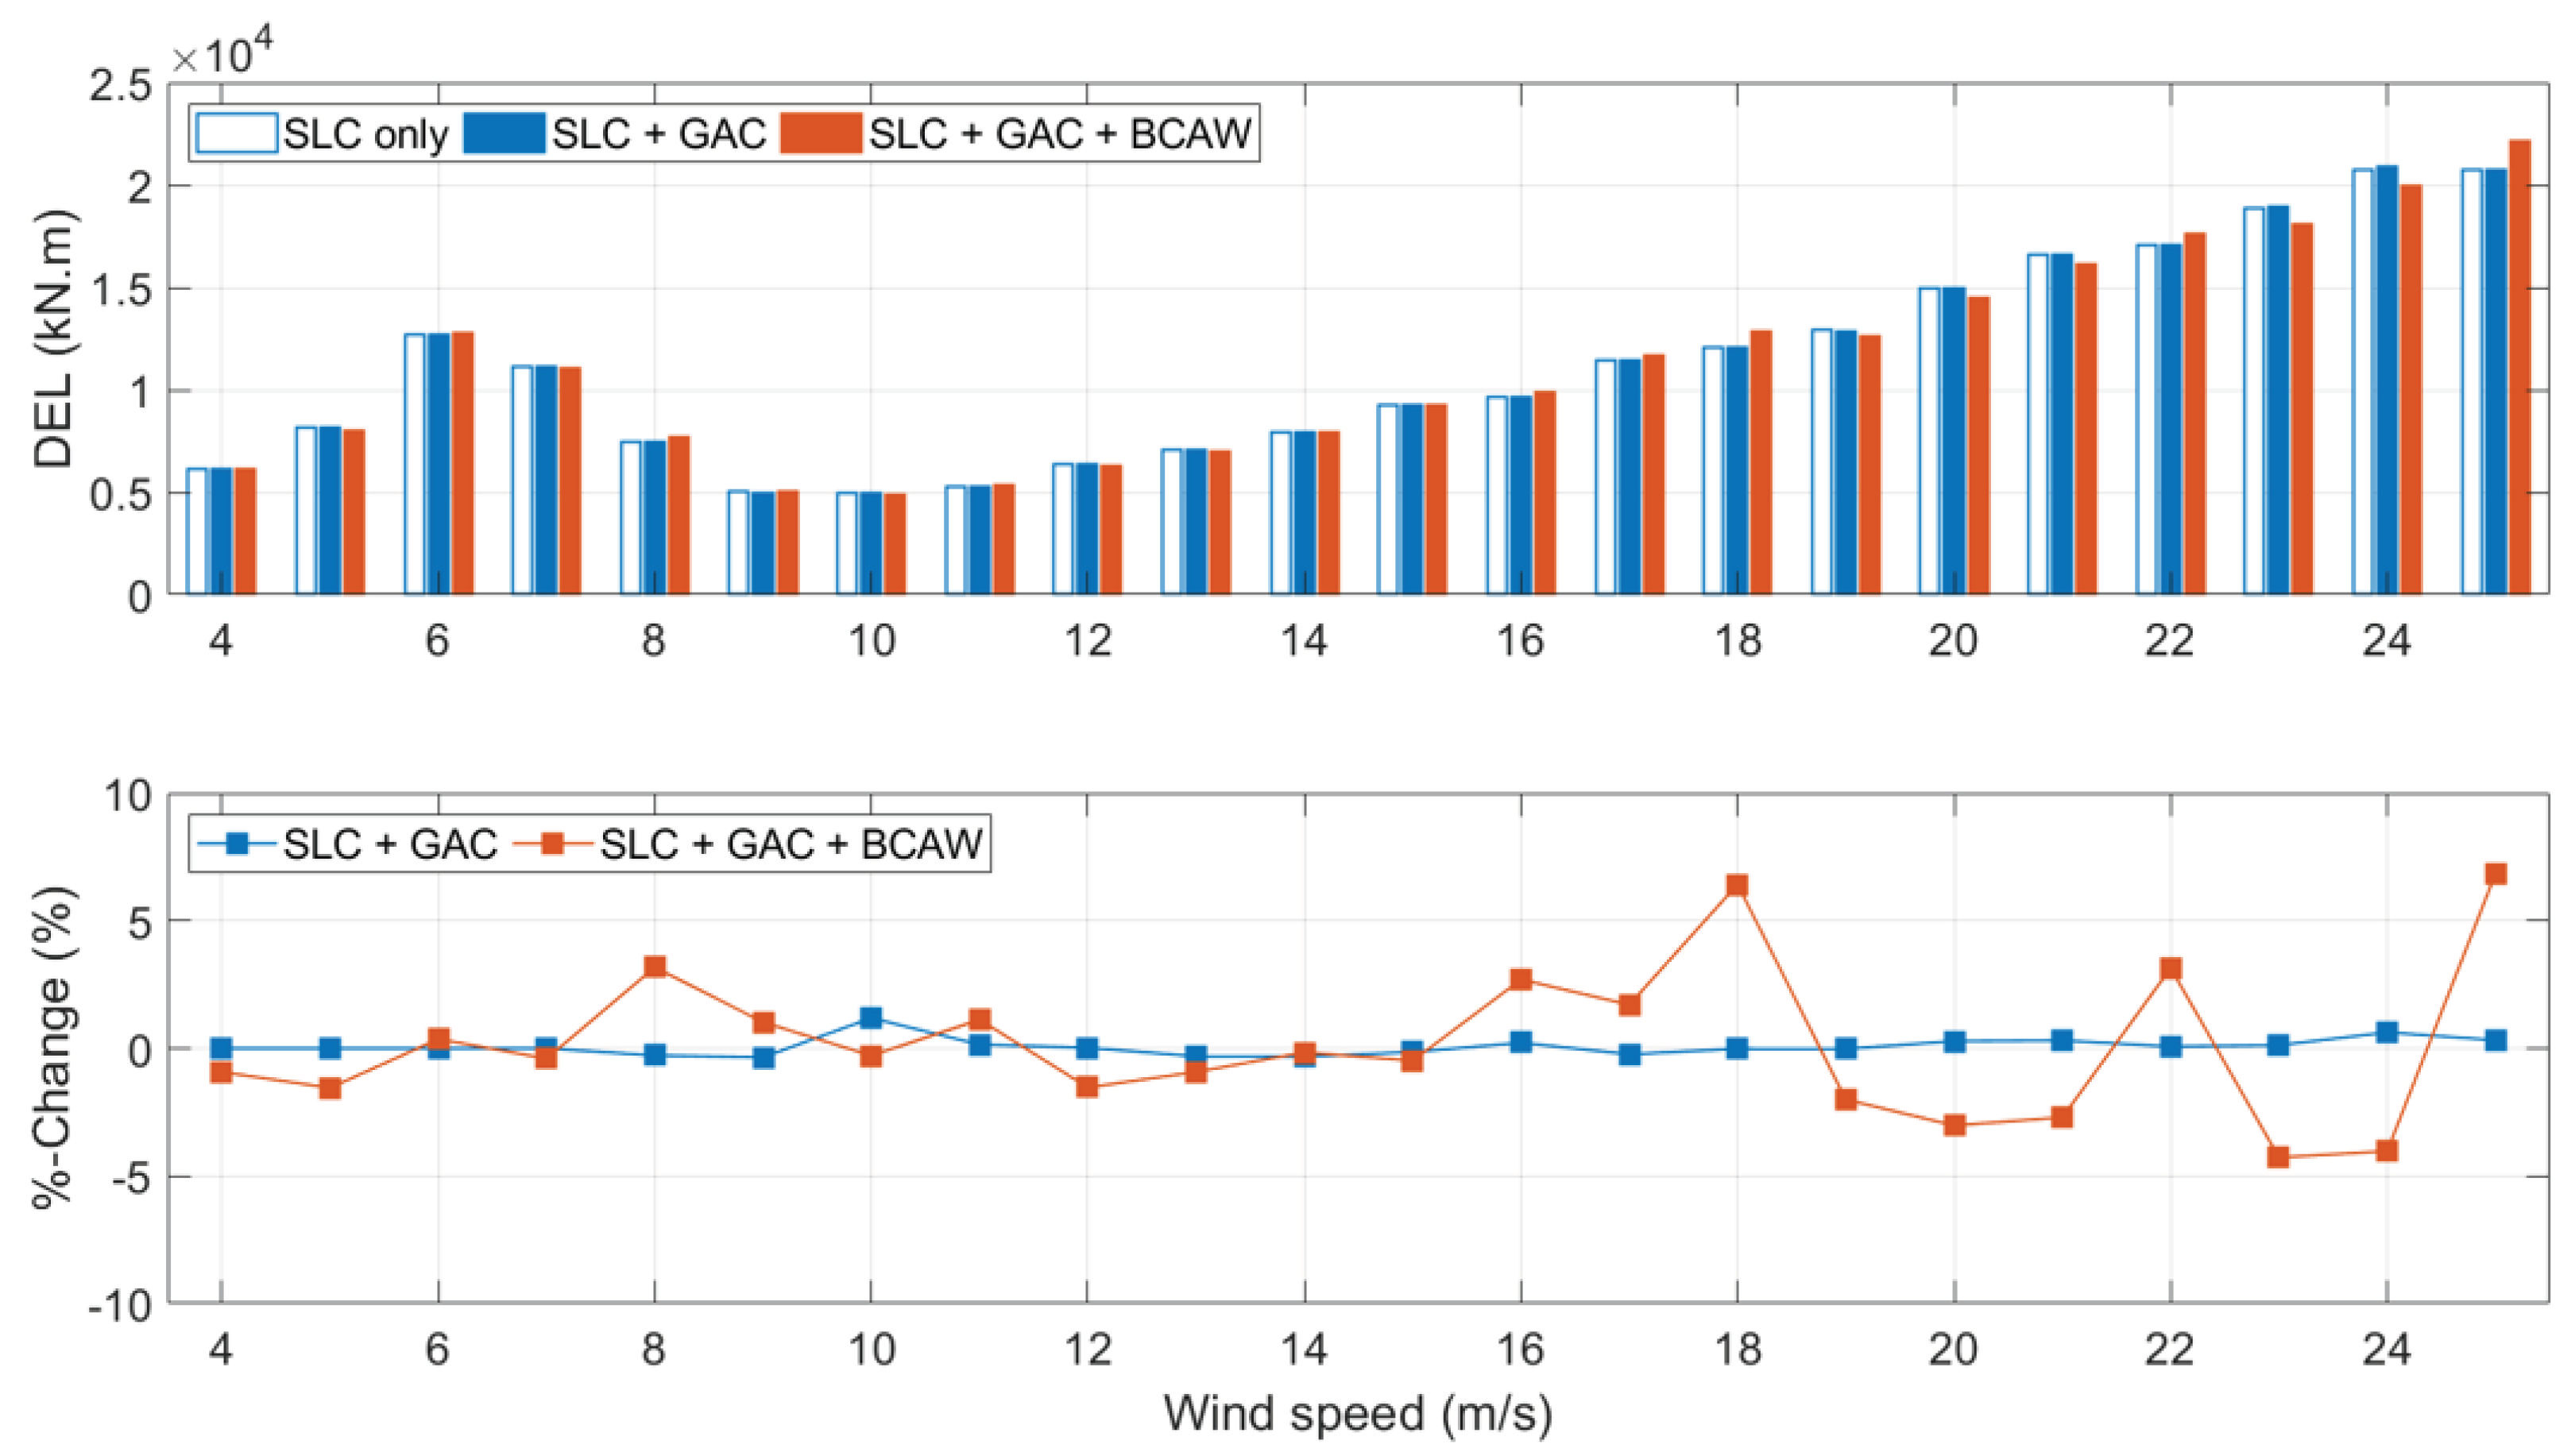
Fatigue loads are also evaluated with different controller configurations under normal turbulence wind conditions. Figure 13 shows the DEL variations at the blade root and tower base with different control architectures. Overall, the metrics are either reduced or remain at the same level.
By comparing the ‘SLC Only’ with the ‘SLC + GAC’, we observe that the GAC does not affect the flapwise blade root bending moment DELs in any significant way. There is an approximate 2% reduction in tower base DELs. Therefore, the GAC has a slight positive effect on tower fatigue loads. Adding the BCAW results in significant DEL reductions in blade root flapwise bending moments and tower base fore-aft bending moments as compared to the baseline (‘SLC Only’). The DELs of blade root flapwise bending moments and tower base fore-aft bending moments have extra 6.9% and 6.2% reductions as compared to the ‘SLC Only’. The other two metrics show less than 1% change.
Further results on turbine performance, fatigue loads and extreme peak values (from cut-in to cut-out wind speed) are presented in Appendix B. These additional evaluations are conducted following the IEC standard Design Load cases 1.2, 1.3 and 1.5, as listed in Table A4. In this way, all the conditions required by the ‘power production’ case of the IEC standard are evaluated with our proposed controller.

6. Conclusions

This paper describes a methodology for the design and evaluation of a feedback control system using lift actuators to alleviate extreme loads and deflections under gust wind. It also describes a switching scheme to integrate the GAC into turbines with the fatigue load controller (SLC) to achieve extreme loads and deflections reduction while maintaining the fatigue load reduction capability. Moreover, modifications in the turbine controller (ROSCO) are proposed to further reduce extreme loads and deflections and to improve turbine performance.
Key features of the method presented include:
  • The GAC uses simple switching logic with hysteresis to activate the GAC under extreme loads only and does not affect the normal operation of the turbine equipped with SLC.
  • The optimal thresholds for the GAC are selected based on a weighted sum of the normalized evaluation metrics.
  • The performance evaluation is based on the IEC standard. Simulations are conducted under gust wind conditions to evaluate the extreme loads and deflections. Turbulent wind condition simulations are conducted to evaluate the GAC’s effects on power production, turbine performance and fatigue loads.
The method is demonstrated with a 3.4-MW turbine [3] modified to incorporate sectional lift actuation on each blade. Based on the results of this study, the GAC can reduce the primary extreme loads and deflections by up to 10% under the ECD gust wind. The secondary loads and deflections are either reduced or unchanged. Moreover, the GAC does not affect the turbine performance and fatigue loads in any significant way under the normal turbulent wind.
The modified turbine controller (with BCAW) can further reduce the extreme loads and deflections by up to 23%. The extreme values of most of the primary and secondary metrics are reduced as compared to cases without BCAW, except the blade tip in-plane deflection which remains at the same level as the ‘SLC Only’ case. For turbine performance, adding the BCAW can reduce the standard deviation of rotor speed, pitch angle and generator power by up to 6.2%. The reduction in STD means the turbine’s key outputs such as power, rotor speed and blade pitch exhibit less fluctuation. The ‘SLC + GAC + BCAW’ case also shows extra reductions in fatigue loads measured by DELs. The blade root flapwise and tower base fore-aft bending moment DELs show up to 6.9% reduction under turbulent wind as compared to the ‘SLC Only’ case.

Author Contributions

Conceptualization, C.L. and A.G.; methodology, C.L., A.G. and M.A.R.; software, C.L. and A.G.; validation, C.L., A.G. and M.A.R.; formal analysis, C.L.; resources, M.A.R.; data curation, C.L.; writing—original draft preparation, C.L. and A.G.; writing—review and editing, A.G. and M.A.R.; visualization, C.L. and A.G.; supervision, M.A.R.; project administration, M.A.R.; funding acquisition, M.A.R. All authors have read and agreed to the published version of the manuscript.

Funding

The research presented herein was funded by the US Department of Energy Advanced Research Projects Agency-Energy (ARPA-E) under the Active Aerodynamic Load Control for Wind Turbines project (award number DE-AR0001011). Any opinions, findings, and conclusions, or recommendations expressed in this material are those of the authors and do not necessarily reflect the views of ARPA-E.

Institutional Review Board Statement

Not applicable.

Informed Consent Statement

Not applicable.

Data Availability Statement

Data are available upon request from corresponding author, if allowed by funding agency.

Acknowledgments

The authors are grateful for the ongoing support of Arctura, Inc.; in particular, Neal Fine and John Cooney, regarding DBD plasma actuator system development.

Conflicts of Interest

The authors declare no conflict of interest. The funders had no role in the design of the study; in the collection, analyses, or interpretation of data; in the writing of the manuscript; or in the decision to publish the results.

Abbreviations

The following abbreviations are used in this manuscript:
AFCActive Flow Control
BCAWBack-Calculation Anti-Windup
DBDDielectric Barrier Discharge
DELDamage Equivalent Load
DLCDesign Load Case
ECDExtreme Coherent guest with Direction change
ETMExtreme Turbulence Model
EWSExtreme Wind Shear
GACGust Alleviation Controller
IECInternational Electrotechnical Commission
IFCIndividual Flap Control
IPCIndividual Pitch Control
LCOELevelized Cost Of Energy
MBCMulti-Blade Coordinate (Transformation)
NRELNational Renewable Energy Laboratory
NTMNormal Turbulence Model
ROSCOReference Open-Source Controller
SLASectional Lift Actuator
SLCSectional Lift Controller
STDStandard Deviation
TSRTip Speed Ratio

Appendix A. Controller Parameters

The values of the parameters of the controllers shown in Figure 6 and Figure 7 are summarized in this appendix. Table A1, Table A2 and Table A3 provide the parameter values of ROSCO, SLC, and GAC, respectively.
Table A1. ROSCO controller parameters.
VariableValueUnitDescription
k p , T −1.0757e+03N·m/(rad/s)Torque controller proportional gain
k i , T 1.3436e+02N·m/radTorque controller integral gain
k a w , T 1.2490e-011/sTorque controller anti-windup gain
τ s a t [0, 2.9317e+04]N·mTorque controller saturation
τ r a t e [−1.5000e+04, 1.5000e+04]N·m/sTorque controller rate limit
k p , P [−3.8010e-03, −3.6420e-03, −3.4890e-03, −3.3410e-03, −3.1990e-03, −3.0600e-03, −2.9270e-03, −2.7970e-03, −2.6720e-03, −2.5510e-03, −2.4330e-03, −2.3190e-03, −2.2080e-03, −2.1000e-03, −1.9960e-03, −1.8940e-03, −1.7950e-03, −1.6990e-03, −1.6060e-03, −1.5150e-03, −1.4260e-03, −1.3400e-03, −1.2560e-03, −1.1740e-03]N·m/(rad/s)Pitch controller scheduled proportional gains
k i , P [−5.3000e-04, −5.2100e-04, −5.1200e-04, −5.0300e-04, −4.9500e-04, −4.8700e-04, −4.7900e-04, −4.7100e-04, −4.6400e-04, −4.5700e-04, −4.5000e-04, −4.4300e-04, −4.3600e-04, −4.3000e-04, −4.2400e-04, −4.1800e-04, −4.1200e-04, −4.0600e-04, −4.0100e-04, −3.9600e-04, −3.9000e-04, −3.8500e-04, −3.8000e-04, −3.7500e-04]N·m/radPitch controller scheduled integral gains
β P [8.0339e-02, 1.1328e-01, 1.3950e-01, 1.6187e-01, 1.8194e-01, 2.0026e-01, 2.1742e-01, 2.3321e-01, 2.4870e-01, 2.6323e-01, 2.7738e-01, 2.9087e-01, 3.0419e-01, 3.1697e-01, 3.2959e-01, 3.4164e-01, 3.5353e-01, 3.6545e-01, 3.7690e-01, 3.8842e-01, 3.9973e-01, 4.1064e-01, 4.2135e-01, 4.2761e-01]radPitch angles for gain scheduling
k a w , P 1.3947e-011/sPitch controller anti-windup gain
β s a t [0, 90]degPitch controller saturation
β r a t e [−7, 7]deg/sPitch controller rate limit
Table A2. SLC controller parameters from [9].
VariableValueUnitDescription
Δ C L [−0.2, 0.2]-Lift actuator limits
K a w 100-SLC anti-windup gain
ω 0 0.37rad/sSLC bandwidth
G ( 0 ) 2.7033 e 03 1.2389 e 03 1.2486 e 03 2.7590 e 03 kN·mDC-gain matrix
HI (Identity Matrix)-Robust controller gain matrix
Table A3. GAC controller parameters.
VariableValueUnitDescription
u G A C −0.2-Predefined GAC command
T l o w e r 8.0000e+03kN·mGAC lower threshold
T u p p e r 1.0000e+04kN·mGAC upper threshold

Appendix B. Power Production DLCs Results

The DLCs listed in the ‘power production’ case of the IEC standard are evaluated. The turbine performance and fatigue loads are evaluated from cut-in to cut-out wind speeds under normal turbulence model following DLC 1.2. The turbine performance results are plotted in Figure A1, Figure A2 and Figure A3 and the DEL results are shown in Figure A4, Figure A5, Figure A6 and Figure A7. Maximum transient (peak) values are evaluated across the entire wind speed envelope under Extreme Turbulence Model (ETM) from DLC 1.3 and Extreme Wind Shear (EWS) from DLC 1.5. Peak values of DLC 1.3 and DLC 1.5 are plotted in Figure A8 and Figure A9, respectively.
Table A4. Design load cases evaluated in this appendix.
DLCWind ModelWind SpeedType of AnalysisDuration
1.2NTM4:1:25 m/sFatigue 8 × 600 s
1.3ETM4:1:25 m/sUltimate 8 × 600 s
1.5EWS4:1:25 m/sUltimate20 s
For turbine performance under DLC 1.2, Figure A1 shows the mean and standard deviation of power. The mean power outputs of ‘SLC + GAC’ and ‘SLC + GAC + BCAW’ are virtually the same as the ‘SLC only’ case. The standard deviation decreases in the region from 8 to 12 m/s mean wind speed for the ‘SLC + GAC + BCAW’ case, which implies reduced power fluctuation. However, a smaller increase in the standard deviation is observed in the range of 14 to 15 m/s mean wind speed. Figure A2 shows the mean and standard deviation of rotor speed. The mean rotor speed is unaffected across the entire wind speed envelope. The rotor speed standard deviation is reduced by up to 13% with ‘SLC + GAC + BCAW’ in the transition region from 8 to 15 m/s, which implies a more stable operating condition. Figure A3 shows the mean and standard deviation of the pitch. The mean pitch angle is increased for the case ‘SLC + GAC + BCAW’ close to the rated wind speed as the BCAW brings the pitch command out of saturation faster than standard ROSCO. Reduced standard deviation is observed from 10 to 15 m/s mean wind speed, which suggests reduced pitch angle fluctuations. With the BCAW, the pitch controller is activated at 7 m/s mean wind speed since the mean pitch is not equal to the minimum pitch angle. As a result, the %-change in standard deviation at 7 m/s is not meaningful and is omitted in the plot.
Figure A1. Variation of the mean and standard deviation of the power from cut-in to cut-out wind speed under DLC 1.2 with different control architectures. Top—Dimensional values; Bottom—Percentage changes with respect to the ‘SLC Only’ case.
Energies 15 06474 g0a1
Figure A2. Variation of the mean and standard deviation of the rotor speed from cut-in to cut-out wind speed under DLC 1.2 with different control architectures. Top—Dimensional values; Bottom—Percentage changes with respect to the ‘SLC Only’ case.
Energies 15 06474 g0a2
Figure A3. Variation of the mean and standard deviation of the pitch from cut-in to cut-out wind speed under DLC 1.2 with different control architectures. Top—Dimensional values; Bottom—Percentage changes with respect to the ‘SLC Only’ case.
Energies 15 06474 g0a3
For the fatigue analysis under DLC 1.2, Figure A4 shows the DELs of the blade root flapwise bending moments. The ‘SLC + GAC + BCAW’ shows up to a 9% DEL reduction in the transition region. Figure A5 shows that the DELs of blade root edgewise bending moments are not affected. Figure A6 shows the DELs of tower base fore-aft bending moments. A reduction of up to 8% is observed in the transition region with ‘SLC + GAC + BCAW’. Figure A7 shows the DELs of tower base side-side bending moments. Overall, the DELs are at the same level as the ‘SLC only’ case. However, fluctuations are observed for ‘SLC + GAC + BCAW’.
Figure A4. Variation of the DELs of the blade root flapwise bending moments from cut-in to cut-out wind speed under DLC 1.2 with different control architectures. Top—Dimensional DELs; Bottom—Percentage changes with respect to the ‘SLC Only’ case.
Energies 15 06474 g0a4
Figure A5. Variation of the DELs of the blade root edgewise bending moments from cut-in to cut-out wind speed under DLC 1.2 with different control architectures. Top—Dimensional DELs; Bottom—Percentage changes with respect to the ‘SLC Only’ case.
Energies 15 06474 g0a5
Figure A6. Variation of the DELs of the tower base fore-aft bending moments from cut-in to cut-out wind speed under DLC 1.2 with different control architectures. Top—Dimensional DELs; Bottom—Percentage changes with respect to the ‘SLC Only’ case.
Energies 15 06474 g0a6
Figure A7. Variation of the DELs of the tower base side-side bending moments from cut-in to cut-out wind speed under DLC 1.2 with different control architectures. Top—Dimensional DELs; Bottom—Percentage changes with respect to the ‘SLC Only’ case.
Energies 15 06474 g0a7
Figure A8 shows the peak values of all metrics under DLC 1.3. Peak values are either reduced or remain at the same level for ‘SLC + GAC’. Further reductions of some metrics (up to 20%) are observed with ‘SLC + GAC + BCAW’. The peak values of blade root edgewise bending moment and in-plane deflection increase by slightly (2 and 3%, respectively).
Figure A8. Variation of the maximum absolute transient (peak) values of the primary and secondary metrics under DLC 1.3 with different control architectures. Top—Peak dimensional values; Bottom—Percentage changes with respect to ‘SLC Only’ case.
Energies 15 06474 g0a8
For DLC 1.5, Figure A9 shows the peak values of all metrics. Peak values remain at the same level as the ‘SLC only’ case except for tower side-side bending. Despite this small percentage increase in the tower side-side bending moment for the ‘SLC + GAC + BCAW’, its dimensional value is lower than the peak value from DLC 1.3, which is the highest among all cases considered.
Figure A9. Variation of the maximum absolute transient (peak) values of the primary and secondary metrics under DLC 1.5 with different control architectures. Top—Peak dimensional values; Bottom—Percentage changes with respect to ‘SLC Only’ case.
Energies 15 06474 g0a9

References

  1. Veers, P.; Bottasso, C.; Manuel, L.; Naughton, J.; Pao, L.; Paquette, J.; Robertson, A.; Robinson, M.; Ananthan, S.; Barlas, A.; et al. Grand Challenges in the Design, Manufacture, and Operation of Future Wind Turbine Systems. Wind Energy Sci. Discuss. 2022, 2022, 1–102. [Google Scholar] [CrossRef]
  2. Pao, L.Y.; Zalkind, D.S.; Griffith, D.T.; Chetan, M.; Selig, M.S.; Ananda, G.K.; Bay, C.J.; Stehly, T.; Loth, E. Control co-design of 13 MW downwind two-bladed rotors to achieve 25% reduction in levelized cost of wind energy. Annu. Rev. Control 2021, 51, 331–343. [Google Scholar] [CrossRef]
  3. Chetan, M.; Sakib, M.S.; Griffith, D.T.; Gupta, A.; Rotea, M.A. Design of a 3.4-MW wind turbine with integrated plasma actuator-based load control. Wind Energy 2022, 25, 517–536. [Google Scholar] [CrossRef]
  4. Bossanyi, E.A. Individual Blade Pitch Control for Load Reduction. Wind Energy 2003, 6, 119–128. [Google Scholar] [CrossRef]
  5. Stol, K.A.; Zhao, W.; Wright, A.D. Individual Blade Pitch Control for the Controls Advanced Research Turbine (CART). J. Sol. Energy Eng. 2006, 128, 498–505. [Google Scholar] [CrossRef]
  6. Bottasso, C.L.; Croce, A.; Riboldi, C.E.D.; Salvetti, M. Cyclic pitch control for the reduction of ultimate loads on wind turbines. J. Phys. Conf. Ser. 2014, 524, 012063. [Google Scholar] [CrossRef]
  7. Schwack, F.; Halmos, F.; Stammler, M.; Poll, G.; Glavatskih, S. Wear in wind turbine pitch bearings—A comparative design study. Wind Energy 2022, 25, 700–718. [Google Scholar] [CrossRef]
  8. Liu, C.; Li, Y.; Cooney, J.A.; Fine, N.E.; Rotea, M.A. NREL FAST Modeling for Blade Load Control with Plasma Actuators. In Proceedings of the 2018 IEEE Conference on Control Technology and Applications (CCTA), Copenhagen, Denmark, 21–24 August 2018; pp. 1644–1649. [Google Scholar] [CrossRef]
  9. Gupta, A.; Rotea, M.A.; Chetan, M.; Sakib, M.S.; Griffith, D.T. A Methodology for Robust Load Reduction in Wind Turbine Blades Using Flow Control Devices. Energies 2021, 14, 3500. [Google Scholar] [CrossRef]
  10. Gupta, A.; Rotea, M.A. Higher-Harmonic Load Control of Wind Turbine Blades with Actuator Saturation. In Proceedings of the 2021 American Control Conference (ACC), New Orleans, LA, USA, 25–28 May 2021; pp. 545–551. [Google Scholar] [CrossRef]
  11. Veers, P.S.; Ashwill, T.D.; Sutherland, H.J.; Laird, D.L.; Lobitz, D.W.; Griffin, D.A.; Mandell, J.F.; Musial, W.D.; Jackson, K.; Zuteck, M.; et al. Trends in the Design, Manufacture and Evaluation of Wind Turbine Blades. Wind Energy 2003, 6, 245–259. [Google Scholar] [CrossRef]
  12. Lackner, M.A.; van Kuik, G.A.M. The Performance of Wind Turbine Smart Rotor Control Approaches During Extreme Loads. J. Sol. Energy Eng. 2010, 132, 011008. [Google Scholar] [CrossRef]
  13. Bernhammer, L.O.; van Kuik, G.A.; De Breuker, R. Fatigue and extreme load reduction of wind turbine components using smart rotors. J. Wind Eng. Ind. Aerodyn. 2016, 154, 84–95. [Google Scholar] [CrossRef]
  14. Kanev, S.; van Engelen, T. Wind turbine extreme gust control. Wind Energy 2010, 13, 18–35. [Google Scholar] [CrossRef]
  15. Carcangiu, C.; Pujana-Arrese, A.; Mendizabal, A.; Pineda, I.; Landaluze, J. Wind gust detection and load mitigation using artificial neural networks assisted control. Wind Energy 2014, 17, 957–970. [Google Scholar] [CrossRef]
  16. Schlipf, D.; Schlipf, D.J.; Kühn, M. Nonlinear model predictive control of wind turbines using LIDAR. Wind Energy 2013, 16, 1107–1129. [Google Scholar] [CrossRef]
  17. Barlas, T.; Pettas, V.; Gertz, D.; Madsen, H.A. Extreme load alleviation using industrial implementation of active trailing edge flaps in a full design load basis. J. Phys. Conf. Ser. 2016, 753, 042001. [Google Scholar] [CrossRef]
  18. Abbas, N.J.; Zalkind, D.S.; Pao, L.; Wright, A. A reference open-source controller for fixed and floating offshore wind turbines. Wind Energy Sci. 2022, 7, 53–73. [Google Scholar] [CrossRef]
  19. International Electrotechnical Commission. Wind Turbines—Part 1: Design Requirements; Technical Report IEC 61400-1:2005; International Electrotechnical Commission: Geneva, Switzerland, 2005. [Google Scholar]
  20. Bortolotti, P.; Tarrés, H.C.; Dykes, K.; Merz, K.; Sethuraman, L.; Verelst, D.; Zahle, F. Systems Engineering in Wind Energy—WP2. 1 Reference Wind Turbines; Technical Report NREL/TP-5000-73492; National Renewable Energy Lab. (NREL): Golden, CO, USA, 2019. [Google Scholar]
  21. Jonkman, J. The New Modularization Framework for the FAST Wind Turbine CAE Tool. In Proceedings of the 51st AIAA Aerospace Sciences Meeting including the New Horizons Forum and Aerospace Exposition, Grapevine, TX, USA, 7–10 January 2013; p. 202. [Google Scholar] [CrossRef]
  22. Buhl, M. IECWind: Version 5.01.02. Available online: https://www.nrel.gov/wind/nwtc/iecwind.html (accessed on 27 August 2022).
  23. Jonkman, B.J. Turbsim User’s Guide: Version 1.50; Technical Report NREL/TP-500-46198; National Renewable Energy Lab. (NREL): Golden, CO, USA, 2009. [Google Scholar] [CrossRef] [Green Version]
  24. Hayman, G. MLife Theory Manual for Version 1.00; National Renewable Energy Lab. (NREL): Gold, CO, USA, 2012; Volume 74, p. 106. [Google Scholar]
  25. Jonkman, J.; Butterfield, S.; Musial, W.; Scott, G. Definition of a 5-MW Reference Wind Turbine for Offshore System Development; Technical Report NREL/TP-500-38060; National Renewable Energy Lab. (NREL): Golden, CO, USA, 2009. [Google Scholar]
  26. Åström, K.J.; Hägglund, T.; Astrom, K.J. Advanced PID Control; ISA-The Instrumentation, Systems, and Automation Society: Research Triangle Park, NC, USA, 2006; Volume 461. [Google Scholar]
  27. Bohn, C.; Atherton, D. An analysis package comparing PID anti-windup strategies. IEEE Control Syst. Mag. 1995, 15, 34–40. [Google Scholar] [CrossRef]
Figure 1. Lift coefficient of the original and modified blade section with lift actuator.
Energies 15 06474 g001
Figure 2. Turbine blade plot with chord length and actuated section.
Energies 15 06474 g002
Figure 3. Block diagram of ROSCO.
Energies 15 06474 g003
Figure 4. Wind speed vector plot.
Energies 15 06474 g004
Figure 5. Blade root flapwise bending moments under three ECD wind conditions.
Energies 15 06474 g005
Figure 6. Block diagram of GAC and SLC with hysteresis switching logic commanded by maximum absolute values of flapwise bending moments. SLC from [9].
Energies 15 06474 g006
Figure 7. (a) Block diagram of the PI controller in ROSCO. (b) Block diagram of the PI controller with back calculation anti-windup.
Energies 15 06474 g007
Figure 8. Torque and pitch variations with and without BCAW under gust wind.
Energies 15 06474 g008
Figure 9. Contour plots for peak values of the primary evaluation criteria.
Energies 15 06474 g009
Figure 10. Weighted sum of the %-changes of the primary criteria.
Energies 15 06474 g010
Figure 11. Variation of the maximum absolute transient (peak) values of the primary and secondary metrics under gust wind with different control architectures. Top—Peak dimensional values; Bottom—Percentage changes with respect to ‘SLC Only’ case.
Energies 15 06474 g011
Figure 12. Variation of the mean and standard deviation of the power, rotor speed and pitch angle under normal turbulence wind with different control architectures. Top—Dimensional values; Bottom—Percentage changes with respect to the ‘SLC Only’ case.
Energies 15 06474 g012
Figure 13. Variation of the DELs of the blade root and tower base bending moments under normal turbulence wind with different control architectures. Top—Dimensional DELs; Bottom—Percentage changes with respect to ‘SLC Only’ case.
Energies 15 06474 g013
Table 1. Properties of IEA 3.4A turbine model.
ParameterValue
Class and CategoryIEC Class 3A
Rated Power3.4 MW
Rated Rotor Speed11.75 rpm
Rotor OrientationUpwind
Gear Ratio97
Rotor Diameter130 m
Hub Height110 m
Cut-in, Rated, Cut-out Wind Speed4 m/s, 9.8 m/s, 25 m/s
Table 2. Design load cases evaluated in this study.
DLCWind ConditionType of AnalysisDuration
1.2NTM V rated Fatigue 6 × 600 s
1.4ECD V rated Ultimate20 s
Table 3. Metrics for evaluation.
Evaluation CriteriaComments
Worst-case transient values under gust wind
Blade root flapwise bending moments (Flapwise)Primary
Blade root edgewise bending moments (Edgewise)Primary
Blade tip out-of-plane deflections (OoP Defl)Primary
Rotor speed (Rot Speed)Primary
Tower base fore-aft bending moment (Tower FA)Secondary
Tower base side-side bending moment (Tower SS)Secondary
Drive train torsional moment (DT Torsion)Secondary
Blade tip in-plane deflections (IP Defl)Secondary
Turbine performance under normal turbulence wind
Generator power (mean and STD)Secondary
Rotor speed (mean and STD)Secondary
Pitch activity (mean and STD)Secondary
Publisher’s Note: MDPI stays neutral with regard to jurisdictional claims in published maps and institutional affiliations.

