Article

Research on Underground Coal Mine Map Construction Method Based on LeGO-LOAM Improved Algorithm

1
School of Mechanical Electronic and Information Engineering, China University of Mining and Technology, Beijing 100083, China
2
Key Laboratory of Intelligent Mining and Robotics, Ministry of Emergency Management, Beijing 100083, China
3
Institute of Intelligent Mining and Robotics, China University of Mining and Technology, Beijing 100083, China
*
Author to whom correspondence should be addressed.
Energies 2022, 15(17), 6256; https://doi.org/10.3390/en15176256
Submission received: 19 July 2022 / Revised: 23 August 2022 / Accepted: 25 August 2022 / Published: 27 August 2022
(This article belongs to the Special Issue Intelligent Coal Mining Technology)

Abstract

:
The application of intelligent equipment and technologies such as robots and unmanned vehicles is an important part of the construction of intelligent mines, and has become China’s national coal energy development strategy and the consensus of the coal industry. Environment perception and instant positioning is one of the key technologies destined to realize unmanned and autonomous navigation in underground coal mines, and simultaneous location and mapping (SLAM) is an effective method of deploying this key technology. The underground space of a coal mine is long and narrow, the environment is complex and changeable, the structure is complex and irregular, and the lighting is poor. This is a typical unstructured environment, which poses a great challenge to SLAM. This paper summarizes the current research status of underground coal mine map construction based on visual SLAM and Lidar SLAM, and analyzes the defects of the LeGO-LOAM algorithm, such as loopback detection errors or omissions. We use SegMatch to improve the loopback detection module of LeGO-LOAM, use the iterative closest point (ICP) algorithm to optimize the global map, then propose an improved SLAM algorithm, namely LeGO-LOAM-SM, and describe its principle and implementation. The performance of the LeGO-LOAM-SM was also tested using the KITTI dataset 00 sequence and SLAM experimental data collected in two coal mine underground simulation scenarios, and the performance indexes such as the map construction effect, trajectory overlap and length deviation, absolute trajectory error (ATE), and relative pose error (RPE) were analyzed. The results show that the map constructed by LeGO-LOAM-SM is clearer, has a better loopback effect, the estimated trajectory is smoother and more accurate, and the translation and rotation accuracy is improved by approximately 5%. This can construct more accurate point cloud map and low drift position estimation, which verifies the effectiveness and accuracy of the improved algorithm. Finally, to satisfy the navigation requirements, the construction method of a two-dimensional occupancy grid map was studied, and the underground coal mine simulation environment test was carried out. The results show that the constructed raster map can effectively filter out outlier noise such as dynamic obstacles, has a mapping accuracy of 0.01 m, and the required storage space compared with the point cloud map is reduced by three orders of magnitude. The research results enrich the SLAM algorithm and implementation in unstructured environments such as underground coal mines, and help to solve the problems of environment perception, real-time positioning, and the navigation of coal mine robots and unmanned vehicles.

1. Introduction

At present and for a long period of time in the future, the status of coal as the main energy in China will not change, and it is still the most important energy resource [1]. Approximately 90% of China’s coal resources are mined by underground mining, and more than 40% of the mines have a mining depth of more than 500 m. Vigorously promoting the application of intelligent equipment such as robots and unmanned vehicles technology in coal mines is an important part of the construction of intelligent coal mines, which has become the national energy development strategy and industry consensus. Simultaneous location and mapping (SLAM) one way of build a map of the complex underground coal mine environment and its own intelligent positioning, and is also a key technology for realizing the unmanned and mobile robots’ autonomous navigation and operation in underground coal mines [2]. It has also become a research hotspot for many scholars at home and abroad in recent years. The space of a coal mine underground parking lot is narrow and long, the environment is complex and changeable, the surrounding rock structure is complex and irregular, and the lighting conditions are poor. These characteristics are those of a typical semi-structured or unstructured environment, and the vehicle scheduling is complex, which puts forward higher requirements and challenges to SLAM.
SLAM was proposed by Peter Cheeseman [3] and Durrant-Whyte [4] in 1986 and is a popular research topic in mobile robotics [5,6]. According to the different sensors used, SLAM algorithms can be divided into two types: vision-based [7,8,9] and LiDAR-based [10,11,12]. A lot of work has been carried out on the development of SLAM technology for the underground coal mine environment. Chen Y. et al. [13] used airborne LiDAR SLAM technology to construct a map of the coal mine tunnel environment, using laser scan matching and an improved probabilistic incentive maximum likelihood estimation algorithm to generate a 3D tunnel model, which improved the accuracy of the map construction but suffered from higher costs and less information. M. Li et al. [14] proposed a real-time 3D SLAM based on normal distribution transform (NDT) and further improved the consistency of map building through bitmap optimization and closed-loop detection. Yang Lin et al. [15] studied a SLAM method for coal mine inspection robots, combining the adaptive Monte Carlo localization algorithm and optimized fast SLAM algorithm to improve the adaptivity of robot localization and the accuracy of map construction. Based on the study of the HectorSLAM algorithm, J. Yang et al. [16] proposed a method for modeling the mine roadway environment and locating the underground roadheader based on self-coupling and HectorSLAM. The adaptability of the HectorSLAM algorithm to the roadway environment was further improved. The accuracy of the algorithm in the roadway environment was improved. A. Cowley et al. [17] proposed an UPSLAM for maps based on panoramic depth images using LiDAR data and IMU data to build coal mine underground maps. For the navigation algorithm of a coal mine patrol UAV, combined with the complex coal mine environment, PMC-SLAM [18] designs a probabilistic membrane system model and membrane algorithm by analyzing mathematical models based on LiDAR, IMU and depth camera sensor as well. Zhuli Ren et al. [19,20] studied a lightweight loopback detection and SLAM optimization algorithm based on rules and generalized iterative nearest point (GICP) based on the characteristics of the roadway, using the roadway plane as a node constraint; the distance weight map was proposed for the first time and applied to underground coal mine localization. Since LiDAR does not depend on external lighting conditions or the radiation of the target itself, the LiDAR-based SLAM algorithm is more suitable for the underground coal mine environment. The map construction in an underground coal mine environment needs to balance real-time effectiveness and accuracy, and there are still many problems to be solved, and loopback detection is one of them.
Lidar odometry and mapping (LOAM) [21,22] is the most representative real-time 3D laser SLAM algorithm based on feature matching at present. It has a small amount of calculation and motion compensation, but there is no loopback detection, such as more drift error in large-scale testing. For loopback detection, local descriptors such as SHOT [23], ISHOT [24] and FPFH [25], whose re-identification usually requires keypoint extraction and large-scale local geometry computation, have low detection efficiency; global descriptors, such as GLAROT-3D [26], Scan Context [27], and LiDAR Iris [28], are better at detecting keypoints with high repeatability. In 2017, R. Dubé et al. [29] proposed the SegMatch algorithm for the segmentation matching and position recognition of 3D point clouds based on the work of Douillard and Nieto et al. [30,31]. SegMatch does not rely on the assumption of “perfect segmentation” or on the presence of “objects” in the environment, and can operate reliably in large-scale unstructured environments, allowing for efficient and robust loopback detection. Deep learning-based loopback detection methods, such as the current algorithm [32,33,34], still lack engineering utility when applied to autonomous underground coal mine navigation due to high arithmetic power requirements as well as the need for large amounts of training data, which are heavily dependent on the performance of the sample set.
In view of the shortcomings of the LOAM algorithm, Shan T et al. [35] added a loop detection method that combines ICP and European distance to find loop points, carried out lightweight and ground optimization processing on feature extraction, and proposed the LeGO-LOAM algorithm. It achieves similar or better accuracy with reduced computational resources. However, sometimes loop detection may have errors or identification omissions. In 2019, Ji x et al. [36] integrated the radar odometry of LOAM with the point cloud matching of SegMatch, and proposed the LiDAR SLAM algorithm of LLOAM with the loopback test function, which reduced the drift error and improved the mapping accuracy. In 2020, Shihan Ouyang [37] used a SegMatch class algorithm, which subscribes to and is called the low-drift, real-time coordinate transformation relationship published by the laser build node of the LOAM class algorithm, effectively improving the relative positional estimation accuracy of the SegMatch class algorithm in large-scale outdoor scenes. The previous work of our team [38] proposed an improved LeGO-LOAM algorithm based on scan context for real-time positioning and mapping in coal mines.
Although there have been studies on the fusion of LOAM-like algorithms and SegMatch-like algorithms to improve the accuracy of the algorithms accordingly, the related studies still have shortcomings. The literature [36] used SegMatch to achieve the loopback detection of LOAM, and the literature [37] only used the odometer information of LOAM-like algorithms when performing SLAM map building. For the coal mine underground vehicle yard environment, this paper optimizes the loopback detection module of LeGO-LOAM using the SegMatch algorithm, and performs global graph optimization using the ICP algorithm to propose a SLAM algorithm that fuses SegMatch and LeGO-LOAM, namely LeGO-LOAM-SM, and tests the performance of the improved algorithm through a public dataset, simulating a closed and narrow space The environment experimentally validates the algorithm’s localization and map building effects, and outputs a 3D octree occupancy grid map (octo-map) [39] and 2D occupancy grid map according to the navigation requirements in order to explore better SLAM algorithms to provide technical support for map building and unmanned driving in underground coal mine environments.

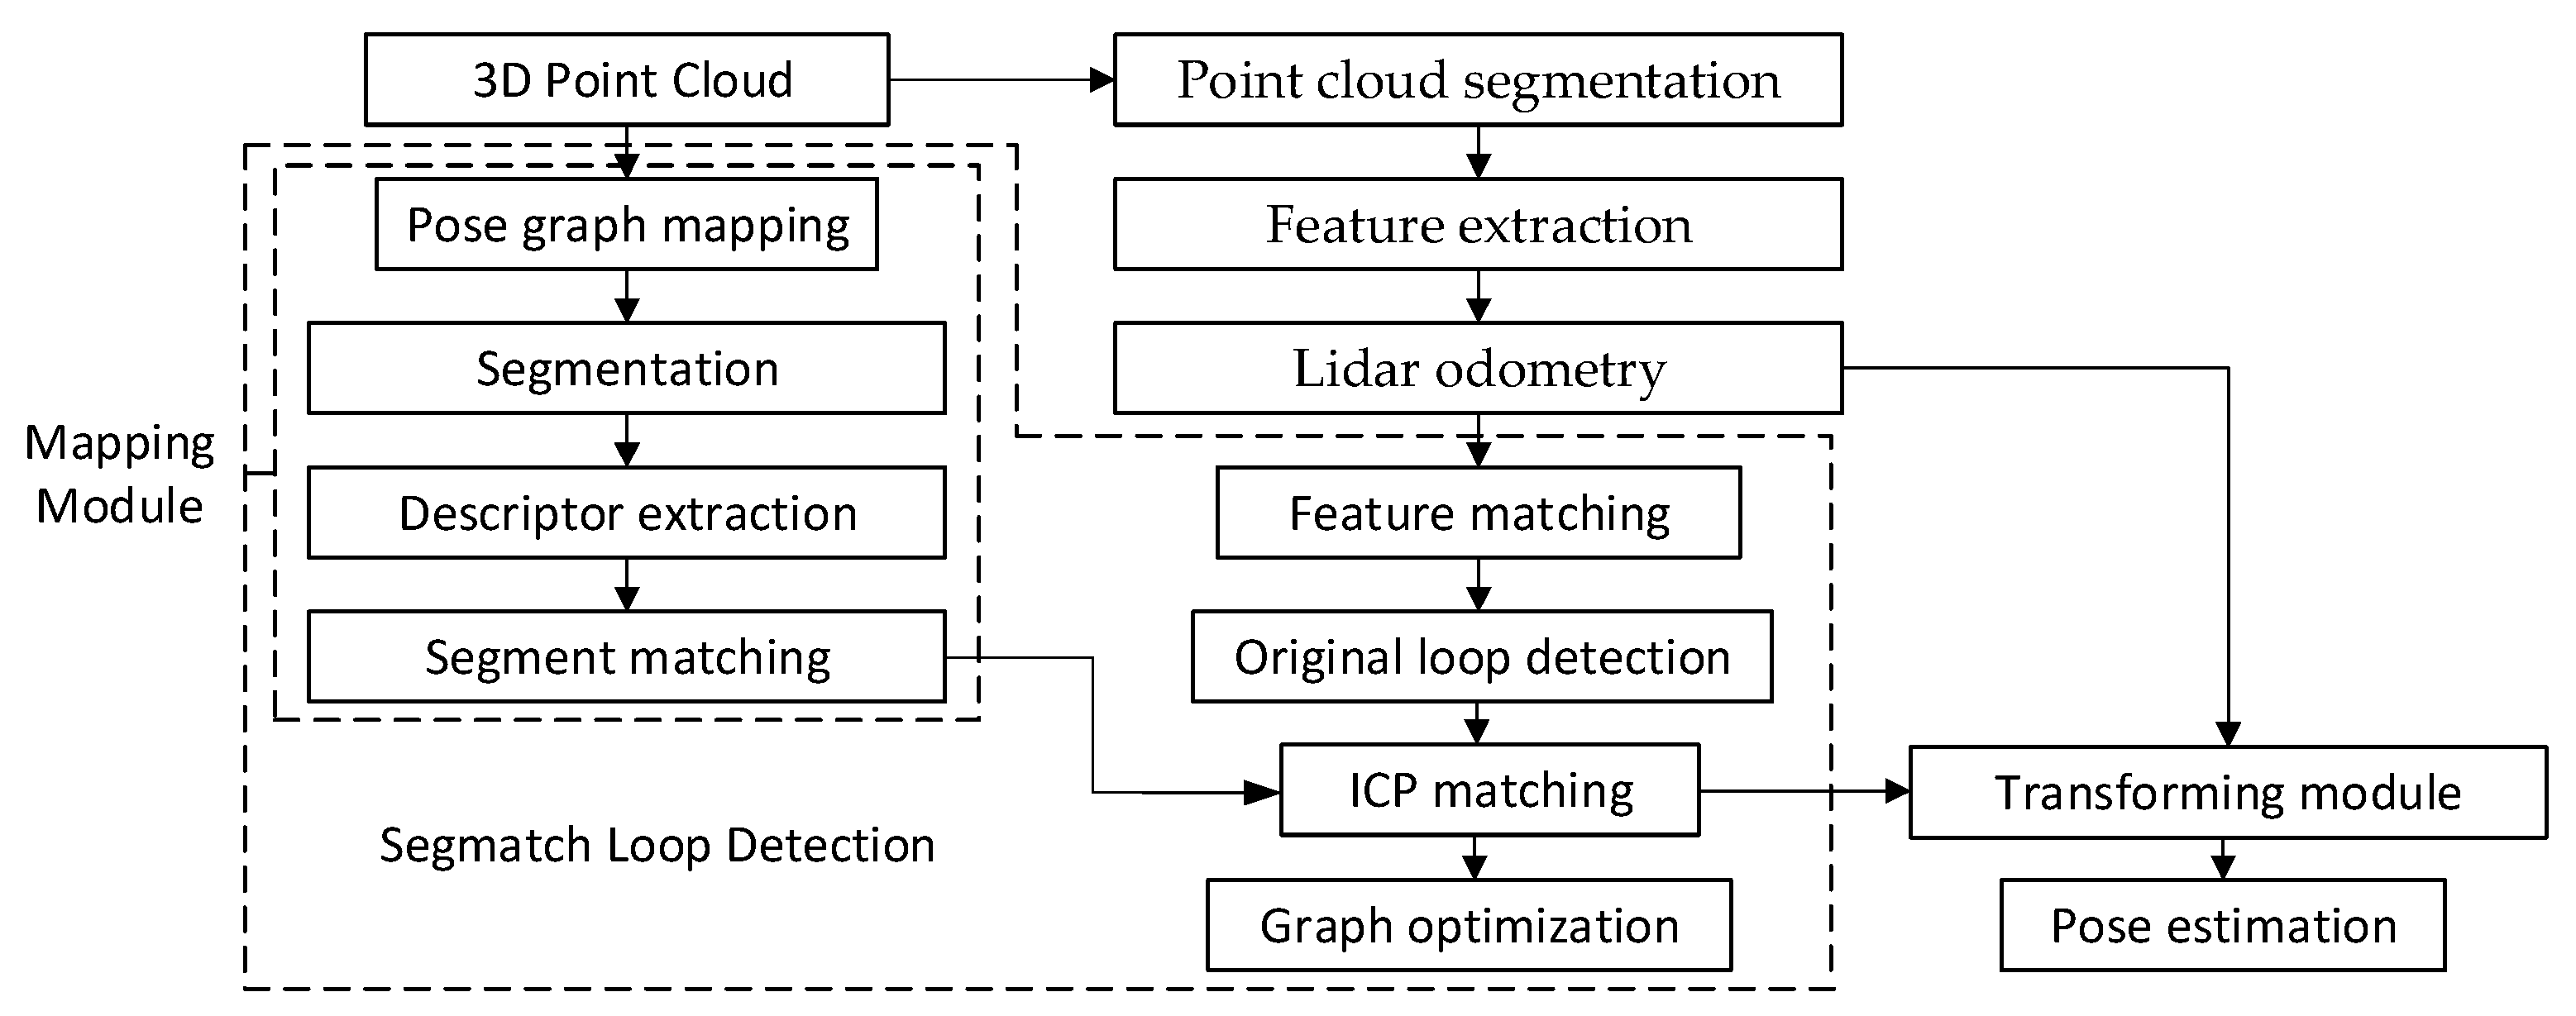
2. Algorithm Principle

The loopback detection function in the LeGO-LOAM algorithm is achieved by an ICP loopback detection algorithm based on Euclidean distance, which sometimes results in errors or recognition omissions. For this reason, this paper incorporates SegMatch loopback detection with high detection accuracy to improve the loopback detection of the traditional LeGO-LOAM algorithm, and proposes the LeGO-LOAM-SM algorithm for optimized global pose estimation. The block diagram of the improved algorithm is shown in Figure 1.
The point cloud segmentation, feature extraction and LiDAR odometry modules of the LeGO-LOAM-SM algorithm are partially identical to those of the LeGO-LOAM algorithm, details of which can be found in the literature [35], and here the focus is on the principles of the LiDAR map building module.
The LiDAR map building module first matches the extracted features with the local point cloud map and progressively refines the pose transformation, uses L-M optimization to obtain the final transformed poses and adds spatial constraints between the new nodes and historical ones in the point cloud map, before performing Euclidean distance-based loopback detection at a lower frequency, and finally uses ICP to match the point cloud of the current frame and the loopback frame and adds the new constraints. The pose image is then sent to GTSAM to optimize the map and update the pose estimation. Therein, the low-frequency loopback detection is based on the Euclidean distance. The KD Tree model is used to search the historical or similar poses of the current pose and several nearby point clouds to find several poses in the area with the current pose of the robot as the origin and the radius of 7 m, and determine whether the loop is satisfied by using the constraint that the time difference between the historical pose and the current pose is greater than 30 s. Due to the large amount of calculation and consideration of real-time and accuracy, a lower frequency is adopted. While SegMatch can performs loopback detection at a higher frequency.
(1)
Segmentation
SegMatch receives the 3D point cloud from the LiDAR and segments the point cloud into differentiated elements for matching. The ground plane is removed and the adjacent voxels are clustered using the vertical variance and the mean value. The remaining area is segmented into segments using Euclidean clustering, and noise that has no contributions for mapping is removed so as not to affect the mapping accuracy. The input point cloud is gridded, and the filtered point cloud is divided into multiple groups using the “Cluster-All Method”.
(2)
Feature extraction
After the point cloud is segmented, features are extracted from each segment to obtain a point cloud descriptor, and a classifier is used to determine whether two segments can be described as the same object or part of the same object. The point cloud, i.e., the source cloud, and the point cloud, i.e., the target cloud, scanned by the experimental platform at a certain moment, are segmented to extract the descriptor features, as shown in Figure 2, and different colors indicate the labels constructed for classification and identification during feature extraction after point cloud segmentation to facilitate subsequent feature matching.
(3)
Segment match
The descriptor feature is used to identify the matching relationship between the source point cloud and the target one. When multiple feature types are involved, it is usually difficult to select an appropriate distance metric and threshold using traditional methods, so the learning-based method is introduced. First, the candidate matching is retrieved by KD tree search, and then it is sent to the random forest classifier to determine whether the matching point cloud of the two parts represents the same object or a part of the object.
(4)
Geometric verification
The matching candidates are fed into the geometric verification model by using the random sampling consistency algorithm. The rotation matrix between two point clouds is estimated by splitting the centroid of the point cloud; the matching degree is checked according to the geometric consistency of the corresponding relationship. The consistent geometric information in the delineated point cloud cluster can be regarded as the same object. Figure 3 is a visual effect of geometric verification of extracted descriptors using SegMatch, and colors indicate different point cloud segmentation. It can be seen from the figure that object C and object D in the target cloud correspond to object A and object B in the source cloud and can be regarded as the same object.
(5)
Loopback detection
The target point cloud is established in real time for loopback detection, and the local point cloud is extracted in the neighborhood of the cylinder, the segmentation and feature extraction are performed once, and the generated source segmented point cloud is used for matching and building the target map. When the source segmentation point cloud is added to the target map, incomplete segmentation point clouds are removed and duplicate segmentation point clouds are deleted. When a loopback is detected, the robot’s trajectory is re-estimated and the position of the target point cloud is updated.
After the SegMatch step of aligning the segmentation point clouds and filtering out duplicate segments, the ICP is used to match the point clouds of the current frame and the loopback frame to add new constraints, send the pose map to GTSAM for bitmap optimization, and update the pose estimate. The transformation module corrects the LiDAR odometry module’s pose estimation with the pose estimation from the LiDAR mapping module, and the feature matching of the point cloud is used to derive the transformation matrix for the attitude update, resulting in the final pose estimation.

3. The KITTI Dataset Test

In order to verify the mapping effect of the LeGO-LOAM-SM algorithm, the KITTI dataset 00 sequence [40] is used to test the improved algorithm, and to compare and analyze the mapping effect, mapping trajectory, absolute trajectory error, relative pose error, and others. The test software environment is Ubuntu 18.04, ROS melodic, PCL 1.10, GTSAM 4.0.3, Python 2.7.17, and the hardware configuration is 8 GB RAM, Intel Core i3-4100M and NVIDIA GeForce 940M.

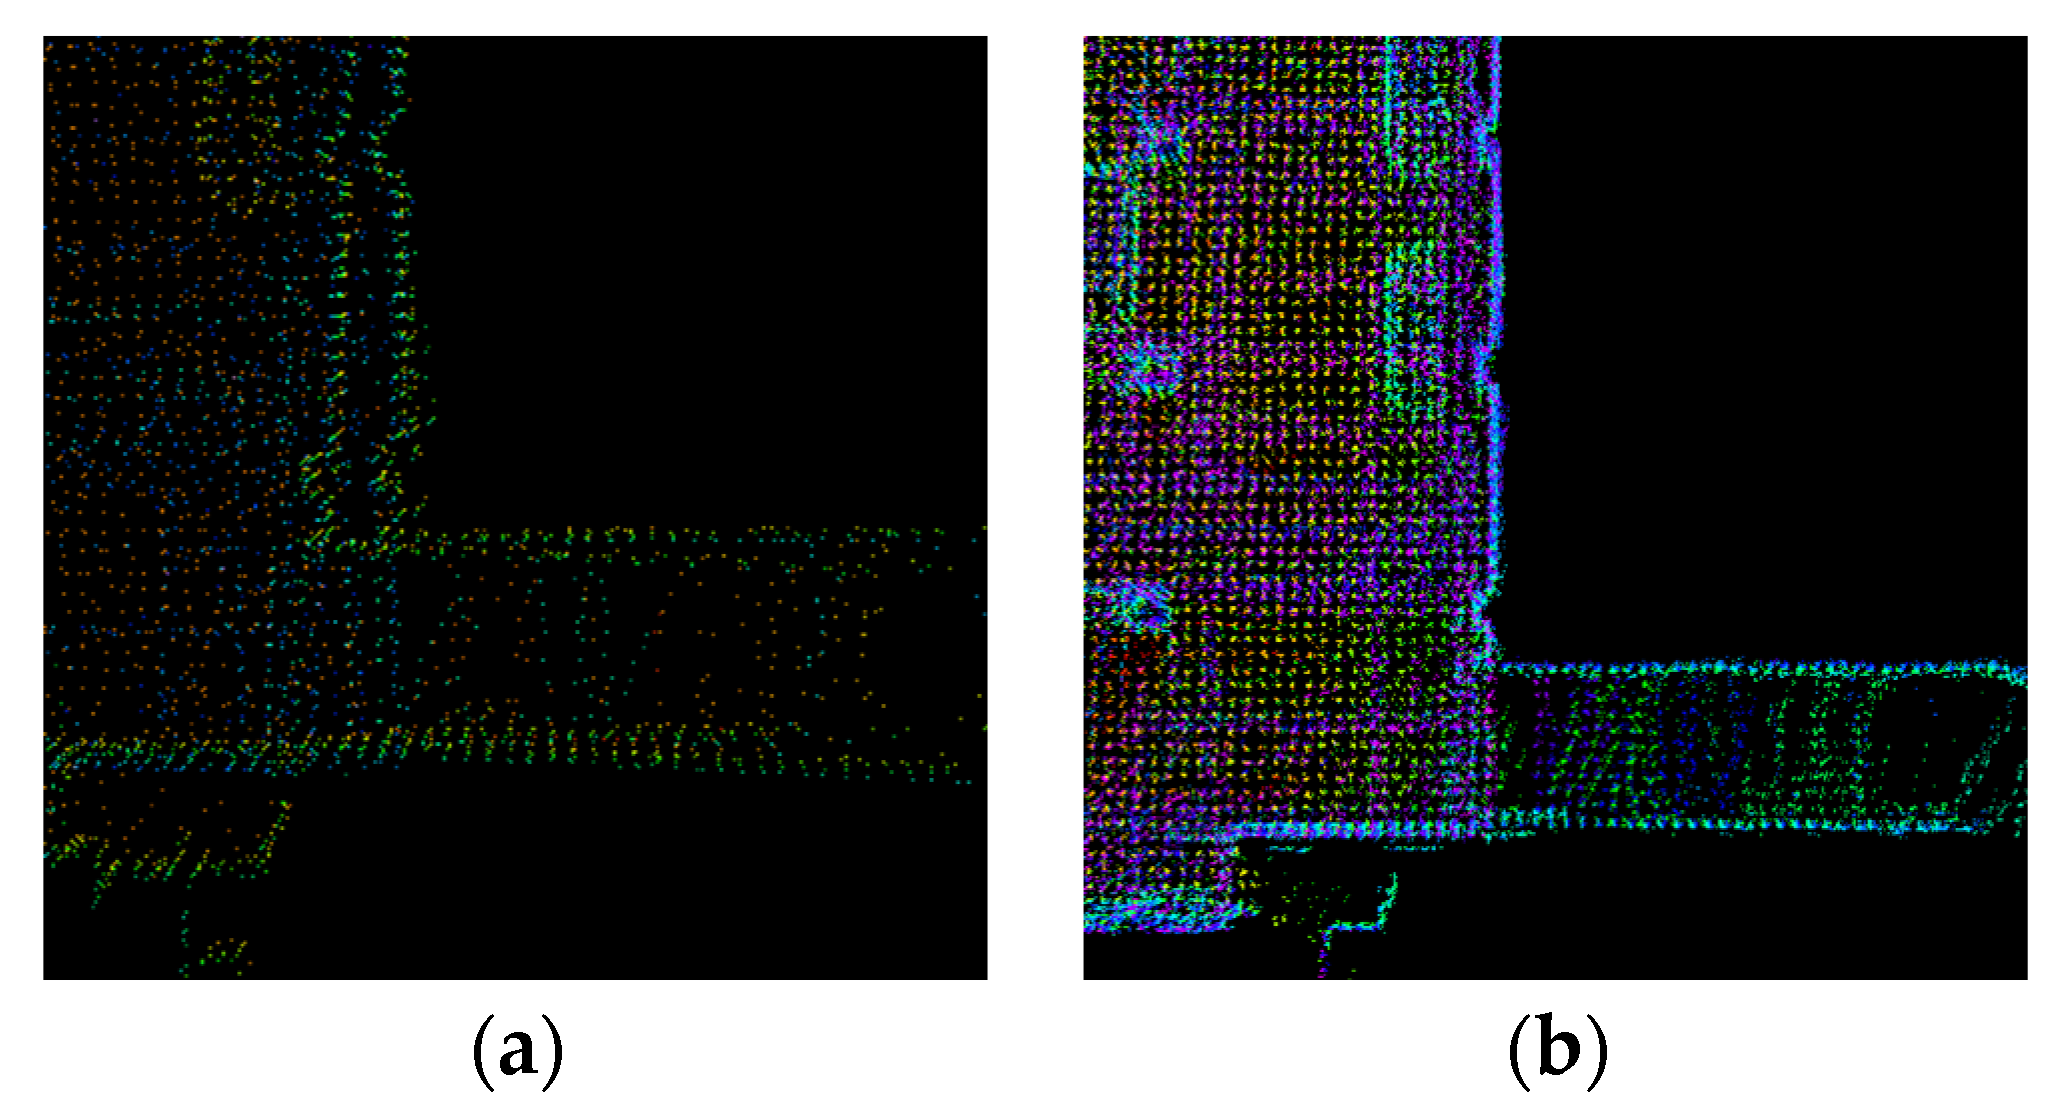
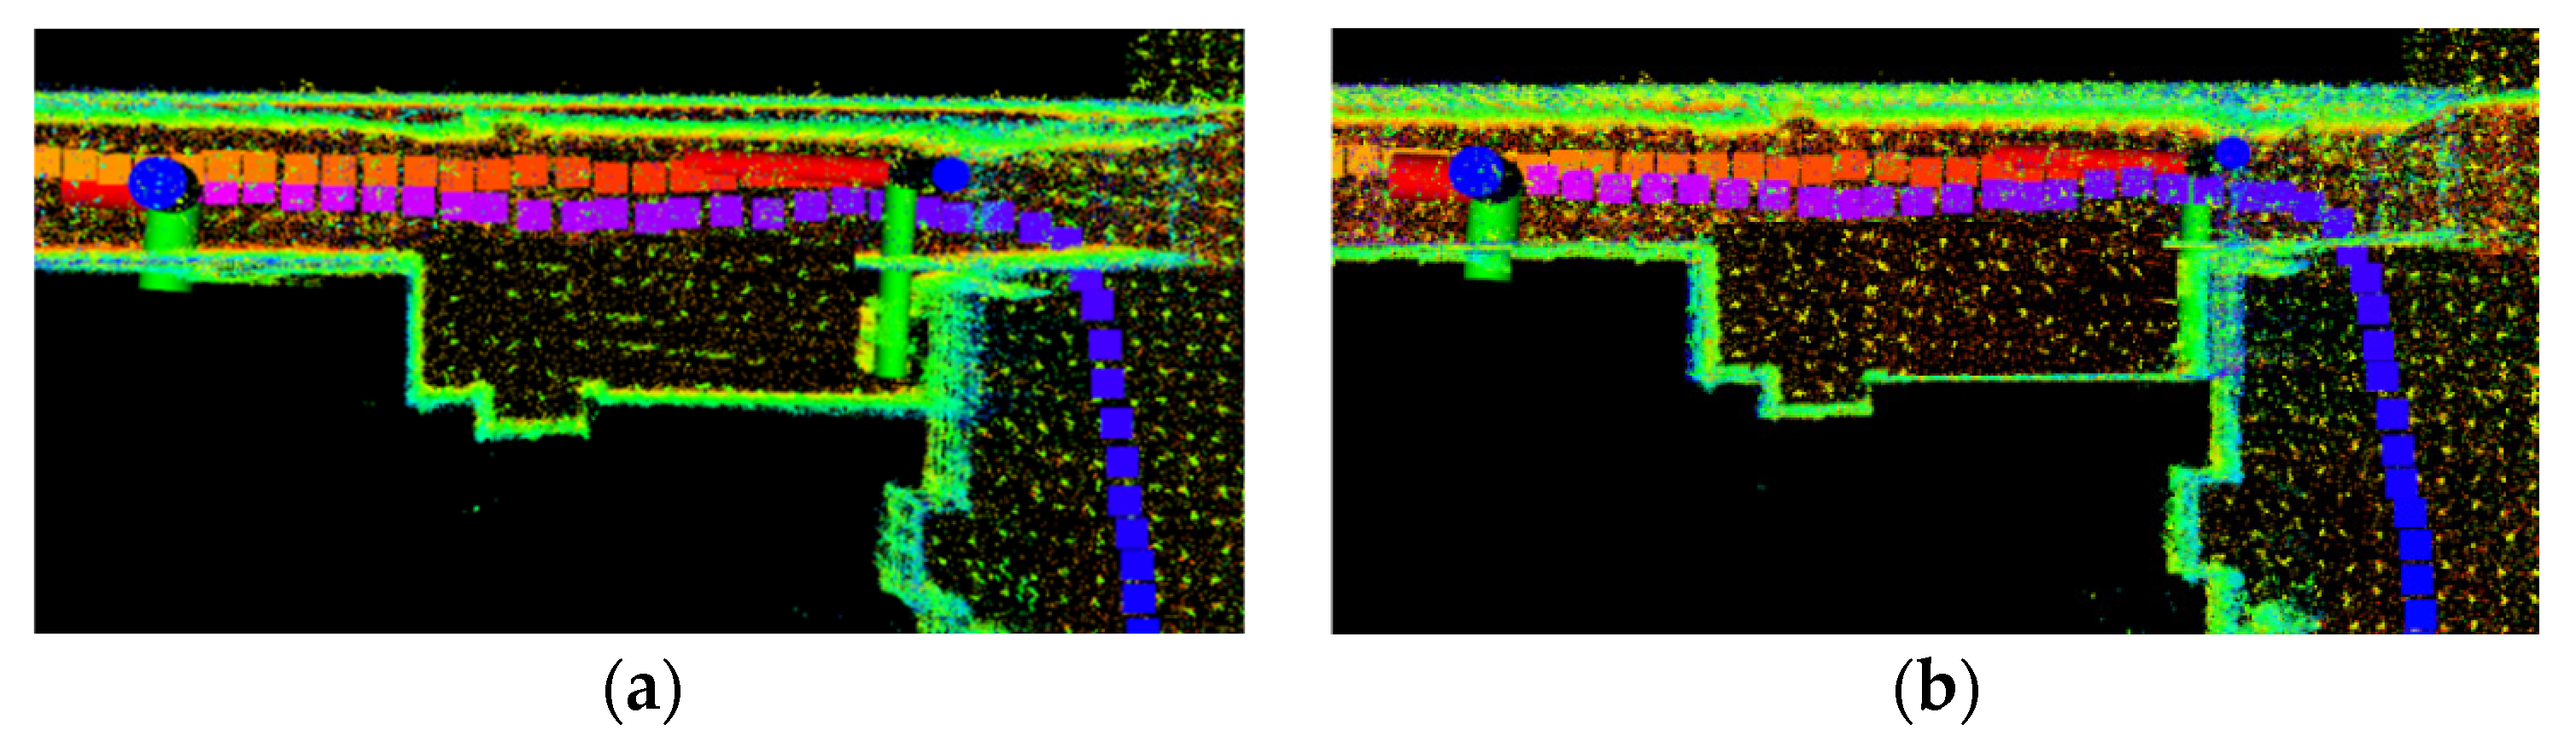
3.1. Comparison of Mapping Results

Figure 4 shows a point cloud map of the KITTI dataset 00 sequence constructed by the LeGO-LOAM and LeGO-LOAM-SM, with the red boxes showing the locations of the start and end points of the scan, and color represents elevation. Figure 5 is a partial enlarged view of the red box portion of Figure 4. It can be seen from Figure 5 that the phenomenon of point cloud map drift occurs in LeGO-LOAM, and the loopback effect is poor, while that the initial construction of LeGO-LOAM-SM and the loopback construction basically overlap, which makes up for the phenomenon of point cloud map drift.

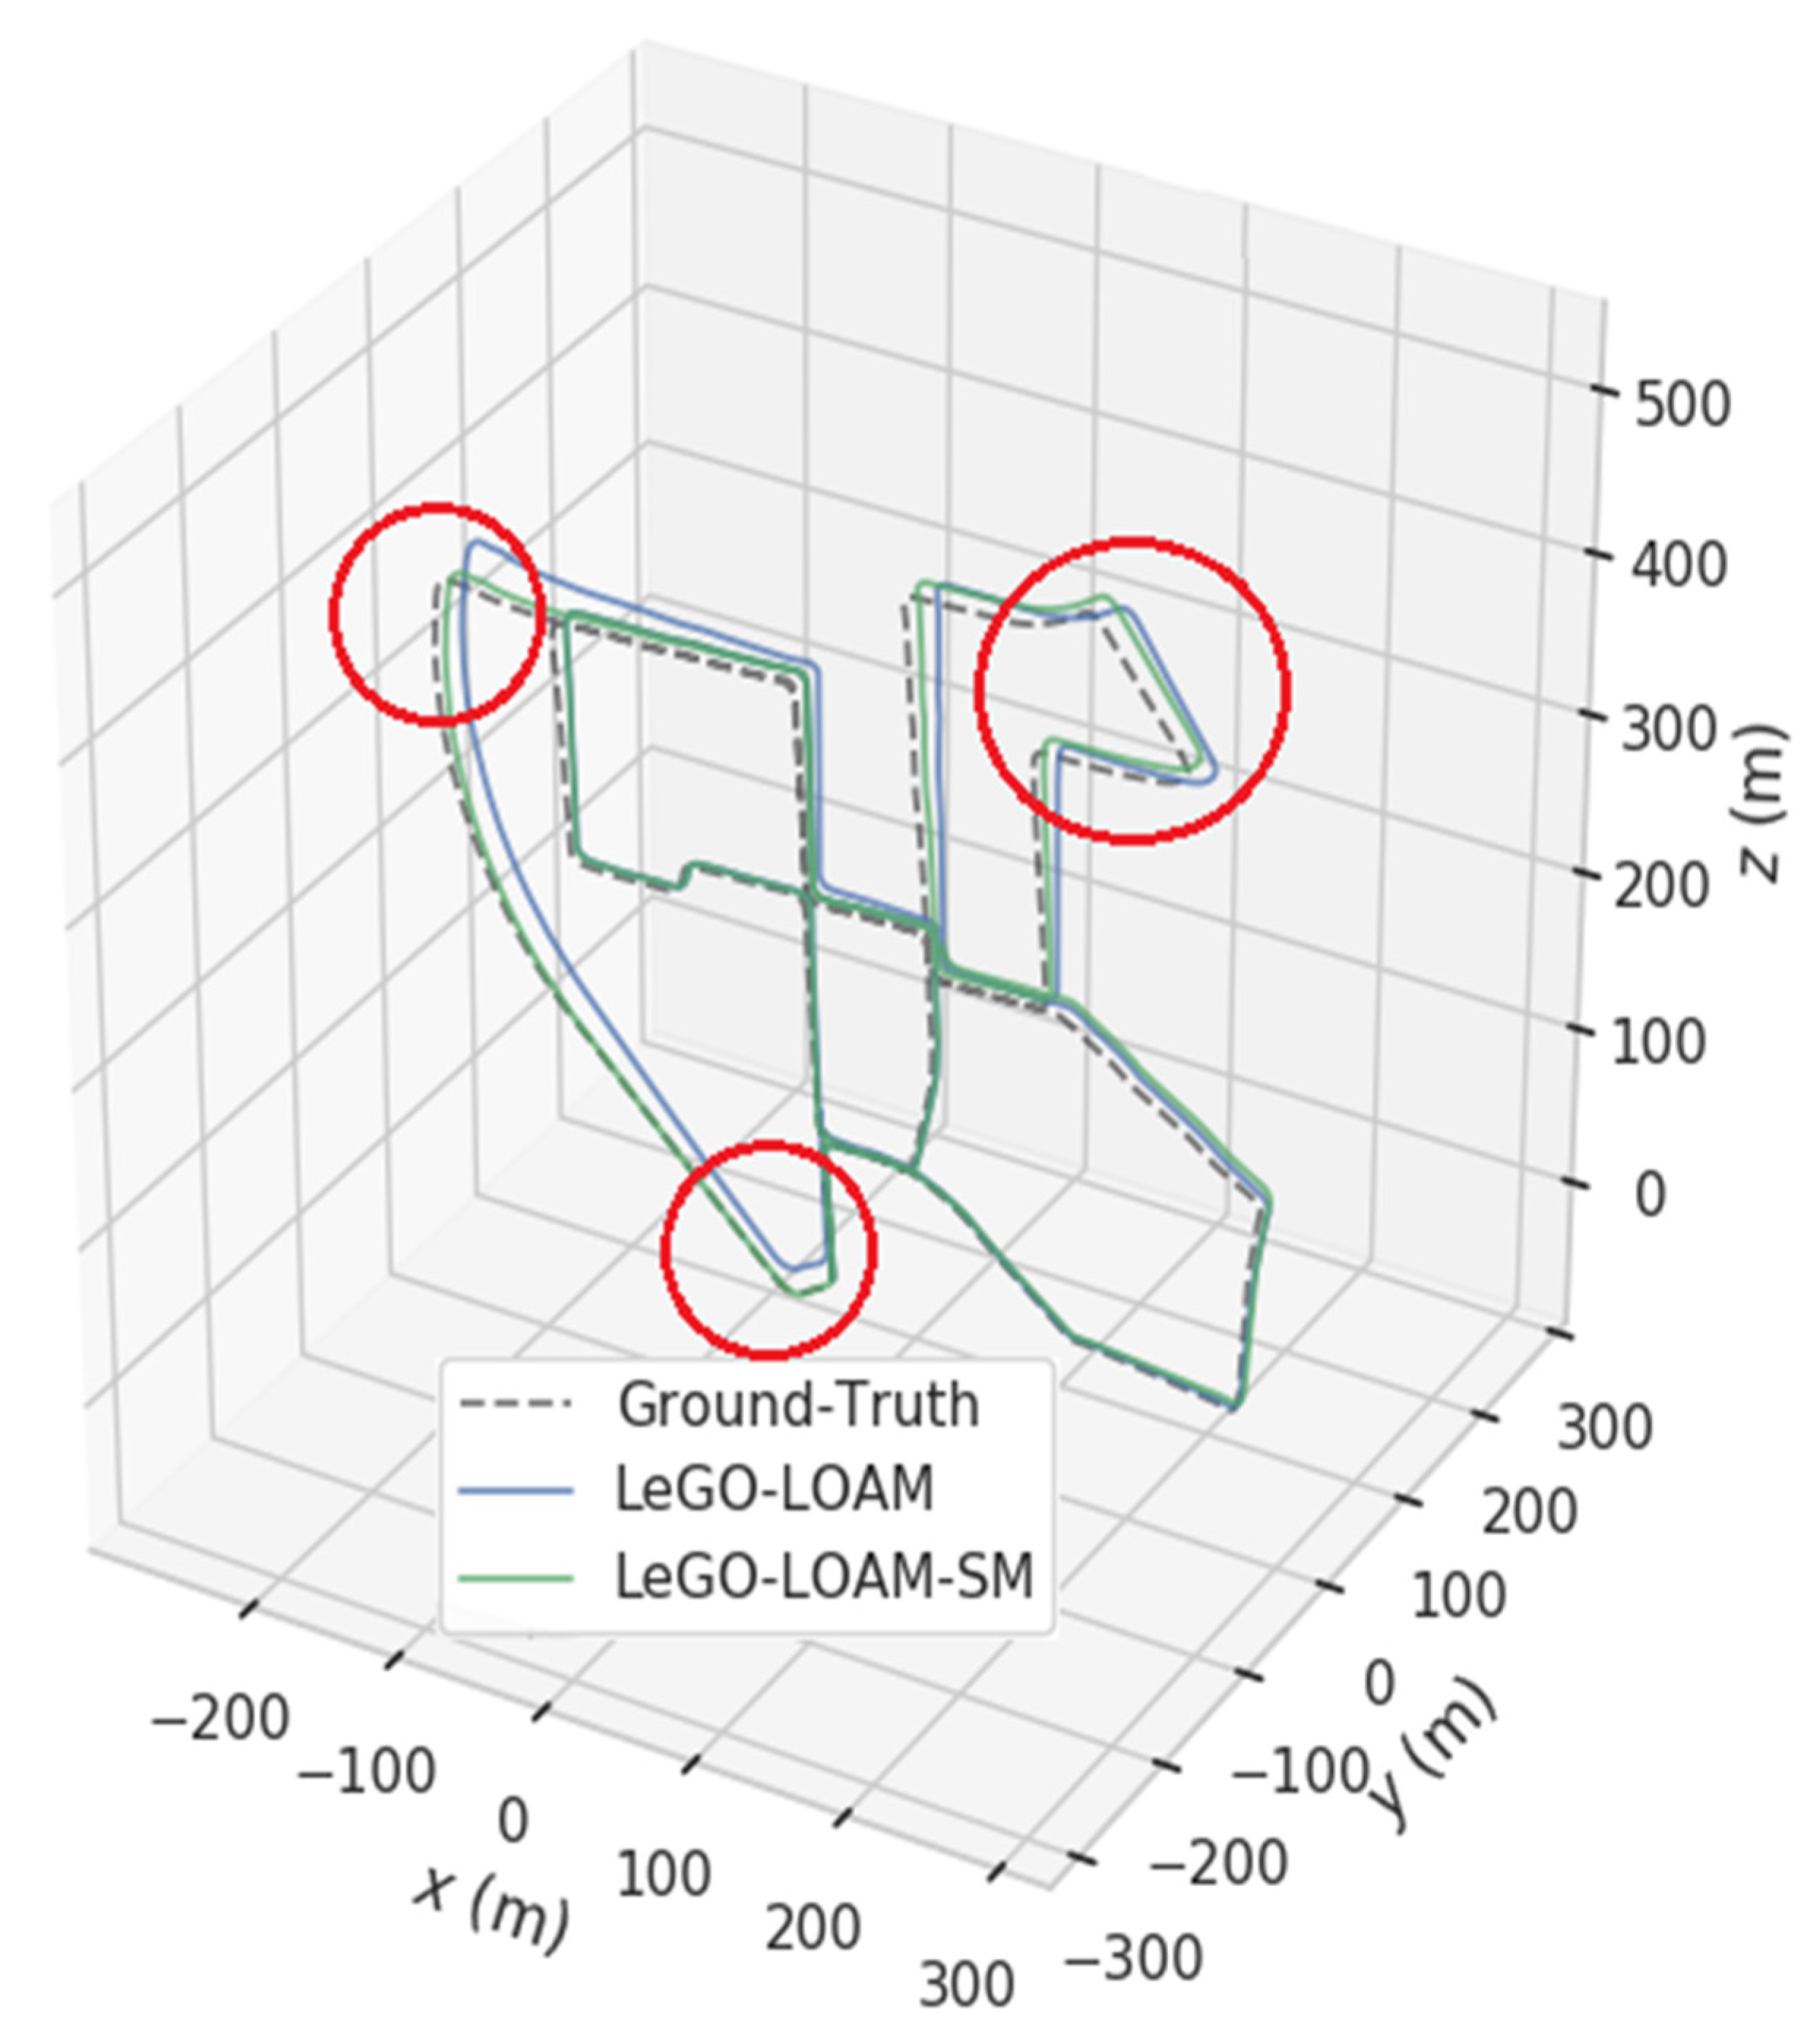
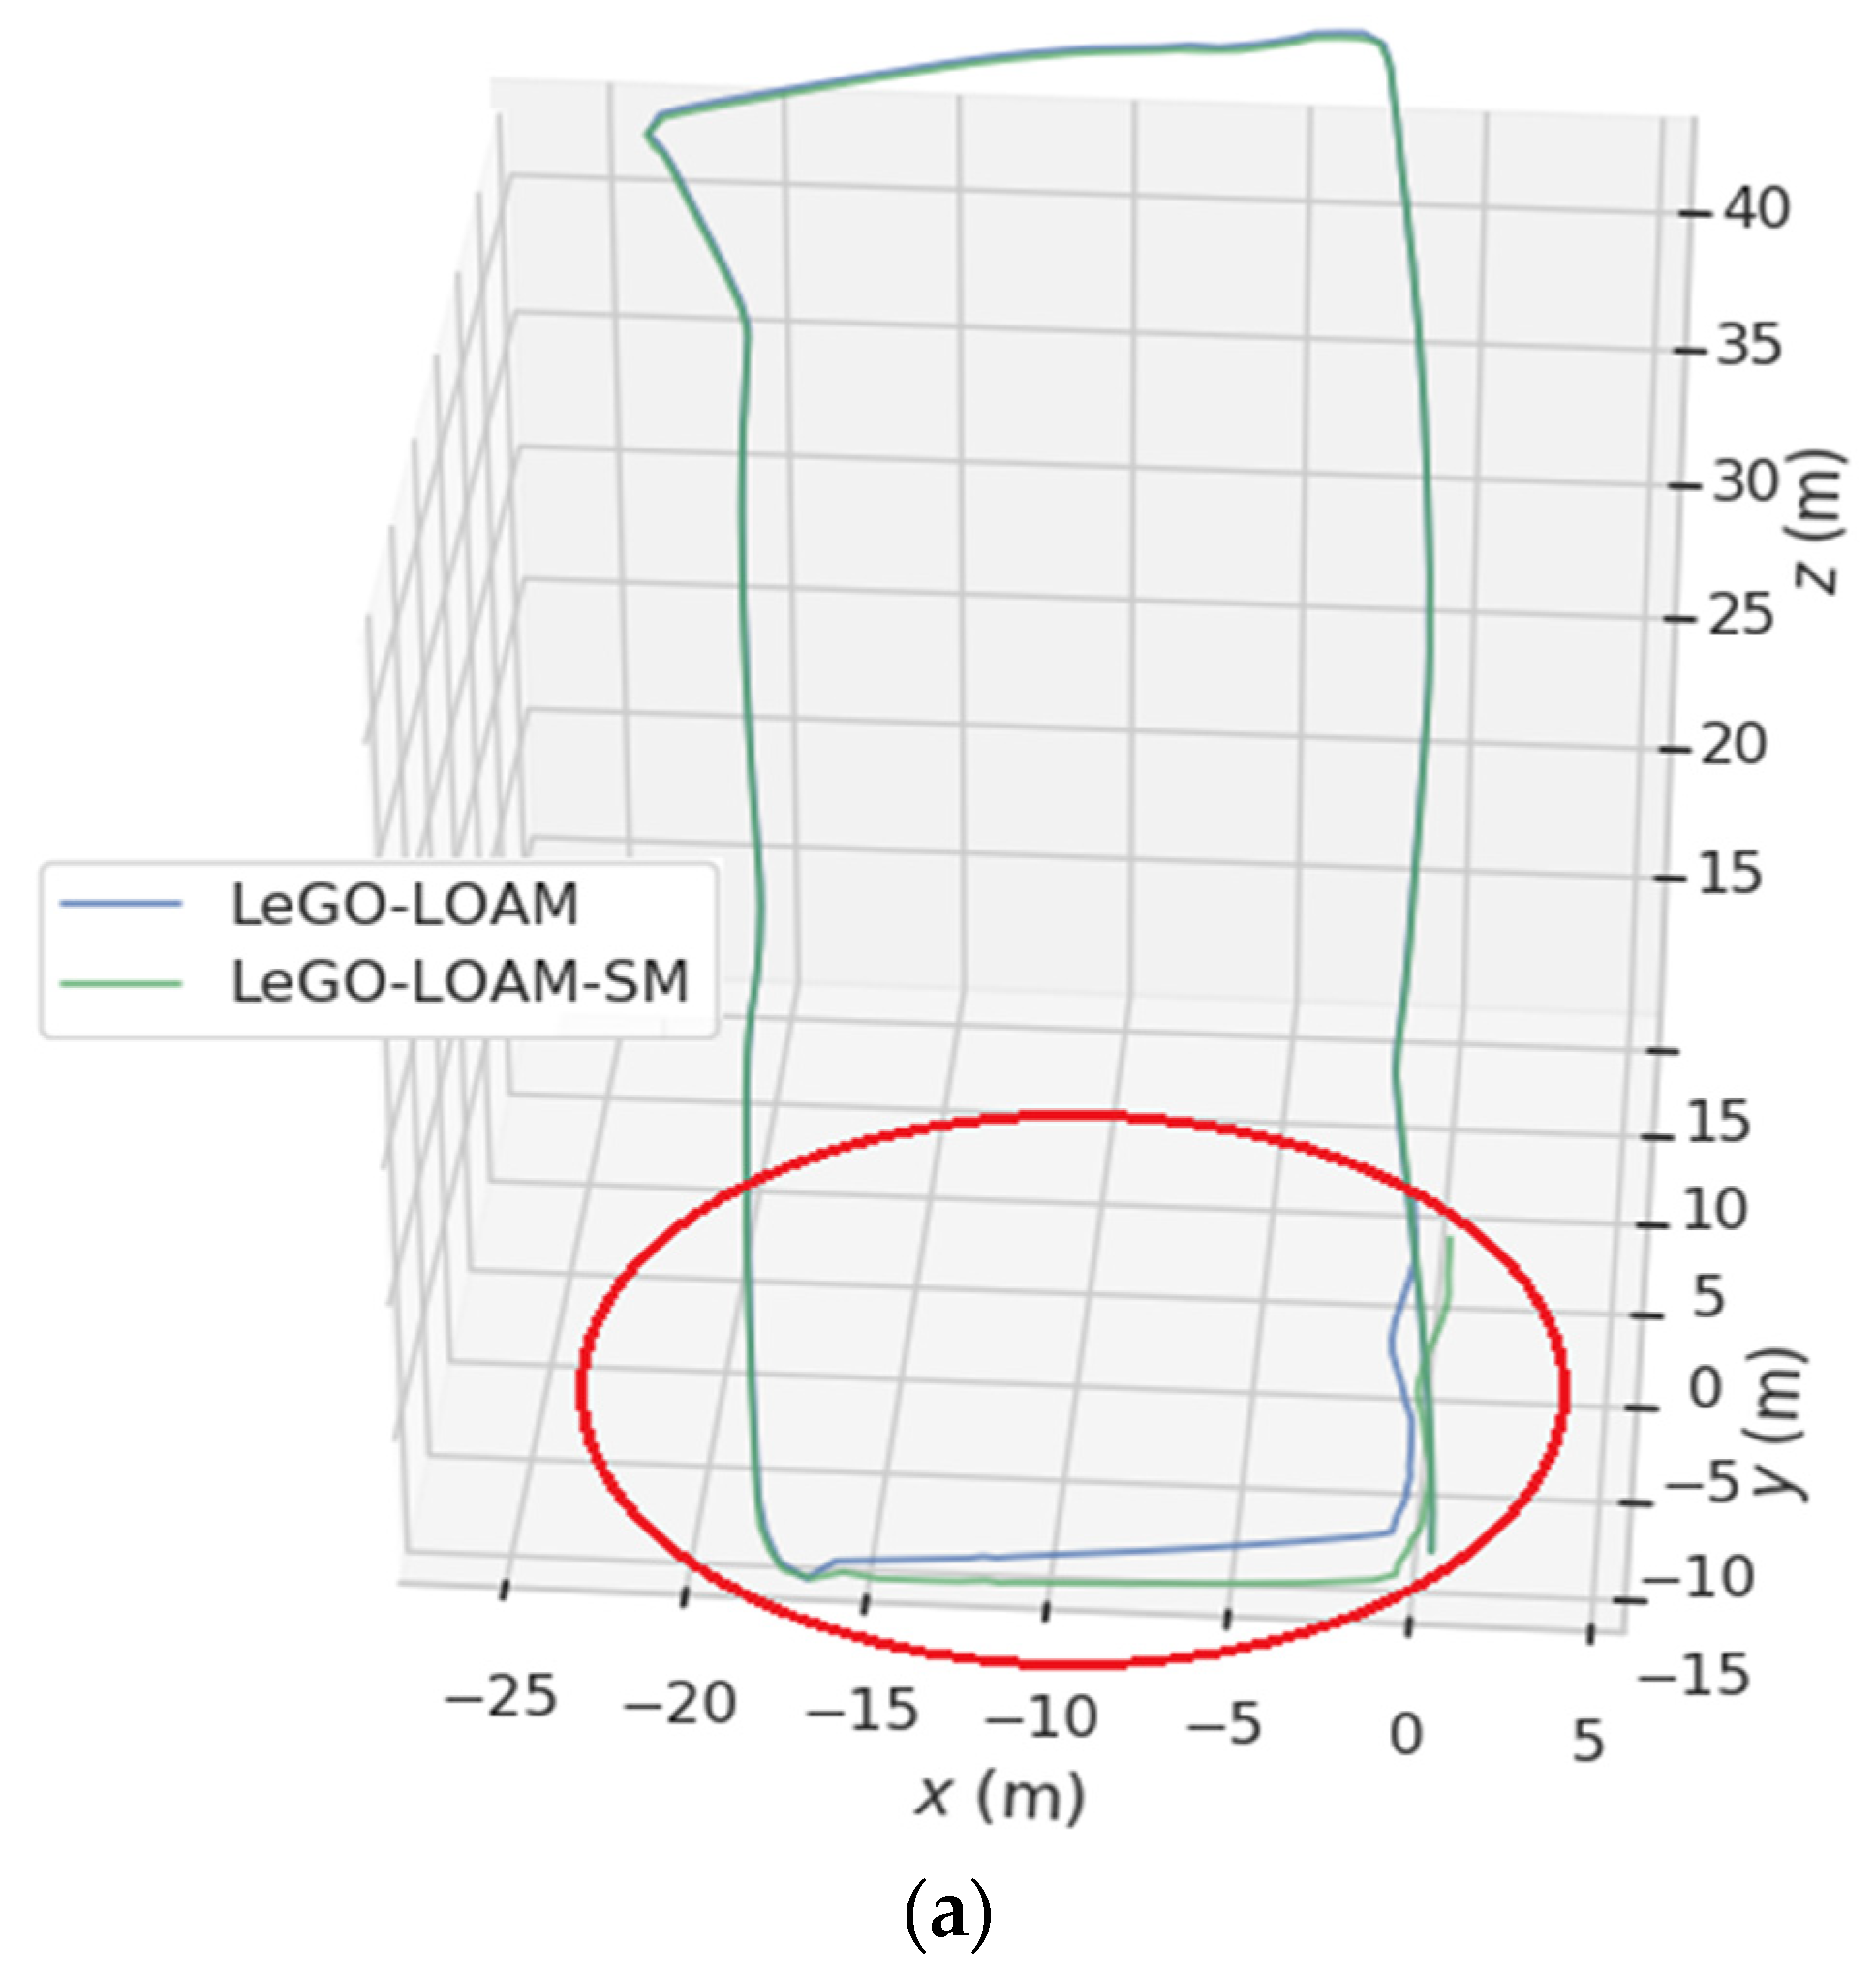
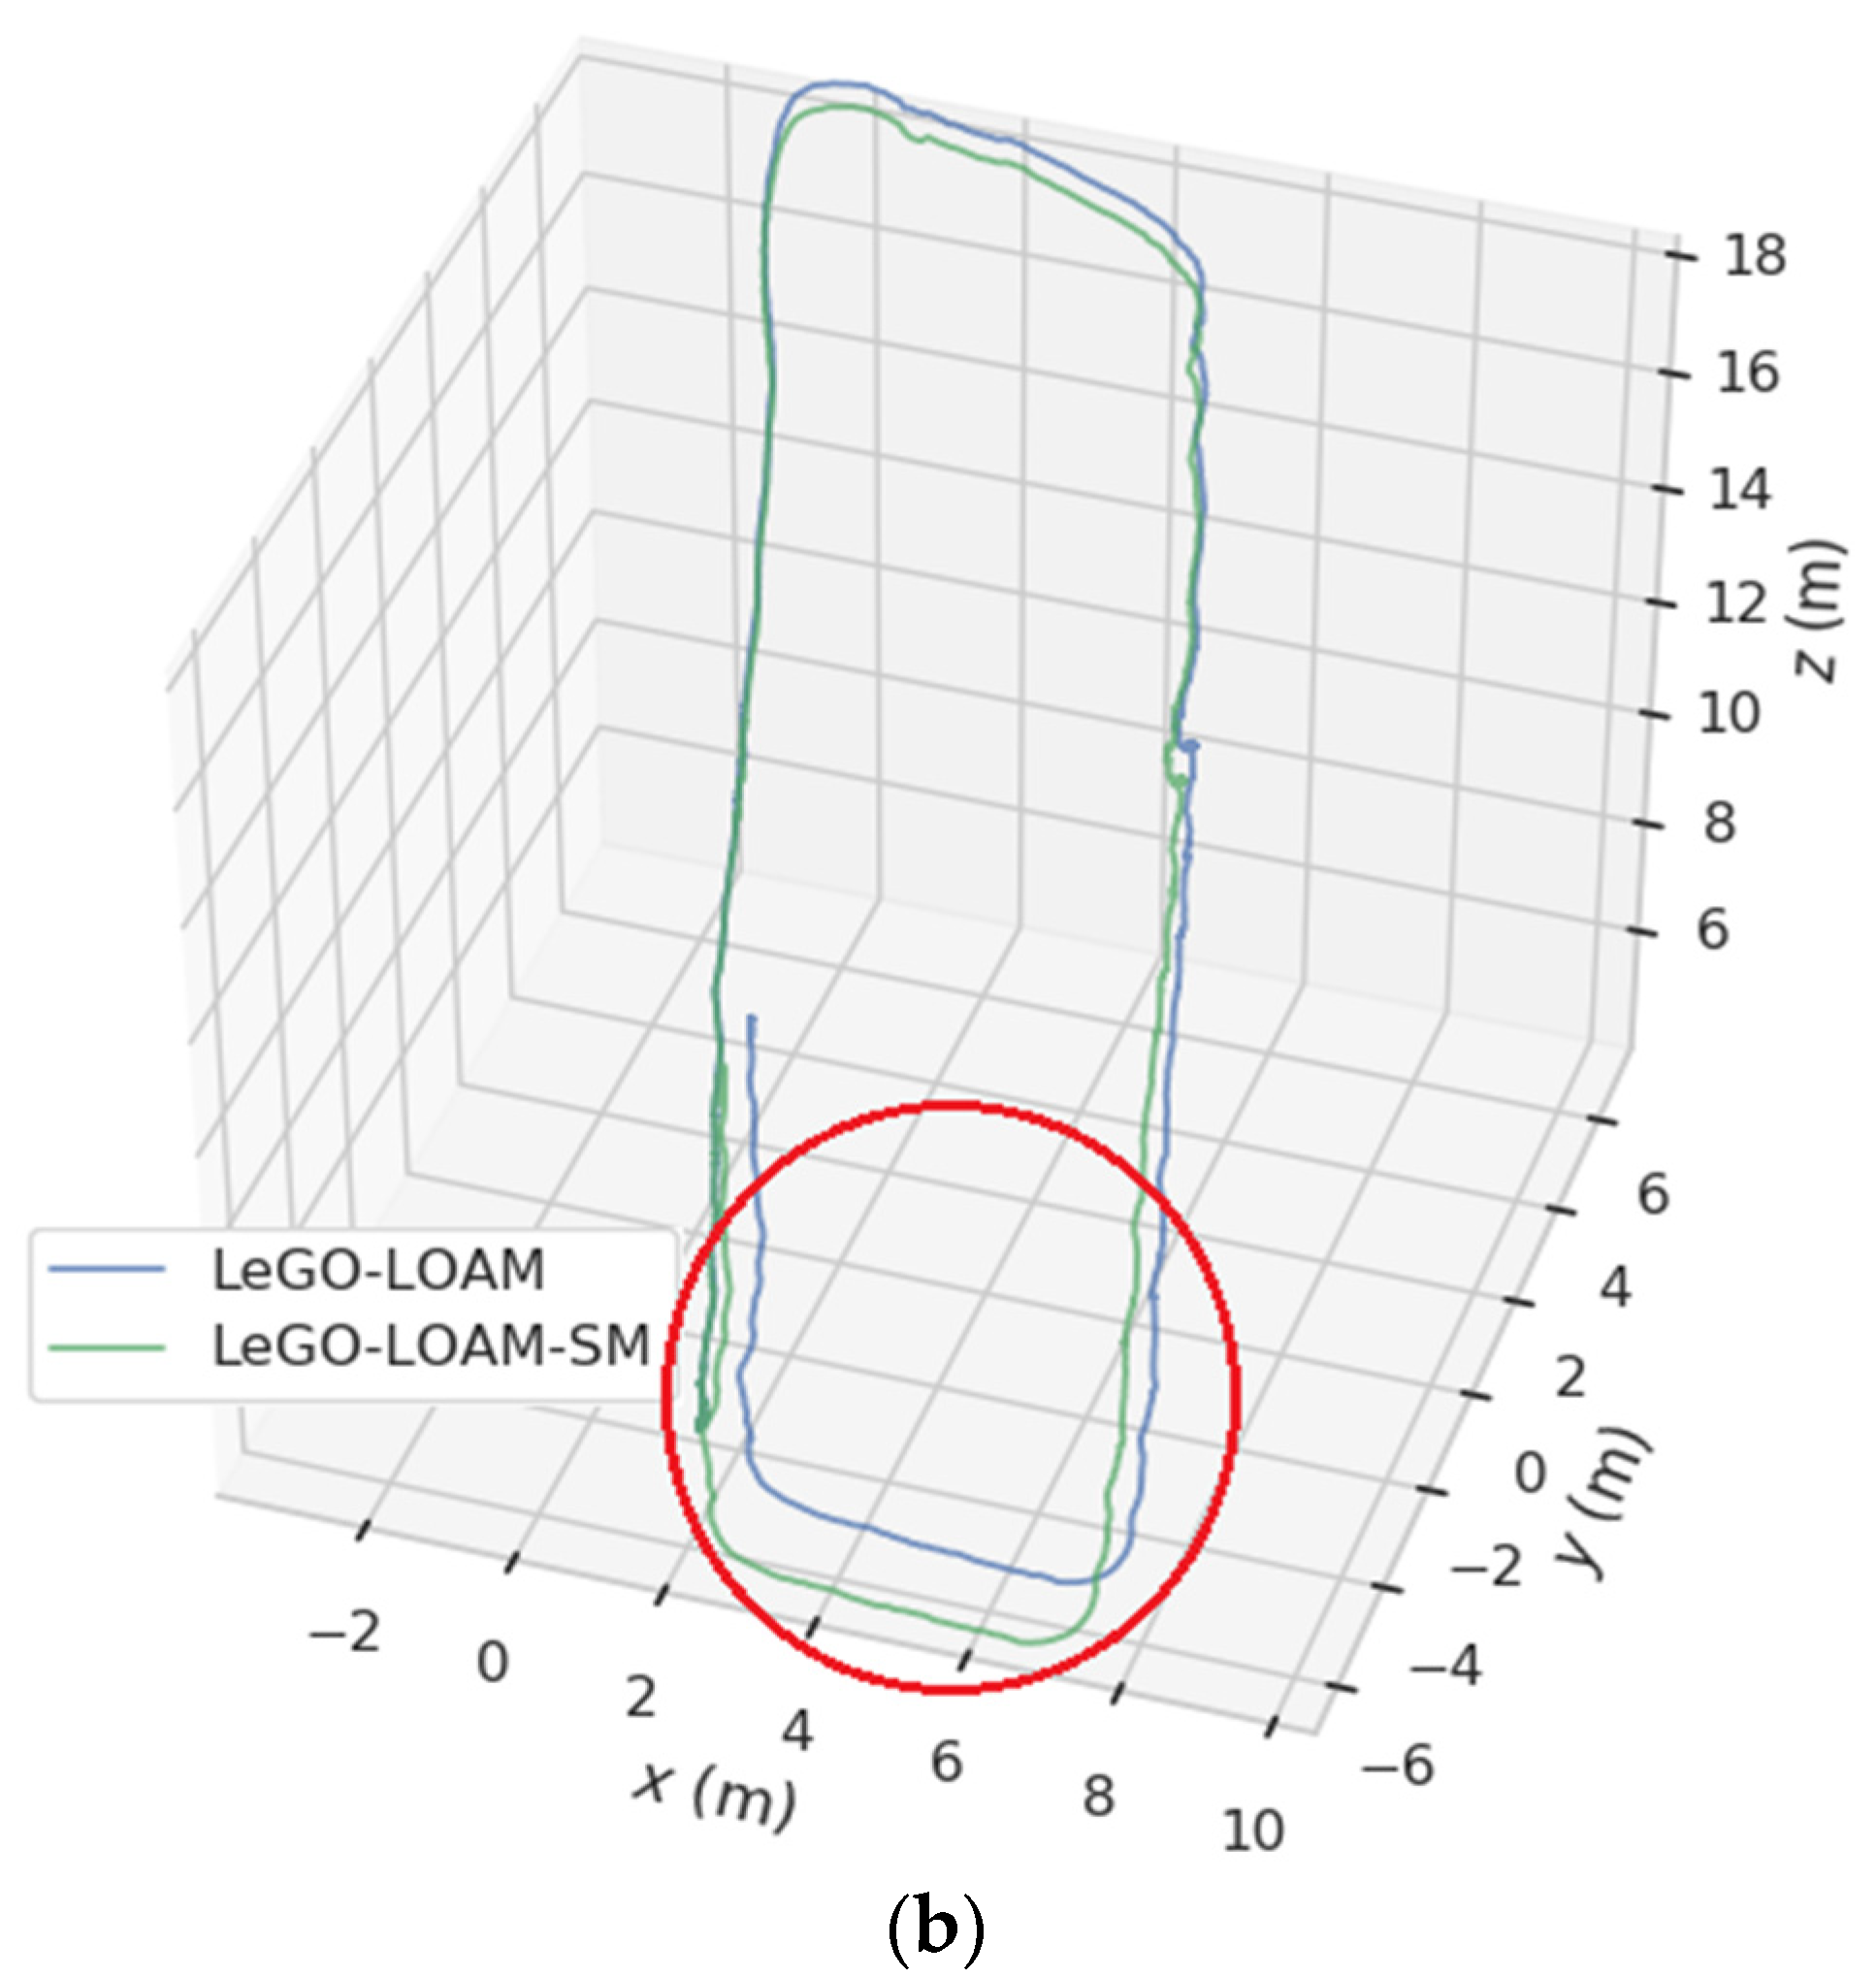
3.2. Trajectory Comparison

The motion trajectories of the two algorithms were extracted by the evo tool, as shown in Figure 6, and the ground-truth trajectory is also given for the convenience of contrast. It can be seen from Figure 6 that the motion trajectory generated by LeGO-LOAM-SM has a higher degree of coincidence with the ground-truth trajectory, especially at large angle turns (the part circled in red in Figure 6), and that LeGO-LOAM fails to loopback smoothly, while the LeGO-LOAM-SM algorithm has a smoother loopback and better effect.

3.3. Estimated Trajectory Length Deviation

The KITTI dataset 00 sequence trajectory length and its deviation were estimated by LeGO-LOAM and LeGO-LOAM-SM, as shown in Table 1. It can be seen from Table 1 that the estimated trajectory length of LeGO-LOAM-SM is closer to the ground-truth track length than LeGO-LOAM, with a deviation reduced by 51.4%, indicating that the improved algorithm has higher accuracy in mapping.

3.4. Absolute Trajectory Error and Relative Pose Error

The absolute trajectory error (ATE) and relative pose error (RPE) of the KITTI dataset 00 sequence estimated by LeGO-LOAM-SM and LeGO-LOAM are given in Table 2.
As can be seen from Table 2, compared with LeGO-LOAM, the maximum error, minimum error, mean error, standard deviation, and mean square error of the ATE of LeGO-LOAM-SM were significantly improved by 49.0%, 82.8%, 62.0%, 62.0%, and 63.3%, respectively. The maximum error, mean error, standard deviation and mean square error of RPE improved by 62.6%, 1.6%, 62.3%, and 47.2%, respectively, indicating that the improved algorithm has high positioning accuracy and high stability.

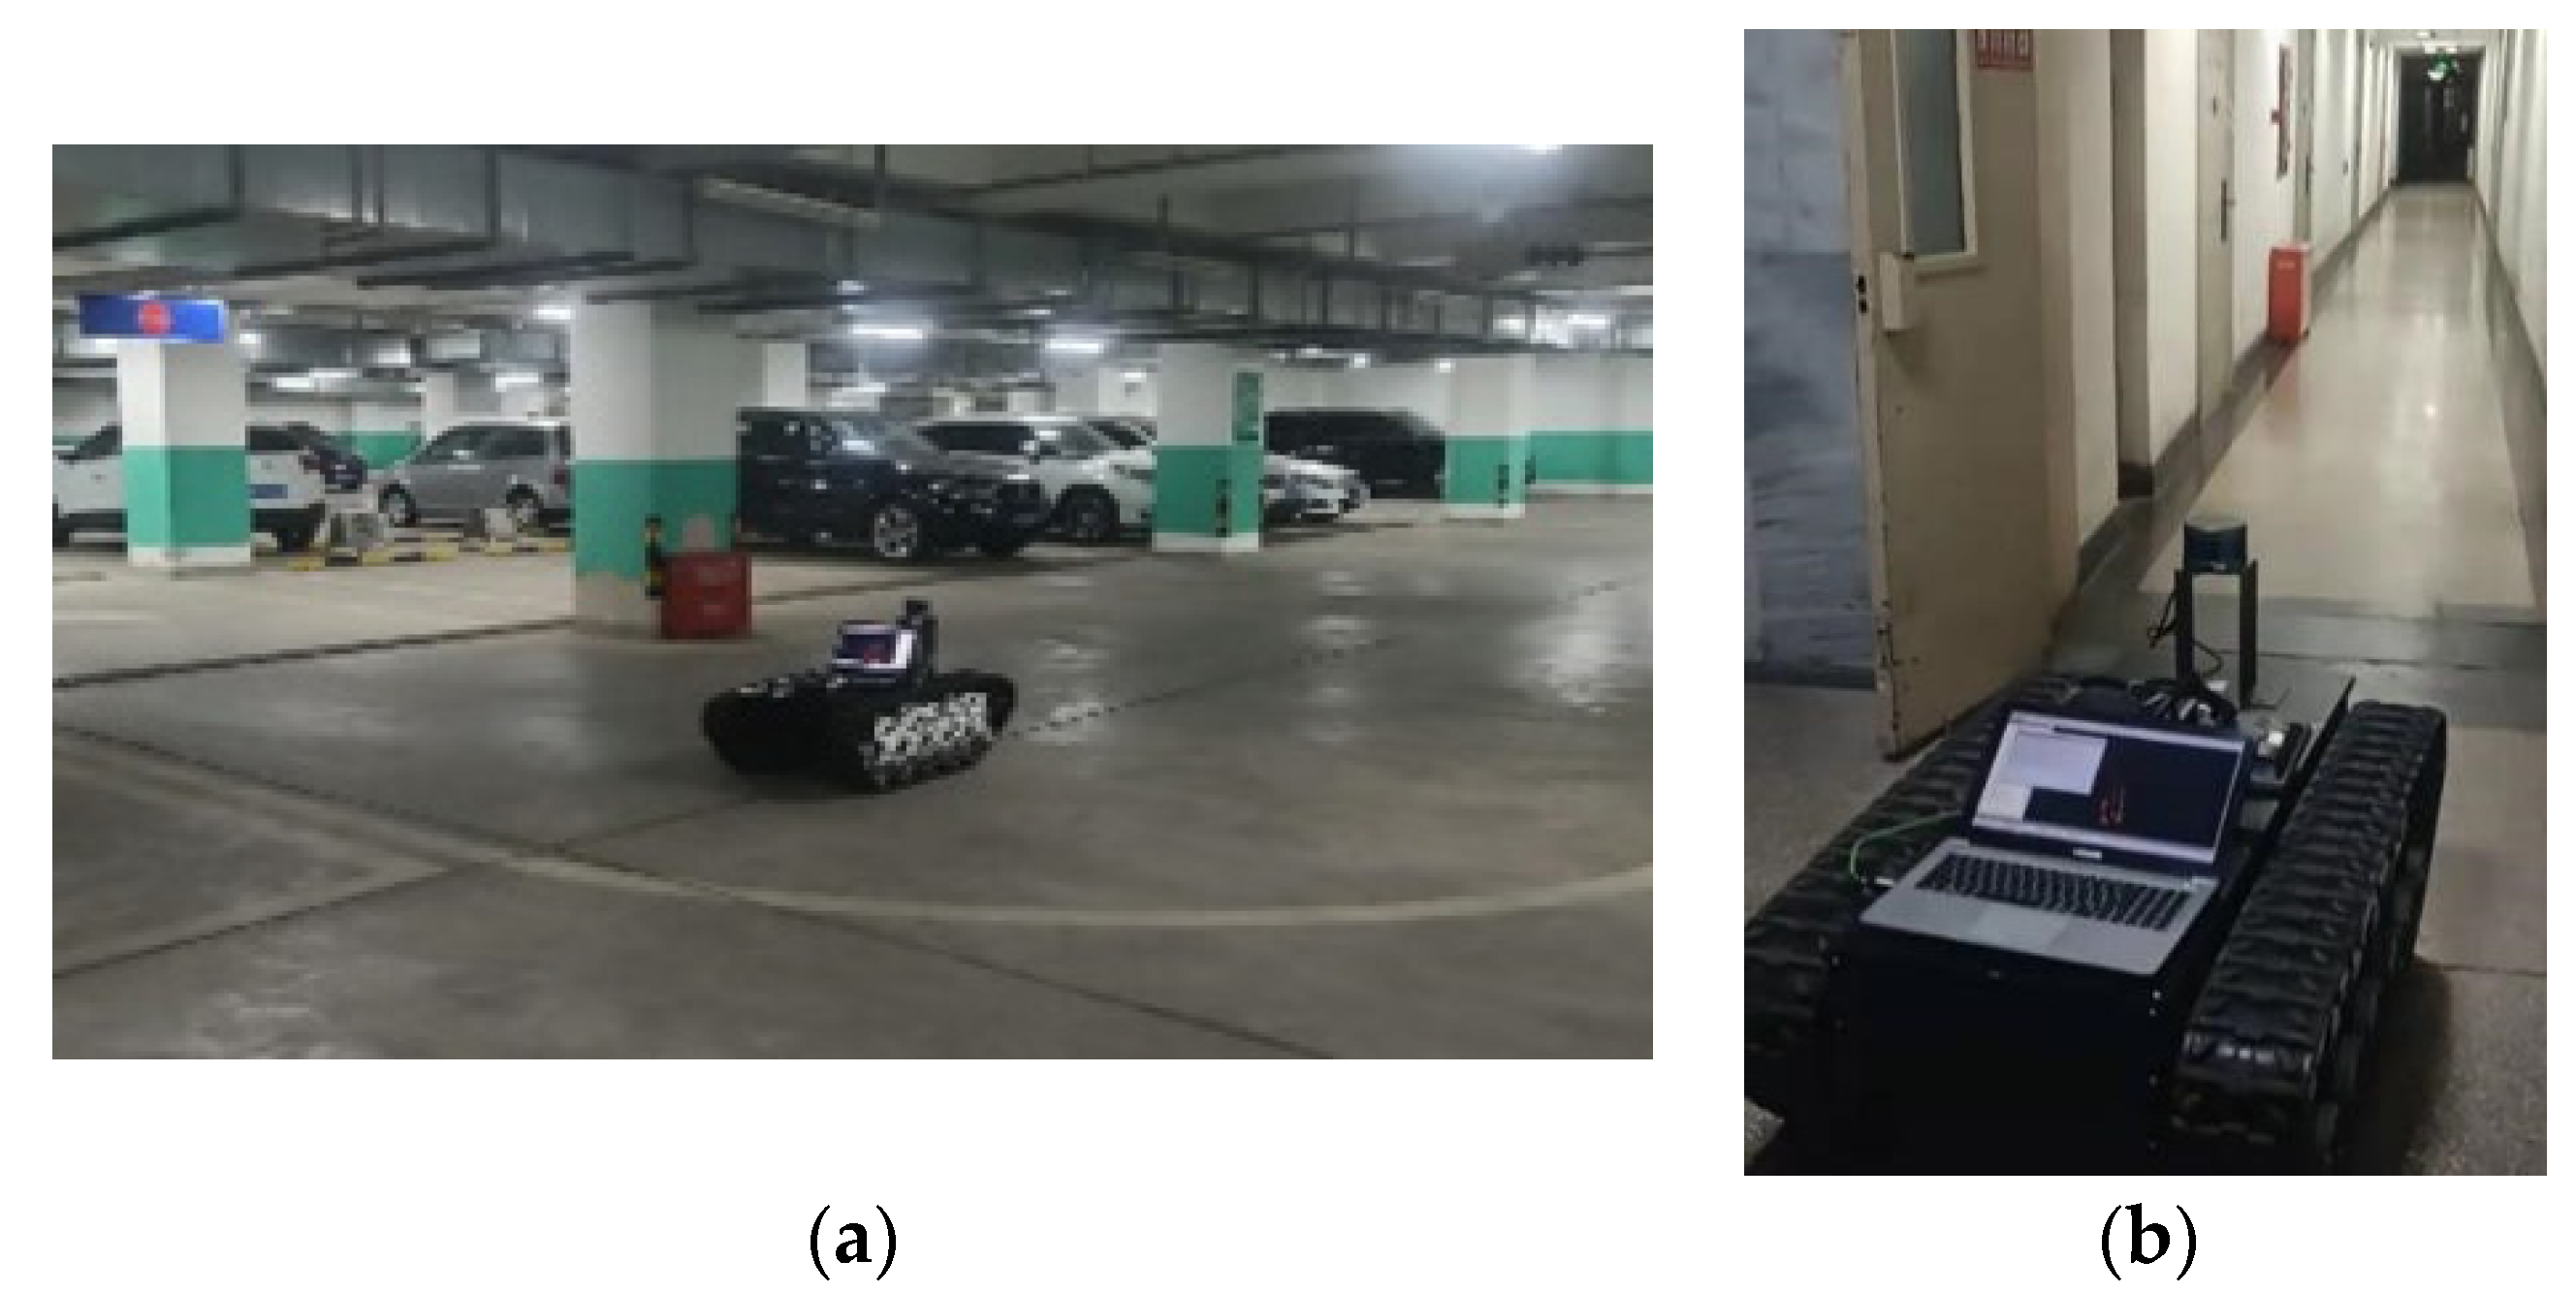
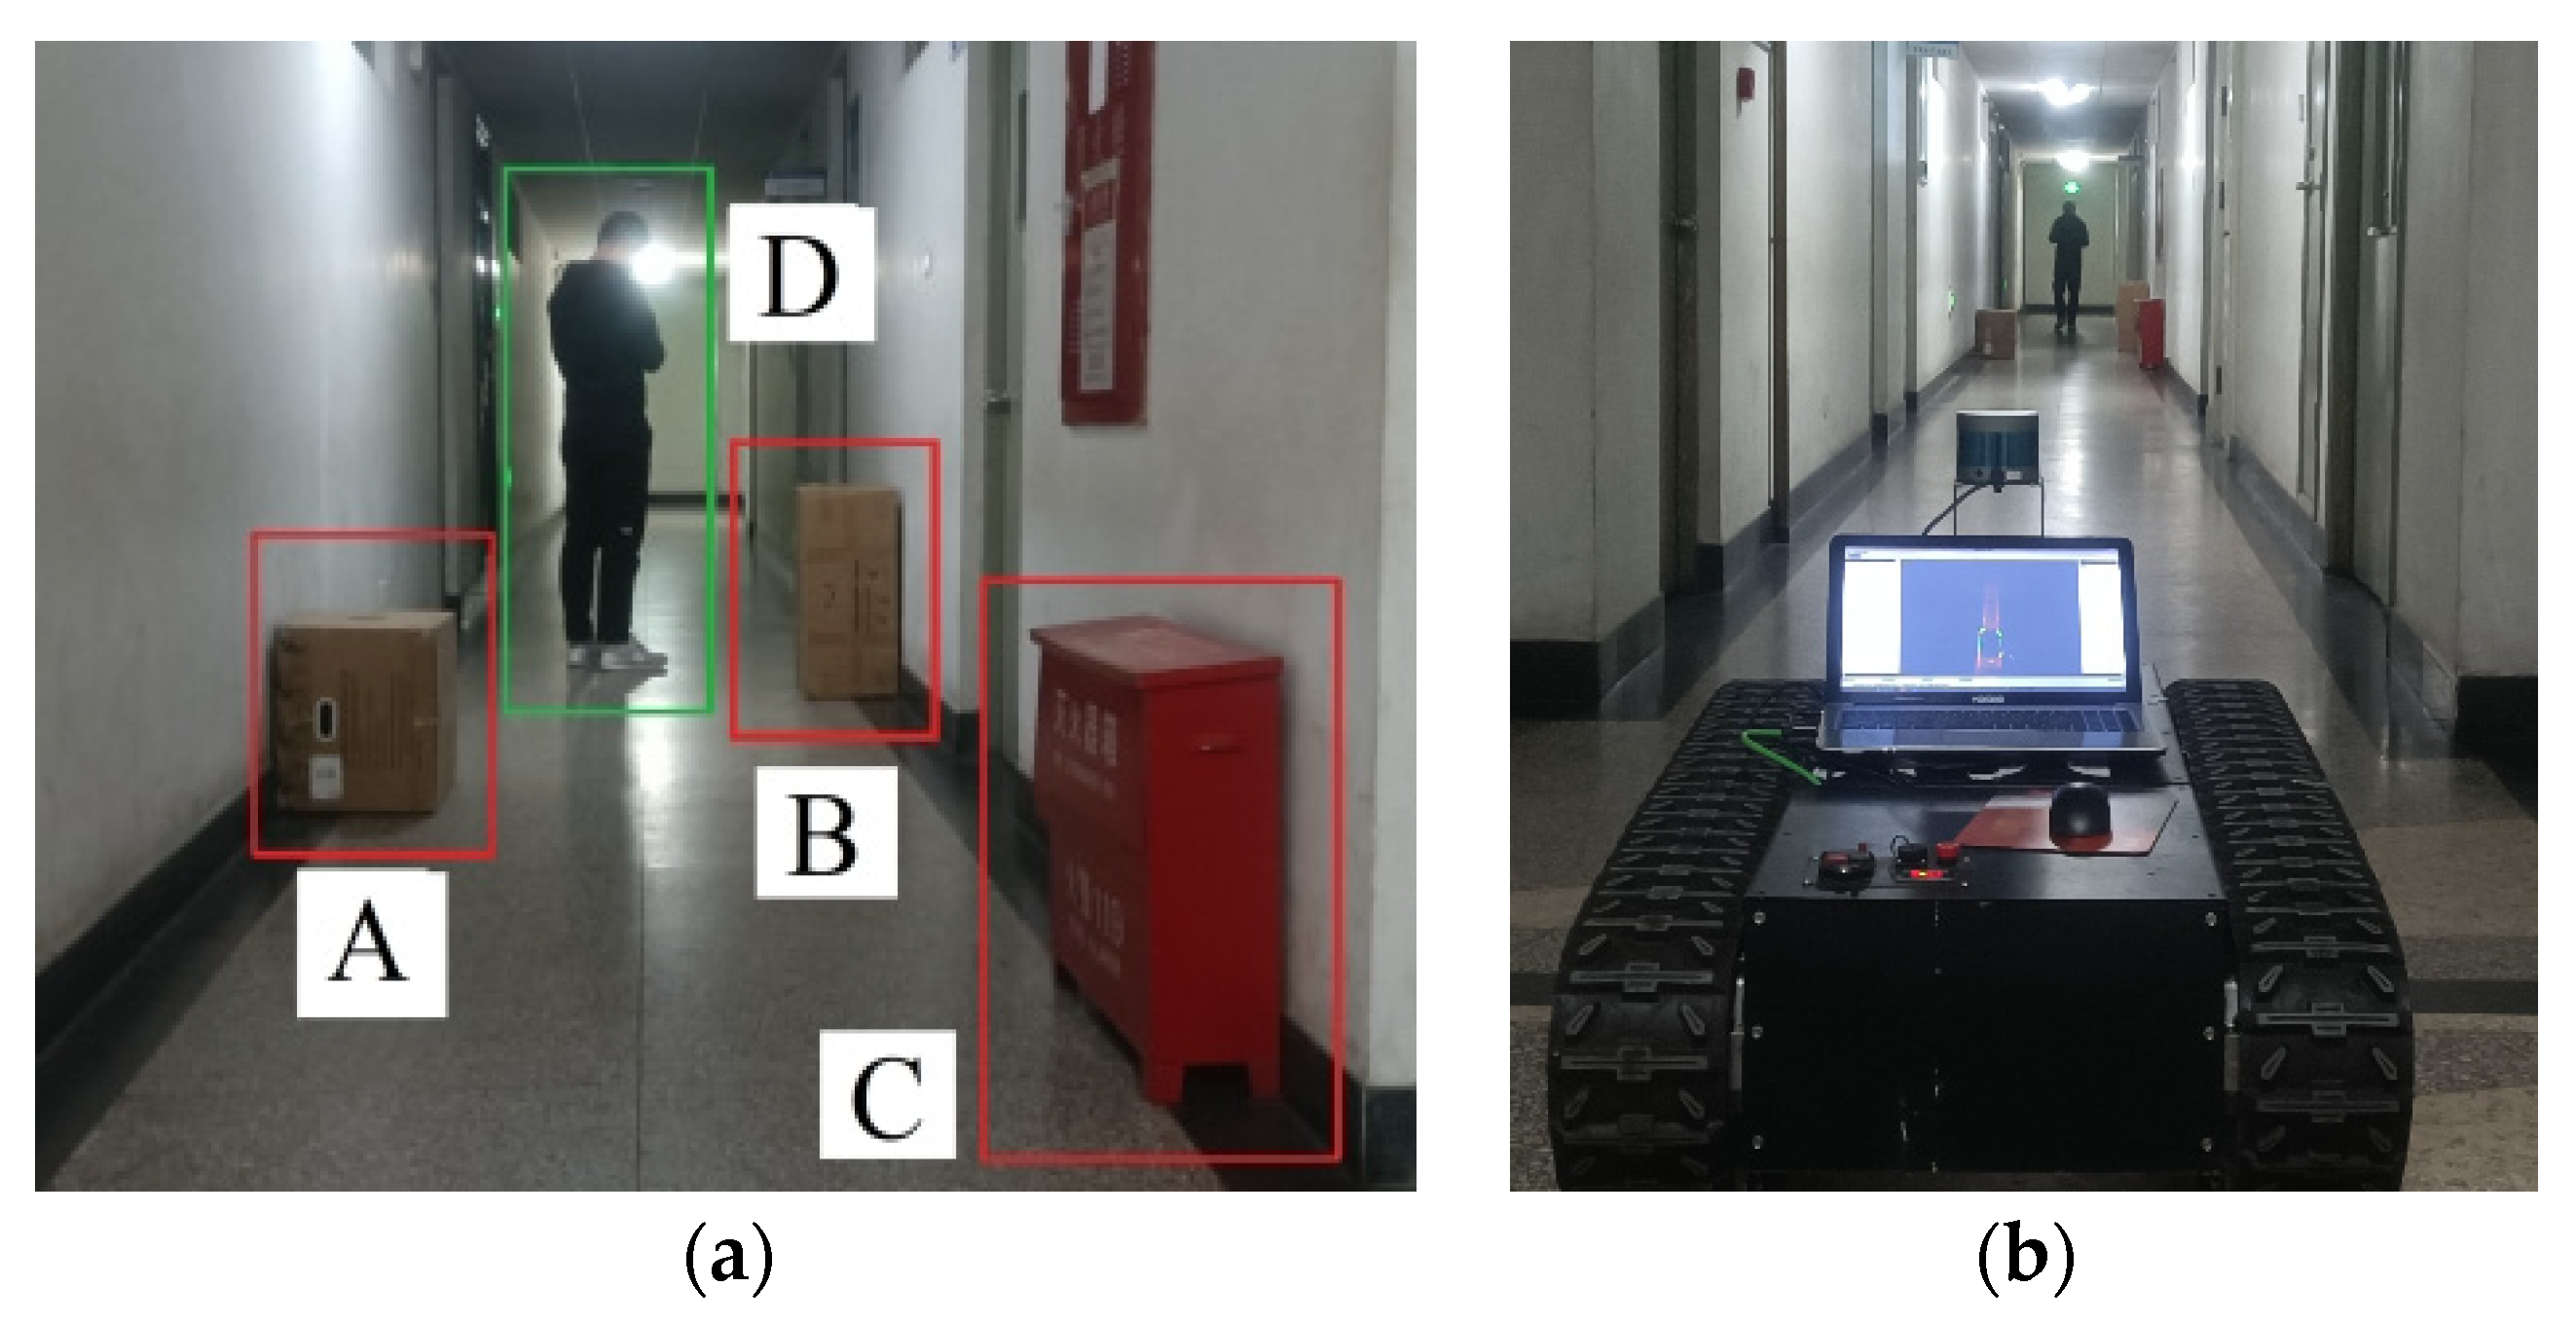
4. Experimental Verification of Practical Scenarios

Two scenarios of an underground parking lot and building corridor were selected for experimental validation. The environment is shown in Figure 7. The main structures of the parking lot are columns, beams, cars, etc. The site is relatively empty, and there are bumpy roads such as speed bumps and sewers so as to test the accuracy and robustness of the positioning and mapping algorithm; the building corridor is long and narrow, and there is a looped structure, which is similar to the coal mine underground scene with a single structure and a few geometric features. The experimental platform is a crawler robot equipped with a 16-line laser radar. The 16-line LiDAR has a measurement range of 150 m, an accuracy of ±2 cm, a vertical view angle of 30°, a horizontal view angle of 360°, a vertical angle resolution of 2°, a horizontal angle resolution of 0.2°, and a rotation rate of 10 Hz. The chassis size of the crawler robot is 1185 × 765 × 395 mm, rated power 1000 W × 2, the maximum barrier crossing 150 mm, maximum span ≥300 mm, the chassis height 200 mm, the bandwidth 150 mm, the maximum climbing ≥30°, and maximum load of 100 kg.

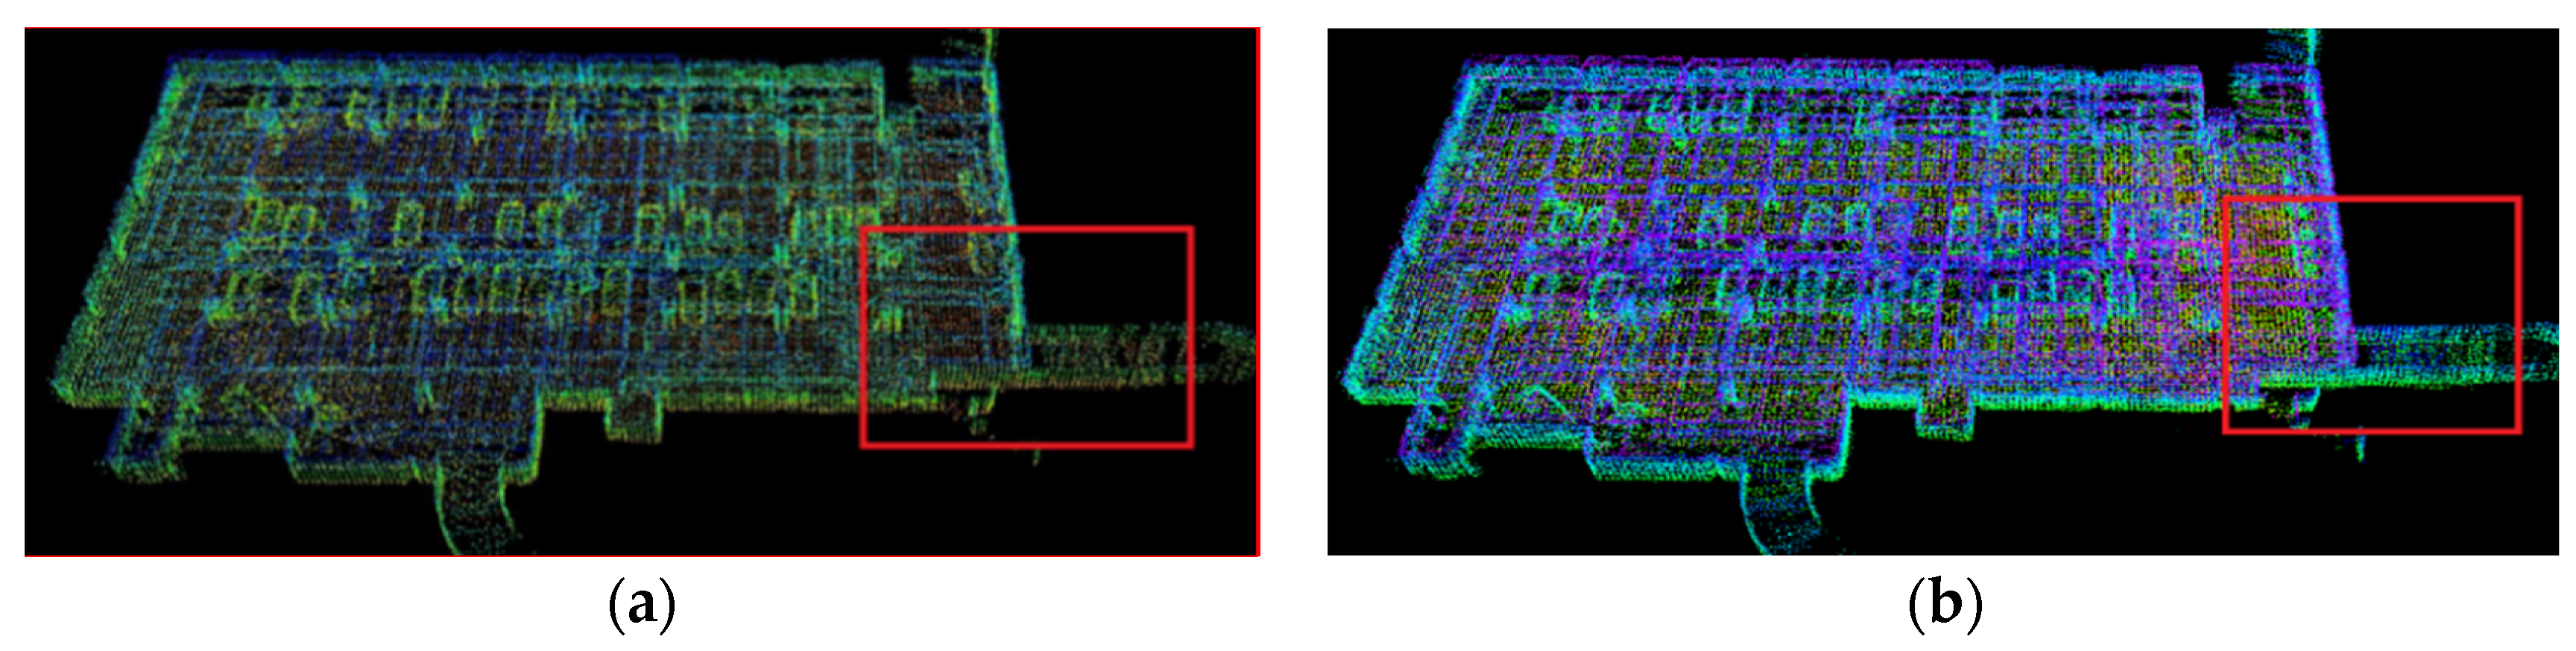
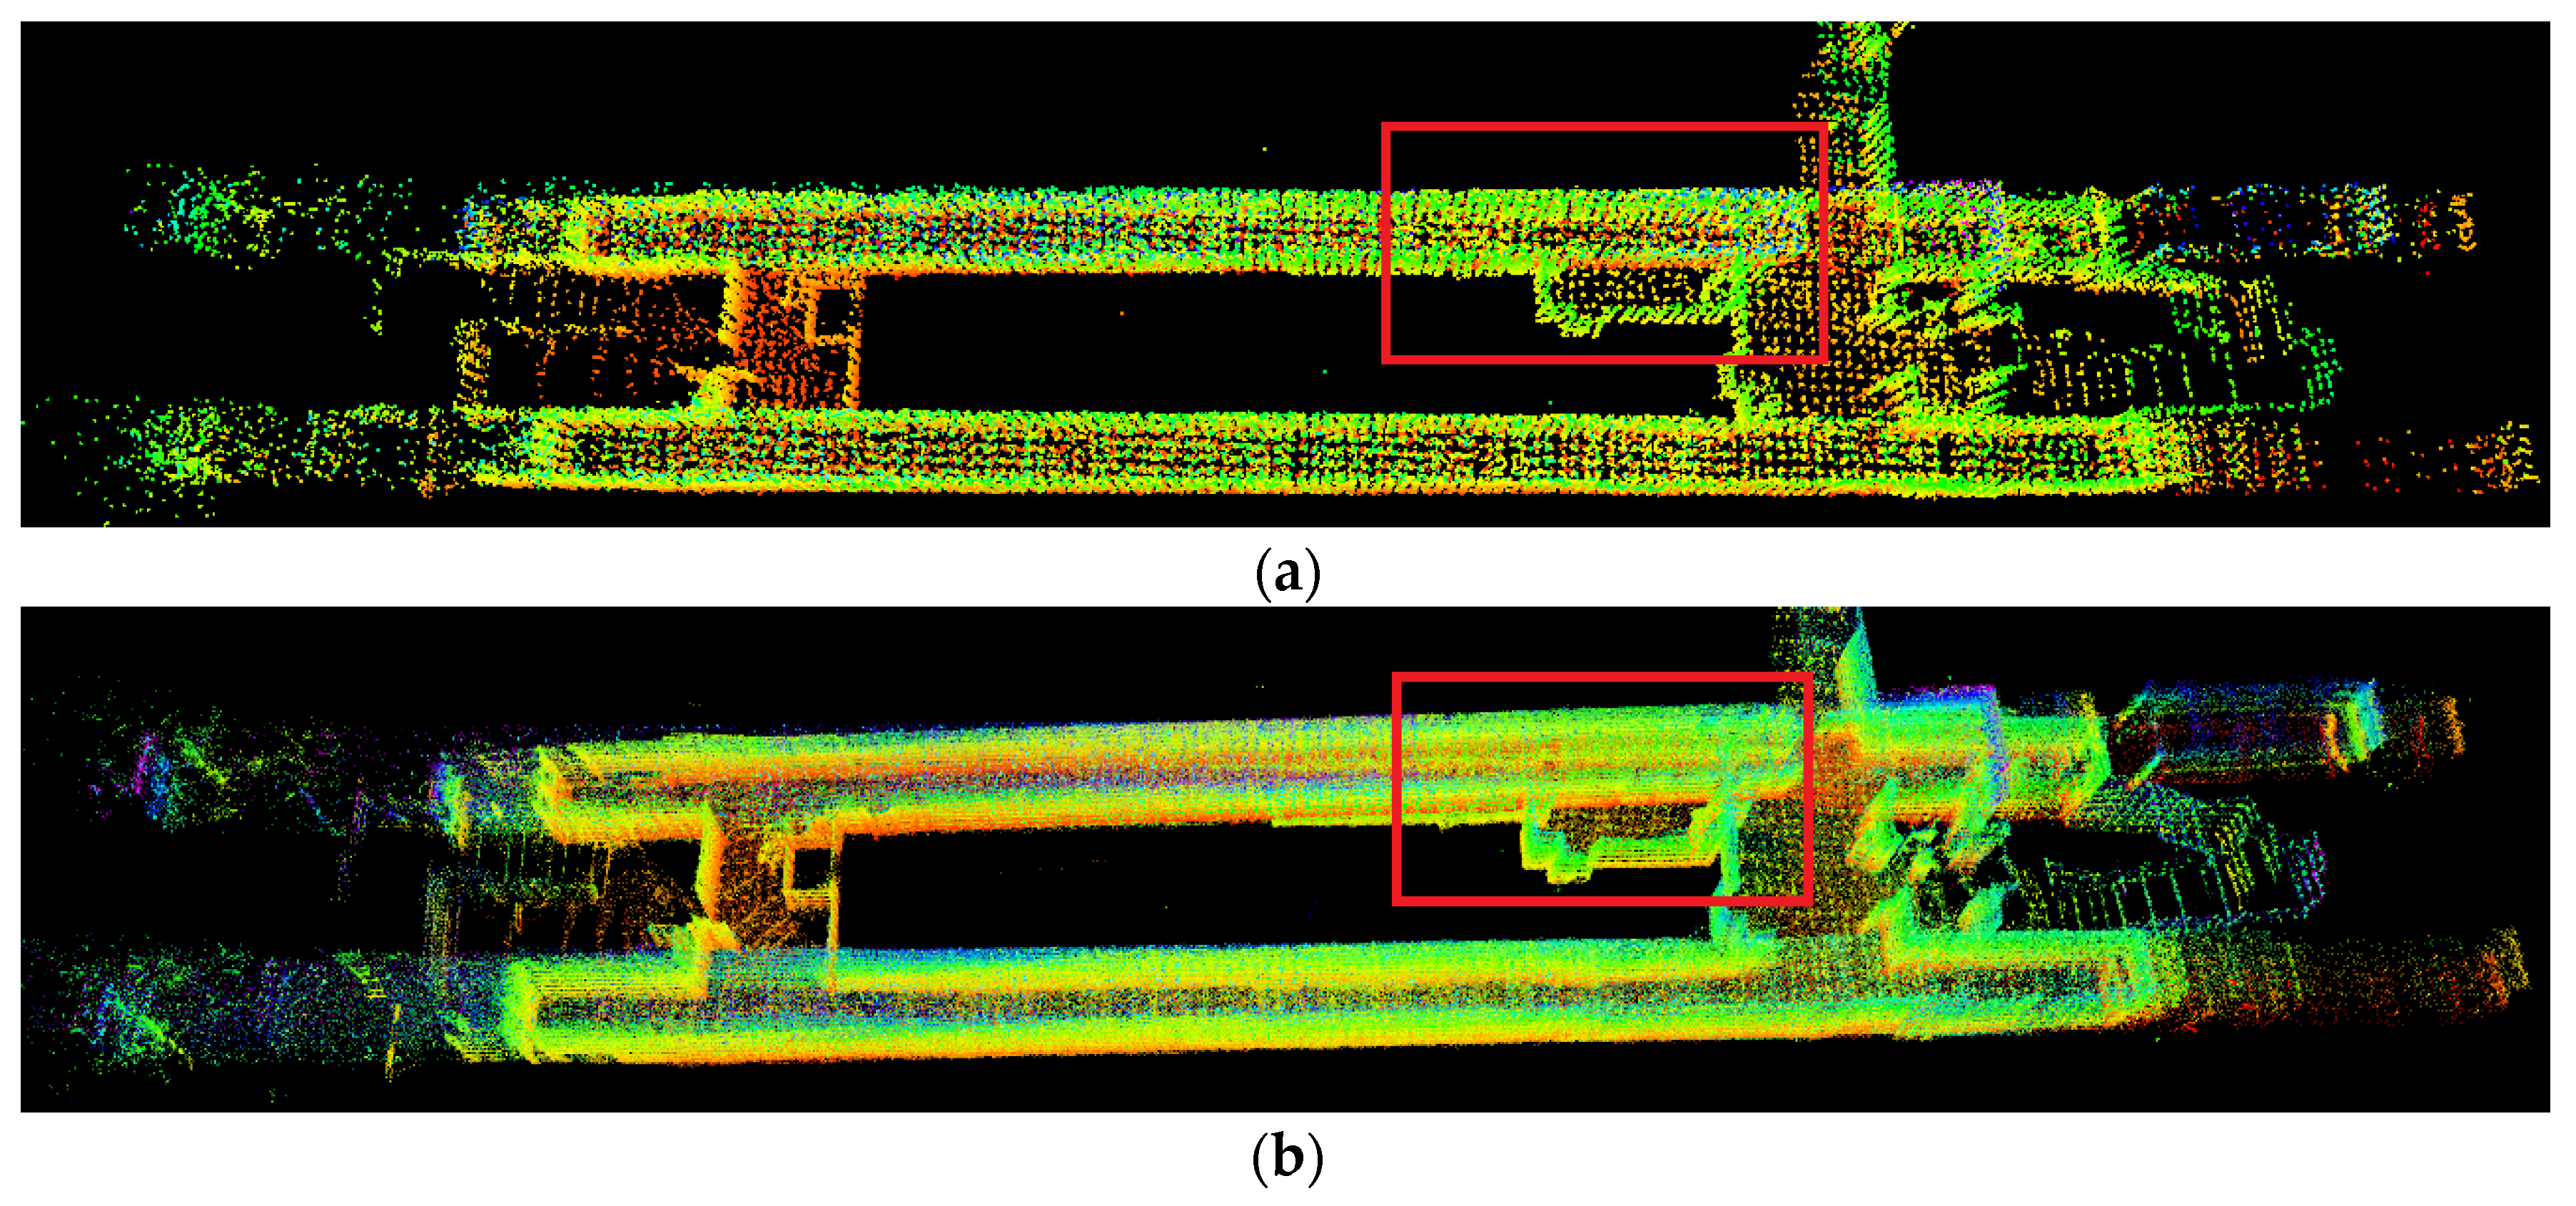
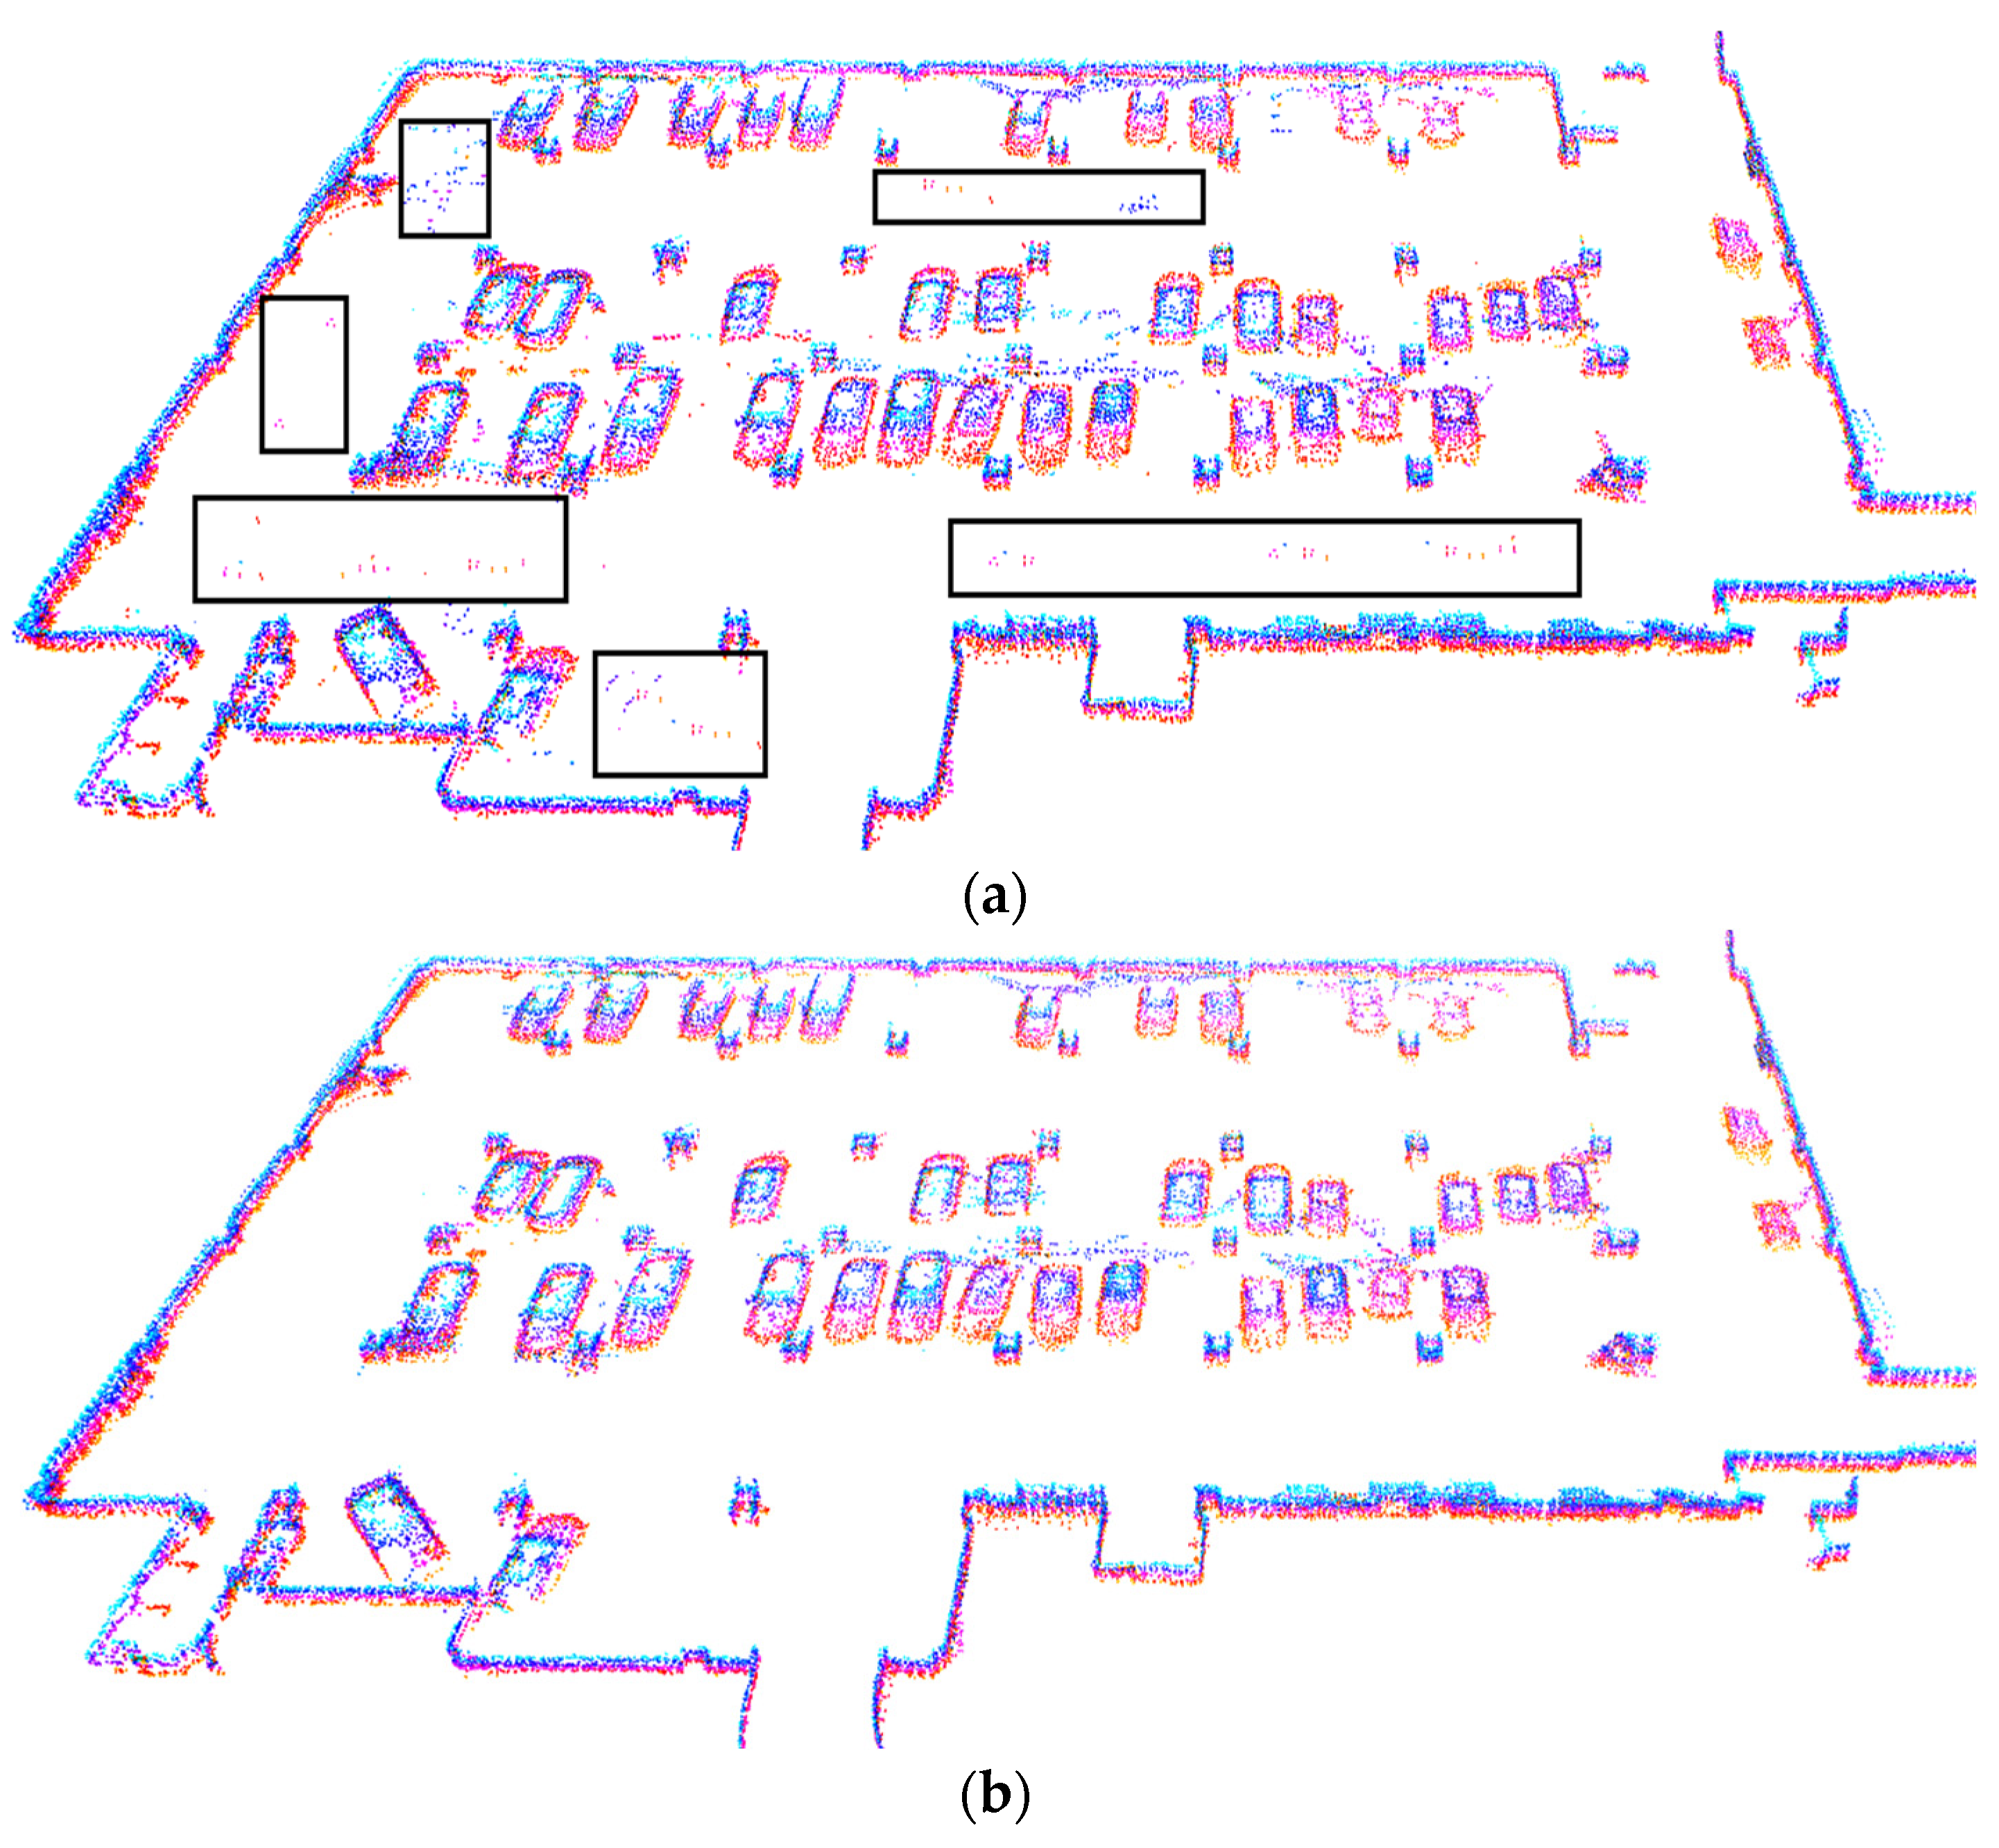
4.1. Comparison of Build Results

Figure 8 and Figure 9 show the maps of the underground parking lot and the looped corridor scenes constructed by the two algorithms LeGO-LOAM and LeGO-LOAM-SM, respectively. For comparison purposes, the red boxed parts of the maps are partially enlarged, as shown in Figure 10 and Figure 11, respectively.
It can be seen from Figure 8 and Figure 9 that, in the two scenarios, the map constructed by the improved algorithm is clearer and the effect is better. The point cloud map of scene 1 constructed by LeGO-LOAM (Figure 10) has a drift phenomenon, and the loopback effect is poor. However, the map constructed by the improved algorithm has a good coincidence at the starting point and the ending point (loopback), which makes up for the drift phenomenon of the point cloud map, and the loopback effect is better. In the point cloud map of scenario 2 constructed by LeGO-LOAM (Figure 11), there are two overlapping roads at the loopback position, and the ghost phenomenon occurs at the road edge, which indicates that the algorithm fails to detect the loopback well at the indicated road section, and the loopback detection omission occurs. However, the trajectory and point cloud map constructed by the improved algorithm LeGO-LOAM-SM at the same road section only have a slight ghost at the edge of the final loop, but the effect is better than that of the LeGO-LOAM.

4.2. Trajectory Comparison

Figure 12 shows the motion estimation trajectories of LeGO-LOAM and LeGO-LOAM-SM extracted by evo tool. It can be seen that the motion trajectory estimated by LeGO-LOAM has a large drift at sharp angle turns (the part circled in red in the figure), while the trajectory estimated by the improved algorithm is smoother, which proves that the overall positioning effect is better.
To verify the global consistency of the point cloud map constructed by the improved algorithm, the initial pose of the experimental platform was taken as the zero point, and several pose estimation experiments were carried out in two scenarios. when the experimental platform returns to the vicinity of the initial pose, the pose estimation data are obtained by LeGO-LOAM and LeGO-LOAM-SM, and the average value of the pose data of multiple experiments is taken as the final estimated pose. The results are shown in Table 3. It can be seen from Table 3 that, in the case of only using 3D lidar information, the improved algorithm LeGO-LOAM-SM achieves more accurate positioning and mapping effects, and the translation and rotation accuracy of the constructed map is approximately 5% higher than LeGO-LOAM.

5. Construction of Occupancy Grid Map

To improve the positioning and mapping accuracy, the LeGO-LOAM-SM algorithm does not eliminate ground points in the process of constructing the point cloud map. The constructed 3D point cloud map has a large amount of information and is intuitive, but contains more unnecessary details, occupies a large storage space, lacks the location information of the scene, and has poor stability. The mobile robot or unmanned vehicle cannot identify the feasible area and the infeasible area. It is difficult to use for subsequent path planning and navigation. The raster method is a commonly used modeling method for robot path planning. Therefore, it is necessary to convert the 3D point cloud map to the 3D octo-map or the 2D occupancy grid map after removing the ground points and filtering through the ground plane fitting, so as to make up for the deficiency that the point cloud map cannot meet the needs of autonomous navigation and obstacle avoidance.

5.1. Comparison of Build Results

The 3D octo-map can build a full 3D map of any environment without priori information. It can update the map by fusing new map data or sensor data at any time, and can flexibly expand the map range if need be, and occupies small storage space. In this paper, a ground plane fitting-based method is adopted to eliminate ground points [41], the threshold Thdist is experimentally set to 0.12 m, and the 3D octo-map is constructed based on the octo-map framework fusion filtering method. Figure 13 shows the 3D octo-map constructed on the basis of the 3D point cloud map of the scene of the underground parking lot.
The octo-map constructed by the robot during its movement will contain a large number of outliers due to environmental noise and other dynamic objects, as shown in the black box in Figure 13a. These outliers are not static obstacles, but noise and other dynamic objects, which will affect subsequent path planning. Therefore, filters such as Gaussian filters, radius filters and statistical outlier removal (SOR) are often used in the construction of an octo-map to reduce the influence of noise and other dynamic objects in the environment. SOR [42] mainly uses statistics to calculate the field of each point, and filters out points beyond the set threshold according to the calculated results to remove sparse outlier noise points. In this paper, the SOR filter is used to reduce the noise of outliers in the constructed octo-map. Through the noise reduction effect test of the number of adjacent points k and the coefficient ε1, the noise reduction effect is best when k = 15 and ε1 = 0.2. Figure 13b shows the 3D octo-map after SOR noise reduction, and almost all outliers in the black box are filtered out.

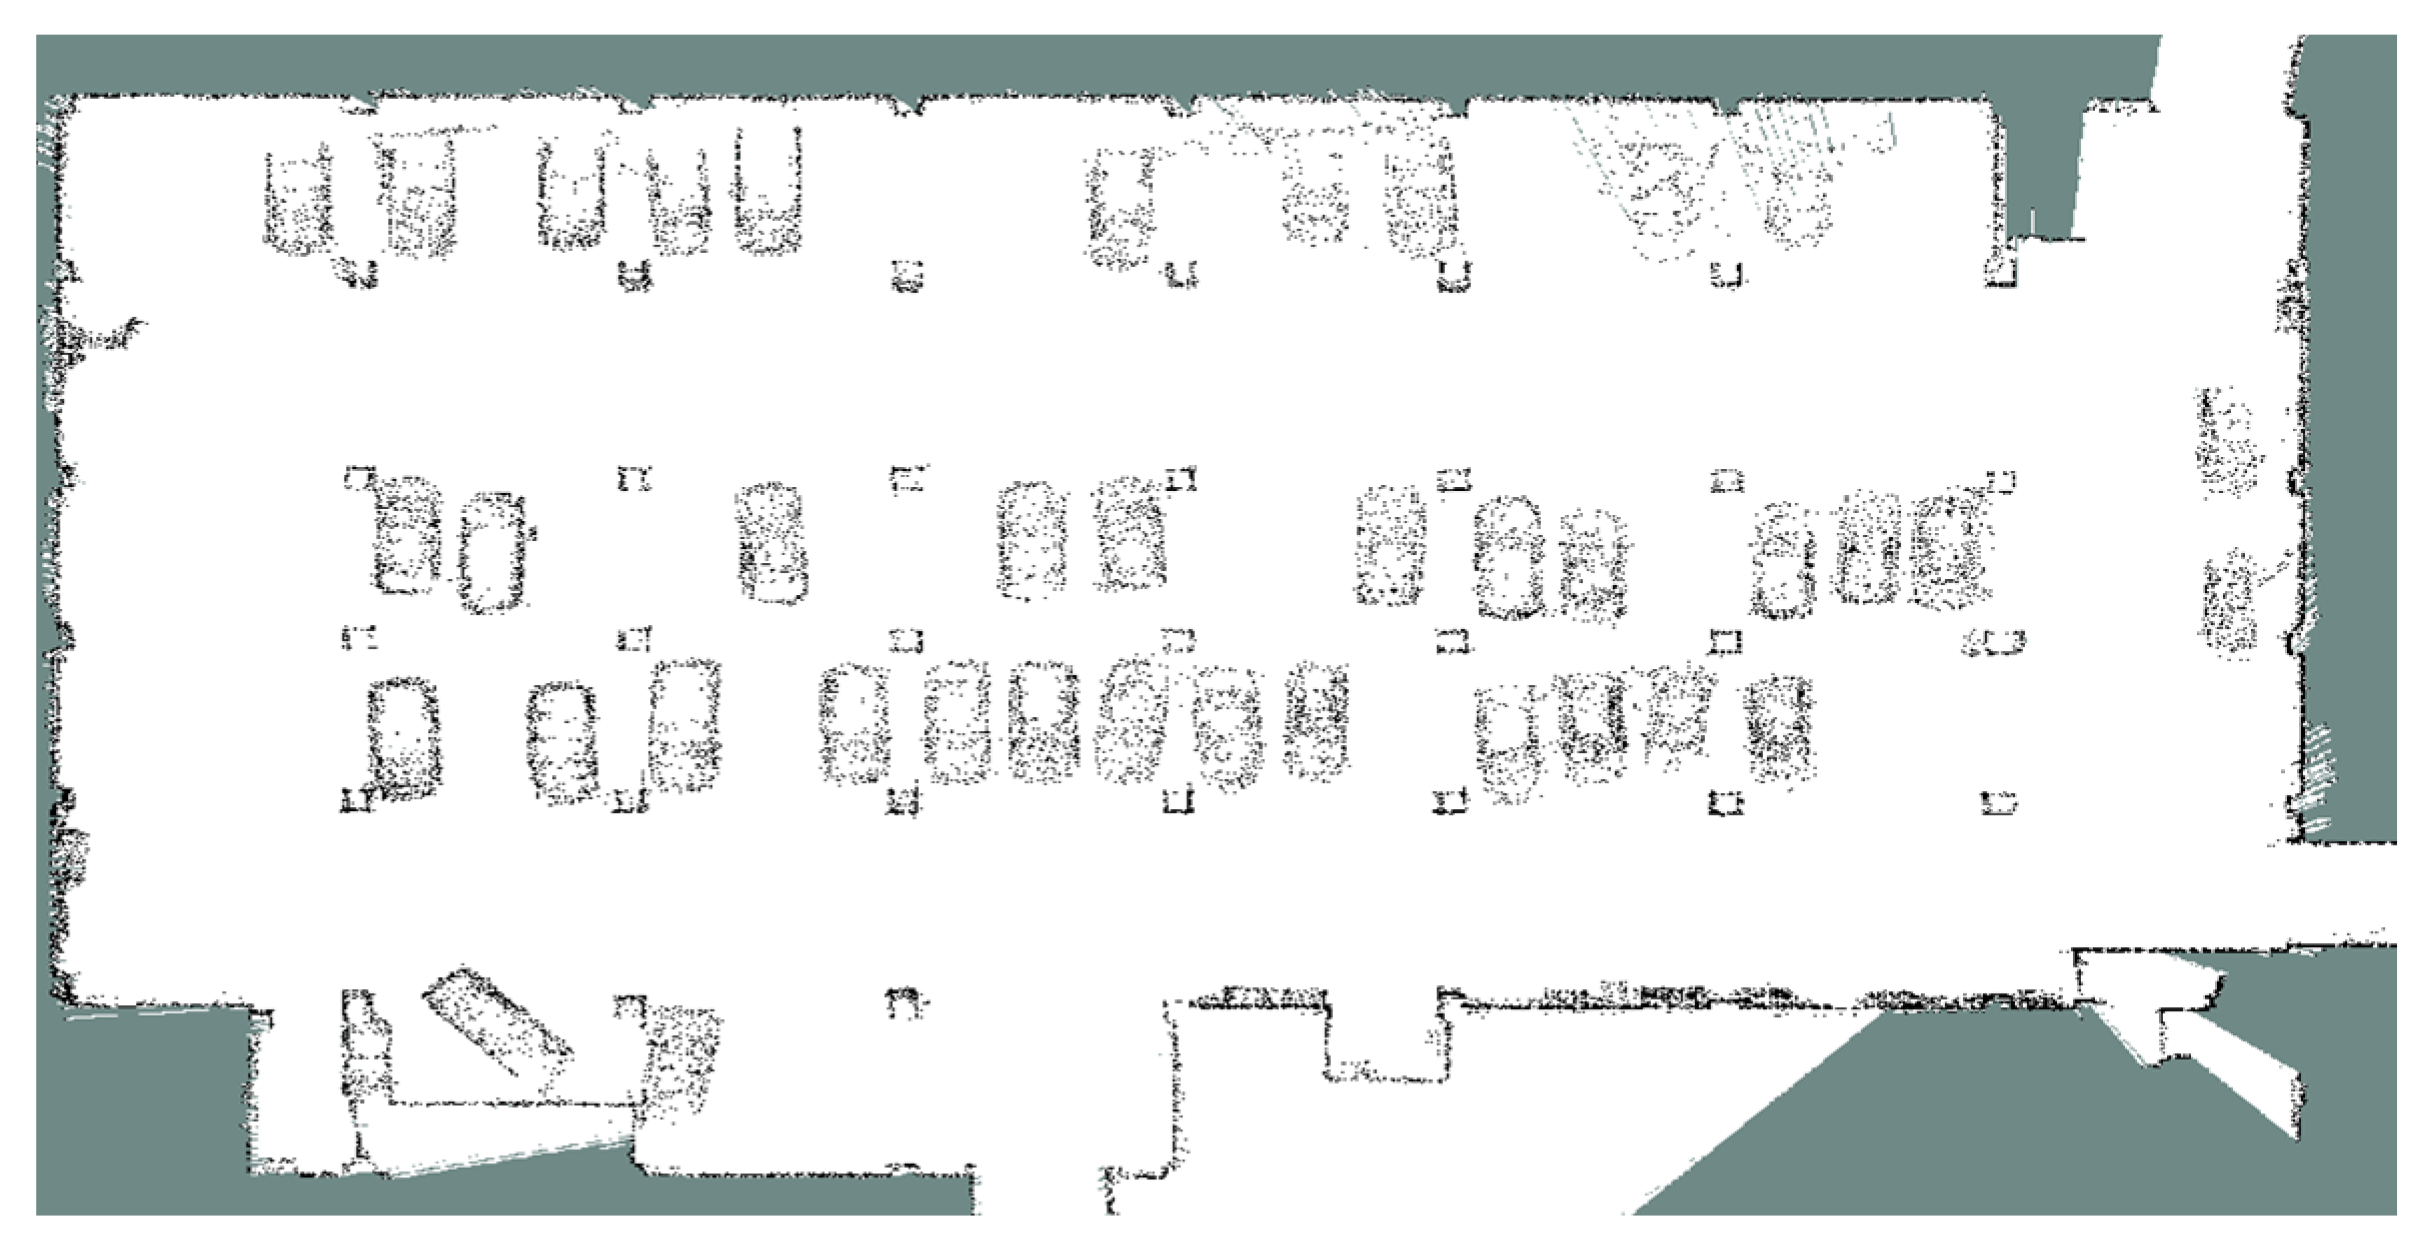
5.2. Two-Dimensional Occupancy Grid Map Construction

The corresponding 2D occupancy grid map is obtained by projecting the constructed 3D octo-map onto the 2D plane. Compared with the 2D occupancy grid map directly constructed by 2D LiDAR, the constructed 2D occupancy grid map contains the required three-dimensional obstacle information in 3D space instead of 2D obstacle information in the plane where LiDAR is located, which has a better obstacle avoidance effect for the mobile robot driving in the 3D space using the 2D occupancy grid map for path planning and navigation. Figure 14 shows the constructed 2D occupancy grid map of the underground parking lot scene.

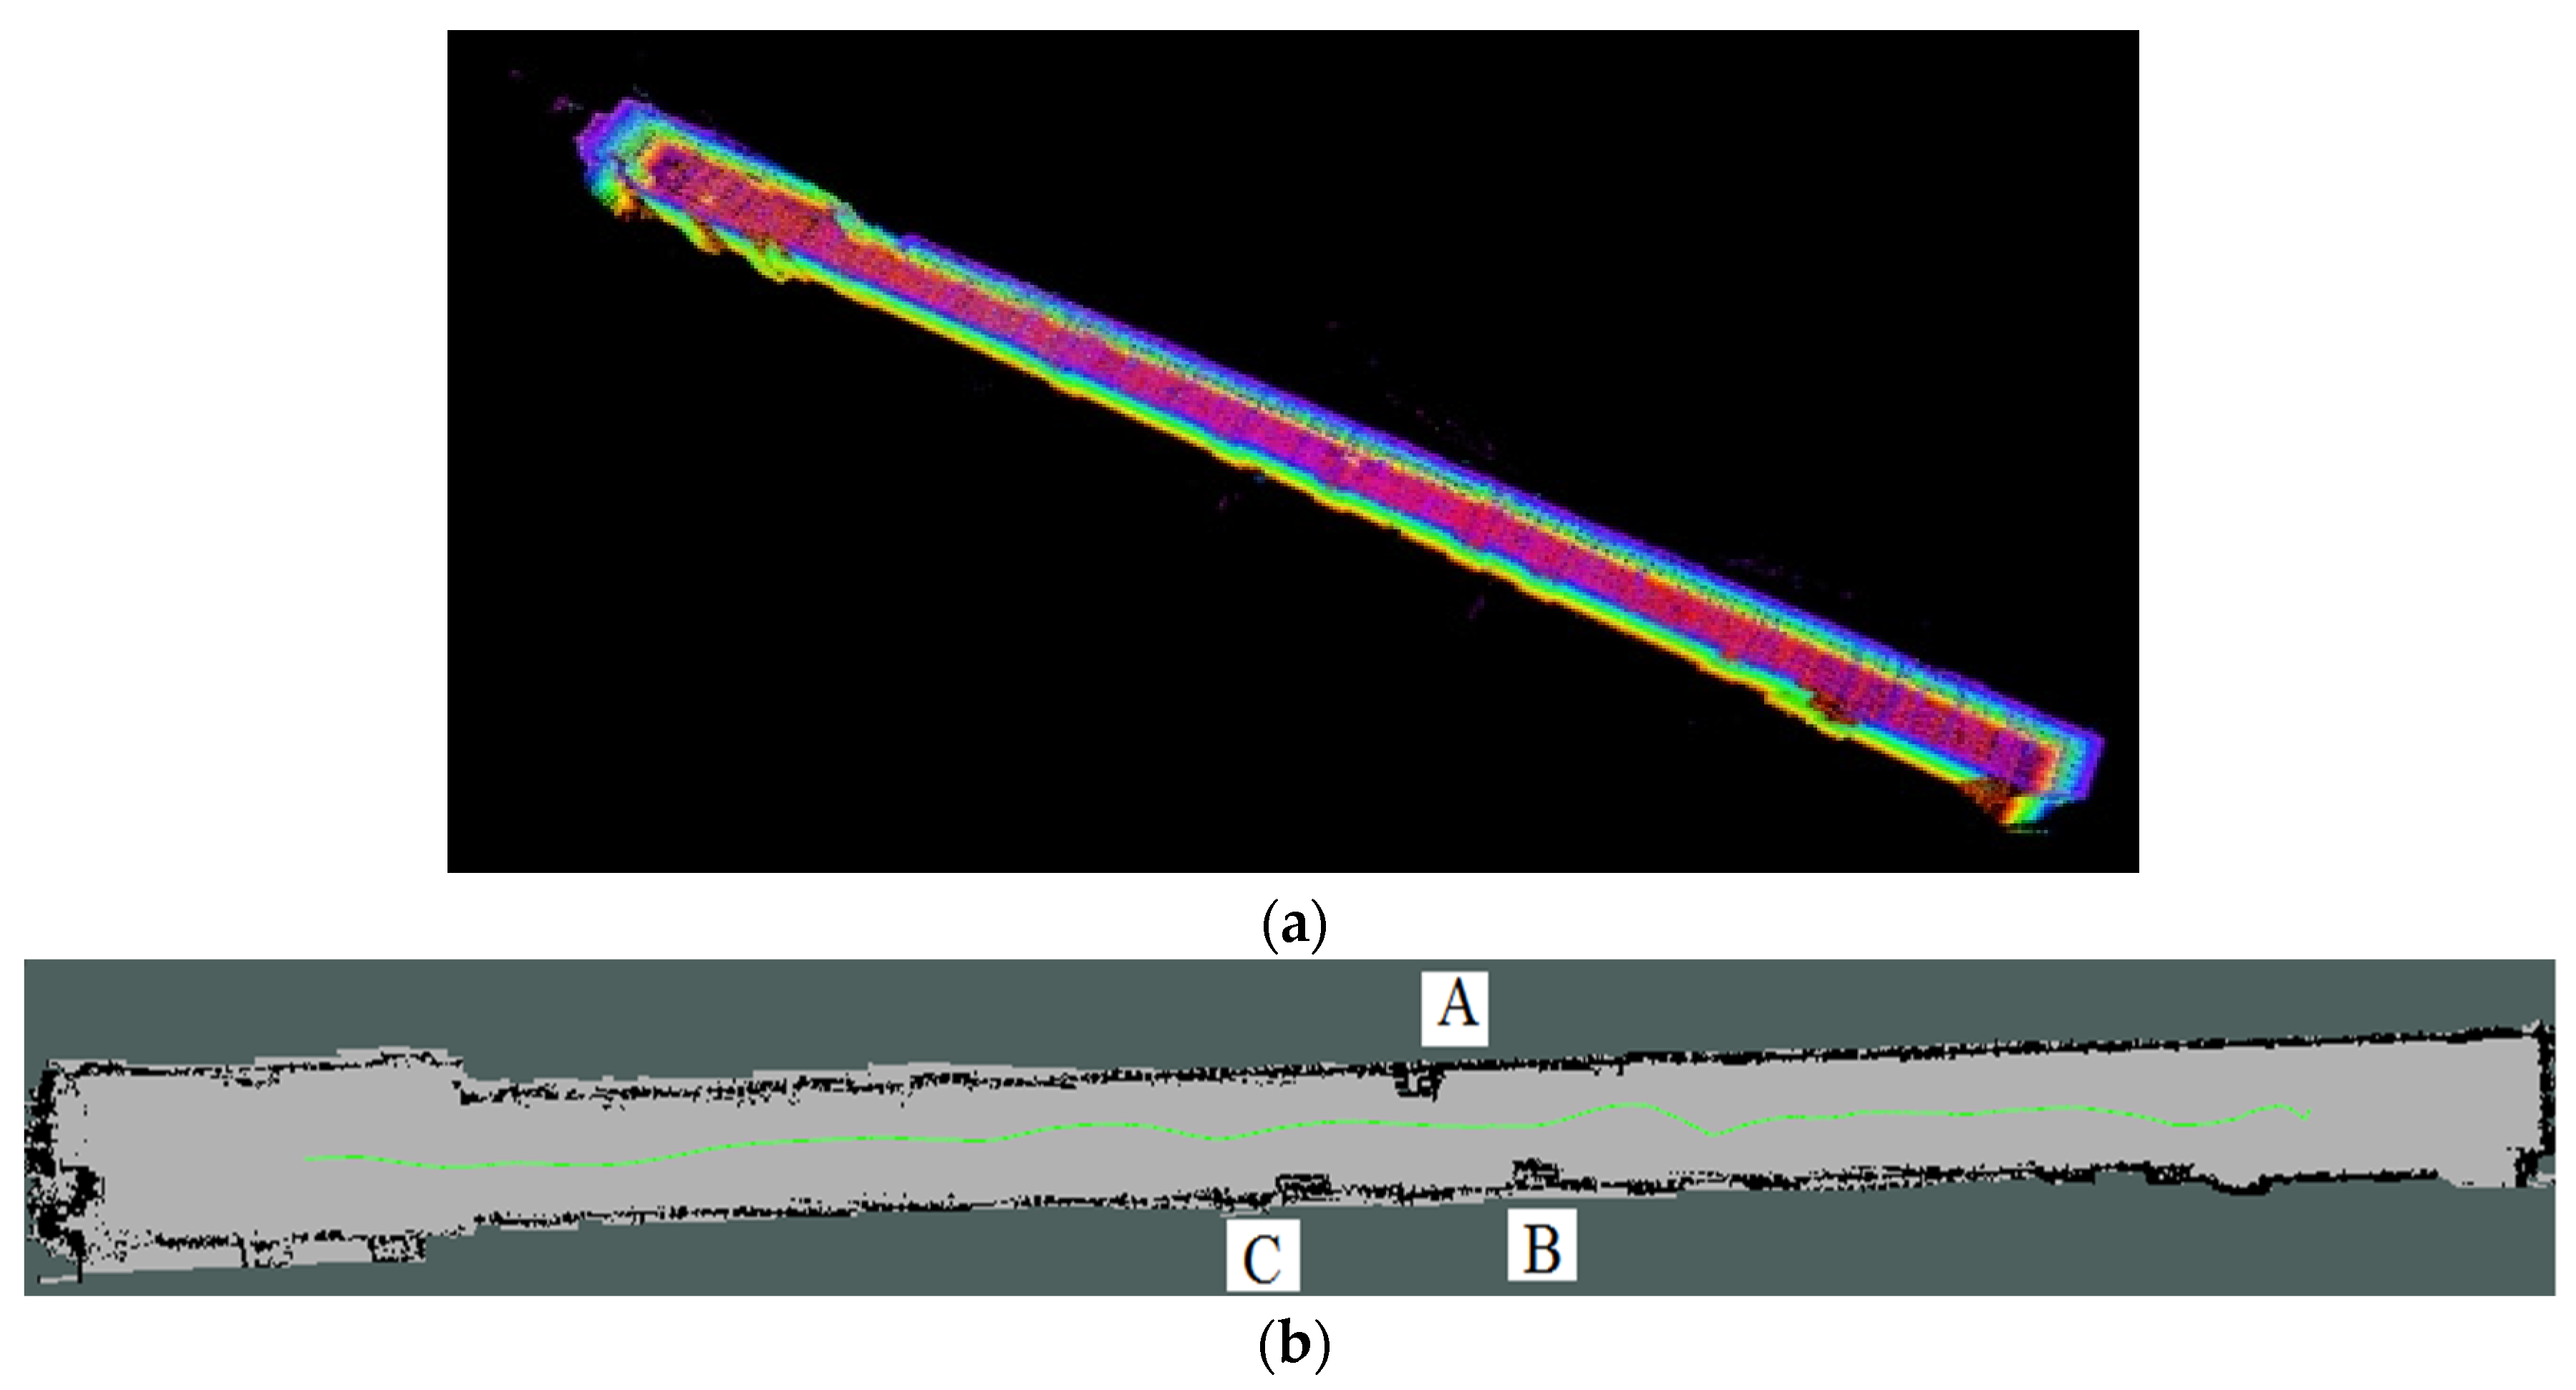
5.3. Simulation of Closed and Narrow Coal Mine Underground Environment Test

The corridor is used to simulate the closed and narrow roadway environment with few geometric features in the coal mine, and labeled as scene 3. Obstacles and pedestrians are set in the environment, as shown in Figure 15a, where static obstacles A, B, and C are in red boxes and dynamic pedestrians D are in green boxes. The 3D point cloud data are collected by the aforementioned experimental platform, as shown in Figure 15b. The point cloud map of the test scene is constructed by the improved LeGO-LOAM-SM algorithm, and then a 2D occupancy grid map is generated, as shown in Figure 16. As can be seen from the figure, the occupancy grid map filters out the dynamic obstacles (pedestrians) in the scene, while the static obstacles (A, B, and C in the figure) are retained. There are no outliers in the white passable area, which provides an available map for path planning.
For the acquisition of the true values of the actual size and the obstacle size in the experimental scene, the UT393A laser rangefinder is used to measure the whole size of the scene and the obstacle sizes. Its ranging principle is based on the particle nature of light, and its measurement accuracy is better than 1.5 mm. This is suitable for evaluating the accuracy of the mapping due to the ±2 cm accuracy of the LiDAR in the experiment. The measurement results of the laser rangefinder and the corresponding values estimated by the constructed 2D occupancy grid map are listed in Table 4. It can be seen from Table 4 that the 2D occupancy grid map constructed by the improved LeGO-LOAM-SM algorithm have good accuracy with an error within 0.01 m, which meets the requirements of path planning.
Table 5 summarizes the memory occupied by the constructed point cloud map, 3D octo-map, and 2D occupancy grid map constructed for the three scenes in the paper.
It can be seen from Table 5 that, compared with the point cloud map, the 3D octo-map compresses the detailed information contained in the point cloud map, saves a large amount of storage space, and solves the problem that the point cloud map cannot provide the spatial information of obstacles; the 2D occupancy grid map further reduces the occupied memory space while retaining the obstacle information, reduces the robot’s hardware requirements, improves the system’s real-time performance, and provides map support for the robot’s path planning and autonomous navigation in the complex environment of coal mines.

6. Conclusions

(1) Aiming at the deficiency of LeGO-LOAM, a LeGO-LOAM-SM algorithm fuses LeGO-LOAM and SegMatch is proposed. SegMatch algorithm is used to optimize the loopback detection of LeGO-LOAM, and ICP algorithm is used to optimize the global map. The test results of KITTI dataset and practical experiments show that the improved algorithm has higher accuracy, better overall consistency and local accuracy, and higher accuracy in long-distance large-scale scenes.
(2) The mapping and pose estimation performance of LeGO-LOAM and LeGO-LOAM-SM algorithms are tested and compared with the Kitti dataset 00 sequence. The results show that LeGO-LOAM-SM makes up for the drift phenomenon of long-distance point cloud map construction compared with LeGO-LOAM, and the coincidence of motion trajectory estimation and ground-truth trajectory is higher, the loopback is smoother, and the estimated trajectory length is closer to the ground-truth trajectory length.
(3) To verify the feasibility of applying the LeGO-LOAM-SM algorithm to mobile robots in coal mines, a crawler experimental platform equipped with LiDAR is used to simulate the map construction experiments of mobile robots or vehicles in coal mines in different simulated closed scenes. The results show that the improved algorithm can build a clearer map than the LeGO-LOAM algorithm, with a better loopback effect, smoother estimated trajectories, more accurate overall positioning, and a 5% improvement in translation and rotation accuracy, which can achieve higher accuracy point cloud map construction and pose estimation.
(4) To address the problem that the point cloud map contains a large amount of detail information and lacks the location information of the scene, the dynamic noise reduction method of the SOR filter to filter outliers and the construction method of the 2D and 3D occupied grid map are studied, and the simulation environment test of the underground coal mine is carried out. The results show that the constructed grid map can effectively filter out dynamic obstacles, has a mapping accuracy of 0.01 m, and the required storage space is smaller than the point cloud map by three orders of magnitude.

Author Contributions

Conceptualization, G.X. and R.L.; methodology, G.X., R.L. and J.W.; software, R.L. and J.W.; validation, R.L. and J.W.; formal analysis, R.L. and S.L.; investigation, R.L. and S.L.; resources, G.X.; data curation, R.L. and G.X.; writing—original draft preparation, G.X., R.L. and J.W.; writing—review and editing, G.X., R.L. and S.L.; visualization, R.L. and J.W.; supervision, G.X.; project administration, G.X.; funding acquisition, G.X. All authors have read and agreed to the published version of the manuscript.

Funding

This research and the APC was funded by General Program of National Natural Science Foundation of China (Grant No: 51874308) and National Key Basic Research Program of China (Grant No: 2014CB046306).

Institutional Review Board Statement

Not applicable.

Informed Consent Statement

Not applicable.

Data Availability Statement

Not applicable.

Conflicts of Interest

The authors declare no conflict of interest.

References

  1. Shirong, G.E.; Eryi, H.U.; Wenliang, P.E.I. Classification system and key technology of coal mine robot. J. China Coal Soc. 2020, 45, 455–463. [Google Scholar] [CrossRef]
  2. Jianjian, Y.; Qiang, Z.; Chao, W.; Boshen, C.; Xiaolin, W.; Shirong, G.; Miao, W. Status and development of robotization research on roadheader for coal mines. J. China Coal Soc. 2020, 45, 2995–3005. [Google Scholar] [CrossRef]
  3. Smith, R.C.; Cheeseman, P. On the representation and estimation of spatial uncertainty. Int. J. Robot. Res. 1986, 5, 56–68. [Google Scholar] [CrossRef]
  4. Durrant-Whyte, H.F. Consistent integration and propagation of disparate sensor observations. Inter-Natl. J. Robot. Res. 1987, 6, 3–24. [Google Scholar] [CrossRef]
  5. Huang, L. Review on LiDAR-based SLAM Techniques. In Proceedings of the 2021 International Conference on Signal Processing and Machine Learning (CONF-SPML), Beijing, China, 18–20 August 2021. [Google Scholar] [CrossRef]
  6. Taheri, H.; Xia, Z.C. SLAM; definition and evolution. Eng. Appl. Artif. Intell. 2021, 97, 104032. [Google Scholar] [CrossRef]
  7. Qin, T.; Li, P.; Shen, S. VINS-Mono: A Robust and Versatile Monocular Visual-Inertial State Estimator. IEEE Trans. Robot. 2018, 34, 1004–1020. [Google Scholar] [CrossRef]
  8. Zhang, T.; Zhang, H.; Li, Y.; Nakamura, Y.; Zhang, L. FlowFusion: Dynamic Dense RGB-D SLAM Based on Optical Flow. In Proceedings of the 2020 IEEE International Conference on Robotics and Automation (ICRA), Paris, France, 31 May–31 August 2020. [Google Scholar] [CrossRef]
  9. Campos, C.; Elvira, R.; Rodríguez, J.J.G.; Montiel, J.M.M.; Tardós, J.D. Orb-slam3: An accurate open-source library for visual, visual–inertial, and multimap slam. IEEE Trans. Robot. 2021, 37, 1874–1890. [Google Scholar] [CrossRef]
  10. Chen, X.; Milioto, A.; Palazzolo, E.; Giguère, P.; Behley, J.; Stachniss, C. SuMa++: Efficient LiDAR-based Semantic SLAM. In Proceedings of the International Conference on Intelligent Robots and Systems (IROS), Macau, China, 4–8 November 2019. [Google Scholar] [CrossRef]
  11. Li, K.; Li, M.; Hanebeck, U.D. Towards high-performance solid-state-lidar-inertial odometry and mapping. IEEE Robot. Autom. Lett. 2021, 6, 5167–5174. [Google Scholar] [CrossRef]
  12. Bai, C.; Xiao, T.; Chen, Y.; Wang, H.; Zhang, F.; Gao, X. Faster-LIO: Lightweight Tightly Coupled Lidar-Inertial Odometry Using Parallel Sparse Incremental Voxels. IEEE Robot. Autom. Lett. 2022, 7, 4861–4868. [Google Scholar] [CrossRef]
  13. Chen, Y.; Tang, J.; Hyyppä, J.; Wen, Z.; Li, C.; Zhu, T. Mobile laser scanning based 3D technology for mineral environment modeling and positioning. In Proceedings of the 2016 Fourth International Conference on Ubiquitous Positioning, Indoor Navigation and Location Based Services (UPINLBS), Shanghai, China, 3–4 November 2016. [Google Scholar] [CrossRef]
  14. Li, M.; Zhu, H.; You, S.; Tang, C.; Li, Y. Efficient laser-based 3D SLAM in real time for coal mine rescue robots. In Proceedings of the 2018 IEEE 8th Annual International Conference on CYBER Technology in Automation, Control, and Intelligent Systems (CYBER), Tianjin, China, 19–23 July 2018. [Google Scholar] [CrossRef]
  15. Yang, L.; Ma, H.; Wang, Y.; Wang, C.; Zhang, Z. Research on method of simultaneous localization and mapping of coal mine inspection robot. Ind. Mine Autom. 2019, 45, 18–24. [Google Scholar]
  16. Yang, J.; Wang, C.; Zhang, Q.; Chang, B.; Wang, F.; Wang, X.; Wu, M. Modeling of Laneway Environment and Locating Method of Roadheader Based on Self-Coupling and Hector SLAM. In Proceedings of the 2020 5th International Conference on Electromechanical Control Technology and Transportation (ICECTT), Nanchang, China, 15–17 May 2020. [Google Scholar] [CrossRef]
  17. Cowley, A.; Miller, I.D.; Taylor, C.J. UPSLAM: Union of panoramas SLAM. In Proceedings of the 2021 IEEE International Conference on Robotics and Automation (ICRA), Xi’an, China, 30 May–5 June 2021. [Google Scholar] [CrossRef]
  18. Xu, J.; Huang, Y.; Zhao, R.; Liu, Y.; Li, H. Probabilistic Membrane Computing-Based SLAM for Patrol UAVs in Coal Mines. J. Sens. 2021, 2021, 7610126. [Google Scholar] [CrossRef]
  19. Ren, Z.; Wang, L.; Bi, L. Robust GICP-based 3D LiDAR SLAM for underground mining environment. Sensors 2019, 19, 2915. [Google Scholar] [CrossRef] [PubMed]
  20. Ren, Z.; Wang, L. Accurate Real-Time Localization Estimation in Underground Mine Environments Based on a Distance-Weight Map (DWM). Sensors 2022, 22, 1463. [Google Scholar] [CrossRef] [PubMed]
  21. Zhang, J.; Singh, S. LOAM: Lidar odometry and mapping in real-time. In Proceedings of the Robotics: Science and Systems, wheeler hall, Berkeley, CA, USA, 12–16 July 2014. [Google Scholar] [CrossRef]
  22. Zhang, J.; Singh, S. Low-drift and real-time lidar odometry and mapping. Auton. Robot. 2017, 41, 401–416. [Google Scholar] [CrossRef]
  23. Salti, S.; Tombari, F.; di Stefano, L. SHOT: Unique signatures of histograms for surface and texture description. Comput. Vis. Image Underst. 2014, 125, 251–264. [Google Scholar] [CrossRef]
  24. Guo, J.; Borges, P.V.K.; Park, C.; Gawel, A. Local descriptor for robust place recognition using lidar intensity. IEEE Robot. Autom. Lett. 2019, 4, 1470–1477. [Google Scholar] [CrossRef]
  25. Guo, Y.; Bennamoun, M.; Sohel, F.A.; Lu, M.; Wan, J.; Kwok, N.M. A comprehensive performance evaluation of 3D local feature descriptors. Int. J. Comput. Vis. 2016, 116, 66–89. [Google Scholar] [CrossRef]
  26. Rizzini, D.L. Place recognition of 3D landmarks based on geometric relations. In Proceedings of the 2017 IEEE/RSJ International Conference on Intelligent Robots and Systems (IROS), Vancouver, BC, Canada, 24–28 September 2017. [Google Scholar] [CrossRef]
  27. Scan Context: Egocentric Spatial Descriptor for Place Recognition Within 3D Point Cloud Map. In Proceedings of the International Conference on Intelligent Robots and Systems (IROS), Madrid, Spain, 1–5 October 2018. [CrossRef]
  28. Wang, Y.; Sun, Z.; Xu, C.-Z.; Sarma, S.E.; Yang, J.; Kong, H. Lidar iris for loop-closure detection. In Proceedings of the 2020 IEEE/RSJ International Conference on Intelligent Robots and Systems (IROS), Las Vegas, CA, US, 24–30 October 2020. [Google Scholar] [CrossRef]
  29. Dubé, R.; Dugas, D.; Stumm, E.; Nieto, J.; Siegwart, R.; Cadena, C. Segmatch: Segment based place recognition in 3d point clouds. In Proceedings of the 2017 IEEE International Conference on Robotics and Automation (ICRA), Singapore, 29 May–3 June 2017. [Google Scholar] [CrossRef]
  30. Douillard, B.; Quadros, A.; Morton, P.; Underwood, J.P.; de Deuge, M.; Hugosson, S.; Hallström, M.; Bailey, T. Scan segments matching for pairwise 3D alignment. In Proceedings of the 2012 IEEE International Conference on Robotics and Automation, St Paul, MN, USA, 14–18 May 2012. [Google Scholar] [CrossRef]
  31. Nieto, J.; Bailey, T.; Nebot, E. Scan-SLAM: Combining EKF-SLAM and scan correlation. In Proceedings of the Field and Service Robotics, QLD, Australia, 29–31 July 2005. [Google Scholar] [CrossRef]
  32. Li, Y.; Su, P.; Cao, M.; Chen, H.; Jiang, X.; Liu, Y. Semantic Scan Context: Global Semantic Descriptor for LiDAR-based Place Recognition. In Proceedings of the 2021 IEEE International Conference on Real-time Computing and Robotics (RCAR), Xining, China, 15–19 July 2021. [Google Scholar] [CrossRef]
  33. Zhou, Y.; Wang, Y.; Poiesi, F.; Qin, Q.; Wan, Y. Loop closure detection using local 3D deep descriptors. IEEE Robot. Autom. Lett. 2021, 7, 6335–6342. [Google Scholar] [CrossRef]
  34. Ma, J.; Zhang, J.; Xu, J.; Ai, R.; Gu, W.; Chen, X. Overlap Transformer: An Efficient and Yaw-Angle-Invariant Transformer Network for LiDAR-Based Place Recognition. IEEE Robot. Autom. Lett. 2022, 7, 6958–6965. [Google Scholar] [CrossRef]
  35. Shan, T.; Englot, B. LeGO-LOAM: Lightweight and Ground-Optimized Lidar Odometry and Mapping on Variable Terrain. In Proceedings of the International Conference on Intelligent Robots and Systems (IROS), Madrid, Spain, 1–5 October 2018. [Google Scholar] [CrossRef]
  36. Ji, X.; Zuo, L.; Zhang, C.; Liu, Y. Lloam: Lidar odometry and mapping with loop-closure detection based correction. In Proceedings of the International Conference on Mechatronics and Automation (ICMA), Tianjin, China, 4–8 August 2019. [Google Scholar] [CrossRef]
  37. Meng, Z.; Wang, C.; Han, Z.; Ma, Z. Research on 3d Laser Navigation of Mobile Robot Based on Segmentation Matching and SLAM. In Proceedings of the 2020 5th International Conference on Automation, Control and Robotics Engineering (CACRE), Shenyang University of Technology, Shenyang, China, 19–20 September 2020. [Google Scholar] [CrossRef]
  38. Xue, G.; Wei, J.; Li, R.; Cheng, J. LeGO-LOAM-SC: An Improved Simultaneous Localization and Mapping Method Fusing LeGO-LOAM and Scan Context for Underground Coalmine. Sensors 2022, 22, 520. [Google Scholar] [CrossRef]
  39. Hornung, A.; Wurm, K.M.; Bennewitz, M.; Stachniss, C.; Burgard, W. OctoMap: An efficient probabilistic 3D mapping framework based on octrees. Auton. Robot. 2013, 34, 189–206. [Google Scholar] [CrossRef]
  40. Geiger, A.; Lenz, P.; Urtasun, R. Are we ready for autonomous driving? the kitti vision benchmark suite. In Proceedings of the 2012 IEEE Conference on Computer Vision and Pattern Recognition, Providence, RI, USA, 16–21 June 2012. [Google Scholar]
  41. Zermas, D.; Izzat, I.; Papanikolopoulos, N. Fast segmentation of 3d point clouds: A paradigm on lidar data for autonomous vehicle applications. In Proceedings of the 2017 IEEE International Conference on Robotics and Automation (ICRA), Singapore, 29 May–3 June 2017. [Google Scholar] [CrossRef]
  42. Zhang, Z.; Wang, D.; Liu, N.; Feng, X.; Geng, N.; Hu, S. Research on the preprocessing method of blade point cloud based on structured light on-machine measurement. Chin. J. Sci. Instrum. 2020, 41, 55–66. [Google Scholar] [CrossRef]
Figure 1. Block diagram of the LeGO-LOAM-SM algorithm.
Energies 15 06256 g001
Figure 2. Point cloud visualization results after SegMatch segmentation and feature extraction: (a) for the source point cloud; and (b) for the target point cloud.
Energies 15 06256 g002
Figure 3. Visual effect of the geometric verification of extracted descriptors using SegMatch: (a) object A and object B in the source cloud; and (b) object C and object D in the target cloud.
Energies 15 06256 g003
Figure 4. Point cloud map of the KITTI dataset 00 sequence constructed by the LeGO-LOAM and LeGO-LOAM-SM. Color represents elevation: (a) LeGO-LOAM; and (b) LeGO-LOAM-SM.
Energies 15 06256 g004
Figure 5. Partial enlarged view of the red box portion of Figure 4: (a) for LeGO-LOAM; (b) for LeGO-LOAM-SM.
Energies 15 06256 g005
Figure 6. Comparison of the motion trajectories of LeGO-LOAM-SM and LeGO-LOAM.
Energies 15 06256 g006
Figure 7. Experimental scene and experimental platform: (a) Scene 1: the underground parking lot; and (b) Scene 2: the building corridor with looped structure.
Energies 15 06256 g007
Figure 8. Point cloud map constructed for Scene 1: (a) by LeGO-LOAM; and (b) by LeGO-LOAM-SM.
Energies 15 06256 g008
Figure 9. Point cloud map constructed for Scene 2: (a) by LeGO-LOAM; and (b) by LeGO-LOAM-SM.
Energies 15 06256 g009
Figure 10. Partial enlarged view of the red boxed section in Figure 8: (a) for LeGO-LOAM; and (b) for LeGO-LOAM-SM.
Energies 15 06256 g010
Figure 11. Partial enlarged view of the red boxed section in Figure 9: (a) for LeGO-LOAM; and (b) for LeGO-LOAM-SM.
Energies 15 06256 g011
Figure 12. The motion estimation trajectories of LeGO-LOAM and LeGO-LOAM-SM: (a) for Scene 1; and (b) for Scene 2.
Energies 15 06256 g012aEnergies 15 06256 g012b
Figure 13. The 3D octo-map: (a) the original map without SOR filter, with outliers due to noise or dynamic interference shown in the black box; and (b) the map with SOR filter, as can be seen the outliers in the black box, are almost completely filtered out.
Energies 15 06256 g013
Figure 14. Construction of 2D occupancy grid map for the underground parking lot scene.
Energies 15 06256 g014
Figure 15. Scene 3: underground coal mine roadway simulated environment and experiment platform: (a) static obstacle and pedestrian; and (b) the whole scene and experiment platform.
Energies 15 06256 g015
Figure 16. Constructed map of underground coal mine simulation scenario: (a) the point cloud map; and (b) 2D occupancy raster map.
Energies 15 06256 g016
Table 1. The estimated length and its deviation of the KITTI dataset 00 sequence trajectory by LeGO-LOAM and LeGO-LOAM-SM.
Evaluation IndicatorsLeGO-LOAMLeGO-LOAM-SMImprovement (%)
Trajectory length/m3733.443719.69/
Deviation 1/m9.254.5051.4%
1 The ground-truth trajectory length is 3724.19 m. The deviation value is the absolute value of the difference between the estimated value and the ground-truth value.
Table 2. ATE and RPE of KITTI dataset 00 sequence estimated by LeGO-LOAM-SM and LeGO-LOAM.
LeGO-LOAMLeGO-LOAM-SM
ATE/mRPEATE/mRPE
Maximum error11.116.1745.672.312
Minimum error1.160.0050.200.005
Average error5.370.0612.040.060
Standard deviation2.740.1461.040.055
Mean square error6.030.1592.210.084
Table 3. Relative pose estimation error of LeGO-LOAM and LeGO-LOAM-SM in the scenes of the underground parking lot and the looped corridor.
Scene 1Scene 2
LeGO-LOAMLeGO-LOAM-SMLeGO-LOAMLeGO-LOAM-SM
Panning X/m−0.750.150.760.47
Panning Y/m0.150.060.20−0.21
Panning Z/m13.8912.427.496.52
Total panning/m13.9112.427.536.54
Pitch angle/deg−2.350.9210.289.92
Declination angle/deg0.64−6.258.037.68
Rolling angle/deg6.31−0.611.020.99
Total rotation/deg6.766.3513.0812.58
Table 4. The measurement results of the laser rangefinder and the corresponding estimated values by the constructed 2D occupancy grid map.
Measurement Size/mEstimated Size/m
LengthWidthLengthWidth
Simulation scenario46.8031.82246.811.82
Obstacle A0.7650.4110.770.42
Obstacle B0.5670.3780.560.37
Obstacle C0.6880.2100.680.22
Table 5. The memory occupied by the constructed point cloud map, 3D octo-map, and 2D occupancy grid map constructed for the three scenes.
3D Point Cloud Map/Mb3D Octo-Map/Kb2D Occupancy Grid Map/Kb
Scene 124.362.316.3
Scene 235.673.826.7
Scene 317.854.513.4
Publisher’s Note: MDPI stays neutral with regard to jurisdictional claims in published maps and institutional affiliations.

