Article

Torrefaction of Pulp Industry Sludge to Enhance Its Fuel Characteristics

by
Tharaka Rama Krishna C. Doddapaneni
1,*,
Linnar Pärn
2 and
Timo Kikas
1
1
Chair of Biosystems Engineering, Institute of Forestry and Engineering, Estonian University of Life Sciences, Kreutzwaldi 56, 51014 Tartu, Estonia
2
Institute of Forestry and Engineering, Estonian University of Life Sciences, Kreutzwaldi 5, 51014 Tartu, Estonia
*
Author to whom correspondence should be addressed.
Energies 2022, 15(17), 6175; https://doi.org/10.3390/en15176175
Submission received: 29 July 2022 / Revised: 19 August 2022 / Accepted: 20 August 2022 / Published: 25 August 2022

Abstract

:
Recently, under COP26, several countries agreed to phase-out coal from their energy systems. The torrefaction industry can take advantage of this, as the fuel characteristics of torrefied biomasses are comparable to those of coal. However, in terms of economic feasibility, torrefied biomass pellets are not yet competitive with coal without subsidies because of the high price of woody biomass. Thus, there is a need to produce torrefied pellets from low-cost feedstock; pulp industry sludge is one such feedstock. In this context, this study was focused on the torrefaction of pulp industry sludge. Torrefaction experiments were carried out using a continuous reactor, at temperatures of 250, 275, and 300 °C. The heating value of the sludge increased from 19 to 22 MJ/kg after torrefaction at 300 °C. The fixed carbon content increased from 16 wt.% for dried pulp sludge to 30 wt.% for torrefied pulp sludge. The fuel ratio was in the range of 0.27 to 0.61. The ash content of the pulp sludge was comparable to that of agricultural waste, i.e., around 12 wt.% (dry basis). The cellulose content in the sludge was reduced from 35 to 12 wt.% at 300 °C. Ash related issues such as slagging, fouling, and bed agglomeration tendency of the sludge were moderate. This study shows that torrefaction treatment can improve the fuel properties of pulp industry sludge to a level comparable to that of low-rank coal.

1. Introduction

Since the end of 19th century, the earth’s average surface temperature has increased by around 1.8 °C [1]. This global warming is mainly due to the increase of greenhouse gases content in the atmosphere, which has been linked to the extensive usage of fossil fuels. Today, our energy systems are largely dependent on fossil resources. Among other fossil fuels, coal plays a major role in global energy production [2]. According to IEA energy statistics, global energy production from coal in 2019 was around 163 EJ, i.e., 26.8% of the total [3]. In the same year, the share of coal in the global CO2 emission production was around 44% [3]. At a regional level, the role of coal in energy production can be much higher than the global average. For example, in China, more than half of the primary energy is still produced from coal [4]. Realizing the role of coal in greenhouse gas emissions, under COP26, several countries agreed to phase out its use from their energy production [2]. One alternative to coal could be biomass. However, the characteristics of biomass fuel are not comparable to those of coal [5]. Thus, there is a need to pretreat biomass prior to its application in energy production; torrefaction is one such pretreatment. Torrefaction is a mild pyrolysis which is carried out in the temperature range of 200–300 °C [6]. Although torrefied biomass pellets can be compared with coal in terms of their fuel characteristics, they are not yet economically competitive. The main reason for this is the high price of the woody biomass. According to Doddapaneni et al. [7], the raw biomass itself accounts for 80% of the total production costs of torrefied pellets. Thus, producing torrefied pellets from low cost or no-cost organic residues could be helpful to improve the economic feasibility of the torrefaction process.
On the other hand, pulp industries produce large quantities of sludge during wastewater treatment, commonly known as primary, secondary and tertiary sludge, depending on the stage and waste water treatment approach. Pulp industry sludge contains undigested wood fibers, fines, fillers, clays, plastics, and metals, depending on the type of pulping process, i.e., virgin fibers or reused waste paper [8,9]. Because of strict environmental regulations, sustainable methods to handle such large quantities of sludge are needed. Today, pulp industry sludge is disposed of through composting, landfill combustion, agricultural field application, and anaerobic digestion [10]. Considering its organic fraction and availability in large quantities, alternatively, pulp industry sludge could be used as a raw material for the production of torrefaction pellets and, subsequently, in energy production.
Previously, Mondoza Martinez et al. [11] studied the hydrothermal carbonization (HTC) of chemical and biological pulp mill sludges and reported that the physiochemical properties of the pulp sludge improved with HTC treatment, where dehydration and demethylation were the dominant reaction pathways. In the same study, the authors observed that the heating value of the sludge increased by 1 MJ/kg and 5 MJ/kg for primary and biological sludges, respectively. Recently, Liu et al. [12] studied the applicability of paper mill sludge char as a catalyst to improve the quality of pyrolysis gas; those authors observed that the Ca present in pulp sludge had a significant effect on the composition and energy content of the pyrolysis gas. Tarelho et. al. [13] studied the slow pyrolysis of biological sludge from pulp from the paper industry and reported a biochar, dry sludge yield in the range of 0.40 to 0.73 kg/kg. Grimm et. al. [14] studied the co-combustion of pulp industry chemical sludge and Scots pine bark and observed increasing NOx and SO2 emissions in the flue gas and reduced ash slagging and fouling tendency. Latva-Somppi et al. [15] studied ash related issues during pulp sludge combustion in an industrial scale bubbling fluidized bed and circulating fluidized bed. They concluded that pulp and paper industry sludge can be combusted in fluidized beds at a temperature range of 800–900 °C. Huang et al. [16] studied the torrefaction of pulp sludge from a pulp factory in Taiwan and observed that torrefaction treatment improved the fuel properties of the sludge. The authors reported that the heating value of pulp sludge increased by 25% following 60 min. of torrefaction at 300 °C.
A considerable number of studies are available on the combustion and pyrolysis of pulp sludge, but very few are available on low temperature thermal treatments such as torrefaction, hydrothermal carbonation, and hydrothermal liquefaction. Notably, not much data is available on the torrefaction of pulp industry sludge, and to the knowledge of the authors, only one study is available on the torrefaction of pulp industry sludge. Thus, the main aim of the present study is to understand the influence of torrefaction treatment on the fuel characteristics of pulp sludge. Torrefaction experiments were carried out using a continuous torrefaction reactor setup at 250, 275 and 300 °C. The influence of torrefaction on the chemical composition of biomass fibers is also discussed. Pulp sludge is known for its high ash content. Thus, the ash melting behavior of the dried and torrefied sludge was also studied. Finally, a SWOT analysis on the torrefaction of pulp industry sludge is presented.

2. Materials and Methods

2.1. Pulp Sludge

Pulp sludge was collected from AS Estonian Cell, Estonia, where pulp is produced from Aspen wood through a chemical-thermo-mechanical pulping process. The collected pulp sludge was a mixture of both primary and secondary sludges which had been mechanically dewatered. The dry matter content of the as-received pulp sludge was around 20%. After collecting, the sludge was stored in a freezer at −20 °C in order to avoid further microbial degradation. Prior to torrefaction, the sludge was dried at 105 °C using a UF1060 oven (Memmert GmbH, Büchenbach, Germany) until it was moisture free. The dried samples were stored in air-tight plastic containers for further use.

2.2. Torrefaction Experiments

Torrefaction of the dried sludge was carried out in a continuous reactor setup, as shown in Figure 1. The material flowrate was maintained at 1 kg/h. Torrefaction experiments were carried out at temperatures of 250, 275, and 300 °C, with residence times of 30 and 60 min. An inert environment was maintained in the reactor by venting nitrogen at a flow rate of 10 L/min initially for 10 min before starting the reactor and 4 L/min while running the reactor. The reactor temperature was recorded using a TC-08 data logger (Picotech, Saint Neots, UK) and the temperature was maintained within the limit of ±5 °C throughout the operation.

2.3. Analytical Methods

2.3.1. Heating Value

The higher heating values (HHV) were measured using an IKA calorimeter C5000 based on EVS-EN ISO 18125:2017. The authors referred to [17,18] for details regarding the heating value measurement procedure.

2.3.2. Proximate and Ultimate Analysis

An elemental analysis was carried out using an Elementar Vario Macro Cube elemental analyzer, based on EVS-EN ISO 16948:2015. The oxygen content was measured by difference, i.e., O = 100 − (C + H + N + S). The moisture content was measured using a Kern MLS-50-3D (Kern & Sohn GmbH, Balingen, Germany) moisture analyzer.
Volatile matter was measured using a muffle furnace, according to the standard EVS-EN ISO 18123:2015. Briefly, about one gram of the sample was loaded into crucible with a lid and heated at 900 °C for 7 min. The volatile matter content was calculated based on the weight before and after heating. The fixed carbon content was calculated using Equation (1). The amount of ash was measured using a muffle furnace at 550 °C for 4 h, according to EVS-EN ISO 18122:2015.
F i x e d   c a r b o n = 1 v o l a t i l e   m a t t e r a s h        

2.3.3. Composition Analysis

A fiber analysis of sludge before and after torrefaction was carried out using an ANKOM 2000 fiber analyzer (ANKOM Technology, Macedon, NY, USA), following the standard methodology defined by ANKOM Technology. The cellulose, hemicellulose and lignin contents were measured in terms of acid detergent fibers (ADF), neutral detergent fibers (NDF) and acid detergent lignin (ADL) and using Equations (2)–(4). The digesting process was carried out using premixed chemical solutions supplied by ANKOM Technology and following the methodology presented in our previous studies [17].
H e m i c e l l u l o s e = N D F A D L                        
C e l l u l o s e = A D L A D F                      
L i g n i n = A D L                              

2.3.4. Ash Composition and Ash Melting Behavior

The composition of the ash was analyzed using an external lab Oil Shale Competence Center, Fuel Technology Research and Testing Laboratory, TalTech, Estonia, according to the standard EVS-EN ISO-16967 part A. The ash melting behavior of both dried and torrefied pulp sludge was tested using a Hesse Heating Microscope E.M. 201-17K (Hesse Instruments, Osterode am Harz, Germany) based on CEN/TS 15370-1:2006. A detailed description of the method is presented in [17]. Briefly, a cylindrical ash test piece was heated to a final temperature (up to 1750 °C) at a rate of 80 °C/min up to 550 °C and later at 10 °C/min. A high-speed camera connected to the system recorded images for every 10 °C and also when the dimensions of the sample changed by 12% for the corner angle, 5% for the shape factor, and 5% in terms of area.
The different evaluation indices presented in Table 1 were used for the theoretical evaluation of ash related issues.

3. Results

3.1. Mass and Energy Yield

Mass and energy yields are key parameters which are commonly used to evaluate the performance of the torrefaction process. The mass and energy yields of the pulp sludge at different torrefaction conditions are presented in Figure 2a. As expected, mass yield decreased with increasing torrefaction temperature. For example, when temperature increased from 250 °C to 300 °C, the mass yield decreased from 87 to 60 wt.%, respectively, at a residence time of 60 min. The mass loss during torrefaction was mainly because of the loss of volatile matter, which was ultimately the result of the degradation of biomass components. It is worth noting that, in terms of thermal stability, hemicellulose is the fraction that degrades the most during torrefaction, while cellulose and lignin degrade only partially. A literature survey showed that the mass yield during torrefaction was in the range of 90–25 wt.%, depending on the operating conditions and the feedstock composition. Compared to other parameters, temperature was the most influential parameter on mass yield. Other than temperature, biomass composition, particle size, and reactor setup also showed significant effect on mass yield. For example, previously, Phanphanich et al. [18] reported a mass yield of 52 wt.% for the torrefaction of pine wood chips at 300 °C for 30 min. In another study, Barta-Rajnai et al. [21] and Gucho et al. [22] reported a mass yield of 46 wt.% for spruce stump and 40 wt.% for beech wood for torrefaction at 300 °C. Compared with biomass, the mass yield for pulp sludge was relatively higher under the same operating conditions. In this study, a mass yield of around 71 and 61% was observed at 275 and 300 °C, respectively, at 60 min residence time. Huang et al. [16] also reported similar mass yield values for the torrefaction of pulp mill sludge, i.e., around 75 and 65 wt.% under the same torrefaction conditions. In another study, Lin et. al. [23] reported a mass yield of around 60 wt.% for the torrefaction of municipal wastewater sludge at 300 °C for 60 min. The relatively increasing ash content was the main reason for the higher mass yield in the case of pulp sludge compared with biomass. However, when ash free, the degradation rate of organic matter is higher and the final mass yield lower in the case of pulp sludge because of the catalytic effect of the ash. The same phenomenon was observed by Zhang et al. [24] in a comparative analysis of raw and leached (inorganics removal) torrefaction of rice husk.
The energy yield was in the range of 91% to 72% for the temperature range of 250–300 °C, respectively. Following the mass yield, the energy yield was also reduced with increasing torrefaction temperature. However, with respect to temperature, the rate of mass loss was higher compared with energy loss during torrefaction. This may have been because of the loss of low energy content volatiles. This is one of the major advantages of the torrefaction process, which ultimately increases the energy density. The energy density values for the pulp sludge torrefaction are presented in Figure 2b. From the same figure, it can be observed that the energy density of torrefied pulp sludge increased with increasing torrefaction temperature. The energy density increased from 1.05 to 1.18 when the torrefaction temperature was increased from 250 to 300 °C. Compared with temperature, residence time showed little effect on energy density. Regarding energy density, the torrefaction of pulp sludge can be carried out with shorter residence times in order to improve the feasibility of the process. Previously, Huang et al. [16] reported energy density values of 1.34 and 1.14 for torrefied pulp sludge at 300 °C and 60 min.

3.2. Ultimate Analysis and Proximate Analysis

Table 2 shows the results from an elemental analysis of pulp sludge before and after torrefaction treatment. The carbon content of the sludge increased with increasing torrefaction treatment, while the oxygen, hydrogen, and sulfur contents were reduced. The carbon content in the dried sludge was around 45%, but this increased to 53% when pulp sludge was treated at 300 °C for 60 min. Deoxygenation is one of the advantages of the torrefaction process. Similar to previous studies, [18,25], the oxygen content in the torrefied sludge was reduced with increasing torrefaction temperature. The maximum oxygen loss was observed following torrefaction at 300 °C and 60 min.
Deoxygenation during the torrefaction of biomass mainly occurs due to dehydration and depolymerization. According to a previous study [25], oxygen in biomass during torrefaction was released in the form of volatiles, such as CO2, CO, H2O, acids, phenols, furans, and ketones. Among the other compounds, the majority of the oxygen migrates in the form of CO2. Ma et. al. [25] observed that around 82% of oxygen distribution is in the form of CO2. The contents of other elements, such as hydrogen, nitrogen, and sulfur, were also reduced with increasing torrefaction temperature. However, their concentrations were not significant compared to those of carbon and oxygen.
The volatile matter content in the torrefied sludge was reduced by 32% at 300 °C and 60 min, compared with dried pulp sludge. Under the same torrefaction conditions, the fixed carbon content increased relatively by 18%. The volatile matter and fixed carbon contents of the pulp sludge were in a comparable range to those of several biomasses reported in the literature [18,22].

3.3. Energy Content

The heating values of dried and torrefied pulp sludge are presented in Table 2. The heating value of the dried pulp sludge was around 19.18 MJ/kg. Previously, Mendoza Martinez et al. [11] reported heating values of 17.50 MJ/kg and 19.78 MJ/kg for dried primary and secondary sludge, respectively. As expected, the heating value of the pulp sludge increased with increasing torrefaction temperature. For example, at 300 °C and 60 min, the energy content of the pulp sludge increased by 18% compared with that of dried pulp sludge. As mentioned in Section 3.1, the loss of low heating value volatiles could be the main reason for the increased energy content with torrefaction temperature. Compared with woody biomass, the increase in the heating value with torrefaction treatment was lower in the case of pulp sludge. This may have been due to the higher ash content of the pulp sludge compared with woody biomass. Previously, Phanphanich et al. [18] reported an increase of 35% in the energy content of pine wood chips when torrefied at 300 °C. Under the same operating conditions, the gain in energy content for pulp sludge was around 18%.
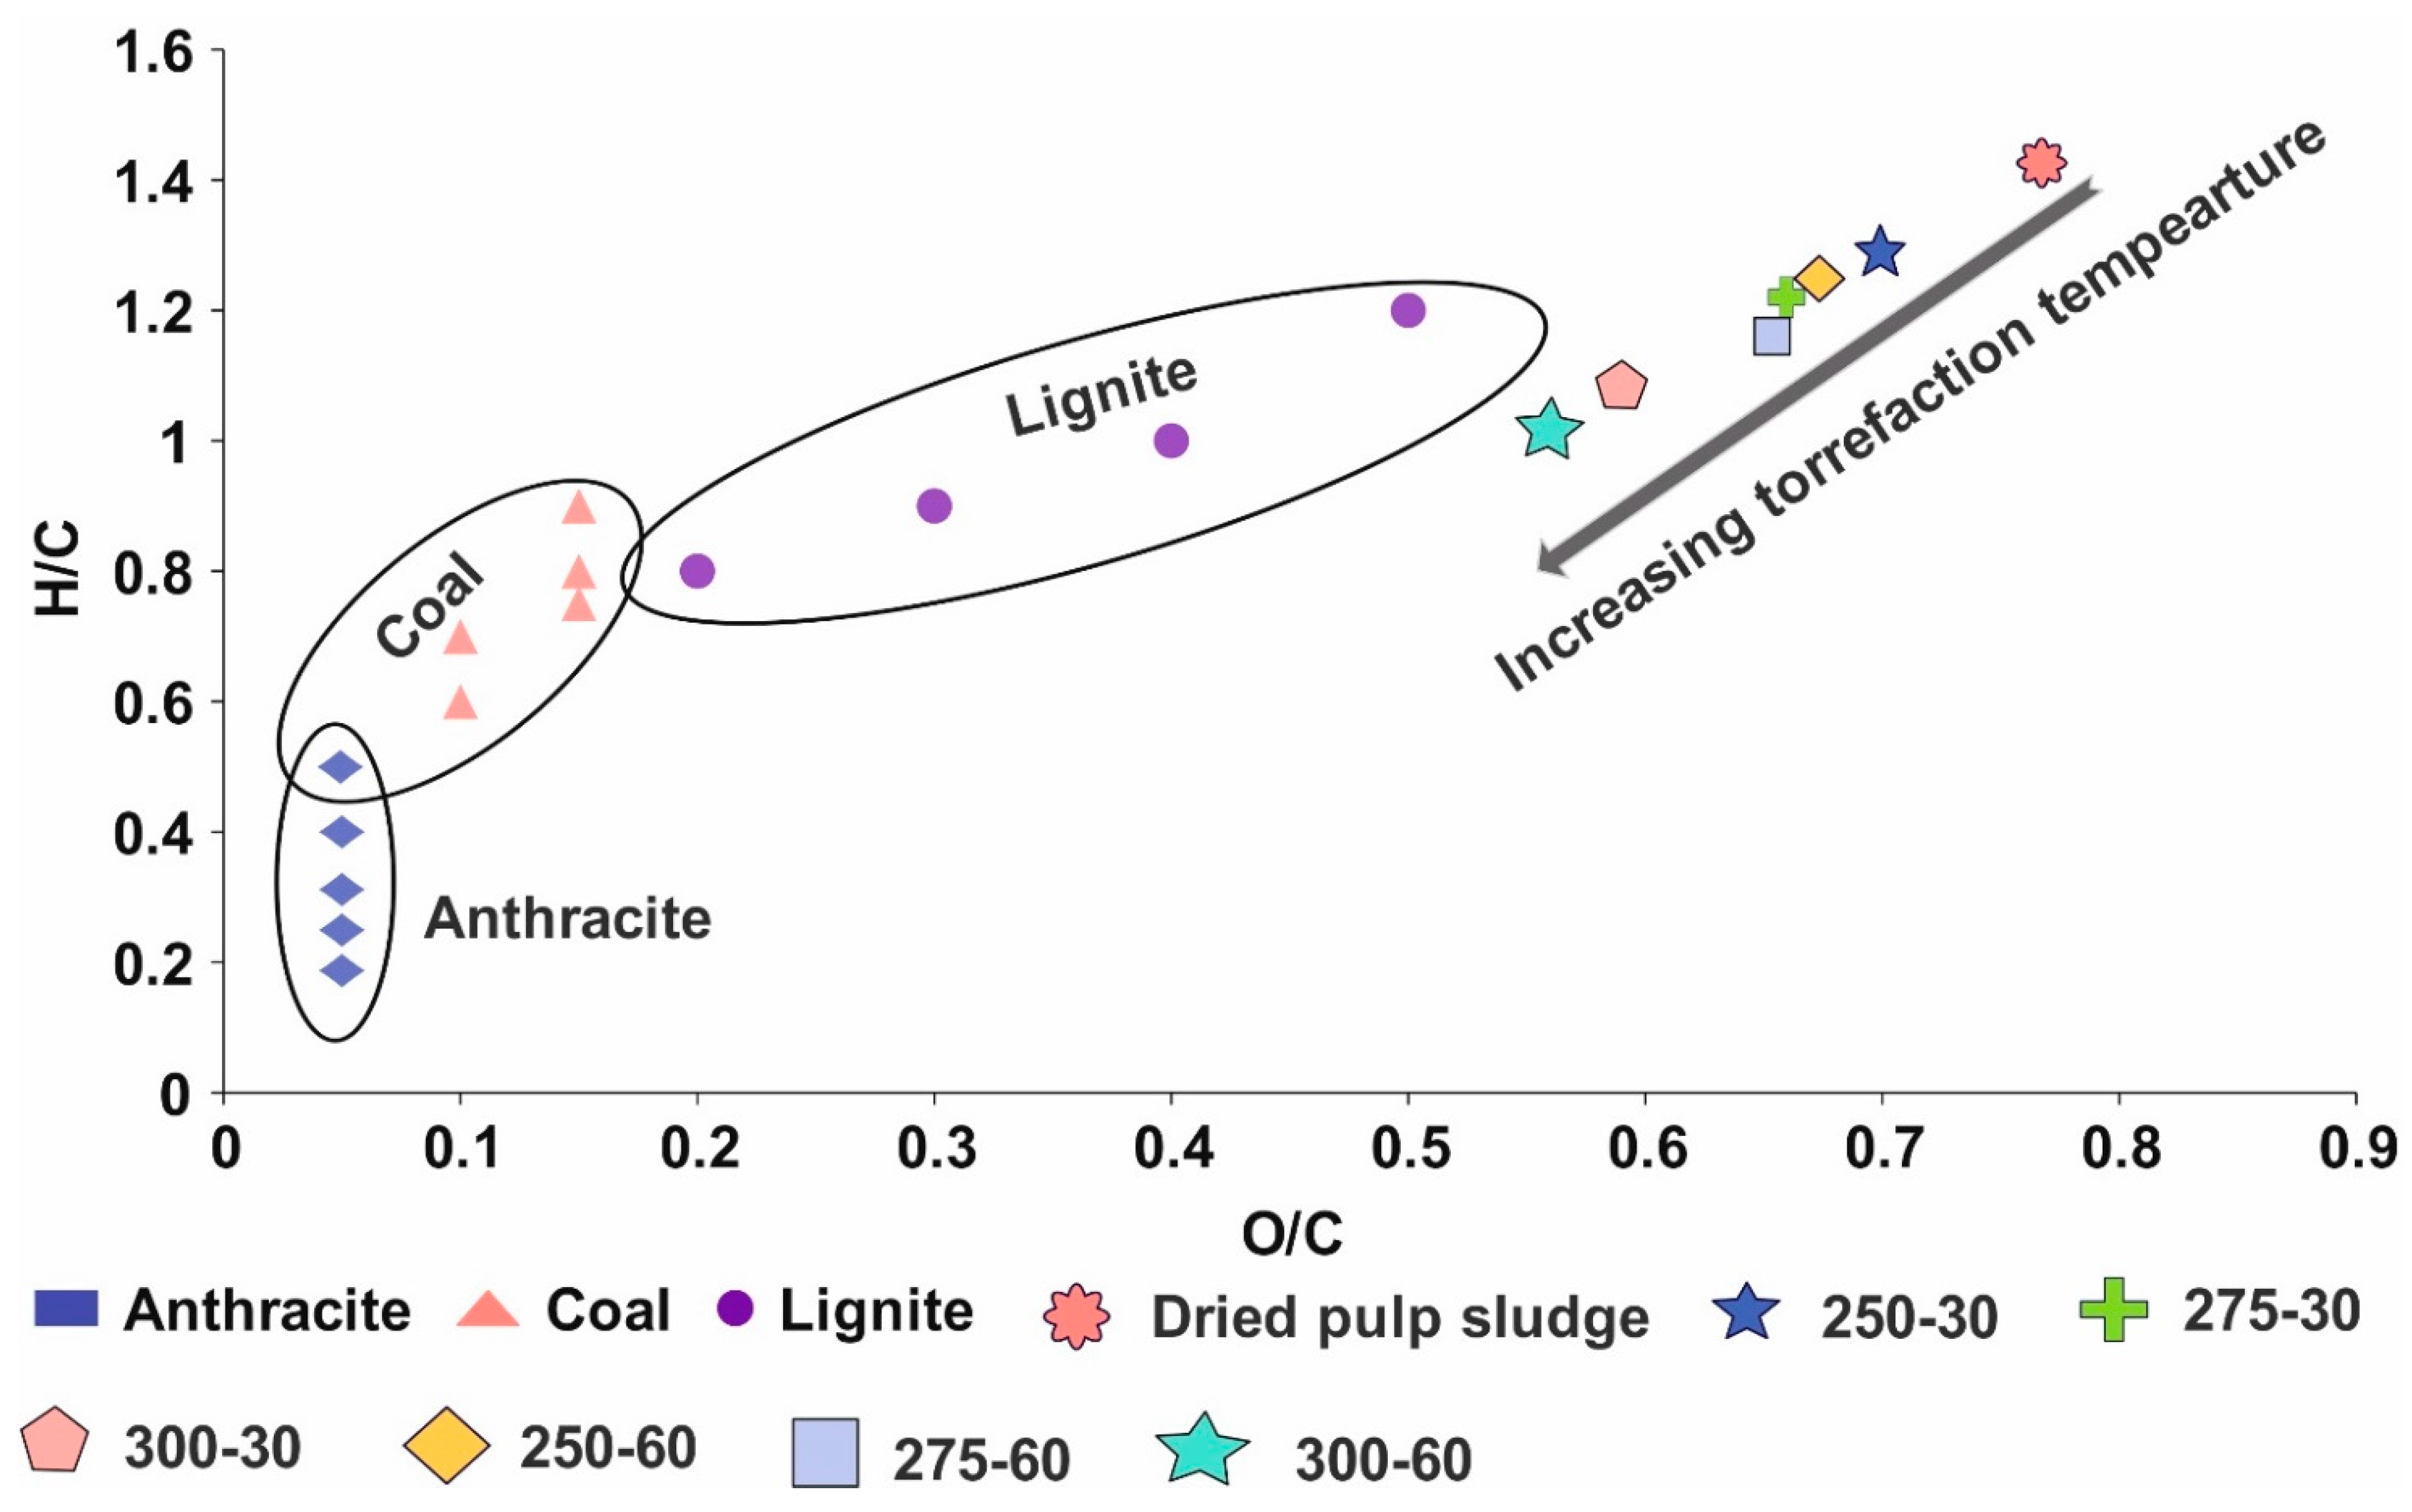
Van Krevelen diagrams are a commonly used tool to depict fuel quality based on the atomic ratios of O/C and H/C. A Van Krevelen diagram of pulp sludge at various torrefaction conditions is presented in Figure 3. It was observed that with increasing torrefaction severity, the H/C and O/C ratios decreased, moving toward the lower left region. Generally, fuels with lower H/C and O/C ratios are classified as high-ranking (i.e., high heating value). As shown in Figure 3, the H/C and O/C ratios of the pulp sludge after torrefaction moved close to those of lignite. In terms of energy content, torrefied pulp sludge closely matched low ranking coals, such as lignite and sub-bituminous. For comparison, the heating value of lignite and sub-bituminous coals varies between 9–19 MJ/kg and 19–24 MJ/kg respectively [26,27], while the heating value of torrefied pulp sludge varied between 20–22 MJ/kg.

3.4. Fuel Ratio

The fuel ratio is a commonly used index to rank coals; it provides theoretical information about combustion efficiency. It is commonly represented as a ratio between fixed carbon (%) and volatile matter (%). The fuel ratio for dried sludge was found to be 0.22, while that of torrefied pulp sludge was in the range of 0.27–0.61. From Table 3, it can be observed that the fuel ratio increased with increasing torrefaction temperature. Compared with dried sludge, the fuel ratio increased by around 2.6 times following torrefaction at 300 °C and 60 min. Previously, Pitak et al. [29] reported fuel ratios in the range of 0.3–0.6 for different biomasses. In another study, Ibitoye et al. [30] reported a fuel ratio of 1.29 for torrefied corn cobs at 260 and 60 min. Sarker et. al. [31] reported a fuel ratio in the range of 0.4 to 0.8 following microwave torrefaction of canola residue. In another study, Huang et al. [32] reported comparatively high fuel ratios i.e., 0.32 to 3.57, for leucaena wood. For the sake of comparison, the fuel ratio of lignite and anthracite coal are in the range of 0.8–1.5 and 9–29, respectively [33]. The fuel ratio of the studied torrefied sludge at 300 °C was close to that of lignite coal. The boiler efficiency for high-fuel-ratio coals is lower because of the increased content of unburnt char during combustion. Thus, coals with fuel ratios in the range 0.8 to 3.0 are often preferred in power plants [34]. In that regard, torrefied pulp sludge (300 °C and 60 min) with a fuel ratio of 0.61 is close to the lower limit of the optimal fuel ratio.

3.5. Ash Composition and Ash Melting Behavior

3.5.1. Ash Composition

The influence of torrefaction treatment on the ash content and composition of pulp sludge is summarized in Table 4. From the same table, it can be observed that the ash content increased with increasing torrefaction temperature. This was mainly because of the loss of the organic fraction. The ash content in the dried sludge was around 13 wt.%. Previously, Budzyń and Tora et. al. [35] reported an ash content of 15.4% for sludge from a Polish paper mill. In another study, Wang et al. [36] observed an ash content of pulp sludge in the range of 11.9 to 16 wt.%. Some studies have reported significantly higher ash contents in pulp sludge than those observed in this study. For example, Coimbra et al. [37] and Grimm et al. [14] reported ash contents in the range of 25–33 wt.%. This variation could be attributed to the wastewater treatment methods applied and whether the pulp mill used recycled paper or not. The ash content for torrefied pulp sludge was around 17, 19 and 22 wt.% for 250, 275 and 300 °C, respectively, at 60 min residence time, which is a significant increase compared with dried pulp sludge. Notably, at 300 °C, the ash content increased by 76.4%, compared with that of dried sludge.
The oxide compositions of ash for both dried and torrefied pulp sludge are presented in Table 4. The ash of dried pulp sludge mainly contained SiO2 (45.59 wt.%), CaO (16.53 wt.%) and Na2O (12.05 wt%). It also contained other oxides, such as MgO, Al2O3, Fe2O3, K2O, TiO2, and ZnO in small quantities. From Table 4, it can be observed that the concentration of ash components increased with increasing torrefaction temperature. Notably, the SiO2 and Fe2O3 contents increased by 1.75 and 2.46 times, respectively, following torrefaction of 300 °C and 60 min. Again, the reason for increasing ash content could be the greater loss of volatiles compared to ash content with increasing torrefaction. Previously, Simão at al. [38] reported similar values for the ash composition of pulp sludge, except for Al2O3. Their Al2O3 concentration was much higher (13.24 wt.%) than that observed in this study (4.2 wt.%). In another study, Mitikie et al. [39] reported an ash composition similar to that reported here for paper industry sludge, with the exception of the CaO (53.14 wt.%) content, which was higher than in the pulp sludge used in this study (16.53 wt.%). This difference may be attributable to the wastewater treatment and pulping processes. Specifically, different coagulants and flocculants, such as alum, lime, ferric chloride, and ferric sulfate [40], are used in wastewater treatments in the pulp industry, and these compounds influence the composition of the resulting ash.

3.5.2. Ash Melting Behavior

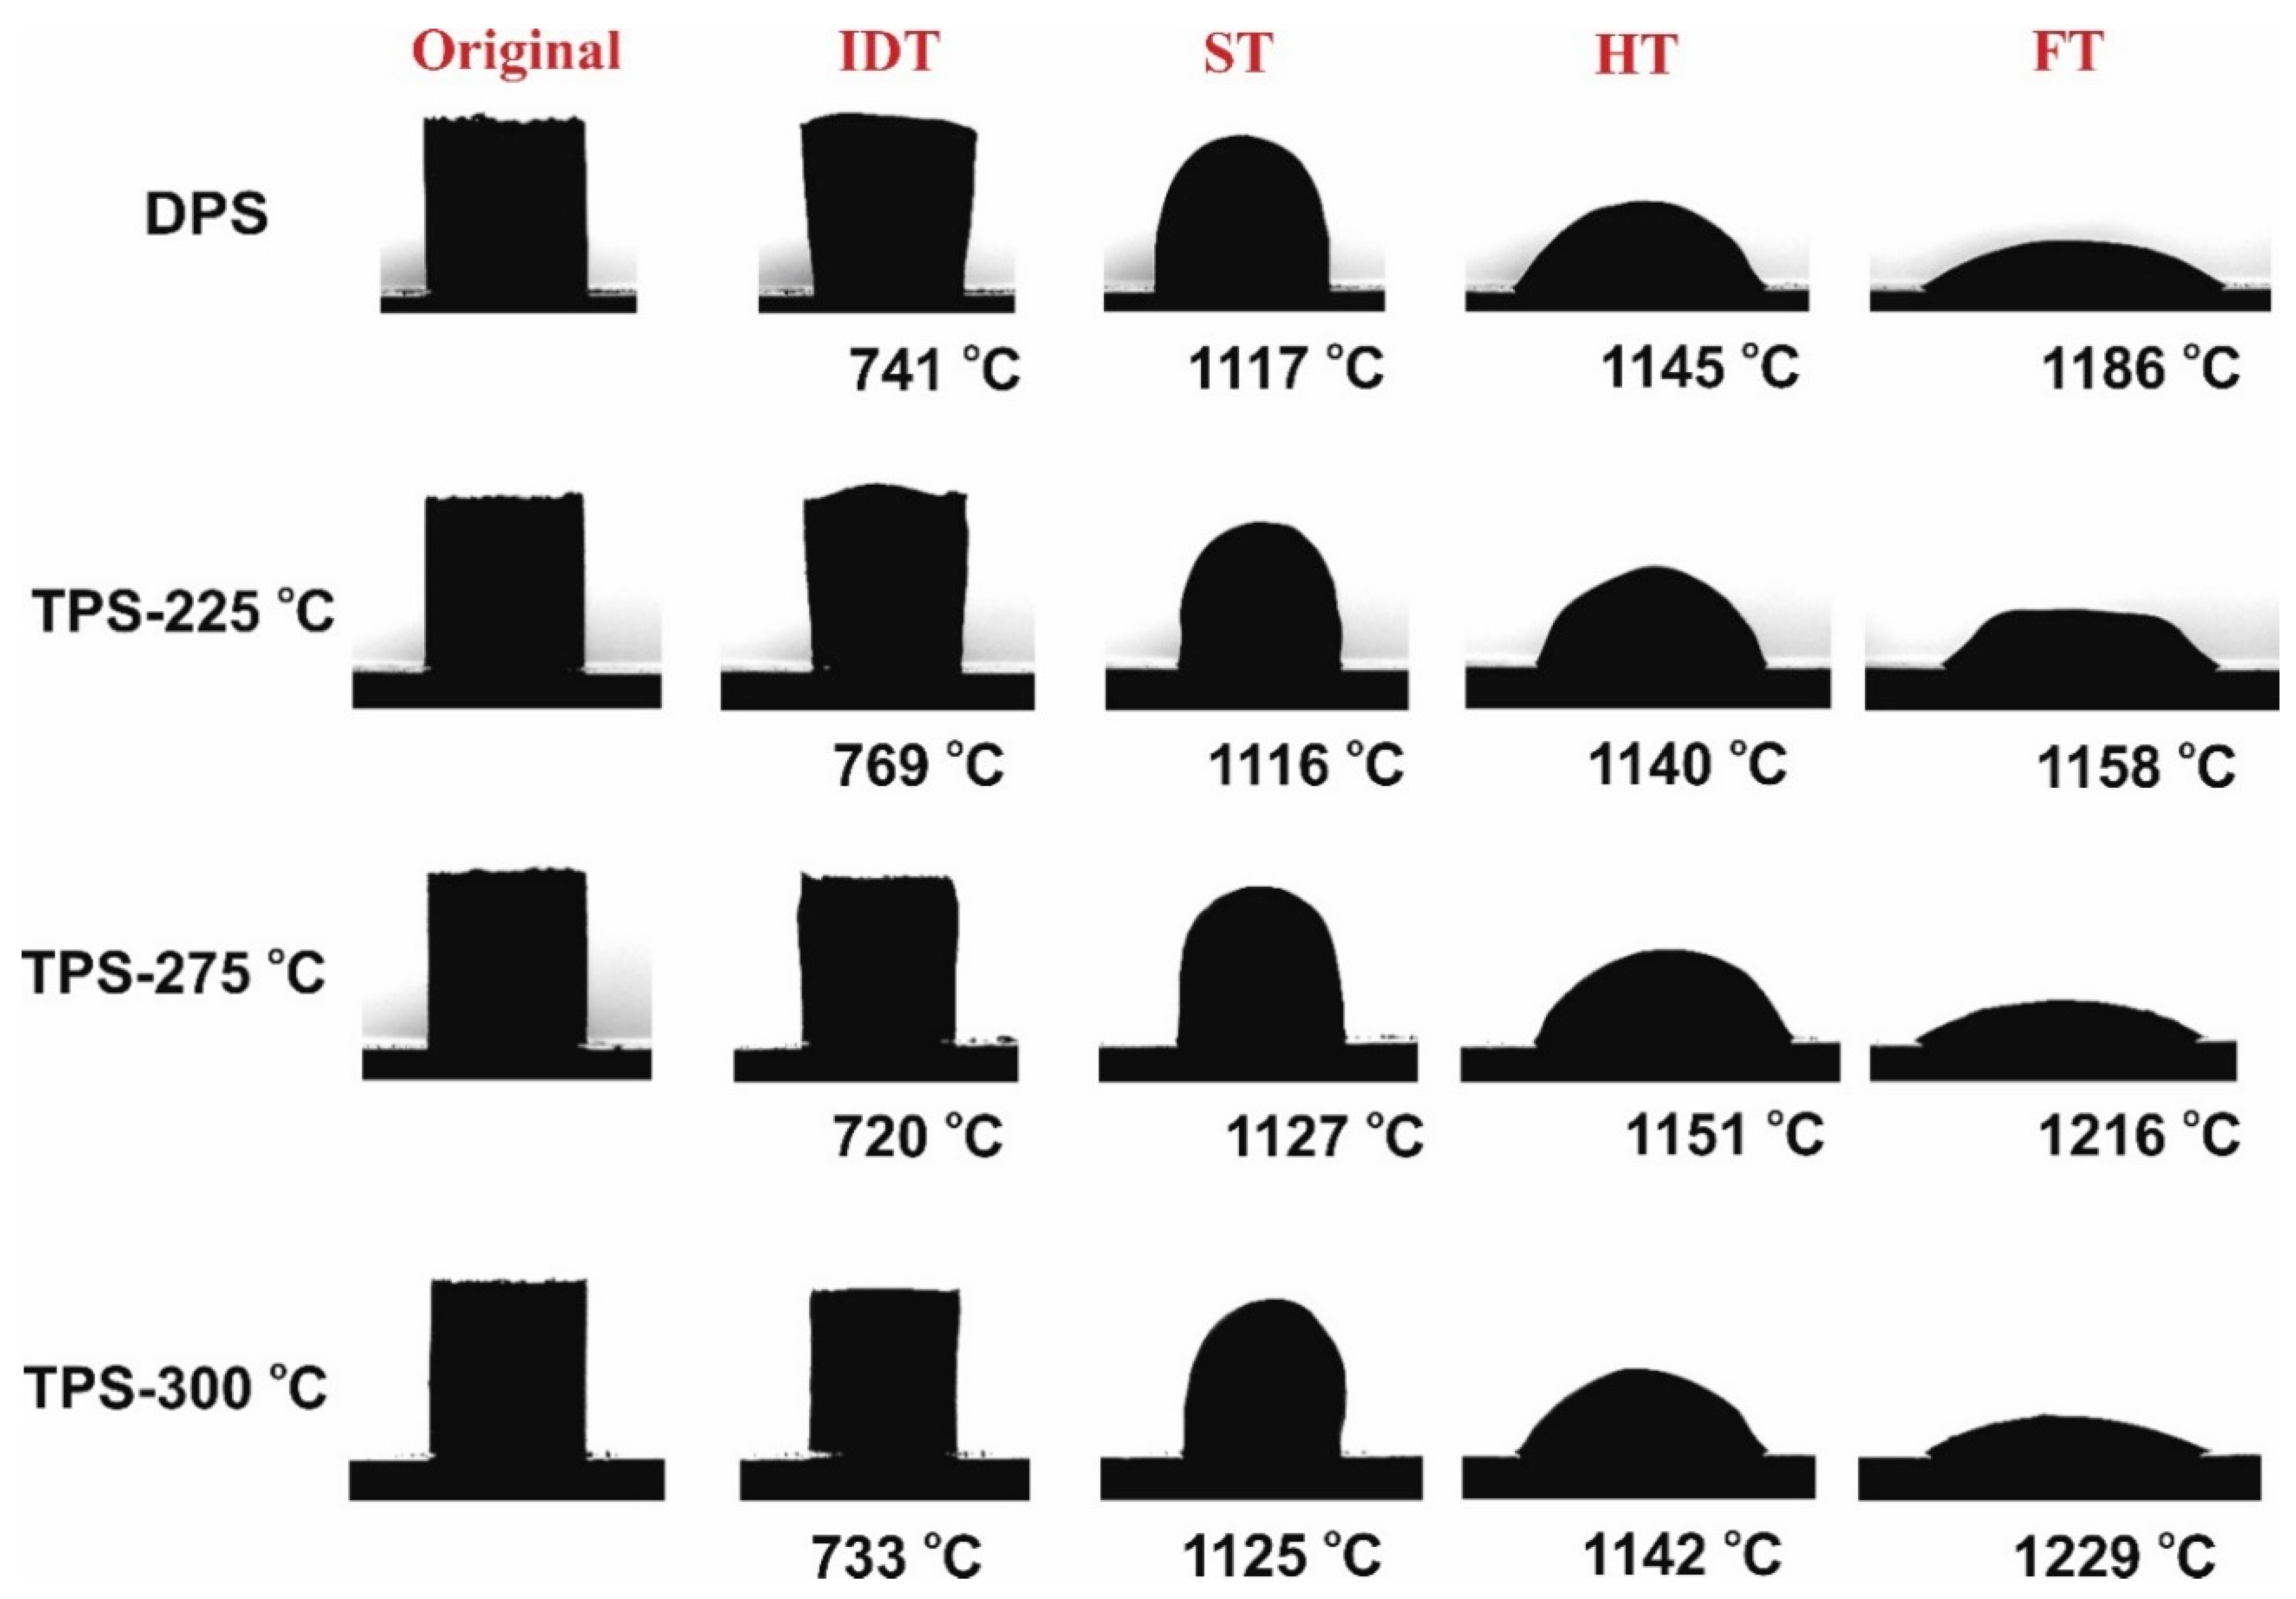
The ash melting temperatures of dried and torrefied pulp sludge, presented in Figure 4, ranged from 720 to 1229 °C. The initial deformation temperature (IDT) varied between 720–770 °C. Compared with biomass, the IDT values of pulp sludge were lower and closely matched those of agricultural wastes. For example, Niu et al. [41] reported DT values in the range of 590–730 °C for cotton stalks and wheat stalks. Although the DT values were reduced with torrefaction temperatures of 275 and 300 °C, not much influence of torrefaction treatment was observed on softening temperature (ST) or hemisphere temperature (HT). The flow temperatures were in increasing order with increasing temperature. Previously, Wang et al. [42] also observed reducing IDT values with increasing temperature for the ash produced from maize straw char. In another study, Adeleke et al. [43] observed no significant influence of torrefaction treatment on ST and HT values for tropical woody biomass. In contrast, Cahyanti et al. [17] and Muizniece et al. [44] observed increasing IDT values with torrefaction treatment. The variation in the ash melting behavior with torrefaction treatment could be attributed to the composition of inorganics in the biomass and could be further linked to the origin of the biomass. The lower ash melting temperatures of pulp sludge could be linked to its high SiO2 and lower Al2O3 contents. According to Niu et al. [45] and Kopczyński et al. [46], IDT values increase with increasing Al2O3 and decrease with increasing SiO2 and K2O.
Different indices calculated to understand the ash behavior during combustion are presented in Table 5. In general, the basic oxides reduce the ash melting temperatures and acidic oxides increase it [19,20]. In that view, basic to acidic ratio could be used to understand the slagging tendency of the ash. From Table 1 and Table 5, it can be observed that both dried and torrefied sludge show medium slagging tendency according to basic to acidic ratio. The slagging viscosity index is also one of the useful tools to understand the slagging tendency of the ash. According to Lachman et al. [19], the slagging tendency in the range of 65 < Sr < 72 is considered as the medium range. For both, dried pulp sludge and torrefied pulp sludge, the slagging tendency is in the medium range.
According to another index based on SiO2 (%) content, the SiO2 (%) higher than 25% is considered as a threshold for slagging and fouling tendencies. However, it is worth to note that the slagging tendency is not solely dependent on silica content but also depends on other components, such as K, Na, Mg, Fe, Al [47]. The alkali compounds K, Na react with Si and from low melting or softening Na-silicate and K-silicate eutectic mixtures, such as Na2SiO5 (874 °C) and K2O4SiO2 (764 °C). In case of pulp sludge, although silica content is in the range of high slagging tendency, the potassium content is relatively very low.
The fouling index (Fe) for both dried and torrefied pulp sludge was also in the medium range. The potassium and sodium together with chlorine and sulphur produce alkali chlorides and alkali sulfates, which play a major role in the fouling and corrosion of the heat exchanger surfaces in the boiler. For example, alkali chlorides with low melting point (NaCl—801 °C and KCl—770 °C) condense on boiler surfaces and facilitate fouling. Compared with biomass, pulp sludge showed several times lower fouling index. For the studied pulp sludge, the potassium content was relatively lower. This could be the main reason for the lower fouling index compared with biomass. A detailed review by Garcia-Maraver et al. [20] on the ash composition of various biomass shows that majority of the biomass contains higher potassium and chlorine contents than pulp sludge. K2O content of the pulp sludge ash is closely matching the sewage sludge ash, which is also having very low fouling index.
Bed agglomeration is also one of the serious concerns in case of fluidized bed combustion and gasification. From the Table 1 and Table 5, it can be observed that the bed agglomeration probability is lower for both dried and torrefied pulp sludge. As noted earlier in this section, the lower concentration of K and Na could be the reason for the lower tendency of bed agglomeration in case of the studied pulp sludge. In addition, higher Ca content in the pulp sludge could also play a role in this. According to Niu et al. [48], the increasing Ca content increases the ash melting towards high temperatures.

3.6. Chemical Composition Analysis

The chemical composition of dried and torrefied pulp sludge is presented in Table 6. Cellulose, hemicellulose, and lignin contents of dried pulp sludge were around 35.5, 10.6, and 9.7 wt.%, respectively. Previously, Deeba et al. [49] reported similar composition of pulp sludge i.e., cellulose 32.8%, hemicellulose 13.9%, and lignin 14.6%. Biomass components in the sludge mainly come from undigested wood chips, fines (short fibers), and the wood chips entered during the sludge handling. Concentration of the biomass components in sludge varies depending on the pulping process. Coming to torrefied pulp sludge, as expected, the concentrations of hemicellulose and cellulose reduced with increasing torrefaction temperature and residence time. Hemicellulose was completely degraded at 275 and 300 °C. The cellulose content degraded by 66.2 % at 300 °C and 60 min. At the same time, thermal stability of lignin was higher compared with hemicellulose and cellulose and thus, its degradation was limited in torrefaction. Thus, lignin content in pulp sludge after torrefaction increased relatively with increasing torrefaction temperature. The lignin content in the sludge after torrefaction increased by 83.9%, 87.4%, and 187.9% at 250, 275, and 300 °C (30 min residence time), respectively. Previous studies [17,18] observed the same trend of biomass component’s degradation during torrefaction. For example, Phanphanich et al. [18] reported that during torrefaction of pine chips at 300 °C, cellulose and hemicellulose contents reduced by 73% and 96.3%, respectively while lignin content increased by 205.77%.
Hemicellulose degradation during torrefaction mainly depends on temperature and its degradation level is similar for all the biomass and with little variation depending on the biomass composition. In case of cellulose, the degradation mainly depends on two parameters i.e., temperature and ash content, especially alkali and alkaline elements in ash. According to Giudicianni et al. [50], both, alkali and alkaline metals lower the cellulose degradation temperatures. The same was experimentally observed by Zhao et al. [51]. Literature survey shows that the cellulose degradation during torrefaction is higher for biomass with high ash content, such as agricultural waste and bark, and lower in case of woody biomass because of the lower ash content in the latter. However, in case of studied pulp sludge, the cellulose degradation followed the woody biomass irrespective of its high ash content. The reason could be the lower amount of K, Na, and Mg compared with agricultural waste. Interestingly, in case of lignin, the degradation was higher for the studied pulp sludge compared with biomass i.e., agricultural (high ash) and woody biomass (low ash). The main reason could be higher amount of Ca in the pulp sludge. Previously Wang et al. [52], observed the increased degradation of lignin during pyrolysis with Ca compared with K and Fe. It is worth to note that, in addition to temperature and inorganics, other parameters, such as particle size, reactor setup, and heat transfer limitations could play a critical role in biomass components degradation. The authors also want to highlight that the composition of biomass components are the representative of acid soluble and insoluble fibers of the biomass. As the biomass components are charring with increasing torrefaction temperature, the solubility of these components could have altered. As presented by [17], they might also have contained impurities and/or undigested fibers.

4. Summary

Our study clearly showed that torrefaction treatment improved the fuel characteristics of the pulp industry sludge. In order to give a comprehensive perspective of the opportunities and challenges of pulp sludge torrefaction, a SWOT analysis is presented in Figure 5. In the authors’ opinion, producing torrefied pellets from pulp sludge could be a win-win strategy for both the torrefaction and pulp industries. For the torrefaction industry, the production cost of torrefied pellets could be reduced compared with the use of woody biomass because of the reduced material costs. For the pulp industry, sludge can be handled in an effective way and ultimately, the resource efficiency and sustainability of the industry could be significantly improved.
In this study, it was observed that torrefied pulp sludge has better fuel characteristics compared with other biomasses, especially in terms of its energy density and ash melting behavior. Although the studied pulp sludge contained more ash, the concentrations of problematic compounds, such as chlorine, phosphorous, and potassium, were lower in comparison with those of other biomasses, especially agricultural waste, which is also an organic residue that, like pulp sludge, is available at low cost.
Although the torrefied sludge showed better fuel characteristics, there could also be some challenges. The authors foresee two immediate difficulties, i.e., the high energy input requirements during drying and the high ash content. As the sludge contained around 20% dry weight, drying requires higher energy input compared with biomass. Alternatively, pulp sludge, after mechanical dewatering, can be air-dried in subtropical and tropical regions. However, air-drying may not be practically possible in other regions. The excess heat energy produced in pulp mills could also be used to dry the sludge. It is worth noting that at present, industrial energy recovery processes are well established, and thus, part of the required energy could be recovered from drying volatiles. The higher ash content of the torrefied sludge could create operational issues and increase ash handling costs. However, torrefied sludge is comparable with low grade coals such as lignite, which have been used in power plants for a long time. At the same time, high ash agricultural waste, like straw, is already being used for energy production in countries like Denmark. Thus, the authors believe that torrefied pulp sludge could be effectively used in existing power plants.
The authors also want to stress that the properties of pulp sludge vary significantly based on the operating conditions from which the material is sourced. As such, the properties of the torrefied sludge would also vary. At the same time, future studies are required to determine the overall feasibility of the torrefaction of pulp sludge. Although the theoretical indices showed moderate values for ash fouling and slagging, there is a need for the experimental evaluation. The energy balance of the overall process needs to be established. These will be the topics of our future study.

5. Conclusions

This study described the torrefaction of pulp industry sludge using a continuous torrefaction reactor setup. Torrefaction treatment was found to significantly improve the fuel characteristics of pulp industry sludge. The energy density of the torrefied pulp sludge increased by 17% compared with that of dried pulp sludge. The ash content increased by 76% with torrefaction treatment at 300 °C. However, regarding the studied pulp sludge, not much effect of torrefaction treatment was observed on ash composition or melting behavior. A theoretical evaluation of different indexes showed that the slagging and fouling tendency of the ash was moderate. Compared with woody biomass, the degradation of cellulose, hemicellulose, and lignin was higher in the case of pulp sludge. This may have been due to the catalytic effect of the ash. In terms of chemical composition and physiochemical properties, torrefied pulp sludge can be compared to low-grade coal like lignite.

Author Contributions

Conceptualization: T.R.K.C.D. and T.K.; Methodology: T.R.K.C.D. and L.P.; Investigation: T.R.K.C.D. and L.P.; Supervision: T.K.; Visualization: T.R.K.C.D.; Writing—original draft: T.R.K.C.D.; Writing—review & editing: L.P. and T.K. All authors have read and agreed to the published version of the manuscript.

Funding

This project has received funding from the European Union’s Horizon 2020 research and innovation programme under the Marie Skłodowska-Curie grant agreement No. [843723].

Data Availability Statement

https://doi.org/10.5281/zenodo.7009696 [accessed on 24 August 2022].

Acknowledgments

This project has received funding from the European Union’s Horizon 2020 research and innovation programme under the Marie Skłodowska-Curie grant agreement No. [843723]. The authors would like to thank Luzkov Kersti from AS Estonian Cell, Estonia for providing pulp sludge.

Conflicts of Interest

The authors declare no conflict of interest.

References

  1. NASA. Climate Change: How Do We Know? Available online: https://climate.nasa.gov/evidence/ (accessed on 10 March 2022).
  2. Shamoon, A.; Haleem, A.; Bahl, S.; Javaid, M.; Bala Garg, S. Role of energy technologies in response to climate change. Mater. Today Proc. 2022, 62, 63–69. [Google Scholar] [CrossRef]
  3. IEA. Key World Energy Statistics 2021; IEA: Paris, France, 2021. [Google Scholar]
  4. IEA. Coal 2021; IEA: Paris, France, 2021. [Google Scholar]
  5. Cahyanti, M.N.; Doddapaneni, T.R.K.C.; Kikas, T. Biomass torrefaction: An overview on process parameters, economic and environmental aspects and recent advancements. Bioresour. Technol. 2020, 301, 122737. [Google Scholar] [CrossRef] [PubMed]
  6. Doddapaneni, T.R.K.C.; Praveenkumar, R.; Tolvanen, H.; Palmroth, M.R.T.; Konttinen, J.; Rintala, J. Anaerobic batch conversion of pine wood torrefaction condensate. Bioresour. Technol. 2017, 225, 299–307. [Google Scholar] [CrossRef] [PubMed]
  7. Doddapaneni, T.R.K.C.; Praveenkumar, R.; Tolvanen, H.; Rintala, J.; Konttinen, J. Techno-economic evaluation of integrating torrefaction with anaerobic digestion. Appl. Energy 2018, 213, 272–284. [Google Scholar] [CrossRef]
  8. Bajpai, P. Generation of Waste in Pulp and Paper Mills. In Management of Pulp and Paper Mill Waste; Springer International Publishing: Cham, Switzerland, 2015; pp. 9–17. [Google Scholar] [CrossRef]
  9. Kaur, R.; Tyagi, R.D.; Zhang, X. Review on pulp and paper activated sludge pretreatment, inhibitory effects and detoxification strategies for biovalorization. Environ. Res. 2020, 182, 109094. [Google Scholar] [CrossRef]
  10. Monte, M.C.; Fuente, E.; Blanco, A.; Negro, C. Waste management from pulp and paper production in the European Union. Waste Manag. 2009, 29, 293–308. [Google Scholar] [CrossRef]
  11. Mendoza Martinez, C.L.; Sermyagina, E.; Vakkilainen, E. Hydrothermal Carbonization of Chemical and Biological Pulp Mill Sludges. Energies 2021, 14, 5693. [Google Scholar] [CrossRef]
  12. Liu, Z.; Hughes, M.; Tong, Y.; Zhou, J.; Kreutter, W.; Lopez, H.C.; Singer, S.; Zitomer, D.; McNamara, P. Paper mill sludge biochar to enhance energy recovery from pyrolysis: A comprehensive evaluation and comparison. Energy 2022, 239, 121925. [Google Scholar] [CrossRef]
  13. Tarelho, L.A.C.; Hauschild, T.; Vilas-Boas, A.C.M.; Silva, D.F.R.; Matos, M.A.A. Biochar from pyrolysis of biological sludge from wastewater treatment. Energy Rep. 2020, 6, 757–763. [Google Scholar] [CrossRef]
  14. Grimm, A.; Etula, J.; Salh, R.; Kalén, G.; Segerström, M.; Brücher, J.; Söderberg, C.; Soukup, D.; Pfeifer, C.; Larsson, S.H. Slagging and fouling characteristics during co-combustion of Scots pine bark with low-temperature dried pulp and paper mill chemical sludge. Fuel Process. Technol. 2019, 193, 282–294. [Google Scholar] [CrossRef]
  15. Latva-Somppi, J. Experimental Studies on Pulp and Paper Mill Sludge Ash Behavior in Fluidized Bed Combustors; VTT Publication 336; Technical Research Centre of Finland: Espoo, Finland, 1998; pp. 1–89. [Google Scholar]
  16. Huang, M.; Chang, C.-C.; Yuan, M.-H.; Chang, C.-Y.; Wu, C.-H.; Shie, J.-L.; Chen, Y.-H.; Chen, Y.-H.; Ho, C.; Chang, W.-R.; et al. Production of torrefied solid bio-fuel from pulp industrywaste. Energies 2017, 10, 910. [Google Scholar] [CrossRef]
  17. Cahyanti, M.N.; Doddapaneni, T.R.K.C.; Madissoo, M.; Pärn, L.; Virro, I.; Kikas, T. Torrefaction of Agricultural and Wood Waste: Comparative Analysis of Selected Fuel Characteristics. Energies 2021, 14, 2774. [Google Scholar] [CrossRef]
  18. Phanphanich, M.; Mani, S. Impact of torrefaction on the grindability and fuel characteristics of forest biomass. Bioresour. Technol. 2011, 102, 1246–1253. [Google Scholar] [CrossRef] [PubMed]
  19. Lachman, J.; Baláš, M.; Lisý, M.; Lisá, H.; Milčák, P.; Elbl, P. An overview of slagging and fouling indicators and their applicability to biomass fuels. Fuel Process. Technol. 2021, 217, 106804. [Google Scholar] [CrossRef]
  20. Garcia-Maraver, A.; Mata-Sanchez, J.; Carpio, M.; Perez-Jimenez, J.A. Critical review of predictive coefficients for biomass ash deposition tendency. J. Energy Inst. 2017, 90, 214–228. [Google Scholar] [CrossRef]
  21. Barta-Rajnai, E.; Wang, L.; Sebestyén, Z.; Barta, Z.; Khalil, R.; Skreiberg, Ø.; Grønli, M.; Jakab, E.; Czégény, Z. Effect of Temperature and Duration of Torrefaction on the Thermal Behavior of Stem Wood, Bark, and Stump of Spruce. Energy Procedia 2017, 105, 551–556. [Google Scholar] [CrossRef]
  22. Gucho, E.M.; Shahzad, K.; Bramer, E.A.; Akhtar, N.A.; Brem, G. Experimental study on dry torrefaction of beech wood and miscanthus. Energies 2015, 8, 3903–3923. [Google Scholar] [CrossRef]
  23. Lin, Y.L.; Zheng, N.Y.; Wang, H.C. Sludge dewatering through H2O2 lysis and ultrasonication and recycle for energy by torrefaction to achieve zero waste: An environmental and economical friendly technology. Renew. Sustain. Energy Rev. 2022, 155, 111857. [Google Scholar] [CrossRef]
  24. Zhang, S.; Su, Y.; Ding, K.; Zhu, S.; Zhang, H.; Liu, X.; Xiang, Y. Effect of inorganic species on torrefaction process and product properties of rice husk. Bioresour. Technol. 2018, 265, 450–455. [Google Scholar] [CrossRef]
  25. Ma, Z.; Zhang, Y.; Shen, Y.; Wang, J.; Yang, Y.; Zhang, W.; Wang, W. Oxygen migration characteristics during bamboo torrefaction process based on the properties of torrefied solid, gaseous, and liquid products. Biomass Bioenergy 2019, 128, 105300. [Google Scholar] [CrossRef]
  26. Reddy, P.J. Clean Coal Technologies for Power Generation; Taylor & Francis: Abingdon, UK, 2013. [Google Scholar]
  27. Markič, M.; Kalan, Z.; Pezdič, J.; Faganeli, J. H/C versus O/C atomic ratio characterization of selected coals in Slovenia. Geologija 2007, 50, 403–426. [Google Scholar] [CrossRef]
  28. Orem, W.H.; Finkelman, R.B. Coal Formation and Geochemistry. In Treatise on Geochemistry; Holland, H.D., Turekian, K.K., Eds.; Elsevier: Oxford, UK, 2003; pp. 191–222. [Google Scholar] [CrossRef]
  29. Pitak, L.; Laloon, K.; Wongpichet, S.; Sirisomboon, P.; Posom, J. Machine learning-based prediction of selected parameters of commercial biomass pellets using line scan near infrared-hyperspectral image. Processes 2021, 9, 316. [Google Scholar] [CrossRef]
  30. Ibitoye, S.E.; Jen, T.C.; Mahamood, R.M.; Akinlabi, E.T. Improving the combustion properties of corncob biomass via torrefaction for solid fuel applications. J. Compos. Sci. 2021, 5, 260. [Google Scholar] [CrossRef]
  31. Sarker, T.R.; Azargohar, R.; Dalai, A.K.; Meda, V. Enhancement of fuel and physicochemical properties of canola residues via microwave torrefaction. Energy Rep. 2021, 7, 6338–6353. [Google Scholar] [CrossRef]
  32. Huang, Y.F.; Cheng, P.H.; Chiueh, P.T.; Lo, S.L. Microwave Torrefaction of leucaena to Produce Biochar with High Fuel Ratio and Energy Return on Investment. Energy Procedia 2017, 105, 35–40. [Google Scholar] [CrossRef]
  33. Xie, K.-C. Chemical Characteristics of Coal. In Structure and Reactivity of Coal; Springer: Berlin/Heidelberg, Germany, 2015; pp. 67–117. [Google Scholar] [CrossRef]
  34. Berruti, F.; Wong, R. Strategies for Low Emissions from Circulating Fluidized Bed Boilers. In Chemical Reactor Technology for Environmentally Safe Reactors and Products; De Lasa, H.I., Doğu, G., Ravella, A., Eds.; Springer: Dordrecht, The Netherlands, 1992; pp. 379–408. [Google Scholar] [CrossRef]
  35. Budzyń, S.; Tora, B. Biomass fuel based on wastes from the paper industry. In Proceedings of the 1st International Conference on the Sustainable Energy and Environment Development (SEED 2016), Kraków, Poland, 17–19 May 2016. [Google Scholar] [CrossRef] [Green Version]
  36. Wang, S.; Wen, Y.; Hammarström, H.; Jönsson, P.G.; Yang, W. Pyrolysis behaviour, kinetics and thermodynamic data of hydrothermal carbonization–Treated pulp and paper mill sludge. Renew. Energy 2021, 177, 1282–1292. [Google Scholar] [CrossRef]
  37. Coimbra, R.N.; Paniagua, S.; Escapa, C.; Calvo, L.F.; Otero, M. Thermal Valorization of Pulp Mill Sludge by Co-processing with Coal. Waste Biomass Valorization 2016, 7, 995–1006. [Google Scholar] [CrossRef]
  38. Simão, L.; Jiusti, J.; Lóh, N.J.; Hotza, D.; Raupp-Pereira, F.; Labrincha, J.A.; Montedo, O.R.K. Waste-containing clinkers: Valorization of alternative mineral sources from pulp and paper mills. Process. Saf. Environ. Prot. 2017, 109, 106–116. [Google Scholar] [CrossRef]
  39. Mitikie, B.B.; Waldtsadik, D.T. Partial Replacement of Cement by Waste Paper Pulp Ash and Its Effect on Concrete Properties. Adv. Civ. Eng. 2022, 2022, 8880196. [Google Scholar] [CrossRef]
  40. Teng, T.T.; San Wong, S.; Wei Low, L. Coagulation–Flocculation Method for the Treatment of Pulp and Paper Mill Wastewater. In The Role of Colloidal Systems in Environmental Protection; Fanun, M.P., Ed.; Elsevier: Amsterdam, The Netherland, 2014; pp. 239–259. [Google Scholar] [CrossRef]
  41. Niu, Y.; Tan, H.; Wang, X.; Liu, Z.; Liu, H.; Liu, Y.; Xu, L. Study on fusion characteristics of biomass ash. Bioresour. Technol. 2010, 101, 9373–9781. [Google Scholar] [CrossRef]
  42. Wang, Q.; Han, K.; Gao, J.; Wang, J.; Lu, C. Investigation of Maize Straw Char Briquette Ash Fusion Characteristics and the Influence of Phosphorus Additives. Energy Fuels 2017, 31, 2822–2830. [Google Scholar] [CrossRef]
  43. Adeleke, A.A.; Odusote, J.K.; Ikubanni, P.P.; Lasode, O.A.; Malathi, M.; Paswan, D. The ignitability, fuel ratio and ash fusion temperatures of torrefied woody biomass. Heliyon 2020, 6, e03582. [Google Scholar] [CrossRef] [PubMed]
  44. Muizniece, I.; Klavina, K. Logging Residue Fuel Characteristic Ash Melting Temperatures. Energy Procedia 2016, 95, 314–318. [Google Scholar] [CrossRef]
  45. Niu, Y.; Lv, Y.; Zhang, X.; Wang, D.; Li, P.; Hui, S. Effects of water leaching (simulated rainfall) and additives (KOH, KCl, and SiO2) on the ash fusion characteristics of corn straw. Appl. Therm. Eng. 2019, 154, 485–492. [Google Scholar] [CrossRef]
  46. Kopczyński, M.; Lasek, J.A.; Iluk, A.; Zuwała, J. The co-combustion of hard coal with raw and torrefied biomasses (willow (Salix viminalis), olive oil residue and waste wood from furniture manufacturing). Energy 2017, 140, 1316–1325. [Google Scholar] [CrossRef]
  47. Alam, M.T.; Dai, B.; Wu, X.; Hoadley, A.; Zhang, L. A critical review of ash slagging mechanisms and viscosity measurement for low-rank coal and bio-slags. Front. Energy 2021, 15, 46–67. [Google Scholar] [CrossRef]
  48. Niu, Y.; Tan, H.; Hui, S. Ash-related issues during biomass combustion: Alkali-induced slagging, silicate melt-induced slagging (ash fusion), agglomeration, corrosion, ash utilization, and related countermeasures. Prog. Energy Combust. Sci. 2016, 52, 1–61. [Google Scholar] [CrossRef]
  49. Deeba, F.; Pruthi, V.; Negi, Y.S. Converting paper mill sludge into neutral lipids by oleaginous yeast Cryptococcus vishniaccii for biodiesel production. Bioresour. Technol. 2016, 213, 96–102. [Google Scholar] [CrossRef]
  50. Giudicianni, P.; Gargiulo, V.; Grottola, C.M.; Alfè, M.; Ferreiro, A.I.; Mendes, M.A.A.; Fagnano, M.; Ragucci, R. Inherent Metal Elements in Biomass Pyrolysis: A Review. Energy Fuels 2021, 35, 5407–5478. [Google Scholar] [CrossRef]
  51. Zhao, S.; Liu, M.; Zhao, L.; Lu, J. Effects of organic and inorganic metal salts on thermogravimetric pyrolysis of biomass components. Korean J. Chem. Eng. 2017, 34, 3077–3084. [Google Scholar] [CrossRef]
  52. Wang, W.L.; Ren, X.Y.; Li, L.F.; Chang, J.M.; Cai, L.P.; Geng, J. Catalytic effect of metal chlorides on analytical pyrolysis of alkali lignin. Fuel Process. Technol. 2015, 134, 345–351. [Google Scholar] [CrossRef]
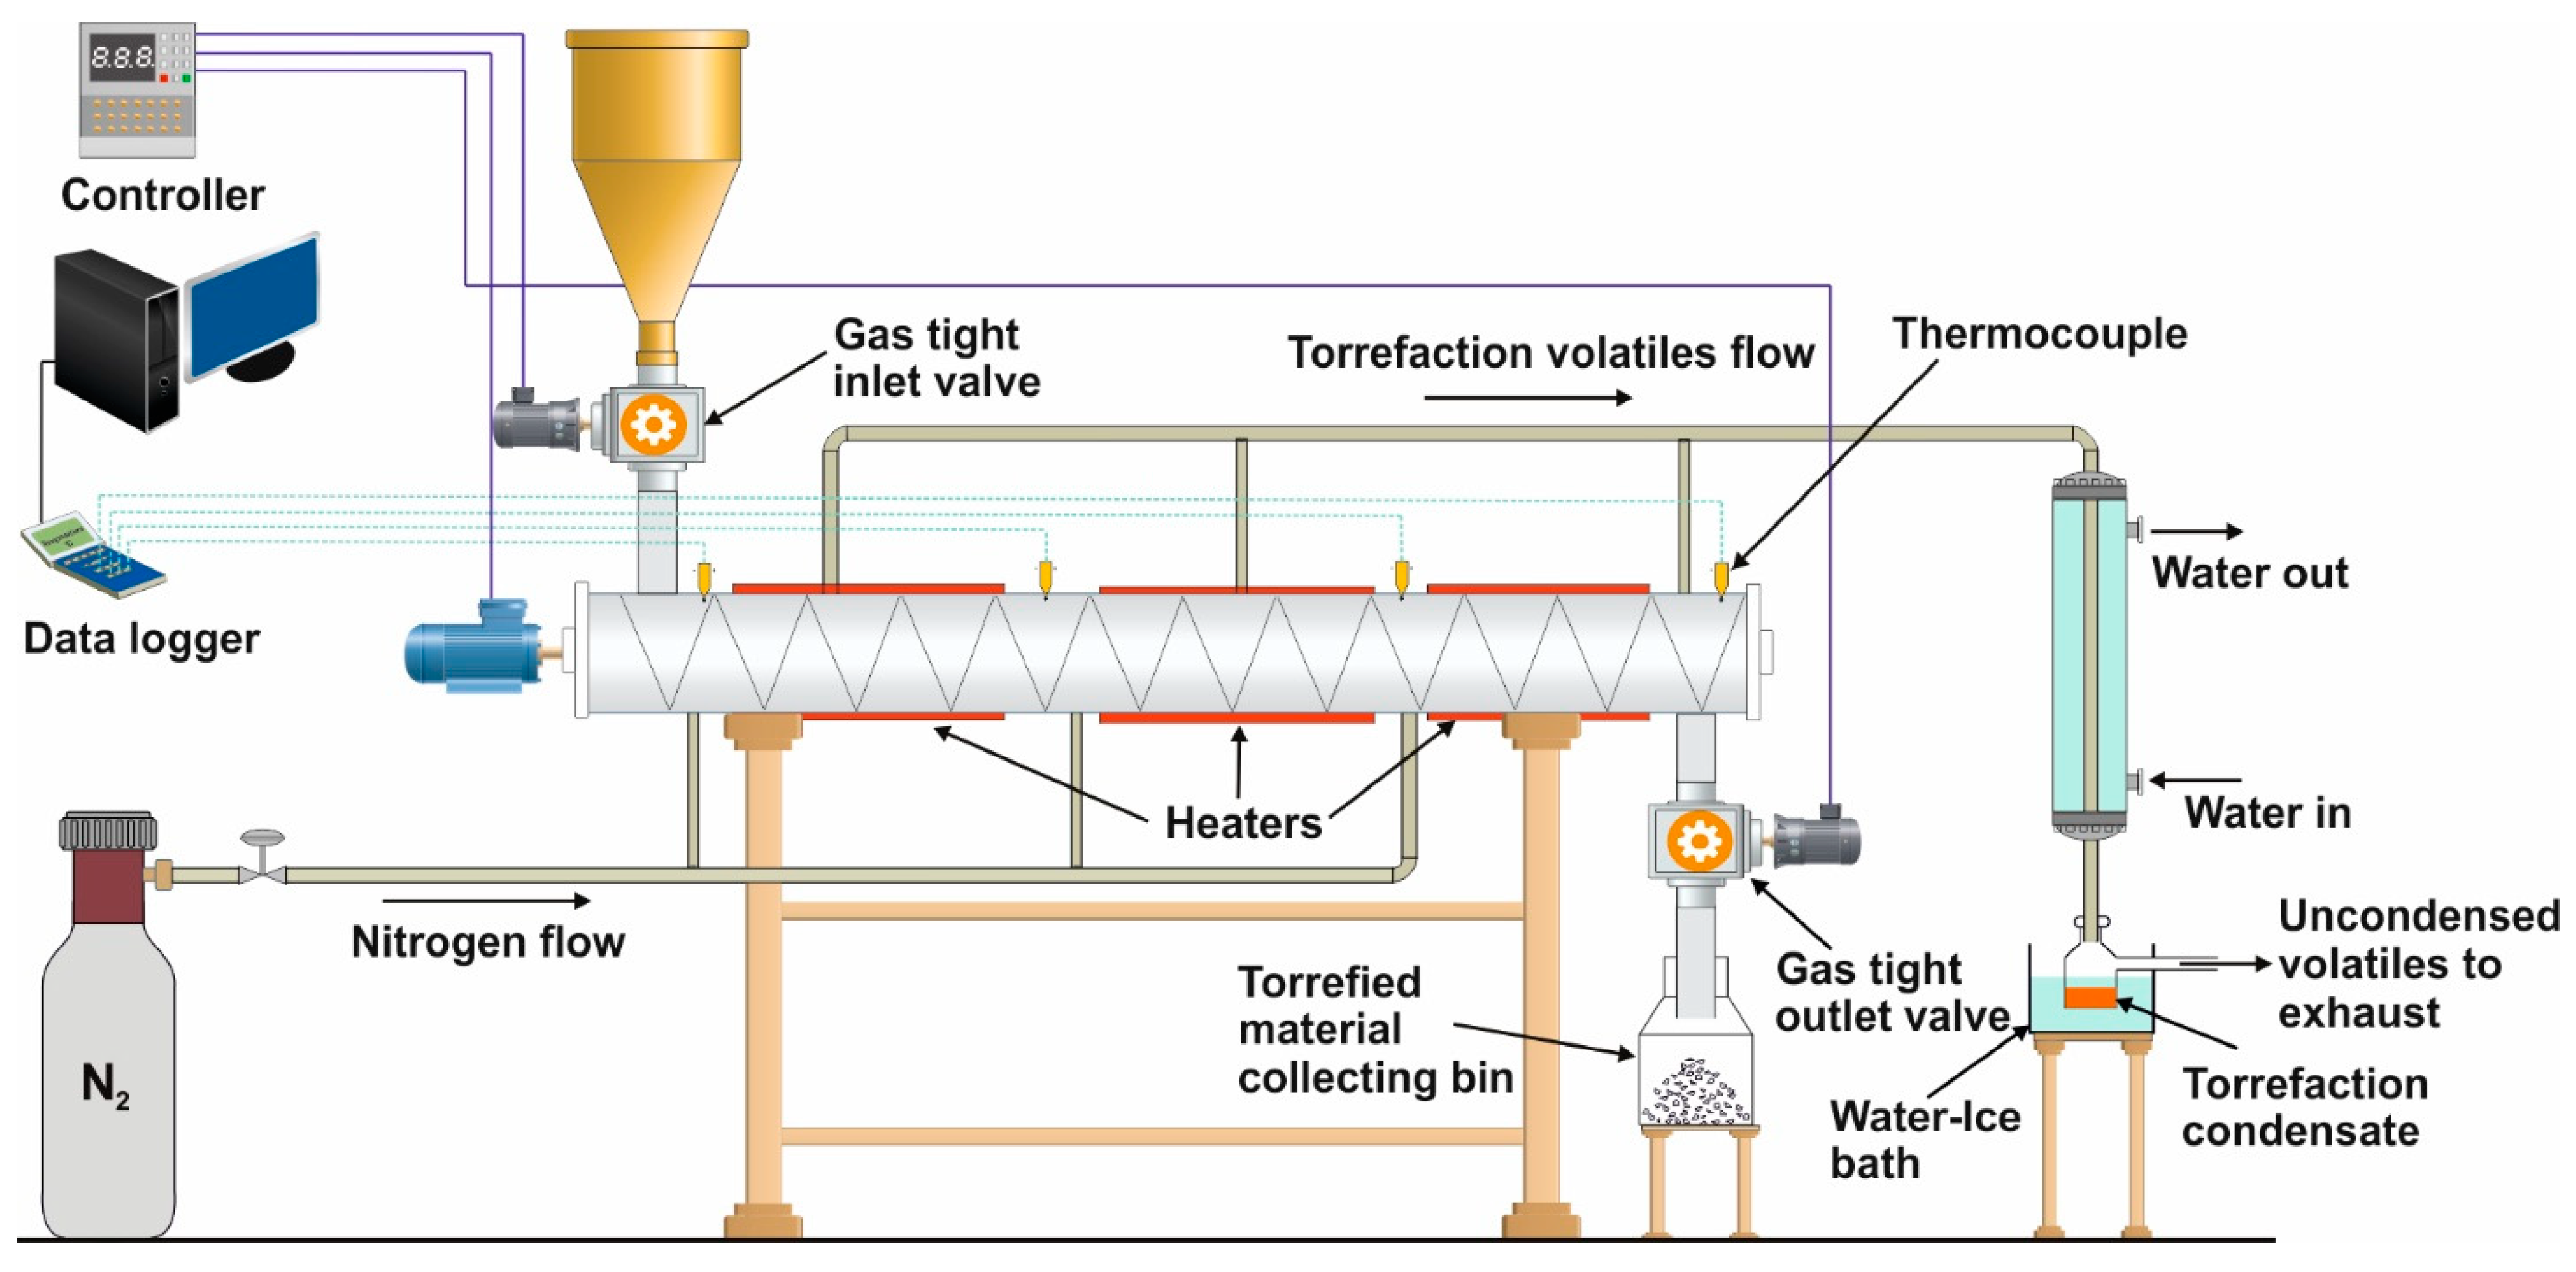
Figure 1. Continuous torrefaction reactor setup used in this study.
Energies 15 06175 g001
Figure 2. Mass and energy yield during torrefaction of pulp industry sludge; (a) Mass yield (wt.%) and (b) energy yield (%) and energy density.
Energies 15 06175 g002
Figure 3. Van Krevelen diagram of dried and torrefied sludge. The data for anthracite, coal and lignite are from [28].
Energies 15 06175 g003
Figure 4. Ash melting temperatures of dried and torrefied pulp sludge. IDT = initial deformation temperature, ST = spherical temperature, HT = hemispherical temperature, FT = fluid temperature.
Energies 15 06175 g004
Figure 5. SWOT analysis of the torrefaction of pulp industry sludge.
Energies 15 06175 g005
Table 1. Slagging and fouling indices to understand ash related issues [19,20].
Slagging and Fouling Degree
Evaluation IndexEvaluation CriteriaLowMediumHighSevere
Base/acid ratio B A = F e 2 O 3 + C a O + M g O + N a 2 O + K 2 O S i O 2 + A l 2 O 3 + T i O 2 <0.505–11–1.75>1.75
Slag viscosity index S r = S i O 2 F e 2 O 3 + C a O + M g O × 100 >7265–72≤65
Silica content (SiO2 %)SiO2 content in ash<2020–25>25
Fouling index F u = F e 2 O 3 + C a O + M g O + N a 2 O + K 2 O S i O 2 + A l 2 O 3 + T i O 2   ×   N a 2 O + K 2 O ≤0.60.6–40>40
Bed agglomeration index B A I = F e 2 O 3 N a 2 O + K 2 O high when BAI < 0.15
Table 2. Ultimate analysis, proximate analysis and heating values of dried and torrefied pulp industry sludge.
Ultimate Analysis (Dry Basis)Proximate Analysis (Dry Basis)HHV (MJ/kg)
C (%)H (%)N (%)S (%)O (%)VM (%)FC (%)Ash (%)
DPS45.43 ± 0.29 5.41 ± 0.042.21 ± 0.240.46 ± 0.1046.49 ± 0.6271.05 ± 0.2216.25 ± 1.06 12.70 ± 0.8519.18 ± 0.03
TPS-250-3047.75 ± 0.095.16 ± 0.022.26 ± 0.010.33 ± 0.0244.50 ± 0.1266.12 ± 0.1418.06 ± 0.2515.82 ± 0.1119.72 ± 0.03
TPS-275-3049.15 ± 0.314.96 ± 0.022.32 ± 0.060.33 ± 0.0143.23 ± 0.3560.25 ± 0.0822.56 ± 0.007 17.19 ± 0.9321.34 ± 0.18
TPS-300-3051.76 ± 0.154.66 ± 0.032.51 ± 0.040.35 ± 0.0140.72 ± 0.2252.72 ± 0.5126.27 ± 0.52 21.01 ± 0.0122.08 ± 0.806
TPS-250-6048.62 ± 0.115.07 ± 0.022.31 ± 0.040.32 ± 0.0143.68 ± 0.1664.09 ± 0.1318.95 ± 0.04 16.96 ± 0.0920.11 ± 0.03
TPS-275-6049.37 ± 0.144.80 ± 0.012.36 ± 0.010.33 ± 0.0143.15 ± 0.1457.80 ± 0.323.25 ± 0.35 18.95 ± 0.0621.87 ± 0.05
TPS-300-6053.05 ± 0.114.46 ± 0.022.62 ± 0.030.37 ± 0.0239.50 ± 0.1648.07 ± 0.129.51 ± 0.8422.41 ± 0.9522.61 ± 0.14
DPS = dried pulp sludge, TPS = torrefied pulp sludge, HHV = higher heating value.
Table 3. Fuel ratios of dried and torrefied pulp industry sludge.
Fuel Ratio
DPS0.23
TPS-250-300.27
TPS-275-300.36
TPS-300-300.50
TPS-250-600.30
TPS-275-600.40
TPS-300-600.61
DPS = dried pulp sludge, TPS = torrefied pulp sludge.
Table 4. Ash composition of dried and torrefied pulp industry sludge.
Oxides (g/kg of Pulp Sludge)Oxides (%) Normalized to Ash Content
DPSTPS-250-60TPS-275-60TPS-300-60DPSTPS-250-60TPS-275-60TPS-300-60
CaO2125.22836.316.5314.8614.7716.20
MgO2.933.44.42.281.771.791.96
SiO257.972.280.4101.445.5942.5642.4245.24
Al2O35.46.47.79.84.253.774.064.37
Fe2O32.85.16.36.92.203.013.323.08
K2O2.12.533.71.651.471.581.65
Na2O15.318.922.428.512.0511.1411.8212.72
TiO20.0090.0090.0150.018
ZnO0.1910.2350.2830.283
DPS = dried pulp sludge, TPS = torrefied pulp sludge.
Table 5. Ash fusion indexes of dried and torrefied pulp industry sludge.
Ash Fusion Indexes
DPSTPS-250-60TPS-275-60TPS-300-60
Base/acid ratio0.700.700.720.72
Slag viscosity index68.4468.4468.0868.05
Silica content (%)45.5942.5642.4245.24
Fouling index12.1214.8918.1923.10
Bed agglomeration index0.160.240.250.21
DPS = dried pulp sludge, TPS = torrefied pulp sludge.
Table 6. Chemical composition of dried and torrefied pulp industry sludge in terms of major biomass components.
Torrefaction ConditionCelluloseHemicelluloseLignin
DPS35.58 ± 0.0210.65 ± 4.059.72 ± 0.45
TPS 250-3031.73 ± 1.643.95 ± 2.4917.88 ± 0.81
TPS 275-3023.77 ± 2.66ND18.22 ± 2.15
TPS 300-3017.11 ± 1.86ND27.99 ± 0.44
TPS 250-6033.53 ± 1.56ND16.33 ± 2.06
TPS 275-6028.93 ± 1.54ND23.95 ± 1.47
TPS 300-6012 ± 1.525ND29.76 ± 0.76
DPS = dried pulp sludge, TPS = torrefied pulp sludge, ND = not detected.
Publisher’s Note: MDPI stays neutral with regard to jurisdictional claims in published maps and institutional affiliations.