Article

Multi-Variate and Multi-Response Analysis of Hydrothermal Carbonization of Food Waste: Hydrochar Composition and Solid Fuel Characteristics

by
Jaime E. Borbolla-Gaxiola
,
Andrew B. Ross
and
Valerie Dupont
*
School of Chemical and Process Engineering, University of Leeds, Woodhouse Ln, Leeds LS2 9JT, UK
*
Author to whom correspondence should be addressed.
Energies 2022, 15(15), 5342; https://doi.org/10.3390/en15155342
Submission received: 4 July 2022 / Revised: 15 July 2022 / Accepted: 15 July 2022 / Published: 22 July 2022

Abstract

:
To maximize food waste utilization, it is necessary to understand the effect of process variables on product distribution. To this day, there is a lack of studies evaluating the effects of the multiple variables of HTC on food waste. A Design of Experiment (DoE) approach has been used to investigate the influence of three process variables on the product distribution and composition of process streams from the HTC of food waste. This work evaluates the effect of hydrothermal carbonization process conditions on the composition and utilization capabilities of hydrochar from food waste. Parametric analysis was carried out with a design of experiments of central composite rotatable design (CCRD) and response surface methodology (RSM). Derringer’s desirability function was employed to perform a multi-response evaluation. The optimized process conditions were 260.4 °C, 29.5 min reaction time, and 19.6% solid load. The predicted optimized responses were EMC = 2.7%, SY = 57.1%, EY = 84.7%, ED = 1.5, and HHV of 31.8 MJ/Kg, with a composite desirability of 0.68. Temperature and solid load had a significant effect on all evaluated responses, while reaction time was non-significant.

1. Introduction

Food waste (FW) includes a variety of residual wastes generated at any point of the food production supply chain and post-consumption wastes from domestic, or commercial activity. It is an abundant biomass resource worldwide with a high carbon content and energy potential. FW can be associated either directly with agricultural wastes, such as waste from the food industry, or final consumers (household or restaurant wastes), with the latter often resulting in large amounts entering municipal waste streams.
In addition to the large quantities of food wasted, its disposal results in several inherent problems. The most common methods for the disposal of food waste include landfill and ocean dumping [1]. Both methods of disposal result in significant environmental impact due to the emission of greenhouse gases since approximately 45% of the carbon content in food waste is released in gaseous form after landfill [2]. A large fraction of the released carbon is in the form of methane, which presents a global warming potential (GWP) of 25 times the greenhouse effect of CO2 in a 100-year horizon [3]. The decomposition of organic matter after dumping and landfilling causes nutrient imbalances in soil and water bodies. In addition to environmental issues, released carbon represents a large amount of wasted energy. To counter these problems, developed countries have developed more advanced methods of disposal, the most common of which include composting and anaerobic digestion (AD) [1]. However, these technologies have technical challenges, such as long processing times and the need for pre-treatment of feedstock to achieve optimal conversion.
In recent years, hydrothermal carbonization (HTC) has positioned itself as a potential technology for valorizing food waste because it overcomes many of the technical challenges of using FW as a feedstock in comparison to other technologies.
HTC involves the treatment of biomass submerged in water at sub-critical conditions, at temperatures ranging from 180 to 260 °C, and autogenic pressures ranging from 10 to 40 bar, resulting in a solid phase known as hydrochar and a liquid phase known as process water, which contains considerable solubilized matter [4,5]. At higher temperatures and pressures, e.g., from 260–350 °C, the main product is a liquid, and the process is referred to as hydrothermal liquefaction (HTL). At higher reaction severity (>375 °C and >22.1 MPa), the process favors the gasification of the feedstock-producing syngas. This process is referred to as hydrothermal gasification (HTG) [6]. The processing conditions explored in this paper fall within the HTC range. The reaction times explored range between 20–70 min; however, carbonization reactions proceed quickly, and operating at longer reaction times is more energy intensive. The solid product has coal-like properties and is commonly known as hydrochar to differentiate it from biochar from dry-carbonization technologies, such as pyrolysis. Hydrochar exhibits enhanced stability, storage, and energetic properties compared to the original biomass [7]. In addition, there is a considerable volume reduction from the original feedstock. In general, hydrochar exhibits a lower oxygen content, enhancing the O:C and H:C ratios due to dehydration and decarboxylation reactions, enhanced fixed carbon, and reduced volatile matter. Meanwhile, the HTC liquid fraction is generally comprised of sugars, volatile fatty acids (e.g., acetic and formic acid), N-containing compounds (e.g., pyrrole and phenolic and furanic compounds (e.g., 5-hydroxymethyl furfural), and dissolved inorganics, such as alkali metals [8].
The HTC process offers numerous advantages that make it more suitable for treating food waste in comparison to other technologies, such as pyrolysis or gasification. Unlike the latter, HTC does not require an energy-demanding drying process, which would make it more energetically favorable [9]. The utilization of HTC to treat high moisture biomass can reduce its carbon footprint compared to other treatments without generating an odor [10]. HTC offers several advantages to biological treatments, such as a shorter process time, as it takes only hours instead of days. In addition, HTC could employ FW with large variability in chemical composition, which can significantly affect the performance of biological processes, such as anaerobic digestion [9]. In addition, due to intense process conditions, HTC can eliminate pathogens and inactivate other potential organic contaminants [10].
In recent years, the use of HTC for the treatment of food waste has gained momentum, and experimental and literature reports are becoming more numerous each year. The works cover different end uses for hydrochar, including soil conditioner or fertilizer [11,12], adsorbents of metals [13], and N and P recovery [14,15]. Nonetheless, the proposed main end use of hydrochar from food waste is solid fuel, either for combustion or gasification [2,16,17,18,19,20,21,22,23]. These experimental works, along with feasibility and process evaluation, have made advances in the development of technology for food waste valorization or treatment [9,24,25,26,27].
Finding the optimal conditions is a crucial step for assessing the viability of HTC as a commercial technology and achieving its implementation as a biomass pre-treatment in larger processes. However, the optimization of this process is hindered by the complexity of the HTC reaction environment and the heterogeneity of food waste feedstock, which complicates the generation of a general reaction model for the HTC process and the prediction of HTC products, limiting the extent of the simulation works [28]. Thus, statistical and empirical models are powerful tools for developing the optimization of the HTC process.
It has been noted that most studies focus on expanding feedstock options and often evaluate one variable at a time [29]. This suggests that the evaluation of how multiple variables and their interactions affect the HTC process represents a significant gap in HTC research. Filling this gap is an important step in continuing the maturation process of technology. Studies and multi-response analysis could help develop opportunities for HTC technology applications.
Previous studies have used response surface methods to understand the effect of multiple variables on HTC parameters, such as temperature, reaction time, solid load, and pH [30,31,32]. However, studies on optimization are limited. Graphical optimization has been reported for hydrochar yields [33,34]. Nonetheless, this optimization approach is limited to one response at a time. More recently, the multiple-response optimization of HTC is beginning to appear. Stutzenstein et al. [35] optimized the solid yield and the difference of O/C in hydrochar using a desirability function for anaerobic digestion digestate. In the same manner, El Ouadrhiri et al. [36] reported the optimization of date stones HTC for solid yield and carbon retention. Therefore, combining end-utilization responses in multiple-response optimization could provide better insight into the HTC process and overcome the trade-offs of the reaction.
This work aims to evaluate the effect of HTC process conditions on the composition and utilization capabilities of hydrochar from food waste. To this day, there is a lack of studies evaluating the effects of the multiple variables of HTC on food waste. Thus, a Design of Experiment (DoE) approach has been used to investigate the influence of three process variables on the product composition and properties of the solid product, hydrochar, from the HTC of food waste. Parametric analysis is carried out with a design of experiments of central composite rotatable design (CCRD) and response surface methodology (RSM). The desirability function was employed to perform a multi-response evaluation. To advance the utilization of HTC on food waste valorization, it is necessary to understand the effect of process variables on product distribution and their trade-offs.

2. Materials and Methods

2.1. Food Waste Collection

Food waste was collected from a hall of residence canteen at the University of Leeds. The food waste had the accumulation of three meals for two days, comprised of significant amounts of eggs, sausages, cooked vegetables, cooked potatoes, bread, and fresh fruit, as observed during the initial visual inspection. The sample was blended to a more easily handled size with a Nutribullet® blender and mixed to homogenization. The homogenized sample was stored in 1.5 kg bags and frozen at −20 °C to preserve its initial composition. For characterization analysis, the food waste sample was freeze-dried and analyzed by proximate, ultimate analysis, and biochemical analysis; the measurements were performed by duplicate on the homogenized sample. A summary of the food waste characterization is shown in Table 1. Neutral detergent fiber (NDF), acid detergent fiber (ADF), and lignin were determined using the Gerhardt Fibrecap system (C. Gerhardt GmbH & Co. KG, Königswinter, Germany) complying with the van Soest methods [37,38]. Where NDF is the sample’s remaining fraction after treatment with a neutral detergent solution, NDF includes hemicellulose, cellulose, and lignin fractions. The ADF fraction is obtained after acid detergent digestion and consists of cellulose and lignin fractions, while the hemicellulose fraction is removed by filtration. Finally, lignin is determined after treating the ADF fraction with a sulfuric acid solution, where cellulose is removed. Total oil was determined using the Soxtec method [39]. The total protein content was determined using a nitrogen-to-protein using the DUMAS method, with a conversion factor of 5.13.

2.2. Hydrothermal Carbonization

HTC reactions were carried out in a 600 mL high-pressure reactor (Parr Instrument Company, Moline, IL, USA). The biomass was loaded fresh into a glass liner, and the moisture content was adjusted to the desired solid load values for the different runs. A glass liner containing the sample submerged in water was placed into the HTC reactor vessel and turned on. The reactor was counted with a heating jacket surrounding the reactor vessel that heated the sample until it reached a set temperature; only then was the reaction time started. The temperature was regulated by a proportional integral derivative (PID) controller at a heating rate of approximately 8 °C/min. After the reaction time ended, the heater was turned off, and the reactor was taken out of the furnace and left to cool down at room temperature until the temperature fell below 40 °C. The reactor was opened once it reached a manageable temperature, and the hydrochar was separated from the process water using 150 mm filter paper (Whatman, Maidstone, UK) and vacuum filtration for 1 min. The liquid filtered called ‘process water’ was frozen at −20 °C for further analysis. The solid fraction ‘hydrochar’ was oven-dried at 60°C overnight and manually ground in a mortar and stored in a zip-lock sealed bag.

2.3. Characterization Analysis

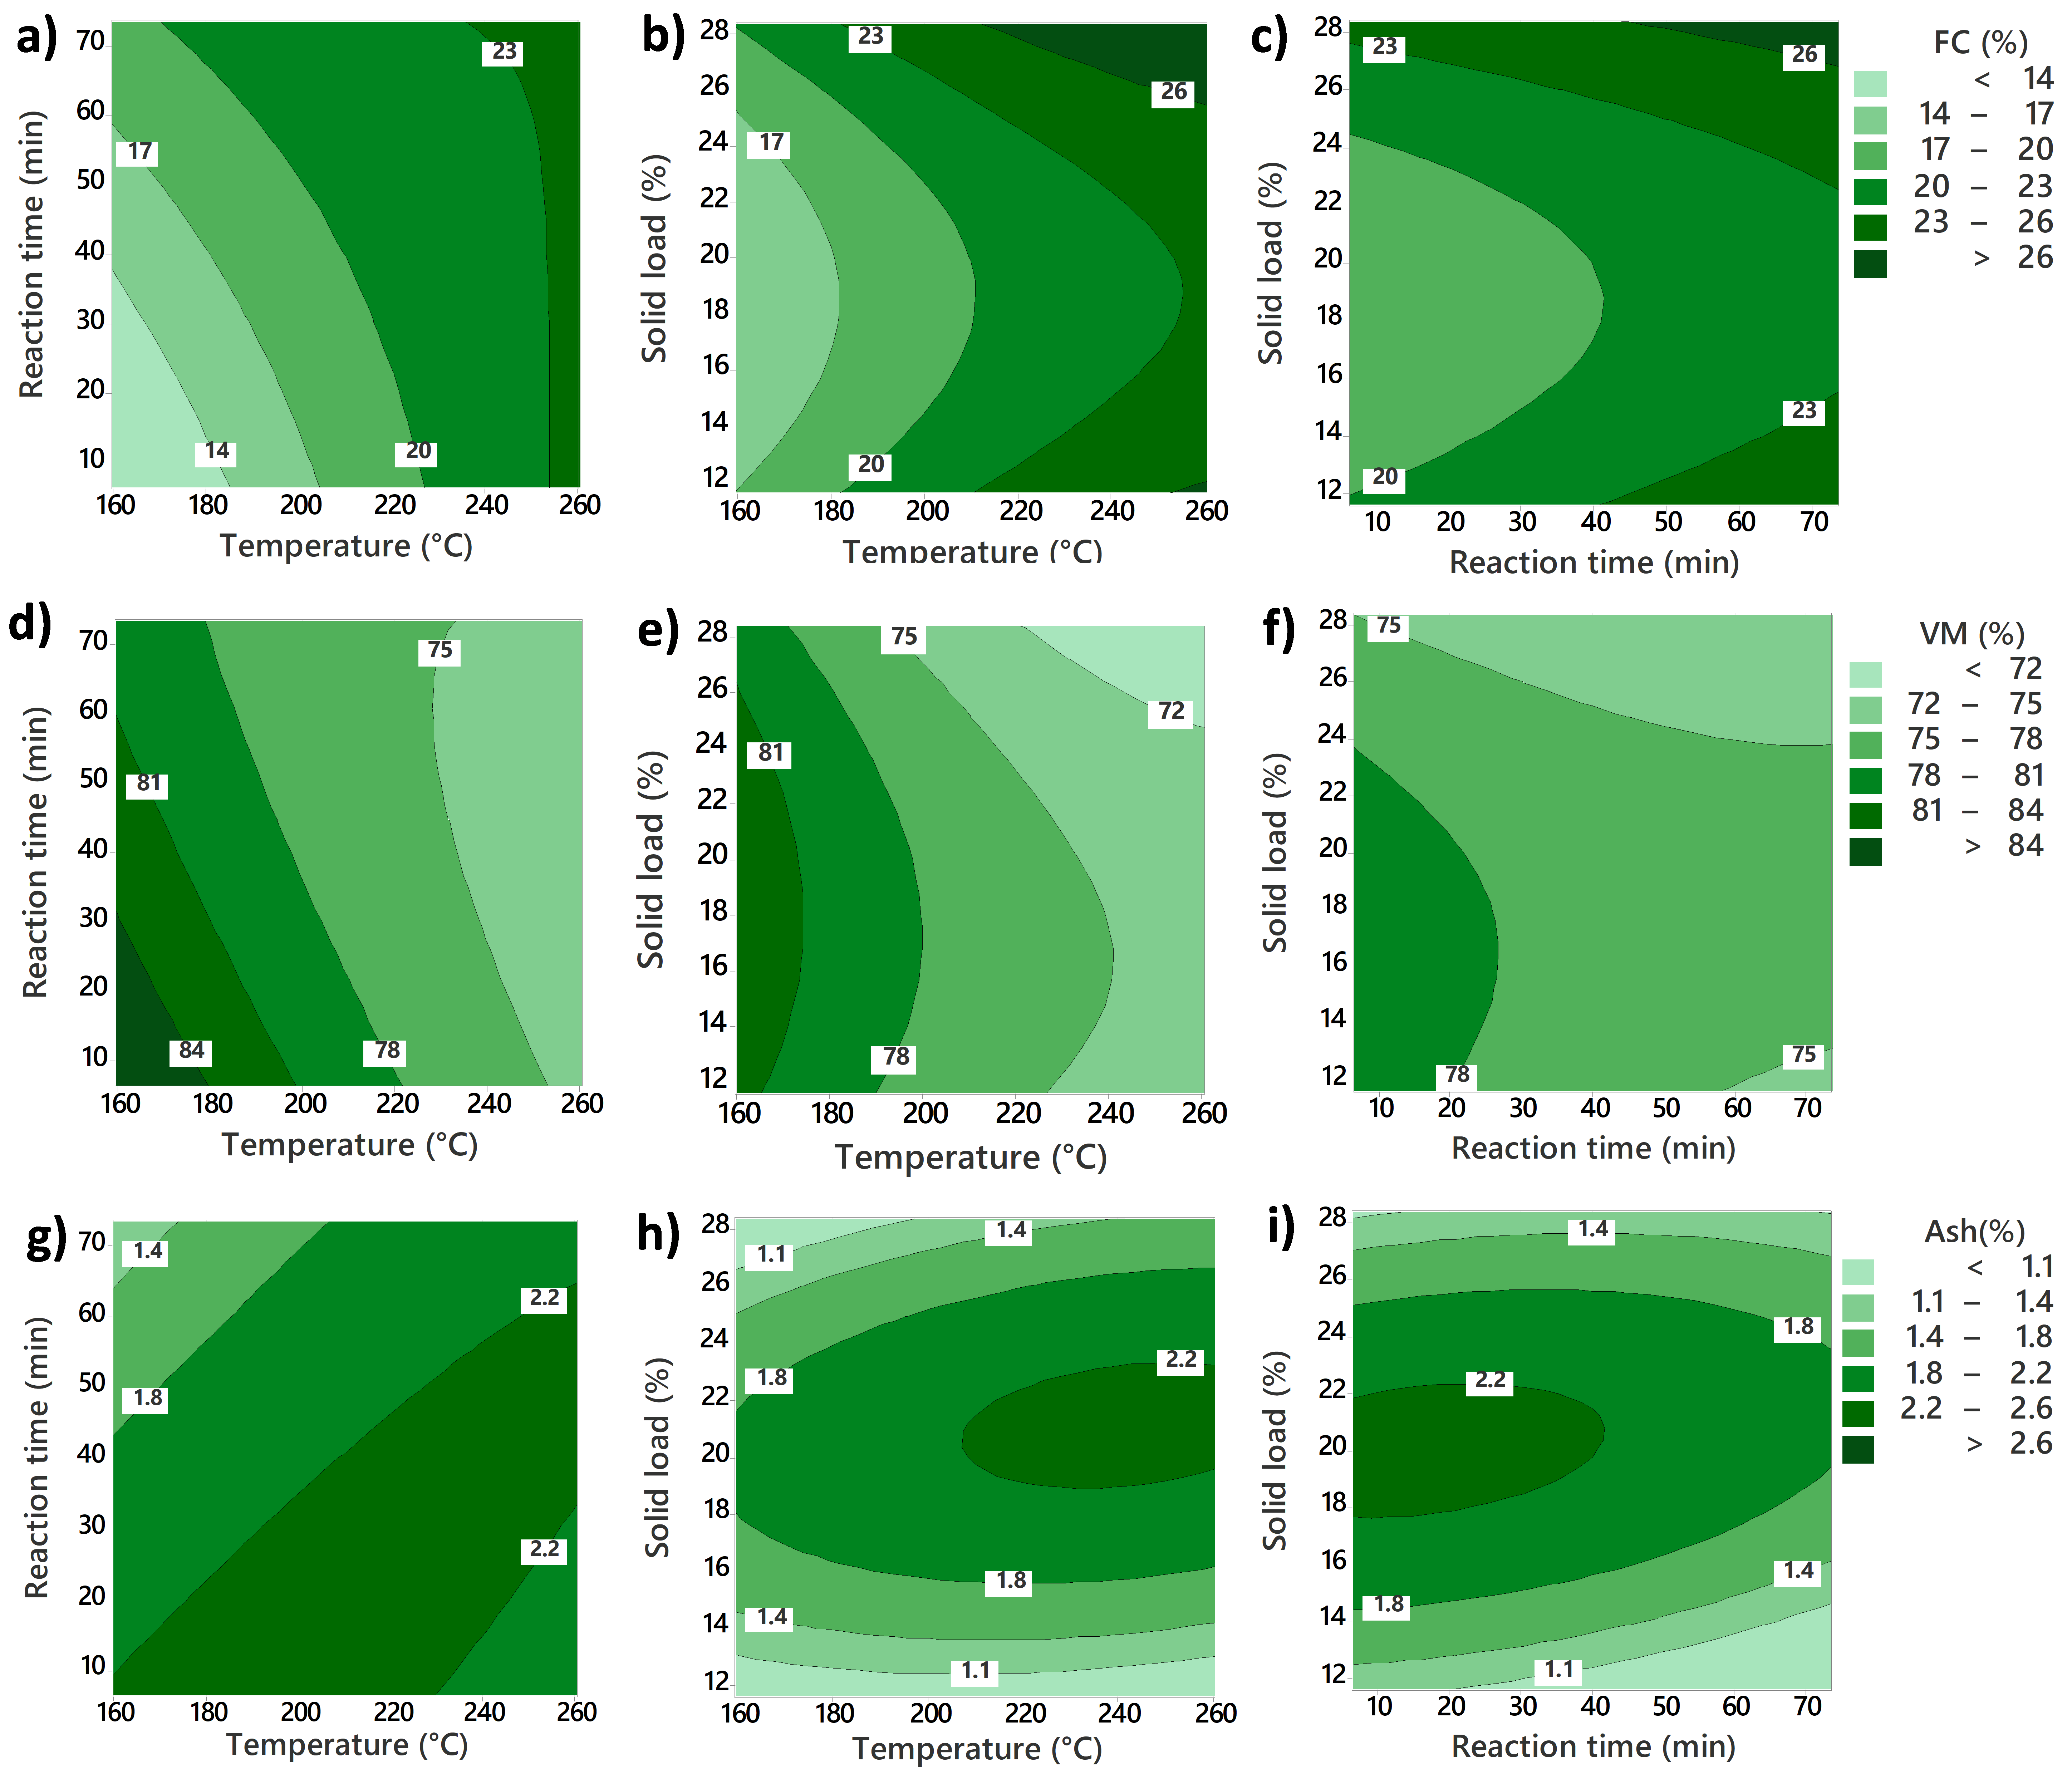
Proximate analysis was carried out with a thermogravimetric analyzer (TGA) (Mettler Toledo TGA/DSC 1). For this method, 10 mg of homogenized sample was loaded into an Alumina 70 µL ceramic crucible and then placed in the TGA equipment. The temperature was ramped from 25 to 900 °C at a heating rate of 25 °C/min, initially under a constant flow of nitrogen (50 mL/min), and finally switched to airflow. The equipment was heated from 25 to 105 °C, at this temperature, it was held for 10 min to assure the removal of moisture. This section was used to calculate moisture content. Heating was resumed until the system reached a temperature of 900 °C, and was held for 10 min to allow the release of volatile matter. After that, the nitrogen flow was switched to air, and the system was held once more at 900 °C for another 15 min. The change in the gaseous phase ensured the total combustion of the fixed carbon fraction. Finally, the remaining produced comprised the inorganic fraction considered ash. The proximate composition of the samples was thus calculated based on the difference in mass loss during each heating stage. The analysis was done in duplicate for each sample.
The objective of the ultimate analysis was to determine the elemental composition of the samples of study by allowing the quantification of the main elements carbon, hydrogen, oxygen, nitrogen, and sulfur (C, H, O, N, S). This technique utilized an instrument elemental analyzer Thermo Instruments Flash EA 1112 Series (Thermo Scientific, Waltham, MA, USA). In this method, 2.5 to 3.0 mg of the sample was weighed in tin foil capsules (Elemental Microanalysis D1009, Devon, UK) and crimped to remove the presence of air. The elemental composition was determined by the conversion of the different elements to their oxides, carbon to CO2, nitrogen to NOx, sulfur to SO2, and hydrogen to H2O. These compounds were measured and quantified by a gas chromatographer using a thermal conductivity detector, while oxygen was determined by difference.

2.4. Data Analysis

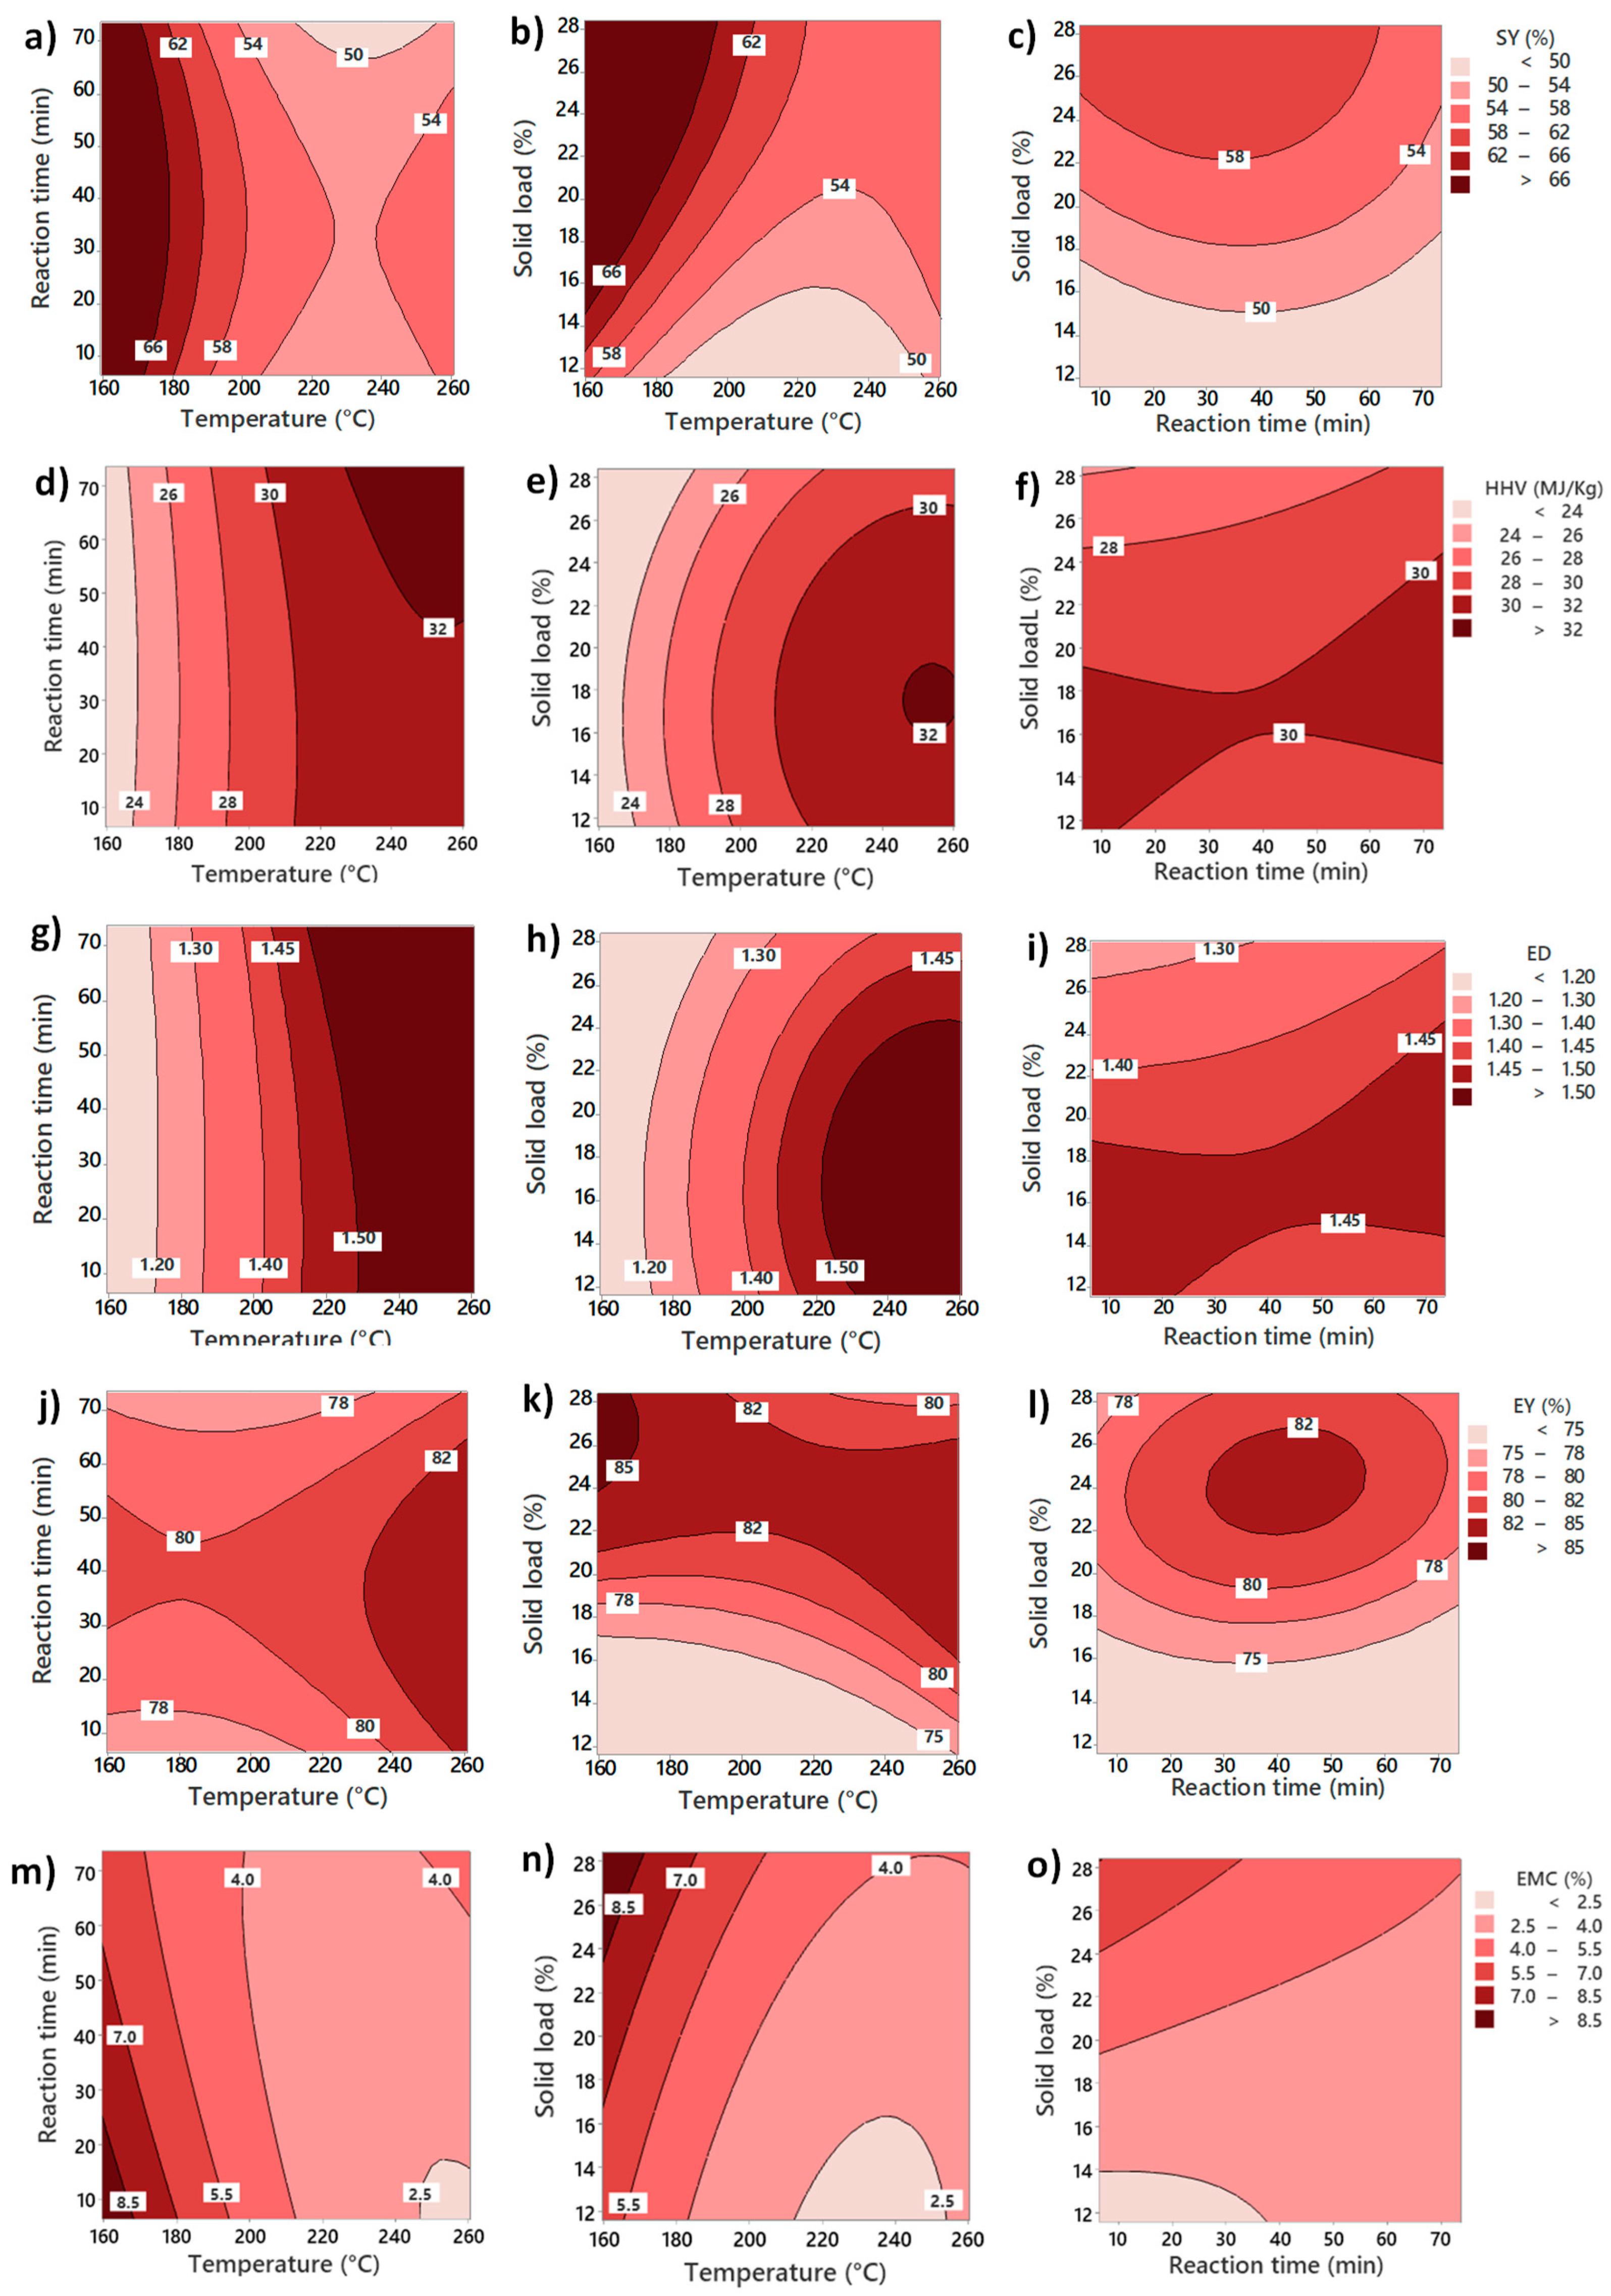
Four numeric responses were evaluated for hydrochar quality: solid yield (SY), higher heating value (HHV), energy densification (ED), and energy yield (EY). The solid yield was calculated by considering the solid fraction remaining in the hydrochar in relation to the initial solid fraction in the raw food waste. It was calculated using Equation (1), where both solid mass fractions were determined on a dry basis.
Solid   yield ( % ) = dry   mass Hydrochar dry   mass Food   waste × 100
A higher heating value was calculated using the data from the proximate and ultimate analysis based on the IGT correlations [40] in Equation (2), where C, H, A, O, and N represent the mass percentage of dry material of carbon, hydrogen, ash, oxygen, and nitrogen, respectively.
HHV   ( MJ kg ) = 0.341 C + 1.323 H + 0.0685 0.0153 A 0.1194 ( O + N )
Energy densification (ED) was calculated to assess the improvement of the heating value after HTC, as in Equation (3). The energy yield (EY) to measure the content of energy remaining in hydrochar was determined using Equation (4).
ED = HHV char HHV FW
EY ( % ) = HHV char · Dry   mass Hydrochar HHV FW · Dry   mass Food   waste

2.5. Equilibrium Moisture Content

The particle size was homogenized using a mesh of 500 and 250 microns, and approximately 1 g of samples was weighed in a crucible. The samples were then placed in a closed chamber of 35 × 50 cm, accompanied by a saturated NaCl solution to generate a relative humidity of around 75%. The principle of the experiment consisted of placing the samples inside a chamber with constant relative humidity, letting the hydrochar adsorb, and absorbing moisture. Consequently, weighing the sample to record the hydrated weight, and finally drying and weighing the sample for the mass balance, as stated in Equation (5) [41].
This experiment was not focused on obtaining the adsorption isotherms but on assessing the hygroscopicity of the hydrochars generated in the DoE and locating the conditions zone where moisture adsorption is minimized. Instead, the EMC is represented as the weight percentage gained by moisture absorption after a period of time (48 h).
EMC ( % ) = mass wet mass dry mass dry

2.6. Design of Experiments

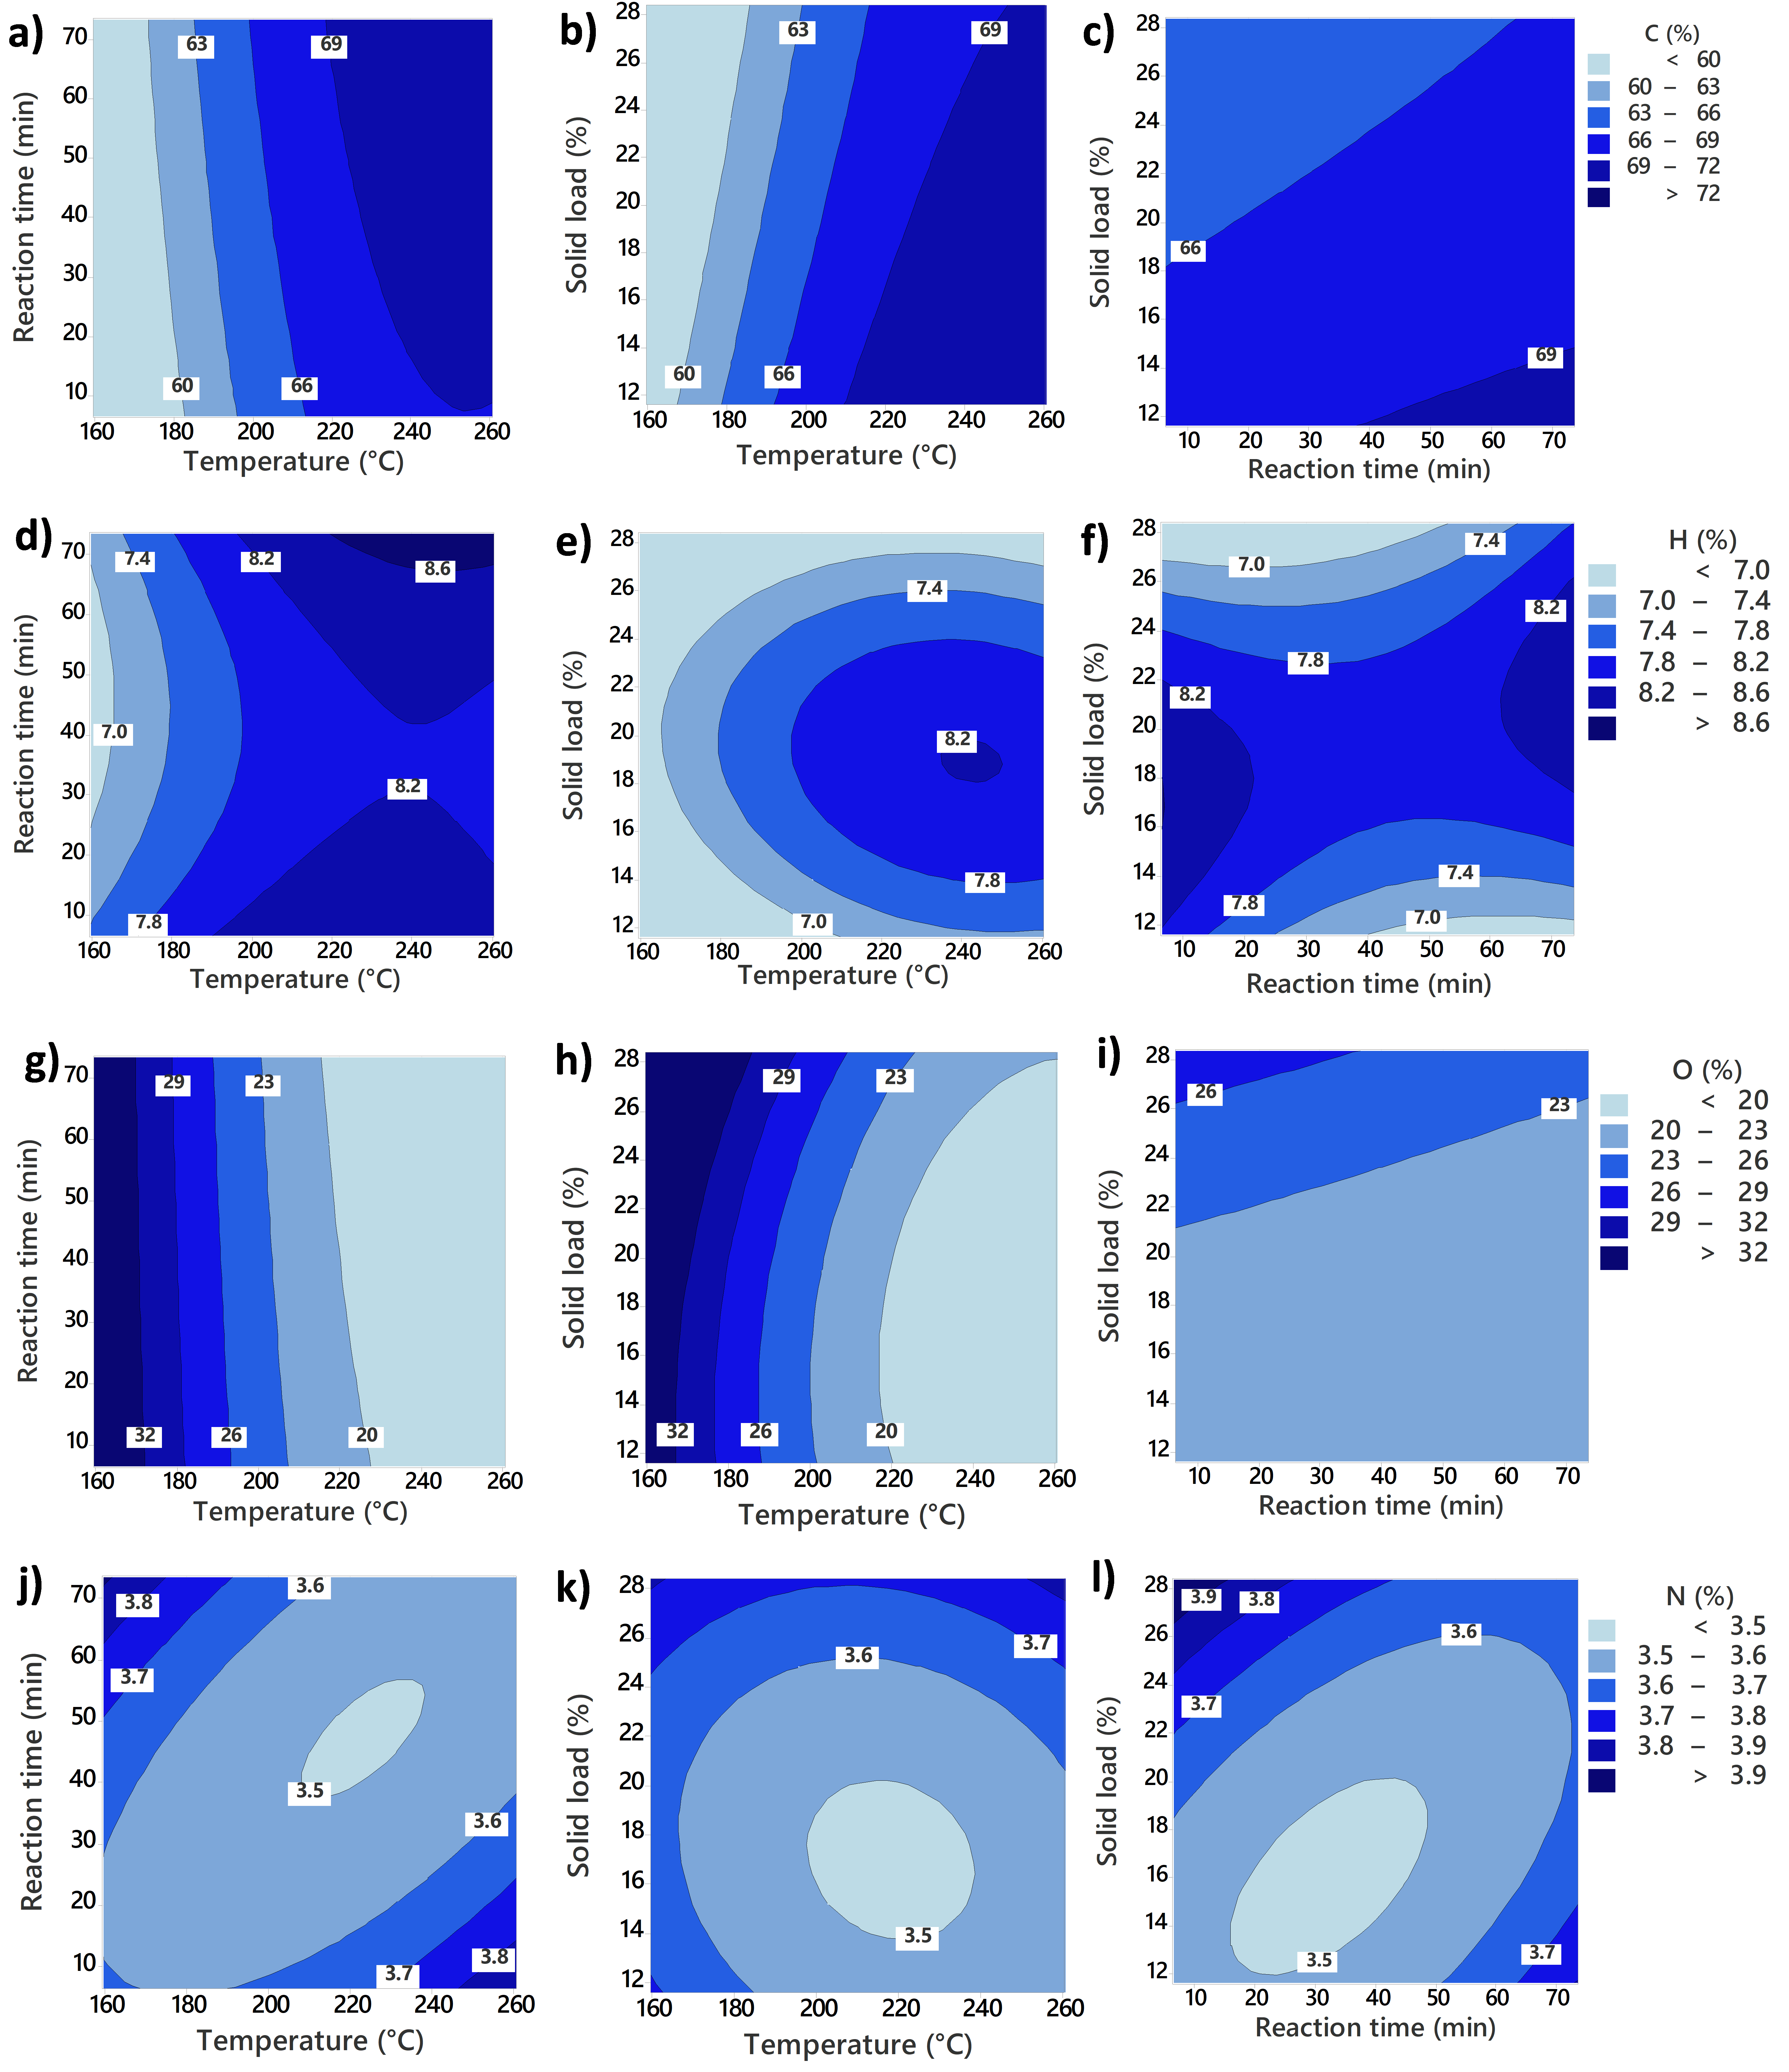
Surface response methodology (RSM) was used to evaluate the effects of different process conditions on HTC products. Design of Experiment (DoE) consists of a central composite design with rotatable points. The design evaluated the linear, quadratic, and two-way interactions of the three continuous variables: temperature, reaction time, and solid load. High- and low-level values for each variable were temperature (T) (240 and 180 °C), reaction time (RT) (60 and 20 min), and solid load (SL) (15 and 25% dry basis). The values for the central points are the middle point between the higher and lower levels of each parameter (210 °C, 40 min, and 20% solid load). The matrix of the full run set is shown in Table 2, where 1 stands for higher level, −1 for lower level, α for higher alpha level, -α for lower alpha level, and 0 central points for a complete design composed of 8 cubic points, 6 central points, and 6 axial points (α = 1.682). The order of the runs was sorted randomly to conduct the experiments.
The values for each variable were selected based on different considerations. For temperature, 180 to 240 °C (and axial points of 160 and 260 °C) cover most of the HTC temperature reaction region. Regarding reaction time, short time values with the longest run (73 min) were screened. Considering the integration of HTC into a larger process, shorter times would make it more economically viable. In the case of solid load, the final range analyzed was from 12 to 28 wt%. This range covers the variation of solid load in real food waste.
For statistical analysis, the ANOVA was conducted using the software MiniTab®, using a full quadratic regression model (Equation (6)). A significance test was performed for the model and each individual factor using a confidence interval of α = 0.95.
y i =   a 0 + b 1 x 1 + b 2 x 2 + b 3 x 3 + b 12 x 1 x 2 + b 13 x 1 x 3 + b 23 x 2 x 3 + c 1 x 1 2 + c 2 x 2 2 + c 3 x 3 2
where yi is the response of interest, a 0 is the constant coefficient, x i is the coded value for each parameter, b i is the linear effect coefficient, b ij is the interaction coefficient and c i is the quadratic coefficient. The validation of the regression models and the significant test of each factor were carried out by a Fischer F-test that considers the variance ratio distribution.

3. Results

3.1. Effect of HTC on Hydrochar Composition

Figure 1 shows the evolution of the chemical composition of FW hydrochar after HTC treatment under DoE conditions. As expected, the fixed carbon (FC) was enhanced as the temperature and reaction time increased. The highest values were found at (240/60/25) and (240/20/25) with 25.37 and 24.94%, respectively. This behavior could indicate the superior effect of temperature over reaction time. However, these values were relatively low compared to other studies found in the literature. For instance, Bhakta Sharma et al. [22] and Wang et al. [15] treated mixed post-consumer FW at 250 and 260 °C, and reported hydrochars with 48 and 45.5% FC, respectively. Nonetheless, values of around 20% are also reported in the literature. For example, McGaughy and Reza [24] also treated post-consumer FW and obtained a hydrochar with an FC of 22.42% FC. In the same manner, Lucian et al. [21] treated the organic fraction of municipal solid waste (OFMSW) at 250 °C for 6 h and reported an FC of 19.4%. Therefore, relatively low values of FC (<30%) are not uncommon while working with FW. One reason for these relatively low values could be the presence of lipids in the FW feedstock, which has been previously reported to influence the FC content in hydrochar [42]. Most importantly, these FC values remain low even after intense HTC conditions (high T, high RT, and low SL), in comparison with samples with only carbohydrates, or carbohydrates and protein. Hence, it is likely that the reported high FC% was produced from food waste feedstock with a significantly low lipid content. In addition, solid load (SL) played an important role in the generation of FC. At the highest temperature (260/40/20) FC only reached 22%. The highest solid load run (210/40/28) produced a relatively high FC of 24.89%. However, the general trend was for the FC to decrease as SL increased.
Figure 1d–f outlines the changes in the volatile matter (VM) due to HTC conditions. VM ranged from 72 to 83%. The highest values corresponded to (180/20/15) with 83.55%, followed by (160/40/20) with 82.37% due to a lower degree of carbonization caused by low HTC intensity. Conversely, the lowest values of VM were found at (240/60/25) followed by (210/40/28) with 72.54 and 72.92%, respectively. This minimal difference between the latter values indicates that SL has a significant effect on the reduction of VM. Similarly, other studies of HTC of FW at temperatures >250 °C and reaction times >1 h reported VM values of 60.2–75.5% [21,24,43]. In contrast, other studies have continually reported considerably lower VM (39%) for FW hydrochar produced under similar conditions [20,44]. According to the behavior observed for the FC, the higher VM values obtained in this study could be attributed to the high lipid fraction; therefore, the lipids could have restricted the loss of VM, even under the most severe HTC conditions. The results from this work, in addition to those reported in the literature, illustrate the high likelihood of obtaining hydrochars with a high VM when selecting FW as feedstock, especially if it contains considerable amounts of lipids.
Figure 1g–i illustrates the evolution of ash content after HTC treatments, which resulted in values between 0.81 and 4.31%. From the observed behavior, solid load (SL) seems to be the main factor influencing ash%. Hence, lower ash values were achieved at either high or low SL, while middle SL (80%) seemed to promote a higher ash%. It is important to outline the influence of the severity of the HC conditions on the ash fraction since it often increases because of the loss of organic matter. However, some ash content could even be lost from solid HC, given that the acidic nature of the subcritical water solubilizes some inorganic elements into the liquid phase [45]. Moreover, the low values of ash, in combination with an unclear trend, did not allow for an adequate statistical analysis or definition of a clear trend.
The ultimate composition (CHNO) of the hydrochars produced under the DoE HTC conditions is illustrated in Figure 2. The carbon content (C%) ranged from 52 to 72%. As the HTC temperature increased, so did the C% due to a higher degree of carbonization. Accordingly, the maximum and minimum values were obtained at (260/40/20) with 72% and at (160/40/20) with 52%, respectively. Both runs had the highest and lowest temperatures within the DoE set, indicating a large dependency on temperature. Similar results were reported by Saqib et al. [2] with 73%, Gupta et al. [46] with 72.1%, Álvarez-Murillo et al. [32] with 72.03%, and Chen et al. [11] with 72.11%.
In contrast, H% showed little variation in the experimental run set. Ranging from 6.64 to 8.68%, with no conclusive trend. The lowest values were found at (160/40/80). However, the maximum values did not reveal a general pattern. The highest values were achieved at (260/40/20) with 8.64%, (210/73/20) with 8.68%, and (210/06/20) with 8.60%. These runs were coincidently axial points within the DoE set, with extreme points of temperature and time.
Oxygen content varied from 38% on (160/40/20) down to 13.33% on (260/40/20). This carried a considerable reduction of O% at high temperatures from the original 40% in raw food waste. In comparison, the reduction in O% at the lowest temperature was minimal, even if the reaction time was relatively long (40 min). These findings support the clear influence of temperature on the decarboxylation and deoxygenation reactions occurring in HTC, thus affecting oxygen content. Compared to other reports, the removal of oxygen in this study was relatively high. Other mixed post-consumer food waste feedstock under similar conditions reported O% of 15 to 25% [2,20,22,25,46]. Nevertheless, similar values have been reported by Lucian et al. [21], at 14%, and Mazumder et al. [47], at 12.8%.
Nitrogen content is an important responsibility for assessing fuels, as it relates to the generation of nitrogen compound emissions, such as NOx, when combusted. However, in this work, the N% in the hydrochar showed little variation throughout the experimental conditions. The nitrogen content ranged from 4.05% (180, 60, 85) to 3.24% (160, 40, 80). Increasing the HTC temperature results in higher solubilization of N into the liquid fraction, although some N species are further reincorporated into the HC, while a minimum remains strongly attached to the biomass of origin [48]. It is difficult to establish a trend given the low N content and minimal differences between the HC samples.
Temperature, reaction time, and solid load were evaluated by their linear, quadratic, and interaction effects and were considered to have a significant effect if Fcalc > Ftab (p < 0.05). The p-values of each factor for the composition responses are summarized in Table 3. The temperature was the most important factor affecting the composition of hydrochar, with a significant (p < 0.050) linear effect for FC, VM, C, H, and O%; it also displayed a significant quadratic effect for C and O%. In contrast, the reaction time was not statistically significant for any of these parameters. Although it showed an important linear effect for FC (p = 0.053) and VM (p = 0.060), it was not so for the elemental responses. Regarding moisture content, it carried significance for linear effect on C% (p = 0.015) and quadratic effect on FC, Ash, and H% with p = 0.028, 0.014, and 0.021, respectively.

3.2. Effect of HTC on Hydrochar Quality

Figure 3a–c shows the evolution of the solid yield (SY) resulting from the DoE HTC conditions. A maximum SY of 88% was obtained at (160/40/20) due to the low intensity of the run since temperatures as low as 160 °C did not start the solubilization of solids into the liquid phase. Moreover, the sample underwent undesirable changes since the formation of a brown and hard solid was observed, suggesting that caramelization reactions took place. At these process conditions, handling the sample became more difficult, impeding proper filtration, thus making dewatering and drying more difficult, and negating the benefits of HTC. The maximum hydrochar yield at the lowest temperatures is a trend reported in a previous multi-factor study [33]. However, other studies have reported lower SY at even lower temperatures (Table 4). For instance, Mahmood et al. [9] reported 65.73% SY working with post-consumer FW at 150 °C for 20 min, while Gupta et al. [46] reported 52% SY at 160 for 5 h. This could indicate that the sample in the current work could have some biochemical particularity that could have promoted the caramelization reaction, such as a higher proportion of free sugars. However, an SY of 88% is an extreme point, even within the DoE. Aside from this point, SY varied from 66% at (180/20/25), down to 47% at (210/40/12), suggesting that SL has a major role in SY.
As the temperature increased, the SY decreased abruptly from 88% to a range between 50–60% in most of the DoE. This is easily observed in Figure 3a, where the area between 50 and 60% SY takes most of the contour plots. At maximum temperature, a solid yield of 50.7% was found at (260/40/20). The lowest solid yields were 47.3% at (210/40/12), followed by 47.9% at (180/20/15). These results could be attributed to the low SL in runs, with 12 and 15%, respectively. This indicates that low SL facilitated the solubilization of solids into the liquid phase (Figure 3b). However, similar values between runs with considerably different process conditions supported the pertinence of considering the combination of the three parameters as necessary. For instance, the 180 °C temperature in (180/20/15) promoted higher solubilization of solids in comparison to 160 °C. The relatively short reaction time of 20 min appeared to allow effective solubilization without promoting the re-polymerization of hydrochar in comparison to (180/60/15), where SY showed a modest increase to 53% despite significantly increasing RT from 20 to 60 min while maintaining temperature and SL (Figure 3a). This trend of RT was inverse at high SL runs, with a fall of SY from (180/20/25) with 66% to 63% at (180/60/25). One possible explanation could be that because of the higher solid load, maximum solubilization was not achieved at a short reaction time and progressed with time. However, this behavior appears to reverse at higher temperatures due to the increase in reaction rates for solubilization and polymerization.
In general, HHV increased with the rising HTC temperature (Figure 3d). The maximum HHV was found at (260/40/20) with 33.48 MJ/kg, whereas the minimum HHV was 20.93 MJ/kg at (160/40/20) This is the highest reported HHV for hydrochar of food waste (Table 4), probably attributed to the high lipid content of the original food waste. Maximum HHV followed the maximum temperature and maximum oxygen removal in the hydrochar. In contrast, the minimum HTC temperature resulted in the lowest HHV and, unexpectedly, even achieved an HHV lower than the original food waste (21.29 MJ/kg). The second-lowest HHV value was at (180/20/25) with 24.71 MJ/kg, lower than a similar run at lower SL (180/20/15) which had an HHV of 27.11 MJ/kg. This could be due to the effect of a higher SL preventing a greater degree of carbonization at low temperatures. The highest energy densification (ED) values were obtained at (260/40/80) with 1.62, followed by (240/60/85) and (240/20/85) both yielding 1.52. On the lowest value side, (160/40/80) produced an ED of 1. Saqib et al. [2] previously reported higher ED values, with 1.83 for similar conditions. Nevertheless, the HHV was lower than that in the present work. Therefore, the high HHV of the raw feedstock is responsible for the lower ED values in the current work. In addition, temperature had a major influence on RT or MC. A clear linear effect of temperature on ED is shown in Figure 3g,h.
The highest EY was 88% at (160/40/20) due to the significantly higher SY in comparison to the rest of the DoE runs. However, as explained before, hydrochar at (160/40/20) showed poor fuel and handling characteristics. Therefore, it must not be considered optimum for this feedstock. Aside from that point, the energy yield ranged from 62.7% on (180/20/15) to 84.8% on (240/60/25). High temperatures enhanced SY due to the increase in HHV (Figure 3j), whereas the reaction time showed a better performance between 30 and 50 min (Figure 3j). Higher SL promoted greater EY at low temperatures. However, as the temperature increased, SL showed better results, around 20 to 24%. In comparison, the EY in this study was higher than in the majority of previous studies on hydrochar from different FW feedstock and HTC conditions, resulting in EY ranging between 20 and 65%, working with different food waste feedstock and process conditions [22,23,43,47,50]. A similar maximum EY was found by Feng et al. [13], with 84% for FW at process conditions close to those of this work, indicating that the limits of the HTC process conditions used in the present study cover an adequate area to obtain high EY and result in a balance between solid yield and HHV.
Equilibrium moisture content (EMC) was used to assess the hygroscopic properties of the hydrochar and how it is affected by the process conditions. This parameter is relevant because a low hygroscopicity hydrochar would re-adsorb and absorb less moisture after drying. A low EMC is desirable to reduce storage and transportation costs, as well as lower drying pre-treatment expenses associated with gasification or combustion use. EMC values ranged from 2.44 to 8.47%, with the lowest at (240/20/15) and the highest at (160/40/20). The pattern shows that the highest HTC temperatures promote the lowest EMC values, while it seems to increase when the reaction time goes above 50 min. The EMC appears to decrease at higher moisture content. Low EMC values are associated with the hydrophobicity of the hydrochar. HTC promotes hydrophobicity due to the removal of carboxyl and hydroxyl in phenol groups [51]. These reactions are enhanced by increasing the temperature. However, hydrophobicity seems to decrease at longer reaction times. This could suggest that re-polymerization reactions could counter hydrophobicity properties, re-forming -OH groups.
SL exhibited high relevance to hydrochar quality, with a significant linear effect on all the evaluated responses (Table 5). This proved that the SL during the HTC of FW should not be neglected, since it highly influenced the variables of response. Therefore, adjusting the solid load should be considered a process factor when optimizing the HTC process for FW. Similarly, temperature proved to be a fundamental factor in the HTC of FW. Temperature exhibited a significant linear and quadratic effect on energy responses, although it had no significant effect on EY. In contrast, the reaction time showed no statistical significance in any of the effects. This indicates that reaction time has no major impact on the timespan selected for this work, which could be considered short compared to other HTC works. However, reaction time could have great importance in the energy analysis of the whole process, as long reaction times increase energy consumption during the HTC. Hence, it is suggested that the reaction time should be kept at a minimum.

Van Krevelen

Van Krevelen plots are used to describe the progression of the carbonization process and as indicators of dehydration and decarboxylation reactions. Intense process conditions promote HTC reactions, as outlined in Figure 4, where the values for the HCs in response to the DoE HTC conditions are compared. It is expected that higher temperatures and extended reaction times will result in lower H:C and O:C ratios. Hence, all high–temperature runs yielded a high reduction of O:C, while the behavior of H:C showed no evident trend in response to the DoE parameters. The points that reached the highest carbonization degree, based on the Van Krevelen plot, were (240/60/15) with 1.26 H:C and 0.19 O:C, followed by (240/20/25) with 1.24 H:C and 0.24 O:C. On the other hand, the highest temperature run (260/40/20) showed the lowest O:C value of 0.14, due to the high effect of temperature on oxygen removal, whereas H:C remained at 1.44. This same pattern was observed for the rest of the runs at high temperatures (240/20/15) and (240/60/25), where O:C values were low, but H:C was not reduced to the same degree. The O:C values were common for the reports of hydrochars from different types of feedstocks after the HTC process, although the most intense runs displayed a rather low O:C value. However, H:C is high in comparison to those found in other feedstocks (i.e., lignocellulosic biomass) but is rather common for food waste. Furthermore, from the combination of parameters used for this DoE and the Van Krevelen diagram, it can be outlined that not only were higher temperatures and long times necessary for a major carbonization degree, but that moisture content could also have played an important role.

3.3. Multi-Response Optimization by Desirability

Based on the results of all responses, multi-response optimization was conducted using the embedded tool in the software package MiniTab 19, utilizing the correlation models generated with the DoE (Table 6). The criteria for optimization were to minimize EMC and maximize SY, HHV, ED, and EY. The optimized process conditions were 260.4 °C, 29.5 min reaction time, and 19.6% solid load. The predicted optimized responses were EMC = 2.7%, SY = 57.1%, EY = 84.7%, ED = 1.5, and HHV of 31.8 MJ/Kg, with a composite desirability of 0.68.
Although most responses were enhanced by intense HTC conditions, the multi-response optimization showed that only temperature was optimized at the upper limit of the DoE, while reaction time and solid load were optimized at mid values. Even if the maximum values of the responses were compromised, the multi-response optimization showed adequate values for all responses, exhibiting the power of the desirability function tool to overcome the trade-offs between the responses of HTC products. Most previous optimization studies found an optimal temperature at <200 °C, benefiting solid load while compromising the solid fuel quality of hydrochar (Table 7). The optimized reaction time was 30 min; in contrast, many previous optimization studies with HTC have used reaction times >120 min. Nonetheless, reaction time would considerably decrease the energy efficiency of the HTC process. Therefore, an optimization with responses, such as the energy efficiency of the process or other viability-related responses, would provide crucial information for valorizing food waste through food waste and commercializing HTC technology.

4. Conclusions

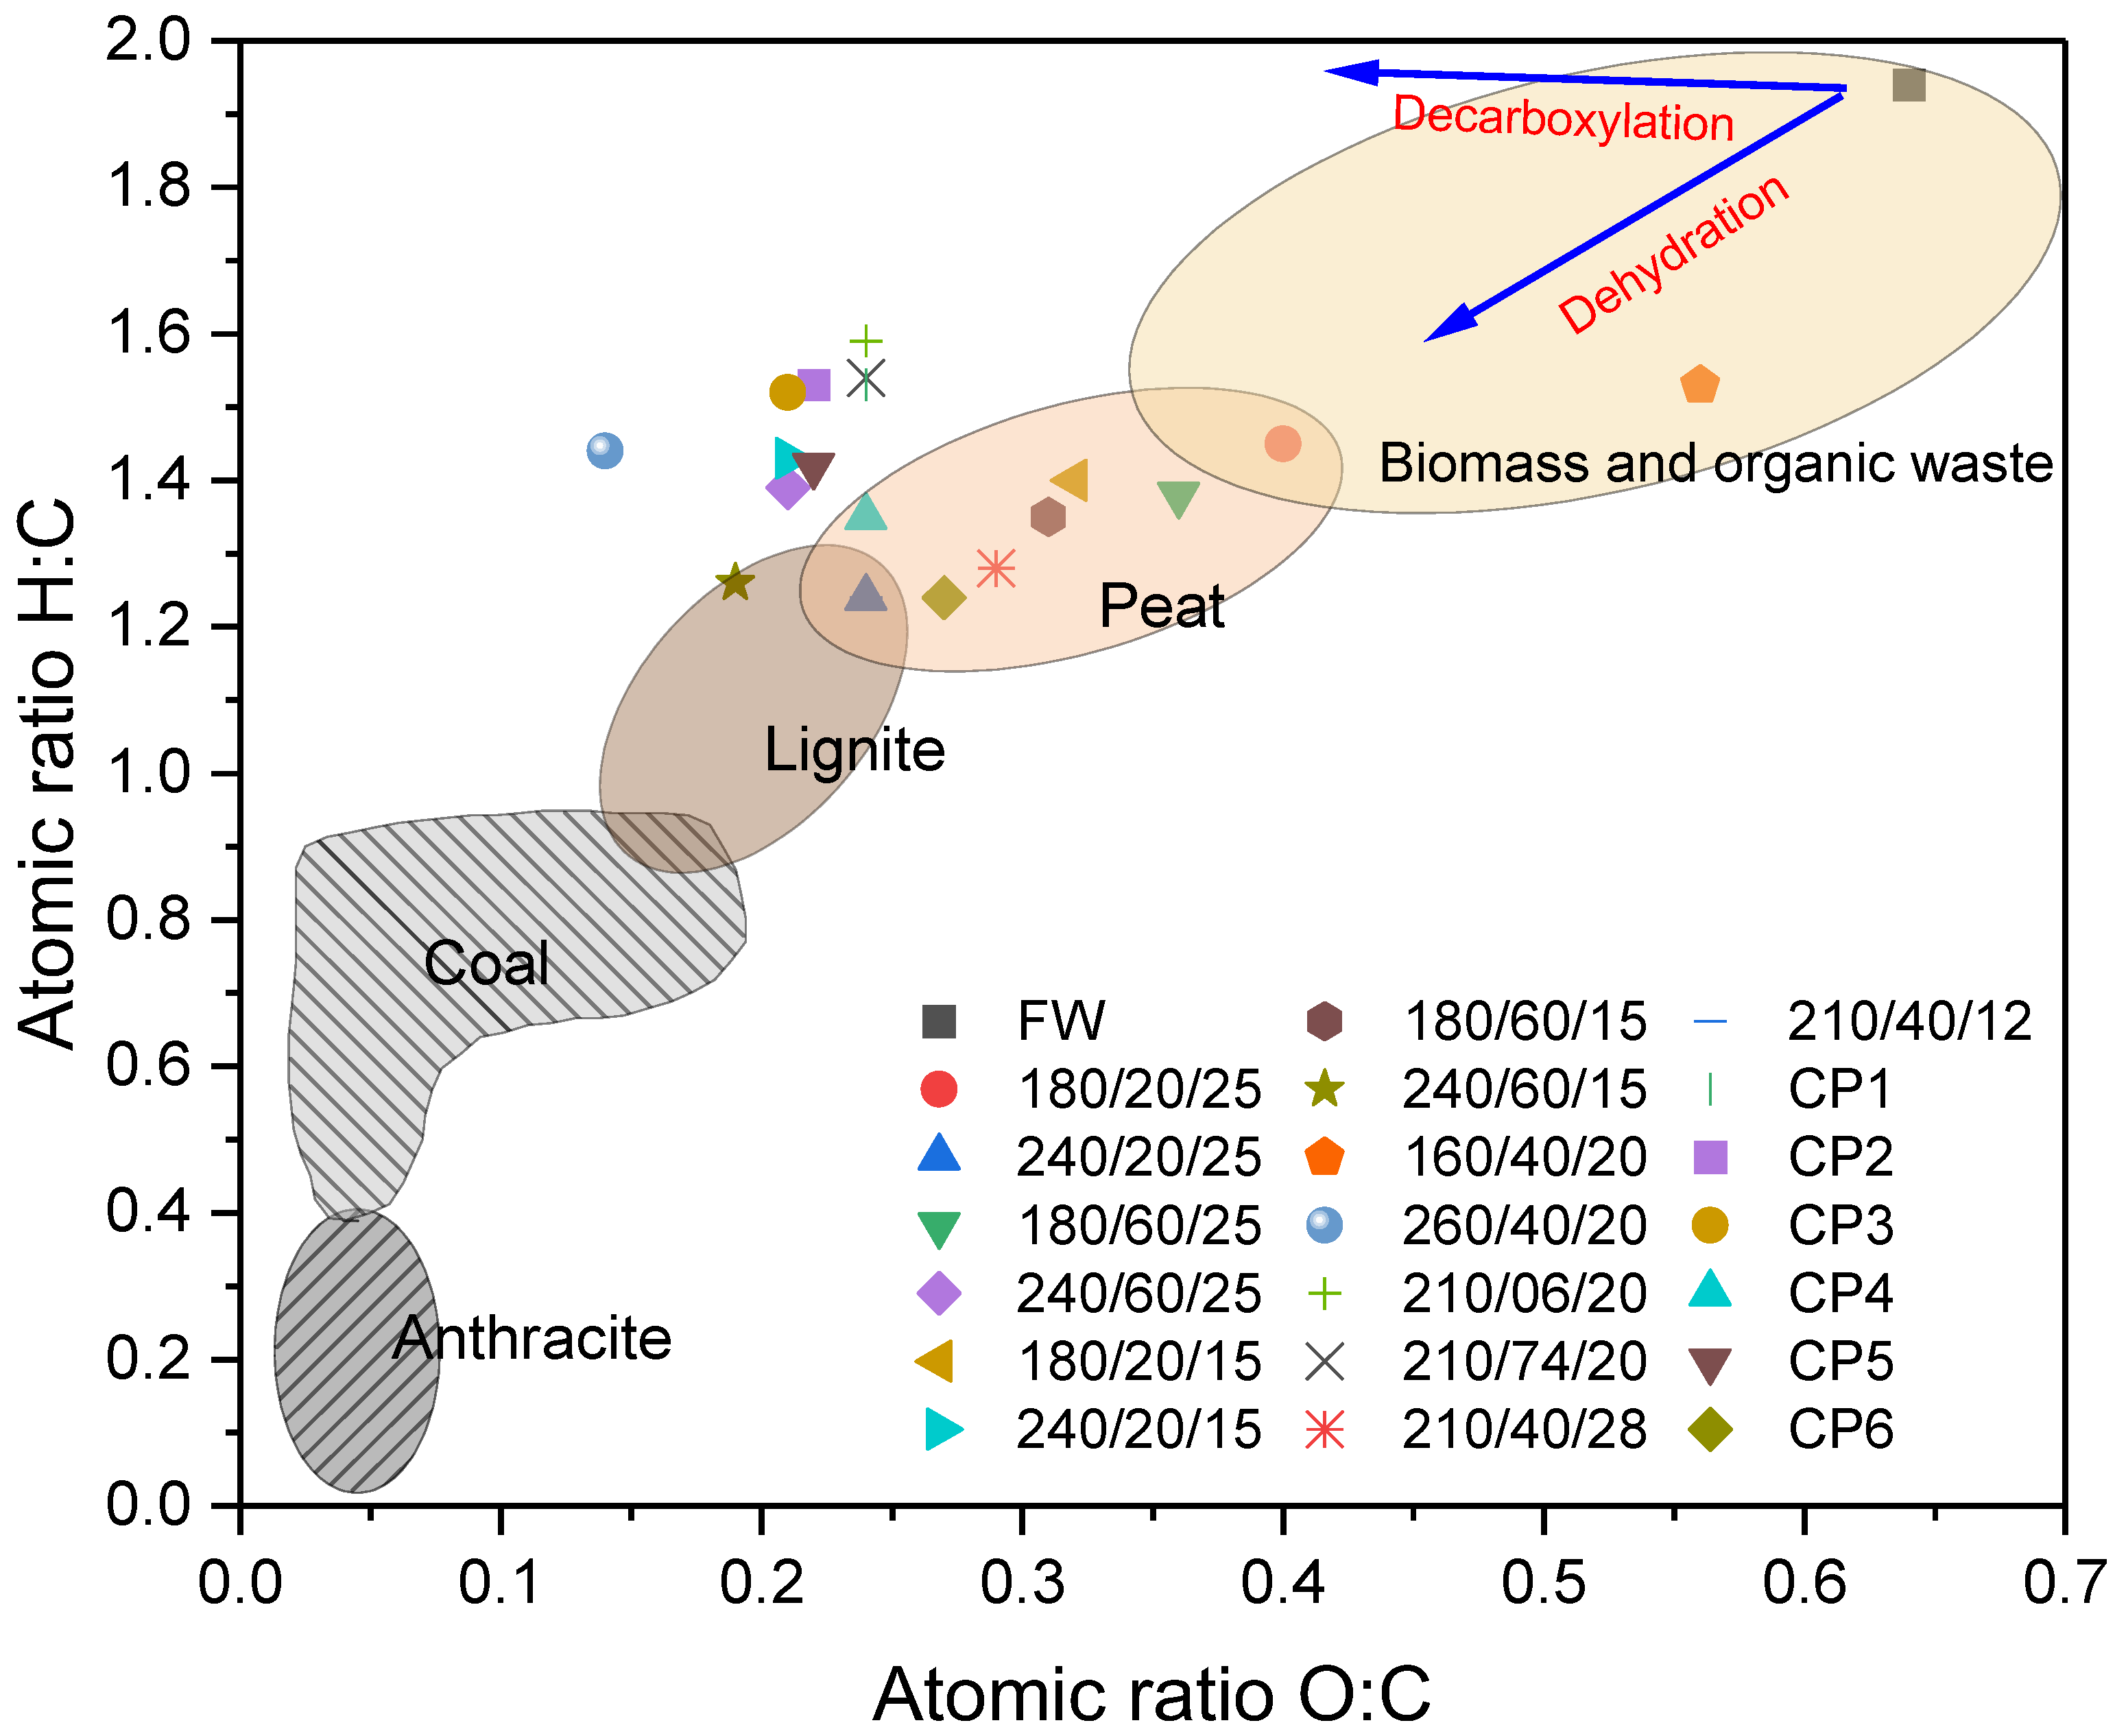
The application of a DoE provided insight into how the HTC process conditions influence the composition and energetic properties of the hydrochar from food waste. This information is valuable for the further development of HTC technology as a treatment and valorization of food waste streams. Hydrothermal carbonization has successfully improved the solid fuel characteristics of food waste. Temperature and a solid load were significant factors affecting the composition of the hydrochar within the condition range used in this work. This suggests that the reaction mechanisms, such as hydrolysis, polymerization, condensation, decarboxylation, and dehydration, were mainly governed by temperature, whereas within the reaction time range of 6–74 min, time played no important role. Decarboxylation reactions were dominant against dehydration. This was visible in the Van Krevelen plot, where the O:C ratio was successfully reduced to coal levels, while H:C remained higher. This behavior was linked to the high volatile matter content and possibly related to the considerable lipid content. It was also evident that solid load played a crucial role, likely facilitating the reaction. This is worth noting, as most modeling and mechanisms studies on HTC are conducted, or assumed to occur, in low solid load (<10%), while practical studies for treating wet wastes have considered minimizing the addition of water to increase environmental viability. This discrepancy requires further addressing, and solid load must be considered a crucial factor when optimizing HTC processes. Reaction time was insignificant for all analyzed responses. However, it could be a major factor when assessing the energy efficiency of the process and should be taken into consideration. Even though the responses evaluated in this work provided insight into the HTC process, it could be useful to encompass a wider set of variables to challenge the perspective of the process and to take advantage of the optimization versatility.

Author Contributions

Conceptualization, J.E.B.-G., V.D., and A.B.R.; methodology, J.E.B.-G., V.D., and A.B.R.; software, J.E.B.-G.; validation, V.D. and A.B.R.; formal analysis, J.E.B.-G.; investigation, J.E.B.-G.; resources, J.E.B.-G., V.D., and A.B.R.; data curation, J.E.B.-G.; writing—original draft preparation, J.E.B.-G.; writing—review and editing, V.D. and A.B.R.; visualization, J.E.B.-G.; supervision, V.D. and A.B.R.; project administration, V.D. and A.B.R.; funding acquisition, A.B.R. All authors have read and agreed to the published version of the manuscript.

Funding

This research was funded by the Mexican Council for Science and Technology and the Secretary of Energy CONACYT-SENER, Autonomous University of Sinaloa, the Biotechnology and Biological Sciences Research Council (BBSRC) through BEFWAM- Bioenergy, fertilisers, and clean water from Invasive Aquatic macrophytes (BB/S011439/1) and a DST UKIERI funded Thematic partnership between the University of Leeds and Indian Institute of Technology, Bombay on Conversion of wet wastes by Hydrothermal carbonisation (IND/CONT/GA/18-19/18).

Institutional Review Board Statement

Not applicable.

Informed Consent Statement

Not applicable.

Data Availability Statement

The associated data for this paper can be found at https://doi.org/10.5518/1187.

Acknowledgments

The authors would like to acknowledge James Hammerton, Karine Alves, and Adrian Cunliffe for their help on the instrumentation analysis.

Conflicts of Interest

The authors declare no conflict of interest.

References

  1. Kaushik, R.; Parshetti, G.K.; Liu, Z.; Balasubramanian, R. Enzyme-assisted hydrothermal treatment of food waste for co-production of hydrochar and bio-oil. Bioresour. Technol. 2014, 168, 267–274. [Google Scholar] [CrossRef] [PubMed]
  2. Saqib, N.U.; Baroutian, S.; Sarmah, A.K. Physicochemical, structural and combustion characterization of food waste hydrochar obtained by hydrothermal carbonization. Bioresour. Technol. 2018, 266, 357–363. [Google Scholar] [CrossRef] [PubMed]
  3. Jiang, X.; Mira, D.; Cluff, D.L. The combustion mitigation of methane as a non-CO2 greenhouse gas. Prog. Energy Combust. Sci. 2018, 66, 176–199. [Google Scholar] [CrossRef] [Green Version]
  4. Funke, A.; Ziegler, F. Hydrothermal carbonization of biomass: A summary and discussion of chemical mechanisms for process engineering. Biofuels Bioprod. Biorefining 2010, 4, 160–177. [Google Scholar] [CrossRef]
  5. Merzari, F.; Langone, M.; Andreottola, G.; Fiori, L. Methane production from process water of sewage sludge hydrothermal carbonization. A review. Valorising sludge through hydrothermal carbonization. Crit. Rev. Environ. Sci. Technol. 2019, 49, 947–988. [Google Scholar] [CrossRef]
  6. Lachos-Perez, D.; Torres-Mayanga, P.C.; Abaide, E.R.; Zabot, G.L.; De Castilhos, F. Hydrothermal carbonization and Liquefaction: Differences, progress, challenges, and opportunities. Bioresour. Technol. 2022, 343, 126084. [Google Scholar] [CrossRef]
  7. Funke, A.; Ziegler, F. Heat of reaction measurements for hydrothermal carbonization of biomass. Bioresour. Technol. 2011, 102, 7595–7598. [Google Scholar] [CrossRef] [PubMed]
  8. Heidari, M.; Dutta, A.; Acharya, B.; Mahmud, S. A review of the current knowledge and challenges of hydrothermal carbonization for biomass conversion. J. Energy Inst. 2019, 92, 1779–1799. [Google Scholar] [CrossRef]
  9. Mahmood, R.; Parshetti, G.K.; Balasubramanian, R. Energy, exergy and techno-economic analyses of hydrothermal oxidation of food waste to produce hydro-char and bio-oil. Energy 2016, 102, 187–198. [Google Scholar] [CrossRef]
  10. Pham, T.P.T.; Kaushik, R.; Parshetti, G.K.; Mahmood, R.; Balasubramanian, R. Food waste-to-energy conversion technologies: Current status and future directions. Waste Manag. 2015, 38, 399–408. [Google Scholar] [CrossRef]
  11. Chen, X.; Lin, Q.; He, R.; Zhao, X.; Li, G. Hydrochar production from watermelon peel by hydrothermal carbonization. Bioresour. Technol. 2017, 241, 236–243. [Google Scholar] [CrossRef] [PubMed]
  12. Idowu, I.; Li, L.; Flora, J.R.; Pellechia, P.J.; Darko, S.A.; Ro, K.S.; Berge, N.D. Hydrothermal carbonization of food waste for nutrient recovery and reuse. Waste Manag. 2017, 69, 480–491. [Google Scholar] [CrossRef] [PubMed] [Green Version]
  13. Feng, Y.; Sun, H.; Han, L.; Xue, L.; Chen, Y.; Yang, L.; Xing, B. Fabrication of hydrochar based on food waste (FWHTC) and its application in aqueous solution rare earth ions adsorptive removal: Process, mechanisms and disposal methodology. J. Clean. Prod. 2019, 212, 1423–1433. [Google Scholar] [CrossRef]
  14. Oliver-Tomas, B.; Hitzl, M.; Owsianiak, M.; Renz, M. Evaluation of hydrothermal carbonization in urban mining for the recovery of phosphorus from the organic fraction of municipal solid waste. Resour. Conserv. Recycl. 2019, 147, 111–118. [Google Scholar] [CrossRef]
  15. Wang, T.; Zhai, Y.; Zhu, Y.; Peng, C.; Xu, B.; Wang, T.; Li, C.; Zeng, G. Influence of temperature on nitrogen fate during hydrothermal carbonization of food waste. Bioresour. Technol. 2018, 247, 182–189. [Google Scholar] [CrossRef]
  16. Wang, T.; Zhai, Y.; Zhu, Y.; Gan, X.; Zheng, L.; Peng, C.; Wang, B.; Li, C.; Zeng, G. Evaluation of the clean characteristics and combustion behavior of hydrochar derived from food waste towards solid biofuel production. Bioresour. Technol. 2018, 266, 275–283. [Google Scholar] [CrossRef]
  17. Gupta, D.; Mahajani, S.M.; Garg, A. Effect of hydrothermal carbonization as pretreatment on energy recovery from food and paper wastes. Bioresour. Technol. 2019, 285, 121329. [Google Scholar] [CrossRef]
  18. Jia, X.; Li, M.; Zhu, J.; Jiang, Y.; Wang, Y.; Wang, Y. Enhancement split-phase hydrogen production from food waste during dark fermentation: Protein substances degradation and transformation during hydrothermal pre-treatments. Int. J. Hydrogen Energy 2019, 44, 17334–17345. [Google Scholar] [CrossRef]
  19. Ismail, T.M.; Yoshikawa, K.; Sherif, H.; El-Salam, M.A. Hydrothermal treatment of municipal solid waste into coal in a commercial Plant: Numerical assessment of process parameters. Appl. Energy 2019, 250, 653–664. [Google Scholar] [CrossRef]
  20. Akarsu, K.; Duman, G.; Yilmazer, A.; Keskin, T.; Azbar, N.; Yanik, J. Sustainable valorization of food wastes into solid fuel by hydrothermal carbonization. Bioresour. Technol. 2019, 292, 121959. [Google Scholar] [CrossRef]
  21. Lucian, M.; Volpe, M.; Merzari, F.; Wüst, D.; Kruse, A.; Andreottola, G.; Fiori, L. Hydrothermal carbonization coupled with anaerobic digestion for the valorization of the organic fraction of municipal solid waste. Bioresour. Technol. 2020, 314, 123734. [Google Scholar] [CrossRef] [PubMed]
  22. Sharma, H.B.; Panigrahi, S.; Dubey, B.K. Food waste hydrothermal carbonization: Study on the effects of reaction severities, pelletization and framework development using approaches of the circular economy. Bioresour. Technol. 2021, 333, 125187. [Google Scholar] [CrossRef] [PubMed]
  23. Wilk, M.; Śliz, M.; Gajek, M. The effects of hydrothermal carbonization operating parameters on high-value hydrochar derived from beet pulp. Renew. Energy 2021, 177, 216–228. [Google Scholar] [CrossRef]
  24. McGaughy, K.; Reza, M.T. Hydrothermal carbonization of food waste: Simplified process simulation model based on experimental results. Biomass Convers. Biorefinery 2018, 8, 283–292. [Google Scholar] [CrossRef]
  25. Tradler, S.B.; Mayr, S.; Himmelsbach, M.; Priewasser, R.; Baumgartner, W.; Stadler, A.T. Hydrothermal carbonization as an all-inclusive process for food-waste conversion. Bioresour. Technol. Rep. 2018, 2, 77–83. [Google Scholar] [CrossRef]
  26. Maqhuzu, A.B.; Yoshikawa, K.; Takahashi, F. Stochastic economic analysis of coal-alternative fuel production from municipal solid wastes employing hydrothermal carbonization in Zimbabwe. Sci. Total Environ. 2020, 716, 135337. [Google Scholar] [CrossRef]
  27. Hantoro, R.; Septyaningrum, E.; Siswanto, B.B.; Izdiharrudin, M.F. Hydrochar Production through the HTC Process: Case Study of Municipal Solid Waste Samples in East Java, Indonesia. Solid Fuel Chem. 2020, 54, 418–426. [Google Scholar] [CrossRef]
  28. Román, S.; Libra, J.; Berge, N.; Sabio, E.; Ro, K.; Li, L.; Ledesma, B.; Álvarez, A.; Bae, S. Hydrothermal carbonization: Modeling, final properties design and applications: A review. Energies 2018, 11, 216. [Google Scholar] [CrossRef] [Green Version]
  29. Tag, A.T.; Duman, G.; Yanik, J. Influences of feedstock type and process variables on hydrochar properties. Bioresour. Technol. 2018, 250, 337–344. [Google Scholar] [CrossRef]
  30. Heilmann, S.M.; Davis, H.T.; Jader, L.R.; Lefebvre, P.A.; Sadowsky, M.; Schendel, F.J.; Von Keitz, M.G.; Valentas, K.J. Hydrothermal carbonization of microalgae. Biomass Bioenergy 2010, 34, 875–882. [Google Scholar] [CrossRef]
  31. Mumme, J.; Eckervogt, L.; Pielert, J.; Diakité, M.; Rupp, F.; Kern, J. Hydrothermal carbonization of anaerobically digested maize silage. Bioresour. Technol. 2011, 102, 9255–9260. [Google Scholar] [CrossRef] [PubMed]
  32. Álvarez-Murillo, A.; Román, S.; Ledesma, B.; Sabio, E. Study of variables in energy densification of olive stone by hydrothermal carbonization. J. Anal. Appl. Pyrolysis 2015, 113, 307–314. [Google Scholar] [CrossRef]
  33. Danso-Boateng, E.; Shama, G.; Wheatley, A.; Martin, S.; Holdich, R.G. Hydrothermal carbonisation of sewage sludge: Effect of process conditions on product characteristics and methane production. Bioresour. Technol. 2015, 177, 318–327. [Google Scholar] [CrossRef] [PubMed] [Green Version]
  34. Kannan, S.; Gariepy, Y.; Raghavan, G.S.V. Optimization of the conventional hydrothermal carbonization to produce hydrochar from fish waste. Biomass Convers. Biorefinery 2018, 8, 563–576. [Google Scholar] [CrossRef]
  35. Stutzenstein, P.; Bacher, M.; Rosenau, T.; Pfeifer, C. Optimization of Nutrient and Carbon Recovery from Anaerobic Digestate via Hydrothermal Carbonization and Investigation of the Influence of the Process Parameters. Waste Biomass Valorization 2018, 9, 1303–1318. [Google Scholar] [CrossRef] [Green Version]
  36. El Ouadrhiri, F.; Elyemni, M.; Lahkimi, A.; Lhassani, A.; Chaouch, M.; Taleb, M. Mesoporous Carbon from Optimized Date Stone Hydrochar by Catalytic Hydrothermal Carbonization Using Response Surface Methodology: Application to Dyes Adsorption. Int. J. Chem. Eng. 2021, 2021, 5555406. [Google Scholar] [CrossRef]
  37. Van Soest, P.J. Collaborative Study of Acid-Detergent Fiber and Lignin. J. Assoc. Off Anal. Chem. 2020, 56, 781–784. [Google Scholar] [CrossRef]
  38. Van Soest, P.J.; Robertson, J.B.; Lewis, B.A. Methods for Dietary Fiber, Neutral Detergent Fiber, and Nonstarch Polysaccharides in Relation to Animal Nutrition. J. Dairy Sci. 1991, 74, 3583–3597. [Google Scholar] [CrossRef]
  39. Anderson, S. Soxtec: Its Principles and Applications. Oil Extr. Anal. 2019, 11–24. [Google Scholar] [CrossRef]
  40. Channiwala, S.A.; Parikh, P.P. A unified correlation for estimating HHV of solid, liquid and gaseous fuels. Fuel 2002, 81, 1051–1063. [Google Scholar] [CrossRef]
  41. Chen, W.-H.; Lin, B.-J.; Colin, B.; Chang, J.-S.; Pétrissans, A.; Bi, X.; Pétrissans, M. Hygroscopic transformation of woody biomass torrefaction for carbon storage. Appl. Energy 2018, 231, 768–776. [Google Scholar] [CrossRef]
  42. Li, Y.; Liu, H.; Xiao, K.; Jin, M.; Xiao, H.; Yao, H. Combustion and Pyrolysis Characteristics of Hydrochar Prepared by Hydrothermal Carbonization of Typical Food Waste: Influence of Carbohydrates, Proteins, and Lipids. Energy Fuels 2020, 34, 430–439. [Google Scholar] [CrossRef]
  43. Sharma, H.B.; Dubey, B.K. Co-hydrothermal carbonization of food waste with yard waste for solid biofuel production: Hydrochar characterization and its pelletization. Waste Manag. 2020, 118, 521–533. [Google Scholar] [CrossRef]
  44. Lin, Y.; Ge, Y.; Xiao, H.; He, Q.; Wang, W.; Chen, B. Investigation of hydrothermal co-carbonization of waste textile with waste wood, waste paper and waste food from typical municipal solid wastes. Energy 2020, 210, 118606. [Google Scholar] [CrossRef]
  45. Kambo, H.S.; Dutta, A. Comparative evaluation of torrefaction and hydrothermal carbonization of lignocellulosic biomass for the production of solid biofuel. Energy Convers. Manag. 2015, 105, 746–755. [Google Scholar] [CrossRef]
  46. Gupta, D.; Mahajani, S.M.; Garg, A. Investigation on hydrochar and macromolecules recovery opportunities from food waste after hydrothermal carbonization. Sci. Total Environ. 2020, 749, 142294. [Google Scholar] [CrossRef]
  47. Mazumder, S.; Saha, P.; McGaughy, K.; Saba, A.; Reza, M.T. Technoeconomic analysis of co-hydrothermal carbonization of coal waste and food waste. Biomass Convers. Biorefinery 2020, 12, 39–49. [Google Scholar] [CrossRef]
  48. Aragón-Briceño, C.; Pozarlik, A.; Bramer, E.; Niedzwiecki, L.; Pawlak-Kruczek, H.; Brem, G. Hydrothermal carbonization of wet biomass from nitrogen and phosphorus approach: A review. Renew. Energy 2021, 171, 401–415. [Google Scholar] [CrossRef]
  49. Ischia, G.; Fiori, L.; Gao, L.; Goldfarb, J.L. Valorizing municipal solid waste via integrating hydrothermal carbonization and downstream extraction for biofuel production. J. Clean Prod. 2021, 289, 125781. [Google Scholar] [CrossRef]
  50. Picone, A.; Volpe, M.; Giustra, M.G.; Di Bella, G.; Messineo, A. Hydrothermal carbonization of lemon peel waste: Preliminary results on the effects of temperature during process water recirculation. Appl. Syst. Innov. 2021, 4, 19. [Google Scholar] [CrossRef]
  51. Schafer, H.N.S. Factors affecting the equilibrium moisture contents of low-rank coals. Fuel 1972, 51, 4–9. [Google Scholar] [CrossRef]
  52. Mäkelä, M.; Benavente, V.; Fullana, A. Hydrothermal carbonization of lignocellulosic biomass: Effect of process conditions on hydrochar properties. Appl. Energy 2015, 155, 576–584. [Google Scholar] [CrossRef]
  53. Nizamuddin, S.; Mubarak, N.; Tripathi, M.; Jayakumar, N.; Sahu, J.N.; Ganesan, P. Chemical, dielectric and structural characterization of optimized hydrochar produced from hydrothermal carbonization of palm shell. Fuel 2016, 163, 88–97. [Google Scholar] [CrossRef]
  54. Ronix, A.; Pezoti, O.; de Souza, L.S.; Souza, I.P.A.F.; Bedin, K.C.; Souza, P.S.C.; Silva, T.L.; Melo, S.A.R.; Cazetta, A.L.; Almeida, V.C. Hydrothermal carbonization of coffee husk: Optimization of experimental parameters and adsorption of methylene blue dye. J. Environ. Chem. Eng. 2017, 5, 4841–4849. [Google Scholar] [CrossRef]
  55. Sweygers, N.; Somers, M.H.; Appels, L. Optimization of hydrothermal conversion of bamboo (Phyllostachys aureosulcata) to levulinic acid via response surface methodology. J. Environ. Manag. 2018, 219, 95–102. [Google Scholar] [CrossRef]
  56. Lühmann, T.; Wirth, B. Sewage sludge valorization via hydrothermal carbonization: Optimizing dewaterability and phosphorus release. Energies 2020, 13, 4417. [Google Scholar] [CrossRef]
  57. Sultana, A.; Novera, T.M.; Islam, A.; Limon, S.H.; Islam, M.A. Multi-response optimization for the production of Albizia saman bark hydrochar through hydrothermal carbonization: Characterization and pyrolysis kinetic study. Biomass Convers. Biorefinery 2021, 1–15. [Google Scholar] [CrossRef]
Figure 1. Contour plots of hydrochar proximate analysis. (a) T, RT vs. FC (%), (b) T, SL vs. FC (%), (c) RT, SL vs. FC (%); (d) T, RT vs. VM (%), (e) T, SL vs. VM (%), (f) RT, SL vs. VM (%); (g) T, RT vs. Ash (%), (h) T, SL vs. Ash (%), (i) RT, SL vs. Ash (%).
Energies 15 05342 g001
Figure 2. Contour plots of the hydrochar ultimate analysis. (a) T, RT vs. C (%), (b) T, SL vs. C (%), (c) RT, SL vs. C (%); (d) T, RT vs. H (%), (e) T, SL vs. H (%), (f) RT, SL vs. H (%); (g) T, RT vs. O (%), (h) T, SL vs. O (%), (i) RT, SL vs. O (%); (j) T, RT vs. N (%), (k) T, SL vs. N (%), (l) RT, SL vs. N (%).
Energies 15 05342 g002
Figure 3. Contour plots of hydrochar quality responses. (a) T, RT vs. SY (%), (b) T, SL vs. SY (%), (c) RT, SL vs. SY (%); (d) T, RT vs. HHV (MJ/kg), (e) T, SL vs. HHV (MJ/kg), (f) RT, SL vs. HHV (MJ/kg); (g) T, RT vs. ED, (h) T, SL vs. ED, (i) RT, SL vs. ED; (j) T, RT vs. EY (%), (k) T, SL vs. EY (%), (l) RT, SL vs. EY (%); (m) T, RT vs. EMC (%), (n) T, SL vs. EMC (%), (o) RT, SL vs. EMC (%).
Energies 15 05342 g003
Figure 4. Van Krevelen diagram of the complete DoE run set and FW. CP = Central points.
Energies 15 05342 g004
Table 1. Characterization of food waste.
AnalysisWeight%
Neutral detergent fiber (NDF)15.2
Amylase NDF4.9
Acid detergent fiber (ADF)6.8
Total oil (Soxtec)19.7
Acid detergent lignin (ADL)3.1
Total protein a15.9
Volatile matter92.9
Fixed carbon4.9
Ash2.3
C47.5
H7.7
N2.3
S0.1
O40.1
a Determined from total Nitrogen.
Table 2. Full set of runs in the DoE, coded, and uncoded (1: higher level value, −1: Lower level value, 0: center point value, α: axial point value).
Coded ValuesActual Values
Temperature (°C)Reaction Time (min)Solid Load (%)Temperature (°C)Reaction Time (min)Solid Load (%)
−1−1−11802015
1−1−12402015
−11−11806015
11−12406015
−1−111802025
1−112402025
−1111806025
1112406025
−α001604020
α002604020
0−α02106.420
0α021073.620
00−α2104012
00α2104028
0002104020
0002104020
0002104020
0002104020
0002104020
0002104020
Table 3. Significance test of hydrochar composition responses (<0.05).
Probability F > Ftab
FactorModelβ1 (T)β2 (RT)β3 (SL)β12β22β32β1 × β2β1 × β3β2 × β3
FC (%)0.0230.0010.0530.1980.4880.9900.0280.2900.9540.854
VM (%)0.0120.0000.0600.1010.2650.5570.1500.3040.7730.702
Ash (%)0.3460.3620.3440.7620.4200.4150.0140.8490.7740.981
C (%)0.0000.0000.1160.0150.0030.8770.8580.9660.6490.864
H (%)0.1300.0310.9910.5330.2440.2900.0210.7630.7280.267
O (%)0.0000.0000.6380.0610.0100.7400.0970.8640.5950.714
N (%)0.980.850.920.510.580.550.540.560.890.59
Table 4. Hydrochar quality responses from food waste.
TemperatureSY (%)HHV (MJ/kg)EY (%)EDEMC (%)Reference
160–260 °C47.3–88.120.9–33.762.8–88.11.0–1.62.4–8.2Current work
220–260 °C-19.6–29.827.0–23.81.9–2.8 [22]
180–220 °C37.0–56.019.6–25.450.0–71.01.1–1.5 [23]
180–250 °C39.5–72.519.5–25.6-- [49]
180–250 °C40.9–50.122.4–26.765.5–63.71.3–1.6 [50]
220–260 °C45.3–59.824.4–27.660.0–45.31.0–1.0 [43]
160–200 °C52.0–58.423.3–29.6 - [46]
180–280 °C27.5–30.523.5–29.637.4–42.4- [47]
175–250 °C40.0–44.021.6–26.7-1.2–1.5 [20]
200–260 °C75.0–68.530.5–33.1-1.2–1.3 [24]
200–250 °C23.8–28.031.0-1.8–2.0 [2]
Table 5. Significance test of hydrochar quality responses (<0.05).
Probability F > Ftab
FactorModelβ1 (T)β2 (RT)β3 (SL)β12β22β32β1 × β2β1 × β3β2 × β3
Solid yield(%)0.0410.0060.7150.0150.0420.4220.5320.8650.3530.836
HHV (MJ/kg)0.0000.0000.4640.0450.0110.6840.0720.7540.8640.390
ED.0.0000.0000.4390.0370.0090.7390.0900.7640.8210.415
EY (%)0.1970.4110.8790.0120.6500.4280.0940.8860.3260.800
EMC (%)0.0020.0000.5150.0050.0120.5470.6280.1200.4680.153
Bold indicates significant coefficient (p < 0.05)
Table 6. Correlation models obtained from the DoE of all responses (T = temperature (°C), RT = reaction time (min), SL = solid load (%db).
ResponseModelR2
FC (%)−16.4 + 0.356 T + 0.410 RT − 2.16 SL + 0.000477 T × T + 0.00002 RT × RT + 0.0614 SL × SL − 0.00149 T × RT − 0.00032 T × SL − 0.00151 RT × SL0.77
VM (%)125.8 − 0.385 T- 0.418 RT+1.22 SL + 0.000650 T × T + 0.00075 RT × RT − 0.0309 SL × SL+ 0.00120 T × RT − 0.00131 T × SL+ 0.00262 RT × SL0.80
Ash (%)−4.1 + 0.0140 T − 0.0501 RT + 0.535 SL − 0.000066 T × T − 0.000135 RT × RT − 0.01643 SL × SL + 0.000178 T × RT + 0.00052 T × SL + 0.00085 RT × SL0.53
C (%)−29.9+ 0.847 T + 0.037 RT − 0.74 SL − 0.001728 T × T − 0.000157 RT × RT + 0.0029 SL × SL − 0.000039 T × RT − 0.00166 T × SL − 0.00093 RT × SL0.93
H (%)−8.5 + 0.1048 T − 0.1027 RT + 0.641 SL − 0.000206 T × T + 0.000419 RT × RT − 0.01638 SL × SL + 0.000104 T × RT+ 0.00048 T × SL − 0.00236 RT × SL0.65
O (%)136.4 − 0.936 T + 0.110 RT − 0.12 SL + 0.001941 T × T + 0.00006 RT × RT + 0.0275 SL × SL − 0.00029 T × RT − 0.00274 T × SL + 0.00380 RT × SL0.91
N (%)5.44 − 0.0174 T + 0.0218 RT − 0.059 SL + 0.000045 T × T + 0.000112 RT × RT + 0.00181 SL × SL − 0.000098 T × RT + 0.000087 T × SL − 0.000531 RT × SL0.17
SY (%)175 − 1.674 T + 0.469 RT + 5.87 SL + 0.00426 T × T − 0.00342 RT × RT- 0.0425 SL × SL − 0.00065 T × RT − 0.0143 T × SL − 0.0046 RT × SL0.74
HHV (MJ/kg)− 37.6 + 0.526 T − 0.126 RT + 0.593 SL − 0.001070 T × T + 0.000329 RT × RT − 0.0251 SL × SL + 0.000188 T × RT + 0.00058 T × SL − 0.00363 RT × SL0.90
ED−1.818 + 0.02602 T − 0.00642 RT + 0.0222 SL − 0.000053 T × T + 0.000014 RT × RT − 0.001056 SL × SL + 0.000010 T × RT + 0.000025 T × SL − 0.000187 RT × SL0.91
EY (%)−17 + 0.012 T + 0.226 RT + 7.87 SL + 0.00076 T × T − 0.00302 RT × RT − 0.1078 SL × SL − 0.00046 T × RT- 0.0135 T × SL+ 0.0050 RT × SL0.74
EMC (%)130.7 − 0.498 T − 0.557 RT − 1.31 MC + 0.000727 T × T + 0.000332 RT × RT + 0.00426 MC × MC + 0.000808 T × RT + 0.00144 T × MC + 0.00442 RT × MC0.87
Table 7. Compilation of response surface methodology and other designs of experimental studies with HTC.
Type of DEOFeedstockVariablesResponsesOptimized ConditionsOptimized ResponsesReference
2-level factorial with center pointsMicroalgaeT, RT, SLSY, CY--[30]
Box-Behnken frationalDigested mail silageT, RT, pHCarbon content, CY--[31]
CCDOlive stoneT, RT, SLSY, HHV--[32]
CCRDSewage sludgeT, RTSY, HHV, EY and ED180/60 and 200/30carbon recovery in liquid[33]
CCDLignocellulosc biomassT, RT, SLSY, ED and EY--[52]
CCDPalm shellT, RT, SLSY--[53]
CCDCoffe huskT, RT, SLSY, BET210/243/3.4:133.3 m2/g[54]
CCDShrimp wasteT, RTSY180/120-[34]
CCDAD digestateT, Rt, pHSY, O/C ratios165/500/3.536%SY, 0.8 O/C difference[35]
CCDBambooT, Rt, HClLevulinic acid160/3h/0.37M9.46% Levulic acid[55]
CCDDigested Sewage sludgeT, Rt, pHDewaterability and P release170/1.93pH48% SY, 70% P release[56]
CCDDate stoneT, Rt, catalyst doseSY, C retention200/120/20mg59.71%SY, 75.84%C[36]
Box-BehnkenBarkT, Rt, Stirring speedSY, HHV180/4h/600rpm69.89%SY, 18.59 MJ/kg[57]
Publisher’s Note: MDPI stays neutral with regard to jurisdictional claims in published maps and institutional affiliations.

