Article

Measures for Assessing the Effectiveness of Investments for Electricity and Heat Generation from the Hybrid Cooperation of a Photovoltaic Installation with a Heat Pump on the Example of a Household

1
Faculty of Management, AGH University of Science and Technology, 30-067 Krakow, Poland
2
Faculty of Economics, West Pomeranian University of Technology Szczecin, 71-210 Szczecin, Poland
3
Institute of Management, University of Szczecin, Cukrowa 8, 71-004 Szczecin, Poland
*
Author to whom correspondence should be addressed.
Energies 2022, 15(16), 6089; https://doi.org/10.3390/en15166089
Submission received: 11 August 2022 / Revised: 18 August 2022 / Accepted: 19 August 2022 / Published: 22 August 2022

Abstract

:
In recent years, one of the key postulates in the European Union’s policy has become the development of renewable energy sources. In order to achieve the desired synergy effect, the idea of combining two selected sources of energy appeared. This article presents a technical and economic analysis of a hybrid connection of a ground source heat pump with a photovoltaic installation. Taking into account the heat demand of the building, a ground heat pump with a catalog nominal heating power of 25 kW was selected. This article presents the problem of the economic profitability of using a hybrid combination of a heat pump and photovoltaic panels in domestic hot water and central heating systems. The justification for the use of such heat sources in these installations is due to global trends and the gradual departure from conventional energy sources such as oil or gas boilers. This paper presents the economic and ecological results of using the pump heat connected together with photovoltaic panels. In the economic analysis, with the assumed installation costs related to the use of the considered heat pump and PV, two parameters commonly used in the investment analysis (static and dynamic) were used, namely, the simple payback period and the net present value of the investment. For the adopted assumptions, the usable area of the facility and the number of years of use were indicated, at which the investment in question is competitive with other alternative investment interest methods and will start to bring tangible benefits. The performed analysis also has measurable environmental benefits in the form of a reduction in carbon dioxide emissions at the level of 2893 kg/year into the atmosphere. The presented solution will help future investors understand the investment profitability mechanism for their households.

1. Introduction

In Poland, electricity and heat are generated mainly from coal. This, in the context of the pro-ecological course adopted by the European Union and the whole world, means for Poland a constant pressure on the price of these goods. The costs of carbon dioxide emission allowances are now almost twice as high as in 2020, which translates into increases in electricity bills. The increases also affected the price of coal and gas—the latter energy carrier has already increased several times this year, recently by more than 7% [1,2,3]. Searching for an alternative to traditional sources of energy and heat is now a necessity. After years of neglect, the Polish energy industry must turn to renewable energy sources as soon as possible, which will help stop the progressing climate change and will be a way to reduce energy and heat costs. Renewable energy sources are gaining in importance at a dynamic pace. The leader here is solar energy, which in 2020 supplied the Polish energy system with as much as 176% more energy than a year ago [4,5,6,7]. Significantly, the merits are mainly due to prosumer installations, which account for about 80% of the total installed power in photovoltaics. The total power of the connected PV microsystems was over 4 GW [8,9]. The sector has been seeing three-digit growths for the past two years. Several factors contributed to the success of the technology: rising electricity prices, falling installation costs and a number of financial incentives. The photovoltaic itself, although it provides clean and cheap energy, is not able to heat houses or apartments. A heat pump, driven by electricity from the sun, becomes one of the cheapest and most ecological methods of heating to help in this [10,11,12,13].
Is it worth combining two renewable sources into one system? Can the cooperation of a heat pump and photovoltaic panels be profitable not only for ecological but also financial reasons? These questions are answered by the following analysis, which is based on the experiments and measurements carried out in the analyzed hybrid installations. From the investor’s point of view, the most important issue is to choose such a method of supplying the building with heat and heating domestic hot water that will ensure the lowest operating costs. To make the right decision, it is necessary to conduct a detailed analysis of the investment costs, future operation, environmental protection aspects and location possibilities for a given heat source, including the fuel storage.
The aim of this article is to assess the investment profitability of a hybrid heat pump connection with PV using a typical household in Poland as an example. To assess the achievement of this goal, the current legal regulations in Poland, the technical and technological parameters of the analyzed devices and climatic conditions were taken into account. This article presents an analysis of the use of heat pumps for heating a single-family building with and without a photovoltaic installation. The content of this article gives a fresh and innovative look at the basic principles of combining these two renewable technologies, the achieved financial and energy benefits, business models and non-technical benefits for the environment and society. In addition, the article provides the necessary knowledge on how the combination of these two technologies affects mutual technological cooperation and why these technologies may be an important element of the European energy system in the future.
The rest of the article is presented as follows: Section 2 presents a global and national literature review on the hybrid combination of the analyzed energy sources. Section 3 describes the research methodology used for profitability analysis using the net present value and payback period calculations. Section 4 describes the results and discusses them. Finally, Section 5 describes the conclusions of the research.

2. Literature Review of the Problem

2.1. The Essence of the Research Problem

The construction sector is responsible for the consumption of approx. 40% of final energy in western Europe. Therefore, a lot of emphasis in the energy policy of the Member States is placed on all activities related to energy conservation. On average, 57% of the total energy needs of buildings are used for space heating, 25% for domestic water heating and approx. 11% for lighting and electricity used by equipment and utilities (approx. 7% for other energy needs) [14,15,16]. The potential for saving energy, especially that used for space heating, is very large. In order to activate the actions of EU countries in the field of energy efficiency in construction and to create a common legislative framework, forcing the achievement of an appropriate level of energy efficiency in buildings, the European Commission has developed directives on the energy efficiency of buildings, the main goal of which is to ensure energy efficiency in buildings and to conduct construction through the use of renewable energy sources. EU directives set out the rules according to which Member States must ensure 20% of the energy consumption is from renewable sources [17,18,19,20]. These requirements can be met, for example, by the use of heat pump technology. This technology can bring significant economic, environmental and energy benefits. Heat pumps use renewable energy and can be the most effective technology for heating and cooling buildings. Significant factors in the future shaping of the market for these devices will certainly be activities related to the recovery of the Polish economy after the COVID-19 pandemic, but also consistent activities aimed at solving the problem of the so-called low emissions. This technology is becoming a key element of the energy mix in reducing CO2 emissions in the sphere of heating and cooling in industry and in households [21]. It should be said that the energy transition is not basically a technological challenge, but rather a matter of politics and raising awareness. Heat pumps perfectly fit into the concept of the intelligent and effective electrification of heating systems supported by the European Commission under the so-called Green Deal and as part of the 2050 decarbonization strategy. Heat pumps are technologies that are fully mature, proven and available for many years, which today are ready to decarbonize the heating sector through the electrification of heating, while ensuring an increase in Poland’s energy security. Using approximately 75% of their energy from renewable sources, they are also characterized by the highest energy efficiency and low operating costs. In the near future, when more and more electricity for the operation of the heat pump will come from renewable sources, the heat pump technology will enable the full decarbonization of heat, becoming at the same time the least emission-heating technology. The wide use of heat pumps in Poland will allow for the achievement of the objectives of the European Union policy in the scope of the implementation of the so-called net zero plan in 2050 and the Paris Agreement target related to the reduction in CO2 by up to 95% by 2050 [22,23,24,25]. At the end of 2021, around 128,000 people worked for heating installations in Poland. They produced 9.92 PJ/year of energy from RES. Estimates for 2022 predict a further intensive development of this market. It is expected that the amount of renewable energy produced by heat pumps will increase in 2022 and will be in the range from 10.51 PJ/year (realistic variant) to 11.52 PJ/year (optimistic variant), depending on the intensity of the government and European support for this technology in various areas [26,27]. The heat pump operation technology is based on the collection of thermal energy from the environment and it is transferred to the building. Thanks to innovative solutions, even 75–80% of the required energy comes from the so-called bottom source, i.e., air, water or soil. However, electricity is needed for the transformation process. Depending on the external conditions and the specificity of the device, a heat pump with 1 kWh of electricity is able to generate approx. 3.5–5.5 kWh of heat energy. Poland has very good conditions with regard to energy production with the use of photovoltaics [28]. The country’s insolation, depending on the region, ranges from 950 to 1300 kWh/m2 per year. It is assumed that from 1 kW of PV installations, it is possible to achieve an annual production of 1000 kWh [29,30]. The cost of investments in a heat pump, including photovoltaics, in Poland is in the range of EUR 11,700–17,000. This amount may seem significant, but taking into account the dynamic increases in electricity, gas and coal prices and the currently record high inflation of 15.5%, it can be assumed that the investment will pay off after about 5–7 years. It is worth remembering that thanks to the use of subsidies, these expenses can be significantly reduced, which was described in detail in the chapter on the methodology and the results of the research. Both the development of heat pumps and photovoltaics is stimulated in Poland by government financial support. There are several financial tools dedicated to individual investors, including “Clean Air” or “Stop smog”. The most willingly chosen subsidy, however, is the “My Electricity” program, which provides direct subsidies to newly built photovoltaic installations with a capacity of 2–10 kW [31]. In 2021, nearly 260,000 beneficiaries applied for aid in the amount of EUR 1064, which allowed the country to reduce CO2 emissions by over 1 million tonnes. The amended RES Act introduced a solution enabling the balancing of the energy produced in prosumer installations with the energy used for one’s own needs. The act stipulates, inter alia, that the user may “return” the excess energy produced by the photovoltaic system to the power grid. During the period of the shortage of the energy produced from its own source, the regulations allow the same user to “collect” the energy produced from the grid without the statutory replacement factor. The generated surplus energy, which is transferred to the energy system, must be removed by the system user from the grid within one year. Using this possibility, the cooperation of a heat pump with photovoltaic panels for heating houses and domestic water can be economically justified and lead to a systemic approach of citizens both in terms of energy production and consumption.

2.2. Literature Review of the Analyzed Problem

Heat pumps have been the subject of numerous scientific publications by Polish authors. In 2008 and 2009, Rubik M. published a series of articles on heat pumps. They raised a number of issues related to the operation of heat pumps [32]: pump history outline and general information, theoretical basis of operation, real heat pump circuits, types of heat pumps, information on ground heat sources, heat pumps in building heating systems and domestic hot water heating, energy, economic and ecological aspects of the use of heat pumps and operational problems. An analysis of the Polish heat pump market was carried out by Zimny et al. [33] and it showed that in the years 2013–2020, there was an increase in the sales of devices from 110 to 15,000 units per year. Mainly brine/water ground pumps were installed for heating purposes. An analysis of the heating costs of a single-family house with the use of a heat pump is presented in [34]. It was found that a higher COP index occurs when the pump is operating for the central heating installation than when it is operating for hot water. In addition, over 70% of the heat needed for heating is taken from the ground, and the device works 7–10 h a day. The cost of operating the pump within a year is less than EUR 234 gross. In turn, the calculations given in [35], for a slightly larger usable area of the house, are at the level of EUR 915 (only heating cells). Cheaper energy sources are coal and gas boilers and regular and condensing boilers. The use of compressor heat pumps in heating systems was analyzed [36]. The amount of energy generated in the heat pump was compared with the coal, oil and gas boiler rooms and system heat. In each of these cases, the pump turned out to be the more advantageous solution. The economic analysis of the heat pump operation in relation to the above-mentioned heat sources was also performed [37]. The unit cost of energy production was lower for a heat pump compared to an oil-fired boiler room fired with LPG and electric heating (when the building is poorly insulated). In the case of a coal-fired, condensing oil or system heat boiler room, it is more economical to choose one of these solutions. The pump efficiency coefficient in the analyzed case was 6.37, and the cost of energy production was EUR 71/GJ. The article [38] presents issues related to operational errors that reduce the efficiency of installations with heat pumps. For example, the author pays attention to the depth of the boreholes—they are often 30 m. Unfortunately, since the first 10 m are characteristic of less heat exchange, the brine may also cool down. The excessive use of the heat source (raising the temperature inside the rooms, weaker insulation of partitions than in the design, etc.) may prevent the ground from regenerating before the next season, and there may even be permafrost around the probe. Efficiency tests of the air/water heat pump preparing the heating medium as a function of the control curve depending on the outside air temperature [39] proved that this operating mode allows for a more effective use of the heat pump’s potential. Moreover, a statistical model describing the dependence of the efficiency coefficient on the adopted parameters was developed. A good agreement was found between the actual working conditions and those obtained from the model. Experimental studies on soil temperature changes as a result of the operation of vertical boreholes as a lower heat source were carried out [40]. It turned out that with a not very intensive use of ground heat in the analyzed heating season, its temperature decreased by 0.8 K. It is possible to use waste heat as a lower heat source [41]. Such heat can be, for example, heat from sewage, pumped water from active and closed mines and heat from the air removed from livestock buildings or cooling units (cooling milk, fruit, vegetables). The article [42] presents the possibility of using the provisions of the PN-EN 14825 standard not only to qualify heat pumps to the energy class, but also for design purposes. The method proposed in the above-mentioned standard takes into account the specificity of the heating season in a given place and the design heat load; however, it is not suitable for determining operating costs. M. Szreder [43] presented the results of research on a heat pump with vertical boreholes, carried out in a low-energy single-family house with underfloor heating. The tests carried out for the variable flow of the medium showed that it is possible to obtain a high efficiency of heat generation in the case of a central heating operation, while during the heating of domestic hot water the COP was lower than expected.
In the global market of the research on the analyzed subject, the authors Pearce et al. [44] determined the potential of PV systems in combination with a heat pump for North American areas. The authors in this study performed numerical simulations and economic analyses using the same loads and climate, but with local electricity and natural gas rates. The authors Sarfarazi et al. [45] built business models at the level of the German community, taking into account the segments of the electricity markets. In turn, the authors Lorenzo et al. [46] presented combinations of renewable energy sources in construction and their advantages and disadvantages in terms of economic profitability. A comparison of the costs and CO2 emissions of three different heating systems based on solar energy and heat pumps at the level of local communities in Scandinavian conditions were presented by the authors Rehman et al. [47]. The seawater heat pump system was studied by the authors Zheng et al. [48] They demonstrated the benefits of saving the building’s energy and reducing carbon dioxide emissions, using heat transfer through seawater heat exchangers, which has become the key to improving the efficiency of the building’s energy system. In a paper by Matt S. Mitchell et al. [49], an improved model of a vertical geothermal heat exchanger for the energy simulation of an entire building is presented. This model, although it is a simplified model, pointed to the advantages of simulation as a tool for solving complex technological problems in the connection of renewable energy sources. On the other hand, an article by Carrêlo et al. [50] showed the economic viability based on a comparison of different PV systems in the Mediterranean region. The authors’ results state that the investment in this climatic zone is profitable. The work of Lorenzo [51] presents the results of the technical validation of the inverter-controlled PV-HP system, which is a satisfactory combination from a technical and economic point of view. In turn, in their research, the authors Pintanel et al. [52] checked the impact of the energy storage used with the compilation in heat pumps on economic efficiency. Their results showed that it is an appropriate energy source system for the construction of social housing in Spain. Another work by the authors Stamatellos et al. [25] presented a methodology that can be adapted to optimize system design parameters for variable electricity tariffs and to improve the net metering policy for a hybrid heat pump–PV plant combination. Moreover, the authors [53,54,55,56] investigated the possibilities of using various renewable energy sources in various centers. The authors compared the operating costs as well as energy storage using the Hybrid RBFNOEHO technique. Their results state that it is the optimal method in solving this type of problem.
Based on a review of domestic and world literature, it can be concluded that no author has investigated the profitability of a hybrid solar panel–heat pump investment in households as an investor. This article discusses the economic, technical and regulatory aspects of the cooperation of a heat pump with photovoltaic sources. When assessing the profitability of the investment, the climatic conditions, the technical specifications of the hybrid connection and the social, legal and political aspects were taken into account, which is an innovative approach to the analysis of this problem. The obtained results will allow investors to make a rational decision regarding the possibility of investing in the analyzed renewable energy sources with full knowledge in this regard.

3. Materials and Methods

3.1. Case Study—Building Energy Parameters

For the analysis, a single-family detached building, one-storied and without a basement, with a usable area of 162.5 m2, was selected. The facility will be used by a family of four. The town has no access to network natural gas. The facility is located in the IV climatic zone for which the design outside temperature is −20 °C. The building heat demand related to heat losses through external partitions and gravity ventilation was calculated in accordance with the PN-EN 12831 standard. It was assumed that the daily consumption of domestic hot water (domestic hot water) at a temperature of 45 °C is 200 dm3, which translates into 213.46 kWh of heat in a month. The building is provided with underfloor heating with the heating medium parameters of 35/28 °C. The use of underfloor heating as a heat receiver cooperating with the heat pump is advantageous due to the higher pump efficiency obtained. Working at a lower temperature parameter allows one to reduce operating costs and also shortens the working time compressors during the heating season, which translates into an extended service life. The greatest energy demand occurs in the winter period (November–March) when the building’s heat demand fluctuates in the allocation of 3800–4300 kWh. In the period from June to September, the heat pump only runs for domestic hot water preparation. The basic parameters of the analyzed building are as follows:
Building characteristics:
Type and purposeresidential building, single-family house
Standardaccording to the regulations of 2020
Number of stories1
The height of the story, m2.8
Heated area, m2162.5
Roofgable
Total area of the facade, m2150
Insulated facade surface, m2150
Total area of windows, m255
Cubature, m3265
LocationRzeszów, Poland
Insolation, kWh/m21080
Airing, m/s8
Climate zone, °CIV
Building insulation parameters—roof:
Material (λ = 0.036)mineral wool
Thickness, cm30
Factor U (W/m2·K)0.11
Insulating parameters of the building—walls:
U-factor of a wall without additional insulation1.15
Material (λ = 0.030)standard styrofoam
Thickness, cm15
U-factor (W/m2·K)0.18
Exterior doors, U0.9
Insulating parameters of the building—floors:
Material (λ = 0.035)styrofoam XPS
Thickness, cm15
U-factor (W/m2·K)0.15
Foundationstraditional insulated
Insulating parameters of the building—ventilation:
Tightnessairtight without recuperation
Trial n503
Ventilationgravitational
Trackiness, %100
The heating system flow temperature was calculated on the basis of a heating curve linking the flow temperature with the ambient temperature. A decrease in the ambient temperature causes an increase in the water temperature at the system supply. The beginning of the heating curve was determined for the outside temperature of −20 °C, for which the supply temperature was 35 °C. The end of the heating curve was set at an ambient temperature of 16 °C, for which the heat pump switched to summer mode (covers the domestic hot water demand only).
In addition, the building is equipped with a photovoltaic installation on a SolarWorld metal frame, made of stable 50 mm profiles, inclined at an angle of 30°. The installation had a power of 16.5 kW and consisted of 50 Just Solar 330 W half cut panels. The installation worked in the on-grid system. A detailed description of the panels is presented in Table 1.
A Fronius inverter with a rated power of 15 kW was installed in the panels. Such a high power of the inverter is enough to operate photovoltaic panels with a power of 16.5 kW. Table 2 shows the details of the inverter.
The content of this article gives a fresh and innovative look at the basic principles of combining two renewable technologies, the achieved financial and energy benefits, business models and non-technical benefits for the environment and society.

3.2. Criteria for Selecting a Heat Pump and PV Installation

The cooperation of two installations gives satisfaction to the investor only when they are selected optimally. When choosing a heat pump, it is worth paying attention to the Coefficient of Performance (COP). The COP is the ratio between the heat pump’s heating power and the compressor’s electrical power required for its operation. For example, a heat pump with a thermal power of 25 kW and an electrical power necessary to power the pump of 5 kW will be described by the COP = 5 (25/5). The interpretation of the COP of a given device means that the higher the coefficient, the more heat can be produced using the same amount of electricity. To evaluate the energy efficiency of a heat pump, seasonal factors are additionally used, which are denoted by the acronym SCOP (Seasonal Coefficient of Performance) or SPF (Seasonal Performance Factor). Both factors determine efficiency per year, with the SCOP being the theoretical factor and the SPF calculated with real data. The SCOP factor takes into account the variable operating conditions of the heat pump, which is ignored when calculating the COP factor. The calculation of the SCOP requires the identification of two energy sources:
  • bottom source—it is, e.g., water, soil or air, which heat the refrigerant in the pump;
  • upper source—it is a heating system to which heat is transported by a refrigerant which gives off heat in the building through, for example, underfloor heating.
The SCOP performance factor should be calculated using the formula [57]:
SCOP   =   QHP EEL
where:
  • QHP —heat given off by the pump;
  • EEL —electricity consumed by the pump.
The second component of the described heating system is the photovoltaic panels. The selection of the power of the panels in the target installation should cover the entire energy consumption electricity, also for the purpose of powering everyday devices (building lighting, household appliances, electronics, etc.). This consumption, however, is individual; therefore, for the purposes of this study, it was assumed that the selection of power in relation to the electricity demand for a given household leads to a quick return of the investor’s funds. Later on, the cooperation of the well-chosen installations generates profits. It is worth saying that the demand for electricity is inversely proportional, which means that in the summer you do not need as much electricity to operate a heat pump as in the winter, and in the summer solar panels absorb most of the sun’s rays. In the winter, however, the demand for electricity is very high, as the electricity production by a photovoltaic installation of the same power is almost half as much.

3.3. Return on Investment Analysis

The investor, by investing cash in the venture, wants it to maintain its value over the years, and moreover, he hopes that they will generate profits. The NPV method allows you to determine the value of money at the time of the return of the investment (money inflation) and it also takes into account the cash flow that the investor has incurred during that investment. Therefore, it is aimed at comparing the sum of financial surpluses with the sum of the expenditures needed to implement the investment, using the discount account. In other words, the NPV is an investment efficiency ratio between the cumulative annual cash flow discounted for the duration of the project and the cumulative annual expenditure. The following equation was used to calculate the NPV [10]:
NPV   =   NCF 0     CO 0   +     NCF 1     CO 1   +     NCF 2     CO 2   +     +     NCF n     CO n
in brief:
N P V   =   t   =   0 n N C F t     C O t
where:
  • NPV —net present value;
  • N C F t —net cash flows in subsequent calculation periods;
  • C O t —discount factor;
  • t = 0, 1, 2, 3, …, n—consecutive years of the calculation period.
The NPV can also be calculated from the formula:
NPV   =   t   =   0 n D t 1   +   i t     t   =   0 n I t 1   +   i t  
If all capital expenditure was incurred in the first year of the investment, then the following formula is used for calculations:
t   =   1 n D t 1   +   i t     I 0   =   t   =   0 n D t 1   +   i t
where:
  • D t —cash flow related to the current operation of the project;
  • I t —capital outlays in the zero period;
  • i—annual interest rate;
  • t = 0, 1, 2, 3, …, n—consecutive years of the calculation period.
The interpretation of the NPV indicator is based on three categories of result interpretation. The first of them refers to profitable investments, and they occur if and only if the NPV index is greater than zero (i.e., NPV > 0). The second category relates to investments in which there is a noticeable lack of revenues; this is the case when the NPV coefficient is zero (i.e., NPV = 0). On the other hand, when the investment generates losses, the NPV ratio is less than zero (i.e., NPV < 0).
The IRR (internal rate of return) method is the internal rate of return; it belongs to the second most frequently chosen methods of assessing economic profitability by investors. The internal rate of return (IRR) is a percentage whose inflows and outflows for the entire investment are equal. In the presented method, the investment will become profitable if and only if the interest rate (IRR) is higher than the limit rate, which is most often set based on BGK (a state-owned bank with a reputation for low credit risk). The internal rate of return is calculated from the formula [10]:
IRR   =   i 1   +   PV     i 2     i 1 PV   +   NV
where:
  • IRR—internal rate of return;
  • i 1 —interest rate value, where the NPV > 0;
  • i 2 —interest rate value, where the NPV < 0;
  • PV—the NPV calculated according to i 1 ;
  • NV—the NPV calculated according to i 2 .
In this method, the most important difference is between i 1 and i 2 , which should be more than 1%.
The main limitations of the NPV method include the problematic selection of the appropriate discount rate, a constant level of the profitability of the assessed investments, as well as the equivalence of the discount rate and capitalization rate used to reinvest positive net cash flows. In turn, the main limitations of the IRR method are the assumption of the identity of the positive NCF reinvestment rate with the calculated IRR, the criterion of constant profitability throughout the investment period, as well as the inability to directly use it for an absolute assessment of the profitability of atypical investments.

4. Results and Discussion

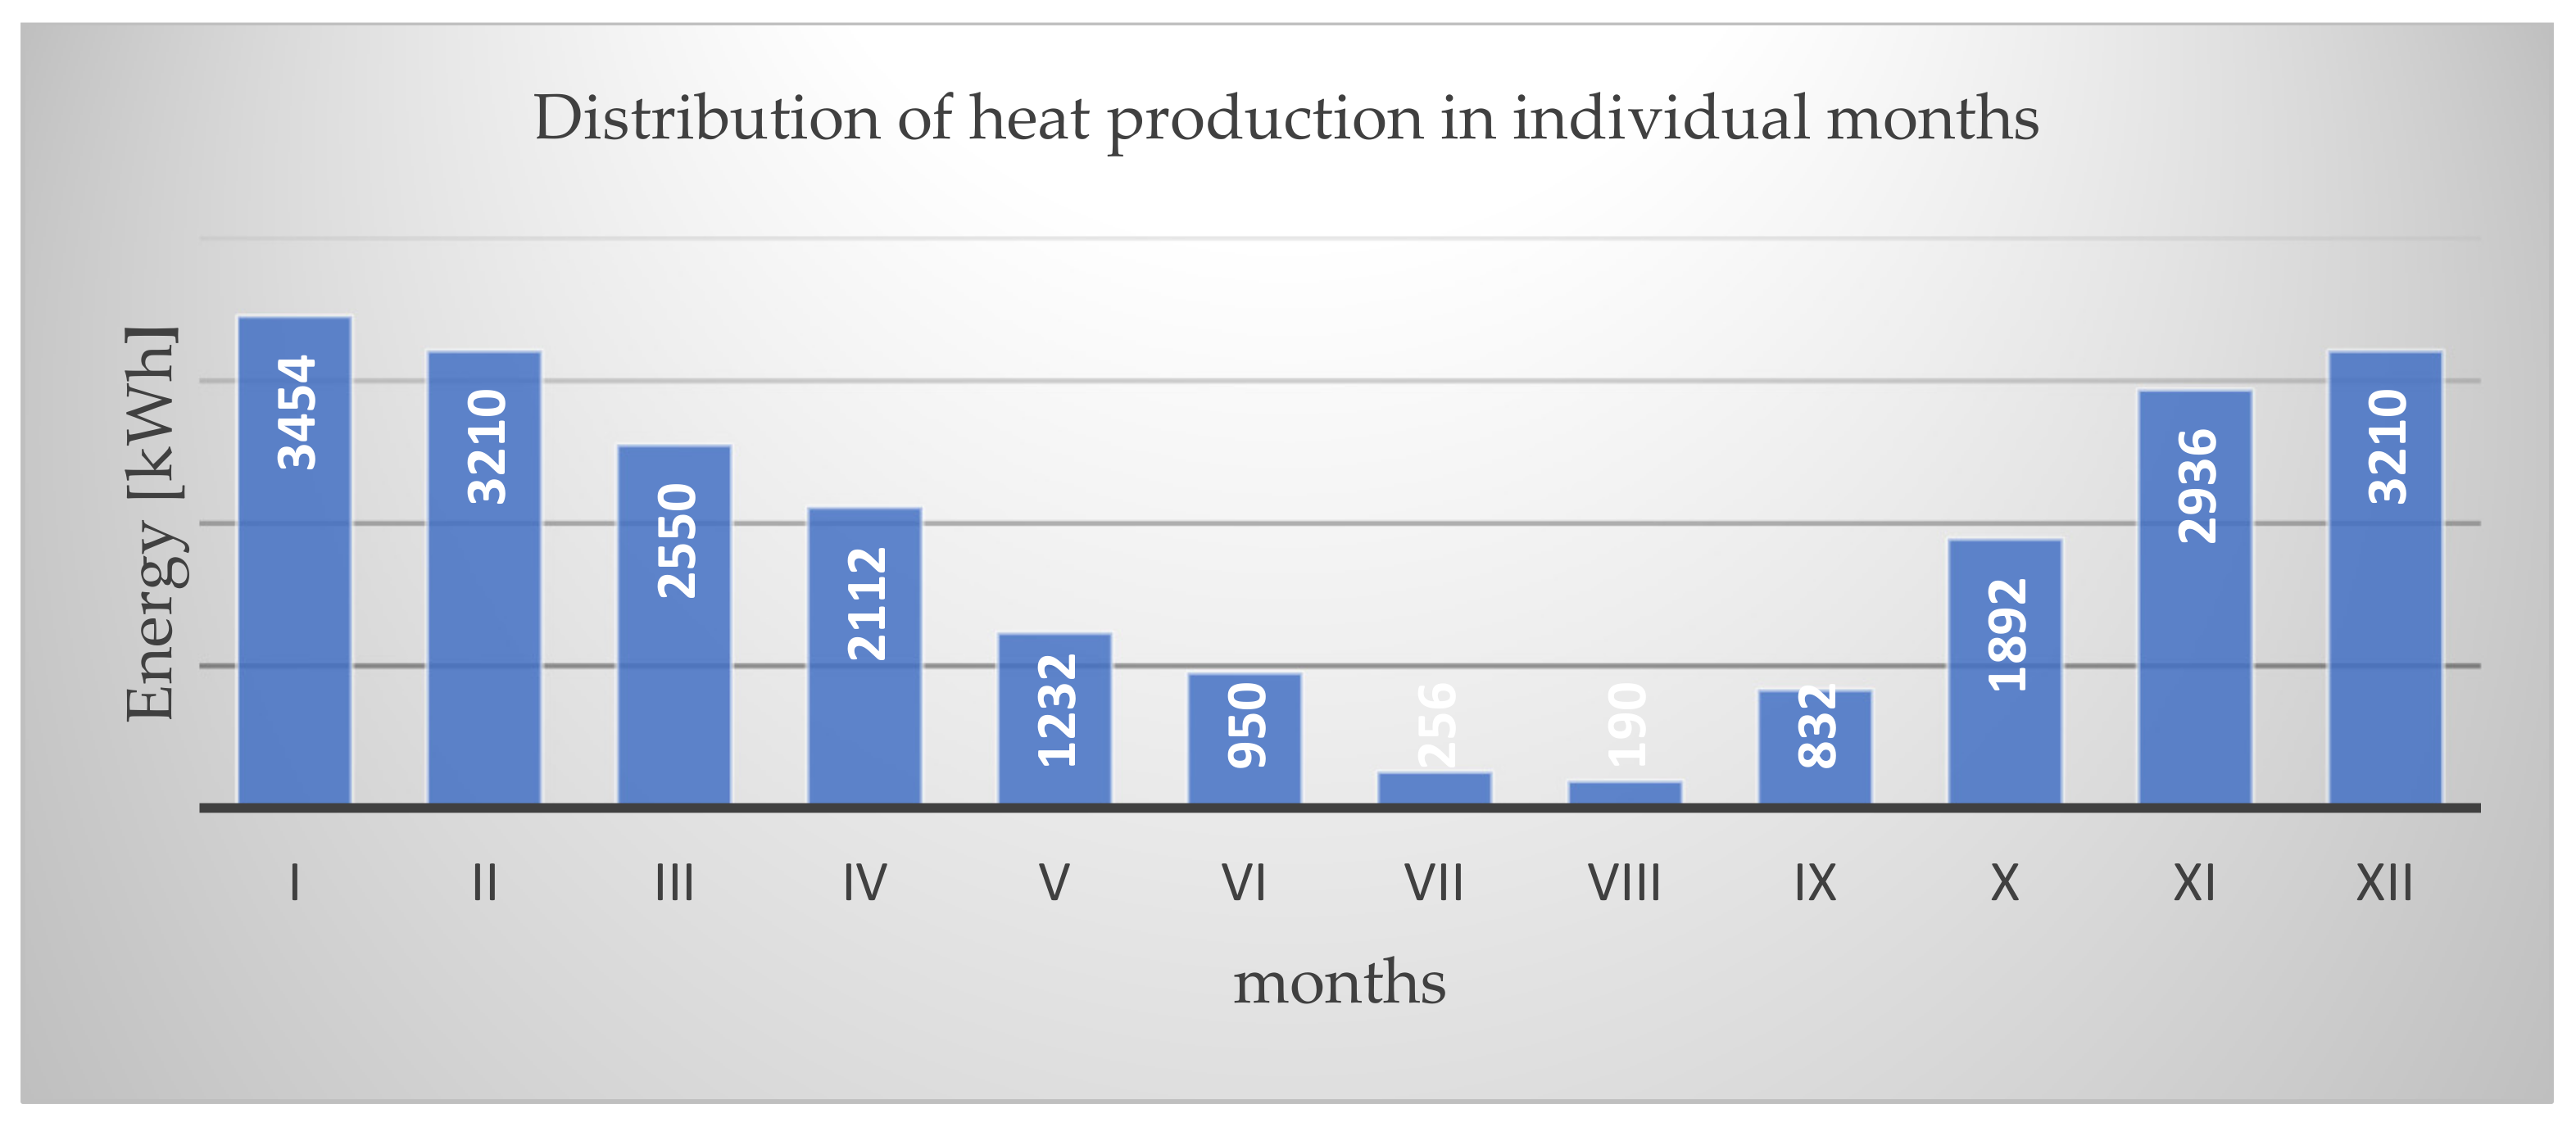
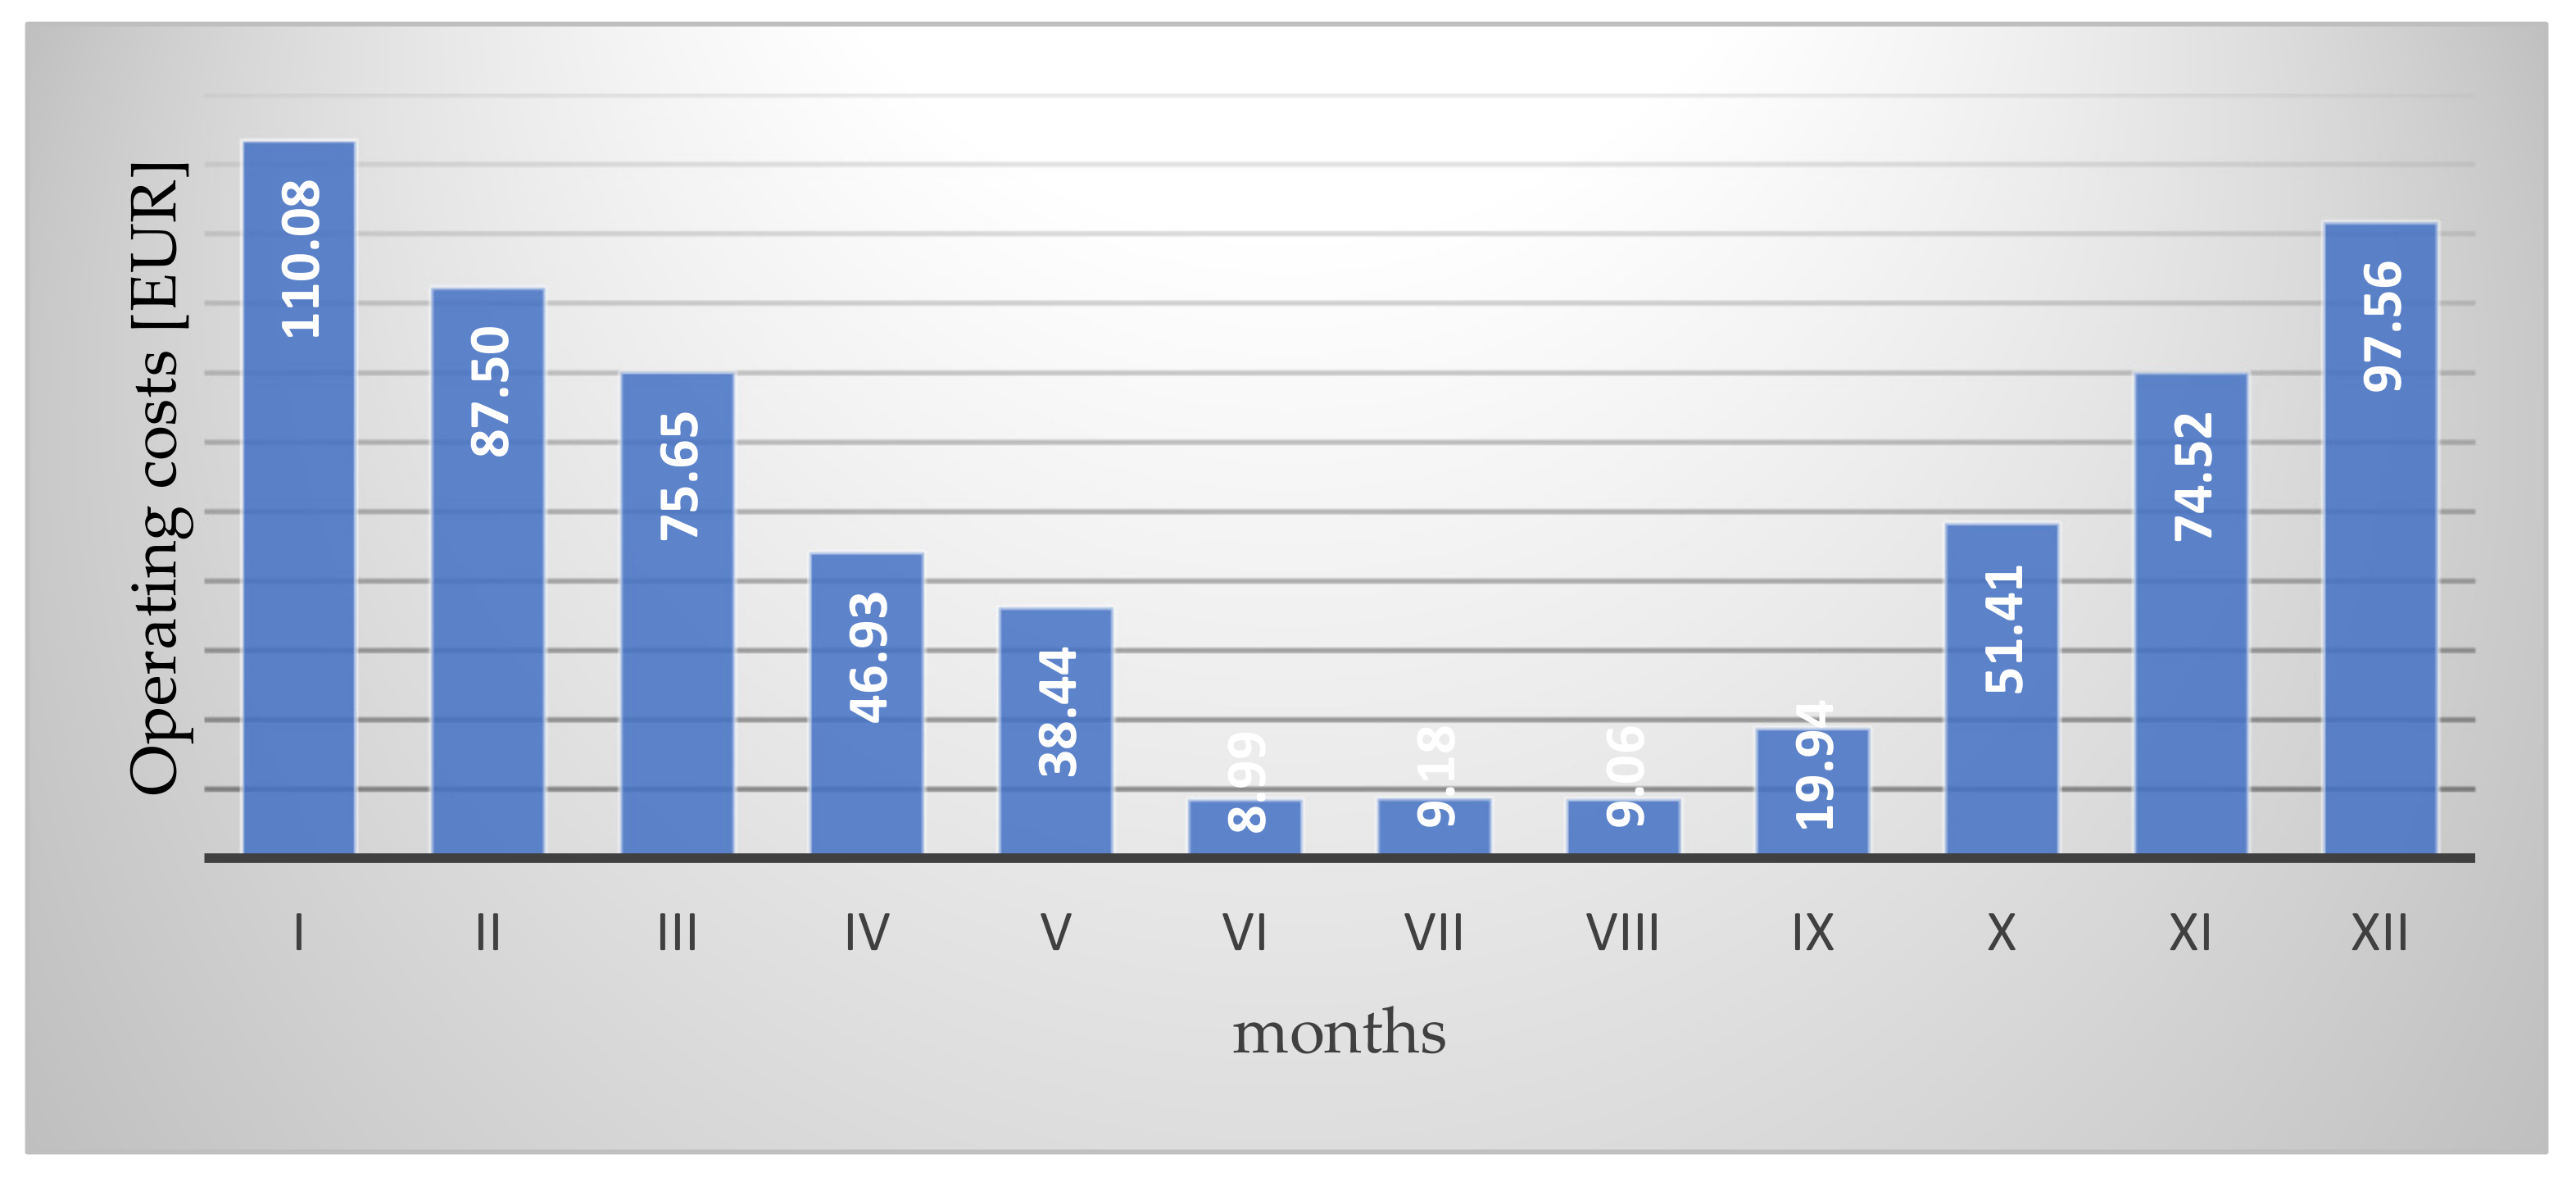
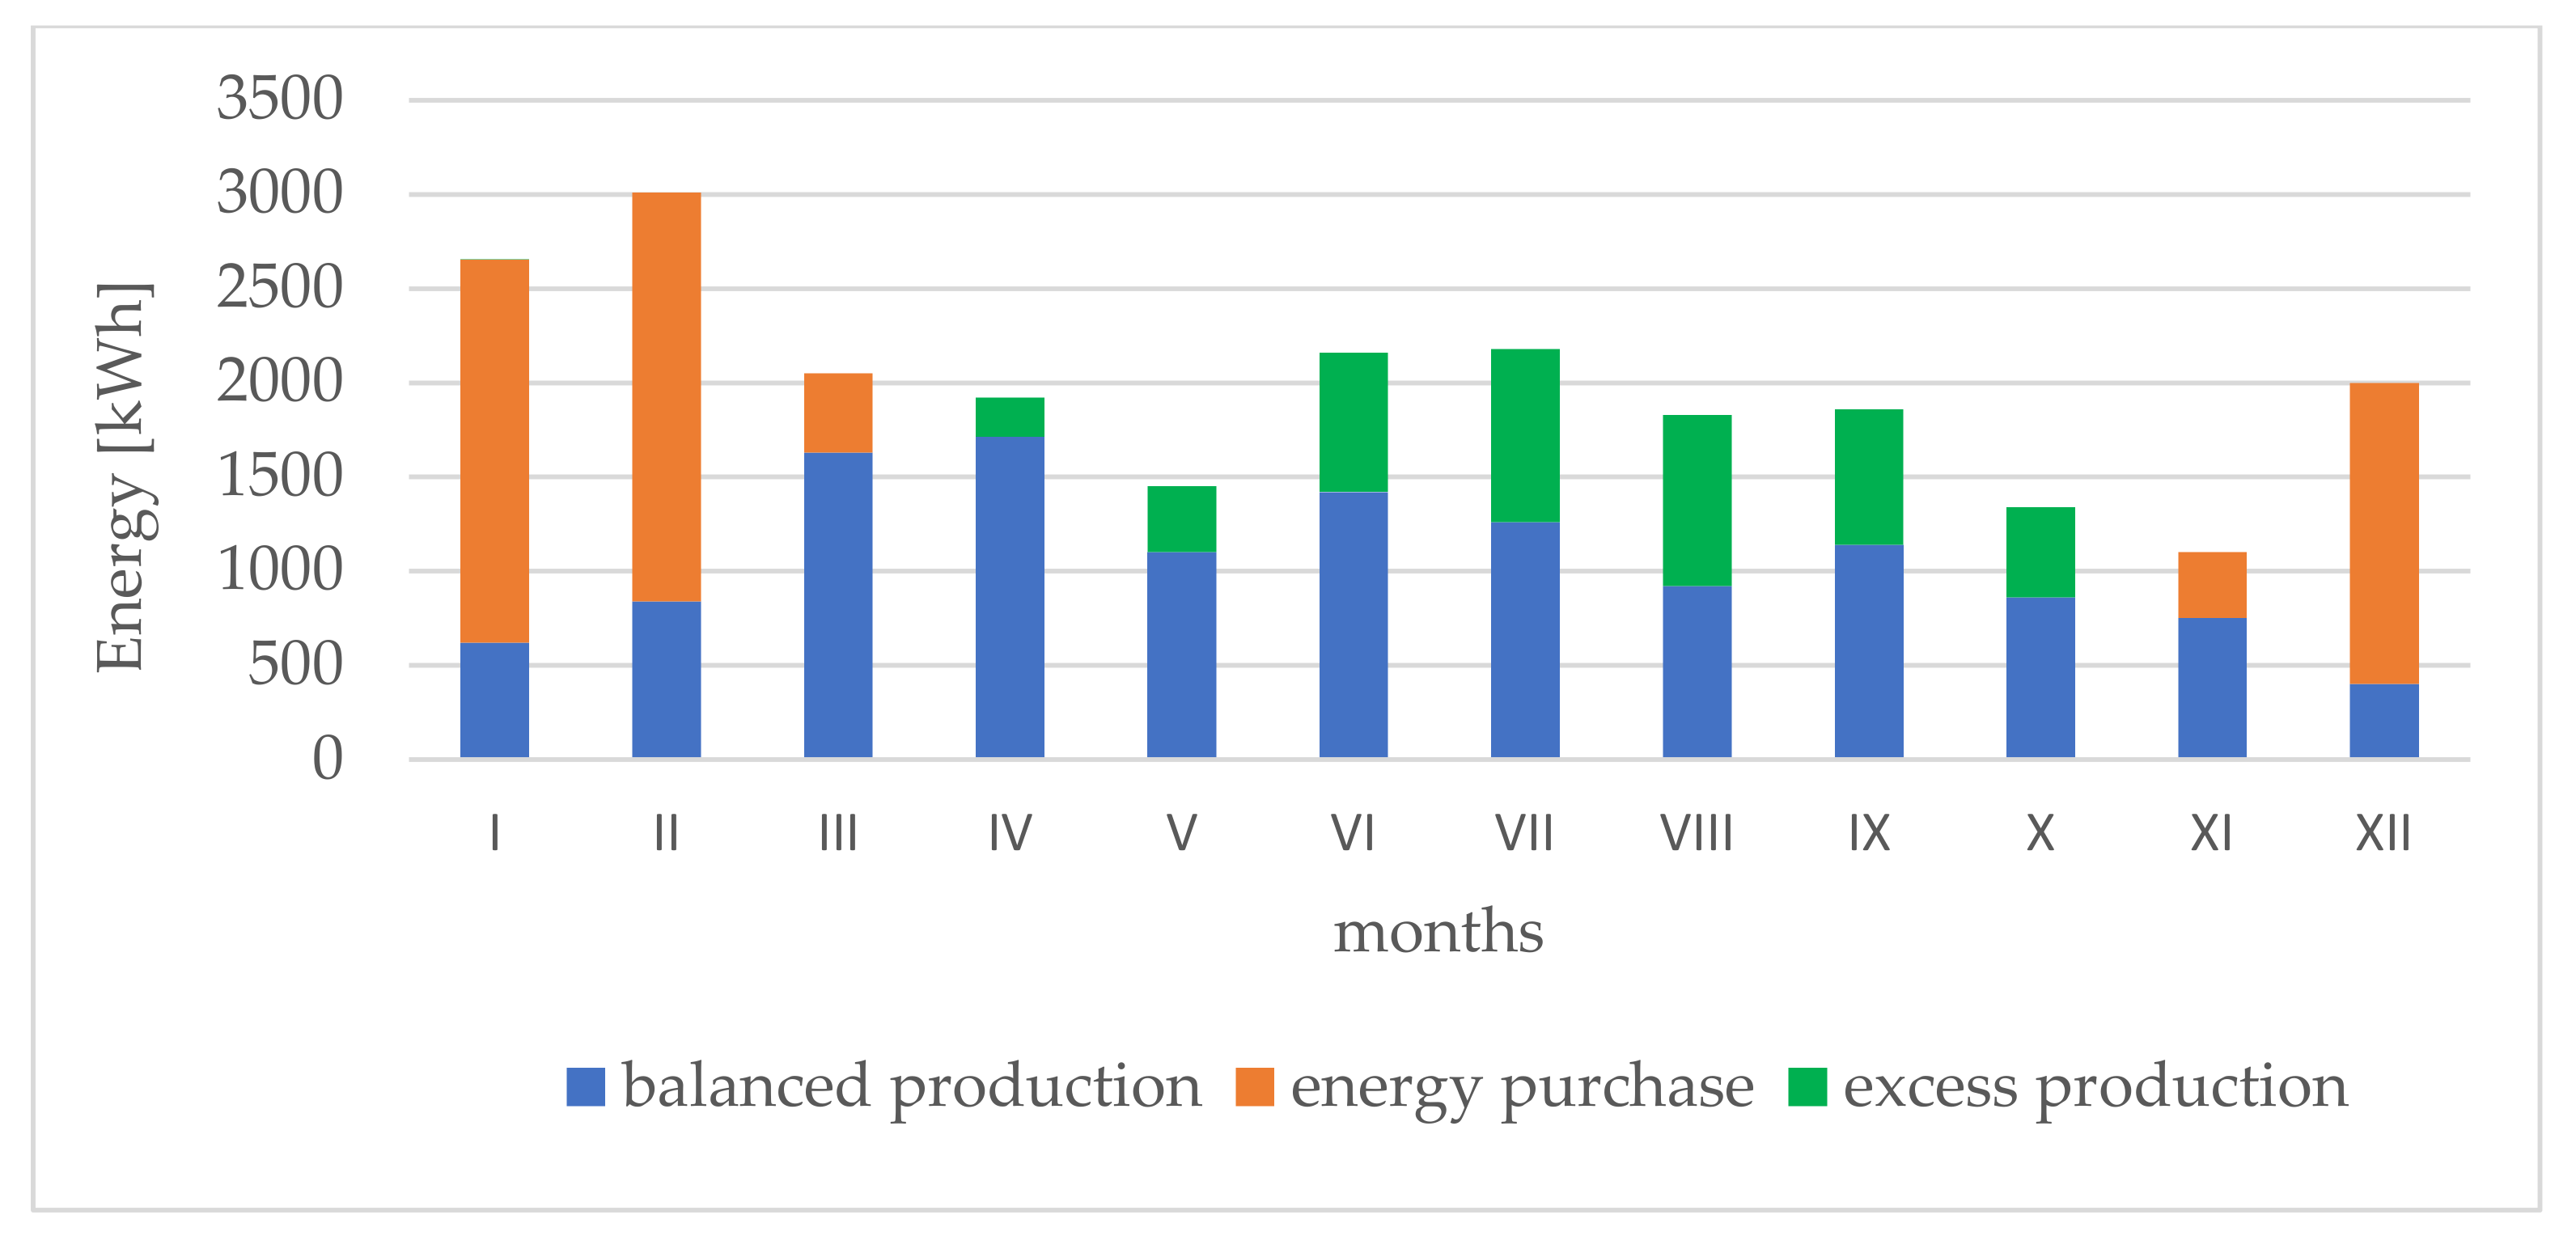
4.1. Analysis of the Energy Effects

The calculations were made using the program for analyzing the energy demand of the building and the selection of Dimplex heat pumps. Currently, they are the heat pumps that offer the lowest costs of home heating. Although they undoubtedly use an expensive energy carrier in the form of electric current, they manage it in an extremely effective way. The calculation of the unit cost of heat (for 1 kWh) is very easy when we know the price from 1 kWh of electricity and the COP or SCOP value. It is enough to divide them by yourself, so with the current price of approximately EUR 0.16/kWh, we get: EUR 0.041/kWh-SCOP 4.0; EUR 0.045/kWh-SCOP 3.5; EUR 0.054/kWh-SCOP 3.0. (It is worth noting that PLN 1 in conversion is EUR 0.21 according to the exchange rate as of 8 August 2022). It follows that even a seemingly insignificant difference in efficiency (SCOP 3.0 or 3.5) clearly translates into the cost of heat. What matters is the efficiency throughout the season, and not the instantaneous COP value determined by the manufacturer only under the most favorable conditions. With the prices of fuels raging at the moment, heat prices from other sources can be even more than 2–3 times higher than in the case of the pump. In recent months, mainly as a result of the introduction of the ban on coal imports from Russia, the popular eco-pea coal has increased dramatically. Its price is as high as EUR 639/t, which translates into the cost of heat even over EUR 0.160/kWh. The price of LPG also increased significantly. For those who have their own tank (and so refueling is cheaper anyway), the average price in April 2022 was 0.75 EUR/dm3, which gives about 0.12 EUR/kWh. Even the price of previously inexpensive heat from natural gas has already increased to EUR 0.07/kWh this year. Nothing foreshadows the end of the increases and it is difficult to forecast how high the prices will be in a few months. In this context, energy-saving heat pumps gain even more competitiveness, especially since electricity prices are growing significantly slower than fuel prices. At the current prices, heating with a heat pump turns out to be significantly cheaper than LPG, as is heating with natural gas and coal, the latter being the cheapest so far. This is true even if the pump needs to supply high-temperature wall heaters (SCOP 3.0).
Comparing the annual energy demand of the analyzed building, which is 28,893 kWh, including 24,386 kWh for central heating and 4507 kWh for hot water, with the produced energy (Figure 1), the heat pump in operating mode covers the entire heat demand of the building.
Assuming that the cost of 1 kWh of electricity used to drive the heat pump compressor is EUR 0.16/kWh and taking into account the cost of the transmission and distribution of energy, the annual operating costs of the heat pump can be estimated. The highest operating costs are incurred during the heating season and amount to a maximum of EUR 110.08 for January (Figure 2). The lowest costs are incurred in the summer, when the heat pump only produces domestic hot water—EUR 9.06 per month.
Annually, the amount of electricity used to drive the heat pump compressor is EUR 613.74. The operating costs also include service costs, which in the case of a heat pump are about EUR 139. Thus, the total seasonal operating cost of a ground source heat pump is EUR 752.16.
Based on the statutory coefficients of prosumer energy billing, an estimation of the potential use of energy production from photovoltaic panels for the heat pump supply was successively estimated. The estimate was for a 25 kW heat pump system. It was determined that the 18 kW PV installation would be the optimal one in terms of energy production and consumption compensation. A summary of the level of energy production by the photovoltaic installation of the indicated power and consumption by the heat pump is presented in Figure 3.
Blue indicates the level of balanced energy in a month (used directly), red indicates a monthly production shortage and green indicates a surplus, i.e., overproduction. Significant from the point of view of self-consumption is the daily production profile, which is important for the settlement of the energy stored in the prosumer formula. It has been estimated that depending on the level of direct consumption, it is necessary to purchase electricity from the grid in the amount of 1.8 to 5.2 MWh per year, which is, respectively, 8–25% of the electricity consumption by a heat pump. In other words, a maximum of 25% of the energy needs to be purchased from the grid and 75% is provided by the installation. Thus, the dependence of the cost of heating the house on the prices of electricity supplied by the seller was reduced. The purchase and installation of a heat pump and a photovoltaic installation—with powers as in the example under consideration—requires investment outlays of over EUR 17,000–22,000. Therefore, it is crucial to the economic efficiency of the venture.

4.2. Technical and Economic Analysis of the Profitability of Investment in a Heat Pump Powered by a Photovoltaic Installation

In the analyzed household, very high annual electricity consumption was observed. Energy consumption in one year was 14.5 MW. In connection with the above, it was decided to install a powerful photovoltaic installation—this way, the residents can become independent of the investment in terms of electricity demand. Self-consumption in the analyzed investment was relatively high, reaching 25% (in the summer, winter and transitional periods, the heat pump is used for cooling, and in the winter for heating). A large part of the energy is consumed by the heater itself, which is installed in the pool for heating purposes. The investment would not turn out to be so profitable if it were not for the EU support from the Clean Air project, from which EUR 3200 was obtained for a photovoltaic installation and EUR 3200 for the installation of a heat pump. The costs related to the energy independence of the household (Table 3) including its operation with statistical assumptions are as follows:
  • annual electricity yield for the first year of operation of the installation—19,009.8 kWh
  • decrease in the efficiency of PV installations—0.8%
  • cost of the installed installation—EUR 13,450.96
  • annual operation—EUR 74.26
  • planned forecast—10 years
  • unit price of electricity for 2022—EUR 0.17
  • inflation rate of electricity prices—3.98%
  • inflation of service prices in the market—7.5%
  • auto-consumption of electricity—25%
  • total cost of the investment under study (heat pump)—EUR 8.09
  • annual exploitation of the heat pump—EUR 74.47
  • the planned use of the heat pump (this is what the extended warranty with the COOPER & HUNTER manufacturer assumes) —10 years
The first column presents the years in which the investment was considered in terms of profitability. The efficiency of the PV installations has a downward trend, which—according to the manufacturer—amounts to 0.8% year on year. The energy yield is shown in the third column; in the first year of the exploitation of the investment, it was 19,009.8 kWh. With the help of the determined indicator of the decrease in the efficiency of the installation, further power yields were forecasted. In the fourth column, the average was used to calculate the average increase in electricity prices from 10 years ago and it amounted to 3.98%. The self-consumption rate was very high because when producing electricity, appliances such as the heat pump and the pool heater are also connected to the grid, which significantly increases the self-consumption of the household. As for the energy that the investor is not able to consume at the time of its production, he can only recover 0.7 of the returned value from the power grid, because the total power of the installation exceeds the power of 10 kWh. According to the data, the actual value of energy that the investor can use for his own needs was 14,732,595 kWh in the first year of use. In order to maintain the efficiency of the installation at a satisfactory level, it should be inspected annually (EUR 63.83—heat pump and photovoltaic installation), the photovoltaic panels should be cleaned annually (EUR 42.55), the air conditioning should be removed (EUR 21.28) and installation insurance should be purchased (cost: pump heat: EUR 21.28; and photovoltaic installation: EUR 17.03). In the last column, the cumulative cash flow was added, which shows the profitability of the researched investments. Figure 4 shows the cumulative cash flows.
The analysis shows that the investments start to be profitable already in the 7th year of its operation. In later annual periods, the investment generates income, i.e., the investor will not incur the costs of electricity resulting from the use of the heat pump for heating purposes (e.g., fees related to the use of an induction cooker, heating the pool and domestic water) and costs related to the use of energy receivers (laptop, mobile phone, light receivers). Thus, it can be concluded that in the seventh year, the installation begins to bring income. The conducted analysis shows that although the investment outlays in the case of installations with heat pumps exceed the costs of building a boiler room for conventional fuels, heat pumps in combination with PV may be an economically advantageous alternative solution, especially where there is no access to the gas network.

4.3. Profitability Analysis of Investments in a Heat Pump using the NPV and IRR Methods

The profitability of the investment was determined according to the Polish bond market, i.e., using the WSE analytical tool—Catalyst scanner. The maturity date of the analyzed investment was estimated in the range of 9–11 years (the maturity date is similar to the time of the exploitation of the investment). In connection with the accepted data, an entity that issues bonds in a similar time range was found—it was the bond FPC0631. The bond was issued by the BGK bank and it is characterized by low credit risk; therefore, the investment can be attributed to a very low risk profile. The interest rate chosen was the reference rate NPV-2.97. Table 4 shows the year-by-year cash flow calculated using Formula (6).
  4898.73 ( 1   +   IRR ) 0   +   190.49 ( 1   +   IRR ) 1   +   418.54 ( 1   +   IRR ) 2   +   475.89 ( 1   +   IRR ) 3   +   538.84 ( 1   +   IRR ) 4   +   607.87 ( 1   +   IRR ) 5   + 683.52 ( 1   +   IRR ) 6   +   766.35 ( 1   +   IRR ) 7   +   856.99 ( 1   +   IRR ) 8   +   956.12 ( 1   +   IRR ) 9   +   1064.47 ( 1   +   IRR ) 10   =   4898.73
Using Excel, the cash flow data were entered into the spreadsheet and the IRR ratio was converted, which was 4.6455%. In order to evaluate the result of the IRR method, two percentages, i.e., the IRR ratio, i.e., 4.65%, should be juxtaposed with the previously calculated rate of 2.97%. The described IRR model was higher than the assumed cut-off rate (IRR > 2.97%). The difference between the compared values is relatively large; therefore, it can be concluded that the investment during the assumed operation of the installation (10 years) will be a factor that will bring financial benefits in the future.
The method of investment analysis using the NPV (net present value) method is the most frequently used indicator of investment profitability. It shows the differences between the cash inflows and outflows for an investment. The financial ratio (r) was determined using the Catalyst scanner in line with Treasury bonds and assuming a safe investment—it was 2.97%. The investment will pay off if the NPV ratio is greater than zero (NPV> 0). The further the NPV deviates from 0 in the direction of plus infinity, the more profitable the investment becomes. After applying Formula (4), the following values were obtained:
  4898.73 ( 1   +   r ) 0   +   190.49 ( 1   +   r ) 1   +   418.54 ( 1   +   r ) 2   +   475.89 ( 1   +   r ) 3   +   538.84 ( 1   +   r ) 4   +   607.87 ( 1   +   r ) 5   +   683.52 ( 1   +   r ) 6 +   766.35 ( 1   +   r ) 7   +   856.99 ( 1   +   r ) 8   +   956.12 ( 1   +   r ) 9   +   1064.47 ( 1   +   r ) 10   =   N P V
Using Excel, the data were entered into a spreadsheet and discounted annually at the rate of return set at 2.97%. Table 5 presents the cash flows discounted with the assumed rate of return of 2.97%.
Then, the discounted cash flow was added and thus the NPV ratio was calculated, which was EUR 526.31. The investment is profitable if and only if the NPV is greater than zero. Thus, it can be concluded that the investment is beneficial for the two methods carried out, i.e., the IRR and NPV. In order to verify the correctness of the NPV calculations, the value was substituted for the cut-off rate in Formula (4), which was obtained from the first calculation method, i.e., 4.65%. After applying the method test (i.e., r = IRR), the discounted cash flows are shown in Table 6.
After substituting the rate of return, which was 4.65%, the value of the NPV profitability ratio was 0. The value of 0 obtained in the NPV method means that the investment is neutral, which means that it does not generate profits and does not bring losses resulting from the capital investment. The NPV index equal to zero has one more meaning—it means the correctness of the calculations performed in individual methods. If the borderline rate in the NPV formula was the rate of return, i.e., the IRR value, the result should be 0, which was calculated and is presented in Table 6.
The Clean Air program plays an important role in the analyzed investment—it shortens the payback period from 13 to 9 years of the investment’s operation. On the other hand, in the case of investments in a heat pump and a photovoltaic installation, the payback period is reduced from 8 to 7 years of the investment, which increases the profitability of the investment. A quick return on invested capital encourages investors who want to invest money with a quick return on their investments. Moreover, the presented analysis allows households to avoid 2893 kg/year of CO2 emissions, which means that thanks to this solution, you can significantly contribute to activities in the field of environmental protection.

5. Conclusions

There is no doubt that renewable energy is to some extent an alternative to conventional energy, provided that as many households as possible rely on renewable energy sources. In order to decide to install their own installation based on the renewal of the energy source, the investor must be sure that such an installation will bring measurable benefits. The fusion of a heat pump with a system of photovoltaic panels is a solution that can be profitable both for ecological and economic reasons. The use of such a hybrid system allows the cost of heating to be independent of external prices, which may be beneficial in the perspective of many changes in the markets. There is more and more talk about the solutions necessary for climate protection, such a heating system, which can be a personal contribution to the fight against smog and global warming, which can have a negative impact on health and life. Based on the analysis of the conducted research, the following conclusions can be drawn:
  • High values of the NPV and IRR ratios allow for a justified capital investment in similar investment models. Contributing to investments using renewable energy sources is a welcome measure today and allows for higher rates of return than those generated by other types of investments with a similar degree of risk.
  • Investments from year to year generated more and more profits than in the previous years, even despite the declining efficiency of the installation—the decline in the efficiency of the installation was not so significant compared to the assumed inflation of electricity prices.
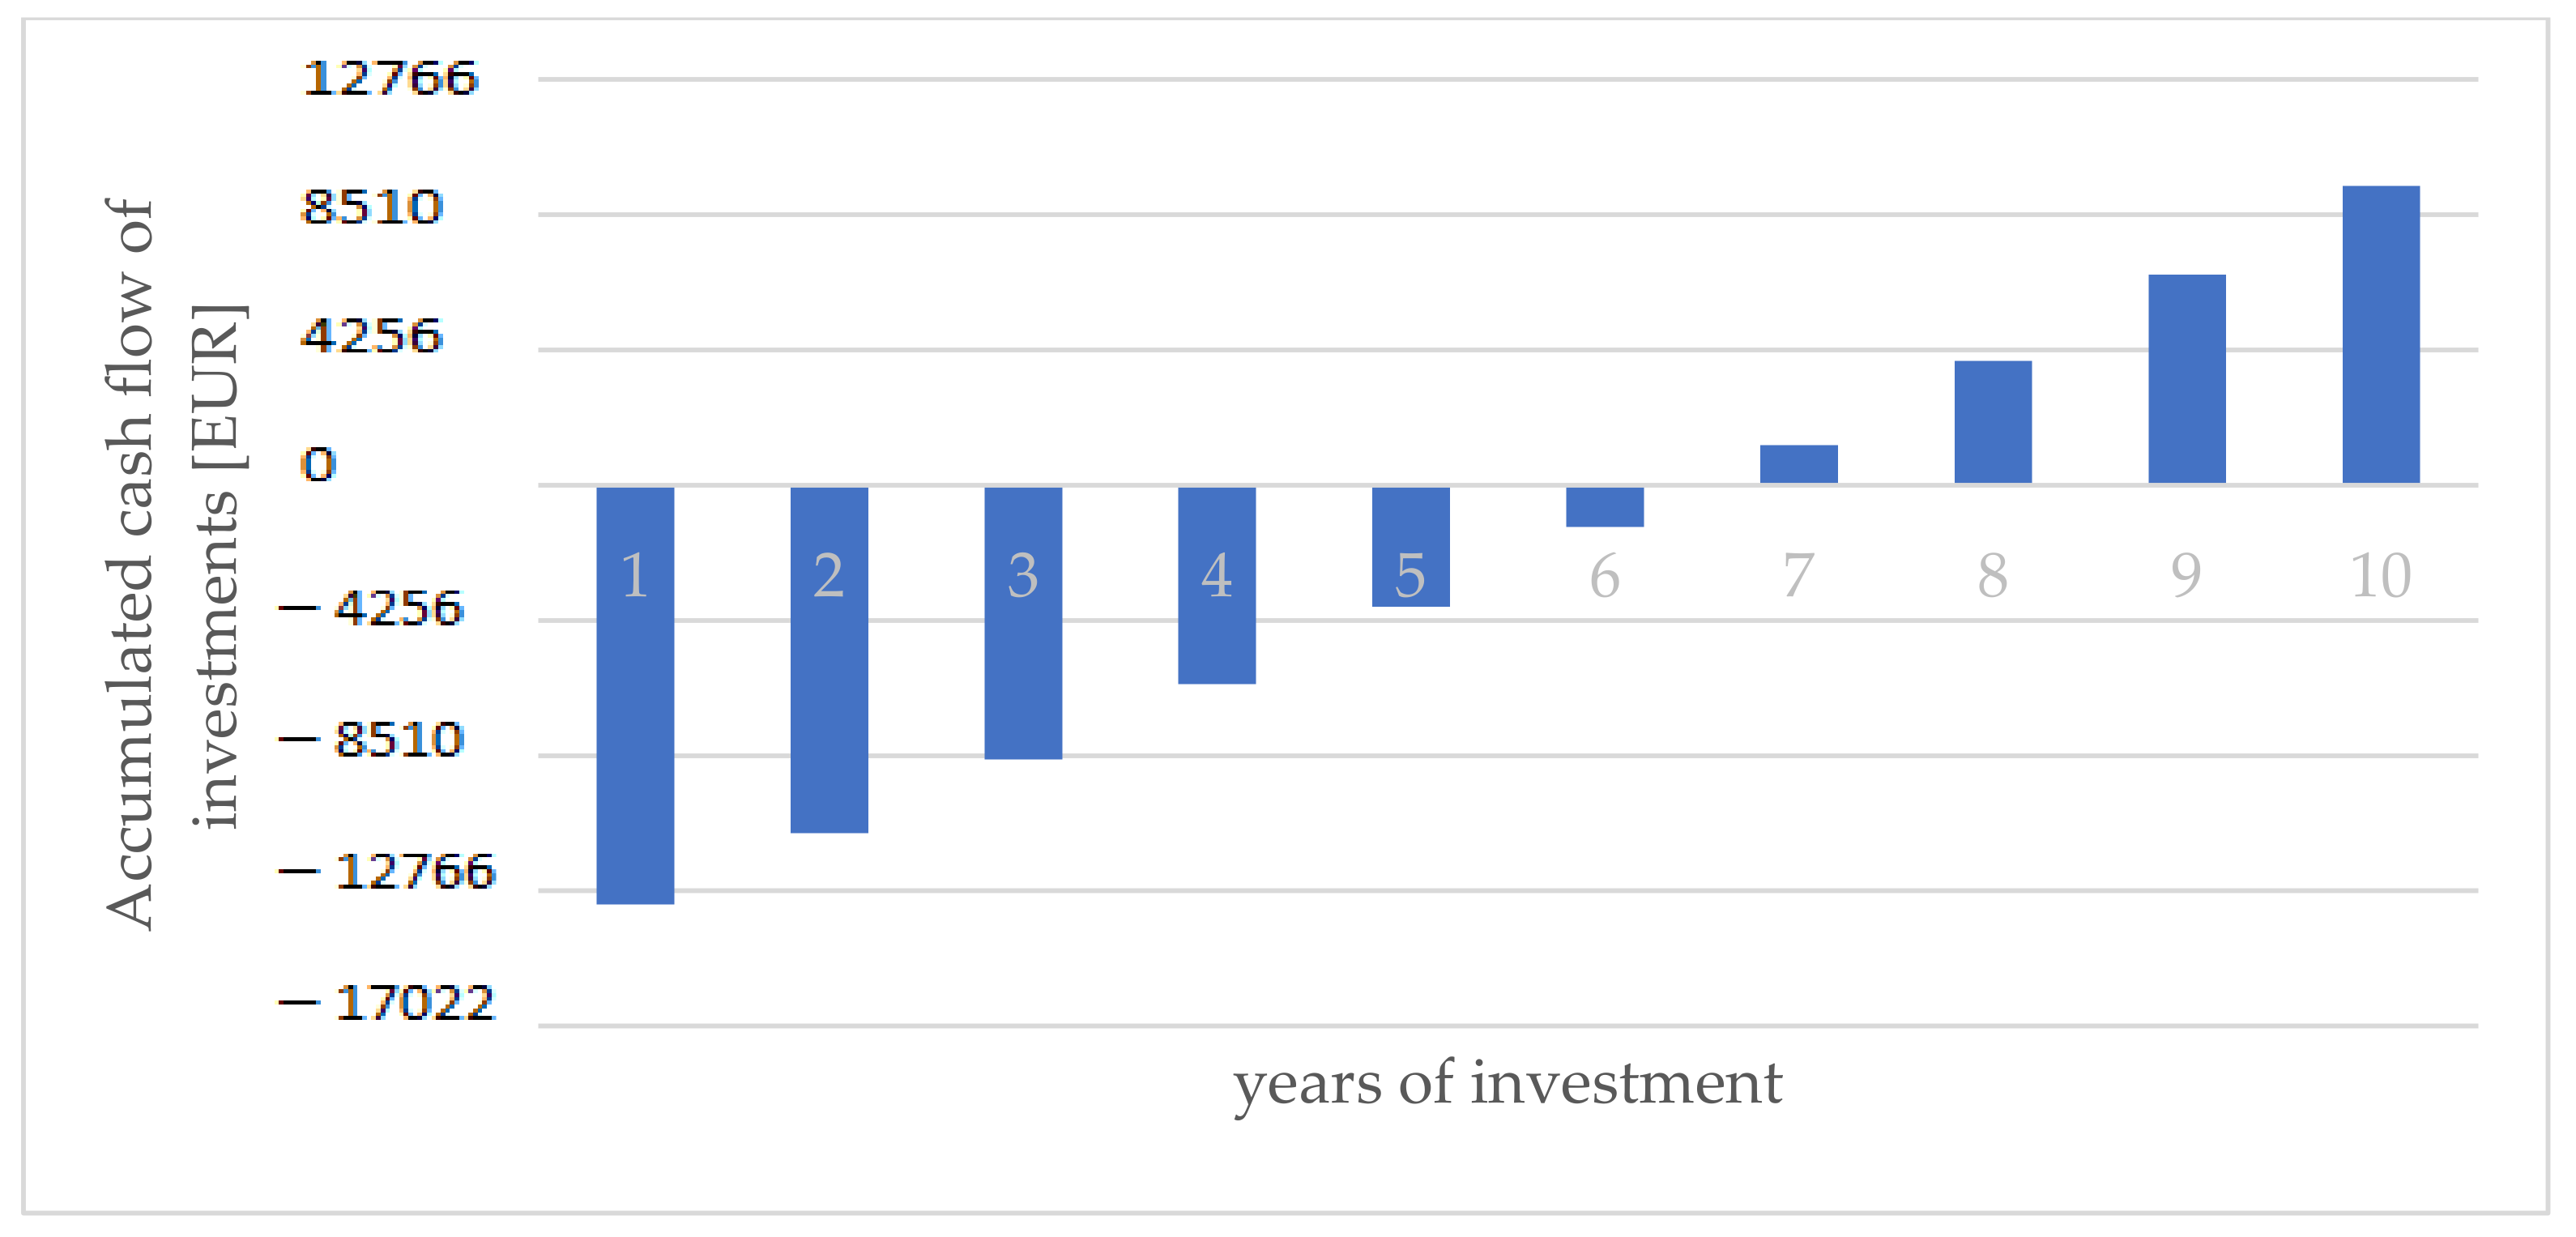
  • Investing in a heat pump is profitable. This is demonstrated by the break-even point that occurs in year 9 of the analysis—in other words, in year 9 the sum of the investment costs is less than the amount obtained by investing money and operating the pump.
  • In the case of an analysis on the profitability of a heat pump investment using a photovoltaic installation, the payback period is reduced from 8 to 7 years. It can therefore be concluded that when installing a heat pump, it is financially advantageous to also install a photovoltaic installation; with this action, we increase self-consumption, so we make full use of the electricity produced by the investor’s panels and the payback period is significantly shortened.
  • Government aids, such as Clean Air, reduce the profitability of investments both in the case of investments in a heat pump and a photovoltaic installation from 9 to 7 years in the case of installing both installations. Government support in the form of programs encouraging the use of alternative energy sources is expected to continue.
In the opinion of the authors, the development direction of such a hybrid solution is certainly storage systems (both heat and electricity). Such devices, if their operations were economically justified, could further increase the self-sufficiency of the household in the context of energy purchases. In this context, an increase in the role of prosumers as a new link in the energy transformation process should be expected.
Recommendations for decision makers on the heat pump and PV market:
  • An effective solution supporting the development of the heat pump market would be the introduction of electricity tariffs dedicated to heat pumps in Poland.
  • Involving banks as soon as possible in the implementation of the “Clean Air” program.
  • Implementation of a professional list of devices co-financed from government and EU programs.
  • Tax relief for RES solutions in new buildings.
  • According to the authors, it is necessary to introduce additional changes in the construction law and in other areas of law, including: a reduction in the primary energy input coefficient for electricity taken from the Polish electricity grid from wi = 3.0 to 2.5; introducing the obligation to use low-temperature installations in new buildings; introducing the obligation to balance heating and domestic hot water installations and cooling installations; and extending the duration of the discount system in the billing of the electricity produced by prosumer micro-installations, which will increase the profitability of the investment.
  • Conducting a monitoring program for the installation of low-emission devices in real working conditions in single-family buildings.
  • Conducting an information campaign on heat pumps and PV, taking into account the best market practices.
This is the first study in Poland to analyze a hybrid combination of these two renewable technology sources based on reliable results from a sample household survey. It has been shown what financial, energy and environmental benefits will bring the investor from the use of such a hybrid connection. Moreover, this article is an incentive for potential investors to rapidly transform the Polish energy system and to move away from fossil fuels, which is part of the European Union’s political strategy.
This type of research has its limitations. From a scientific point of view, it should be emphasized that the adopted data are data examples which, depending on the pump and PV technology used, climatic, social and political conditions may differ. However, these data are the starting point for this type of research.
Further research in this area should include the identification and analysis of aspects of the growing popularity of hybrid renewable energy connections, taking into account the economic aspects of the use of energy storage. Moreover, factors influencing further significant changes in the market situation, including changes in European and national legislation (both at the central and local government level), should be analyzed.

Author Contributions

Conceptualization, M.N., W.L. and W.D.; methodology, M.N. and W.L.; software, M.N. and W.L.; validation, M.N.; formal analysis, M.N. and W.L.; investigation, M.N. and W.L.; resources, M.N.; data curation, M.N., W.L., W.D. and P.M.; writing—original draft preparation, M.N., W.L., W.D. and P.M.; writing—review and editing, M.N. and W.L.; visualization, M.N.; supervision, W.L.; project administration, M.N. and W.L.; funding acquisition, M.N., W.L., W.D. and P.M. All authors have read and agreed to the published version of the manuscript.

Funding

This research received no external funding.

Institutional Review Board Statement

Not applicable.

Informed Consent Statement

Not applicable.

Data Availability Statement

Not applicable.

Conflicts of Interest

The authors declare no conflict of interest.

Abbreviations

COPCoefficient of Performance
SCOPSeasonal Coefficient of Performance
SPFSeasonal Performance Factor
QHPheat given off by the pump
EELelectricity consumed by the pump
NPVnet present value
NC F t net cash flows in subsequent calculation periods
C O t discount factor
D t cash flow related to the current operation of the project
I t capital outlays in the zero period
iannual interest rate
IRRinternal rate of return
i 1 interest rate value, where the NPV > 0
i 2 interest rate value, where the NPV < 0
PVthe NPV calculated according to i 1
NVthe size of the NPV calculated according to i 2
GPWCatalyst scanner
BGKBank of the National Holding
FPC0631domestic bond

References

  1. IRENA—International Renewable Energy Agency. Innovation Landscape Brief: Net Billing Schemes. 2019. Available online: https://irena.org//media/Files/IRENA/Agency/Publication/2019/Feb/IRENA_Net_billing_2019.pdf?la=en&hash=DD239111CB0649A9A9018BAE77B9AC06B9EA0D25 (accessed on 15 June 2022).
  2. IRENA—International Renewable Energy Agency. Country Profiles. Available online: https://www.irena.org/Statistics/View-Data-by-Topic/Renewable-Energy-Balances/Country-Profiles (accessed on 15 June 2022).
  3. GUS. Energy from Renewable Sources in 2019. Available online: https://stat.gov.pl/en/topics/environment-energy/energy/energy-from-renewable-sources-in-2019,3,12.html (accessed on 15 June 2022).
  4. Feldman, D.; Barbose, G.; Margolis, R.; Wiser, R.; Darghouth, N.; Goodrich, A. Photovoltaic (PV) Pricing Trends: Historical, Recent, and Near-Term Projections; National Renewable Energy Laboratory: Golden, CO, USA, 2012. [Google Scholar]
  5. Barbose, G.L.; Darghouth, N.R.; Millstein, D.; La Commare, K.H.; Di Santi, N.; Widiss, R. Tracking the Sun X: The Installed Price of Residential and Non-Residential Photovoltaic Systems in the United States; Lawrence Berkley National Laboratory: Berkley, CA, USA, 2017. [Google Scholar]
  6. IEA. Trends in Photovoltaic Applications 2019 (T1-36:2019); IEA: Paris, France, 2019. [Google Scholar]
  7. Ministerstwo Klimatu i Środowiska—Portal Gov.pl. National Energy and Climate Plan for the Years 2021–2030. Available online: https://www.gov.pl/web/klimat/national-energy-and-climate-plan-for-the-years-2021–2030 (accessed on 15 June 2022).
  8. Niekurzak, M.; Kubińska-Jabcoń, E. Analysis of the Return on Investment in Solar Collectors on the Example of a Household: The Case of Poland. Front. Energy Res. 2021, 9, 1–12. [Google Scholar] [CrossRef]
  9. Ministerstwo Klimatu i Środowiska—Portal Gov.pl. Polityka Energetyczna Polski do 2030 Roku. Available online: https://www.gov.pl/web/klimat/polityka-energetyczna-polski-do-2030-roku (accessed on 20 June 2022).
  10. Niekurzak, M. The Potential of Using Renewable Energy Sources in Poland Taking into Account the Economic and Ecological Conditions. Energies 2021, 14, 7525. [Google Scholar] [CrossRef]
  11. Hayibo, K.S.; Pearce, J.M. A review of the value of solar methodology with a case study of the US VOS. Renew. Sustain. Energy Rev. 2021, 137, 110599. [Google Scholar] [CrossRef]
  12. Green, M.A.; Dunlop, E.D.; Hohl-Ebinger, J.; Yoshita, M.; Kopidakis, N.; Hao, X. Solar cell efficiency tables (version 56). Prog. Photovolt. Res. Appl. 2020, 28, 629–638. [Google Scholar] [CrossRef]
  13. Niekurzak, M.; Mikulik, J. Modeling of Energy Consumption and Reduction of Pollutant Emissions in a Walking Beam Furnace Using the Expert Method—Case Study. Energies 2021, 14, 8099. [Google Scholar] [CrossRef]
  14. Modanese, C.; Laine, H.; Pasanen, T.; Savin, H.; Pearce, J. Economic Advantages of Dry-Etched Black Silicon in Passivated Emitter Rear Cell (PERC) Photovoltaic Manufacturing. Energies 2018, 11, 2337. [Google Scholar] [CrossRef] [Green Version]
  15. Chakraborty, P.; Baeyen, E.; Khargonekar, P.; Poolla, K.; Varaiya, P. Analysis of solar energy aggregation under various billing mechanisms. IEEE Trans. Smart Grid 2019, 10, 4175–4187. [Google Scholar] [CrossRef] [Green Version]
  16. IRENA—International Renewable Energy Agency. Adapting Market Design to High Shares of Variable Renewable Energy. 2017. Available online: https://www.irena.org/publications/2017/May/Adapting-Market-Design-to-High-Shares-of-Variable-Renewable-Energy (accessed on 11 July 2022).
  17. Ziras, C.; Calearo, L.; Marinelli, M. The effect of net metering methods on prosumer energy settlements. Sustain. Energy Grids Netw. 2021, 27, 100519. [Google Scholar] [CrossRef]
  18. Bódis, K.; Kougais, I.; Jäger-Waldau, A.; Taylor, N.; Szabó, S. A high-resolution geospatial assessment of the rooftop solar photovoltaic potential in the European Union. Renew. Sustain. Energy Rev. 2019, 114, 109309. Available online: http://refhub.elsevier.com/S2352-4677(21)00090-4/sb2 (accessed on 10 June 2022). [CrossRef]
  19. Buker, M.S.; Riffat, S.B. Solar assisted heat pump systems for low temperature water heating applications: A systematic review. Renew. Sustain. Energy Rev. 2016, 55, 399–413. [Google Scholar] [CrossRef]
  20. Mohanraj, M.; Belyayev, Y.; Jayaraj, S.; Kaltayev, A. Research and developments on solar assisted compression heat pump systems—A comprehensive review (Part-A: Modeling and modifications). Renew. Sustain. Energy Rev. 2018, 83, 90–123. [Google Scholar] [CrossRef]
  21. Andersson, M. Comparison of Solar Thermal and Photovoltaic Assisted Heat Pumps for Multi-Family Houses in Sweden. Master’s Thesis, KTH Royal Institute of Technology, Stockholm, Sweden, 2018. [Google Scholar]
  22. Niekurzak, M. Determining the Unit Values of the Allocation of Greenhouse Gas Emissions for the Production of Biofuels in the Life Cycle. Energies 2021, 14, 8394. [Google Scholar] [CrossRef]
  23. RED2. Renewable Energy Directive 2018/2001/EU, Directive (EU) 2018/2001 of the European Parliament and of the Council of 11 December 2018 on the Promotion of the Use of Energy from Renewable Sources. Off. J. Eur. Union 2018, 328, 82. Available online: https://eur-lex.europa.eu/legal-content/EN/TXT/PDF/?uri=CELEX:32018L2001&from=fr (accessed on 11 June 2022).
  24. EPP 2040. Ministry of Climate and Environment Draft of Polish Energy Policy until 2040. Energy Policy of Poland Until 2040—Gov.pl. Available online: https://www.gov.pl/documents/33372/436746/EN_Extract_EPP2040.pdf/ca2760d6-f9ab-9a87-c3a9-61063abe3681 (accessed on 17 July 2022).
  25. Stamatellos, G.; Zogou, O.; Stamatelos, A. Energy Performance Optimization of a House with Grid-Connected Rooftop PV Installation and Air Source Heat Pump. Energies 2021, 14, 740. [Google Scholar] [CrossRef]
  26. Wróblewski, P.; Niekurzak, M. Assessment of the possibility of using various types of renewable energy sources installations in single-family buildings as part of saving final energy consumption in Polish conditions. Energies 2022, 15, 1329. [Google Scholar] [CrossRef]
  27. PGE. Ruszyły Inwestycje w Polskie Magazyny Energii. 4 August 2021. 2021. Available online: https://wysokienapiecie.pl/39276-ruszyly-inwestycje-w-polskie-magazyny-energii (accessed on 25 July 2022).
  28. Adamska, B.; Rzeczywisty Początek Magazynowania Energii w Polsce? Wszędzie o Nich Głośno, ale Efektów Brak. Globenergia. Available online: https://globenergia.pl/comments/rzeczywisty-poczatek-magazynowania-energii-w-polsce-wszedzie-o-nich-glosno-ale-efektow-brak (accessed on 16 July 2022).
  29. Niekurzak, M. Development Directions of Low and Zero Emission Sources in the Transformation of the Energy Sector in Poland Based on the Scenario Method Based on Intuitive Logic; Energetyka/Centralny Zarząd Energetyki, Stowarzyszenie Elektryków Polskich: Warszawa, Poland, 2022; Volume 4, pp. 181–192. ISSN 0013-7294. [Google Scholar]
  30. Kantamneni, A.; Winkler, R.; Gauchia, L.; Pearce, J.M. Emerging economic viability of grid defection in a northern climate using solar hybrid systems. Energy Policy 2016, 95, 378–389. [Google Scholar] [CrossRef] [Green Version]
  31. Adamska, B. Magazyny energii w Budynkach Mieszkalnych i Zakładach Przemysłowych—Użyteczne Rozwiązanie czy Zbędny Gadżet? Murator Plus. Available online: https://www.muratorplus.pl/technika/elektroenergetyka/magazyny-energii-w-domowych-systemach-pv-aa-b8Lp-yqDe-MKVq.html (accessed on 17 July 2022).
  32. Rubik, M. Pompy ciepła cz. 8. Energetyczne, ekologiczne i ekonomiczne aspekty stosowania sprężarkowych pomp ciepła. Ciepłownictwo Ogrzew. Went. 2008, 39, 14–16. [Google Scholar]
  33. Zimny, J.; Michalak, P.; Szczotka, K. Polish heat pump market between 2000 and 2013: European background, current state and development prospects. Renew. Sustain. Energy Rev. 2015, 48, 791–812. [Google Scholar] [CrossRef]
  34. Gnyra, K. Ile kosztuje ogrzewanie pompą ciepła? Ciepłownictwo Ogrzew. Went. 2008, 39, 5–9. [Google Scholar]
  35. Kiszczak, A.; Chochowski, A. Ocena efektywności instalacji grzewczej wykorzystującej układ pompa ciepła—Wymiennik gruntowy. Ciepłownictwo Ogrzew. Went. 2007, 38, 8–12. [Google Scholar]
  36. Chudzik, P. Analiza energetyczna stosowania sprężarkowych pomp ciepła. Rynek Energii 2009, 1, 32–43. [Google Scholar]
  37. Chudzik, P.; Strzelczyk, F. Analiza ekonomiczna stosowania sprężarkowych pomp ciepła. Rynek Energii 2010, 4, 68–76. [Google Scholar]
  38. Joniec, W. Wydajność pracy instalacji z gruntowymi pompami ciepła. Rynek Instal. 2012, 7–8, 56–59. [Google Scholar]
  39. Fidorów, N.; Bartnicki, G. Efektywność energetyczna pompy ciepła powietrze woda pracującej w funkcji krzywej regulacji. Rynek Energii 2012, 5, 38–43. [Google Scholar]
  40. Fidorów, N.; Szulgowska-Grzywa, M. Monitoring temperatury w pionowym odwiercie pompy ciepła. Rynek Instal. 2015, 4, 36–40. [Google Scholar]
  41. Rybka, K.; Joniec, W. Pompy ciepła—Przykłady pozyskiwania ciepła odpadowego. Rynek Instal. 2016, 4, 46–48. [Google Scholar]
  42. Piechurski, K.; Szulgowska-Grzywa, M. Obliczanie rocznej efektywności pomp ciepła powietrze/woda. Rynek Instal. 2016, 6, 35–48. [Google Scholar]
  43. Szreder, M. A field study of the performance of a heat pump installed in a low energy house. Appl. Therm. Eng. 2014, 71, 596–606. [Google Scholar] [CrossRef]
  44. Pearce, J.M.; Sommerfeldt, N. Economics of Grid-Tied Solar Photovoltaic Systems Coupled to Heat Pumps: The Case of Northern Climates of the U.S. and Canada. Energies 2021, 14, 834. [Google Scholar] [CrossRef]
  45. Sarfarazi, S.; Deissenroth-Uhrig, M.; Bertsch, V. Aggregation of Households in Community Energy Systems: An Analysis from Actors’ and Market Perspectives. Energies 2020, 13, 5154. [Google Scholar] [CrossRef]
  46. Lorenzo, C.; Narvarte, L.; Cristóbal, A.B. A Comparative Economic Feasibility Study of Photovoltaic Heat Pump Systems for Industrial Space Heating and Cooling. Energies 2020, 13, 4114. [Google Scholar] [CrossRef]
  47. Rehman, H.u.; Hirvonen, J.; Jokisalo, J.; Kosonen, R.; Sirén, K. EU Emission Targets of 2050: Costs and CO2 Emissions Comparison of Three Different Solar and Heat Pump-Based Community-Level District Heating Systems in Nordic Conditions. Energies 2020, 13, 4167. [Google Scholar] [CrossRef]
  48. Zheng, W.; Yin, H.; Li, B.; Zhang, H.; Jurasz, J.; Zhong, L. Heating performance and spatial analysis of seawater-source heat pump with staggered tube-bundle heat exchanger. Appl. Energy 2022, 305, 117690. [Google Scholar] [CrossRef]
  49. Mitchell, M.S.; Spitler, J.D. An Enhanced Vertical Ground Heat Exchanger Model for Whole-Building Energy Simulation. Energies 2020, 13, 4058. [Google Scholar] [CrossRef]
  50. Carrêlo, I.B.; Almeida, R.H.; Narvarte, L.; Martinez-Moreno, F.; Carrasco, L.M. Comparative analysis of the economic feasibility of five large-power photovoltaic irrigation systems in the Mediterranean region. Renew. Energy 2020, 145, 2671–2682. [Google Scholar] [CrossRef]
  51. Lorenzo, C.; Narvarte, L.; Almeida, R.H.; Cristóbal, A.B. Technical evaluation of a stand-alone photovoltaic heat pump system without batteries for cooling applications. Sol. Energy 2020, 206, 92–105. [Google Scholar] [CrossRef]
  52. Martínez-Gracia, A.; Uche, J.; del Amo, A.; Bayod-Rújula, Á.A.; Usón, S.; Arauzo, I. Energy and environmental benefits of an integrated solar photovoltaic and thermal hybrid, seasonal storage and heat pump system for social housing. Appl. Therm. Eng. 2022, 213, 118662. [Google Scholar] [CrossRef]
  53. Govindarajan, U.; Ramachandaramurthy, V.K.; Selvi, T.S.O. Multiple Criteria Decision Making (MCDM) Based Economic Analysis of Solar PV System with Respect to Performance Investigation for Indian Market. Sustainability 2017, 9, 820. [Google Scholar] [CrossRef] [Green Version]
  54. Somakumar, R.; Kasinathan, P.; Monicka, G.; Rajagopalan, A.; Ramachandaramurthy, V.; Subramaniam, U. Optimization of emission cost and economic analysis for microgrid by considering a metaheuristic algorithm-assisted dispatch model. Int. J. Numer. Model. Electron. Netw. Devices Fields 2022, 35, e2993. [Google Scholar] [CrossRef]
  55. Maheswaran, G.; Ravi, R.; Maheswar, R.; Shanmugasundaram, K.; Padmanathan, K.; Subramaniyan, U.; Alavandar, S.; Ganesh, R.; Manikandan, V. Conceptual context of tilted wick type solar stills: A productivity study on augmentation of parameters. Sol. Energy 2021, 221, 348–374. [Google Scholar] [CrossRef]
  56. Venkatesan, K.; Govindarajan, U.; Kasinathan, P.; Padmanaban, S.; Holm-Nielsen, J.B.; Leonowicz, Z. Economic Analysis of HRES Systems with Energy Storage During Grid Interruptions and Curtailment in Tamil Nadu, India: A Hybrid RBFNOEHO Technique. Energies 2019, 12, 3047. [Google Scholar] [CrossRef] [Green Version]
  57. Wójcicki, R. Solar Photovoltaic Self-consumption in the Polish Prosumer Sector. Rynek Energii 2020, 1, 11–17. [Google Scholar]
Figure 1. Distribution of heat production in individual months. Source: own study.
Energies 15 06089 g001
Figure 2. Summary of monthly costs for the electricity used to drive the heat pump compressor. Source: own study.
Energies 15 06089 g002
Figure 3. Summary of monthly electricity production in PV installation with an electric power of 18 kW with pump energy consumption heat with a power of 25 kW thermal power. Source: own study.
Energies 15 06089 g003
Figure 4. Cumulative cash flows for a heat pump investment with a PV plant. Source: own study.
Energies 15 06089 g004
Table 1. Technical data of the Just solar module.
ProducerJust Solar
Model330 HALF CUT
Type of Photovoltaic PanelsMonocrystalline
Technical ParametersSTCNOCTUnit
Power max.330224W
Open circuit voltage42.0739.63V
Closed circuit current10.278.32V
Voltage at maximum power point34.1233.49V
The intensity of the current at the point of maximum power9.237.14A
The efficiency of the photovoltaic module19.7817.95%
Efficiency80%
Dimensions
Length1684mm
Width100mm
Thickness35mm
Surface16.8m2
Libra19kg
Source: own study.
Table 2. Fronius inverter data.
ProducerFronius
ModelSymo 15.0-3-M
ParameterValueUnit
Input data
Maximum input current33A
Maximum short circuit current49.5A
Minimum voltage200V
Rated input voltage600V
MPP voltage range320–800V
Input data
Rated AC power15.000W
Maximum output power15.000VA
General information
Dimensions725 × 510 × 225mm
Mass43.4kg
Level of securityIP 66-
Energy consumption<1W
Ambient temperature range2.5–60°C
Maximum efficiency98%
Source: own study.
Table 3. Summary and analysis of accumulated cash flows for heating with a heat pump powered by a photovoltaic installation.
YearEfficiencyPlanned Energy YieldEnergy PricesAutomatic Energy ConsumptionThe Value of Energy Recovered from the Power PlantActual ConsumptionOperating CostsCumulative Cash Flows
[%][kWh/Year][EUR][kWh/Year][EUR][kWh/Year][EUR][EUR]
0 −15,158.20
1100.00%19,009.800.1454752.4501443.9414,732.595165.95−13,192.63
299.20%18,857.720.1664714.4301643.0314,614.734178.40−10,945.60
398.40%18,706.860.1734676.7151694.7614,497.816191.78−8635.60
497.60%18,557.200.1804639.3011.748.1114,381.834206.16−6261.22
596.80%18,408.750.1874602.1871803.1514,266.779221.62−3821.07
696.00%18,261.480.1954565.3691859.9114,152.645238.26−1313.74
795.20%18,115.390.2024528.8461918.4614,039.424256.111262.17
894.40%17,970.460.2104492.6161978.8613,927.108275.323908.01
993.60%17,826.700.2194456.6752041.1613,815.692295.986625.17
1092.80%17,684.090.2274421.0212105.4213,705.166318.179414.99
Source: own study.
Table 4. Cash flows for investments in a heat pump.
YearCash Flow [EUR]
0−4898.73
1190.49
2418.54
3475.89
4538.84
5607.87
6683.52
7766.35
8856.99
9956.12
101064.47
IRR = 4.6455%
Source: own study.
Table 5. Cash flows discounted with the assumed rate of return of 2.97%.
YearCash Flow [EUR]Discounted Cash Flows [EUR]
0−4898.73−4898.73
1190.49184.99
2418.54394.74
3475.89435.89
4538.84479.31
5607.87525.12
6683.52573.44
7766.35624.39
8856.99678.10
9956.12734.71
101064.47794.38
NPV   =   526.31
Source: own study.
Table 6. Cash flows discounted with the assumed rate of return of 4.65%.
YearCash Flow [EUR]Discounted Cash Flows [EUR]
0−4898.73−4898.73
1190.49182.04
2418.54382.20
3475.89415.29
4538.84449.35
5607.87484.41
6683.52520.51
7766.35557.68
8856.99595.96
9956.12635.38
101064.47675.97
IRR4.64550%NPV = 0
Source: own study.
Publisher’s Note: MDPI stays neutral with regard to jurisdictional claims in published maps and institutional affiliations.

