Article

Scalable Residential Building Geometry Characterisation Using Vehicle-Mounted Camera System

Department of Civil and Structural Engineering, The University of Sheffield, Sheffield S1 3JD, UK
*
Author to whom correspondence should be addressed.
Energies 2022, 15(16), 6090; https://doi.org/10.3390/en15166090
Submission received: 15 July 2022 / Revised: 11 August 2022 / Accepted: 18 August 2022 / Published: 22 August 2022
(This article belongs to the Special Issue Active Buildings: From Theory to Practice)

Abstract

:
Residential buildings are an important sector in the urban environment as they provide essential dwelling space, but they are also responsible for a significant share of final energy consumption. In addition, residential buildings that were built with outdated standards usually face difficulty meeting current energy performance standards. The situation is especially common in Europe, as 35% of buildings were built over fifty years ago. Building retrofitting techniques provide a choice to improve building energy efficiency while maintaining the usable main structures, as opposed to demolition. The retrofit assessment requires the building stock information, including energy demand and material compositions. Therefore, understanding the building stock at scale becomes a critical demand. A significant piece of information is the building geometry, which is essential in building energy modelling and stock analysis. In this investigation, an approach has been developed to automatically measure building dimensions from remote sensing data. The approach is built on a combination of unsupervised machine learning algorithms, including K-means++, DBSCAN and RANSAC. This work is also the first attempt at using a vehicle-mounted data-capturing system to collect data as the input to characterise building geometry. The developed approach is tested on an automatically built and labelled point cloud model dataset of residential buildings and shows capability in acquiring comprehensive geometry information while keeping a high level of accuracy when processing an intact model.

1. Introduction

Global warming is a critical worldwide challenge. The United Nations made climate action one of their seventeen 2030 sustainable development goals in 2005 [1]. Thus, globally reducing carbon emissions should be a priority. In the UK in 2019, 15% of the total greenhouse gas emissions are from residential buildings [2]. Residential buildings also consume 29% of total energy [3]. A way to combat the emissions from the residential sector is through widespread retrofit, although deployment rates are currently slow. Therefore, retrofit is recommended as an infrastructure priority by the Climate Change Committee in the UK [4]. However, analysing if and how a building should be retrofitted is highly labour-intensive and time-inefficient [5]. This is because an on-site survey is still the main approach to making a retrofit plan. If we are going to make retrofit plans for residential buildings at scale, a highly automated solution needs to be developed to speed up solution identification and deployment.
In [5,6], a holistic framework is proposed to use a vehicle-mounted data-capturing system to realise large-scale data collection, characterisation and accounting for urban stocks. The proposed framework shows great potential in building a scalable multi-spectral built-environment digital twin that can provide the comprehensive information required for planning housing retrofit [5]. However, there remains a large gap between data collection and the extraction of useful information.
Vehicle-mounted data capture provides an efficient way to collect urban environmental data at scale [6]. In comparison with using an Unmanned Aerial Vehicle (UAV), a terrestrial vehicle is more cost-effective and convenient to use, especially at scale. For a comprehensive building facade data capture, a UAV needs to be operated, moving both in vertical and horizontal directions and circulating around targets [7]. Therefore, movement pathways will become highly complex and will need to be carefully designed if UAV-based comprehensive building reconstruction is promoted to large-scale data capture, e.g., at a neighbourhood or city scale. In this case, a highly complex data capture process will become inevitable. State-of-the-art approaches using UAVs in capturing building information at scale heavily focus on capturing bottom-view data to modelling building roof structure [8,9,10]. In this case, significant information about a facade, such as window dimensions and distributions, is missing.
Building geometry is critical to understanding urban stocks, especially for building retrofit purposes: it is a key component to building a representative digital building model that can be utilised to model a building’s thermal conditions in modelling tools such as EnergyPlus [11]. The information is also critical for building stock analysis research to estimate quantities of construction materials found in existing buildings in order to plan a circular economy [12]. However, the building geometry, such as building frame dimensions, window locations and sizes, is not always available: surveyors are still required to physically measure the target building on-site to collect the building geometry data [5].
In the architecture industry, the Level-of-Detail (LoD) standard [13] is usually employed to assess how accurately a digital building model is constructed by utilising the building geometry data. The standard contains five levels: level-0 is a 2.5D building planar distribution polygon; level-1 is a prismatic model extruded from level-0 with building height information; level-2 is with the additional roof structure in comparison with the level-1 standard; level-3 and level-4 add extra exterior component details and interior structures on their priors, respectively. Figure 1 demonstrates the five levels of the LoD standard.
To reconstruct buildings under the LoD standard model, collecting raw building data is the primary step. In state-of-the-art approaches developed for building reconstruction purposes, the collected raw data are used to build an elementary building model. A widely adopted elementary building model type is the point cloud model [7,15,16]. The point cloud model consists of structured points in space that represent the 3D shape of an object. Approaches are then developed to automatically measure the buildings to generate LoD standard models from the raw point cloud model. These developed approaches are commonly classified into two types: top-down and bottom-up approaches [17].
The top-down approach defines a building’s primitive library first and then uses a search algorithm to fit the building’s raw model with the predefined primitive library [7,18]. The top-down approach can well maintain the uniformity of the individual reconstructed building models. However, the scope of the primitive library will limit the applicability of the approach to buildings with more complex shapes. The bottom-up approach is also known as the data-driven approach. This approach aims to detect the low-level features of buildings such as vertices, eave lines or their symmetry information. This information is then used to assemble the building model. However, the bottom-up method requires applying strong prior knowledge such as rectilinearity on the low-level feature extraction, which also affects the universality of the developed methods [10,19,20]. Both the two approaches have achieved success in LoD standard reconstruction using various data sources, including aerial images, point clouds and satellite data. However, attempts to use street-view, image-generated point clouds on scalable building measurement for LoD standard reconstruction are still lacking.
This study serves the scalable building energy modelling and material stock quantification target through filling in the research gap of building geometry information acquisition difficulty. The overall contribution of this paper is the development of a novel approach to automatically measure building point cloud models, which are generated from street-view-style images using photogrammetry. The detailed contributions are summarised thus:
  • proposal of a novel top-down approach, completely based on street-view style image data, on building reconstruction;
  • acquiring building geometry data that is essential for building energy analysis using the reconstructed building model.

2. Methodology—Residential Building Geometry Characterisation

2.1. Data Collection and Pre-Processing

The data used in this study are captured by an urban stock research data-capturing system. The data-capturing system can simultaneously collect the visual image, LiDAR point cloud, thermal image, hyperspectral image and position and time data. The data capture system is mounted on a vehicle to drive in the urban environment to collect the data required. Figure 2 demonstrates the data-capturing system MARVEL (Multi-spectral Advanced Research VEhicLe), which is used in this paper for data collection. In this study, we only collect the visual image data using the spherical 360 Teledyne [21] Ladybug5+ camera rig, which contains six separate Sony IMX264 CMOS sensors with 2048 × 2448 pixels resolution. The six cameras are oriented, with one on top pointing upwards and the other five positioned horizontally along the sides, forming a regular pentagon. The camera rig can provide a field of view of 90% of the full sphere.
The image data captured are then input into a pre-trained Deeplabv3+ [23] semantic segmentation model for inference. The model is trained on a dataset that was captured in a typical suburb in Sheffield, UK. The data capture area is shown in Figure 3. The dataset contains 5906 fine-labelled building envelope visual images. In this dataset, each image is partitioned into six categories: wall, roof, window, door, chimney and background. The labelling rules are specifically designed under consideration of the needs of urban stock modelling [5]. The inferred masks are used to extract the building objects from the original images to remove environmental noise. Four examples of the inferred masks with their corresponding raw images and manually labelled masks are shown in Figure 4. Then these noise-free images are used to generate the building point cloud model using the photogrammetry technique. Here we have employed an open-source software package AliceVision Meshroom [16], for the reconstruction.
In the photogrammetry pipeline, the structure-from-motion (SfM) module first infers the camera’s intrinsic parameters and image capture poses. Then the module can calculate the point coordinates in space from the calibrated images. After that, the multiview-stereo (MVS) module refines the coarse output from the SfM module to construct a dense reconstruction. The relationship between the point coordinates in the space and the camera, also known as the essential matrix in the multi-view geometry, is inferred by the photogrammetry algorithm. With the known essential matrices, the mask colour can be projected to the dense reconstruction model from the MVS.
The output model from the pipeline is meshed and textured. Therefore, to acquire the point cloud model, the texture colour is projected to corresponding vertices before the building measurement operation.

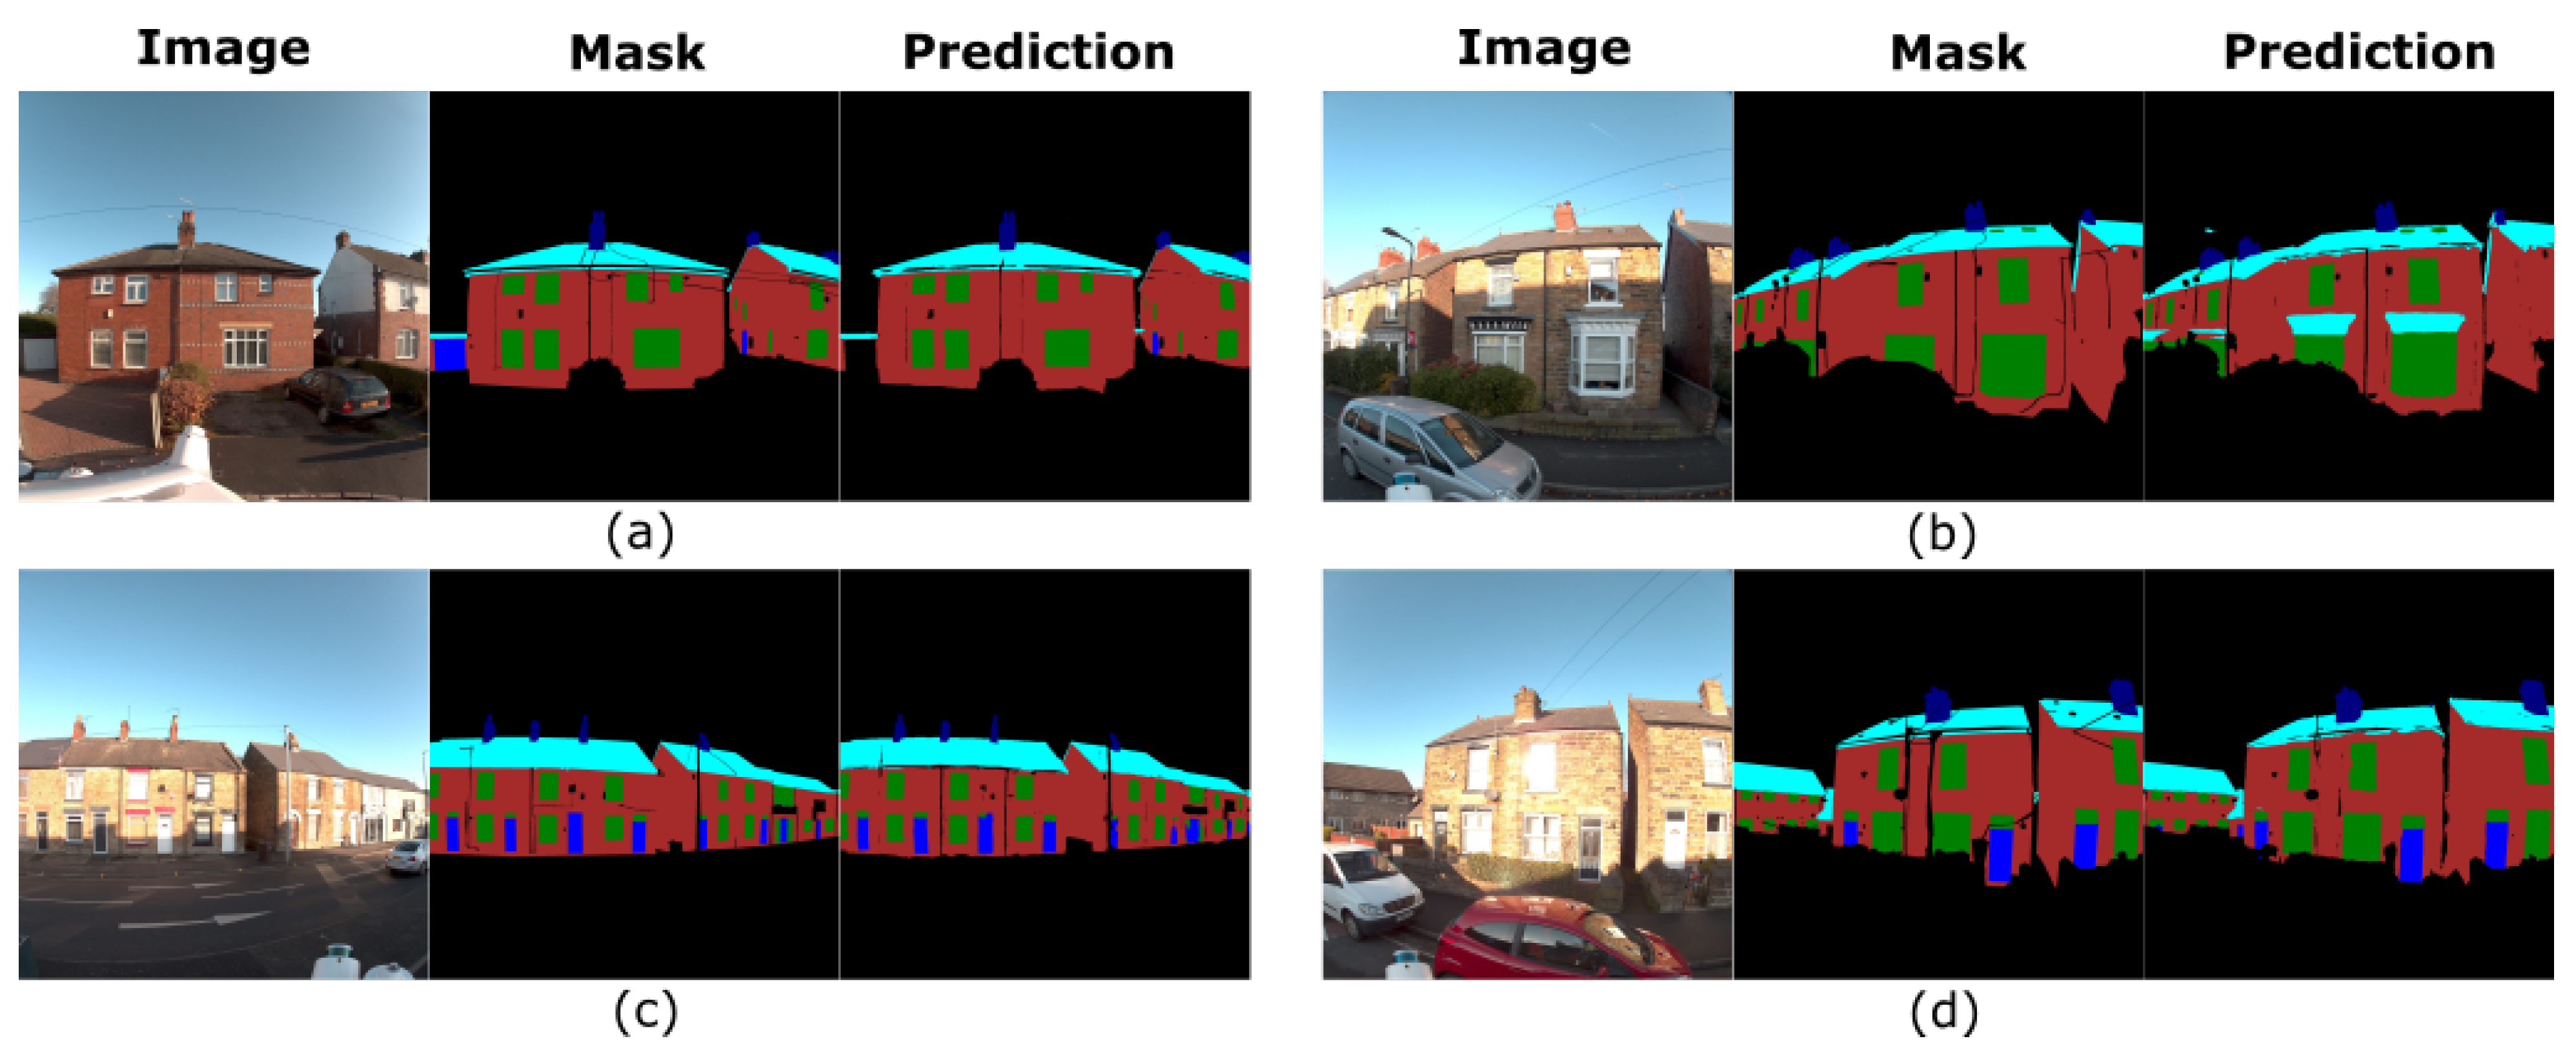
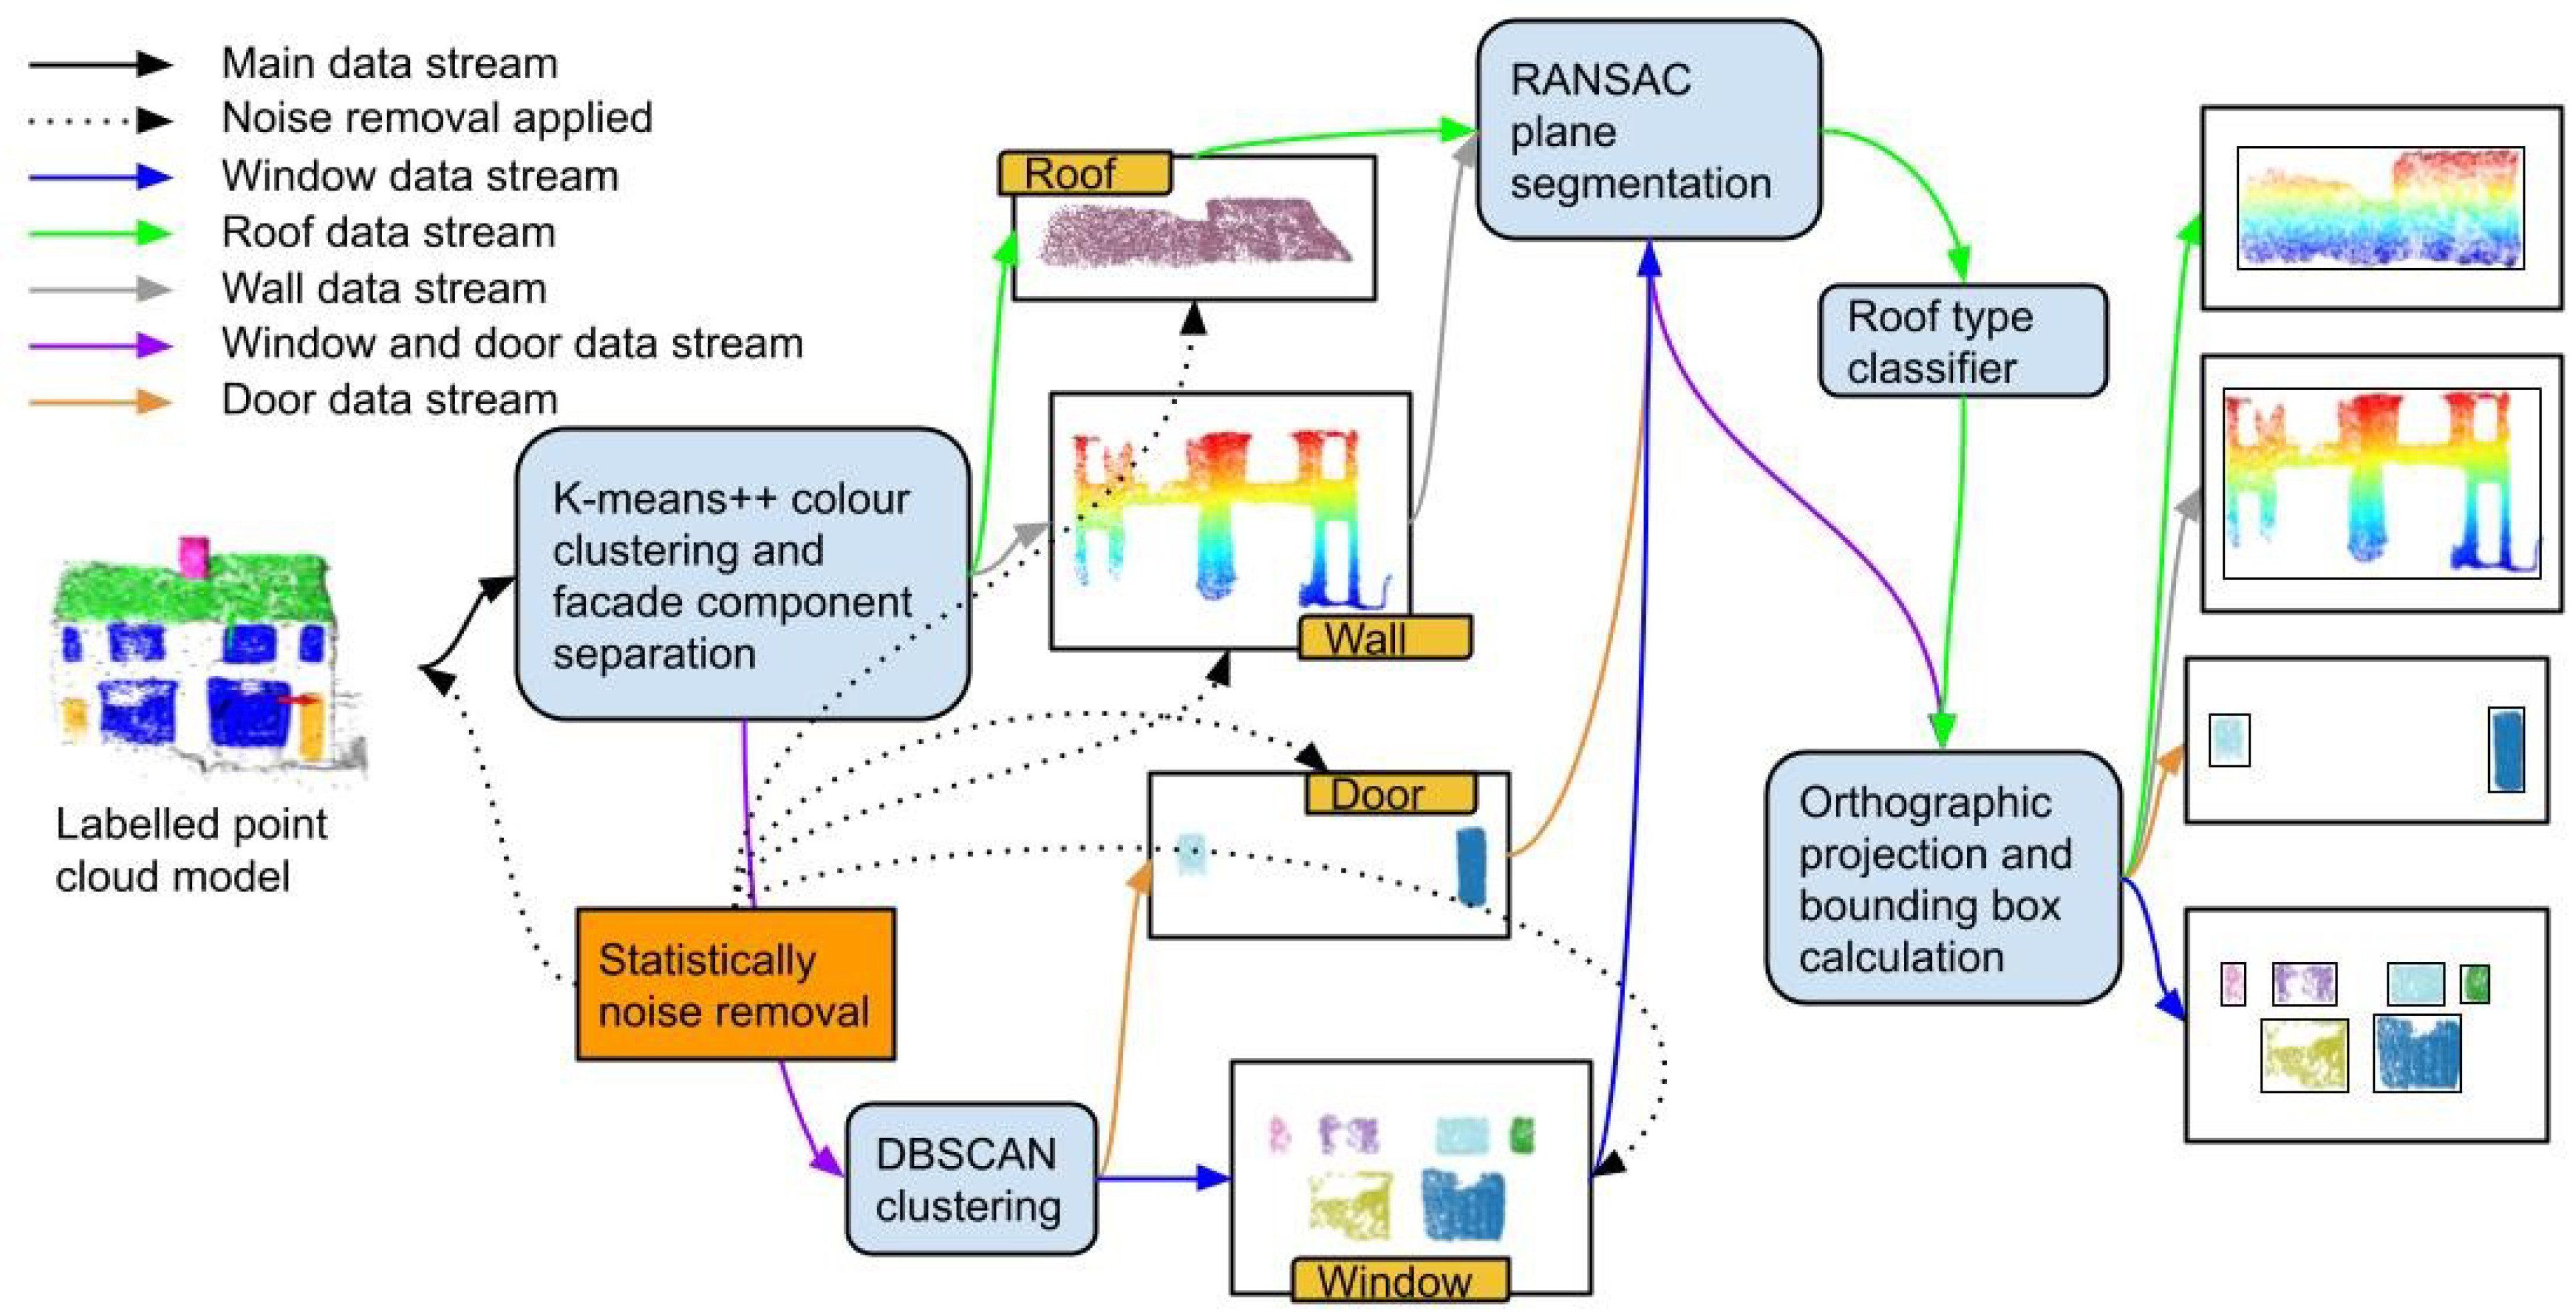
2.2. The Automatic Building Measurement Pipeline

Modelling the roof structure is the key difference between the LoD-1 and the LoD-2 modelling. The state-of-the-art (SOTA) approaches are mainly based on using aerial data collected by an Unmanned Aerial Vehicle (UAV) to reconstruct the roof [7,18]. The aerial data could contain a full top-view of the roof. However, the cost of collecting the aerial data is very high, and the UAV cannot provide a full front view of the building. In comparison, a vehicle-mounted data-capturing system provides a more cost-effective and feasible solution for collecting building data.
However, street-view data normally can only collect facade information instead of a spherical view of buildings. Moreover, according to our observations, when we develop the pre-processing pipeline, the generated labelled point cloud model has several drawbacks: 1. the roof structure is extremely difficult to reconstruct. The SOTA solutions to this problem include integrating aerial data to compensate for the limited field-of-view of vehicles [7]. However, as mentioned, using the aerial data could greatly increase the cost financially and temporally, which is not suitable for a scalable urban stock modelling target. 2. The precision of the mask projection approach is still low. In this situation, a considerable amount of building components in the labelled model have distorted shapes on which it is difficult to apply the bottom-up approaches. Thus we have decided to develop our algorithm based on the top-down approach.
Since the vehicle-mounted data capture can only acquire the building facade data for which the roof structure is commonly only partially visible, assumptions are made for the roof reconstruction: first, the building structure is assumed to be symmetrical around the transversal axis. Therefore, once the facade geometry is achieved, the whole building geometry is mirrored by the transversal axis; secondly, the roof structure is simplified to a gabled shape. In [24], the authors analyse the difference between using the dynamic and the quasi-steady building energy modelling approaches at the district level. The quasi-steady energy modelling is a quick approach to calculating building energy demand, which assumes the indoor and outdoor heat difference remains steady. The approach does not require precise building envelope structures but the surface area of components as well as their heat transmittance values (u-values). The comparative study [7] shows that applying the quasi-steady energy modelling at a large scale is feasible. Thus, instead of trying to reconstruct the precise roof structure, reaching the roof surface area is sufficient.
In [25], a roof template library is built that contains five different roofs. The library is shown below in Figure 5. Although the library only contains the essential roof types, the street-view data may still suffer from collecting adequate roof information for identifying the three pitched roofs due to potential reconstruction errors and viewing angles because the quasi-steady method is feasible for scalable building energy analysis. In this situation, we argue that we can further simplify the pitched roof types in the template library. The roof surface area difference percentage of the gabled roof over the hipped roof can be expressed as:
P r o o f = 100 A g a b l e d A h i p p e d A g a b l e d
In Figure 5(2a), if we denote the building width as a, rooftop width as b, roof length as l and the roof pitch as θ , the above equation becomes:
P r o o f = 100 a w [ ( a + b ) w 2 + w cos θ ( a b 2 ) 2 + ( w sin θ ) 2 ] a w < 100 [ ( a b ) ( 1 cos θ ] 2 a
Equation (2) shows the percentile pitched roof surface area difference has a maximum limit value when the roof upper width b is zero, i.e., the pyramidal roof. According to our observation during the data collection, the roof pitch is around 35°. Thus the limit value can be estimated to be around 9%. For precise building modelling, the roof structure should be modelled as accurately as possible. However, as we are proposing a scalable approach and at the initial investigation stage, it is determined that using the gabled roof structure to represent the three different pitched roofs is acceptable due to the maximum 9% error. The shed roof is also considered as the gabled roof here since the street-view data does not typically have information about the back of the building, which makes the shed roof recognition impossible. Therefore, the five roof types in the template library can be simplified into two types: flat and pitched.
To differentiate between a completely flat roof and a pitched roof point cloud, many methods, such as parametric modelling [7] and linear regression [26], have been developed. However, in this study, as we are using street-view data, these methods are not applicable. Instead, the normal vector of a roof plane is used to differentiate between pitched and plane roofs: if the normal vector of the main plane of a roof point cloud is non-vertical, the roof can be classified as a pitched roof.
Figure 6 demonstrates the proposed automatic building dimension measurement pipeline. As demonstrated, the pipeline starts from the automatically labelled dense reconstruction point cloud model built by the pre-processing pipeline. Although the image mask has certain colours for each category, we have found that the mask projection would lead to gradient colour and various colour noises. Therefore, the K-means++ algorithm [27] is applied first to cluster similar colours together. The K-means++ algorithm is an iterative and unsupervised clustering approach for which the K value needs to be chosen first, which represents the number of clusters the algorithm aims to partition. With the inferred centre values from the trained K-means++ classifier, the point cloud model can be separated for each category.
For the top-down approach, the building primitives need to be defined first. In this work, the wall and the roof objects are considered to be planar and rectangular. Although the data capture system applied can only collect the facade data in most cases, the gained wall point clouds sometimes contain partial sidewalls. These sidewalls are incomplete and thus redundant in general. The RANSAC algorithm [28] is applied to partitioning the wall and the roof objects. The RANSAC aims to find planes in the target point cloud, which has been used in building reconstruction [16]. A mechanism is developed to remove the redundant planes: the angles between the rough facade direction vector and the direction vectors inferred by the RANSAC for each detected plane are calculated, and only the plane having the smallest intersection angle will be kept. Following the redundancy-removal mechanism, the dimensions of the facade wall and roof are easily achieved by orthogonally projecting the detected planes onto a two-dimensional space following a bounding box strategy.
Windows and doors are distributed across the building envelope. Therefore, how to extract each of these objects and also measure their dimensions becomes a critical task. Here a reasonable assumption is made: all windows and doors have to be connected with the wall. Thus, by projecting the window and the roof point clouds onto the wall plane, the orthogonal shapes of these objects are obtained. A DBSCAN classifier [29] that can cluster data points by density is employed to partition the window and door object groups into individual objects. Then, in the same way as for the wall and roof, the dimensions can be measured.
The pipeline will be validated by manually measuring the building point cloud model. The manual measurement is conducted using the “measure function” in the 3D point cloud processing software package CloudCompare [30]. The function is able to measure the distance between two selected points. In the validation step, a building component is measured by selecting the corner points of an edge.

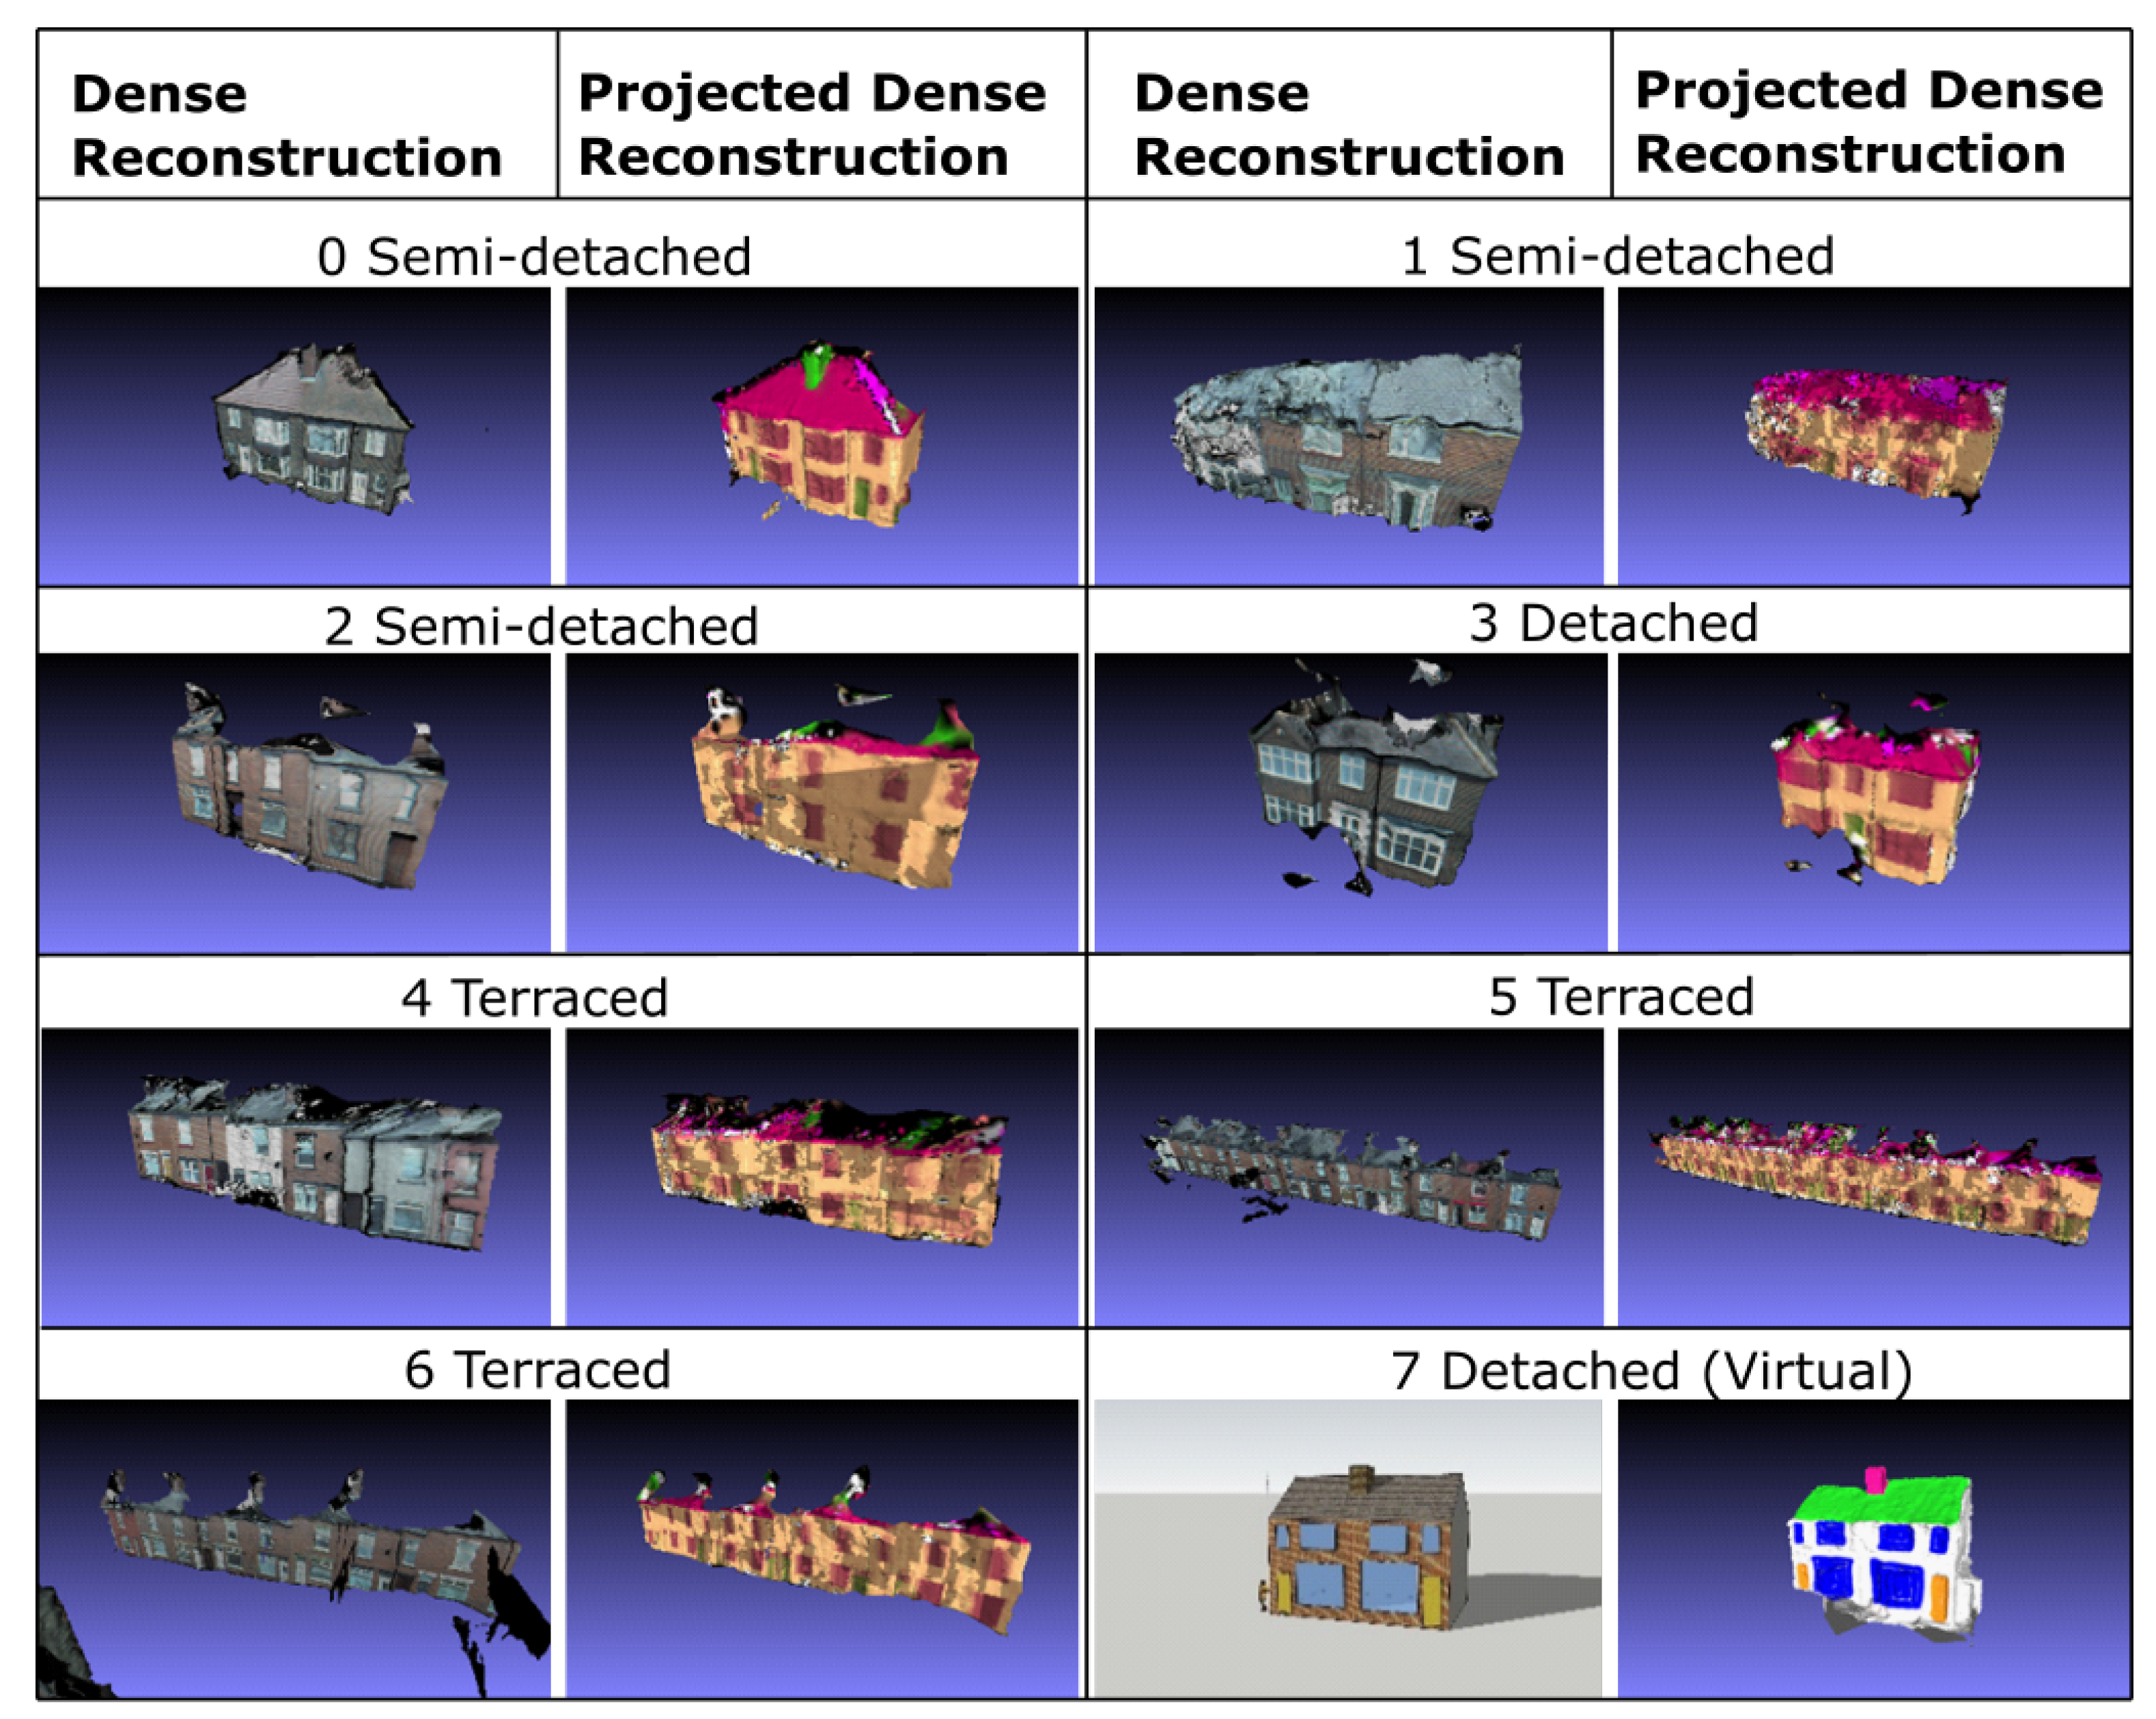
3. Experiments and Validation Results

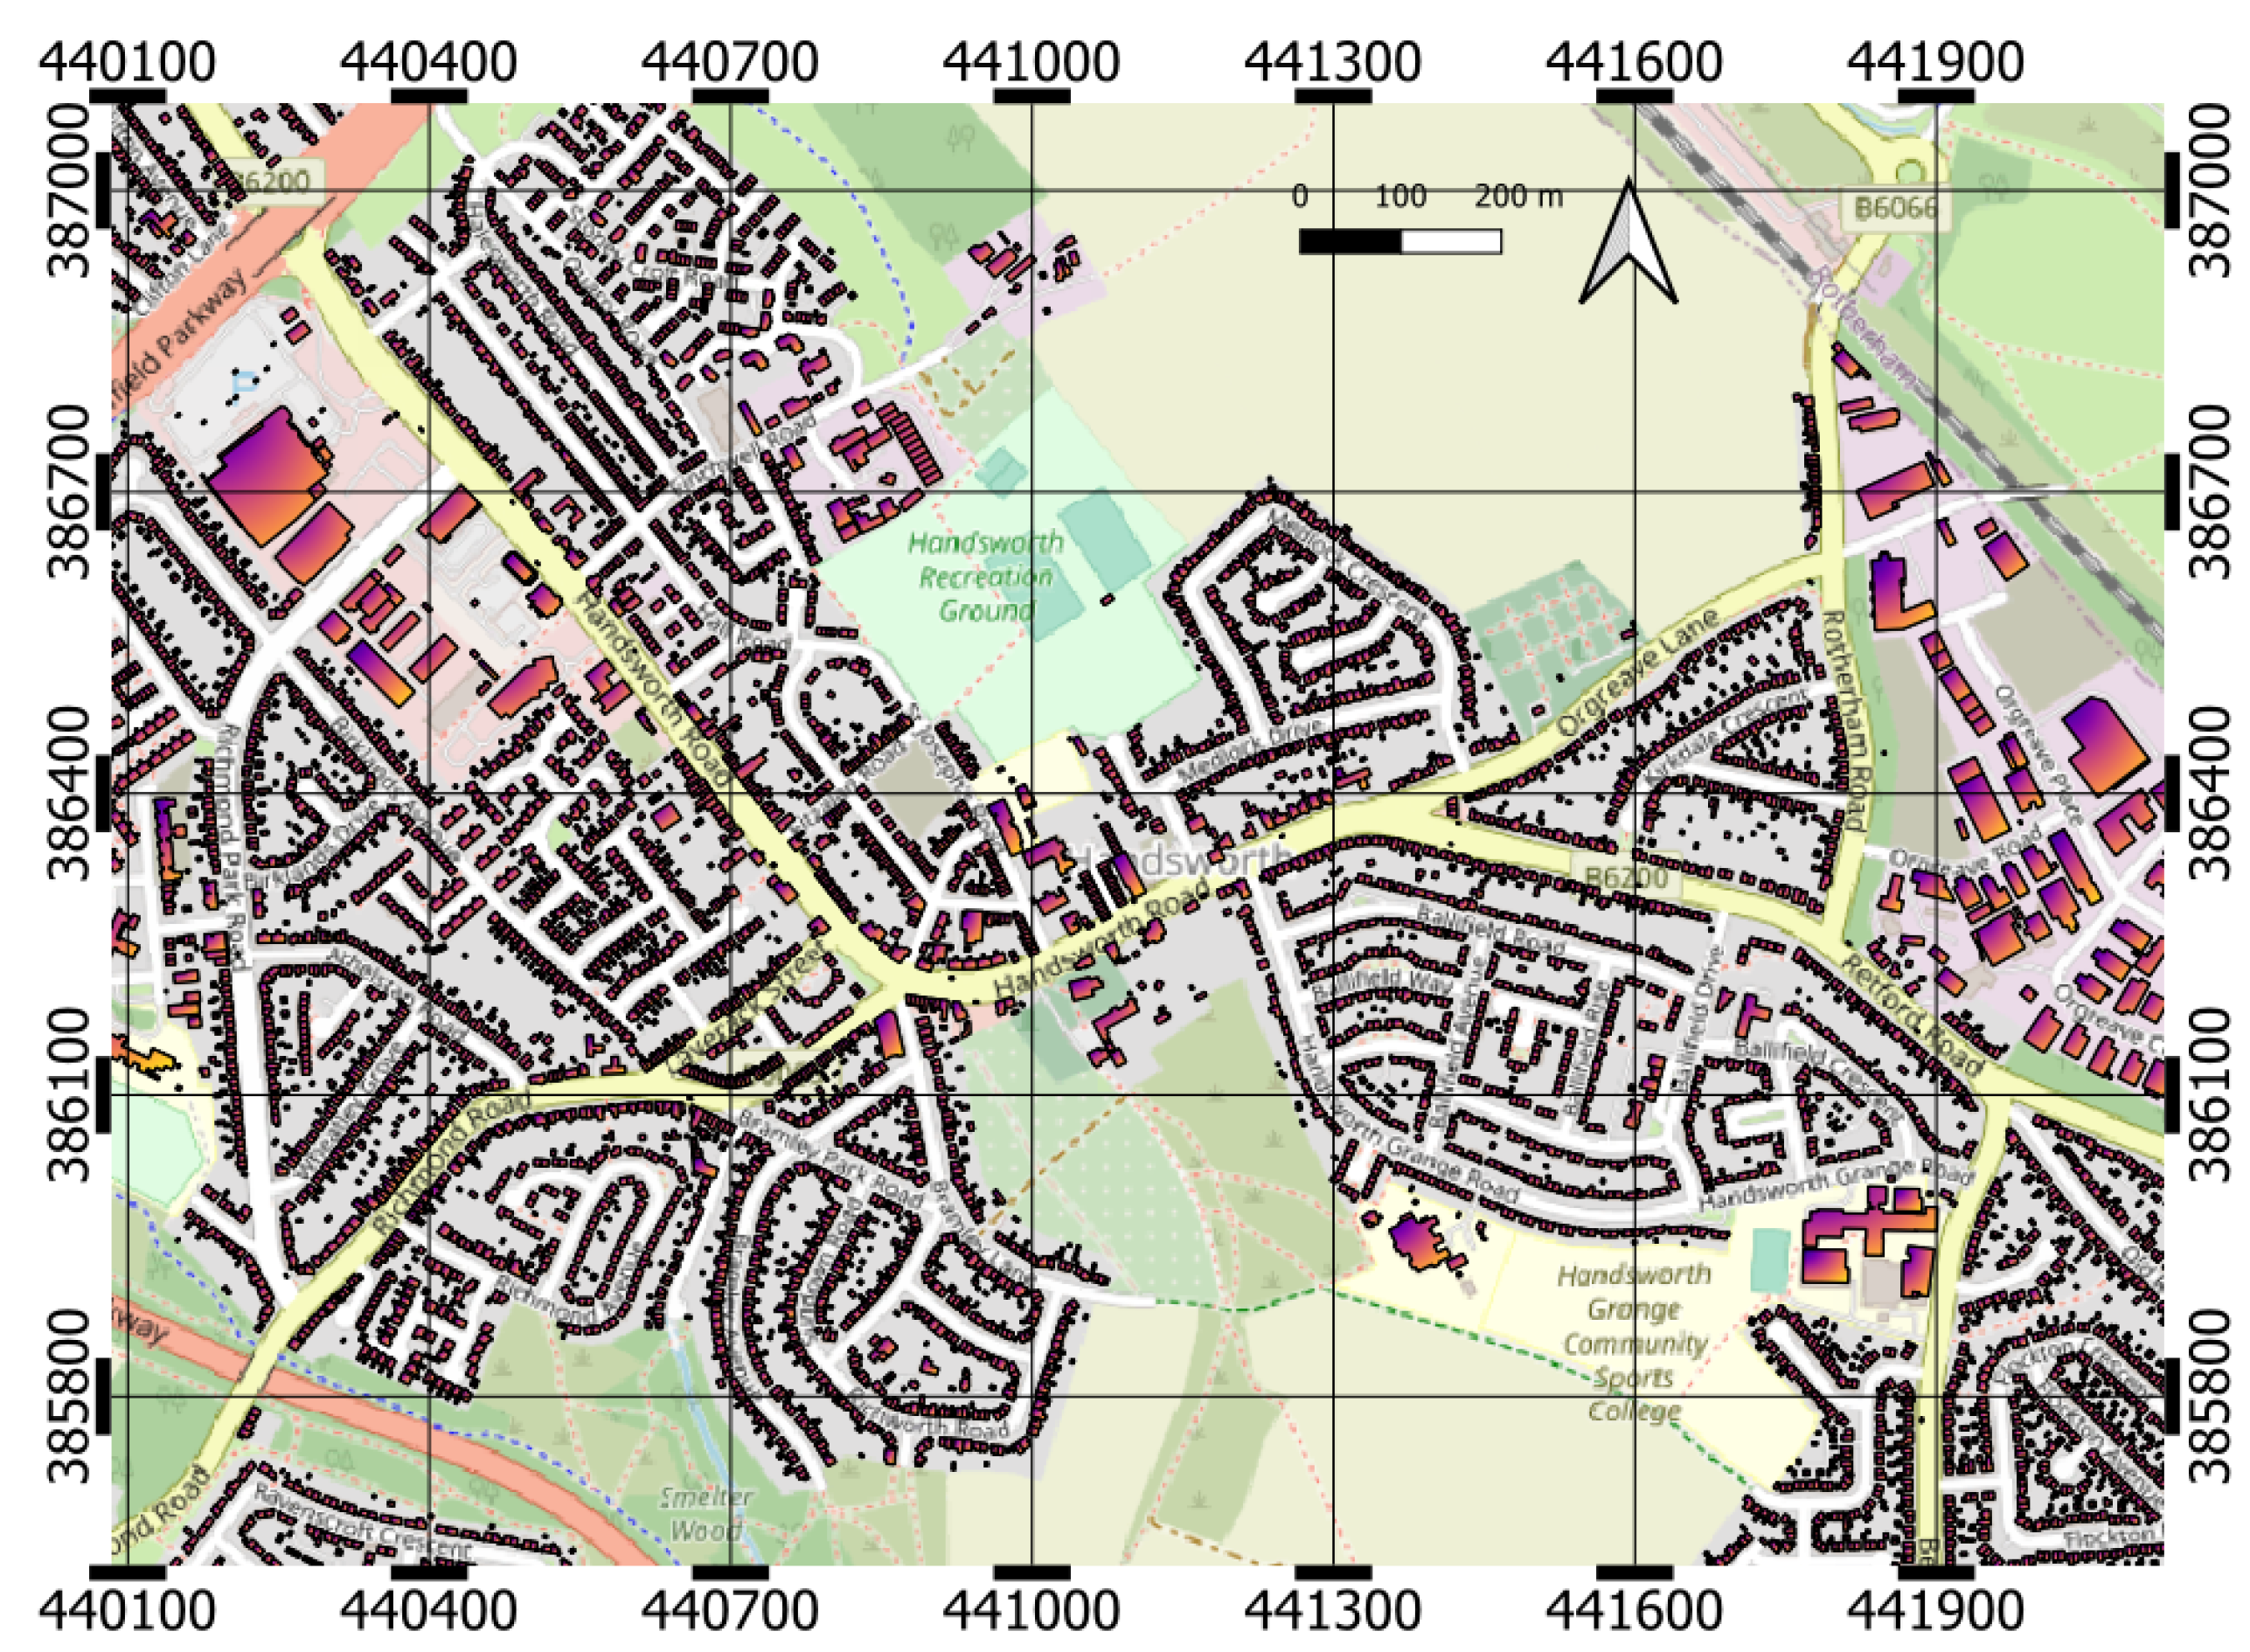
3.1. Experiments Setup and Dataset

In this investigation study, seven buildings’ street-view image data are selected from the dataset collected by the developed data-capturing system. The collected visual images are processed to build the labelled building point cloud models as introduced in Section 2.1. The seven sample building models include one detached, three semi-detached and three terraced houses. The three types of residential buildings are selected according to the European residential building typology database [31].
As illustrated in Figure 7, except for the sample 0 model, all other models fail at reconstructing the roof structure. In samples 1, 4 and 5, the windows are severely shadowed. Besides these, the labelled models all have a lot of noise and jagged boundaries. These problems will inevitably affect the performance of the developed building measurement pipeline. Thus to test the pipeline capability in perfectly labelled models, a virtual detached house model—model 7 in Figure 7—is manually built through the Blender software package [32]. The model is built by manually painting a colourless building point cloud.
Seven metrics are selected to evaluate the pipeline performance, which are the wall height, wall length, wall depth, roof pitch, area of the roof, area of the wall and the window-to-wall ratio. These metrics are all significant in building energy modelling. Table 1 shows the formulae used for each metric. The wall height, the wall length and the roof pitch are directly measured by the pipeline. The building depth is calculated by assuming the building is symmetrical by the building’s lateral axis, in which the θ is the roof pitch. The area of the roof is the area of the facade roof multiplied by two, and the area of the wall is the total envelope wall area. The window-to-wall ratio is the whole window area over the wall area. The symmetrical hypothesis is also applied to these metrics.

3.2. Results

Table 2 shows the results of the developed building measurement pipeline. The difference values are calculated by the difference between the automatic measured result and the manually measured result over the manually measured result. In models 2, 4, 5 and 6, the roof structure fails reconstruction, and thus, the depth, roof pitch and roof area values cannot be achieved. In these models, instead of calculating the envelope wall area, the facade wall area is applied, and the WWR is the facade WWR. Sample 0 is the hipped roof; therefore, calculating the roof area uses the hipped roof function.
The first three semi-detached models achieve promising results in all metrics excluding the WWR. Considering the manual measurement errors, the developed pipeline can accurately measure the building dimensions of the semi-detached buildings. Sample 0 has a less accurate roof area prediction; one of the reasons is the manual roof area is calculated by the hipped roof area function. As indicated in Equation (2), the area of a gabled roof is larger than the area of a hipped roof when they have the same roof pitch and roof width. It is noted that model 1 has a fairly inaccurate WWR measurement; this is because of the severe window shadowing problem. Sample 2 also has the window shadowing problem but is less severe.
The sample 3 model, a detached building, has a less accurate wall height measurement. This is because this model has an attic that leads to a protrusion that is higher than the upper roof boundary, but the pipeline has still measured it as the upper limit of the wall. The problem also leads to larger errors in the wall area and the WWR measurements. Samples 4, 5 and 6 all fail in the roof reconstruction, which gives no results in the roof-related metrics. Window shadowing leads to high errors in WWR in samples 4 and 5. It is noted that sample 6 is captured on a slope, and the current pipeline does not have the capability to cope with complex terrains. Thus this leads to an inaccurate measurement of building height. Sample 7 is virtually constructed by manual labelling. This sample shows the pipeline works well in perfectly labelled models.
The average and the standard deviation of the difference values are also calculated in this quantitative analysis. The results show the pipeline has achieved a high-accuracy level performance across most of the metrics. Excluding WWR, the pipeline has achieved an average error and standard deviation of all metrics of less than 10%. For building height, it is slightly above 10%. Although the pipeline shows less accurate results in measuring wall height, it still maintains robustness to some extent: the pipeline has achieved highly accurate results in samples 1, 2, 5 and 7 and slightly less accurate results in samples 0 and 4. The two worst cases, samples 3 and 6, either have a unique facade or are captured on a slope, as previously stated. The WWR measurement is the weakness of the pipeline while it still achieved higher accuracies in higher-quality models. It is noted that once the constructed facade model has an explicit structure, as in sample 7, all parameters can be accurately measured, including WWR.

4. Discussion and Conclusions

4.1. Discussion and Future Work

In this study, we investigate the possibility of purely using visual image data captured by a vehicle-mounted data-capturing system for automatically measuring the building geometry for scalable energy analysis. An automatic building measurement pipeline is developed using a set of machine learning techniques, including K-means++, DBSCAN and RANSAC, and geometry operations, such as the orthogonal projection. Seven example models across the main three types of residential buildings are constructed. The pipeline has achieved promising results across the seven examples; the unsatisfactory results are more related to low-quality data sources, such as unconstructed roofs and shadowed windows. The pipeline works well with high-quality input data.
Besides the advanced compatibility and capability in characterising building geometry of different types of buildings and in various scenarios, the developed pipeline also shows competency in the data source and computational speed. Street-view style visual images are the only data type required for this approach. Although an advanced data-capturing system is adopted in this study, building visual images is widely available in many ways owing to the uptake of portable visual sensors such as mobile phone cameras and GoPros. In comparison with approaches using multi-source data types, the developed approach can be more conveniently applied.
The potential computational cost is considered when designing the pipeline. Reducing computational costs is crucial in scalable tasks. The pipeline is designed to be end-to-end. In this case, human intervention is avoided as much as possible. When determining applicable machine learning algorithms, heavy computational cost approaches, such as deep learning techniques, are avoided. The computational speed of the pipeline really depends on the size of the input building reconstruction model. For the eight building case studies, none of the cases exceeds one minute of proceeding time.
The developed pipeline has shown outstanding performance in modelling accuracy, data source requirement and computational speed. However, the pipeline still has some drawbacks, including:
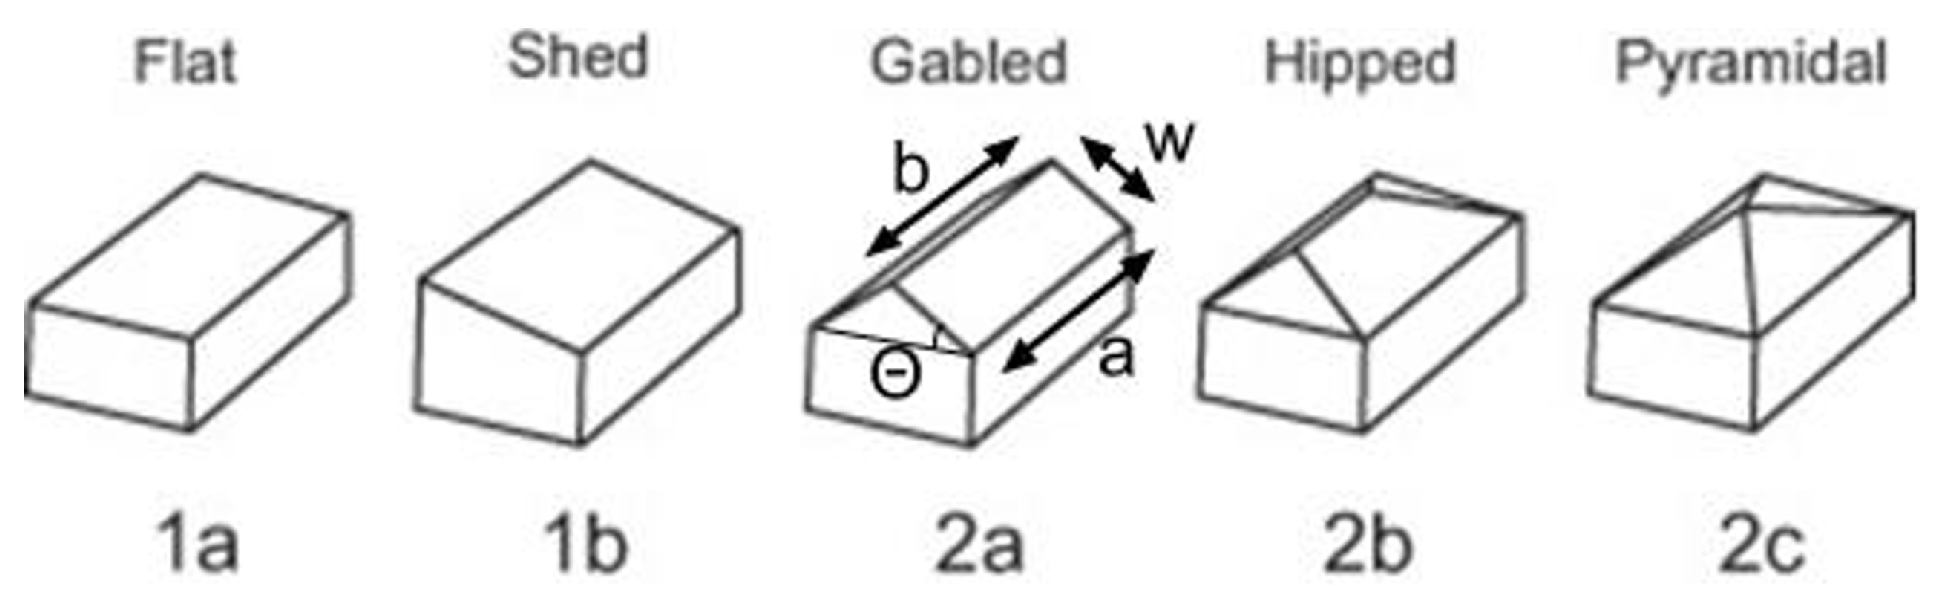
  • The building library is limited. At this stage, only the most common pitched roof building is considered. Although Equation (2) shows that the roof area differences among the different pitched roofs are not very distinct. In model 0, a 14 per cent error is still observed, which is larger than the 9% estimation. Besides that, model 3 has an attic, which leads to a distinct error in measuring the wall height. Therefore, the developed method is needed to expand the building library to facilitate more robust measurements across different types of buildings;
  • The complex terrain is another problem that affects the pipeline performance. If the building is built on a slope, the shape of the building would become rhomboid instead of rectangular. This will lead to a higher building height measurement. An improvement in how to cope with the complex terrains is also important;
  • In this study, all building models are assumed to have a transversal axis of symmetry as the vehicle-mounted data-capturing system can only collect the facade data. The assumption is reasonable in many cases but not adequate for many other cases. Therefore, developing a strategy that can make more accurate assumptions about the building structure is essential.
The future work of this study contains two facets: one is to refine the current pipeline to improve its robustness; another is to fit the building measurement pipeline into the proposed urban stock modelling framework [6]. For the first facet, the building library needs to be expanded to contain more different types of facade walls and roofs. The current algorithm uses the bounding box to measure the facade component dimensions. Therefore, the algorithm will meet large errors when the building is built on inclined terrains or the component has any protrusions. Therefore, instead of using the bounding box, the line fitting and edge detection-based algorithm [33,34] need to be developed to capture the object shape more precisely.
The developed approach fits the global target of the urban stock modelling framework [6]. The precise building dimensions can be incorporated with hyperspectral data to calculate building envelope material stocks. However, measuring the thermal gap [5] still requires developing thermal gap detection and measurement modules and approaches to fitting the pipeline with the thermal camera data.
Specifically, the developed approach can directly contribute toward scalable building energy modelling. The first step of building energy modelling is to collect building geometry data. However, the geometry data are not always available and currently heavily rely upon on-site surveys in the industry, which requires heavy labour and financial cost. In industry, there currently emerge services using collected urban environmental remote sensing data to measure building geometry, such as Spotr.ai [35]. However, how to automatically characterise and quantify building geometry is still challenging. The developed method realises a highly efficient and automatic building measurement.

4.2. Conclusions

This study develops a novel building dimension measurement algorithm and tests it across typical residential building types. The developed approach is based on a series of geometry algorithms and unsupervised machine learning techniques. The study shows the developed approach has achieved satisfactory results in measuring the building dimensions from the point cloud model. Future work of this study will focus on improving its robustness. By incorporating the developed approach with the multi-spectral capture, such as hyperspectral data, the extracted geometry information can directly contribute to the automatic urban stock modelling.

Author Contributions

Conceptualisation, W.O.C.W. and M.D.; methodology, M.D. and W.O.C.W.; software, M.D.; validation, M.D.; formal analysis, M.D.; data curation, H.A. and W.O.C.W.; writing—original draft preparation, M.D.; writing—review and editing, M.D., W.O.C.W., H.A., D.D.T. and M.M.; visualisation, M.D.; supervision, W.O.C.W. and D.D.T.; project administration, W.O.C.W.; funding acquisition, D.D.T. and M.M. All authors have read and agreed to the published version of the manuscript.

Funding

W.W. was supported by EPSRC Grant EP/V012053/1 and by Towards Turing 2.0 under the EPSRC Grant EP/W037211/1 and The Alan Turing Institute.

Institutional Review Board Statement

Not applicable.

Informed Consent Statement

Not applicable.

Data Availability Statement

Not applicable.

Conflicts of Interest

The authors declare no conflict of interest.

References

  1. Arora, N.K.; Mishra, I. United Nations Sustainable Development Goals 2030 and environmental sustainability: Race against time. Environ. Sustain. 2019, 2, 339–342. [Google Scholar] [CrossRef] [Green Version]
  2. Department for Business, Energy & Industrial Strategy, U.G. Final UK Greenhouse Gas Emissions National Statistics: 1990 to 2019 Summary; Technical Report; UK Government: London, UK, 2020.
  3. Department for Business, Energy & Industrial Strategy, U.G. UK Energy in Brief. In National Statistics; 2020; pp. 1–22. Available online: https://www.gov.uk/government/statistics/uk-energy-in-brief-2020 (accessed on 26 July 2022).
  4. Committee on Climate Change. UK Housing: Fit for the Future?—Climate Change Committee. Available online: https://www.theccc.org.uk/publication/uk-housing-fit-for-the-future/ (accessed on 26 July 2022).
  5. Dai, M.; Ward, W.O.; Meyers, G.; Densley Tingley, D.; Mayfield, M. Residential building facade segmentation in the urban environment. Build. Environ. 2021, 199, 107921. [Google Scholar] [CrossRef]
  6. Arbabi, H.; Lanau, M.; Li, X.; Meyers, G.; Dai, M.; Mayfield, M.; Densley Tingley, D. A scalable data collection, characterization, and accounting framework for urban material stocks. J. Ind. Ecol. 2021, 26, 58–71. [Google Scholar] [CrossRef]
  7. Huang, H.; Michelini, M.; Schmitz, M.; Roth, L.; Mayer, H. LOD3 BUILDING RECONSTRUCTION from MULTI-SOURCE IMAGES. In Proceedings of the International Archives of the Photogrammetry, Remote Sensing and Spatial Information Sciences—ISPRS Archives, Nice, France, 31 August–2 September 2020; Volume 43, pp. 427–434. [Google Scholar] [CrossRef]
  8. Cheng, L.; Gong, J.; Li, M.; Liu, Y. 3D building model reconstruction from multi-view aerial imagery and lidar data. Photogramm. Eng. Remote Sens. 2011, 77, 125–139. [Google Scholar] [CrossRef]
  9. Alidoost, F.; Arefi, H.; Tombari, F. 2D image-to-3D model: Knowledge-based 3D building reconstruction (3DBR) using single aerial images and convolutional neural networks (CNNs). Remote Sens. 2019, 11, 2219. [Google Scholar] [CrossRef] [Green Version]
  10. Yu, D.; Ji, S.; Liu, J.; Wei, S. Automatic 3D building reconstruction from multi-view aerial images with deep learning. ISPRS J. Photogramm. Remote Sens. 2021, 171, 155–170. [Google Scholar] [CrossRef]
  11. Crawley, D.B.; Lawrie, L.K.; Winkelmann, F.C.; Buhl, W.F.; Huang, Y.J.; Pedersen, C.O.; Strand, R.K.; Liesen, R.J.; Fisher, D.E.; Witte, M.J.; et al. EnergyPlus: Creating a new-generation building energy simulation program. Energy Build. 2001, 33, 319–331. [Google Scholar] [CrossRef]
  12. Lanau, M.; Liu, G.; Kral, U.; Wiedenhofer, D.; Keijzer, E.; Yu, C.; Ehlert, C. Taking stock of built environment stock studies: Progress and prospects. Environ. Sci. Technol. 2019, 53, 8499–8515. [Google Scholar] [CrossRef]
  13. Gröger, G.; Plümer, L. CityGML–Interoperable semantic 3D city models. ISPRS J. Photogramm. Remote Sens. 2012, 71, 12–33. [Google Scholar] [CrossRef]
  14. Biljecki, F.; Ledoux, H.; Stoter, J. An improved LOD specification for 3D building models. Comput. Environ. Urban Syst. 2016, 59, 25–37. [Google Scholar] [CrossRef] [Green Version]
  15. Shen, C.H.; Huang, S.S.; Fu, H.; Hu, S.M. Adaptive partitioning of urban facades. Acm Trans. Graph. TOG 2011, 30, 1–10. [Google Scholar] [CrossRef] [Green Version]
  16. Malihi, S.; Valadan Zoej, M.J.; Hahn, M.; Mokhtarzade, M.; Arefi, H. 3D Building Reconstruction Using Dense Photogrammetric Point Cloud. In Proceedings of the International Archives of the Photogrammetry, Remote Sensing and Spatial Information Sciences, Prague, Czech Republic, 12–19 July 2016; pp. 71–74. [Google Scholar] [CrossRef] [Green Version]
  17. Cao, J.; Metzmacher, H.; O’Donnell, J.; Frisch, J.; Bazjanac, V.; Kobbelt, L.; van Treeck, C. Facade geometry generation from low-resolution aerial photographs for building energy modeling. Build. Environ. 2017, 123, 601–624. [Google Scholar] [CrossRef]
  18. Huang, H.; Brenner, C.; Sester, M. A generative statistical approach to automatic 3D building roof reconstruction from laser scanning data. ISPRS J. Photogramm. Remote Sens. 2013, 79, 29–43. [Google Scholar] [CrossRef]
  19. Xiao, J.; Fang, T.; Tan, P.; Zhao, P.; Ofek, E.; Quan, L. Image-based façade modeling. In ACM SIGGRAPH Asia 2008 Papers, Proceedings of the SIGGRAPH Asia’08, Singapore, 10–13 December 2008; ACM: New York, NY, USA, 2008. [Google Scholar] [CrossRef] [Green Version]
  20. Xiao, J.; Fang, T.; Zhao, P.; Quan, L.; Lhuillier, M. Image-based Street-side City Modeling. ACM Trans. Graph. 2009, 28, 1–12. [Google Scholar] [CrossRef]
  21. Bai, Y.; Bajaj, J.; Beletic, J.W.; Farris, M.C.; Joshi, A.; Lauxtermann, S.; Petersen, A.; Williams, G. Teledyne imaging sensors: Silicon CMOS imaging technologies for x-ray, UV, visible, and near infrared. In Proceedings of the High Energy, Optical, and Infrared Detectors for Astronomy III, Marseille, France, 23–26 June 2008; SPIE: Bellingham, WA, USA, 2008; Volume 7021, pp. 29–44. [Google Scholar]
  22. Meyers, G.; Zhu, C.; Mayfield, M.; Tingley, D.D.; Willmott, J.; Coca, D. Designing a vehicle mounted high resolution multi-spectral 3d scanner: Concept design. In Proceedings of the 2nd Workshop on Data Acquisition to Analysis, New York, NY, USA, 10 November 2019; pp. 16–21. [Google Scholar]
  23. Chen, L.C.; Zhu, Y.; Papandreou, G.; Schroff, F.; Adam, H. Encoder-Decoder with Atrous Separable Convolution for Semantic Image Segmentation. 2018. Available online: http://xxx.lanl.gov/abs/1802.02611 (accessed on 26 July 2022).
  24. Mora, T.D.; Teso, L.; Carnieletto, L.; Zarrella, A.; Romagnoni, P. Comparative Analysis between Dynamic and Quasi-Steady-State Methods at an Urban Scale on a Social-Housing District in Venice. Energies 2021, 14, 5164. [Google Scholar] [CrossRef]
  25. Lingfors, D.; Bright, J.M.; Engerer, N.A.; Ahlberg, J.; Killinger, S.; Widén, J. Comparing the capability of low- and high-resolution LiDAR data with application to solar resource assessment, roof type classification and shading analysis. Appl. Energy 2017, 205, 1216–1230. [Google Scholar] [CrossRef]
  26. Gooding, J.; Crook, R.; Tomlin, A.S. Modelling of roof geometries from low-resolution LiDAR data for city-scale solar energy applications using a neighbouring buildings method. Appl. Energy 2015, 148, 93–104. [Google Scholar] [CrossRef] [Green Version]
  27. Arthur, D.; Vassilvitskii, S. K-means++: The advantages of careful seeding. In Proceedings of the Annual ACM-SIAM Symposium on Discrete Algorithms, SODA ’07, New Orleans, LA, USA, 7–9 January 2007; pp. 1027–1035. [Google Scholar]
  28. Fischler, M.A.; Bolles, R.C. Random sample consensus. Commun. ACM 1981, 24, 381–395. [Google Scholar] [CrossRef]
  29. Ester, M.; Kriegel, H.P.; Sander, J.; Xu, X. A Density-Based Algorithm for Discovering Clusters in Large Spatial Databases with Noise. In Proceedings of the 2nd International Conference on Knowledge Discovery and Data Mining, Munich, Germany, 2 August 1996; pp. 226–231. [Google Scholar]
  30. Girardeau-Montaut, D. CloudCompare. In Proceedings of the France: EDF R&D Telecom ParisTech, Stuttgart, Germany, 4–5 December 2019. [Google Scholar]
  31. Loga, T.; Stein, B.; Diefenbach, N. TABULA building typologies in 20 European countries—Making energy-related features of residential building stocks comparable. Energy Build. 2016, 132, 4–12. [Google Scholar] [CrossRef]
  32. Blender. Blender-a 3D Modelling and Rendering Package; Stichting Blender Foundation: Amsterdam, The Netherlands, 2020; Available online: http://www.blender.org (accessed on 26 July 2022).
  33. Monga, O.; Deriche, R.; Malandain, G.; Cocquerez, J.P. Recursive filtering and edge tracking: Two primary tools for 3D edge detection. Image Vis. Comput. 1991, 9, 203–214. [Google Scholar] [CrossRef]
  34. Yagüe-Fabra, J.A.; Ontiveros, S.; Jiménez, R.; Chitchian, S.; Tosello, G.; Carmignato, S. A 3D edge detection technique for surface extraction in computed tomography for dimensional metrology applications. CIRP Ann. 2013, 62, 531–534. [Google Scholar] [CrossRef]
  35. Spotr. Inspect Millions of Buildings in Seconds. 2022. Available online: https://www.spotr.ai/ (accessed on 26 July 2022).
Figure 1. The five levels of the LoD standard, from the leftmost 2.5D polygon LoD-0, to the rightmost complex 3D LoD-4, which also contains the interior structures. This figure is reprinted with permission from Ref. [14]. Copyright 2016, Elsevier.
Energies 15 06090 g001
Figure 2. A demonstration figure of the data-capturing system used in this paper, MARVEL. The left-hand side shows the equipped data capturing platform. The integrated rig is mounted on top of an electric van. The right-hand side shows a detailed view of the multi-spectral sensors. The camera is installed on top of the rig to provide an unobstructed view. More detailed technical information on the data collection platform and equipped sensors can be found in [22].
Energies 15 06090 g002
Figure 3. Map of the data capture area. This area is a typical suburb in northern England, which is located in Handsworth, Sheffield. A total of 5906 images are collected in this area and manually annotated to build the semantic segmentation dataset.
Energies 15 06090 g003
Figure 4. Demonstrations of qualitative semantic segmentation results on the Sheffield dataset. Building types include detached, terraced and semi-detached houses. (a) Semi-detached house, individual homes are recognised by the bush partition wall; (b) Detached house, a building without obvious signs of individual homes; (c) Terraced house, structurally integrated homes, individuals can be inferred by multiple doors; (d) Semi-detached house, individual homes are recognised by isolated doors.
Energies 15 06090 g004
Figure 5. The common roof template library. This figure is adapted with permission from Ref. [25] by adding extra annotations. Copyright 2017, Elsevier.
Energies 15 06090 g005
Figure 6. The scope and simple demonstration of the developed building measurement pipeline. The pipeline starts from the annotated point cloud model, which is achieved by texturing semantic masks to the colourless model. As texturing will lose colour uniformity, the K-means++ is first adopted to cluster points with similar colours. Then for larger objects, the RANSAC algorithm is applied to detect planes and then uses bounding boxes to measure their dimensions. For smaller objects, DBSCAN is used to separate individual objects. Prior to applying every algorithm, statistical noise removal is applied to clean the data.
Energies 15 06090 g006
Figure 7. The numbered building samples used in this study; the dense reconstruction is built by the multi-view stereo (MVS) algorithm as aforementioned; the projected dense reconstruction is the dense reconstruction model with semantic segmentation mask projected; all samples are numbered and marked with their building types.
Energies 15 06090 g007
Table 1. The pipeline evaluation metrics formulae sheet.
MetricBuilding DepthTotal Roof AreaTotal Wall AreaWindow-to-Wall-Ratio
Formula D b u i l d i n g = L r o o f × cos θ × 2 A r o o f = W r o o f × L r o o f × 2 A w a l l = ( W w a l l + L w a l l ) × H w a l l × 2 W W R = A w i n d o w × 2 A w a l l
Table 2. Quantitative evaluation of the developed automatic building measurement algorithm. H w a l l represents the total building height; θ represents the roof pitch angle; A r o o f and A w a l l are the total roof and the wall area, respectively; and WWR is the window-to-wall ratio.
TypeSource H wall (m) W wall (m)Depth (m) θ (Degree) A roof ( m 2 ) A wall ( m 2 ) WWR %
No.
0 Semi-detachedAutomatic4.809.656.1639.6277.18151.7823.18%
Manual4.309.656.1236.7767.69126.2120.87%
Difference%11.58%0%0.65%7.75%14.02%11.86%11.10%
1 Semi-detachedAutomatic4.6112.685.3334.4881.91166.0545.32%
Manual4.2013.445.8033.9885.59157.2522.85%
Difference%9.76%−5.66%0.95%1.47%−4.29%5.60%98.37%
2 Semi-detachedAutomatic9.8523.98None--236.2015.54%
Manual9.0324.48---221.1019.28%
Difference%−9.06%2.04%---−6.83%19.42%
3 DetachedAutomatic6.499.592.4253.0338.55155.8915.44%
Manual5.369.102.6158.5539.99125.5519.88%
Difference%21.08%5.34%7.21%9.43%3.60%24.16%-22.33%
4 TerracedAutomatic8.2128.98None--237.9336.75%
Manual7.3232.00---234.2421.80%
Difference%12.16%−9.44%---1.57%68.56%
5 TerracedAutomatic10.8194.77---1024.4628.28%
Manual10.0896.76---975.3417.38%
Difference%7.24%−2.06%---5.04%62.72%
6 TerracedAutomatic11.3749.29---560.4315.96%
Manual8.7257.20---498.7820.16%
Difference%30.39%13.83%---12.36%20.82%
7 Virtual-detachedAutomatic4.879.346.3434.9972.29152.7217.76%
Manual4.649.256.7231.5869.28148.2019.09%
Difference%4.96%0.97%−5.65%10.80%4.35%3.05%6.97%
Average11.01%0.63%3.62%7.36%4.42%7.10%33.20%
Standard Deviation10.80%6.59%2.87%3.57%6.49%8.58%37.03%
Publisher’s Note: MDPI stays neutral with regard to jurisdictional claims in published maps and institutional affiliations.

