
Real-Time Peak Valley Pricing Based Multi-Objective Optimal Scheduling of a Virtual Power Plant Considering Renewable Resources


Abstract
:1. Introduction
- (a)
- A VPP diminishes the need for the conventional generation to provide the provision of dynamic ancillary services.
- (b)
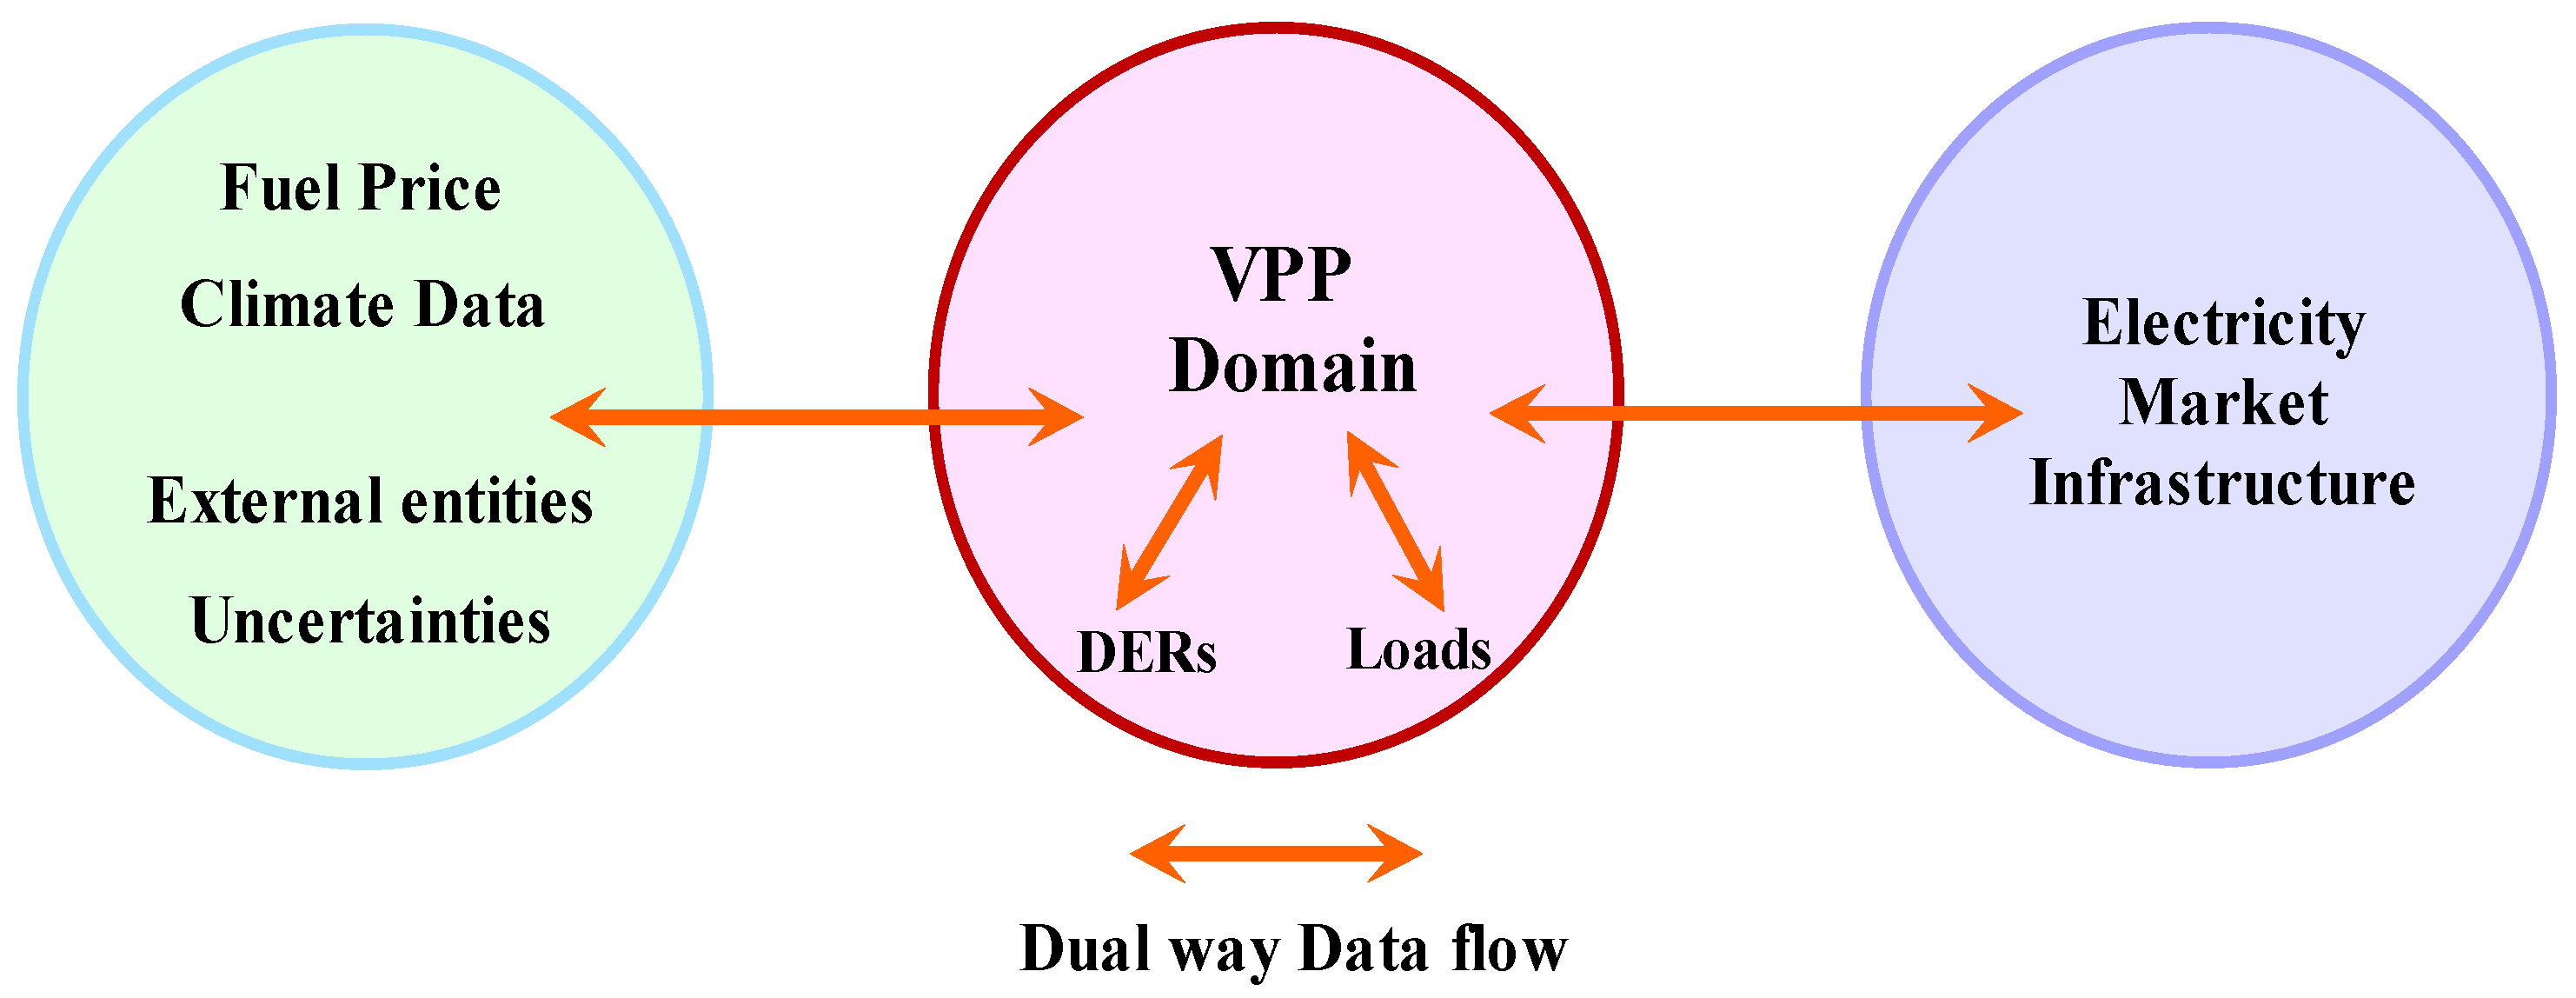
- It controls a cluster of heterogeneous renewable energy resources (RERs).
- (c)
- The intermittency and uncertainty caused by renewables such as solar and wind power, which are highly weather dependent, can be reduced to a certain extent.
- (d)
- It maintains favorable grid conditions for real-time management and supervision in emergencies.
- To ensure efficient management of the grid, sources such as fuel cells and CHP can be considered for optimal scheduling to reduce the cost of power generation along with emissions in a VPP system.
- To handle a non-convex problem such as VPP efficiently, advanced, and recently developed soft computing (SC) techniques can be implemented or modified by choosing related constraints.
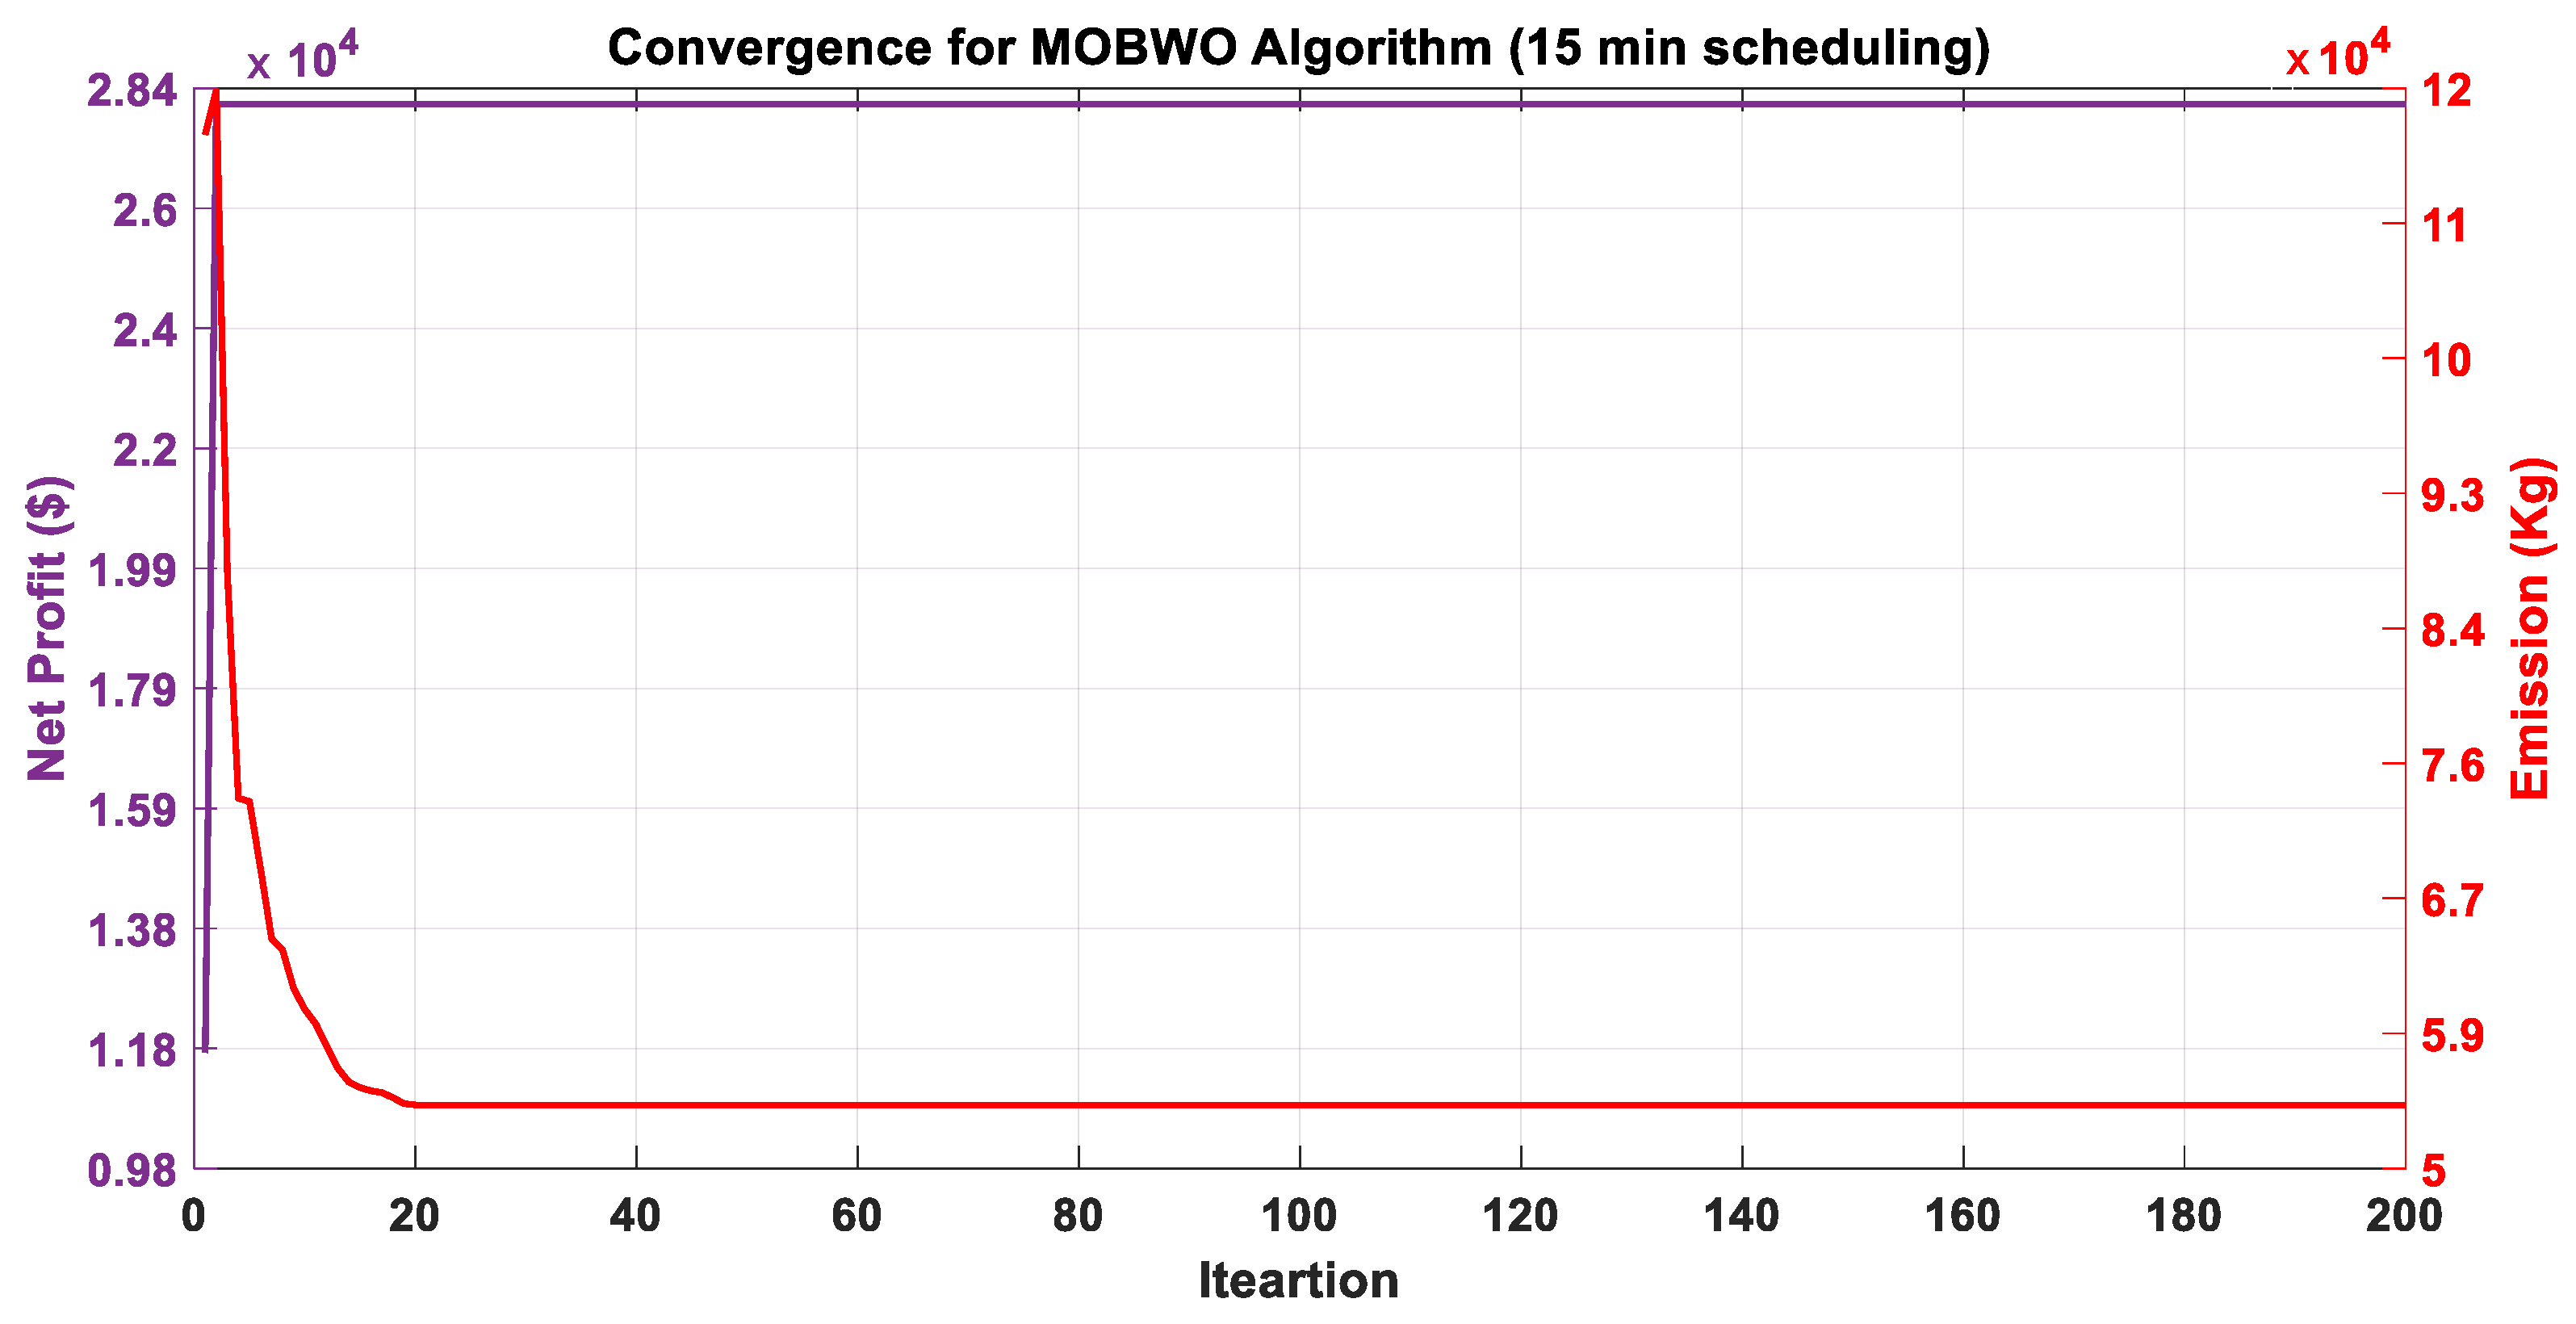
- To incentivize the participants, peak-valley pricing mechanisms with the incorporation of (15 min) interval scheduling is introduced and compared with day-ahead scheduling.
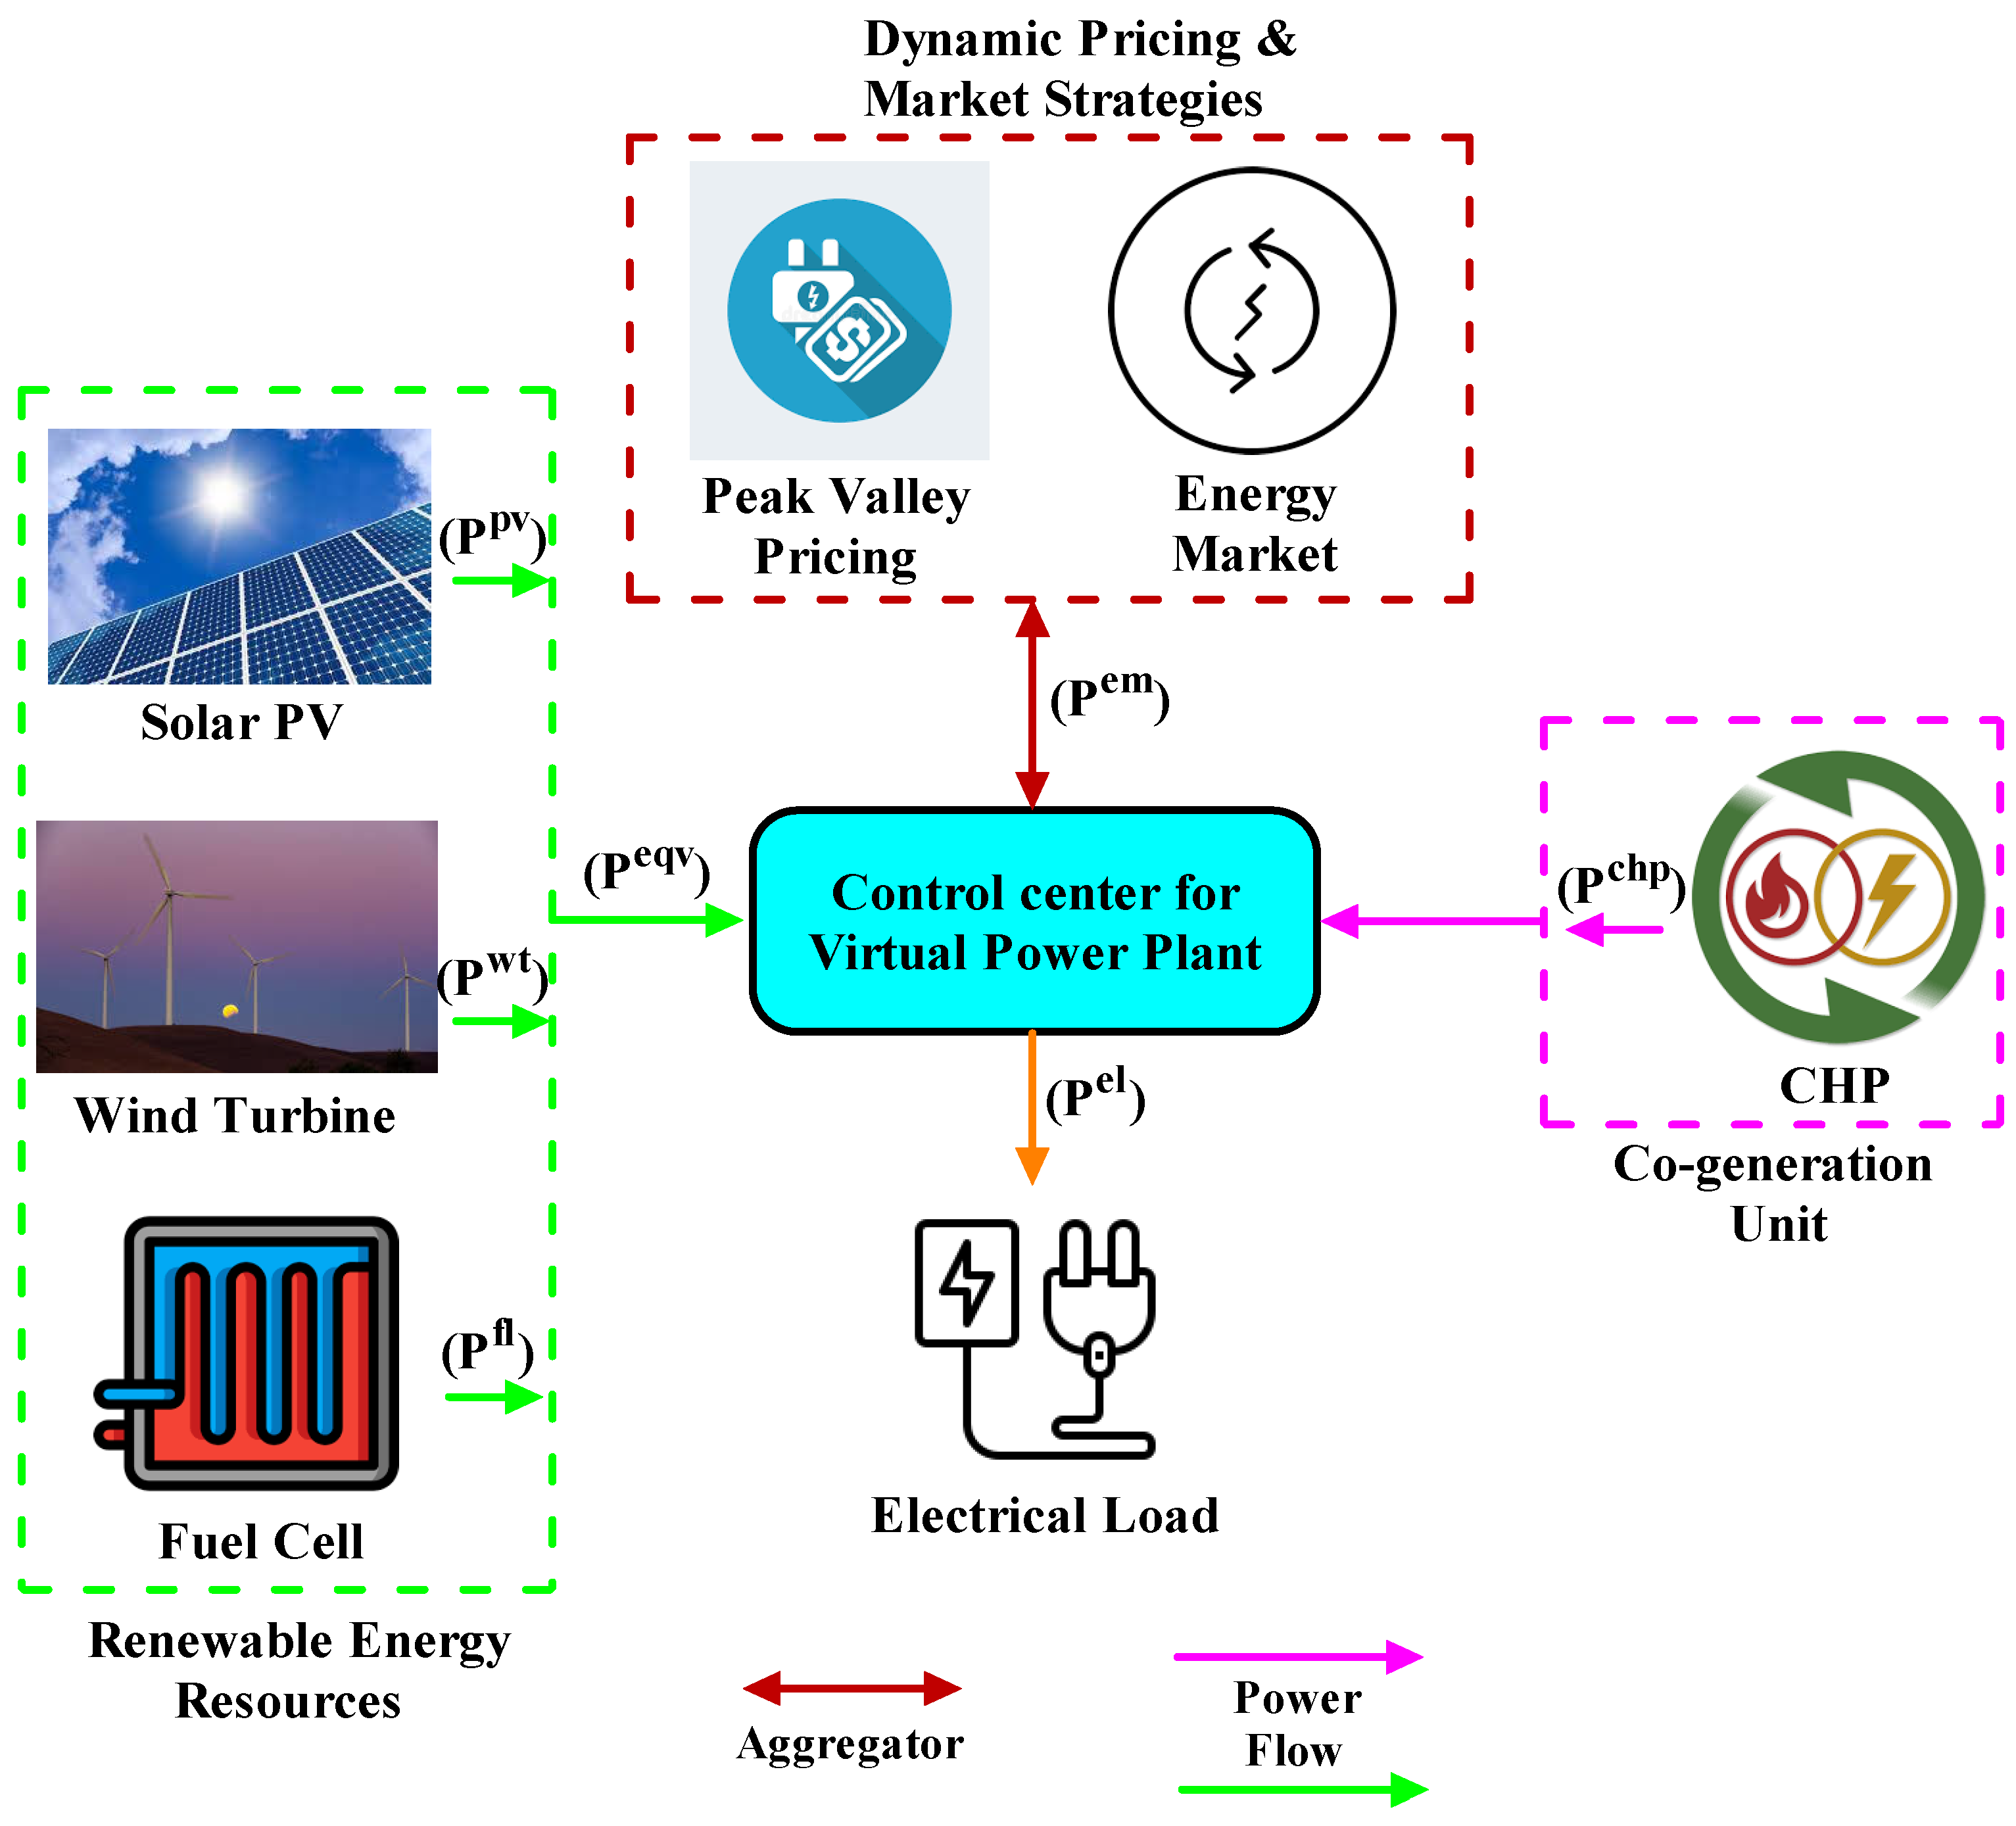
- One centrally controlled VPP system comprised of multiple resources including solar PV modules, WT, fuel cells, electric loads, heat-only units, and CHP units has been attempted to solve the multi-objective optimal scheduling problem.
- The multi-objective optimal scheduling of the VPP considering renewable resources has been solved using the weighting factor method to simultaneously maximize profit and minimize emissions.
- Peak valley’s power pricing strategy is introduced in the multi-objective optimal scheduling of the VPP problem.
- The new price-based multi-objective black widow optimization (MOBWO) is presented and implemented by considering constraint handling.
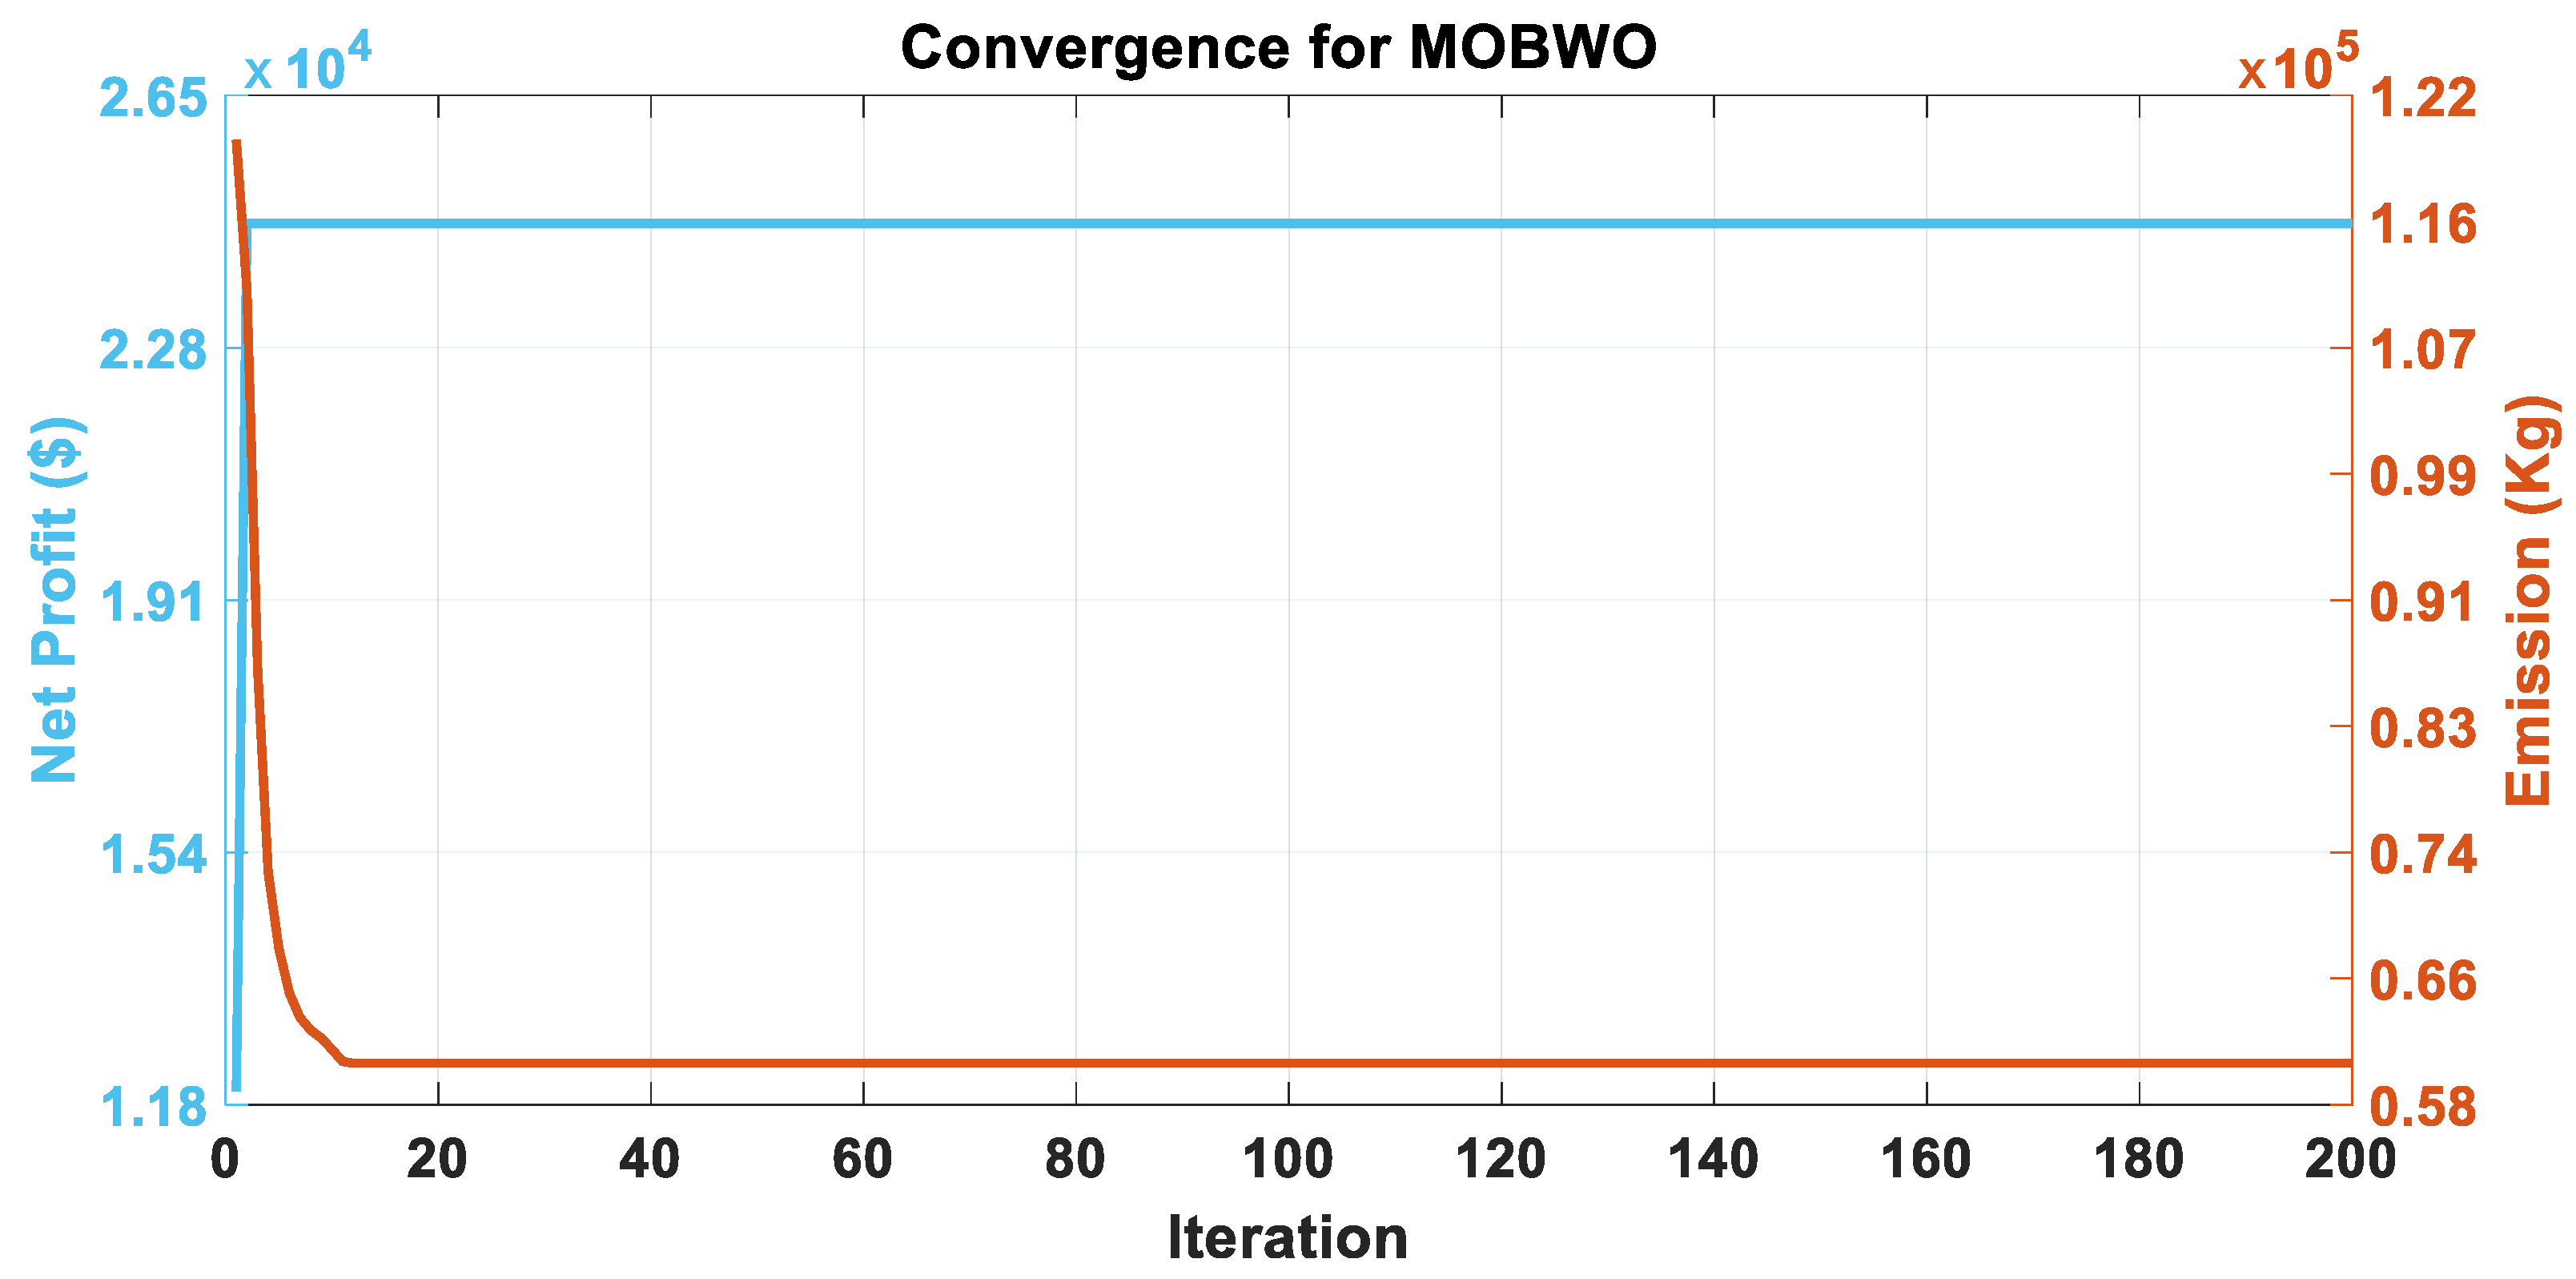
- Statistical analysis was performed for both single and multi-objective optimal scheduling of the VPP problems and quality solution sets were obtained from the MOBWO algorithm after 100 different independent trials.
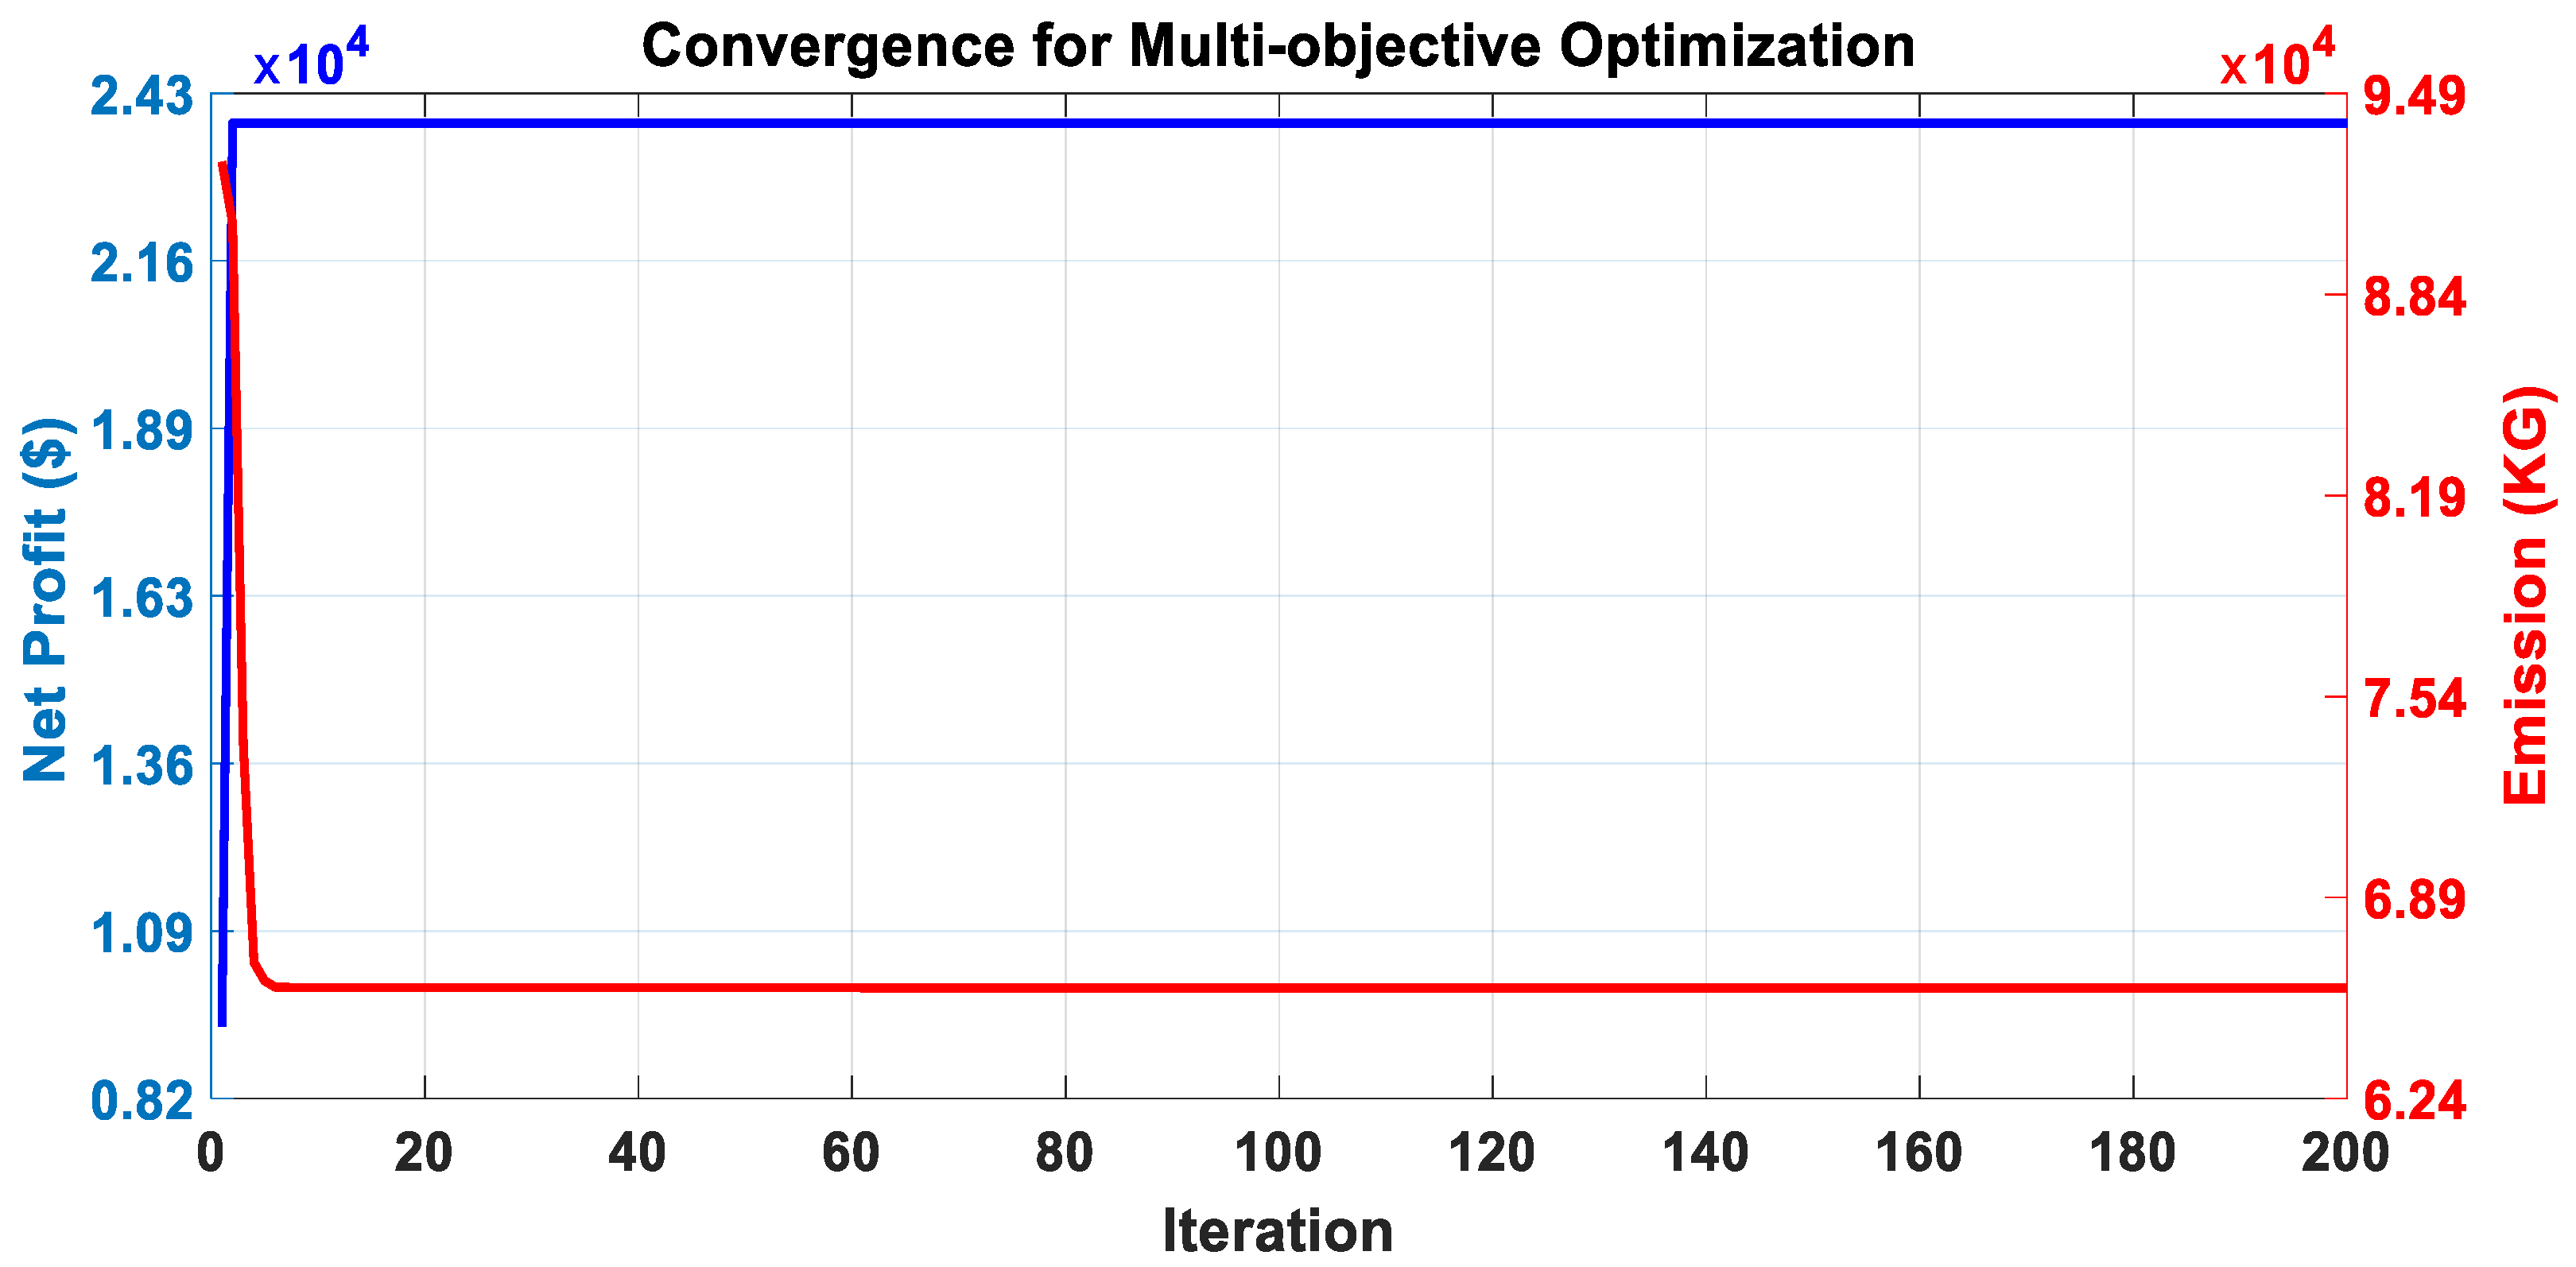
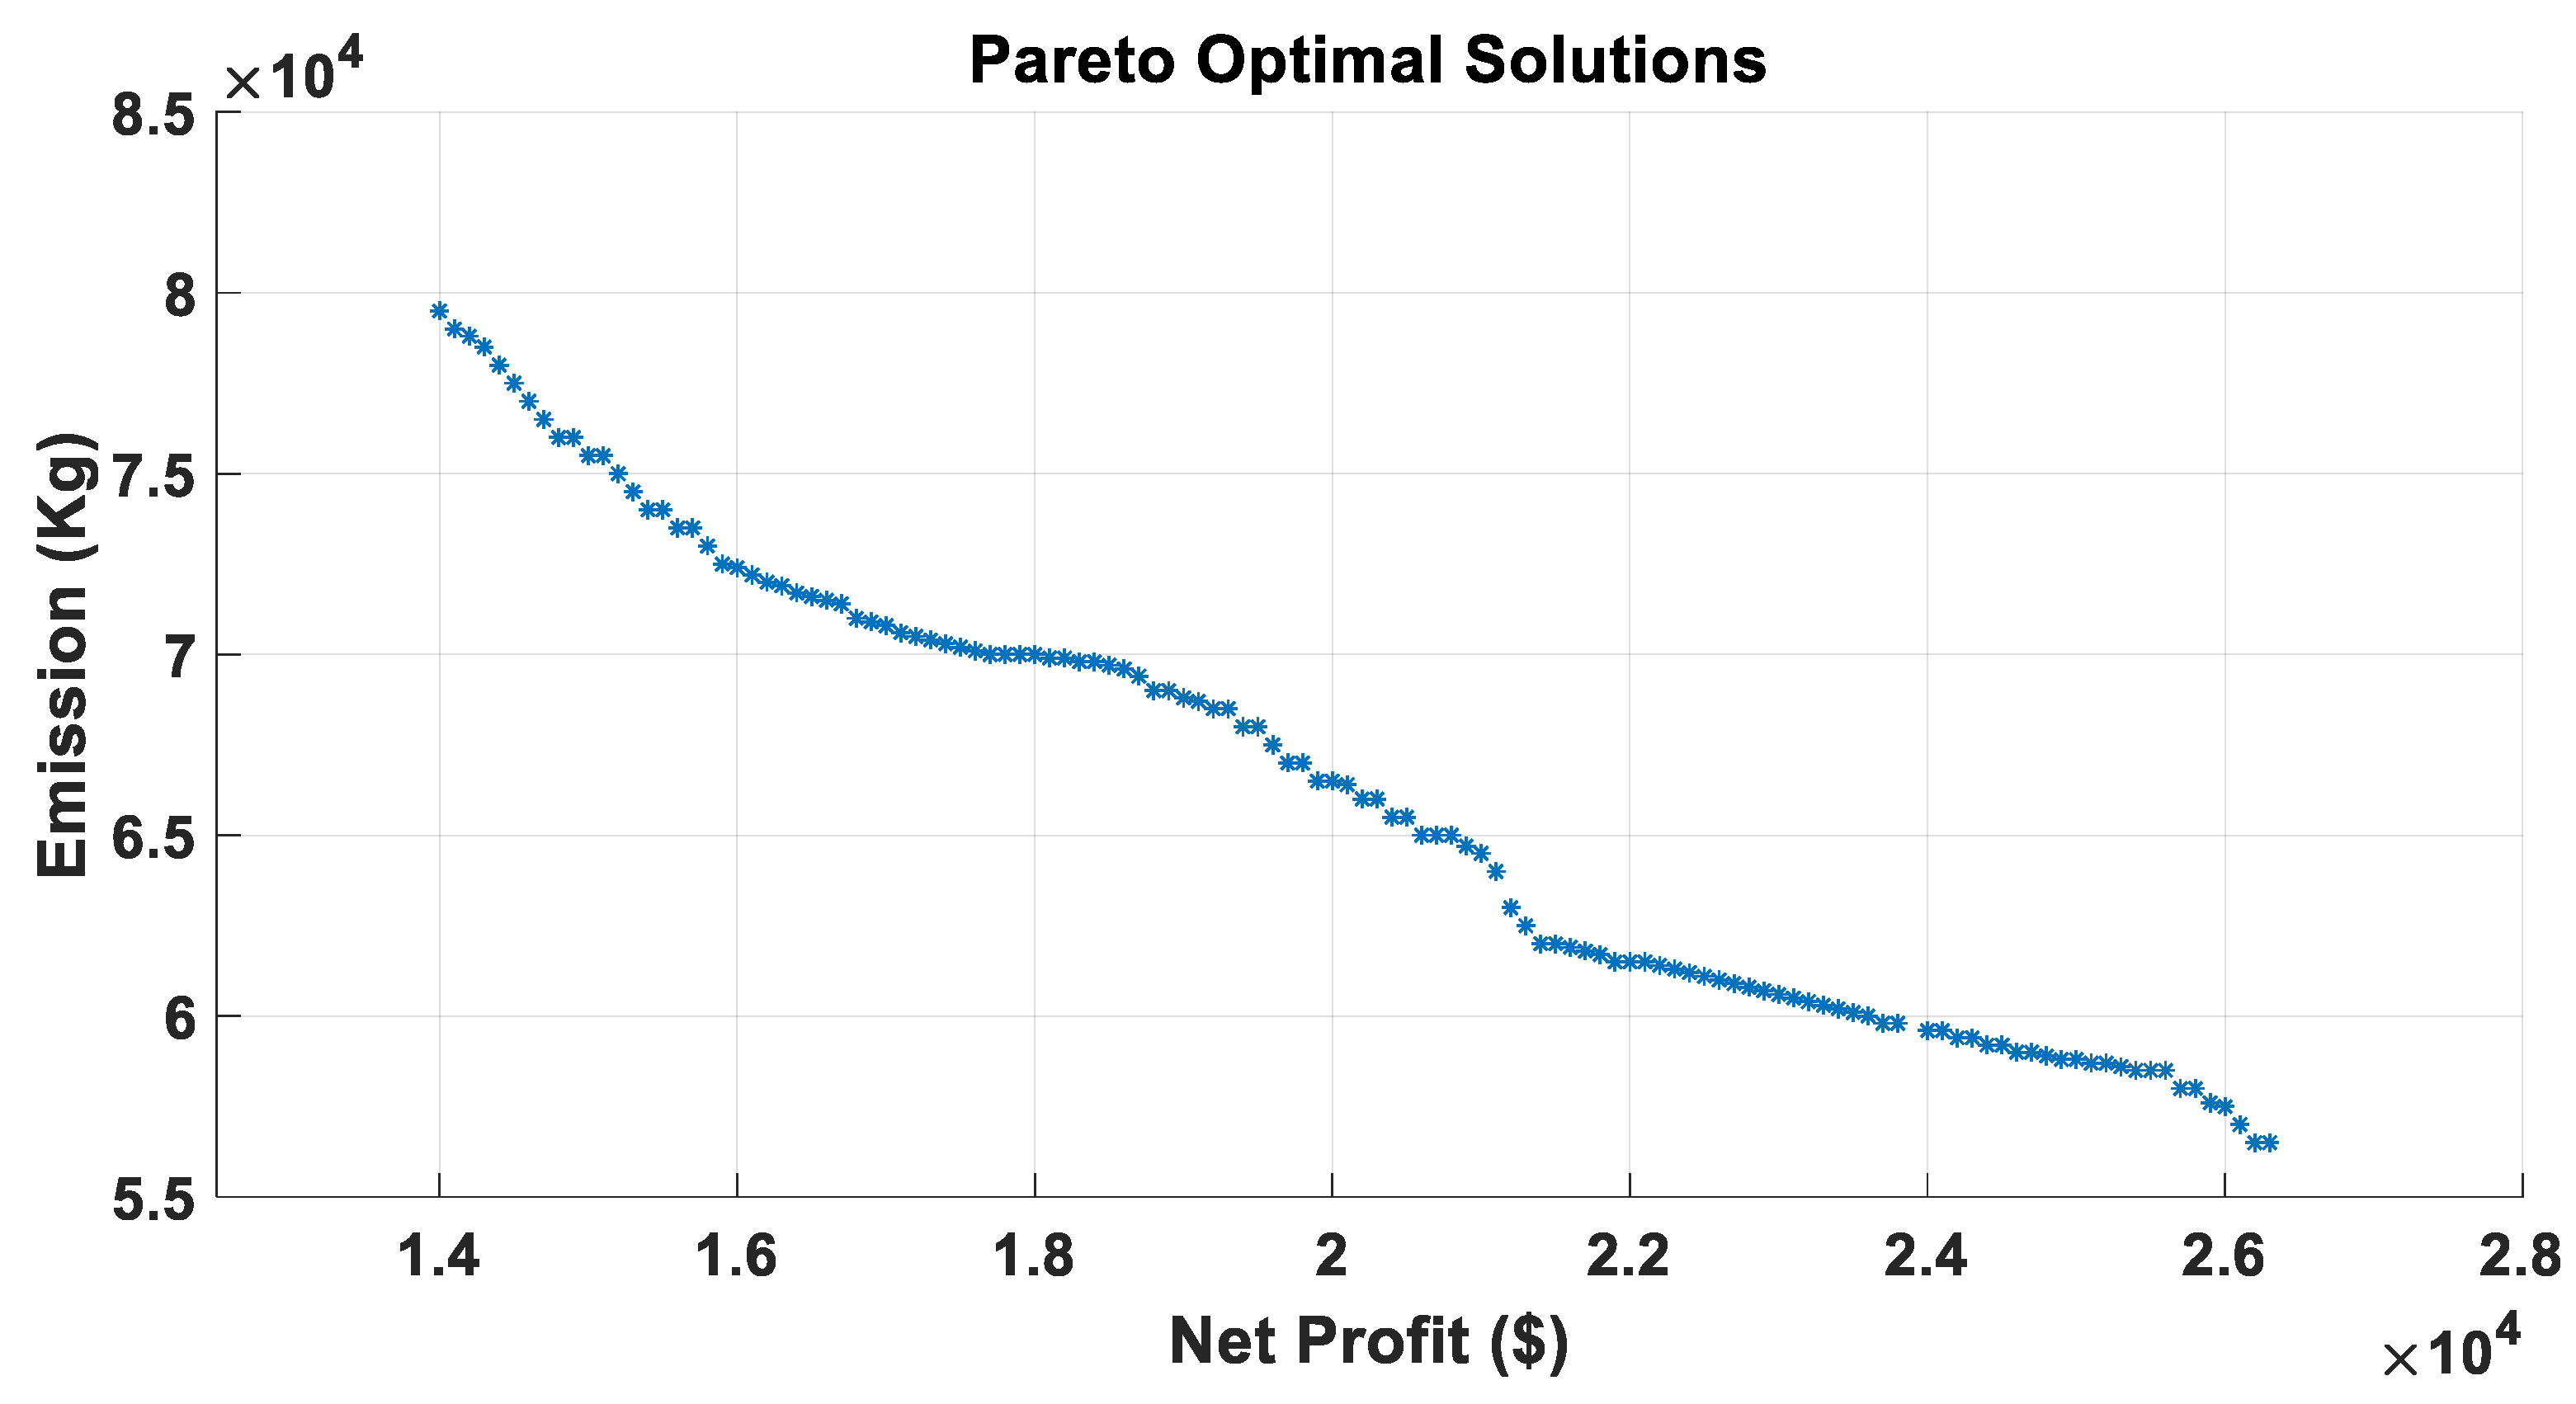
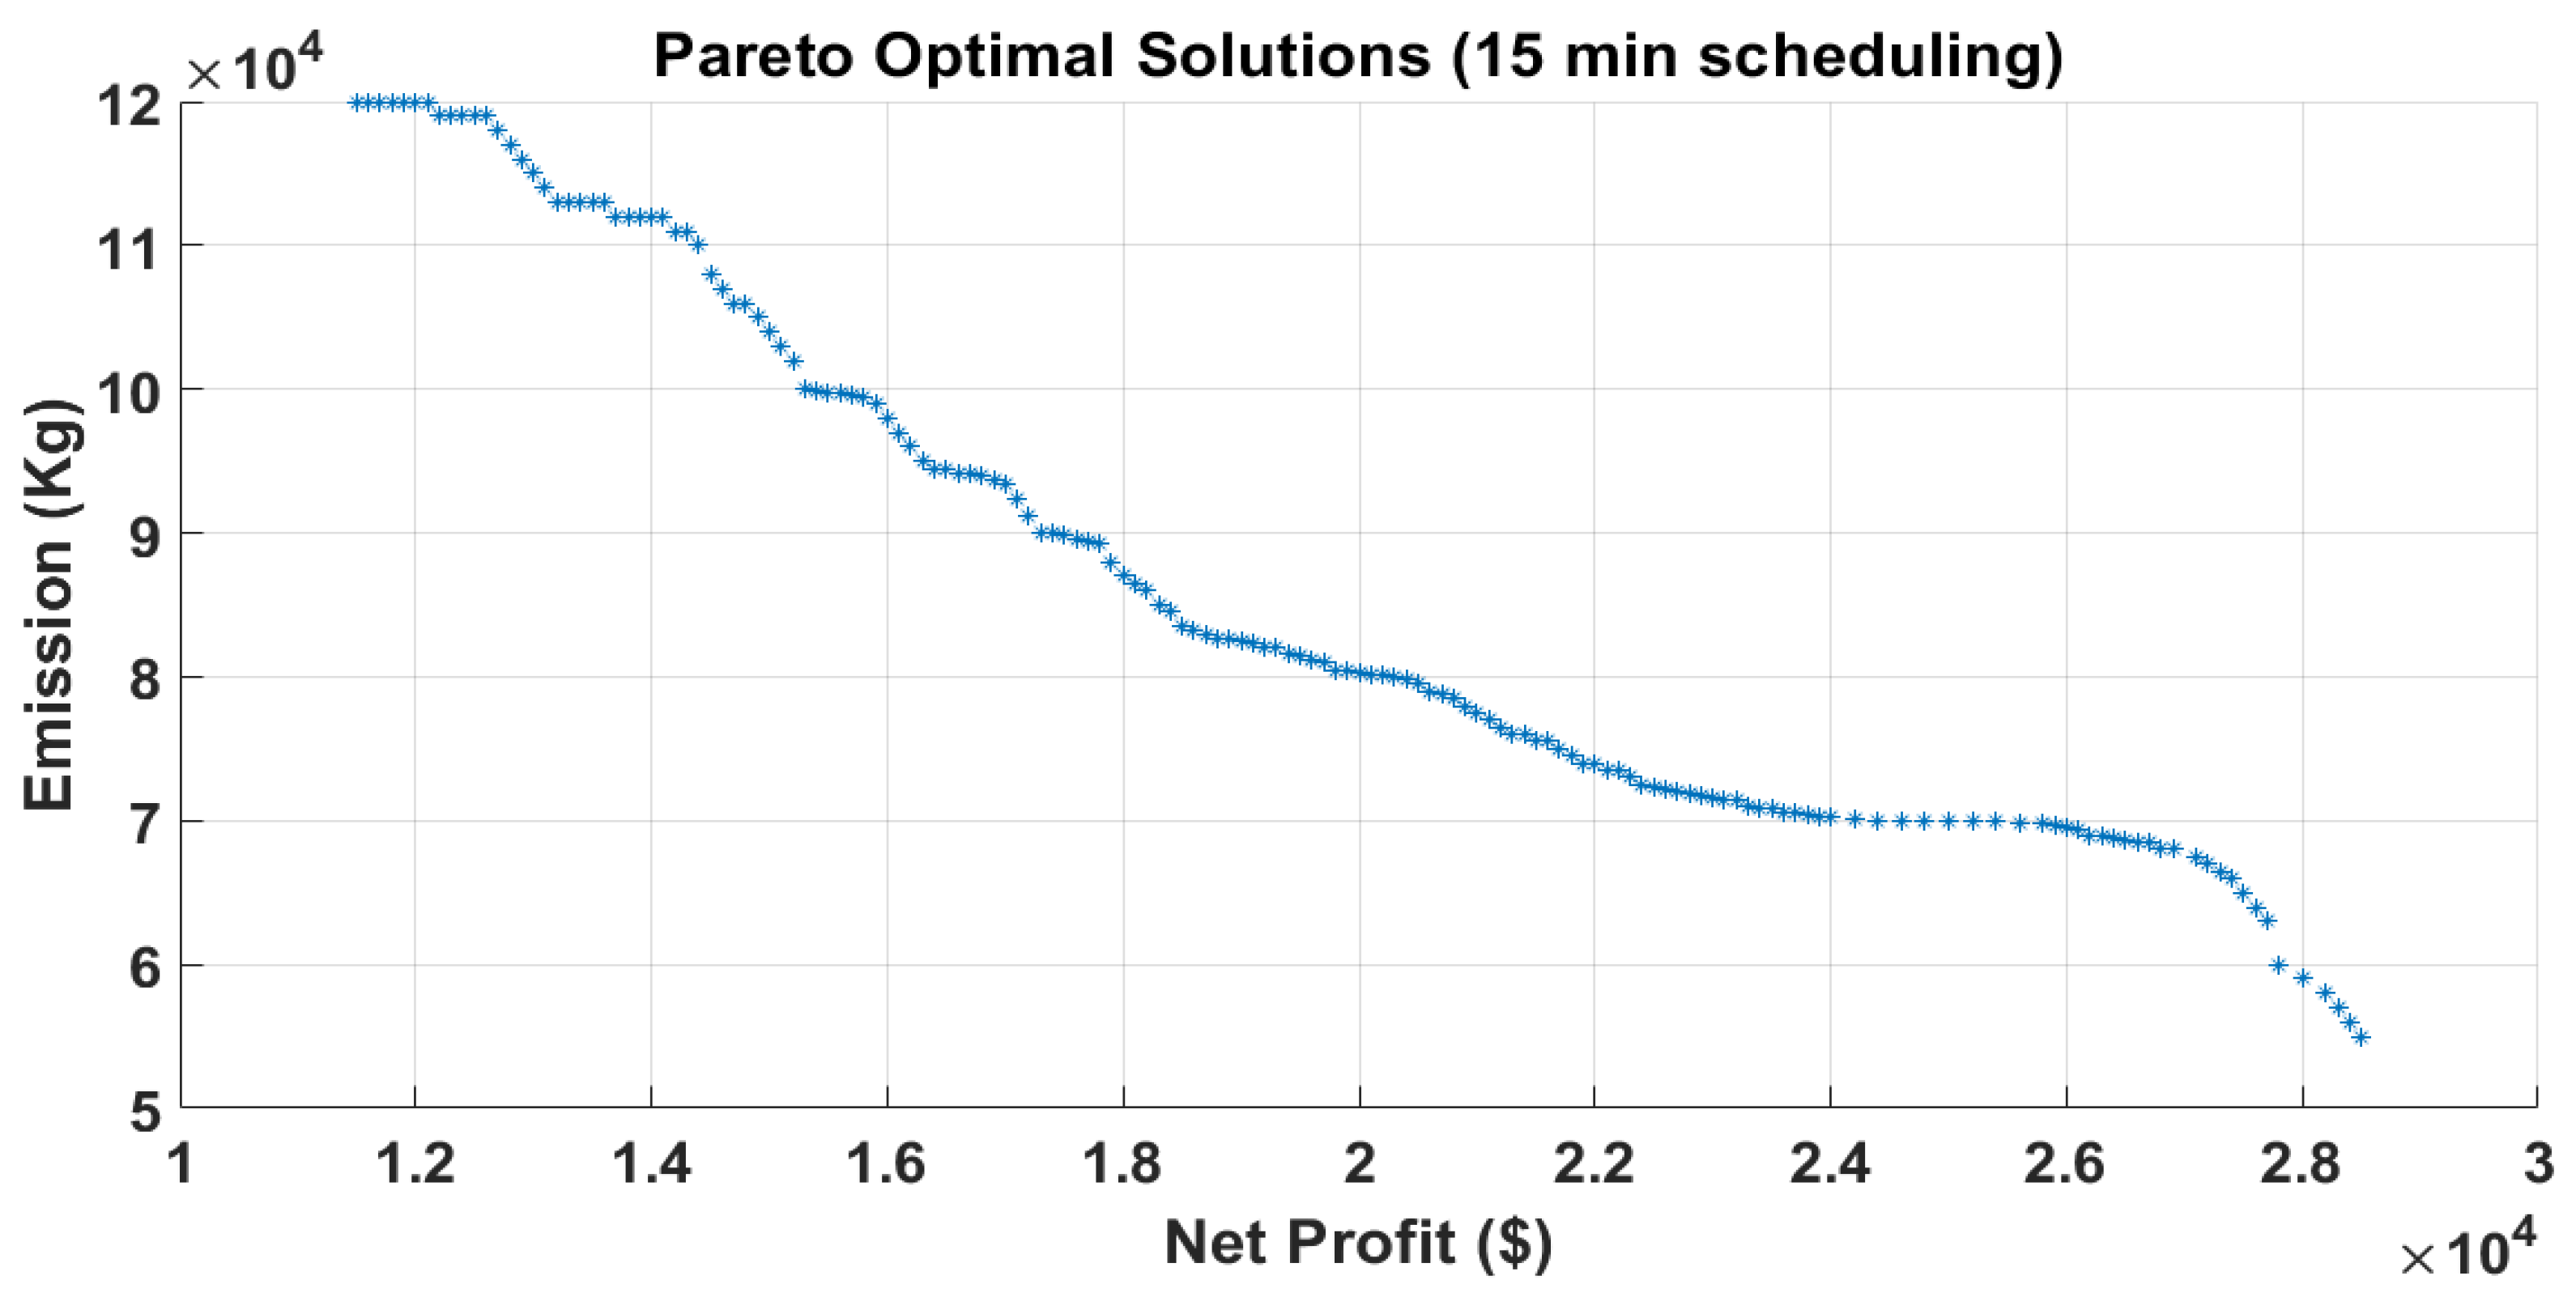
- Pareto optimal solutions were obtained specifically for multi-objective optimal scheduling of the VPP problem for the maximization of profit along with simultaneously minimizing the emissions for both scenarios I and II, respectively.
- Results obtained by the proposed MOBWO algorithm were also compared with the latest published works.
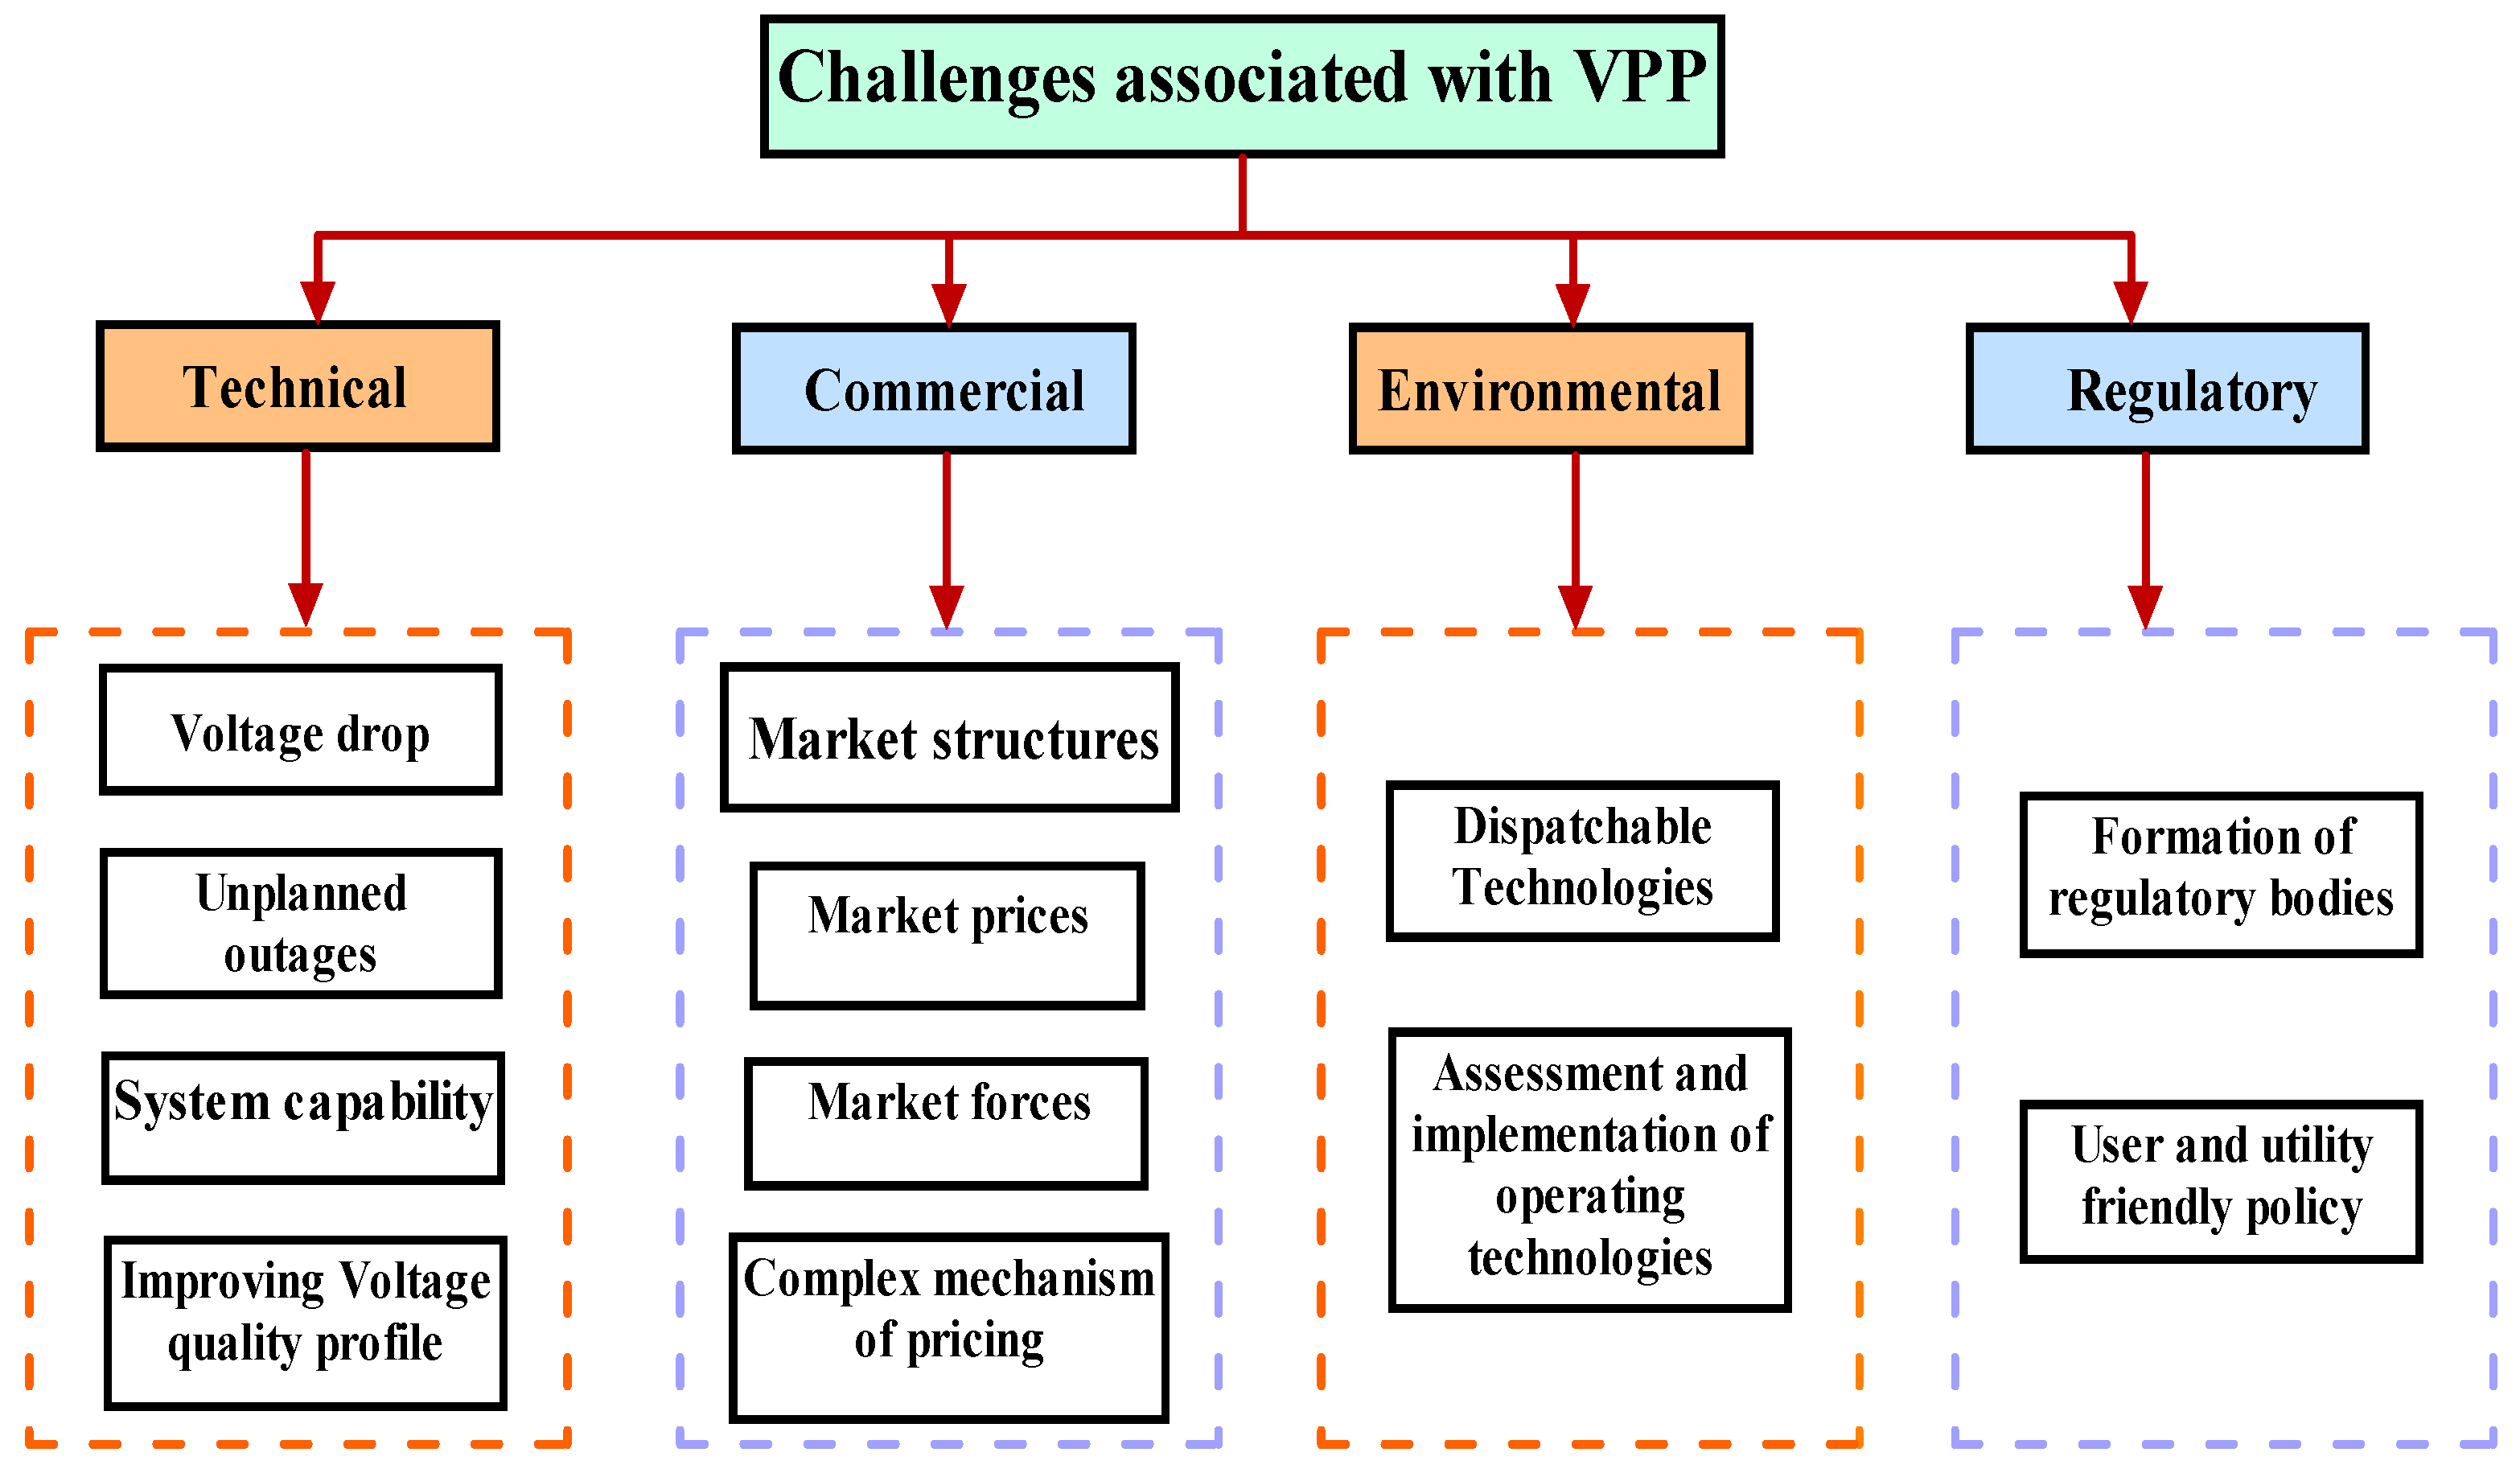
2. VPP Concept
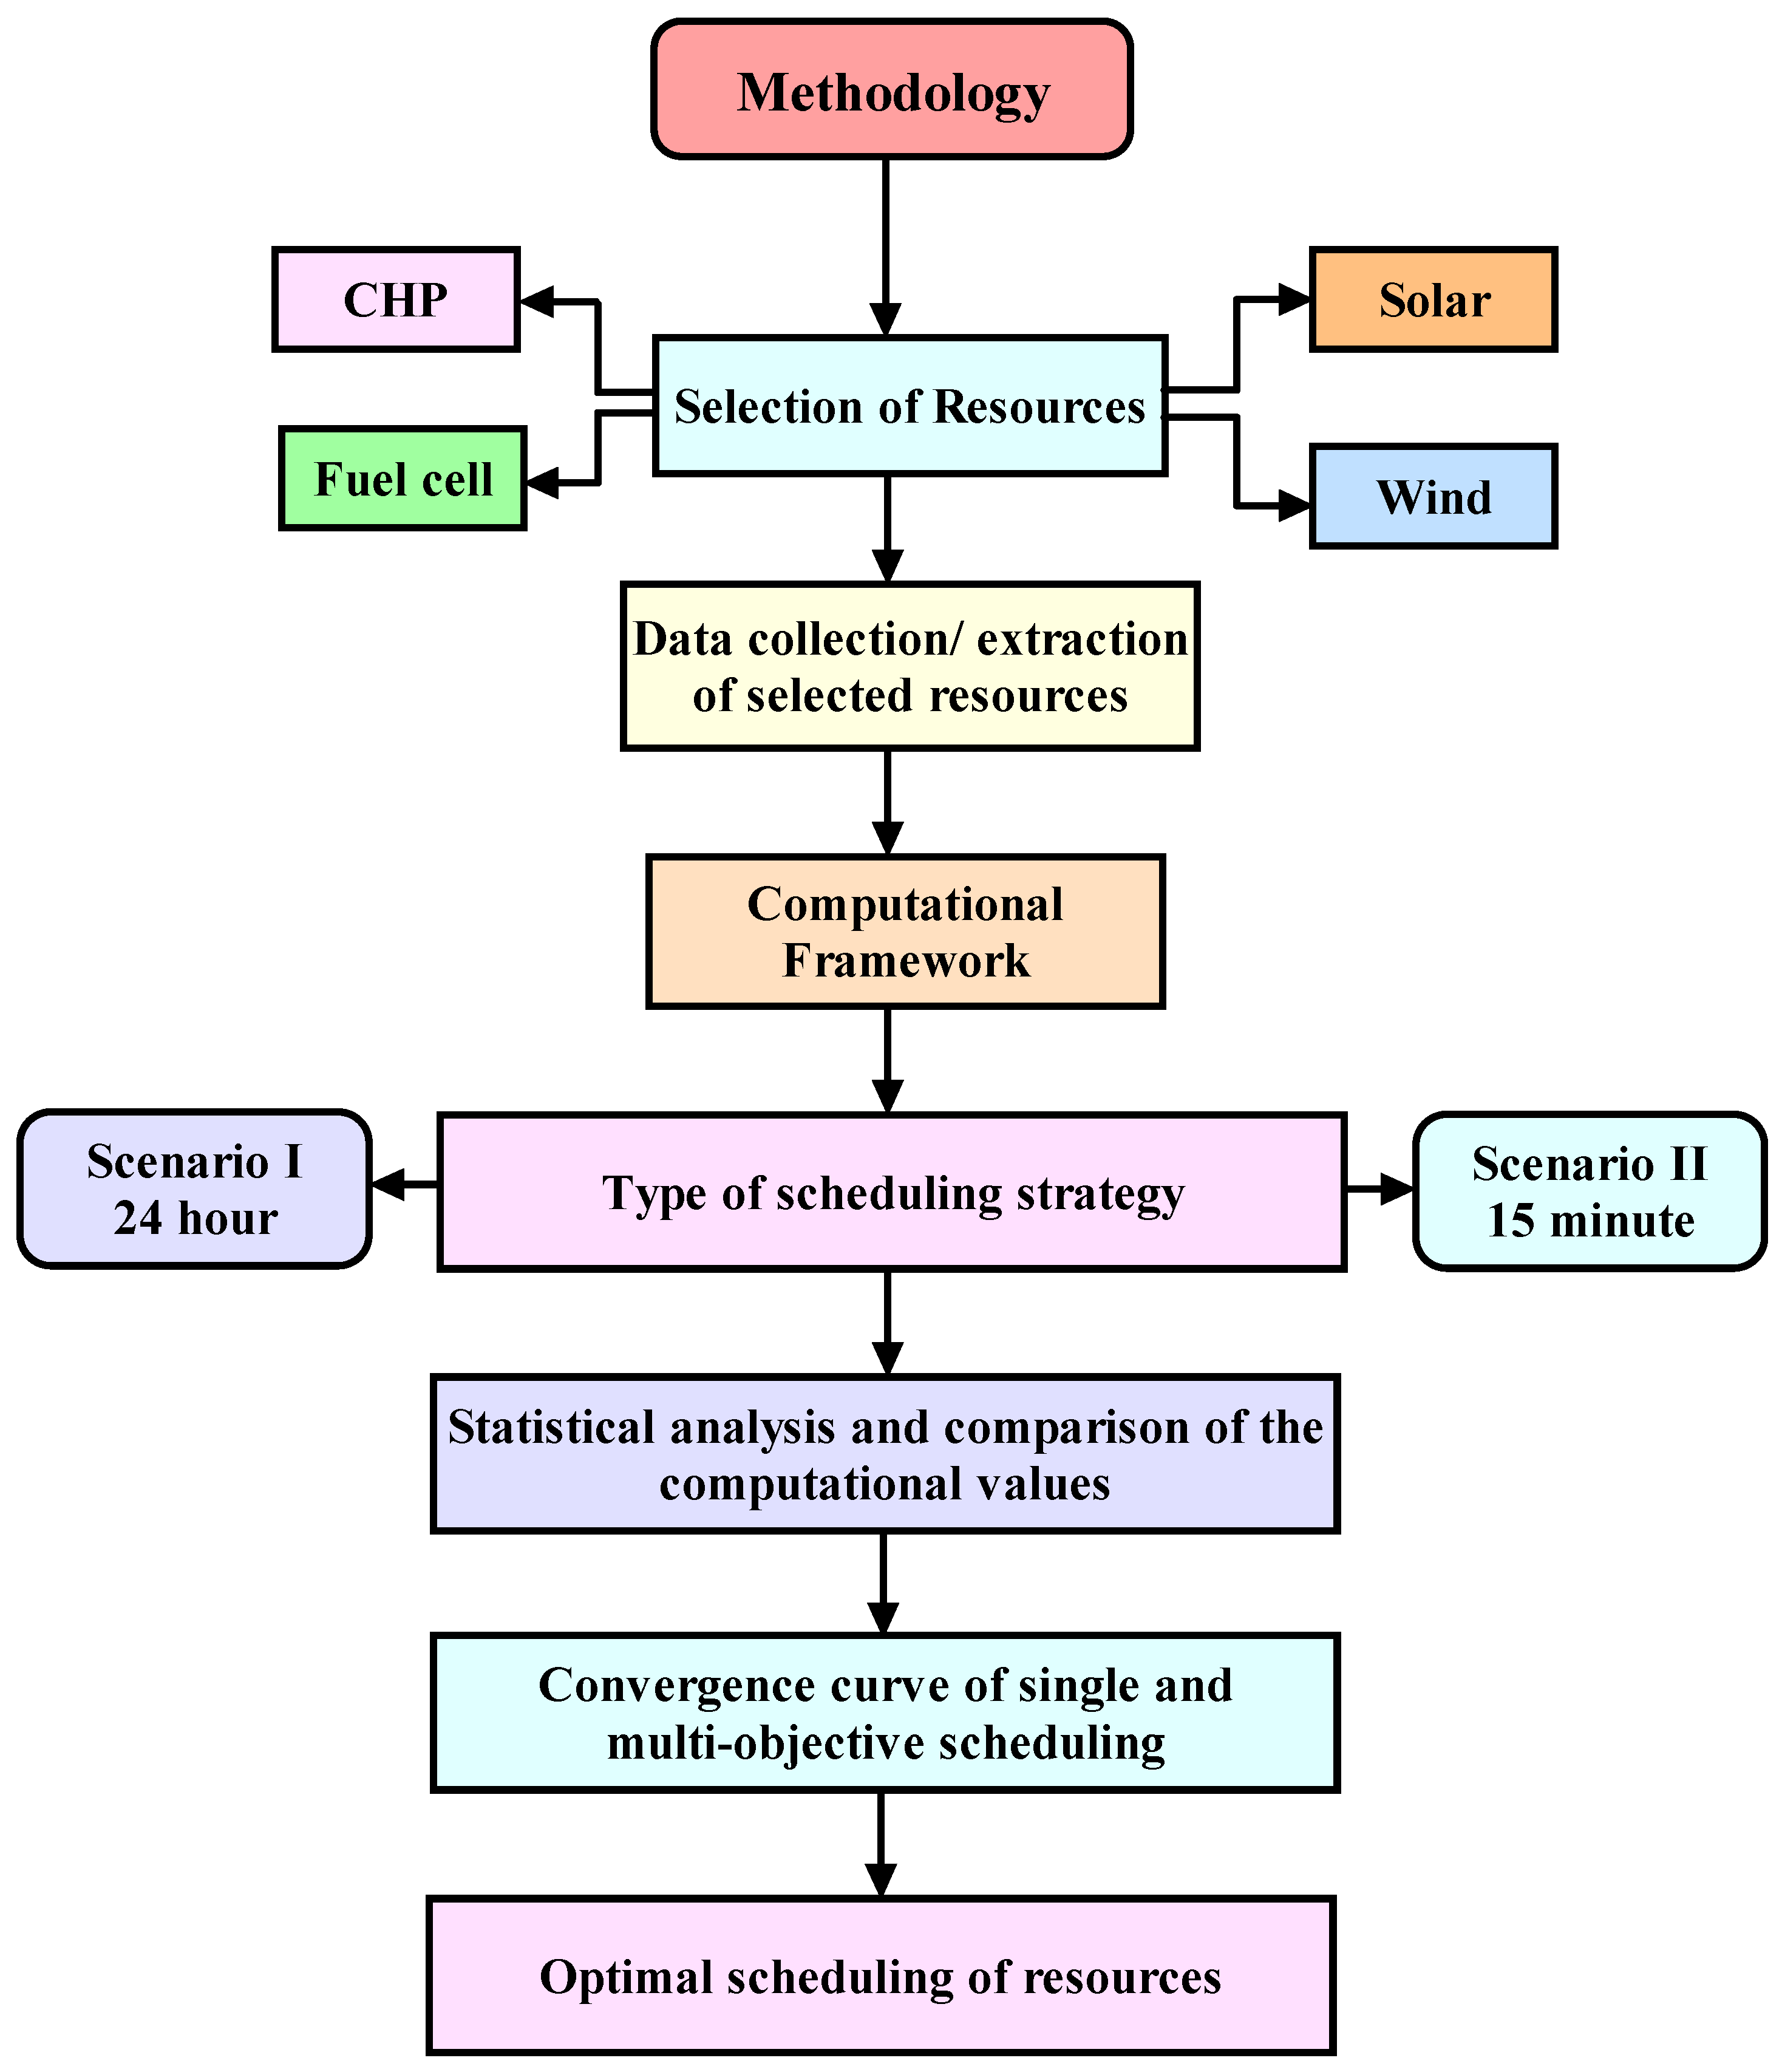
Methodology
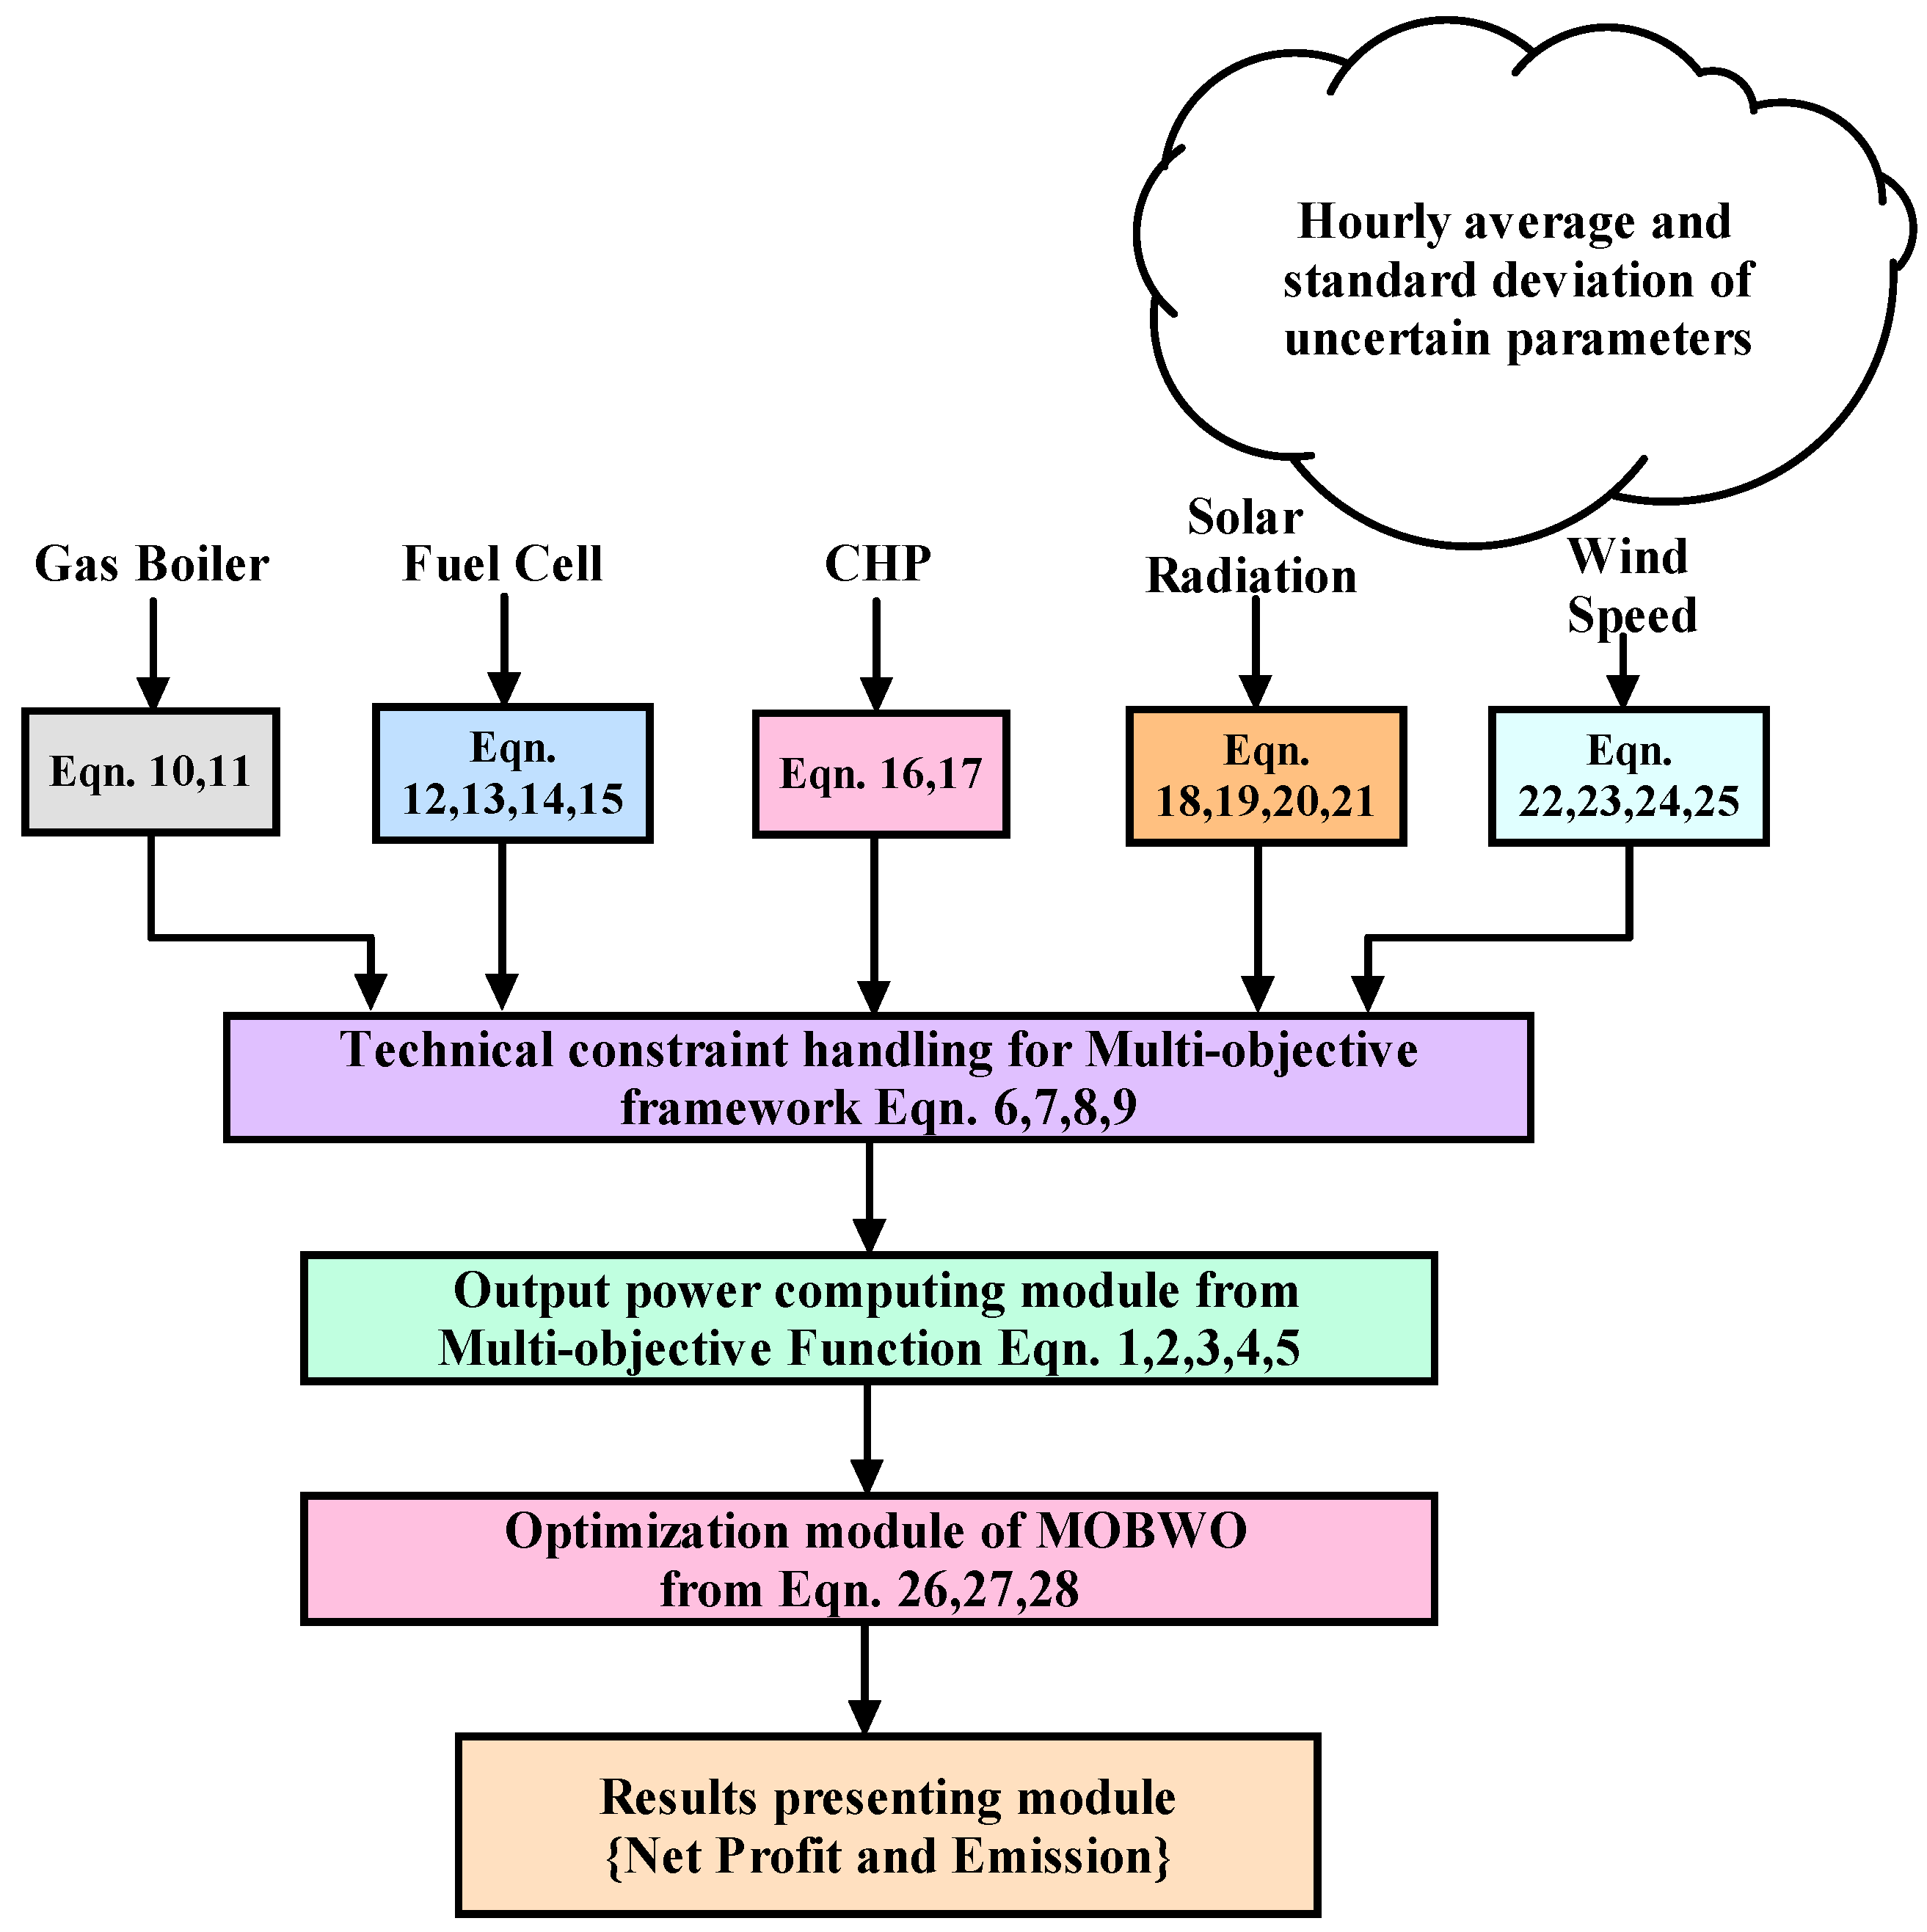
3. Problem Formulation
3.1. Objective Function
3.1.1. Net Profit
- p and s are set of plants and scenarios, t is time ranges from 1 to 24 in Day-ahead scheduling, followed by 1 to 96 in 15-min scheduling.
- cph and cse are the tariffs for purchasing and selling power from the grid system.
- πs is the probability of scenarios.
- pem is the energy market price; cens is the cost of energy not served.
- cchp and chou are the cost function of CHP and heat-only units.
- phou is the price of heat-only units.
3.1.2. Emission
- echp and ehou are the emissions by CHP and heat-only units, respectively.
- eph and ese are the emissions by the grid system.
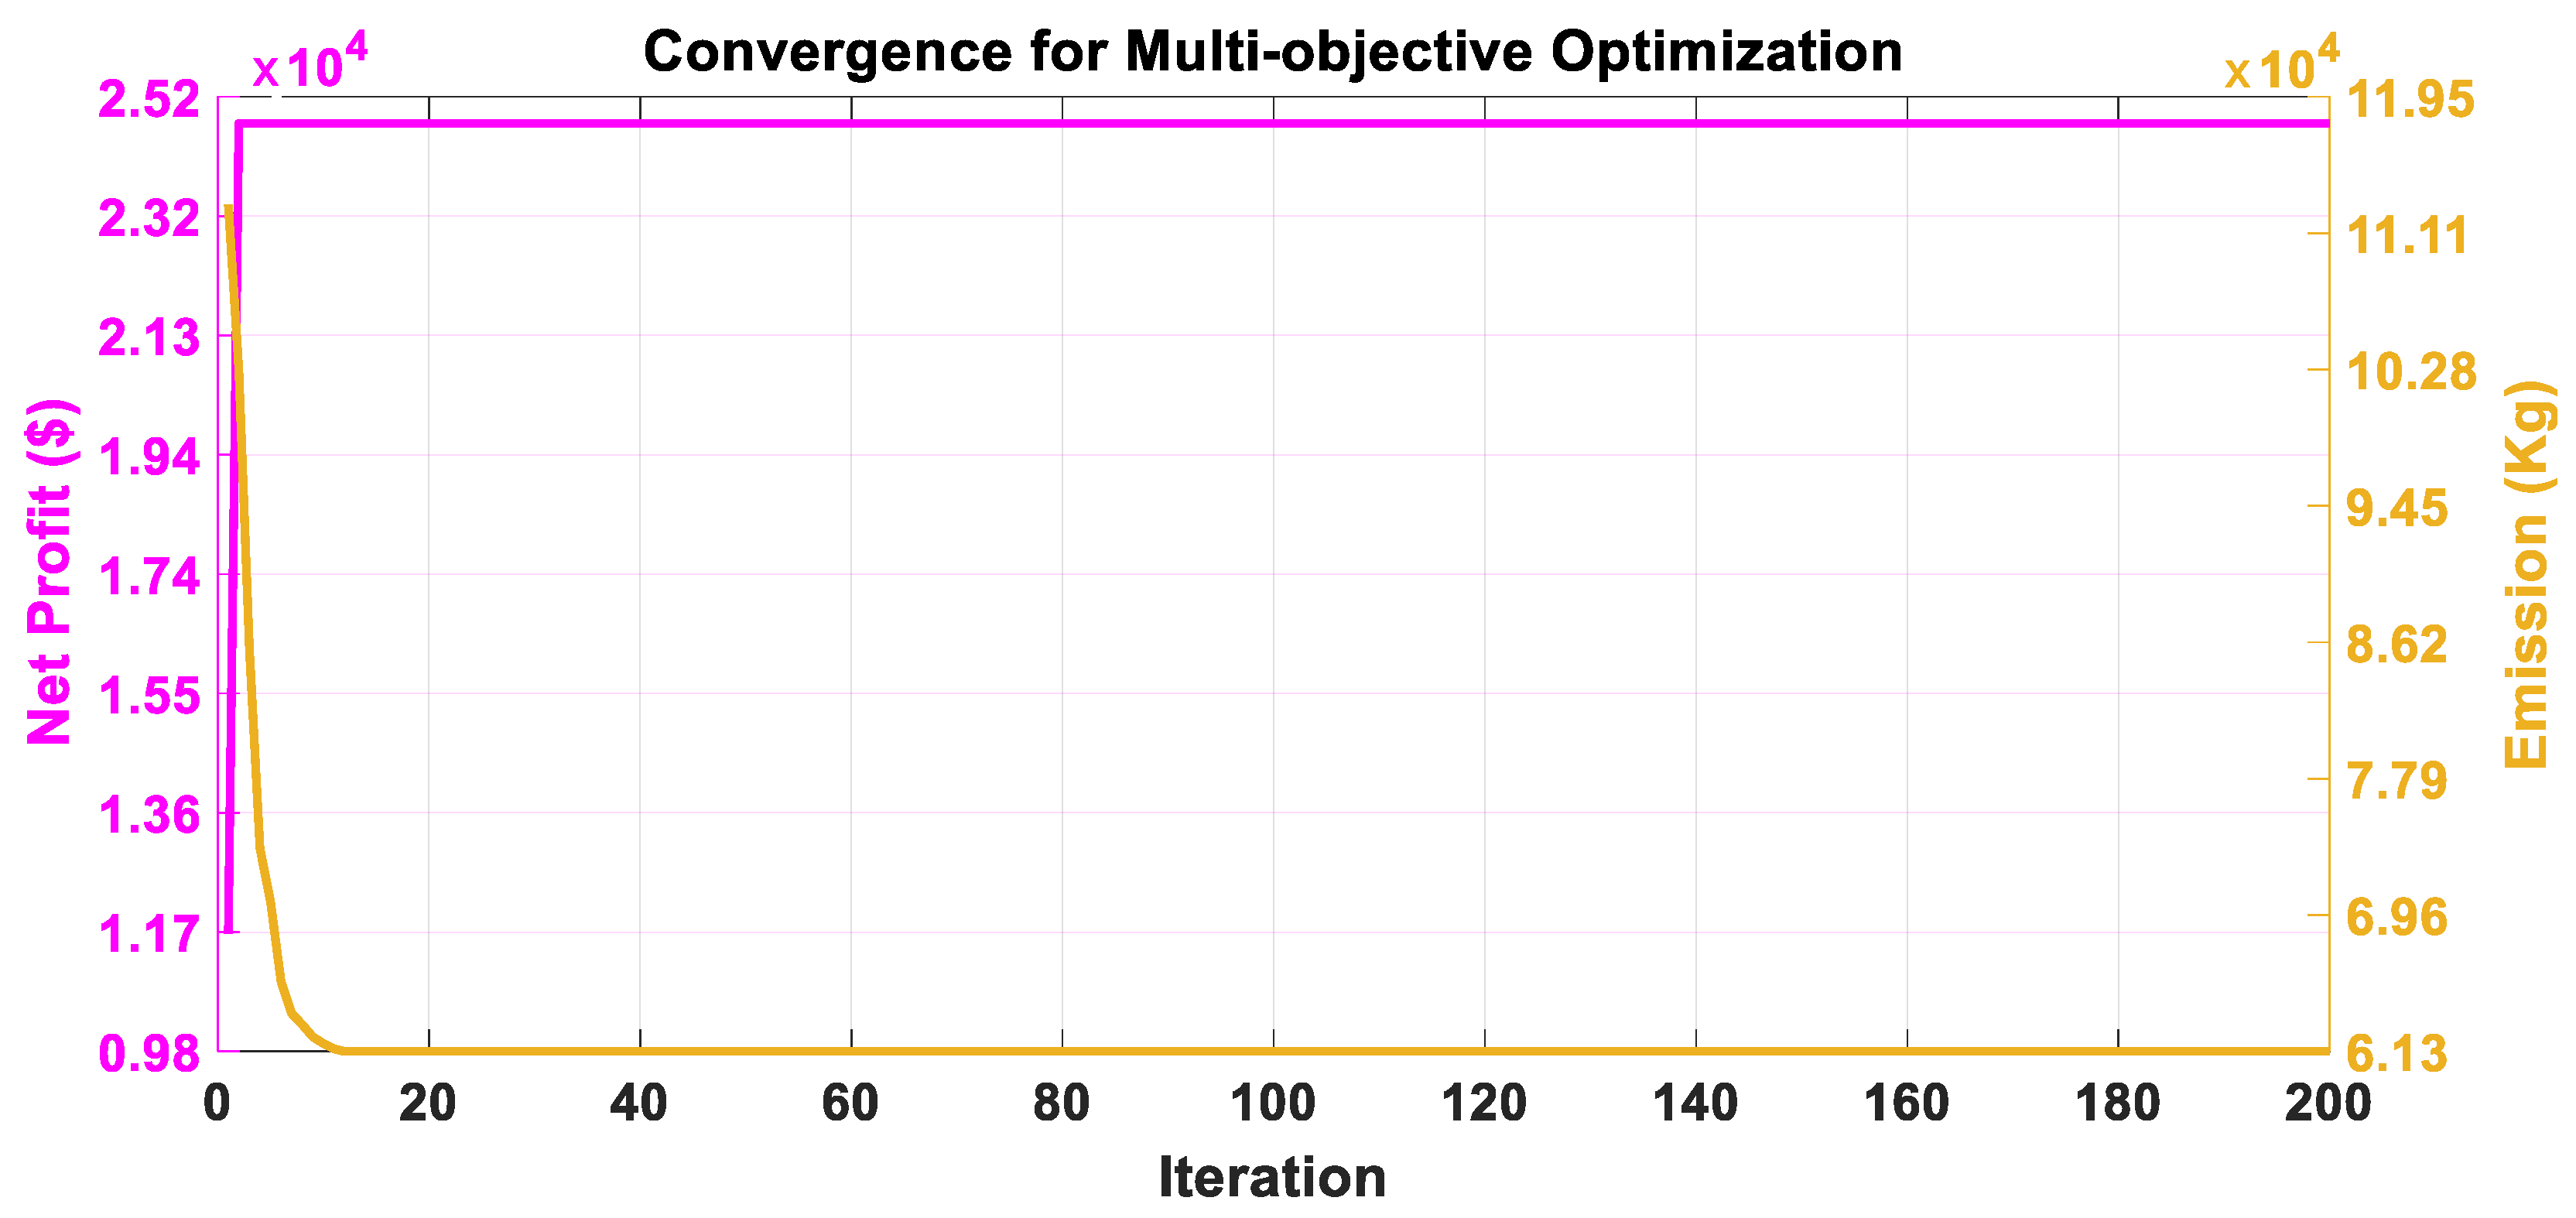
3.1.3. Multi-Objective Framework
- w is considered as 0.5 for giving equal weightage to both objectives.
3.2. Constraints Handling
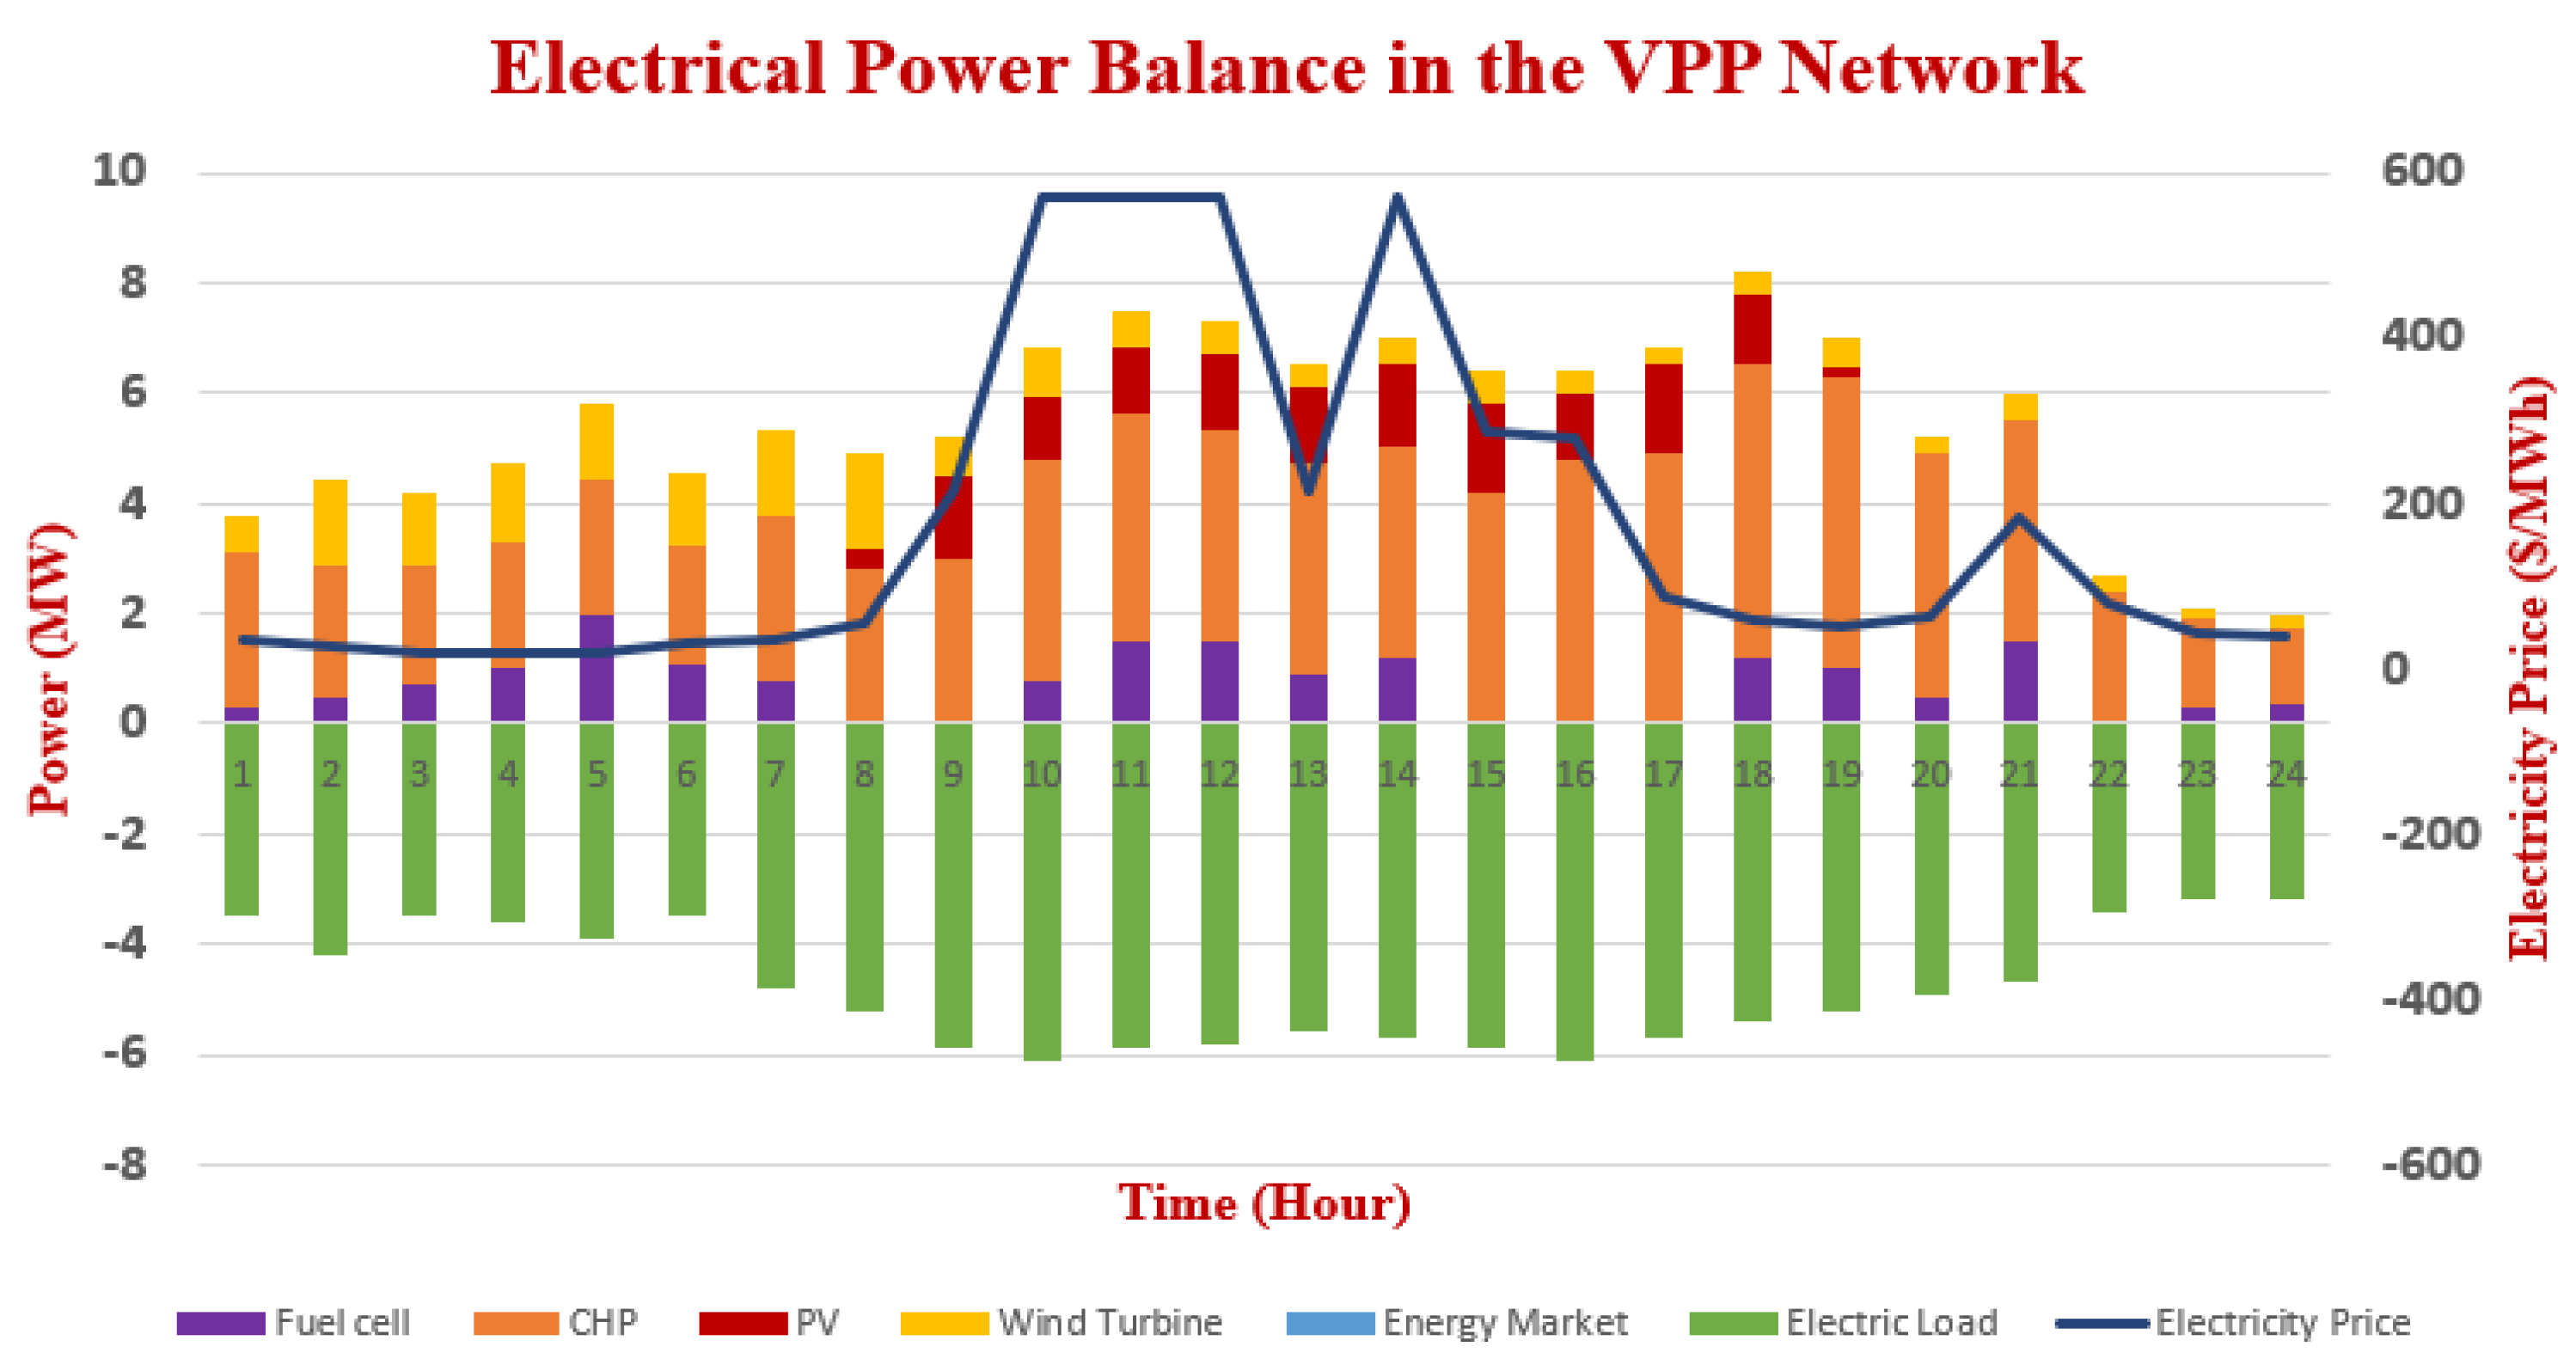
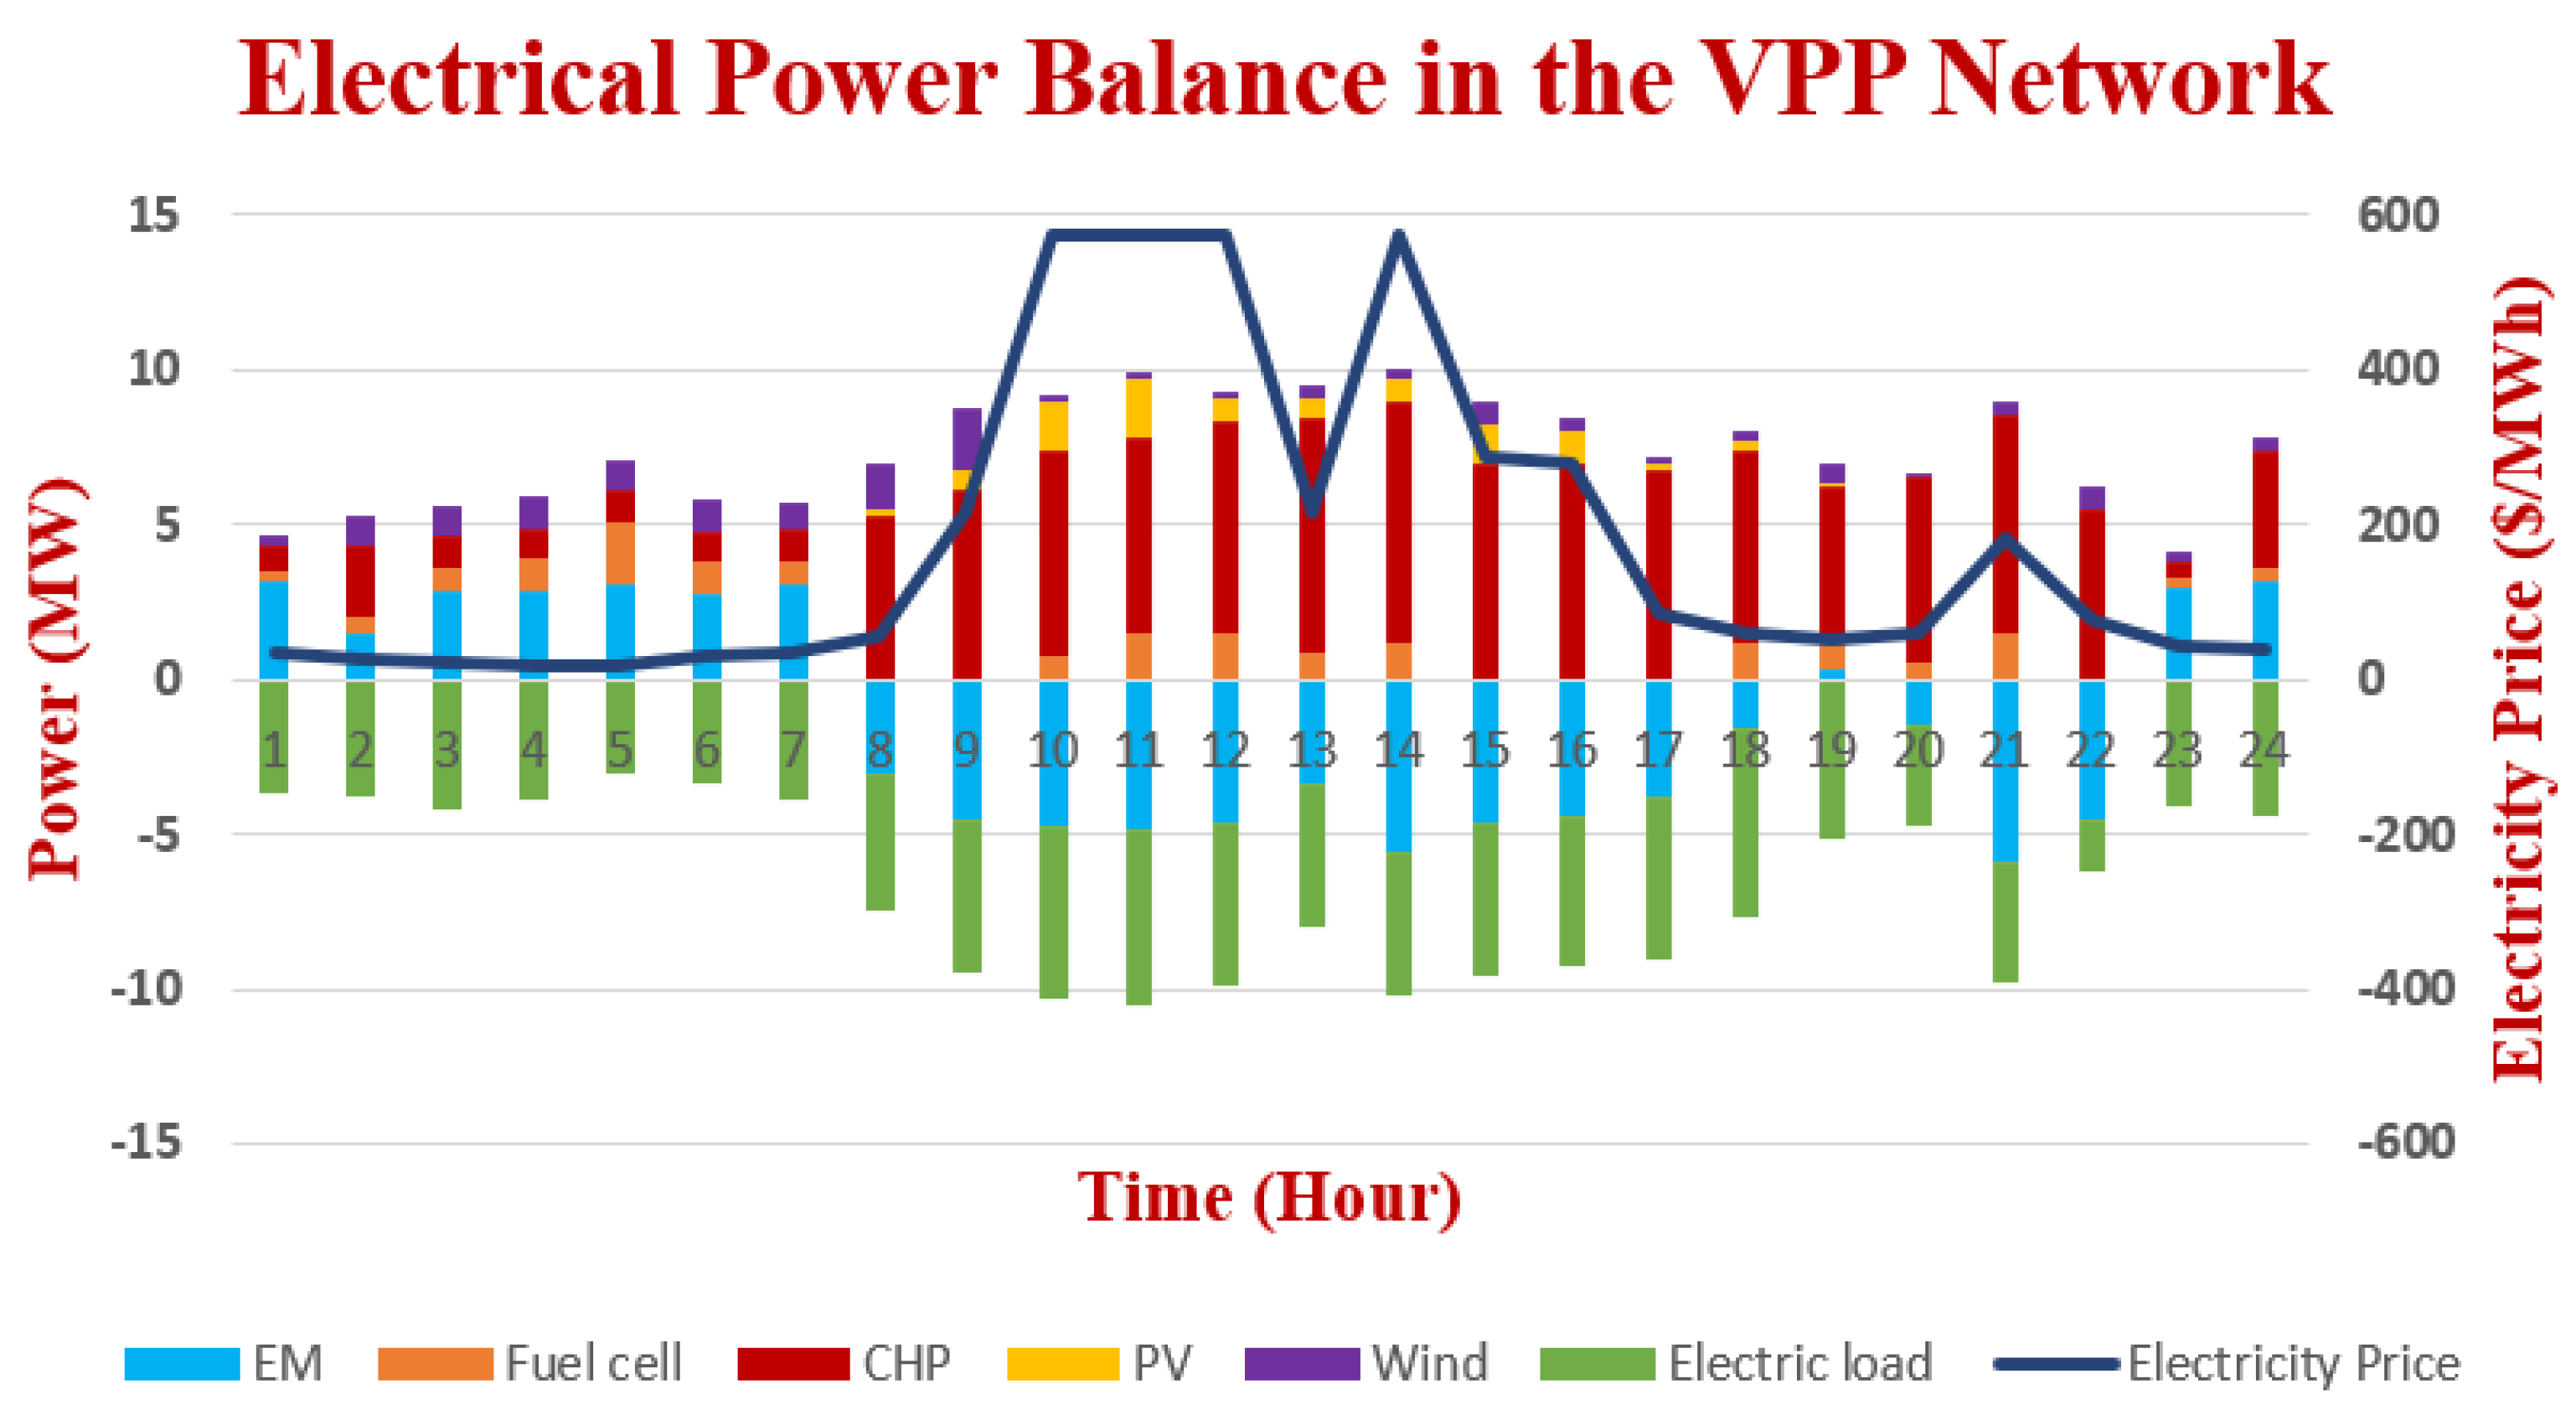
3.2.1. Power Balancing
- is equivalent to power scenario s, time t, and plant p.
- is the exchanging power between the main grid and the CHP system at interval i (MW).
- is the power of the fuel cell at interval i (MW).
- is the power of the wind turbine at interval i (MW).
- is the power of the solar photovoltaic at interval i (MW).
- is the electrical load at interval i (MW).
3.2.2. Heat Balancing
- is the ratio of heat to the electricity of the fuel cell at interval i (MW).
- is the efficiency of the heat rate boiler (MW).
- is the power of a gas boiler at interval i (MW).
- is thermal power balance at interval i (MW).
3.3. Power Switching between Main Grid and CHP Units
- is the minimum exchange of power between the main grid and the CHP system.
- is the maximum exchange of power between the main grid and the CHP system.
3.4. Constraints of Waste Heat and Gas Boiler
- is the minimum limit of the waste heat boiler.
- is the maximum limit of the waste heat boiler.
- is the minimum limit of the gas boiler.
- is the maximum limit of the gas boiler.
3.5. Fuel Cells
- is the fuel cell efficiency at interval i (p.u.) and
- is the ratio of heat to the electricity of the fuel cell at interval i (MW).
Ramp Rate Limit of Fuel Cell
- T is the up-ramp limit and is the down-ramp limit of the fuel cell.
- is the power generated by the fuel cell at interval i (kW).
- is the power generated by the fuel cell at the previous interval (kW).
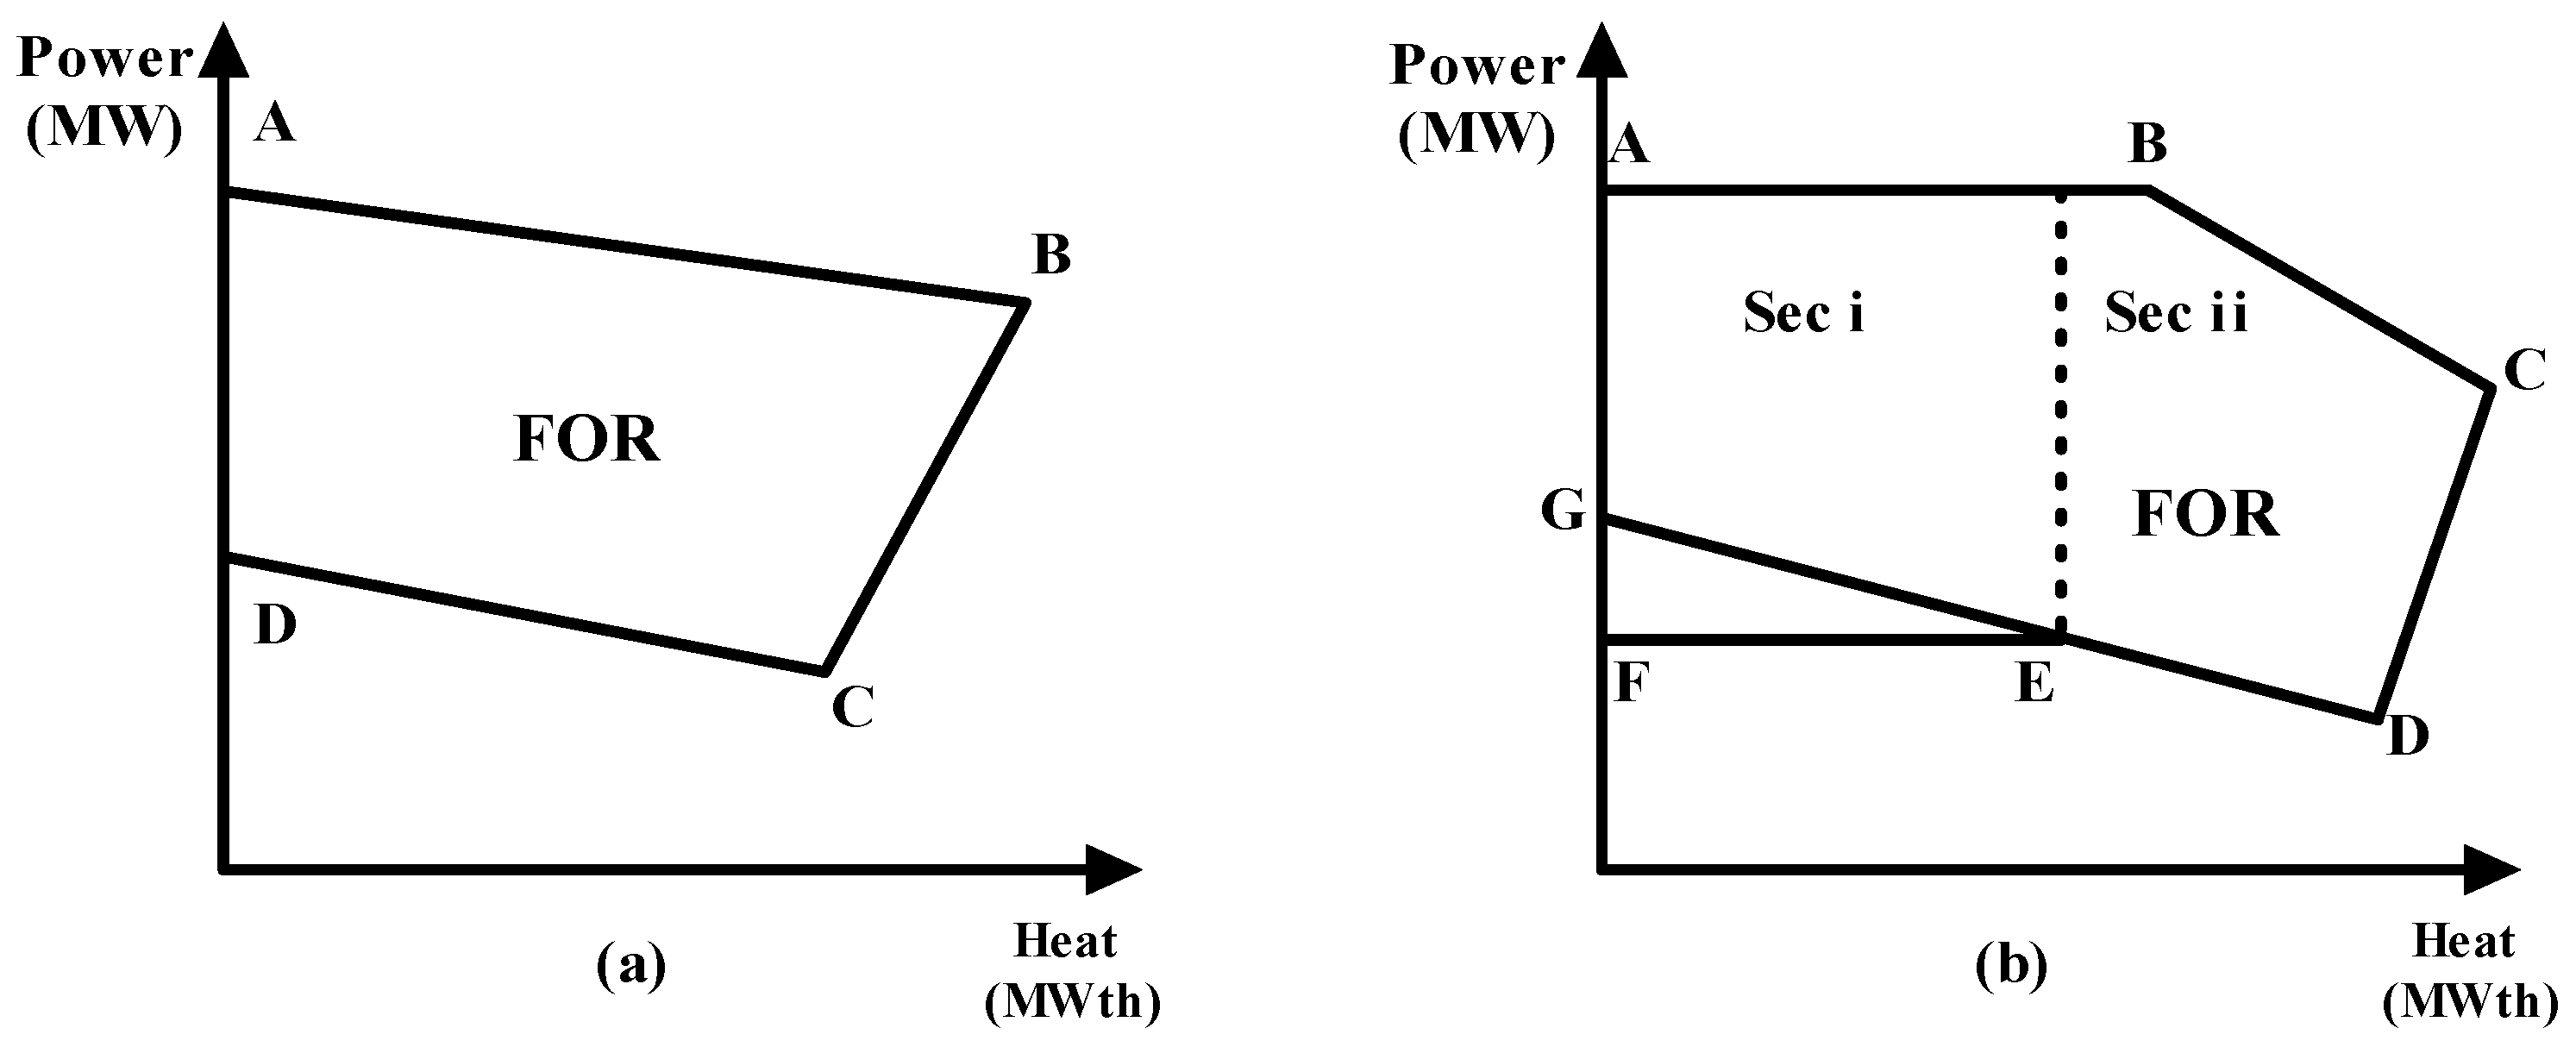
3.6. CHP Units
- is the electrical output power of the CHP and
- is the commitment status of the CHP.
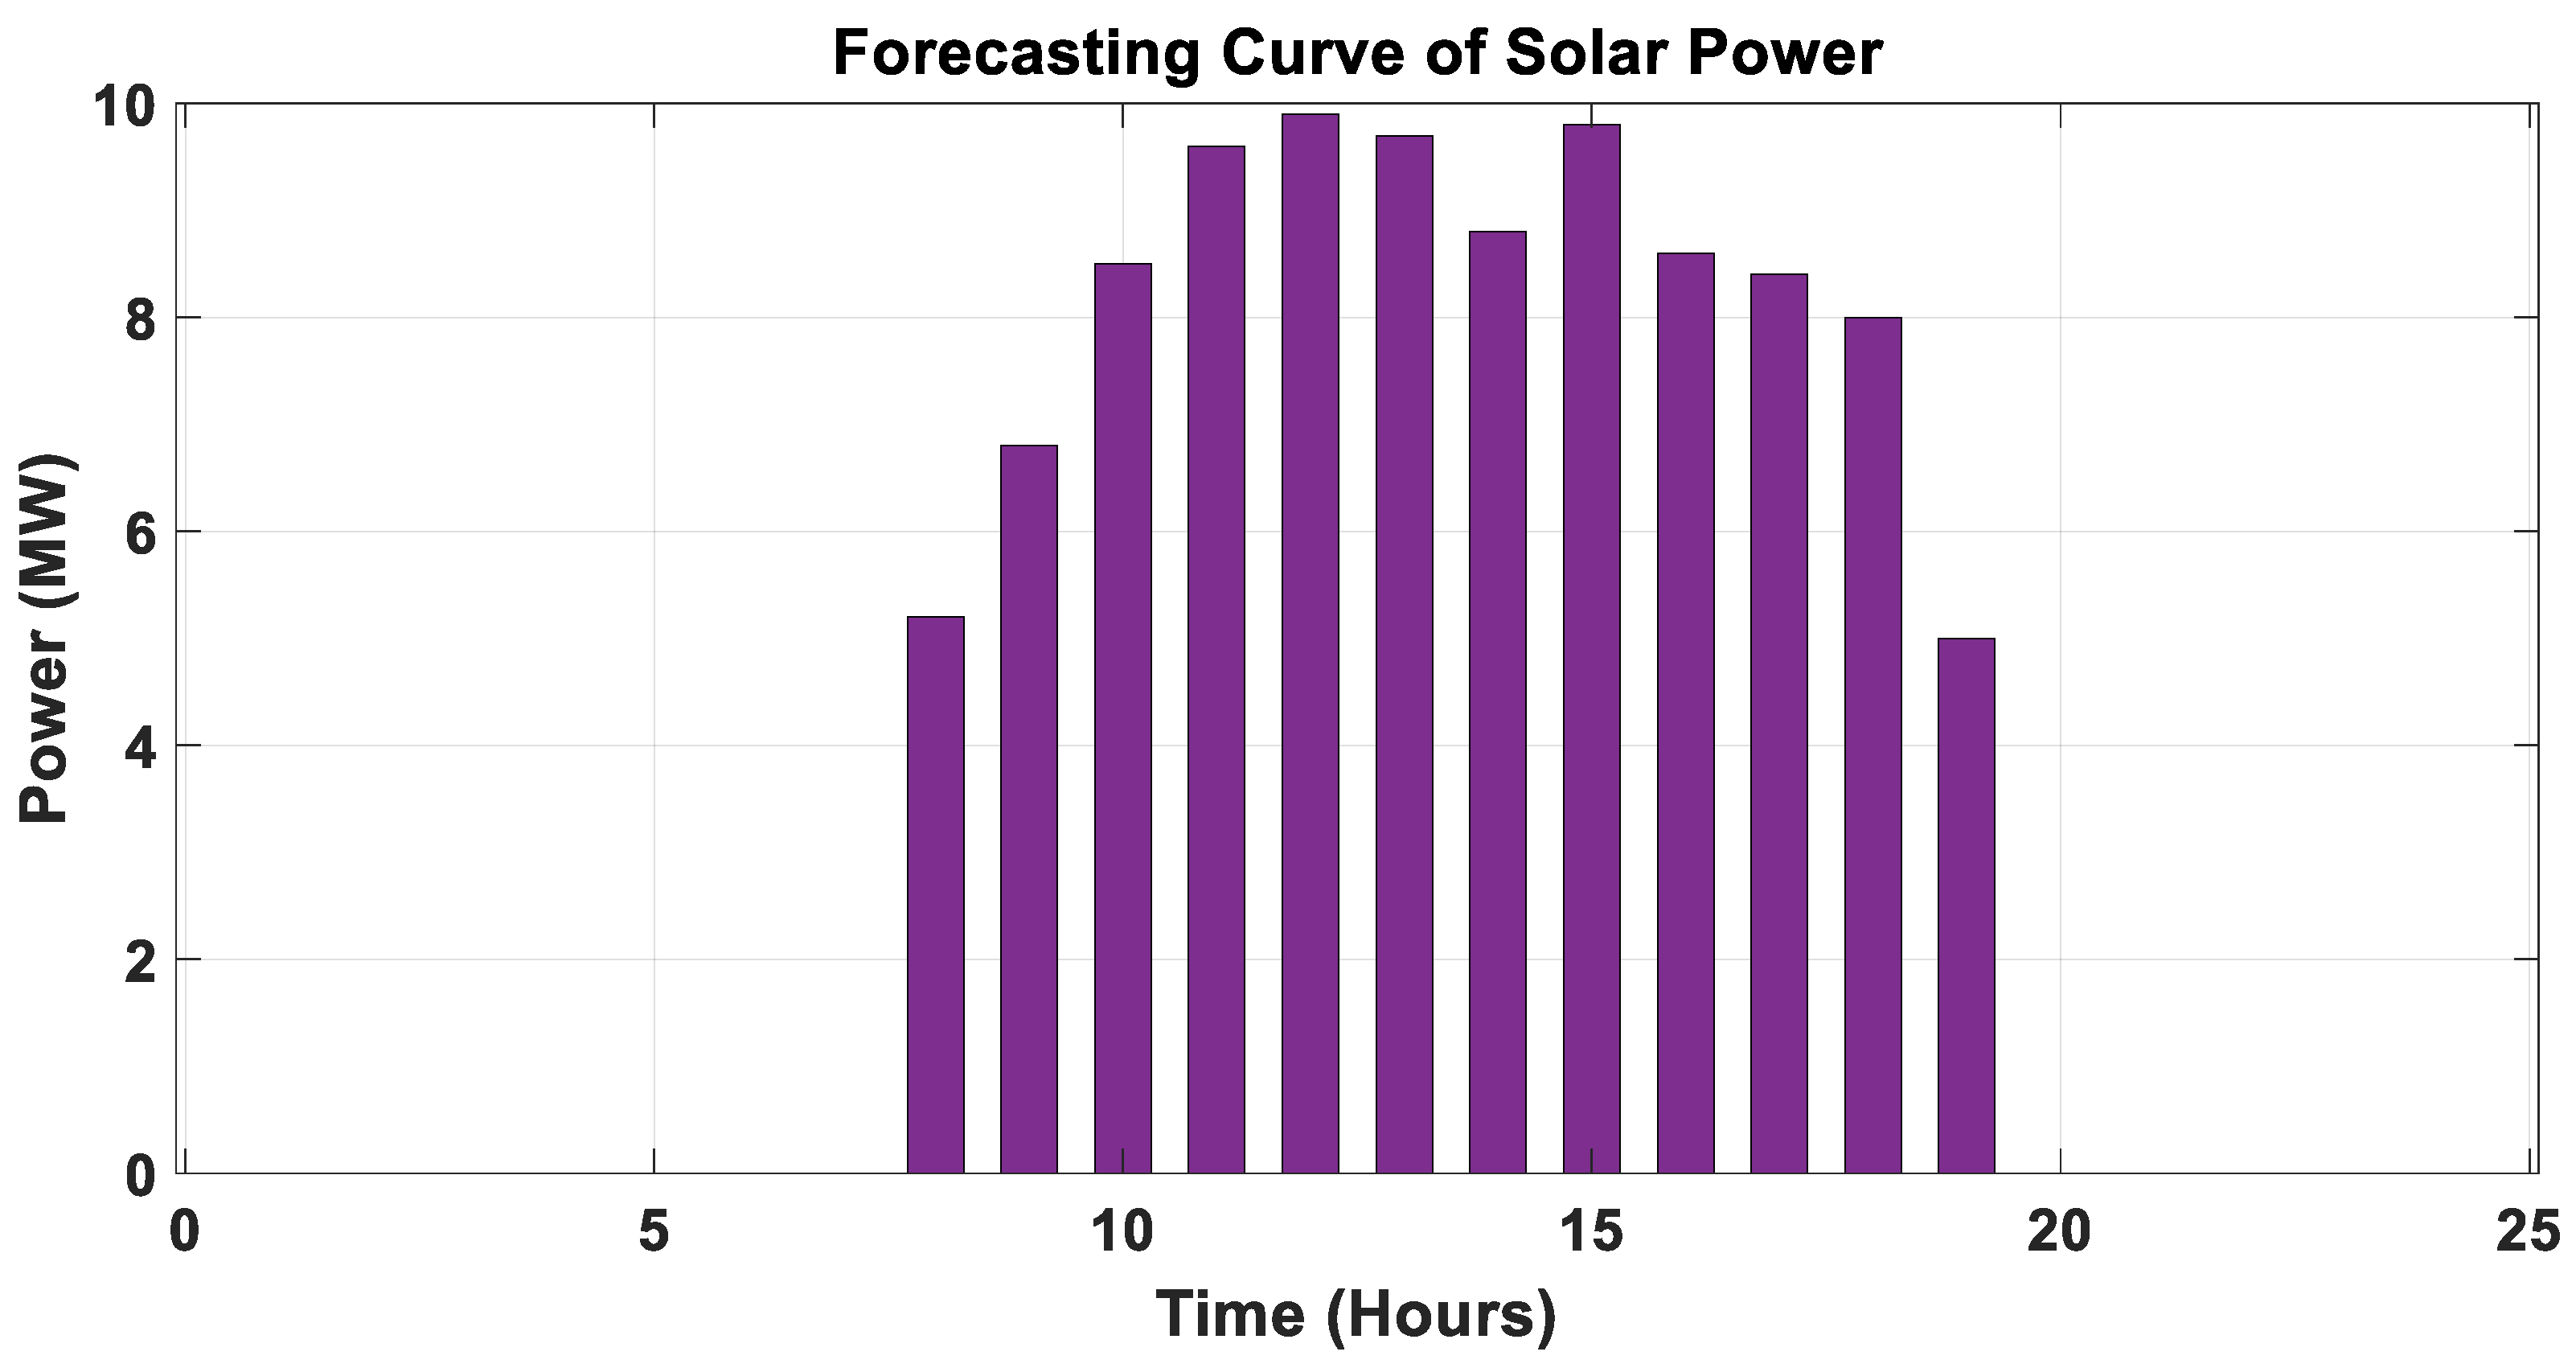
3.7. Solar PV Modules
- is output power, is the number of PV modules, and is the solar radiation (KW/).
- is the open-circuit voltage and is the short circuit current.
- is the current temperature and is the voltage temperature coefficient.
- is the solar cell temperature and FF denotes the Fill Factor of the PV module.
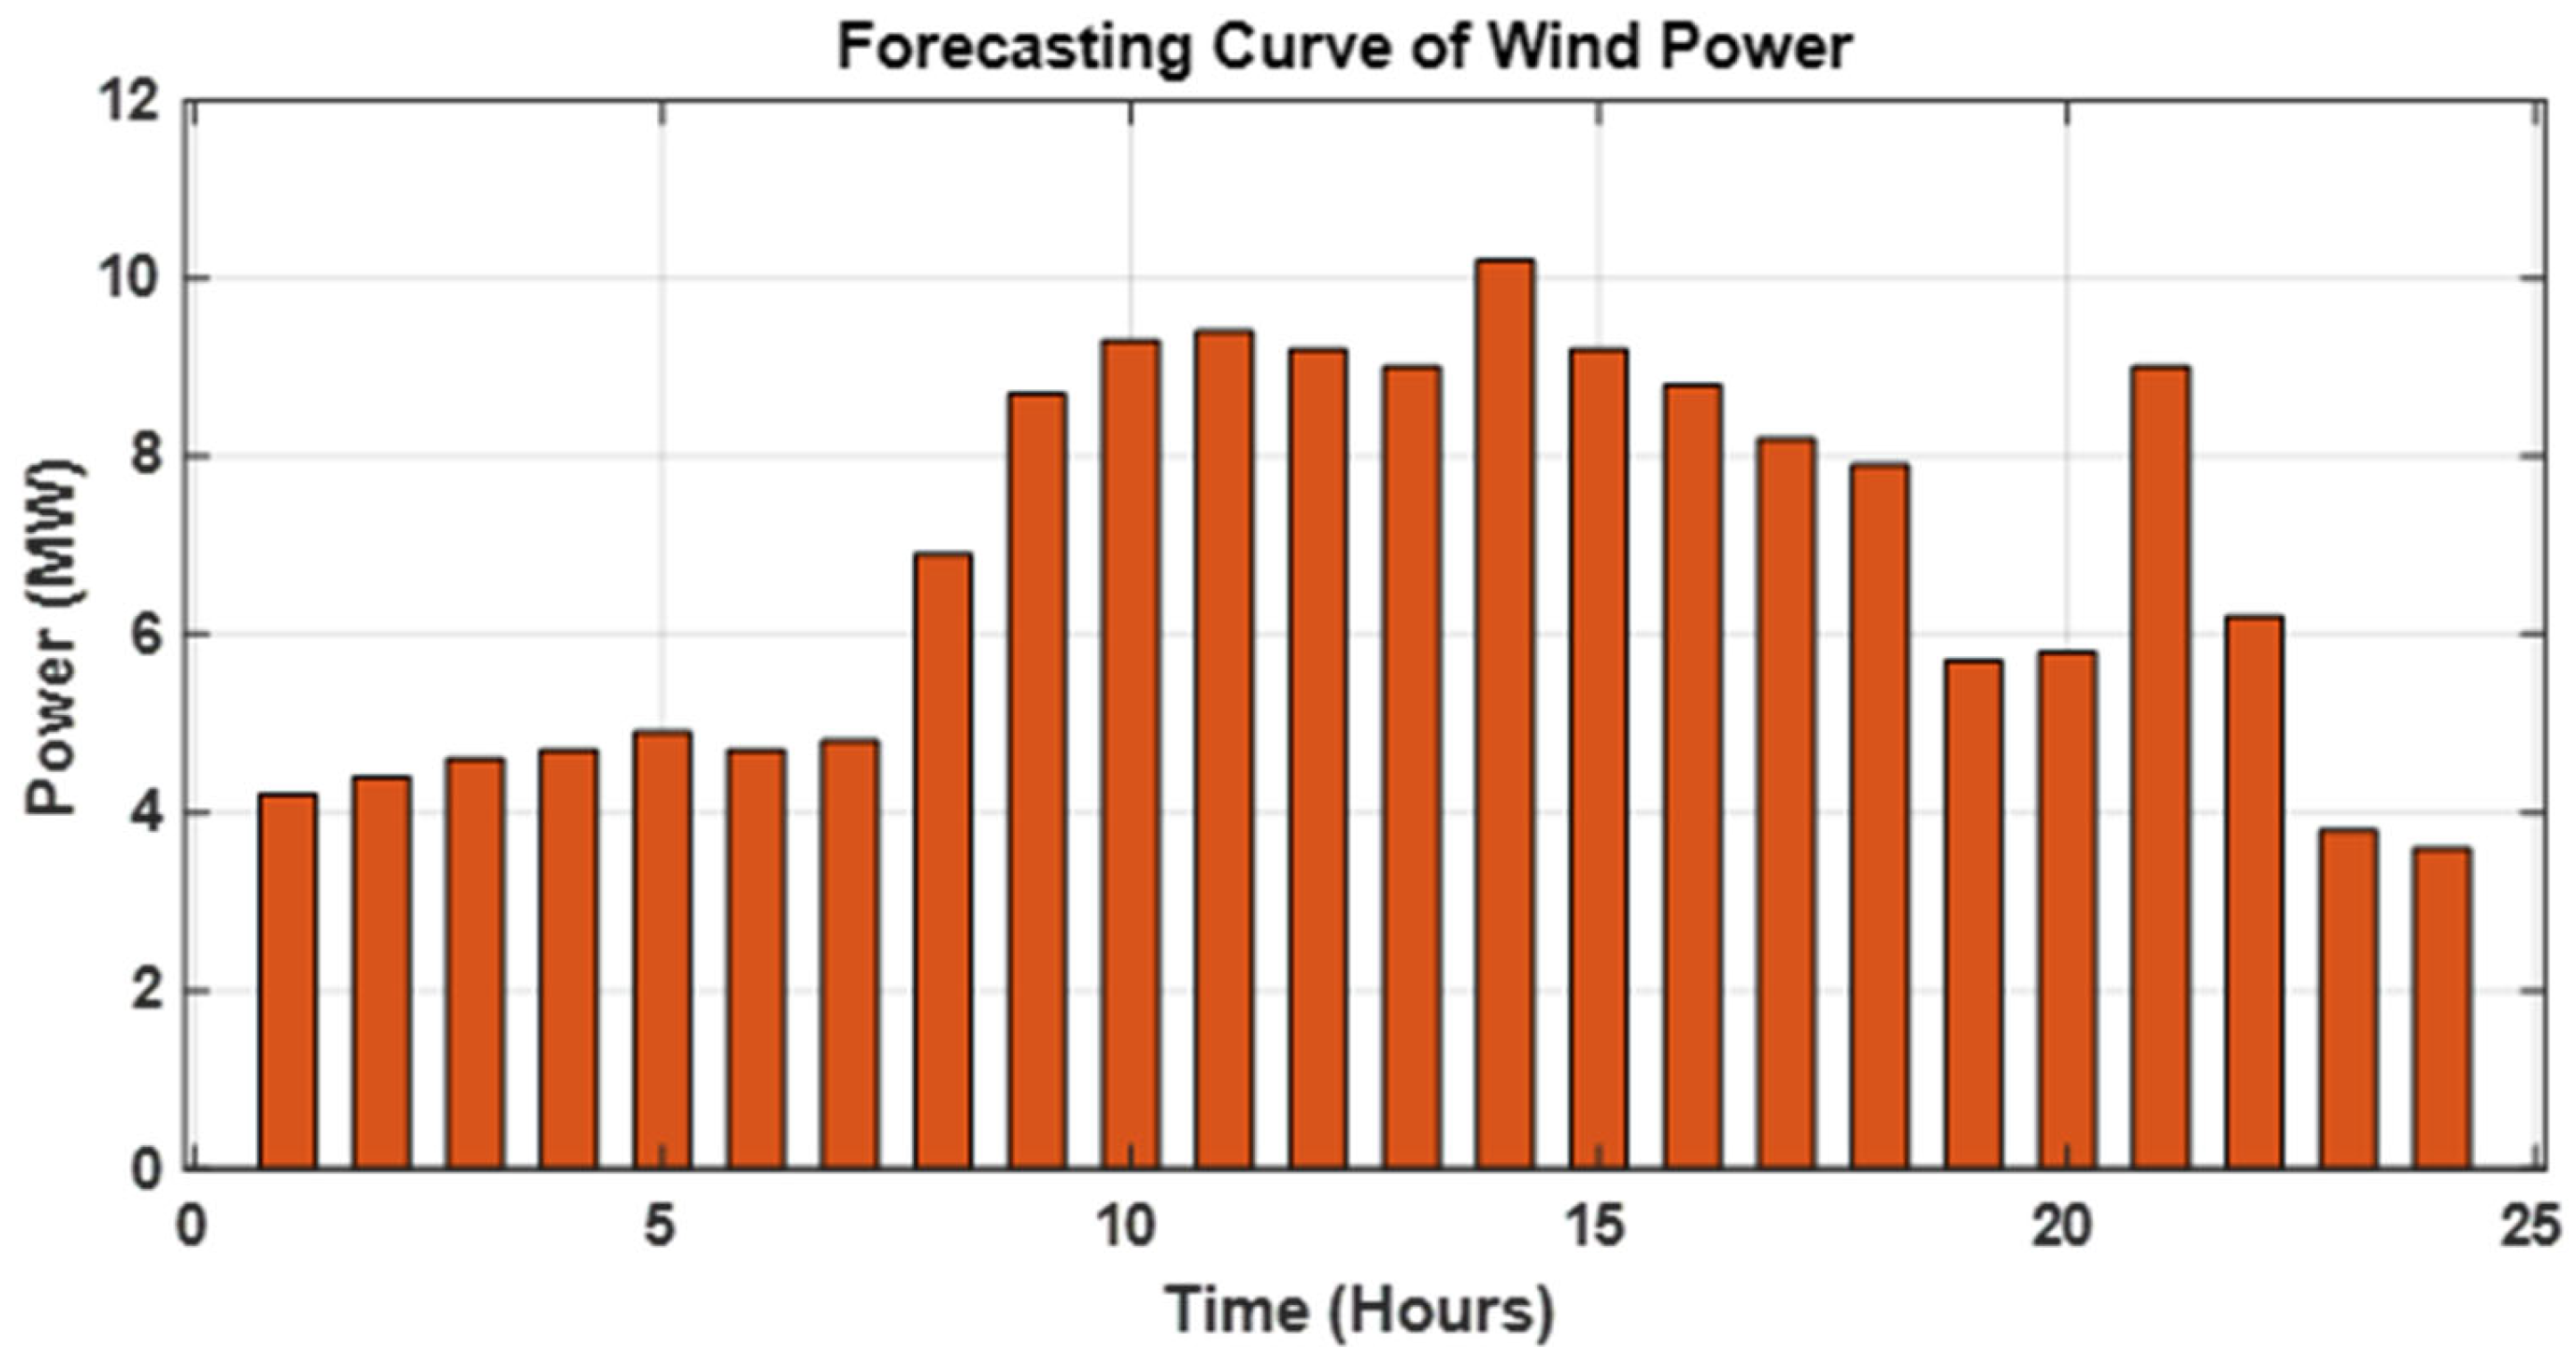
3.8. Wind Turbine
- is the output power of the wind turbine (MW).
- is the nominal power of the wind turbine (MW).
- is the number of wind turbines.
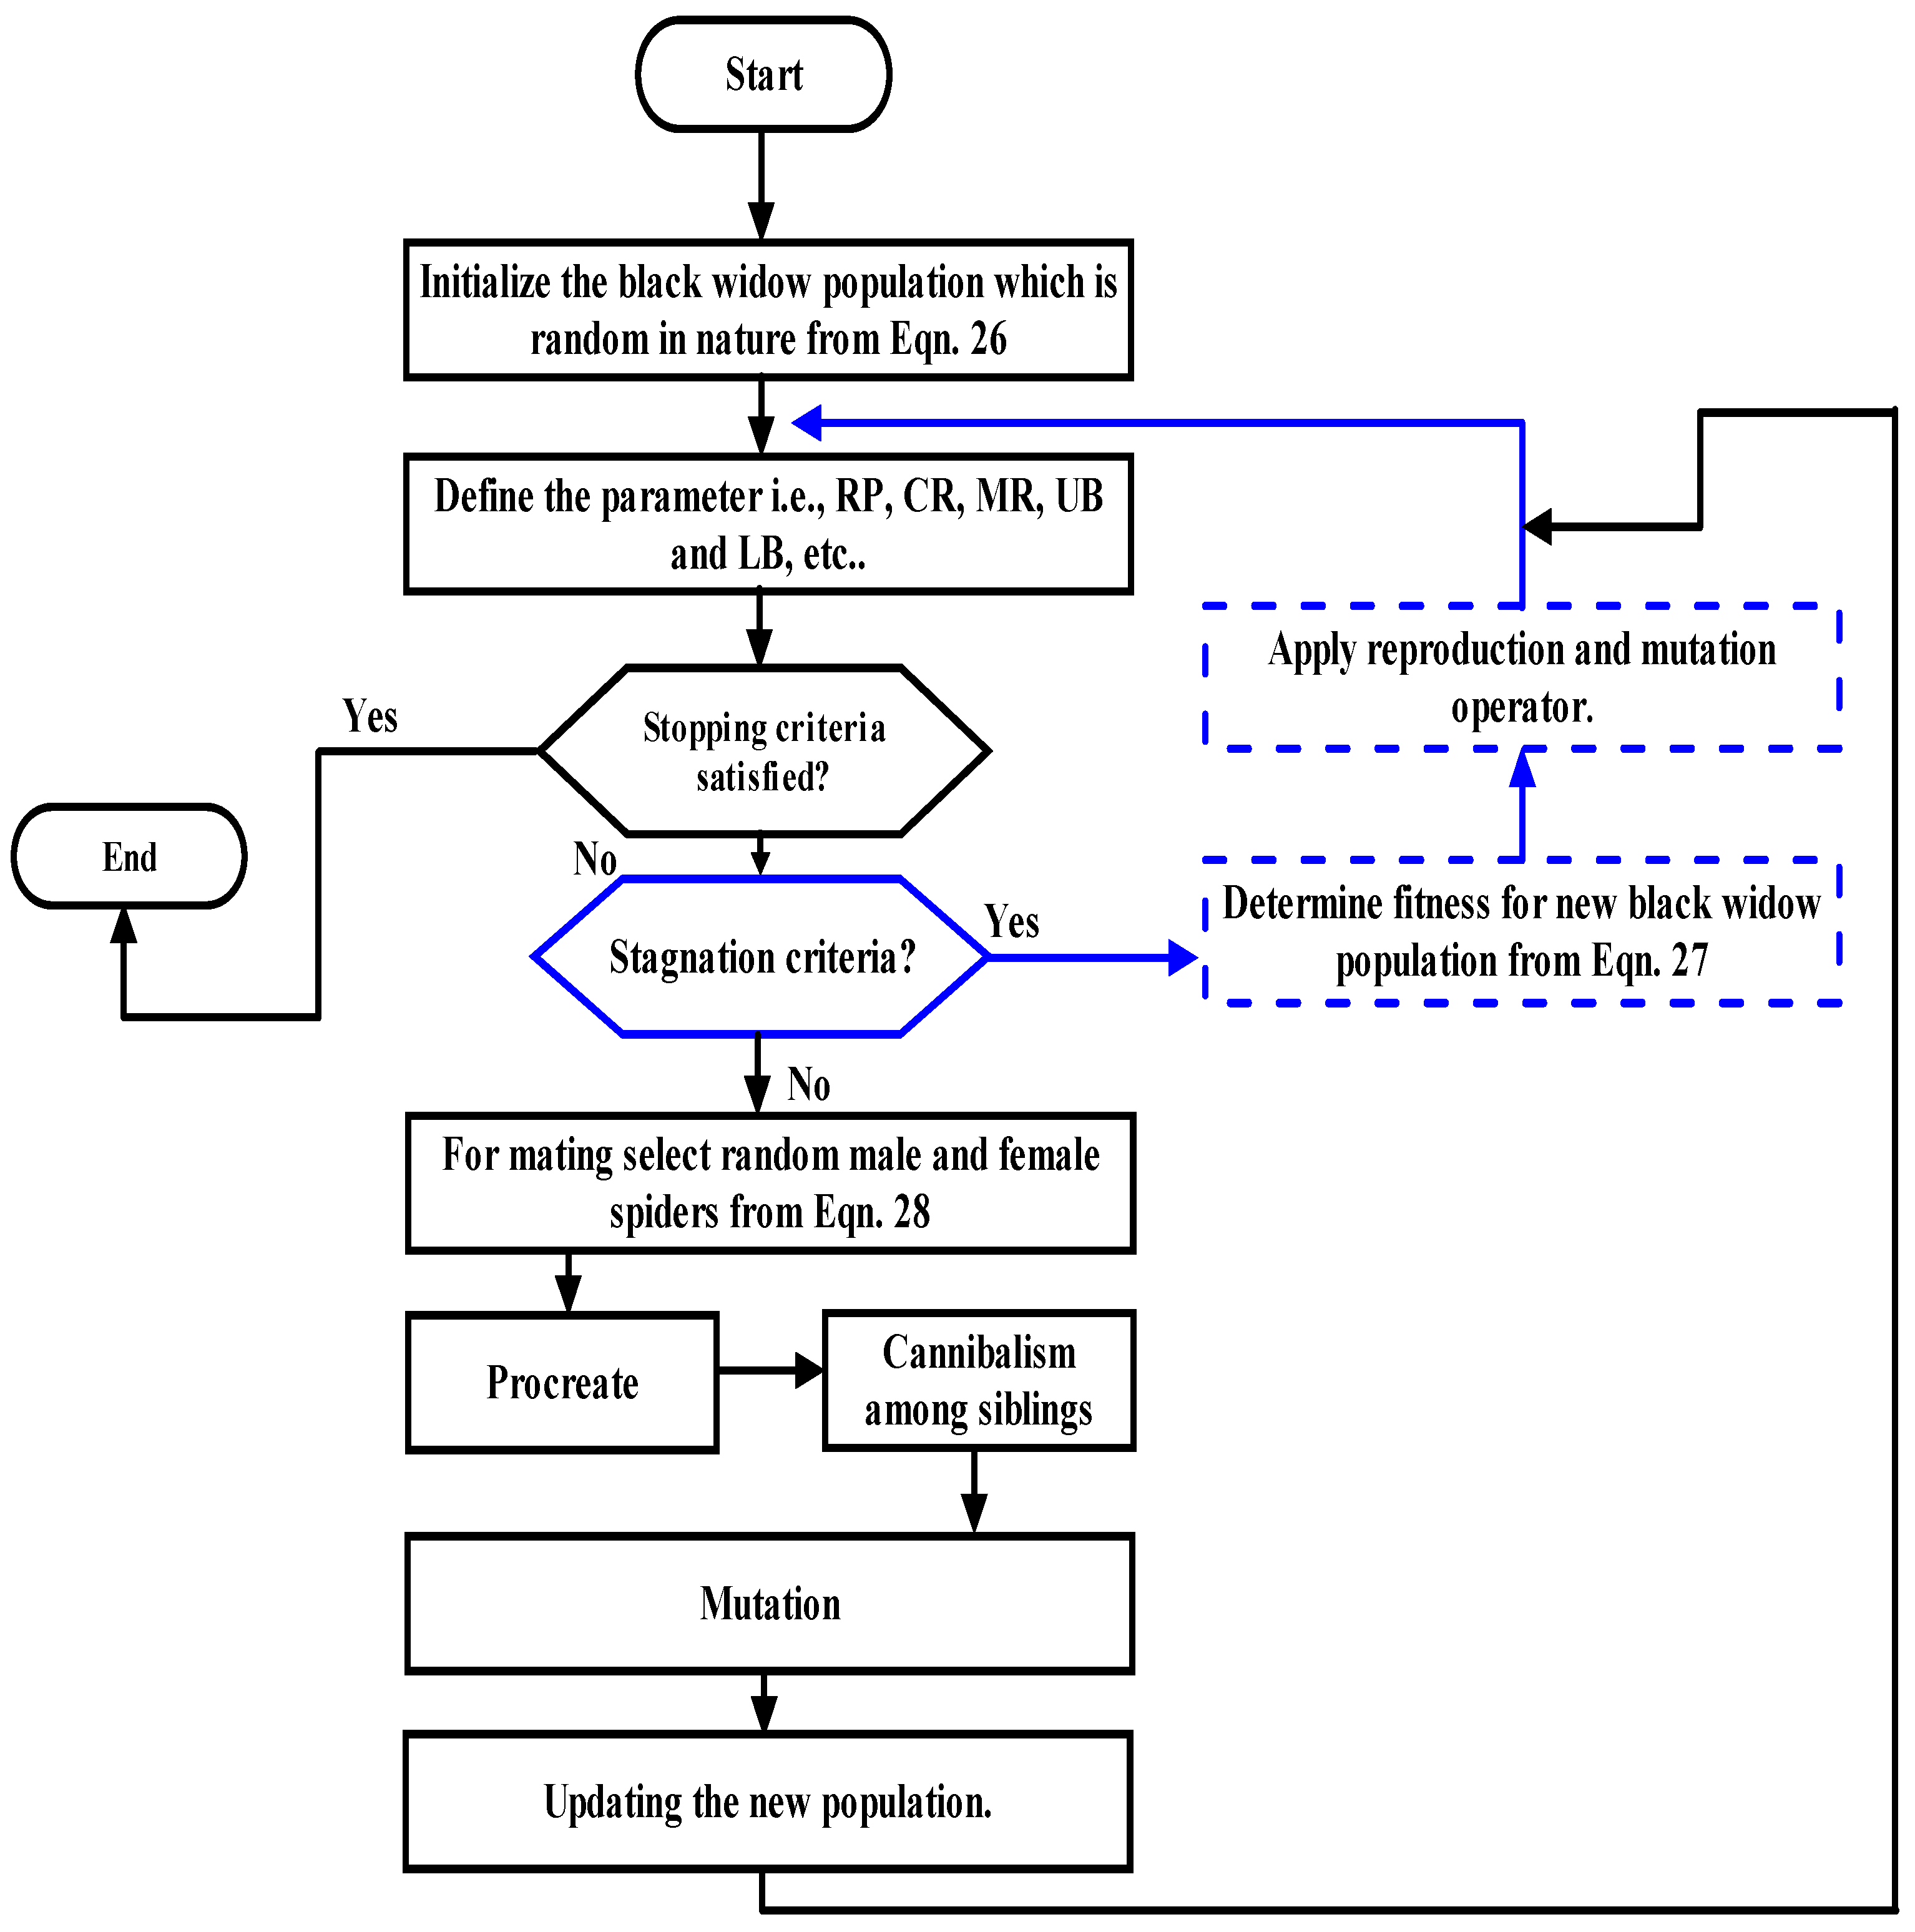
4. Optimization Algorithm
4.1. Population Initialization
- are the floating numbers in the form of variables.
4.2. Procreation, Cannibalism, Mutation
5. Results
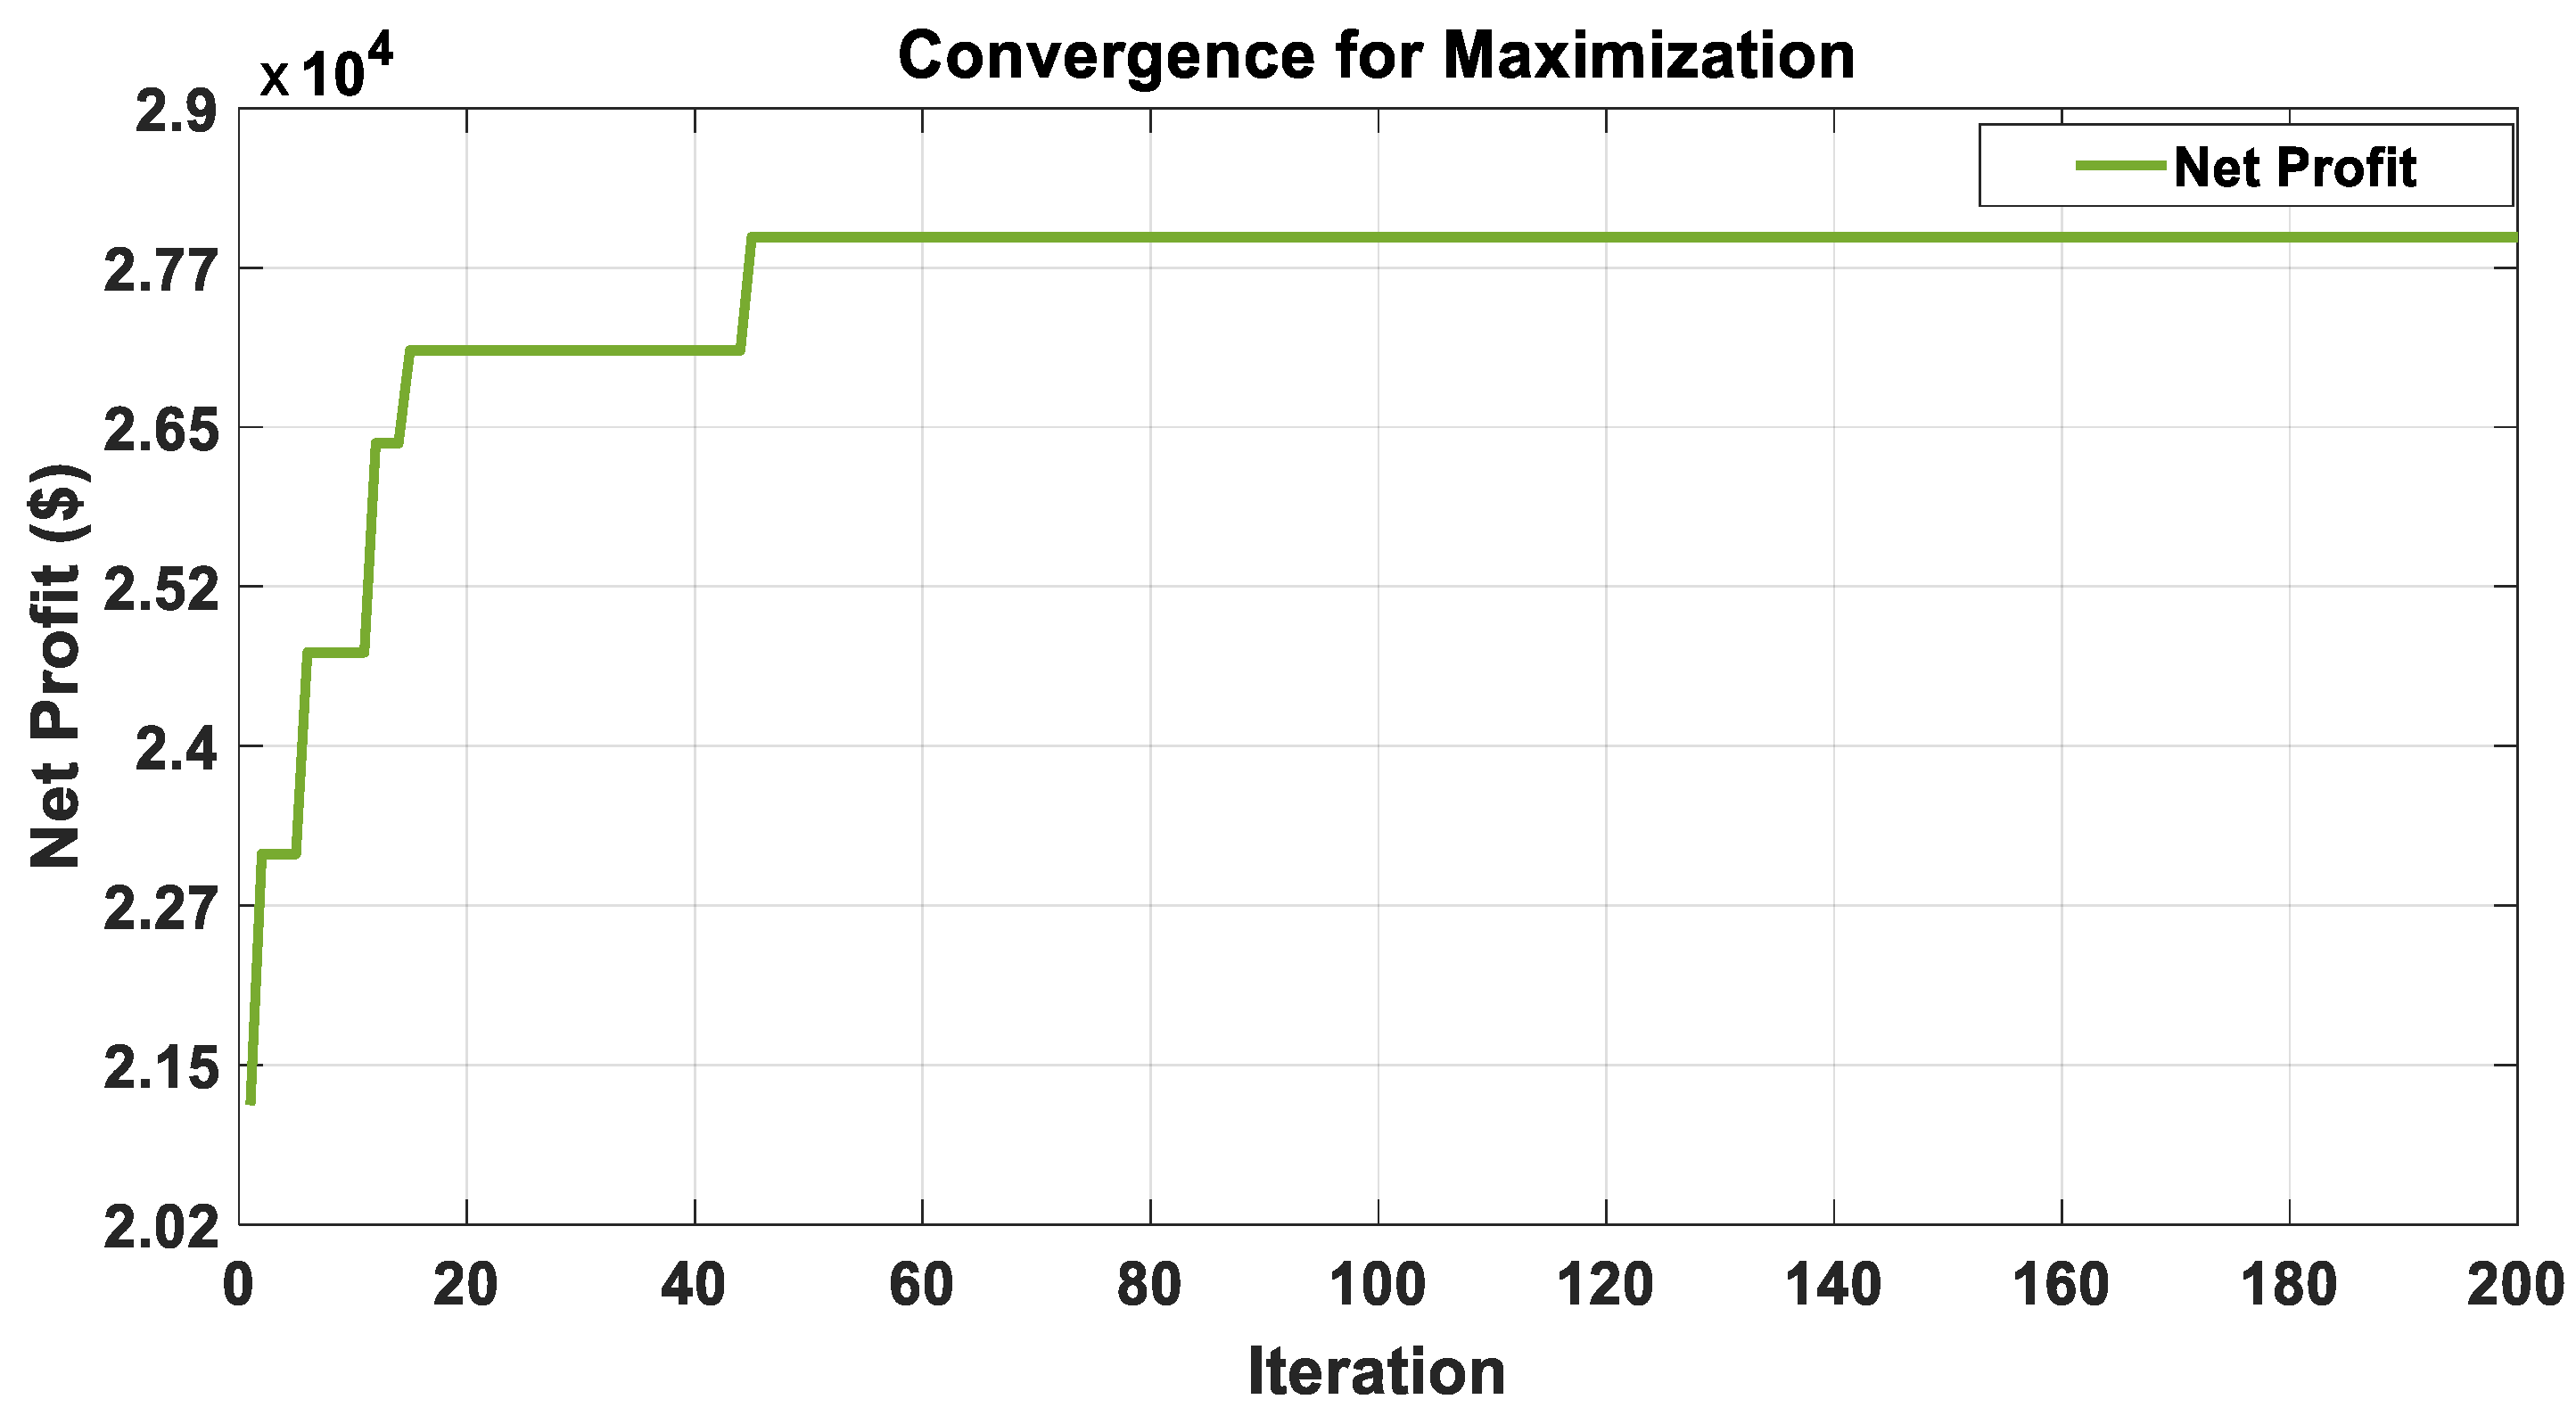
- Case I: Single-objective scheduling for profit maximization.
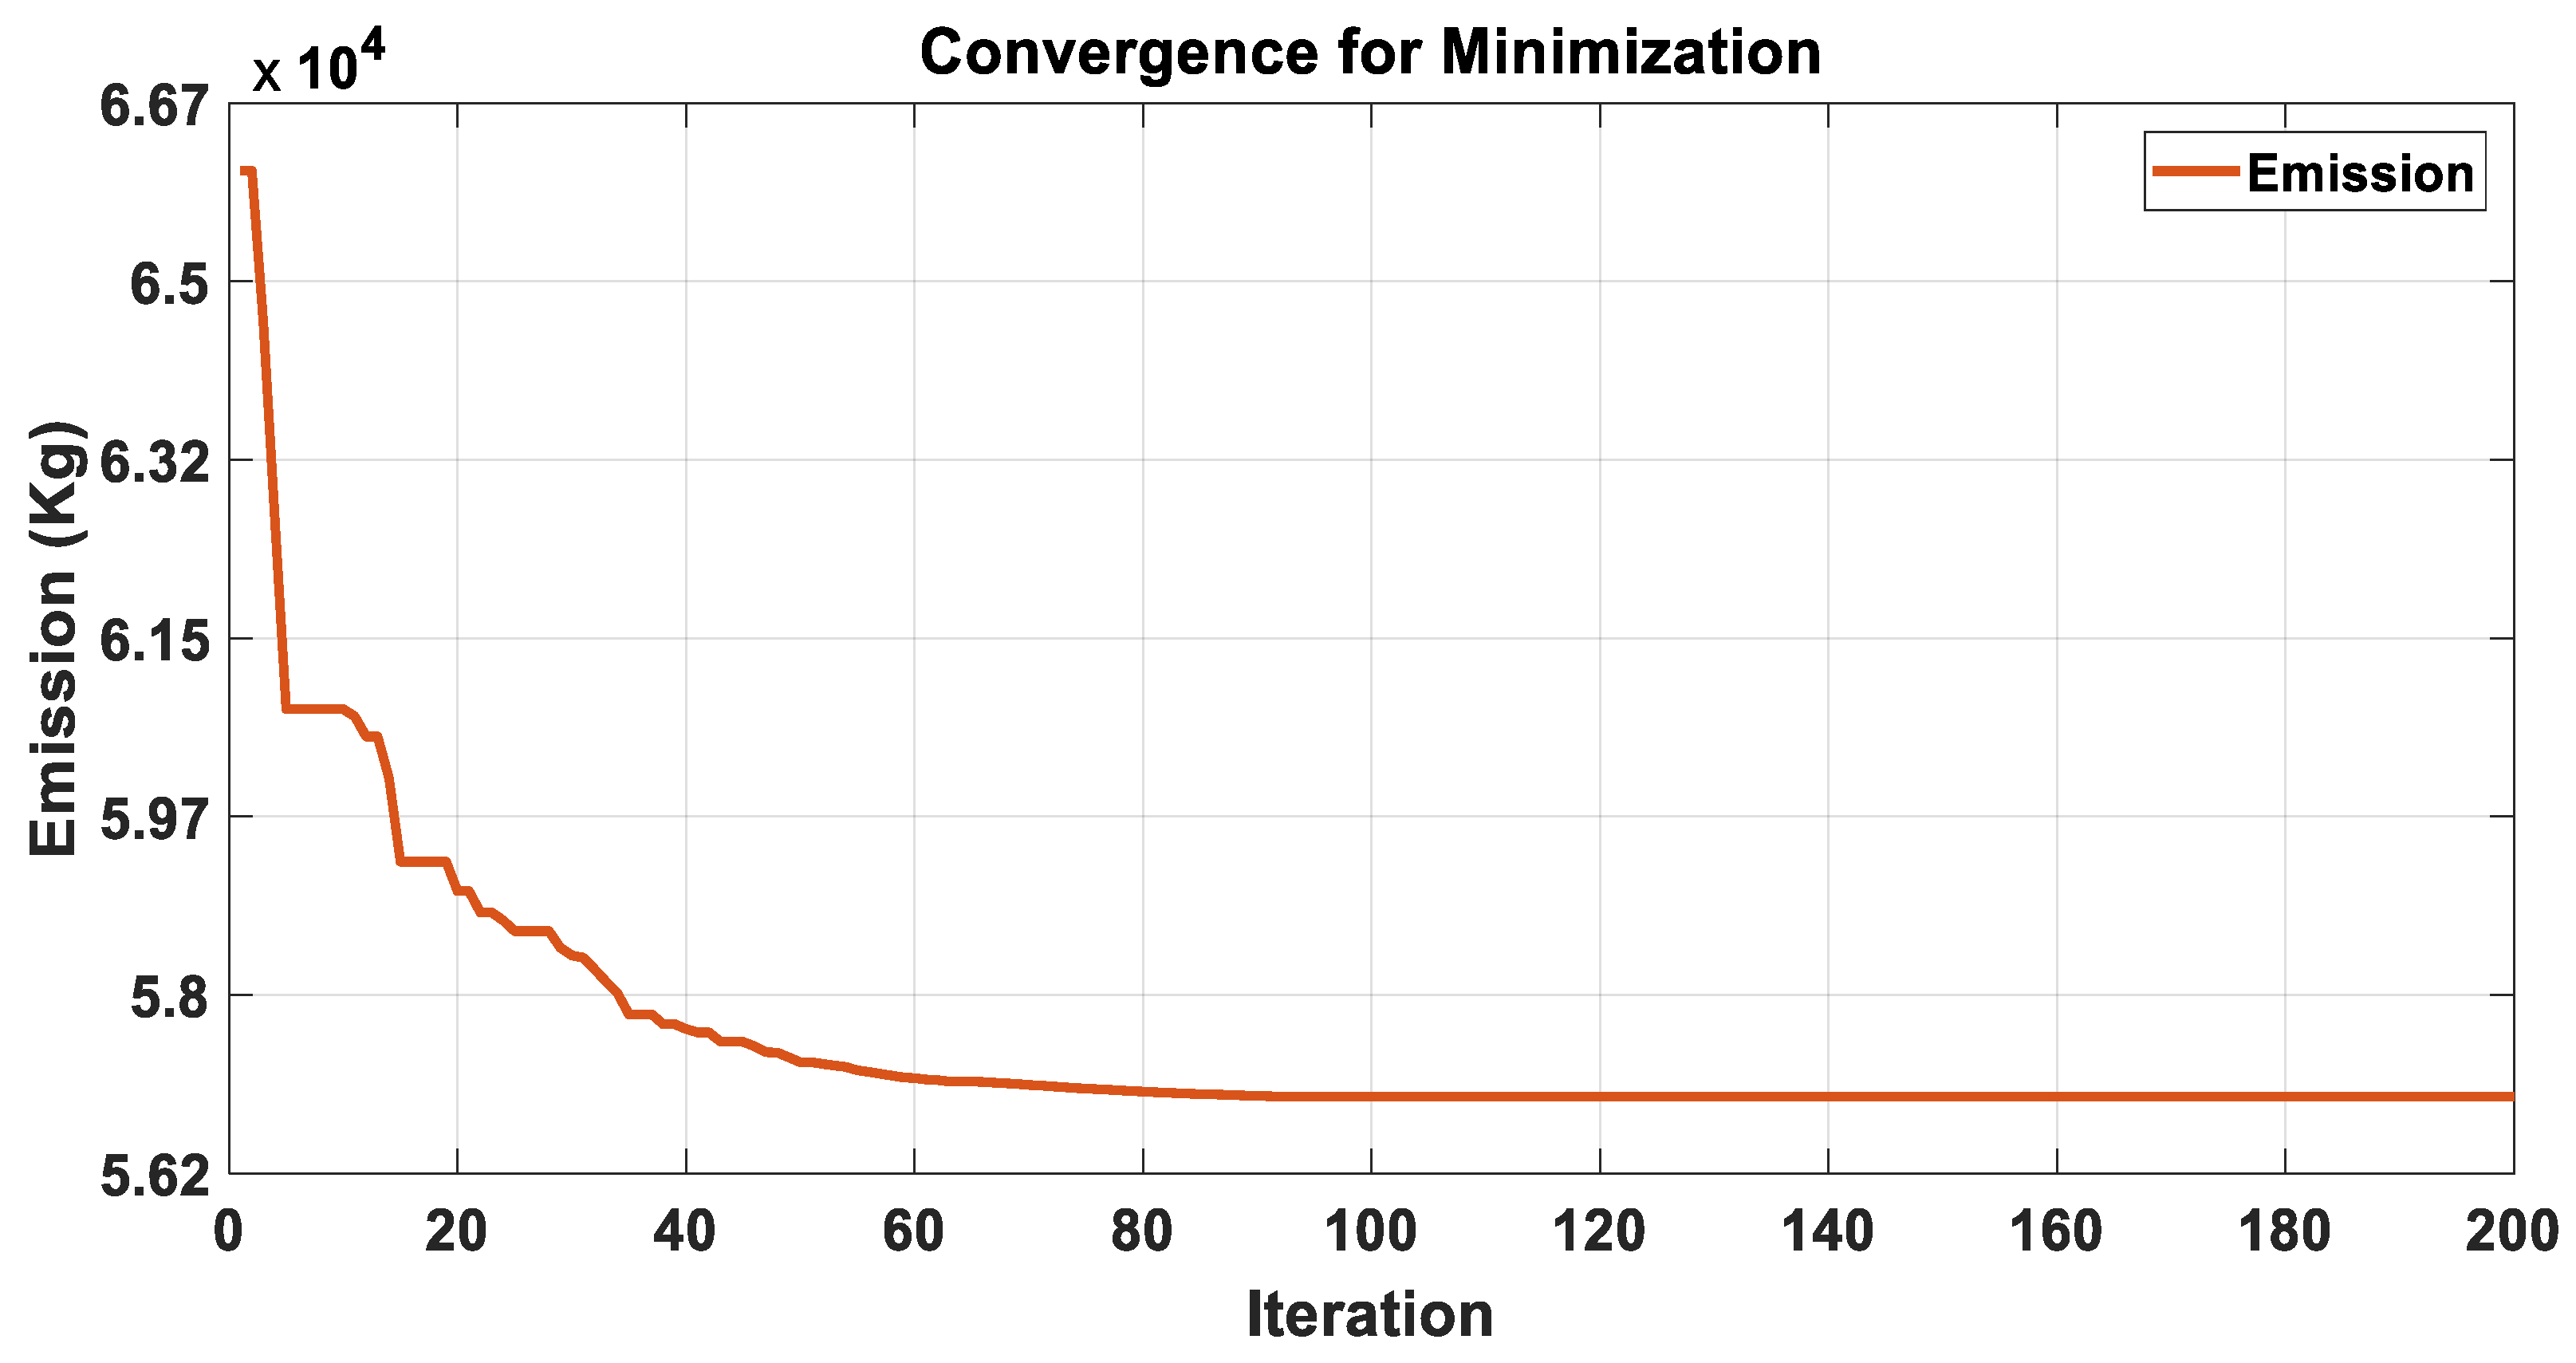
- Case II: Single-objective scheduling for emission minimization.
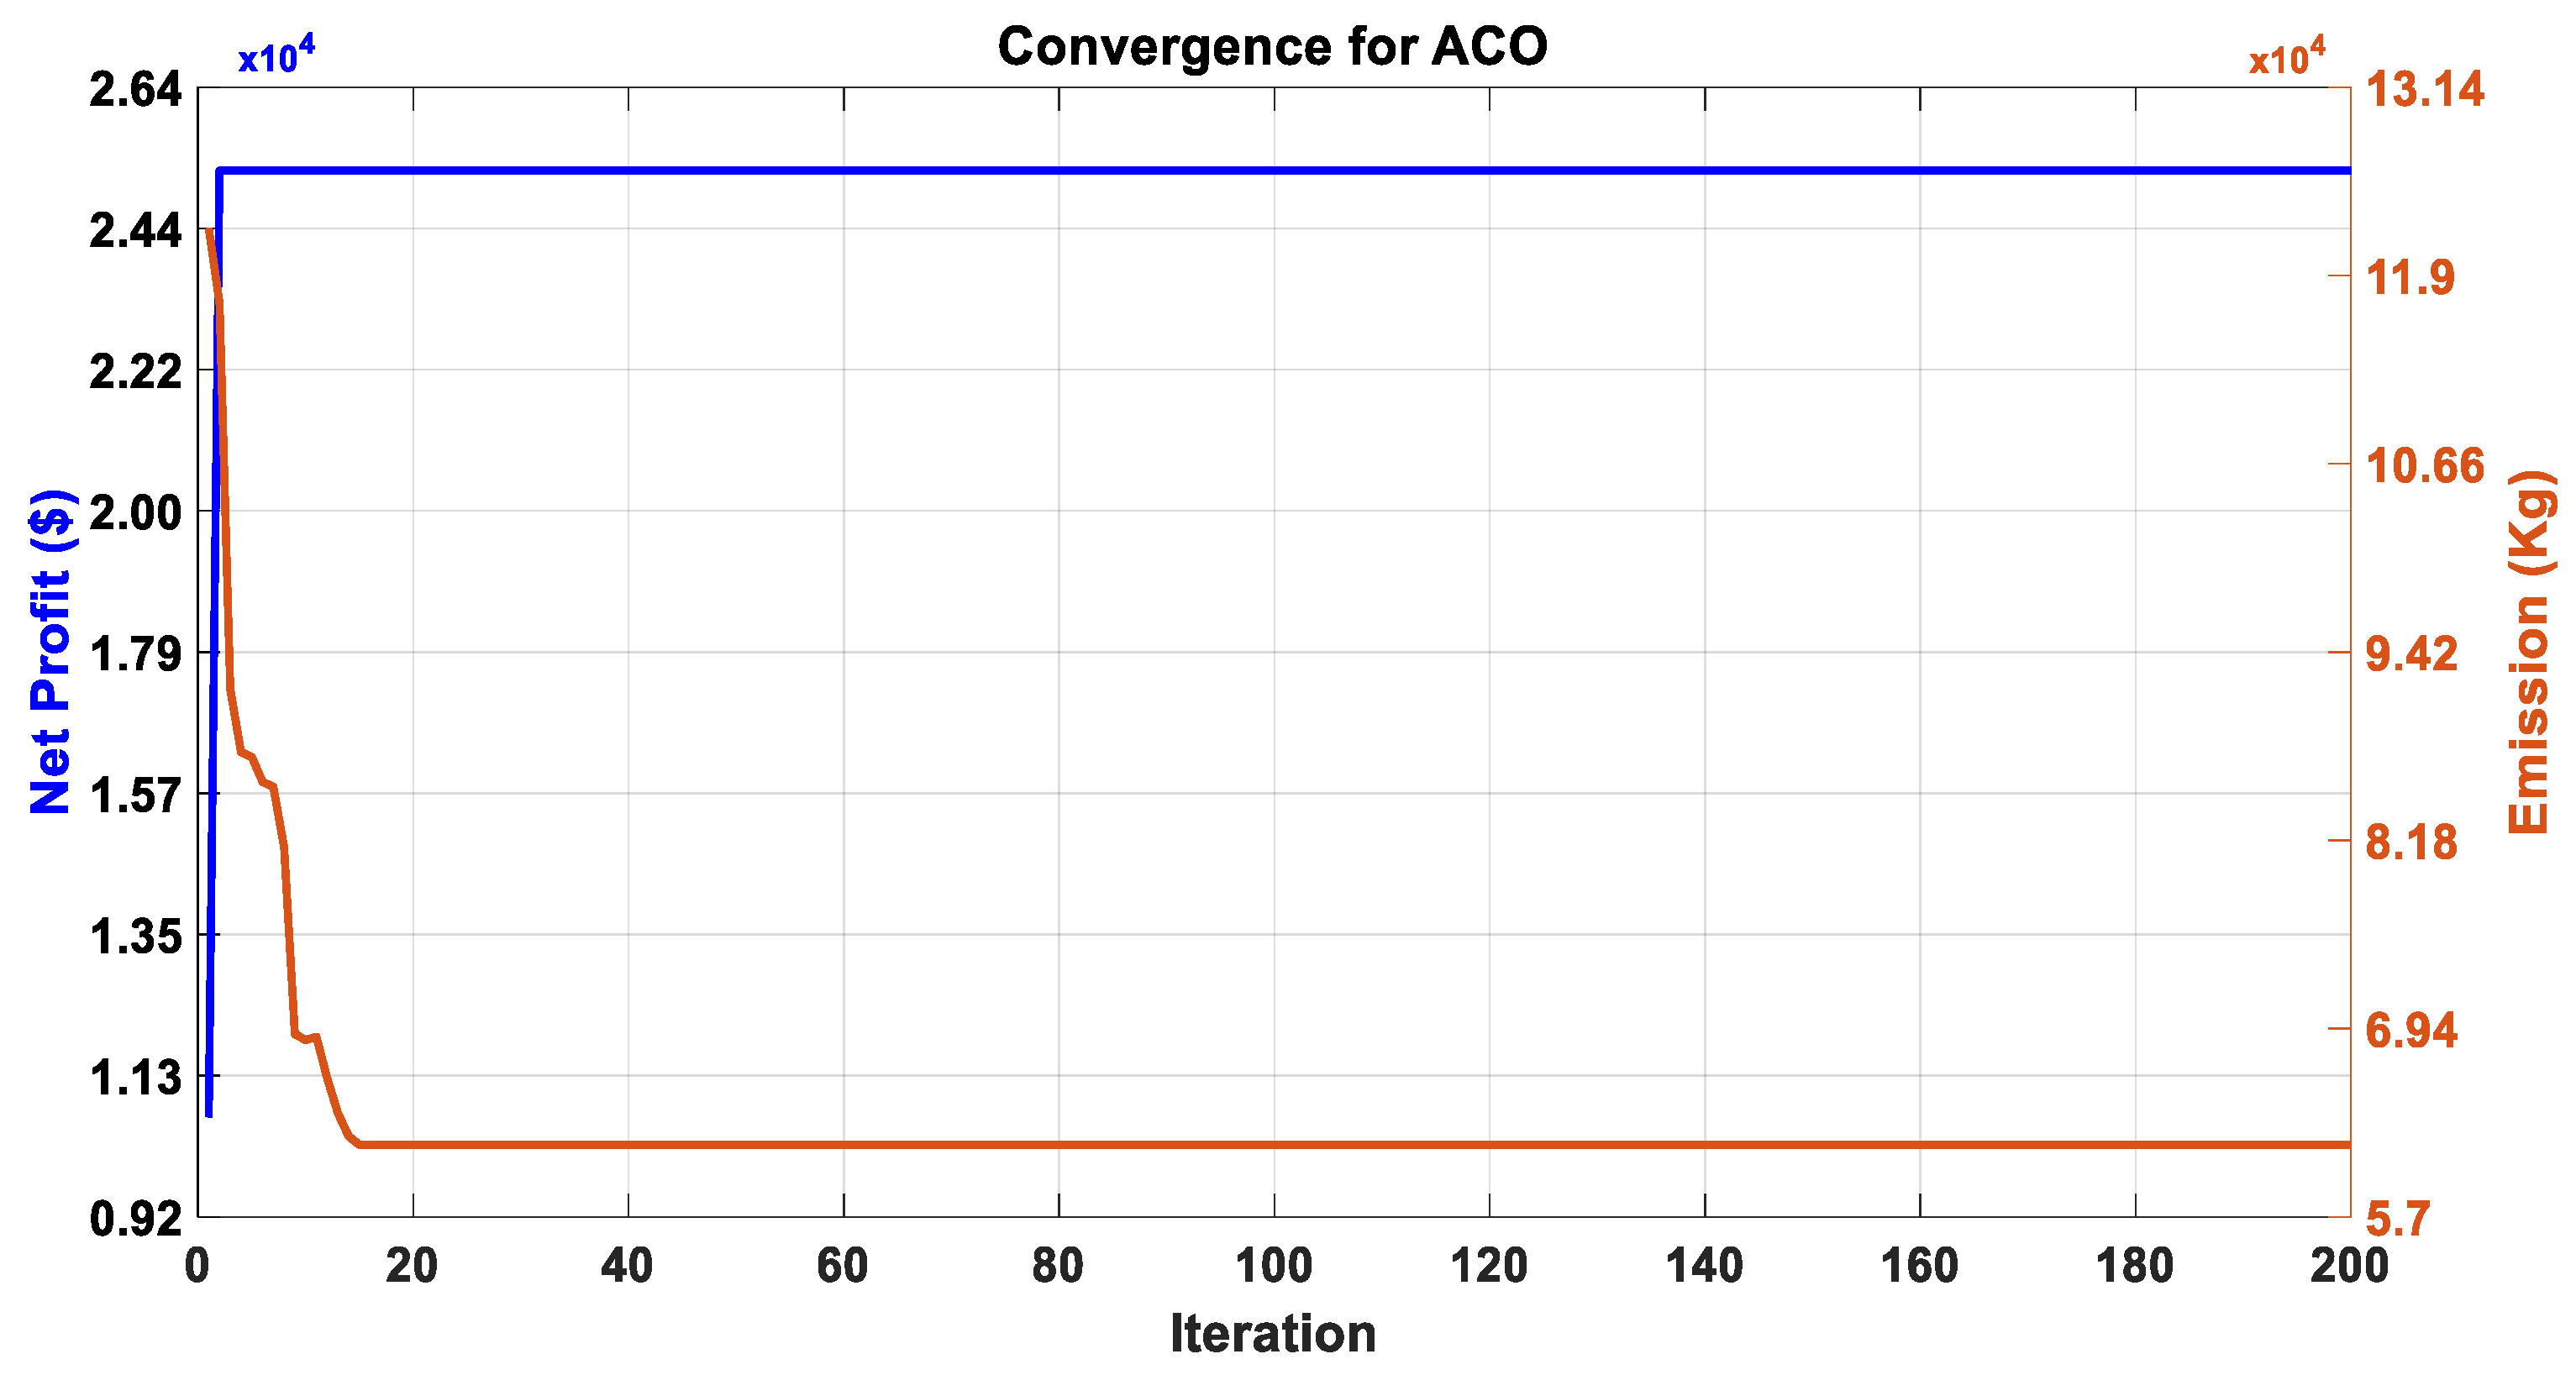
- Case III: Multi-objective scheduling for profit/emission, i.e., maximization followed by minimization.
5.1. Scenario Generation
5.1.1. Scenario I (Day-ahead Scheduling)
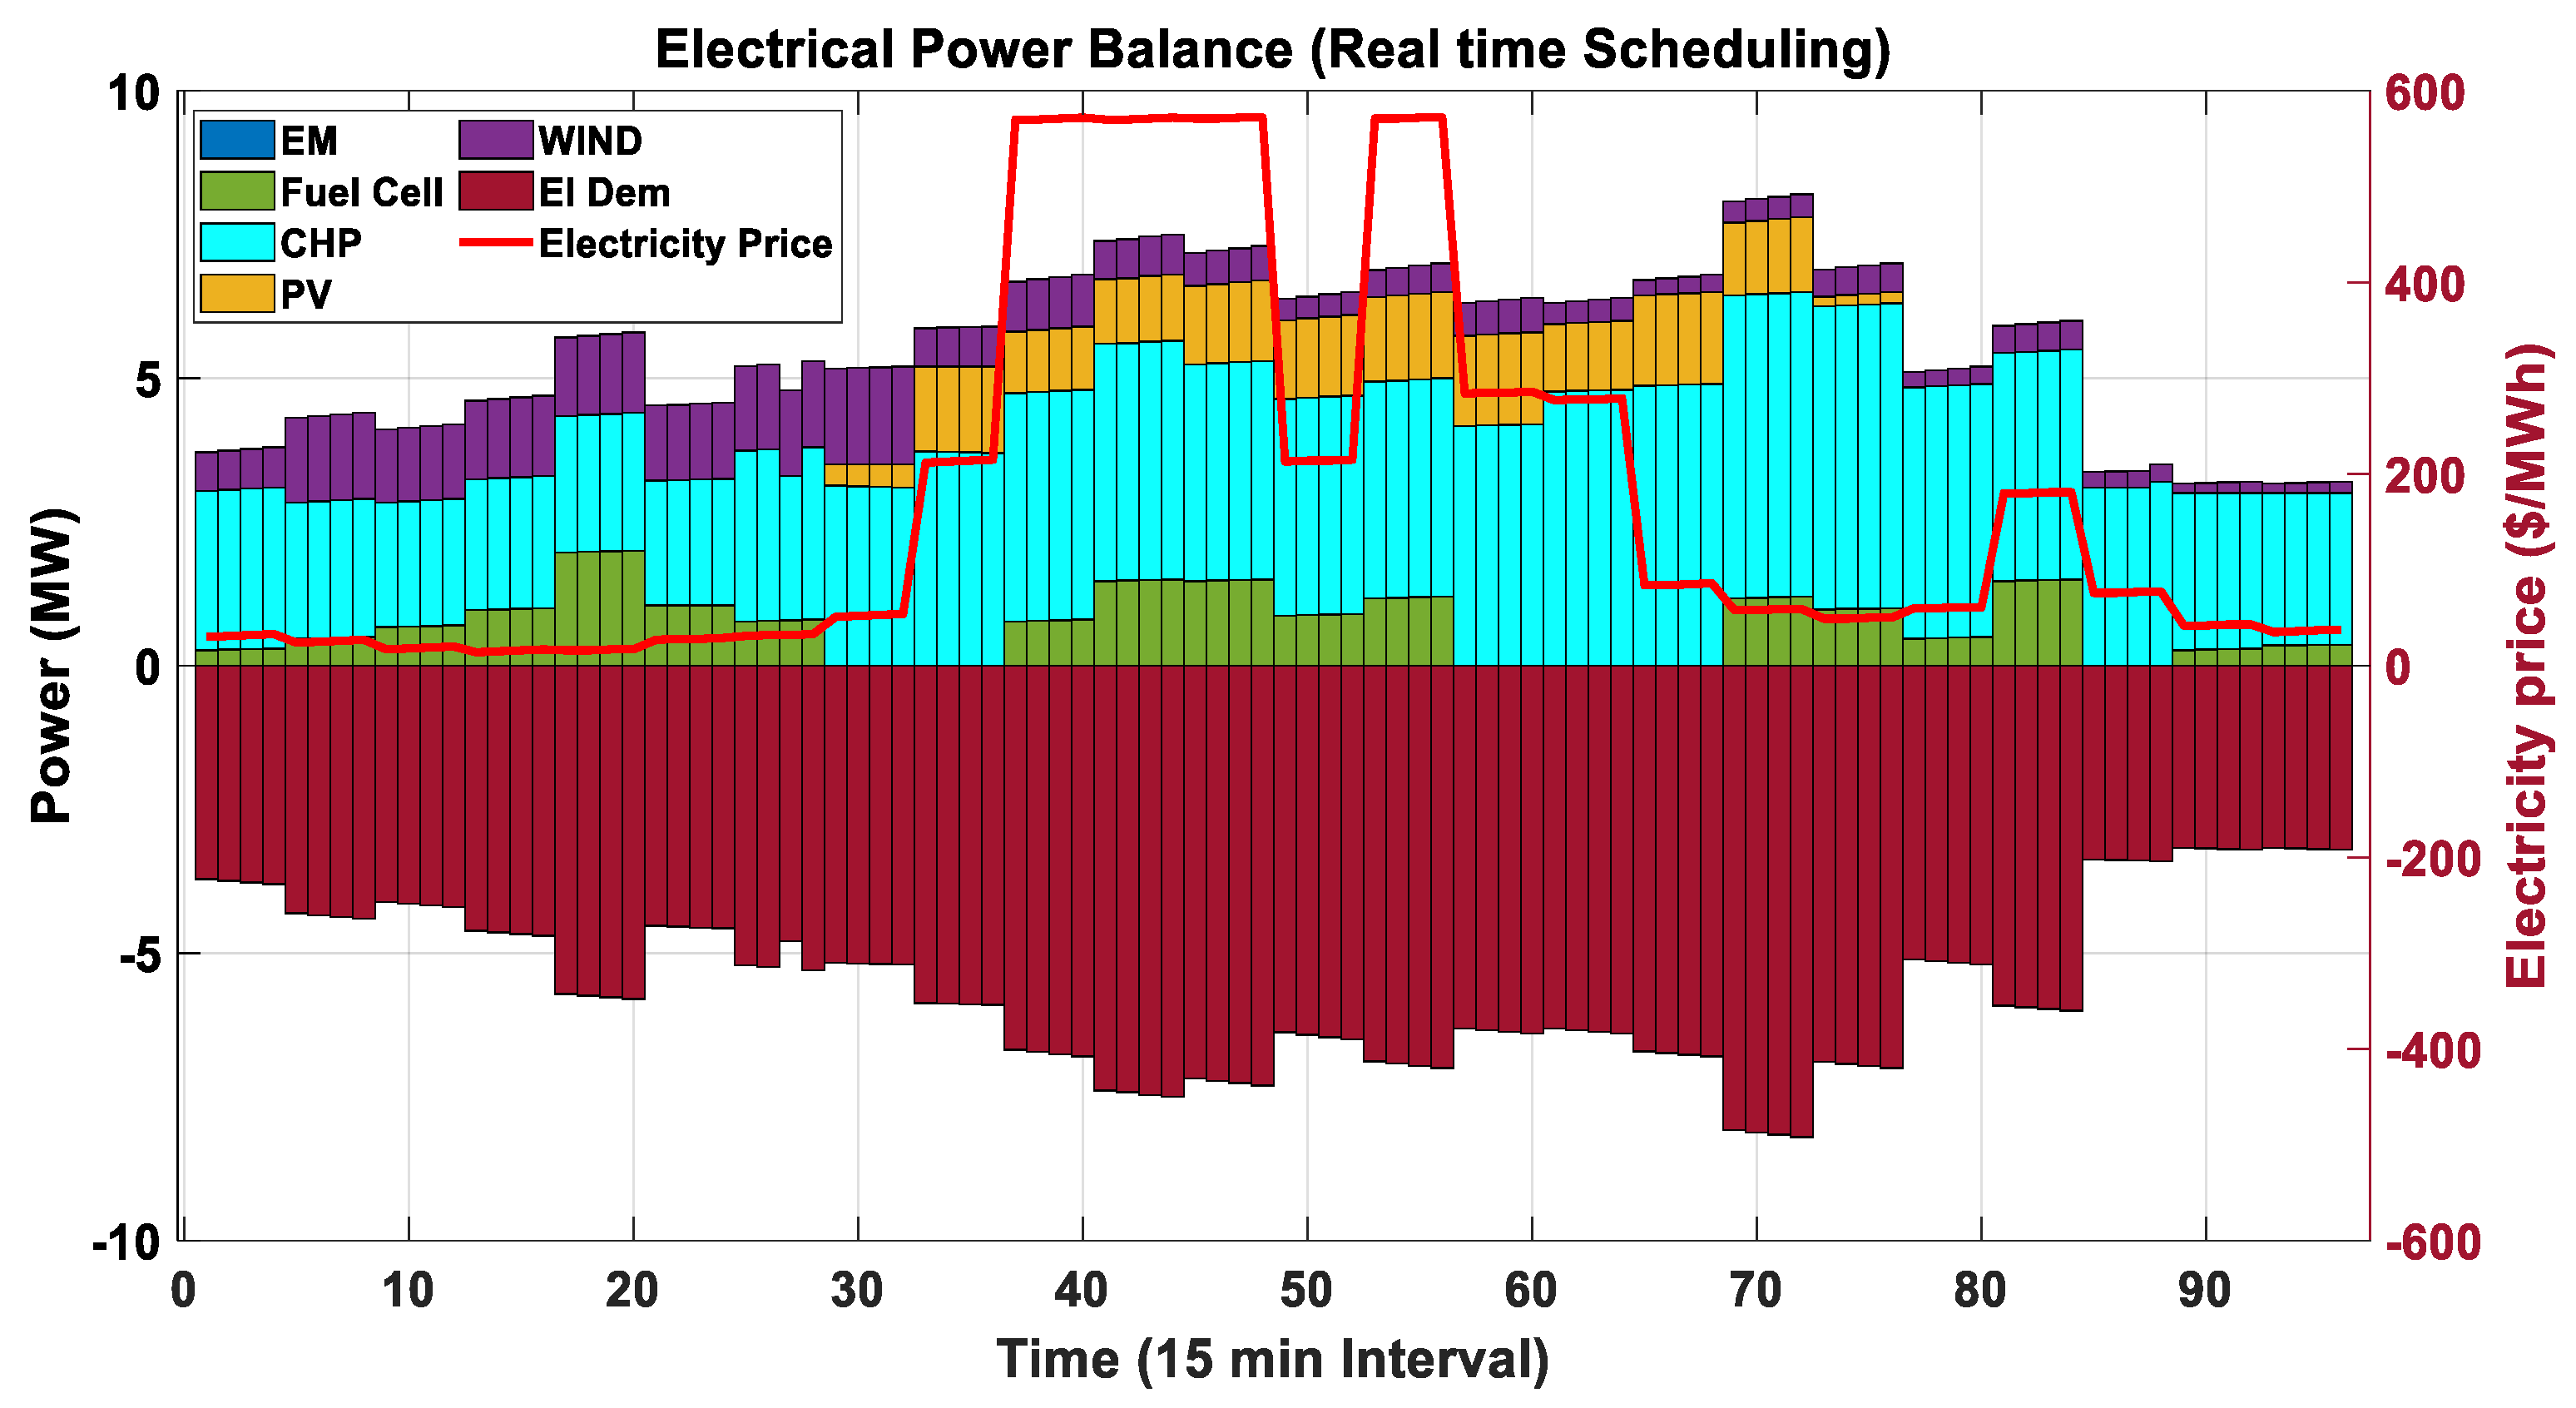
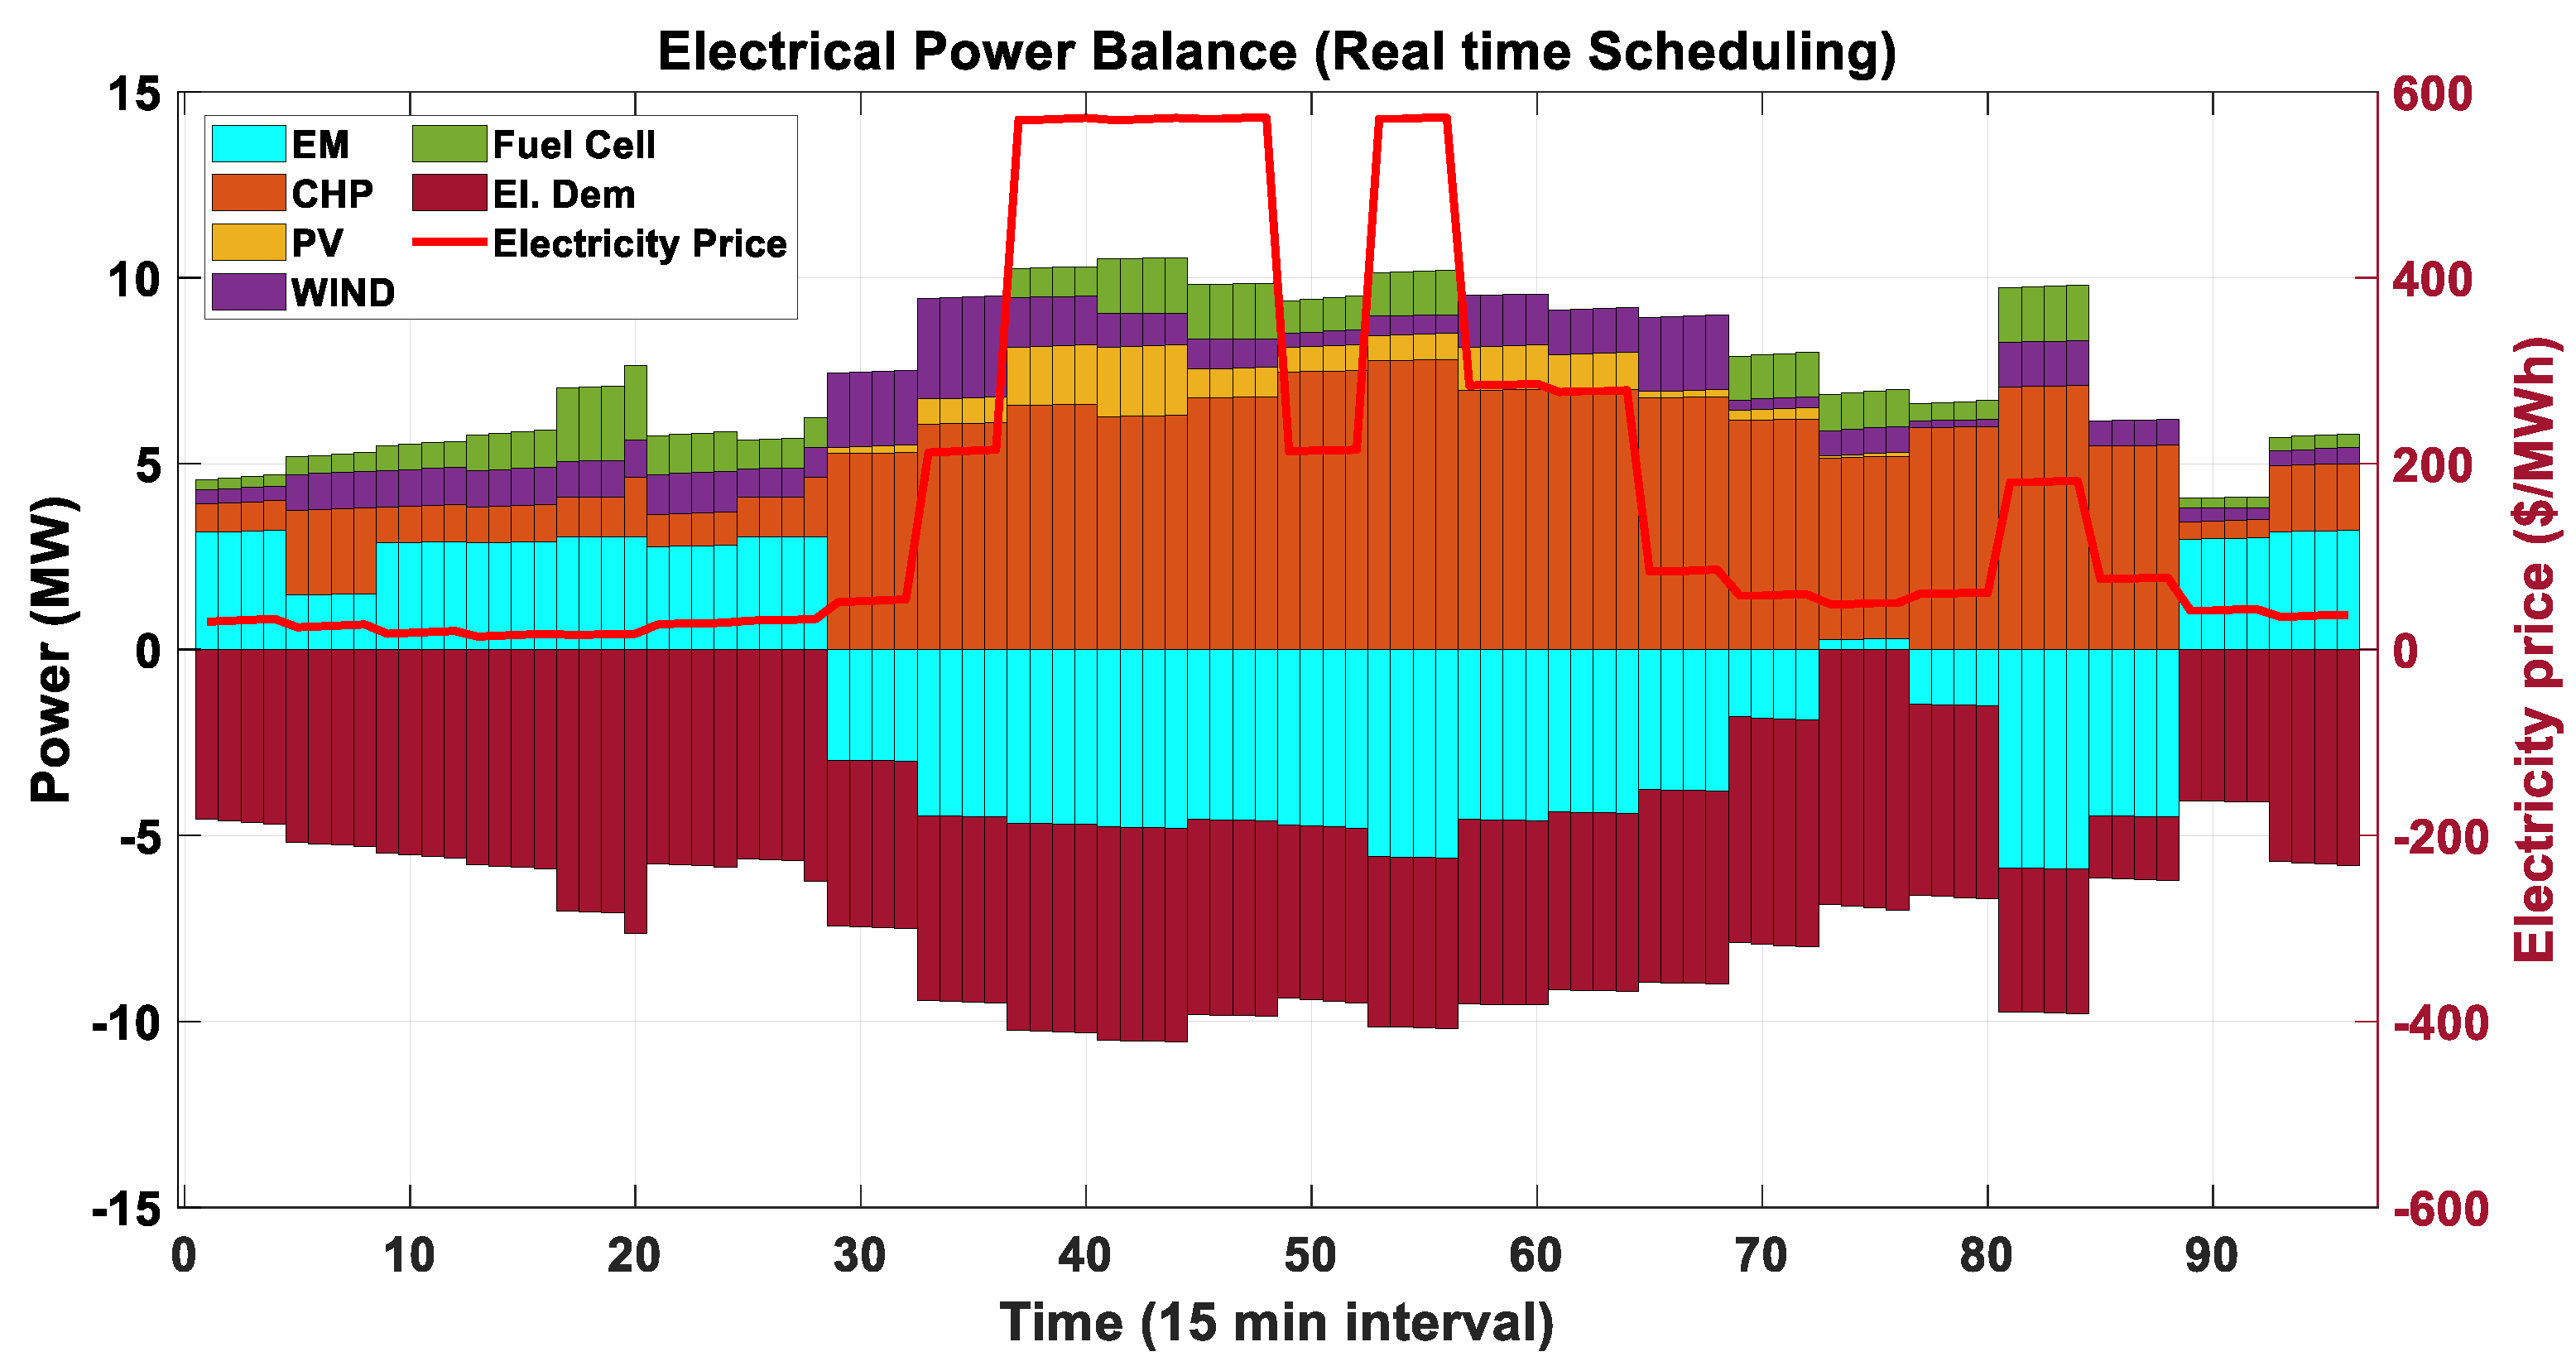
5.1.2. Scenario II (15-min Interval Scheduling)
- (a)
- Buying and selling of electricity one day before the following day.
- (b)
- The VPP acts as a price taker in the day-ahead market.
- (c)
- Ease of unit commitment and power dispatching.
- (a)
- This scheduling helps to determine the imbalance in settlement prices.
- (b)
- Offers the purchase and selling of electricity during the functioning day.
- (c)
- Real-time scheduling stabilizes the differences between day-ahead and real-time demand and production of electricity.
- (d)
- Operating systems that work in real-time can execute quickly without any delay, resulting in a nearly immediate output.
6. Conclusions
Author Contributions
Funding
Institutional Review Board Statement
Informed Con sent Statement
Data Availability Statement
Acknowledgments
Conflicts of Interest
Nomenclature
| TPP | Traditional power plant |
| DERs | Distributed energy resources |
| VPP | Virtual power plant |
| MOBWO | Multi-objective black widow optimization |
| MOOS | Multi-objective optimal scheduling |
| MOSS | Multi-objective scheduling strategy |
| SP | Spot pricing |
| TOU | Time of use |
| EVs | Electric vehicles |
| ES | Energy storage |
| RERs | Renewable energy resources |
| ICT | Information communication technology |
| IRP | Integrated resource planning |
| P2P | Peer to peer |
| NM | Net metering |
| BTM | Behind the meter |
| PSO | Particle swarm optimization |
| GA | Genetic algorithm |
| DR | Demand response |
| V2H | Vehicle to home |
| BSS | Battery storage system |
| CEM | Consecutive energy management |
| SOC | State of charge |
| TNPC | Total net present cost |
| UC | Unit commitment |
| SC | Soft computing |
| PV | Photovoltaics |
| WT | Wind turbine |
| FC | Fuel cells |
| CHP | Combined heat and power |
| EL | Electric load |
| EM | Energy market |
| PLR | Part load ratios |
| FOR | Feasible regions of operation |
| Probability distribution function | |
| FF | Fill factor |
| ACO | Ant colony optimization |
| ABC | Artificial bee colony |
| ANN | Artificial neural network |
| CR | Cannibalism rate |
| MR | Mutation rate |
| RP | Reproduction rate |
| PVPP | Peak valley power pricing |
References
- Saswat, S.S.; Patra, S.; Mishra, D.P.; Salkuti, S.R.; Senapati, R.N. Harnessing wind and solar PV system to build hybrid power system. Int. J. Power Electron. Drive Syst. 2021, 12, 2160. [Google Scholar] [CrossRef]
- Salkuti, S.R. Short-term optimal hydro-thermal scheduling using clustered adaptive teaching learning based optimization. Int. J. Electr. Comput. Eng. 2019, 9, 3359. [Google Scholar] [CrossRef]
- Reddy, S.S. Multi-objective based adaptive immune algorithm for solving the economic and environmental dispatch problem. Int. J. Appl. Eng. Res. 2017, 12, 1043–1048. [Google Scholar]
- Sravanthi, P.; Vuddanti, S. Solving realistic reactive power market clearing problem of wind-thermal power system with system security. Int. J. Emerg. Electr. Power Syst. 2022, 23, 125–144. [Google Scholar]
- Pal, P.; Krishnamoorthy, P.A.; Rukmani, D.K.; Antony, S.J.; Ocheme, S.; Subramanian, U.; Elavarasan, R.M.; Das, N.; Hasanien, H.M. Optimal Dispatch Strategy of Virtual Power Plant for Day-Ahead Market Framework. Appl. Sci. 2021, 11, 3814. [Google Scholar] [CrossRef]
- Han, S.; Mao, T.; Guo, X.; Wu, W.; Sun, L.; Wang, T.; Zhou, B.; Zhao, W. Profit Evaluation for Virtual Power Plant in Power Load Response: From the Perspective of Power Grid. In Proceedings of the 2020 IEEE 4th Conference on Energy Internet and Energy System Integration (EI2), Wuhan, China, 30 October–1 November 2020; IEEE: Piscataway, NJ, USA, 2020; pp. 2874–2878. [Google Scholar]
- Lombardi, P.; Powalko, M.; Rudion, K. Optimal operation of a virtual power plant. In Proceedings of the 2009 IEEE Power & Energy Society General Meeting, Calgary, AB, Canada, 26–30 July 2019; IEEE: Piscataway, NJ, USA, 2009; pp. 1–6. [Google Scholar]
- Saabit, S.M.; Hasan, S.; Chowdhury, N.A. Virtual Power Plant Implementation and Cost Minimization for Retail Industry. In Proceedings of the 2021 2nd International Conference for Emerging Technology (INCET), Belagavi, India, 21–23 May 2021; IEEE: Piscataway, NJ, USA, 2021; pp. 1–6. [Google Scholar]
- Reddy, S.S. Optimal scheduling of thermal-wind-solar power system with storage. Renew. Energy 2017, 101, 1357–1368. [Google Scholar] [CrossRef]
- Zhang, Y.; Yang, K.; Zheng, B.; Zhu, G.; Wang, D.; Li, S.; Xu, K.; Tu, T. Optimal Scheduling Strategies of the Virtual Power Plant Considering Different Development Stages of the Electricity Market. In Proceedings of the 2021 6th Asia Conference on Power and Electrical Engineering (ACPEE), Chongqing, China, 8–11 April 2021; IEEE: Piscataway, NJ, USA, 2021; pp. 1010–1016. [Google Scholar]
- Zhang, T.; Qin, Y.; Wu, W.; Zheng, M.; Huang, W.; Wang, L.; Xu, S.; Yan, X.; Ma, J.; Shao, Z. Research on Optimal Scheduling in Market Transaction for the Participation of Virtual Power Plants. In Proceedings of the 2019 6th International Conference on Information Science and Control Engineering (ICISCE), Shanghai, China, 20–22 December 2019; IEEE: Piscataway, NJ, USA, 2019; pp. 841–845. [Google Scholar]
- Naina, P.M.; Rajamani, H.; Swarup, K.S. Modeling and simulation of virtual power plant in energy management system applications. In Proceedings of the 2017 7th International Conference on Power Systems (ICPS), Pune, India, 21–23 December 2017; IEEE: Piscataway, NJ, USA, 2017; pp. 392–397. [Google Scholar]
- Zahedmanesh, A.; Muttaqi, K.M.; Sutanto, D. A consecutive energy management approach for a VPP comprising commercial loads and electric vehicle parking lots integrated with solar PV units and energy storage systems. In Proceedings of the 2019 1st Global Power, Energy and Communication Conference (GPECOM), Nevsehir, Turkey, 21–15 June 2019; IEEE: Piscataway, NJ, USA, 2019; pp. 242–247. [Google Scholar]
- Lombardi, P.; Sokolnikova, T.; Styczynski, Z.; Voropai, N. Virtual power plant management considering energy storage systems. IFAC Proc. Vol. 2012, 45, 132–137. [Google Scholar]
- Mishra, S.; Crasta, C.J.; Bordin, C.; Mateo-Fornés, J. Smart contract formation enabling energy-as-a-service in a virtual power plant. Int. J. Energy Res. 2022, 46, 3272–3294. [Google Scholar] [CrossRef]
- Renuka, T.K.; Reji, P.; Sreedharan, S. An enhanced particle swarm optimization algorithm for improving the renewable energy penetration and small signal stability in power system. Renew. Wind Water Sol. 2018, 5, 6. [Google Scholar] [CrossRef]
- Mohammed, O.H.; Amirat, Y.; Benbouzid, M. Particle swarm optimization of a hybrid wind/tidal/PV/battery energy system. Application to a remote area in Bretagne, France. Energy Procedia 2019, 162, 87–96. [Google Scholar] [CrossRef]
- Lombardi, P. Multi criteria Optimization of an autonomous virtual power plant with high degree of renewable energy sources. In Proceedings of the 17th PSCC, Stockholm, Sweden, 22–26 August 2011; pp. 22–26. [Google Scholar]
- Dehghanniri, M.F.; Golkar, M.A.; Jahangir, H. Virtual power plant performance strategy in the DA and RT market under uncertainties. In Proceedings of the 2021 11th Smart Grid Conference (SGC), Tabriz, Iran, 7–9 December 2021; IEEE: Piscataway, NJ, USA, 2021; pp. 1–5. [Google Scholar]
- Khandelwal, M.; Mathuria, P.; Bhakar, R. Profit based self-scheduling of virtual power plant under multiple locational marginal prices. In Proceedings of the 2018 20th National Power Systems Conference (NPSC), Tiruchirappalli, India, 14–16 December 2018; IEEE: Piscataway, NJ, USA, 2018; pp. 1–6. [Google Scholar]
- Gough, M.; Santos, S.F.; Lotfi, M.; Javadi, M.S.; Osorio, G.J.; Ashraf, P.; Castro, R.; Catalao, J.P.S. Operation of a Technical Virtual Power Plant Considering Diverse Distributed Energy Resources. IEEE Trans. Ind. Appl. 2022, 58, 2547–2558. [Google Scholar] [CrossRef]
- Hadayeghparast, S.; Farsangi, A.S.; Shayanfar, H. Day-ahead stochastic multi-objective economic/ emission operational scheduling of a large scale virtual power plant. Energy 2019, 172, 630–646. [Google Scholar] [CrossRef]
- Tascikaraoglu, A.; Erdinc, O.; Uzunoglu, M.; Karakas, A. An adaptive load dispatching and forecasting strategy for a virtual power plant including renewable energy conversion units. Appl. Energy 2014, 119, 445–453. [Google Scholar] [CrossRef]
- Zhang, C.; Ouyang, D.; Ning, J. An artificial bee colony approach for clustering. Expert Syst. Appl. 2010, 37, 4761–4767. [Google Scholar] [CrossRef]
- Aydin, D.; Özyön, S.; Yaşar, C.; Liao, T. Artificial bee colony algorithm with dynamic population size to combined economic and emission dispatch problem. Int. J. Electr. Power Energy Syst. 2014, 54, 144–153. [Google Scholar] [CrossRef]
- Narkhede, M.S.; Chatterji, S.; Ghosh, S. Multi objective optimal dispatch in a virtual power plant using genetic algorithm. In Proceedings of the 2013 International Conference on Renewable Energy and Sustainable Energy (ICRESE), Coimbatore, India, 5–6 December 2013; IEEE: Piscataway, NJ, USA, 2013; pp. 238–242. [Google Scholar]
- Eiben, Á.E.; Hinterding, R.; Michalewicz, Z. Parameter control in evolutionary algorithms. IEEE Trans. Evol. Comput. 1999, 3, 124–141. [Google Scholar] [CrossRef]
- Kumar, S.; Pal, N.S. Ant colony optimization for less power consumption and fast charging of battery in solar grid system. In Proceedings of the 2017 4th IEEE Uttar Pradesh Section International Conference on Electrical, Computer and Electronics (UPCON), Mathura, India, 26–28 October 2017; IEEE: Piscataway, NJ, USA, 2017; pp. 244–249. [Google Scholar]
- Rekik, M.; Chtourou, Z.; Mitton, N.; Atieh, A. Geographic routing protocol for the deployment of virtual power plant within the smart grid. Sustain. Cities Soc. 2016, 25, 39–48. [Google Scholar] [CrossRef]
- Biswas, M.A.R.; Robinson, M.D.; Fumo, N. Prediction of residential building energy consumption: A neural network approach. Energy 2016, 117, 84–92. [Google Scholar] [CrossRef]
- You, S. Developing Virtual Power Plant for Optimized Distributed Energy Resources Operation and Integration. Ph.D. Thesis, Technical University of Denmark, Lyngby, Denmark, 2010. [Google Scholar]
- Simoes, M.; Bose, B.K.; Spiegel, R.J. Design and performance evaluation of a fuzzy-logic-based variable-speed wind generation system. IEEE Trans. Ind. Appl. 1997, 33, 956–965. [Google Scholar] [CrossRef]
- Niknam, T.; Azizipanah-Abarghooee, R.; Narimani, M.R. An efficient scenario-based stochastic programming framework for multi-objective optimal micro-grid operation. Appl. Energy 2012, 99, 455–470. [Google Scholar] [CrossRef]
- Wang, Y.; Ai, X.; Tan, Z.; Yan, L.; Liu, S. Interactive dispatch modes and bidding strategy of multiple virtual power plants based on demand response and game theory. IEEE Trans. Smart Grid 2015, 7, 510–519. [Google Scholar] [CrossRef]
- Dabbagh, S.R.; Sheikh-El-Eslami, M.K. Risk-based profit allocation to DERs integrated with a virtual power plant using cooperative Game theory. Electr. Power Syst. Res. 2015, 121, 368–378. [Google Scholar] [CrossRef]
- Pandey, A.K.; Jadoun, V.K.; Jayalakshmi, N.S. Virtual Power Plants: A New Era of Energy Management in Modern Power Systems. In Proceedings of the 2021 8th International Conference on Signal Processing and Integrated Networks (SPIN), Noida, India, 26–27 August 2021; IEEE: Piscataway, NJ, USA, 2021; pp. 538–543. [Google Scholar]
- Wu, Z.; Gu, W.; Wang, R.; Yuan, X.; Liu, W. Economic optimal schedule of CHP microgrid system using chance constrained programming and particle swarm optimization. In Proceedings of the 2011 IEEE Power and Energy Society General Meeting, Detroit, MI, USA, 24–28 July 2011; IEEE: Piscataway, NJ, USA, 2011; pp. 1–11. [Google Scholar]
- Nazari-Heris, M.; Abapour, S.; Mohammadi-Ivatloo, B. Optimal economic dispatch of FC-CHP based heat and power micro-grids. Appl. Therm. Eng. 2017, 114, 756–769. [Google Scholar] [CrossRef]
- Zamani, A.G.; Zakariazadeh, A.; Jadid, S.; Kazemi, A. Stochastic operational scheduling of distributed energy resources in a large scale virtual power plant. Int. J. Electr. Power Energy Syst. 2016, 82, 608–620. [Google Scholar] [CrossRef]
- Nojavan, S.; Zare, K.; Mohammadi-Ivatloo, B. Application of fuel cell and electrolyzer as hydrogen energy storage system in energy management of electricity energy retailer in the presence of the renewable energy sources and plug-in electric vehicles. Energy Convers. Manag. 2017, 136, 404–417. [Google Scholar] [CrossRef]
- Ali, E.S.; El-Sehiemy, R.A.; El-Ela, A.A.A.; Tostado-Véliz, M.; Kamel, S. A proposed uncertainty reduction criterion of renewable energy sources for optimal operation of distribution systems. Appl. Sci. 2022, 12, 623. [Google Scholar] [CrossRef]
- Available online: https://www.meteoblue.com/en/weather/archive/export/basel_switzerland_2661604 (accessed on 7 March 2022).
- Available online: https://niwe.res.in/department_r&d,rdaf_time_series_data.php (accessed on 7 March 2022).
- Hayyolalam, V.; Kazem, A.A.P. Black widow optimization algorithm: A novel meta-heuristic approach for solving engineering optimization problems. Eng. Appl. Artif. Intell. 2020, 87, 103249. [Google Scholar] [CrossRef]
- Devi, M.R.; Jeya, I.J.S. Black Widow Optimization Algorithm and Similarity Index Based Adaptive Scheduled Partitioning Technique for Reliable Emergency Message Broadcasting in VANET. Mapp. Intimacies 2021. [Google Scholar] [CrossRef]
- Zamani, A.G.; Zakariazadeh, A.; Jadid, S. Day-ahead resource scheduling of a renewable energy based virtual power plant. Appl. Energy 2016, 169, 324–340. [Google Scholar] [CrossRef]
- Zakariazadeh, A.; Jadid, S.; Siano, P. Stochastic multi-objective operational planning of smart distribution systems considering demand response programs. Electr. Power Syst. Res. 2014, 111, 156–168. [Google Scholar] [CrossRef]
- Tostado-Véliz, M.; Mouassa, S.; Jurado, F. A MILP framework for electricity tariff-choosing decision process in smart homes considering ‘Happy Hours’ tariffs. Int. J. Electr. Power Energy Syst. 2021, 131, 107139. [Google Scholar] [CrossRef]


| Refs. No. | Nature of Problem | Control Method | Features of Control Method |
|---|---|---|---|
| [22,23] | Heuristic | PSO/MOPSO | Fewer parameters. Ease of implementation. Local entrapment. |
| [24,25] | Stochastic | ABC | Poor in exploitation stage. Limited population diversity. |
| [26,27] | Computational | ANN | More precise predictions. Good computational efficiency. |
| [28,29] | Heuristic | GA | Can determine multiple solutions simultaneously. |
| [30,31] | Meta-heuristic | ACO | Can discover good solutions rapidly. |
| [32,33] | Mathematical | Fuzzy Logic | Improved prediction accuracy. Use of Fuzzy sets. |
| [34,35] | Mathematical | Game Theory | Computational load increases as the no. of participants increases. |
| This paper | Meta-heuristic | BWO/MOBWO | High searching accuracy. Better updating strategy. Converge to the global optimum in lesser iterations. |
| Emissions | Heat-Only Unit | CHP Unit |
|---|---|---|
| SO2 | 0.0027 | 0.0036 |
| NOX CO2 | 0.3145 401.43 | 0.1995 723.94 |
| (MW) | (m/s) | (m/s) | (m/s) | |
|---|---|---|---|---|
| 150 | 3.5 | 25 | 13.5 | 3 |
| (V) | (A) | (I/°C) | (V/°C) | (°C) | (A) | (V) | |
|---|---|---|---|---|---|---|---|
| 21.98 | 5.32 | 0.003 | 0.0144 | 43 | 4.76 | 17.32 | 2240 |
| (MWth) | ($/MWth2) | ($/MWth) | ($) |
|---|---|---|---|
| 1.2 | 0.052 | 3.0651 | 4.8 |
| ($/MW2) | ($/MW) | ($) | ($/MWth2) | ($/MWth) | ($/MW.MWth) | ($) | ($) |
|---|---|---|---|---|---|---|---|
| 0.0345 | 44.5 | 26.5 | 0.03 | 4.2 | 0.031 | 20 | 20 |
| Output | Ref. [46] | MOPSO [22] | ABC | ACO | Proposed MOBWO |
|---|---|---|---|---|---|
| Maximum Profit ($) | 19,737 | 23,302.8271 | 24,191.8221 | 24,950.7372 | 27,785.6723 |
| Minimum Profit ($) | - | 22,600.1679 | 19,636.7483 | 20,190.8183 | 21,400.3254 |
| Mean Profit ($) | - | 22,955.3462 | 21,914.2852 | 22,570.7776 | 24,592.9985 |
| Computational time (Seconds) | - | 148.095 (For 20 runs) | 139.3737 (For 100 runs) | 135.4932 (For 100 runs) | 123.058 (For 100 runs) |
| Output | Ref. [47] | MOPSO [22] | ABC | ACO | Proposed MOBWO |
|---|---|---|---|---|---|
| Minimum Emission (Kg) | 56,270 | 64,432.3217 | 62,467.8291 | 61,346.4838 | 57,532.2738 |
| Maximum Emission (Kg) | 77,430 | 67,077.3937 | 72,383.7292 | 71.463.2612 | 67,342.3798 |
| Mean Emission (Kg) | - | 66,070.1682 | 67,425.7792 | 66,404.8725 | 62,437.3268 |
| Computational Time (Sec) | - | 171.4826 (For 20 runs) | 153.4826 (For 100 runs) | 131.3633 (For 100 runs) | 81.3745 (For 100 runs) |
| Period | Detail Time (Hr.) | Purchase Price ($/MWh) | Sale Price ($/MWh) |
|---|---|---|---|
| Peak | 9,12,17,22 | 0.0079 | 0.0044 |
| Intermediate | 13,16 | 0.0070 | 0.0035 |
| Valley | 1,8,23,24 | 0.0062 | 0.0026 |
| Objective Functions | Profit ($) | Emissions (Kg) | ||||||
|---|---|---|---|---|---|---|---|---|
| Parameters | MOPSO [22] | ABC | ACO | MOBWO | MOPSO [22] | ABC | ACO | MOBWO |
| MaxFprofit | 23,302.83 | 24,286.82 | 25,183.74 | 26,167.78 | 122,963.46 | 119,789.29 | 119,432.37 | 116,400.85 |
| MinFemission | 9883.69 | 10,320.38 | 11,723.47 | 11,808.47 | 64,432.32 | 62,467.83 | 61,346.48 | 58,785.34 |
| Objective Functions | Profit ($) | Emissions (Kg) | ||||
|---|---|---|---|---|---|---|
| Parameters | ABC | ACO | MOBWO | ABC | ACO | MOBWO |
| MaxFprofit | 27,392.5631 | 26,312.3523 | 28,415.3525 | 120,913.4532 | 120,325.463 | 119,843.4532 |
| MinFemission | 10,404.7262 | 11,123.4253 | 11,929.7262 | 56,402.4216 | 57,342.4235 | 59,921.3248 |
Publisher’s Note: MDPI stays neutral with regard to jurisdictional claims in published maps and institutional affiliations. |
© 2022 by the authors. Licensee MDPI, Basel, Switzerland. This article is an open access article distributed under the terms and conditions of the Creative Commons Attribution (CC BY) license (https://creativecommons.org/licenses/by/4.0/).
Share and Cite
Pandey, A.K.; Jadoun, V.K.; Sabhahit, J.N. Real-Time Peak Valley Pricing Based Multi-Objective Optimal Scheduling of a Virtual Power Plant Considering Renewable Resources. Energies 2022, 15, 5970. https://doi.org/10.3390/en15165970
Pandey AK, Jadoun VK, Sabhahit JN. Real-Time Peak Valley Pricing Based Multi-Objective Optimal Scheduling of a Virtual Power Plant Considering Renewable Resources. Energies. 2022; 15(16):5970. https://doi.org/10.3390/en15165970
Chicago/Turabian StylePandey, Anubhav Kumar, Vinay Kumar Jadoun, and Jayalakshmi N. Sabhahit. 2022. "Real-Time Peak Valley Pricing Based Multi-Objective Optimal Scheduling of a Virtual Power Plant Considering Renewable Resources" Energies 15, no. 16: 5970. https://doi.org/10.3390/en15165970
APA StylePandey, A. K., Jadoun, V. K., & Sabhahit, J. N. (2022). Real-Time Peak Valley Pricing Based Multi-Objective Optimal Scheduling of a Virtual Power Plant Considering Renewable Resources. Energies, 15(16), 5970. https://doi.org/10.3390/en15165970