1. Introduction
This paper offers two insights that are new to many scholars researching the energy transition. The first insight is that the full magnitude of the challenge of replacing all global fossil fuel (FF) use in the energy sector with zero-carbon energy by 2050 goes well beyond a technological substitution. Using a simple calculation, we show that, as a result of delays in effective climate mitigation, increasing global energy consumption, and the absence of affordable methods of removing CO2 from the atmosphere on a large scale, it now appears to be too late for technological change alone if we are to complete the energy transition by 2050. Under these circumstances, energy descent—that is, a substantial reduction in global energy consumption, whose magnitude is quantified in this paper—is almost certainly necessary. As a result, a much greater range of policies must be financed than those needed to drive technological changes within the energy sector. This leads to the second insight: since conventional methods of financing the transition are unlikely to be sufficient, an unconventional method is therefore proposed and explained.
The physical goal considered in this paper is to substitute zero-carbon technologies and other policies for all FF use in the energy sector by 2050, thus eliminating all greenhouse gas (GHG) emissions from the energy sector. Zero-carbon is preferred to net-zero carbon in the energy sector, because net zero may have to be reserved for emissions from agriculture and some non-energy industrial processes. Net zero means that any remaining emissions are offset by emissions removed from the atmosphere, although large-scale CO
2 removal is problematic, as discussed in this paper. The energy sector is key, because it is responsible for about 75% of global GHG emissions [
1].
Because of the low and declining costs of renewable electricity (RElec) from solar photovoltaics (PV) and wind, the widely accepted technological strategy is to transition from fossil-fuelled transportation and combustion heating to electric transportation and heating and, simultaneously, to transition towards generating all electricity as RElec, of which the vast majority will be supplied by low-cost solar PV and wind. The variability of this bulk supply will be balanced by additional storage (batteries, pumped hydro and other gravitational energy storage methods, compressed air, ‘green’ hydrogen, open-cycle gas turbines burning stored renewable fuels, etc.), new and upgraded transmission lines between regions, and demand response [
2,
3,
4,
5,
6,
7].
New nuclear power stations are not included in this study because their electricity costs are at least four times that of solar PV and wind, and they are still higher than those of PV and wind after storage has been added to ‘firm’ the renewables’ variable supply [
8,
9,
10]. Furthermore, nuclear power stations take at least three times as long to plan and build as solar and wind farms [
11,
12], in a situation where time is of the essence.
Section 2 demonstrates the magnitude of the challenge to be financed within the energy sector. Sector 3 suggests strategies that may have to be financed, both within the energy sector and in the broader socio-economy, while recognising that some of the costs are at present not quantifiable.
Section 4 presents the case that countries with monetary sovereignty can offer the major contribution in financing their own national and global energy transitions, drawing upon the insights into macroeconomics provided by modern monetary theory (MMT).
Section 4 also refutes the major myths used by some economists to reject MMT, showing that they are based on misunderstandings of MMT theory.
Section 5 provides a further discussion of financing this transition, and
Section 6 concludes the paper.
2. The Challenge to Be Financed
The challenge is to complete the transition from all FF use in the energy sector (including transportation and combustion heating) to RElec before tipping points push Earth’s climate towards irreversible changes. What makes this task more difficult is that climate science cannot determine precisely when, and at what level of global heating, tipping points will be reached, or whether they have already been passed. However, climate science demonstrates that some impacts of climate change are already providing positive feedbacks to global heating, thus accelerating it. These include the melting of the Arctic ice cap, which results in reduced reflection and, hence, the increased absorption of solar energy by the Earth, as well as wildfires and the melting of the permafrost, which are releasing more GHGs and, hence, reducing the rate of the Earth’s emission of thermal energy [
13]. The presence of these and other positive feedbacks to climate change make the task of the energy transition task urgent.
Climate science tells us that it is now almost certainly too late to keep global heating below 1.5 °C [
14,
15,
16,
17] and that it may be very difficult keep it below 2 °C by 2050. Although 2050 is a somewhat arbitrary date and may be too late to avoid tipping points, we use it as a target for achieving 100% renewable energy (RE), whereby all energy, including energy for transportation and heating, is supplied directly or indirectly via ‘green’ hydrogen by RElec.
The magnitude of the task is revealed in
Table 1, which provides a warning against a post-pandemic return to the pre-pandemic rate of growth of global energy consumption. We consider non-combustible RElec here because biomass combustion is unlikely to make a significant contribution to future RElec for environmental and economic reasons. Over the pre-pandemic period from 2000–2019, annual non-combustible RElec generation grew by 135%, an outstanding performance. However, it started from a small base and so its growth in exajoules (EJ) was just 13.5 EJ. By comparison, the total electricity consumption grew more slowly, by 80%, over the same period, but it started from a larger base and so its growth in EJ was 2.6 times that of RElec.
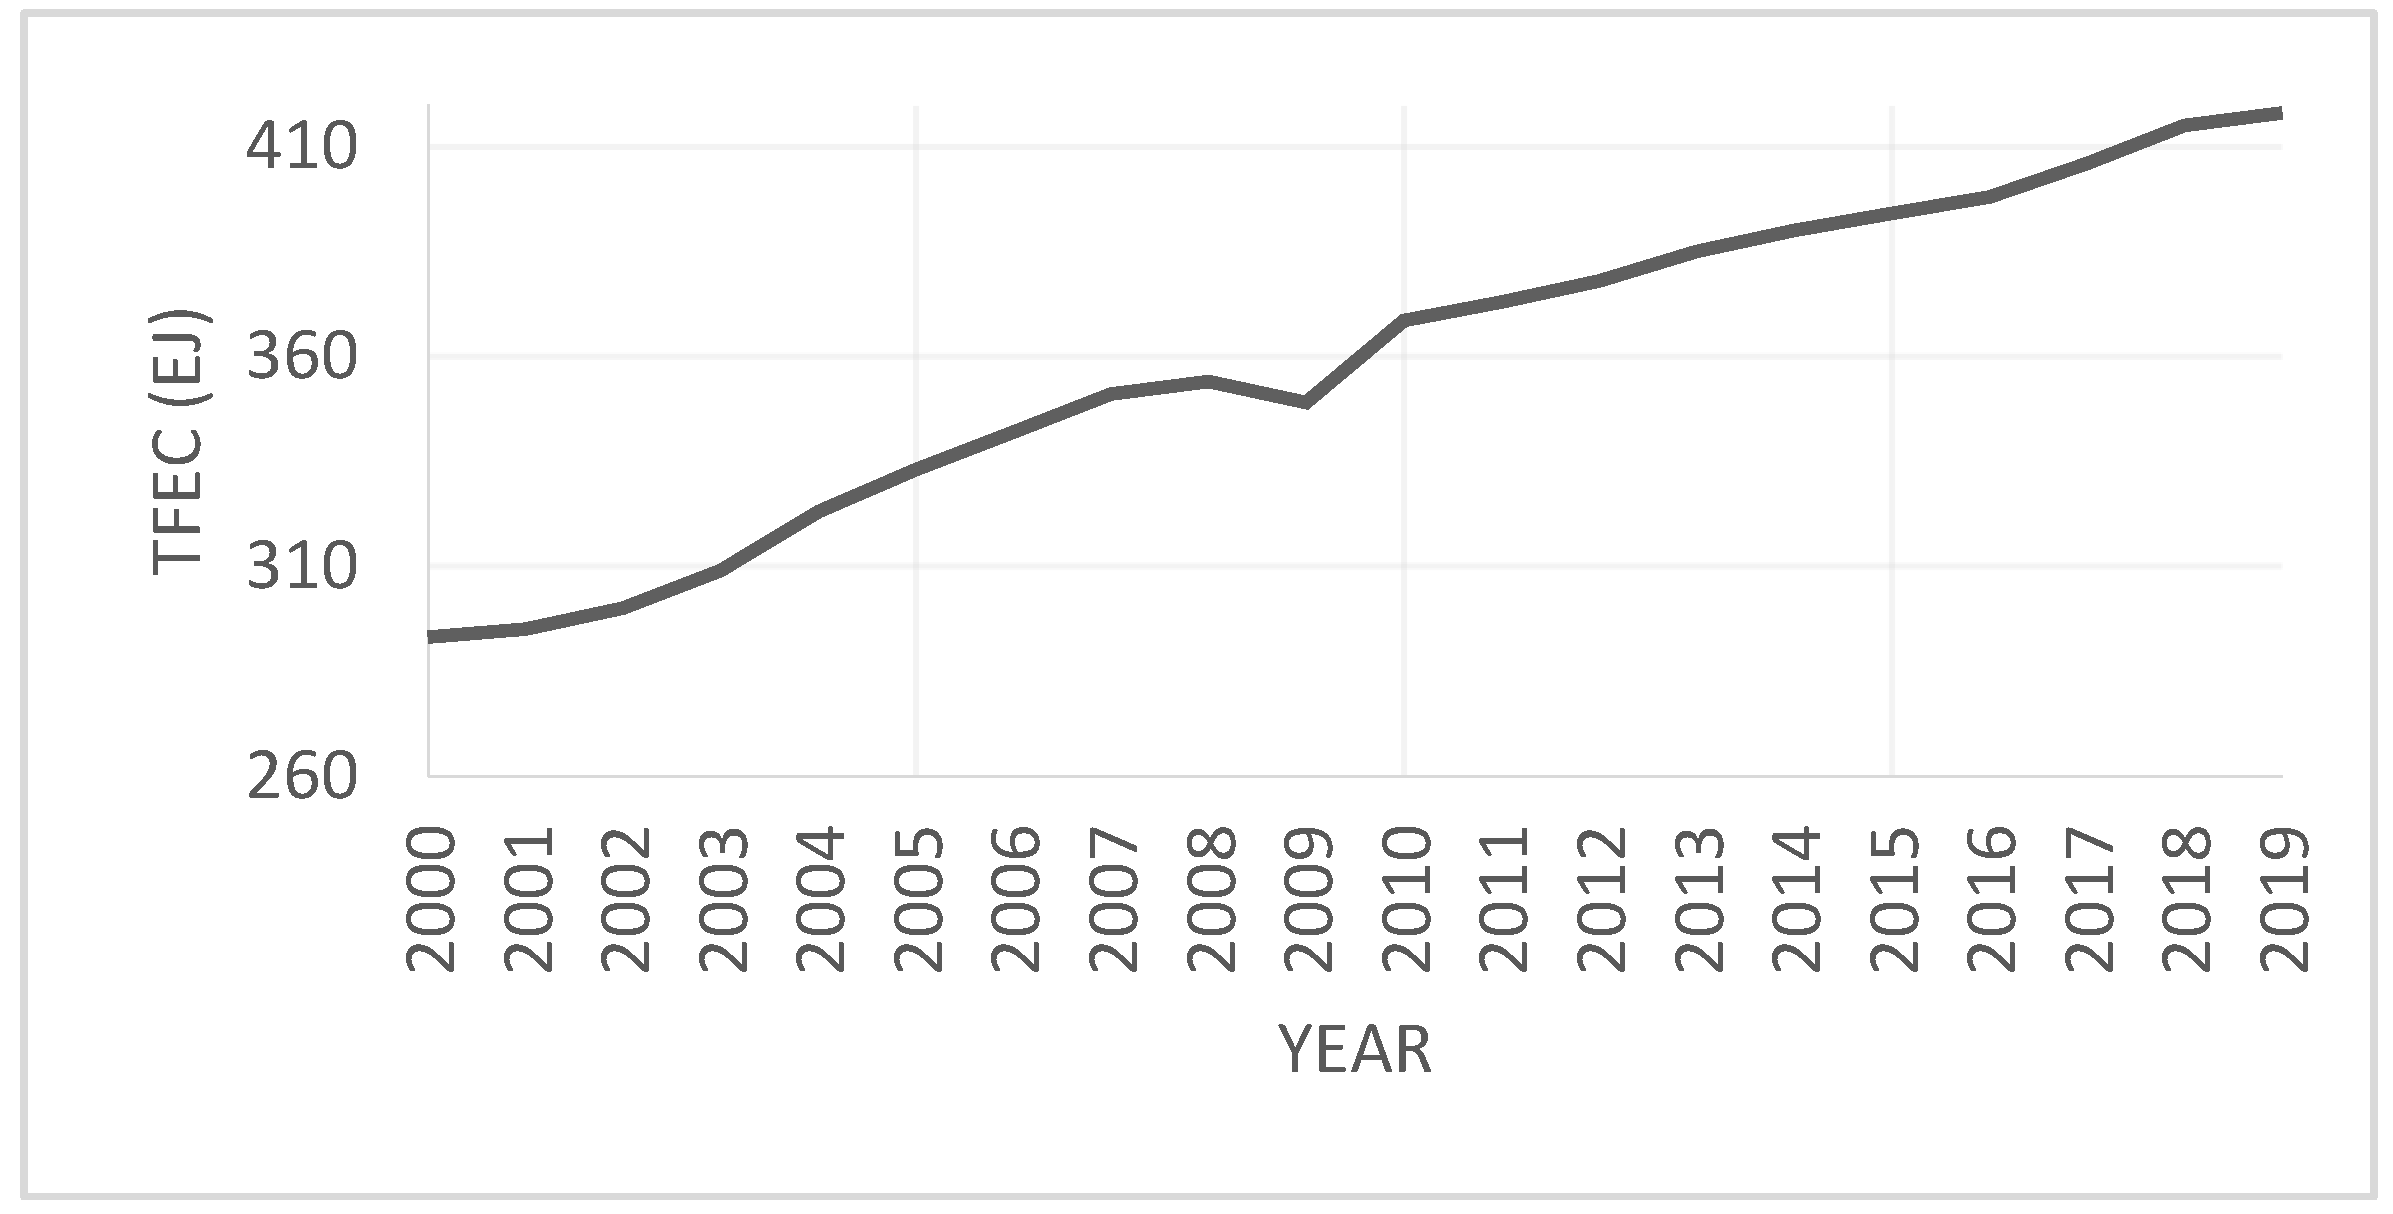
To make matters worse, RElec must do much more than substitute for the current demand for electricity—it must supply the total final energy consumption (TFEC) by 2050. Over 2000–2019, TFEC grew by 43%, about one-third the growth rate of RElec. However, in absolute terms, TFEC grew by 125 EJ, nearly an order of magnitude greater than RElec. As a result, the percentage of TFEC and total primary energy supply (TPES) supplied by FF remained approximately constant over that period.
Global TFEC has been increasing approximately linearly from 2000 to 2019 (see
Figure 1), apart from a brief drop during the global financial crisis. After the COVID-19 pandemic caused a small reduction in energy-related emissions in 2020, “Global CO
2 emissions from energy combustion and industrial processes rebounded in 2021 to reach their highest ever annual level” [
19]. If we assume that TFEC in 2022 is approximately equal to its value in 2019, and thereafter it will continue to grow linearly from 2022 to 2050 at its average pre-pandemic growth rate of 6.568 EJ/year, then it will reach 601.9 EJ in 2050, a 44% increase from 2019. This is Scenario 1. Then, if RElec grows linearly from 2022 (where we assume it has reached 25.7 EJ) to 2050, a simple calculation shows (see
Appendix A) that, to replace all FF energy consumption in 2050, RElec must grow at 29 times its average 2000–2019 pre-pandemic growth rate. Alternatively, if RElec grows exponentially, then it must have a doubling time of 6.2 years, with about 4.5 consecutive doublings.
In Scenario 2, we assume optimistically that a crash program of increased efficiency of energy use reduces TFEC in 2050 to one-third below 601.9 EJ, so that it becomes 414.4 EJ, slightly below its 2019 value. If RElec grows linearly from 2022 to 2050, RElec must grow at 20 times its average 2000–2019 pre-pandemic growth rate to replace all FF energy consumption in 2050. Alternatively, if RElec grows exponentially, then it must have a doubling time of 7.1 years, with four consecutive doublings.
Thus, in both Scenarios 1 and 2, it appears impossible for RElec to overtake TFEC by 2050, even if RElec grows exponentially.
How credible are the required growth rates of RElec? Solar or wind farms can be planned, built and commissioned within three years. Solar modules are mass-produced, and a residential rooftop solar system can be installed in a single day. Large batteries can be installed on the grid within less than one year, but these are only economically viable for storage periods of several hours at most. RElec from non-combustible sources doubled in Denmark and Australia in the eight years between 2011 and 2019 [
20]. In Germany and China, it doubled in the seven years from 2012 to 2019 [
20]. Thus far, this is encouraging, but a single doubling is very different from an exponential growth with four or five doublings.
Furthermore, rapid growth in the installation of solar and wind farms does not take into account the major rate-limiting processes within the electricity subsector or the energy sector as a whole. Within the electricity sub-sector, major new high-voltage transmission lines typically take 6–12 years, depending on location and distance, to plan and build, after assessing the environmental impacts and gaining permission from landowners. Some energy storage systems (e.g., pumped hydro and compressed air systems) take several years at least to build and bring online. Reforming the electricity market rules to make them suitable for grids with 100% RElec can take several years, and sometimes much longer if multiple jurisdictions are involved.
Within the broader energy sector, there are several processes that are likely to take even longer to complete than processes within the electricity sub-sector. These are the replacement of the internal combustion energy (ICE) road transport fleet with electric vehicles, the replacement of combustion heating in homes with electric heat pumps, the replacement of combustion heating systems in industry with electrical heating, and the development of more efficient, low-cost processes for producing ‘green’ hydrogen for aviation, shipping and non-energy industrial processes. To replace FF combustion technologies before the end of their operating lives will be expensive, and this is unlikely to proceed rapidly without compensation from governments. Since RElec cannot grow more rapidly than the growth in the electricity demand, these rate-limiting processes for transforming transportation and heating appear to rule out the exponential growth of RElec. The best we can hope for is linear growth with a few step-ups.
Therefore, despite our optimistic assumption about the contribution of efficient energy use, 100% RE appears impossible to achieve without either substantial CO
2 removal (Plan A) or substantial reduction in global energy consumption (Plan B). The Integrated Assessment Models published by the IPCC [
4] and the Net Zero Emissions Model of the IEA [
7] generally avoid the problem of timing by simply assuming Plan A. However, relying on CO
2 removal is speculative and risky [
21,
22,
23,
24,
25]. Therefore, this paper considers Plan B to replace or at least supplement Plan A.
The target of 100% RE may become possible for the linear growth of RElec, provided that the TFEC in 2050 has been reduced to half the 2019 level. Then, a linear growth rate in RElec of 9.2 times its average 2000–2019 growth rate must be achieved (see Scenario 3 in
Table 2, derived in
Appendix A). An exponential growth of RElec with a doubling time of 9.9 years would be sufficient to supply all TFEC in 2050. By comparison, a previous calculation found that halving the TPES may be sufficient for removing all energy-related GHG emissions by 2050, although reducing the TPES by 75% by 2050 would bring less risk of crossing a tipping point [
26].
This analysis confirms quantitively that, although global energy descent, i.e., a reduction in the global TFEC, is very likely to be necessary in order to achieve zero energy emissions by 2050, there is no basis for the unsupported claims [
27] that civilisation must return to transportation by horse and carriage and home-heating by firewood. These claims have been refuted in this journal by several authors [
28,
29,
30]. A global energy descent of 50% is equivalent to the TFEC of 1977, with the more efficient technologies of the 21st century. It is consistent with a modern industrial society, as is a descent of 75%.
3. Plan B: Energy Descent and Its Implications
Which countries must undertake the energy descent and what strategies are required? Since low-income countries must develop their economies, and since development inevitably involves some increase in energy consumption, energy descent must be undertaken primarily by the high-income countries. However, rapidly growing economies must also participate.
Figure 2 shows that the TFEC in 38 OECD countries, taken as a whole, showed a negligible increase over 2000–2019. Allowing for the fact that eight countries joined the OECD during 2010–2022 (see
https://www.oecd.org/about/members-and-partners (accessed on 28 June 2022)), it is clear that the average energy consumption per member of the OECD has actually decreased. However, the TFEC of a group of five rapidly growing economies, called RapidG hereinafter, taken as a whole, increased rapidly and has almost overtaken the much larger OECD group. In 2019, China contributed the largest fraction of RapidG’s TFEC (65%), followed by India (20%).
The negligible TFEC growth among OECD countries and the high growth among RapidG economies partly results from the situation whereby a large fraction of the goods sold in OECD countries are made in RapidG and low-income economies. Therefore, energy involved in traded goods must be taken into account when developing climate mitigation policies. Governments should calculate their national emissions based on consumption, as well as on the conventional methods of territorial emissions based on production [
31]. Effective energy descent in high-income countries must be achieved by both greening these countries’ own economies (including imports) and reducing unnecessary consumption.
In response to the changing demand of high-income economies, RapidG and other developing economies will have to reduce the quantity and types of goods they manufacture for export. Increased aid from high-income countries will be needed to assist the developing countries, not only to improve their energy efficiency through technology transfer and investment [
32], but also to restructure their economies to facilitate global energy descent [
26]. This will be a major challenge for international cooperation and finance. For climate justice between countries to be affected, it is important to consider that the TFEC
per person in RapidG and low-income countries is much lower than that in OECD economies, which have generally high- and medium-income economies. To gain international cooperation to support both green industries and energy descent, a substantial flow of financial and educational resources will be needed from high- to low-income countries. For the transition within countries, climate justice will rest on governments funding retraining, relocation, new cleaner industries and, where necessary, pensions for workers in FF and related industries. In addition to the ethical justifications is the practical need to obtain cooperation.
The principal strategies for the global transition towards energy descent are summarised in
Table 3. Items (i) and (ii) are the well-known strategies, while strategies (iii) and (iv) are the new strategies that are not primarily technological in nature but rather involve socioeconomic and behavioural changes.
Various authors, including some who have published in the present Special Issue, offer costings of strategies (i) and (ii). However, it would be premature to attempt to estimate the costs of strategies (iii) and (iv). Furthermore, because the benefits of transforming our civilisation from one that is collapsing into one that is ecologically sustainable and more socially just could be infinite, the cost-benefit analysis would be irrelevant. Any attempt would depend on several debatable assumptions, e.g., the rate of transition, which is one of the determinants of the costs of stranded assets, and the method of capping and then reducing energy consumption. What is clear is that finance will be needed that is much greater in magnitude than that required for technological change alone. In this paper, we propose that countries with monetary sovereignty, defined in the next section, can supplement the conventional methods of financing, possibly contributing the major effort.
4. Financing by Monetary Sovereign Countries
A monetary sovereign country has a central or federal government which issues a fully fiat currency. A fully fiat currency is not convertible at a guaranteed fixed rate into any commodity, such as gold, or any foreign currency. It floats on the foreign exchange market. Monetary sovereignty also requires the currency issuer to have no significant net financial liabilities denominated in foreign currencies [
36].
The demand for a fiat currency depends on the imposition of tax liabilities denominated in that currency to private sector agents. The situation that taxes must be paid in that currency, ensures its status. Although commodities have played a role in monetary history, tax systems have driven the demand for monetary assets for thousands of years [
37].
Monetary sovereign governments face no purely financial constraints on their expenditure and investments because they issue a currency which they have not promised to exchange for any real or financial assets, and which is limited in its supply. They are, in principle, able to purchase any good or service which is offered for sale in exchange for domestic currency.
However, all societies face real constraints, depending on the productive capacity of the economy, which is a function of the available labour, skills, capital equipment, technology, and natural resources within the economy. While there is a net demand for the national currency by foreign investors, the country can consume beyond its domestic productive capacity without incurring foreign-currency-denominated debt, since the rest of the world is prepared to supply real goods and services in return for the domestic currency.
All spending using the domestic currency by such governments, without exception, involves currency issuance, which, in most cases, is managed and monitored by a country’s central bank. Every US dollar which is spent by the US federal government is, in other words, a new dollar. It is not a question of ‘printing money.’ It is a description of the institutional mechanism by which federal spending takes place. Federal taxes then delete dollars previously spent in the system by the federal government [
38].
Government spending in excess of tax revenues is defined as a fiscal deficit. Since deficits and surpluses cancel out across a country’s monetary system, a fiscal deficit must have as its counterpart a surplus in the non-government part of the monetary system. Globally, too, government deficits are matched dollar-for-dollar by private sector surpluses. There is no financial limit on the ability of a monetary sovereign government to engage in deficit spending, other than those which are self-imposed by the legal system or convention. The only constraint of any kind is the real constraint discussed above [
39].
To summarise, a monetary sovereign government:
Issues a currency which is required by the private sector for the payment of taxes;
Selects a floating exchange rate regime for that currency;
Avoids the issuance of debt denominated in foreign currencies.
Such a government:
Is not subject to purely financial constraints;
Remains subject to real constraints (and the risk of accelerating inflation);
Normally deficit spends to finance surpluses in the non-government sectors of the monetary system.
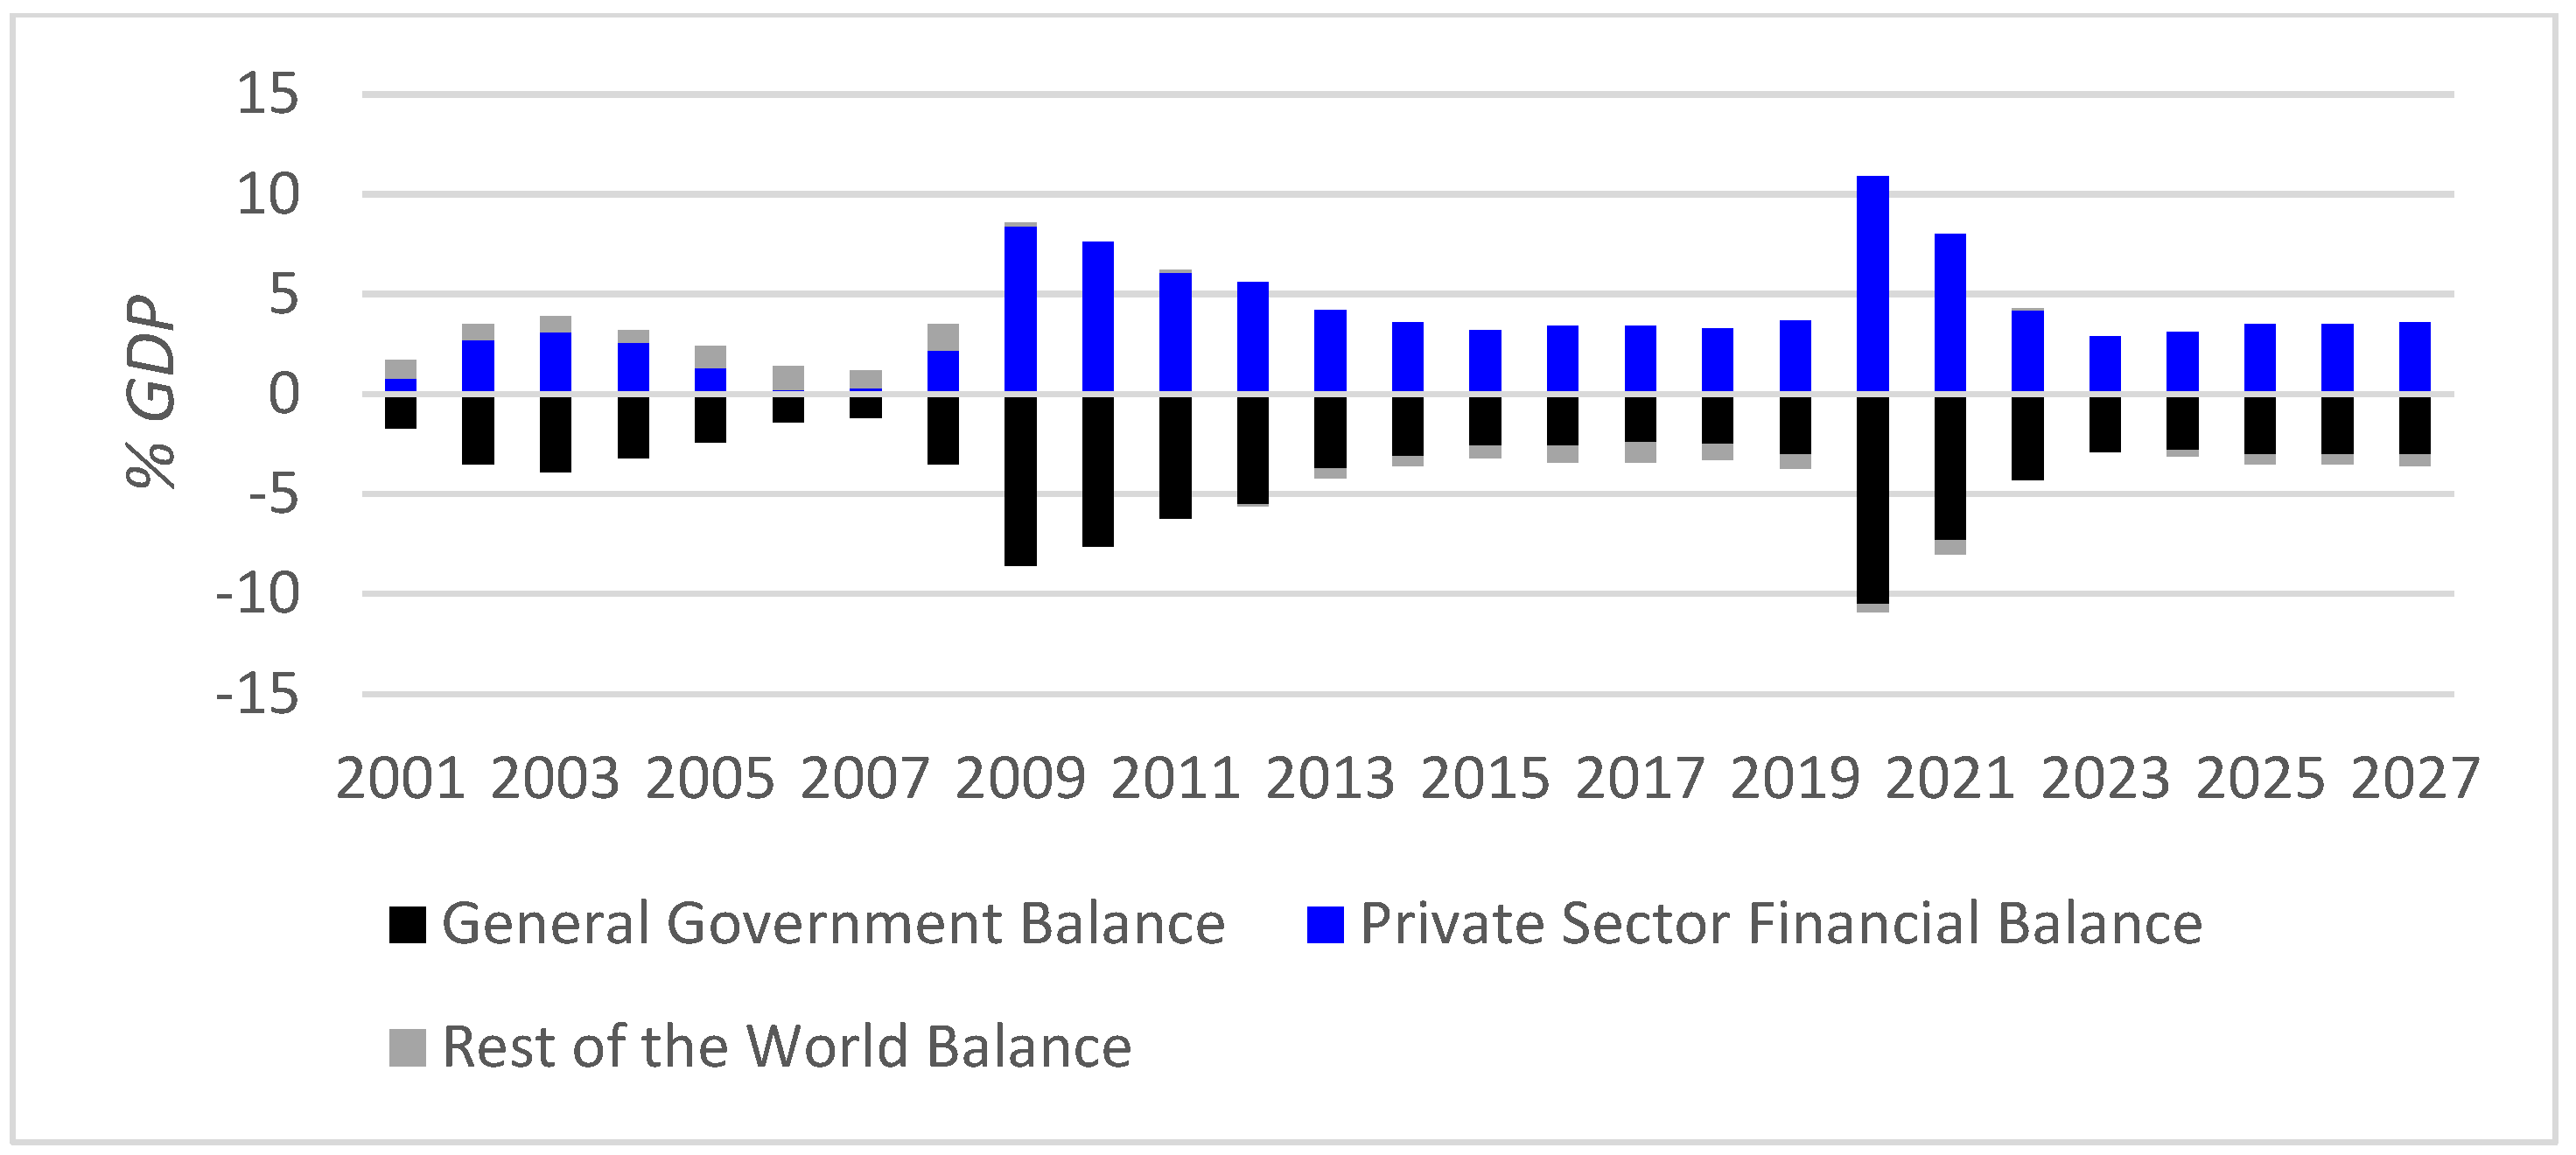
Confirmation that it is normal for high-income-economy governments to deficit spend can be readily provided by numerous sources. One example is the IMF data on the general government net lending (+) or borrowing (−) in advanced economies stretching back to 2001 (see
Figure 3). At no stage during the past 20 years, even just prior to the global financial crisis, when private debt was driving a rapid growth in tax revenues, were advanced economy governments on average in surplus. Nor does the IMF data forecast such a surplus in the future [
40]. Government deficits are a normal feature of modern monetary systems.
Since the data in
Figure 3 are averaged across forty countries, foreign sector net balances (which are the negative of the annual current account balance on the balance of payments) are negligible. This clarifies the role of government deficits in funding private sector financial surpluses. It is not private saving that funds a government deficit in a modern monetary system—it works the other way around. The increase in private net saving during COVID-19, for example, was made possible by fiscal deficits that governments undertook in support of their economies. The government does not need tax revenues to fund its spending, as it spends via currency issuance. Instead, federal taxes:
Create a demand for the government’s currency in the private sector;
Limit the disposable incomes and therefore the purchasing power of the private sector to create room within the productive capacity of the economy for the government to spend or make investments;
Discourage some activities and encourage others (for example, by internalising externalities, such as the environmental and social costs of GHG emissions);
Change the distributions of income and wealth.
This was clarified as long ago as 1946, by the then-chairman of the New York Federal Reserve, Beardsley Ruml. To quote Ruml, “taxes for revenue are obsolete,” at least where a monetary sovereign currency-issuer is concerned [
41].
While treasury bonds play an important role in monetary systems, their issuance is not absolutely necessary in order to fund fiscal deficits. Indeed, during COVID-19, when governments were engaging in high levels of deficit spending, in at least some high-income countries, there was no significant net issuance of bonds to the private sector, and in virtually all of these countries, large-scale central bank purchases of treasury bonds on the secondary market offset most new issues. The US Federal Reserve acquired approximately USD 4 trillion’s worth of federal government and agency bonds and, by the end of 2021, owned 22% of the US federal government debt. The Bank of England, by that point, held 36% of the UK government debt and the Bank of Japan had purchased 43% of the Japanese government debt, which was slightly more than that owned by domestic banks and non-bank investors combined [
42]. There is not room here to discuss the various functions performed by government debt securities in financial markets, but the issuance of treasury bonds is clearly a choice and not a necessity [
43].
In Australia, the final budget of the Morrison Government in March 2022 estimated the total fiscal cost of the pandemic to be worth AUD343 billion [
44], while the balance sheet of the Reserve Bank of Australia confirms the net acquisition by the RBA on the secondary market of AUD340 billion of government debt securities between March 2020 and February 2022 [
45]. While the convention of primary market issuance to match deficit spending, introduced to Australia in 1982, was maintained, the similarity between these statistics is more than a coincidence. Such intervention by the central bank is not normally necessary to support deficit spending, as the Treasury normally spends sufficient dollars into the system to provide the liquidity required for financial institutions to bid at bond auctions [
46], but the onset of the pandemic required the liquidity to be provided by the central bank. It would have been simpler for the central bank to purchase treasury bonds directly from the government, as still happens in some countries, or to provide an overdraft, as the Bank of England did at the onset of the crisis to the UK government, but this would have breached convention.
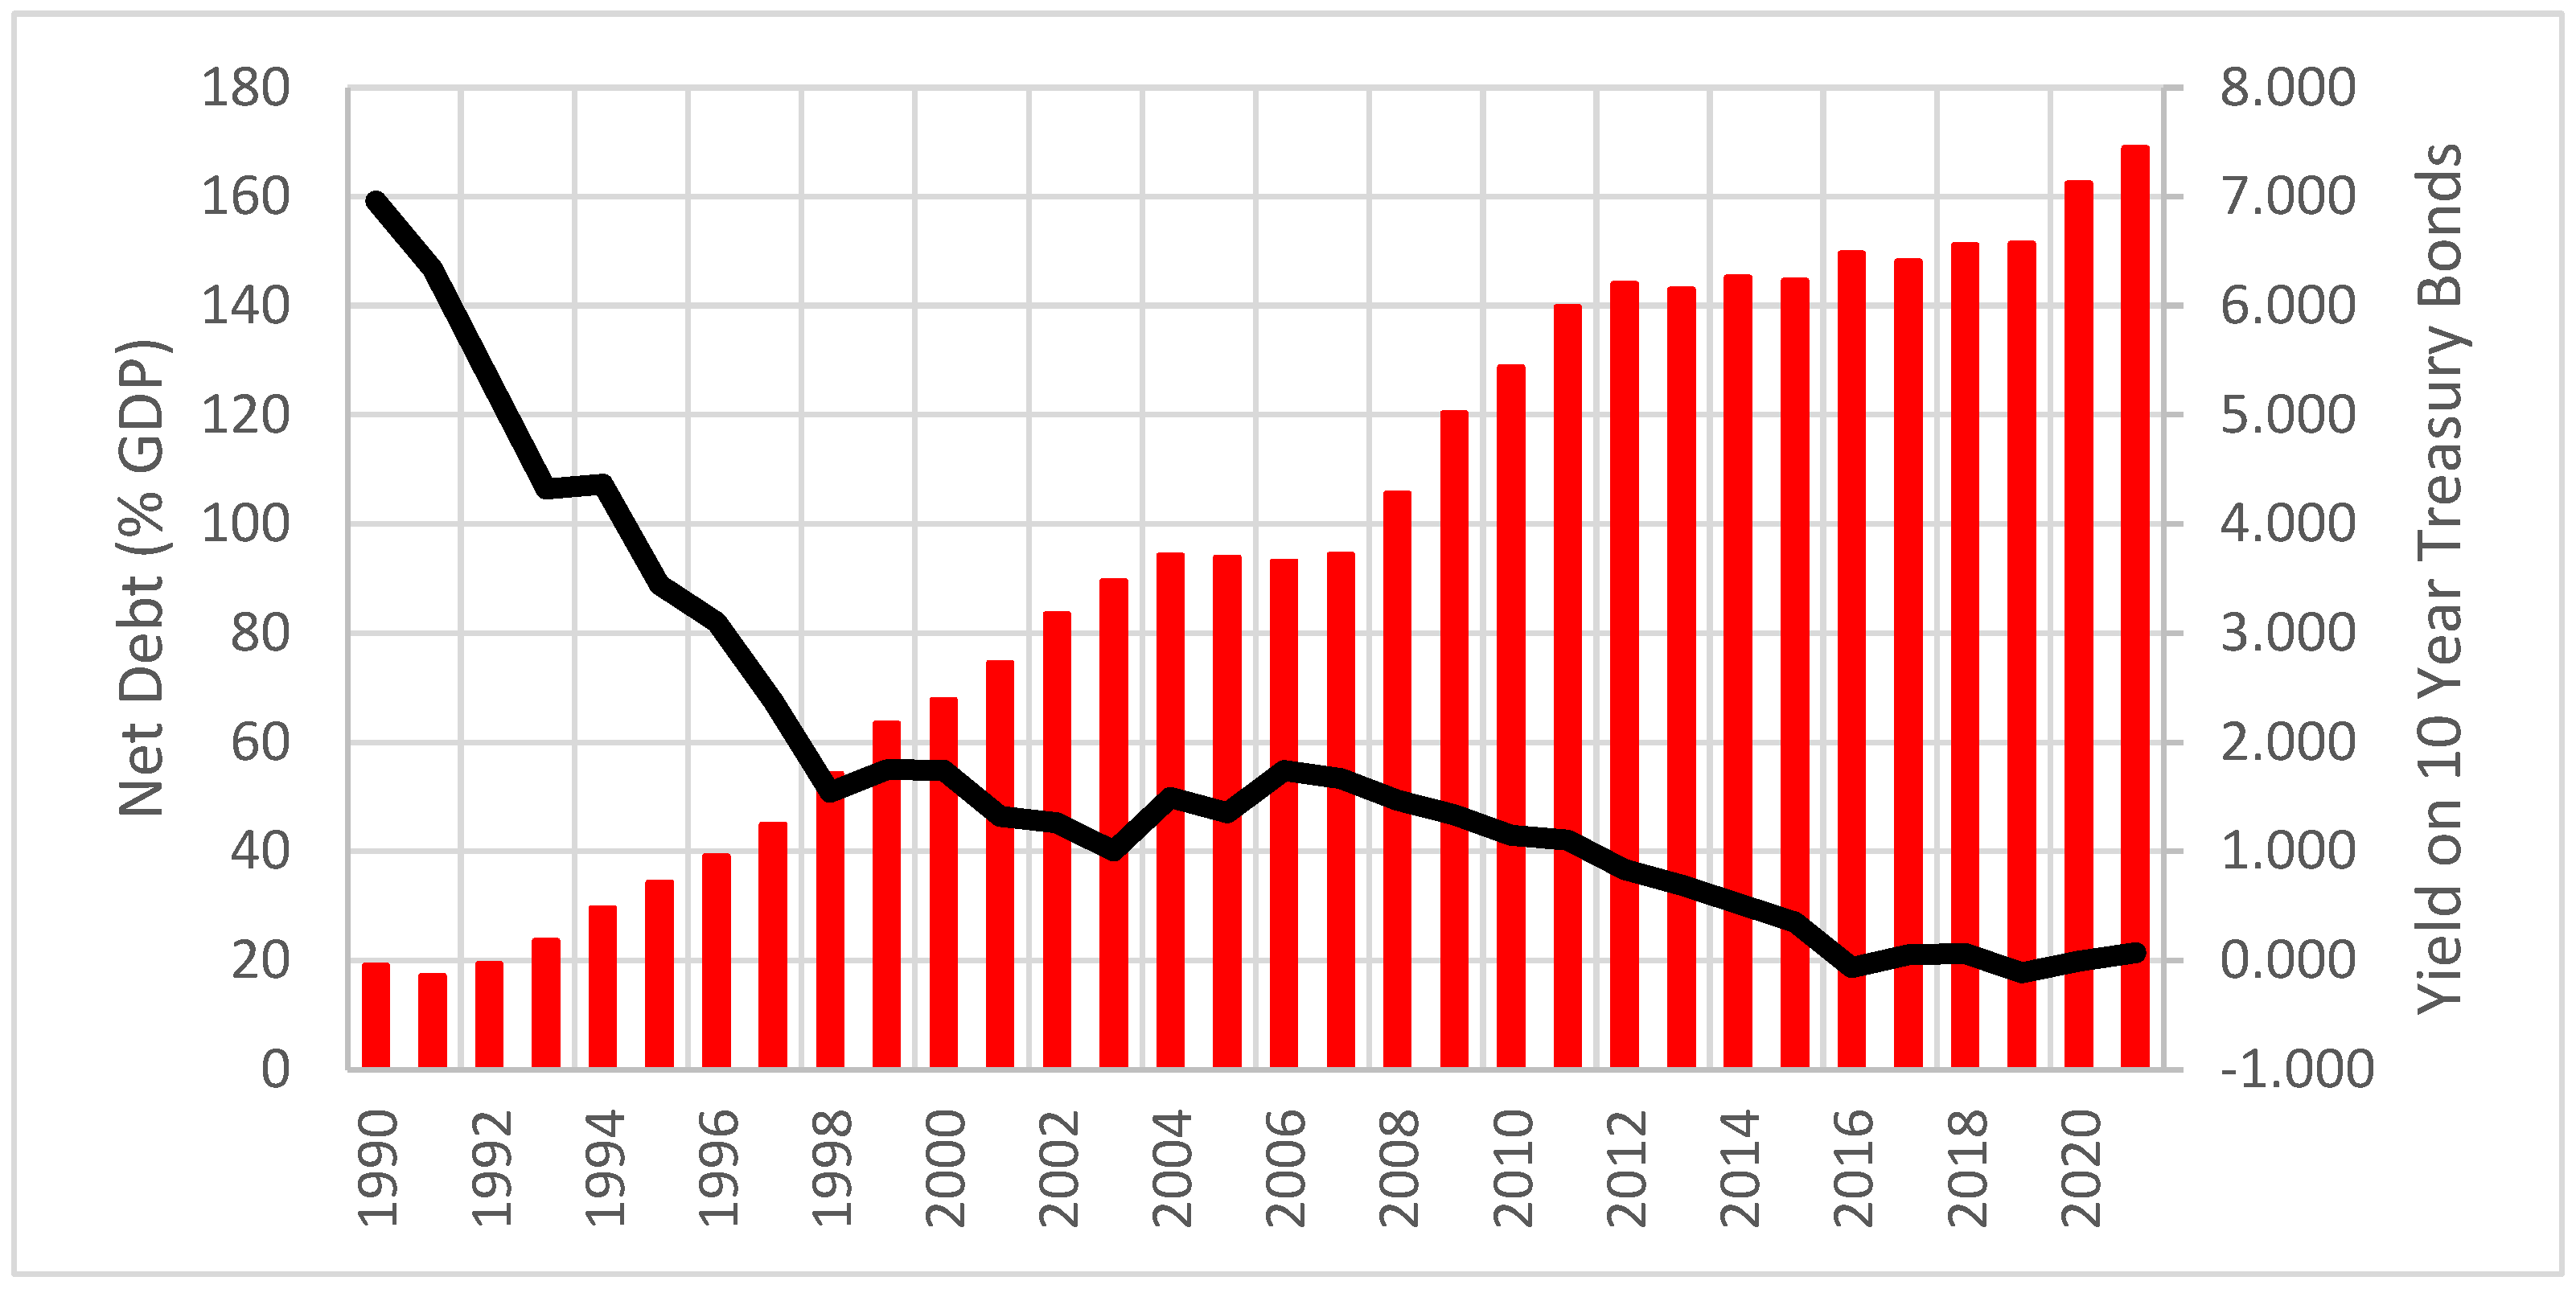
Interest payments on treasury bonds, like all federal spending, involve currency issuance, and are best regarded as transfer payments to the private institutions and individuals holding those bonds. In a monetary sovereign state, the interest paid on the bonds, like the official interest rate target, is best regarded as a policy variable. Rising yields in the bond market indicate that the central bank has chosen to allow the yields to rise, reflecting the market expectations of future monetary policy decisions by the central bank. As the example of Japan makes clear (
Figure 4), financial markets cannot force an increase in interest rates upon the central bank of a monetary sovereign state. Fiscal deficits and bond issuance do not in themselves put upward pressure on interest rates [
47].
Interest payments by a government to its central bank are first debited from the official public account and recorded as earnings by the central bank, and then, later, unless a decision has been taken to increase the central bank’s capital position, they are restored to the official public account as a dividend. Accounting practices sometimes obscure rather than clarify institutional realities, but the important point to note here is that there are arrangements in place in every monetary sovereign state to ensure that legally authorised spending by the national government is always facilitated, regardless of the initial balance of the official public account.
Government debt held by its central bank could, in principle, be written off. This would transform the central bank balance sheets, so that the central bank would have a negative capital position—effectively, the central banks would be in debt to the private sector, rather than the central governments, which own them. Given that neither the central bank nor its government can be forced into insolvency by the financial liabilities denominated in the currency they issue, it would be a reform of no import, except perhaps for the clarification of the fiscal space available to a monetary sovereign.
Most high-income countries are full monetary sovereigns, although members of the Eurozone have sacrificed their sovereignty in pursuit of a monetary union. While this has not had a significant impact on the fiscal space available to Germany and some other northern European countries, it has had major consequences for Greece and other southern European states over the last decade, and led to solvency crises, enforcing austerity and years of mass unemployment [
48].
The fiscal rules of the Eurozone were suspended between March 2020 and March 2022, allowing the European Central Bank to provide unconditional support for member country government debt on the secondary market under the Pandemic Emergency Purchase Program. This involved the ECB acting at least temporarily as though it was the national central bank for all member economies, so that the Eurozone was able to negotiate the pandemic without a recurrence of the crisis which followed the Great Recession a decade earlier. However, with the suspension of that programme, yields on Italian and other government debts are rising again, relative to the German benchmark, so that the southern states are once more faced with a financial constraint similar to other non-sovereign governments [
49].
The euro itself is a rare experiment in monetary history, since it consists of a currency-issuing central bank without a powerful national or federal government sitting above it in the monetary hierarchy. The avoidance of future financial disruptions necessitates the establishment of such a government, with a large enough budget to engage in deficit spending, when and where in the zone it is necessary, in order to promote non-inflationary full employment and social wellbeing. If this is impractical, then a permanent relaxation of the fiscal rules applied to member governments and the unconditional support of the ECB are a second-best solution.
Most middle- and low-income countries have little or no monetary sovereignty. A dependence on imported technology, energy, food and other necessities priced in foreign currency and the accumulation of foreign currency-denominated debt creates a fear about floating exchange rates. A lack of demand internationally for their currencies increases the risk of exchange rate volatility and depreciation, leading to insolvencies, growing food and energy insecurities and political unrest. The maintenance of a fixed exchange rate and a long struggle to avoid insolvency and defaulting on foreign currency-denominated debt requires that the governments of these countries face very pressing financing constraints [
50]. (For countries without monetary sovereignty, a carbon price could assist in funding the energy transition, although it may be more acceptable to citizens if it were returned to them as equal dividends.)
This implies that the financing required for an equitable, planned global energy descent scenario must come from high-income countries that are monetary sovereign states. Just as the US government created dollars equal to more than 2% of its gross domestic product as part of the Marshall Plan to facilitate reconstruction in Europe and Japan from 1946 to 1952, so high-income countries should use the fiscal space available to them as monetary sovereign currency-issuers to fund a global transition. Part of the spending on the energy transition by monetary sovereign countries would be devoted to building infrastructure, developing innovative technology, and improving education and training to increase the knowledge and skills required to support the transition. This spending would increase the productive capacities of these economies and mitigate the risk of accelerating demand-pull inflation. However, inevitably, some inflation risk remains, driven by essential investments when the strategy is designed to limit and reduce global energy use rather than to increase it.
The problem faced by the government of the United Kingdom in 1940 in transforming its economy to a wartime footing was of a different nature, but perhaps no less severe, than the challenge of transitioning the world to 100% RE today. John Maynard Keynes analysed the problem in a pamphlet entitled
How to Pay for the War. The country had, within a generation, come through a war, a pandemic, a post-war slump made worse by an ill-judged attempt to return to the pre-war gold standard, a global financial crisis and a great depression. It faced a military threat which appeared to be likely to lead to invasion and national catastrophe. And yet, in his pamphlet, Keynes explained that in a literal sense ‘paying’ for the war was not the problem. The issue was finding the real productive resources to produce enough armaments and essentials for the war, while continuing to meet the needs of the domestic population and avoiding accelerating inflation [
51].
Our modern monetary system in 2022 is very different to that of the United Kingdom in 1940, but Keynes’ essential point remains true today. The problem of organising a transition to a sustainable energy system, similar to that of gearing up for war more than 80 years ago, relates to real resources, productive capacity, technological possibilities and the avoidance of inflation. Those addressing this problem must also be concerned with economic security for all, wellbeing and social justice, both at the national and global level.
Given the legacy of colonialism, and the neo-colonial trade and investment structure which has been imposed over the past forty years, based on unequal trade and the draining of wealth from the Global South to the Global North, there is a case to made for a 21st century climate-change Marshall Plan for the Global South. A transition to energy sovereignty based on renewables and the pursuit of a renegotiated set of UN Sustainable Development Goals should be part-funded by a significant transfer of resources from the Global North, financed by currency issuance.
5. Further Discussion
Across the Global North, the pursuit of wellbeing, which can perhaps be enlightened by a summary statistic, such as the Genuine Progress Indicator as an index of success, needs to replace the limitless growth of real GDP as a higher policy goal [
52]. At the same time, a realistic assessment is urgent, at both the global and national levels, of the potential to convert the energy system to a system based on renewables quickly enough to contain the emissions of GHG to levels consistent with a safe climate. To the extent that this requires a planned decrease in energy use, it is necessary to identify the potential to further reduce the energy intensity of domestic production and identify a realistic and conservative pathway to sustainability.
None of the abovementioned statements are about financing, and this is where we turn to Keynes and How to Pay for the War. Keynes was clear about maintaining and improving the wellbeing of those with the lowest incomes during that emergency. He made recommendations for reforms to welfare and clearly expressed that people should not be denied access to essentials by inflation. The same should be true now.
Keynes recommended, among other measures, compulsory national saving. In Australia, there is already compulsory retirement saving. Saving a share of income above a certain threshold, in a low-interest non-marketable government bond, would make additional room in the economic system for non-inflationary government investments. Those savings could be gradually released after the transition period, when investment spending is heavy. This could be supplemented by higher taxes on those with higher incomes in a more progressive tax system, or by a wealth tax. The tax would not be there to pay for anything, of course, but to help limit inflationary pressures.
The use of a conventional monetary policy, in the form of higher interest rates, as a paying method is not recommended. The financial system is complex system, and increases in interest rates can have perverse or non-linear consequences, while adding to income inequality and not dealing effectively with demand-pull inflation. However, quantitative and qualitative macroprudential regulation are tools which should be employed, both to limit the quantities that credit banking institutions are permitted to create and to influence the purposes and borrowers to whom credit flows. Banking should facilitate investments in a sustainable economy built on renewables and not contribute towards asset market speculation and wealth inequality [
53].
Organising a transition towards a sustainable steady-state economy based on renewable energy is a complex task, particularly when viewed at the global level. However, the funding of such a transition is simple. Monetary sovereign governments in high-income countries simply need to pass appropriation bills through their various national assemblies, and the funding will be available. That is the beginning and the end of the problem of financing a global transition to renewables energy, and what is technologically possible with our available real resources can definitely be paid for [
54].


