
Experimental Study on the Hydraulic Fracture Propagation in Inter-Salt Shale Oil Reservoirs


Abstract
:1. Introduction
2. Materials and Methods
2.1. Equipment
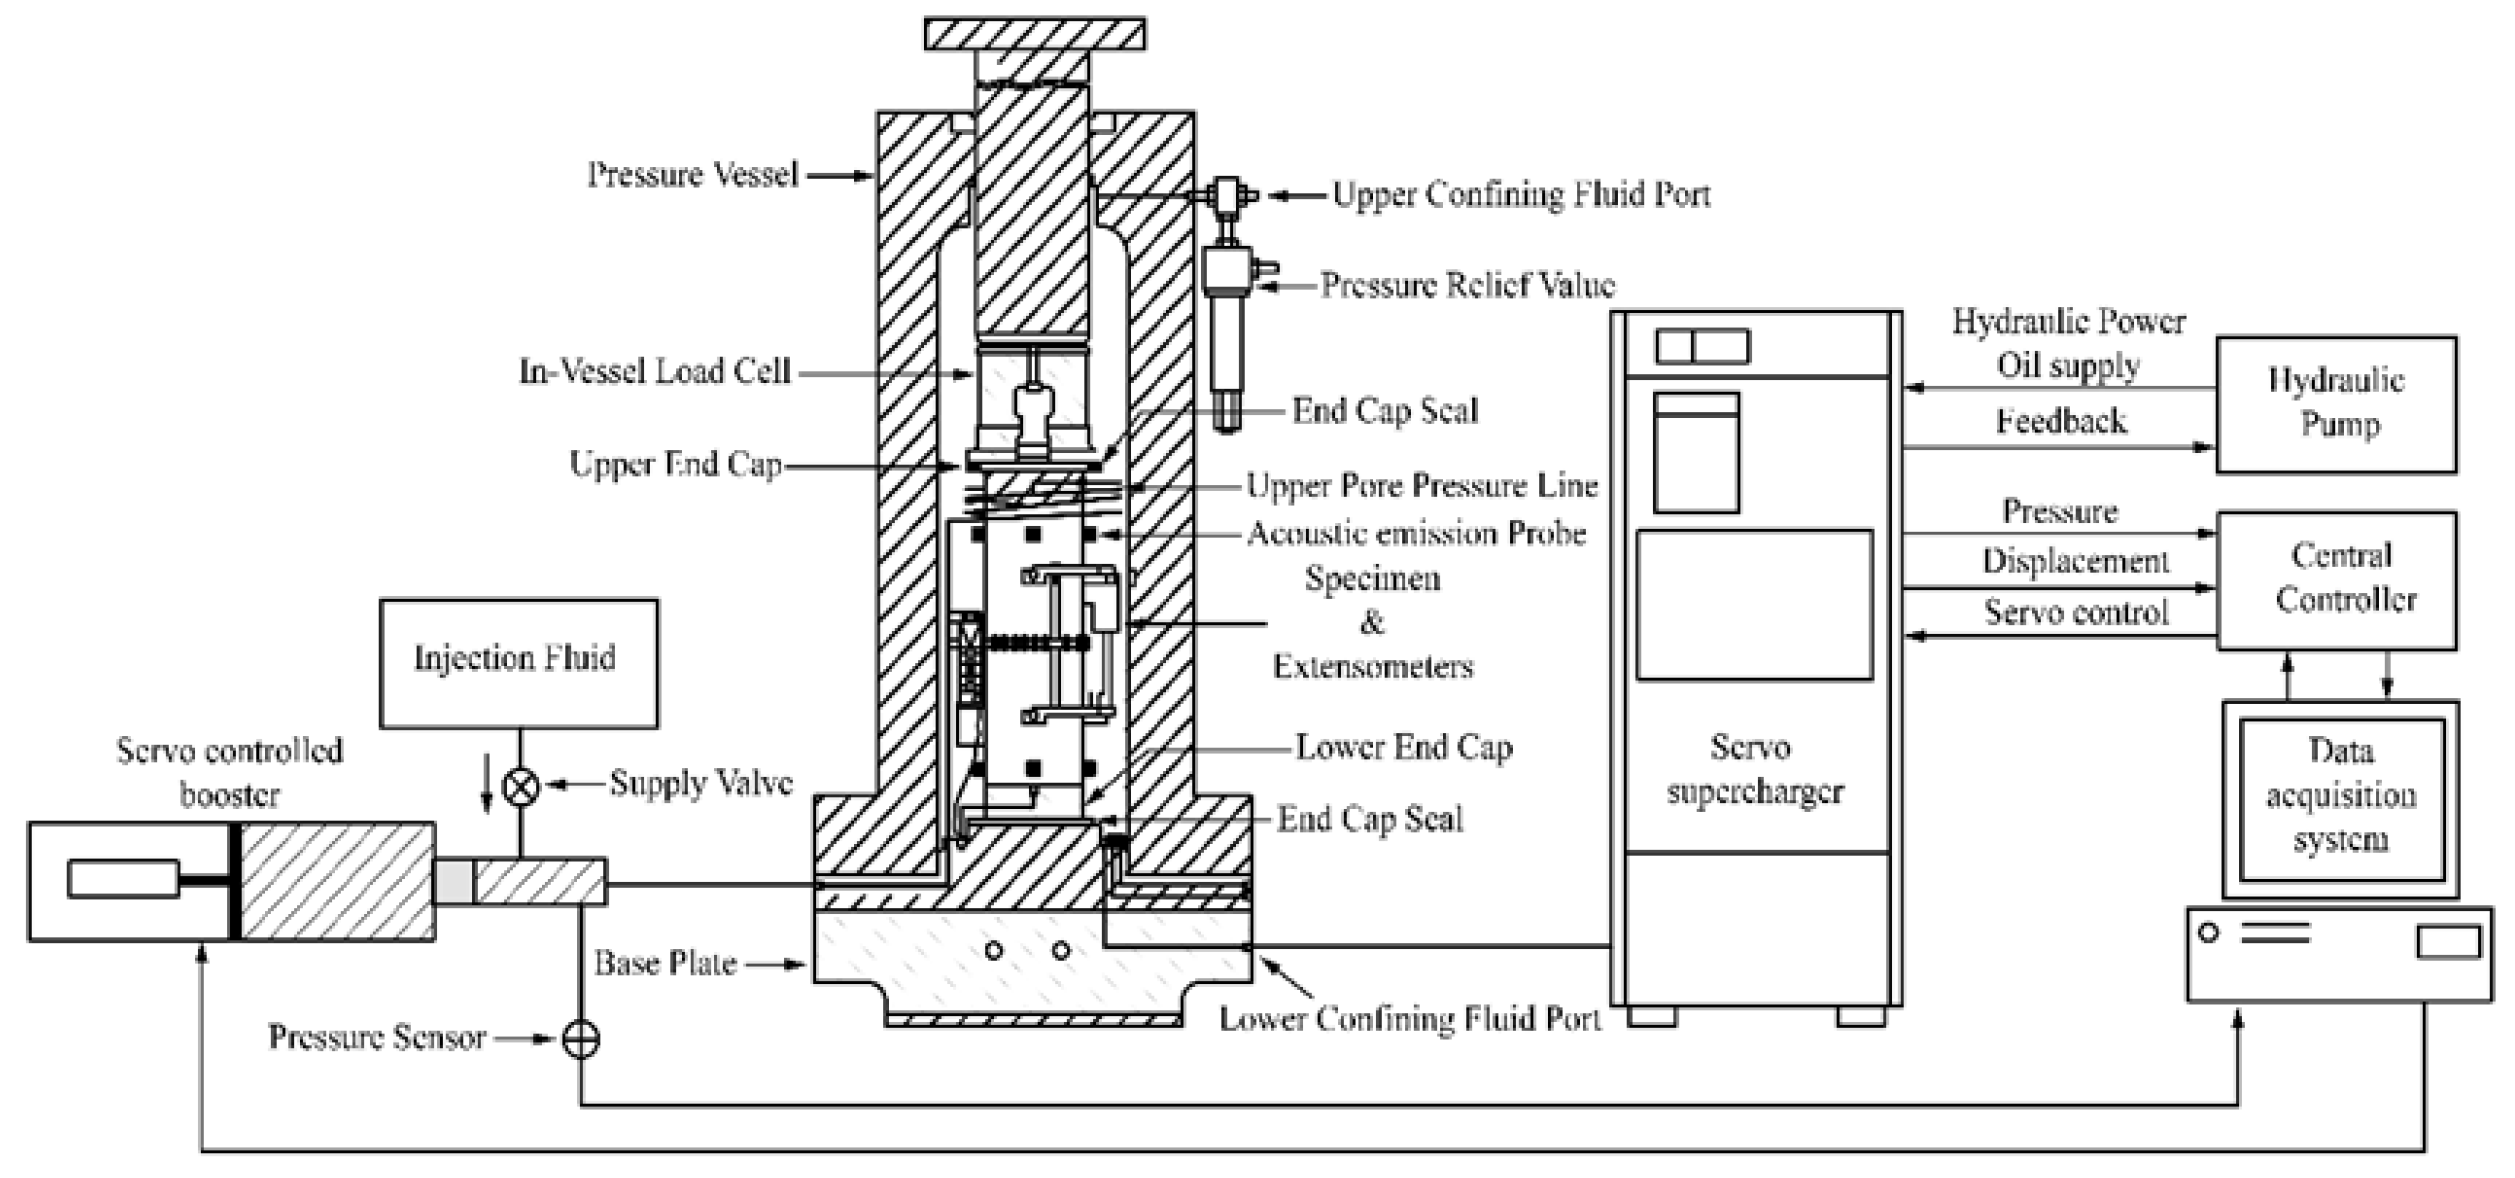
2.1.1. Rock Stress Servo Loading System
2.1.2. Fracturing Fluid Pump Injection System
2.1.3. Acoustic Emission Detection System
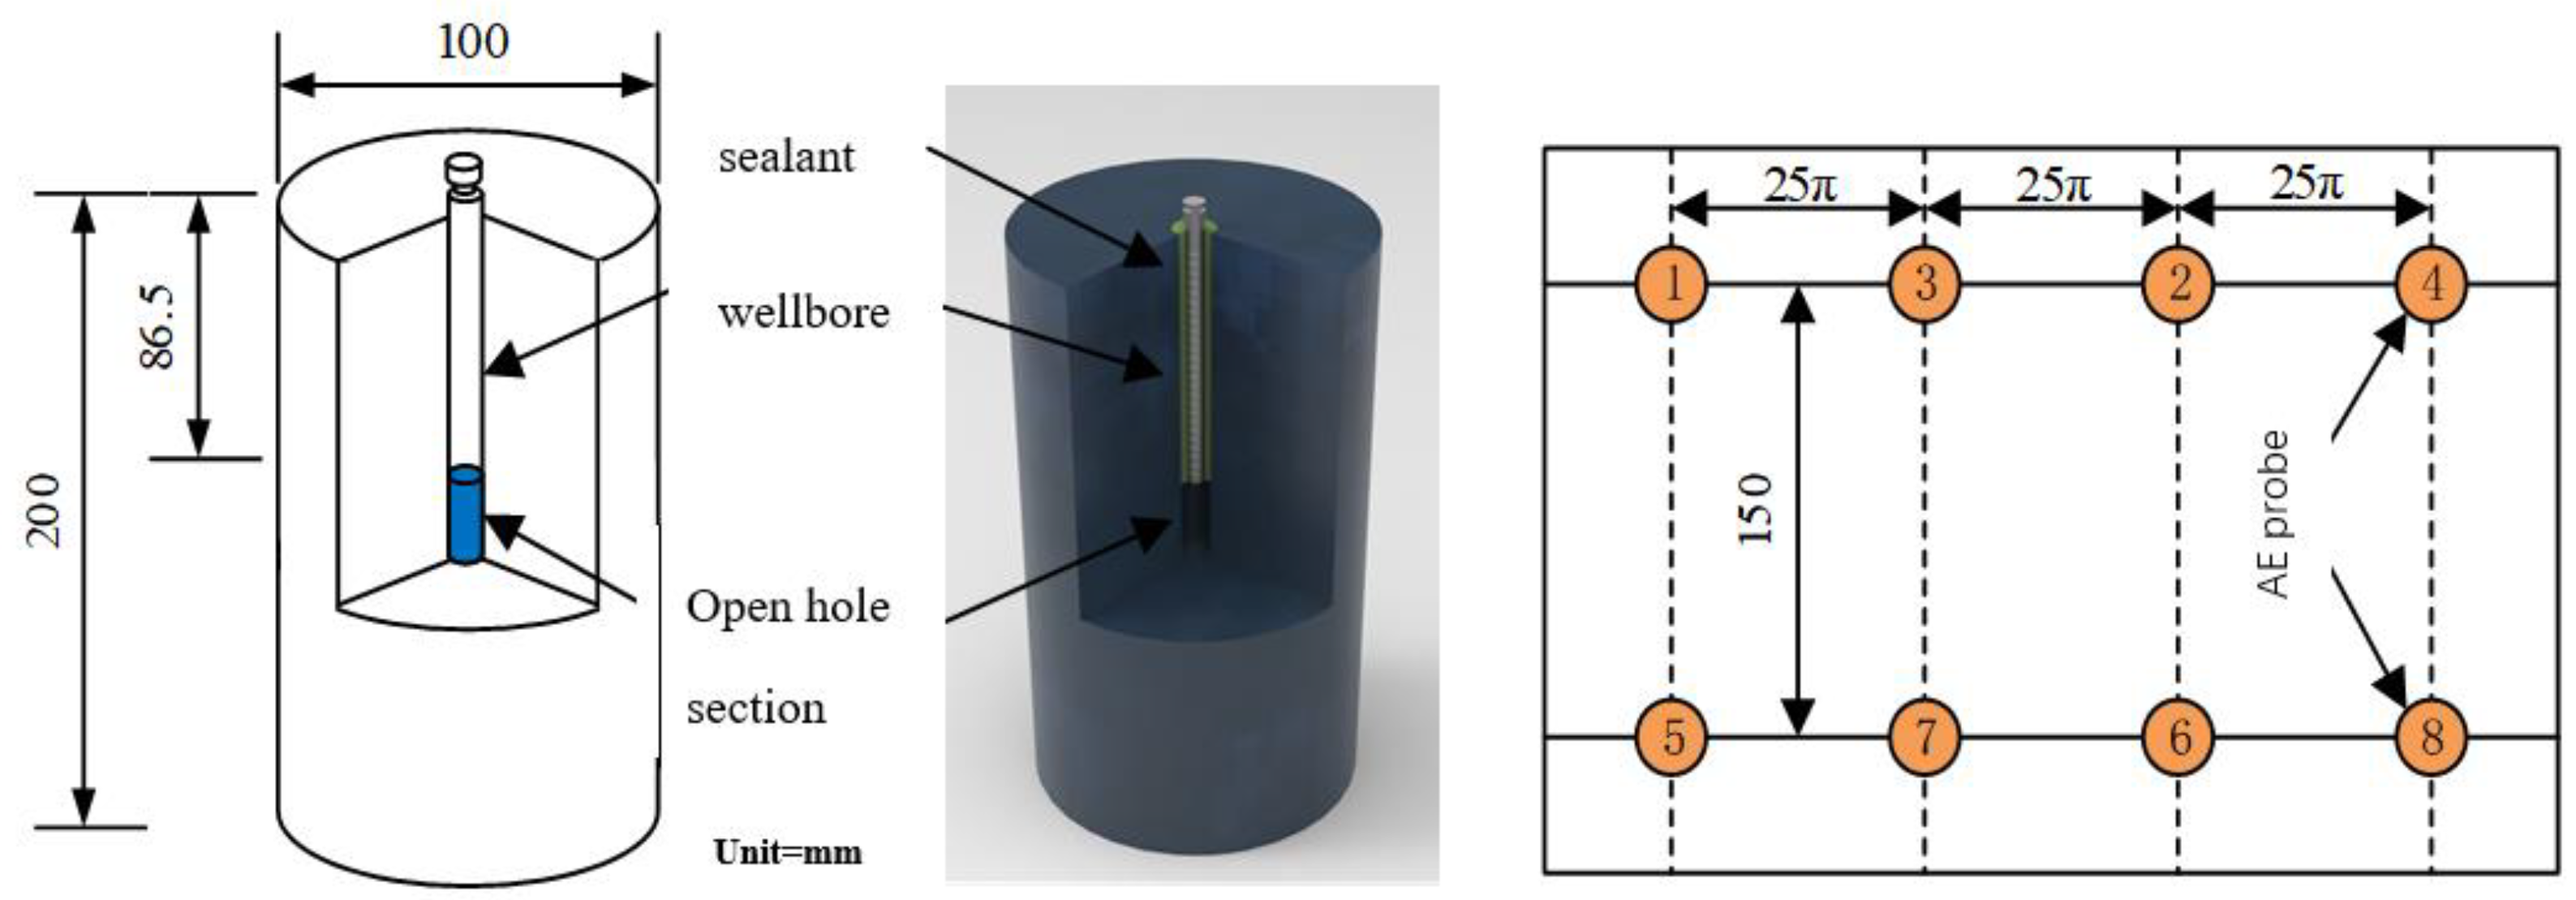
2.2. Preparation of Materials
2.3. Experimental Method
- (1)
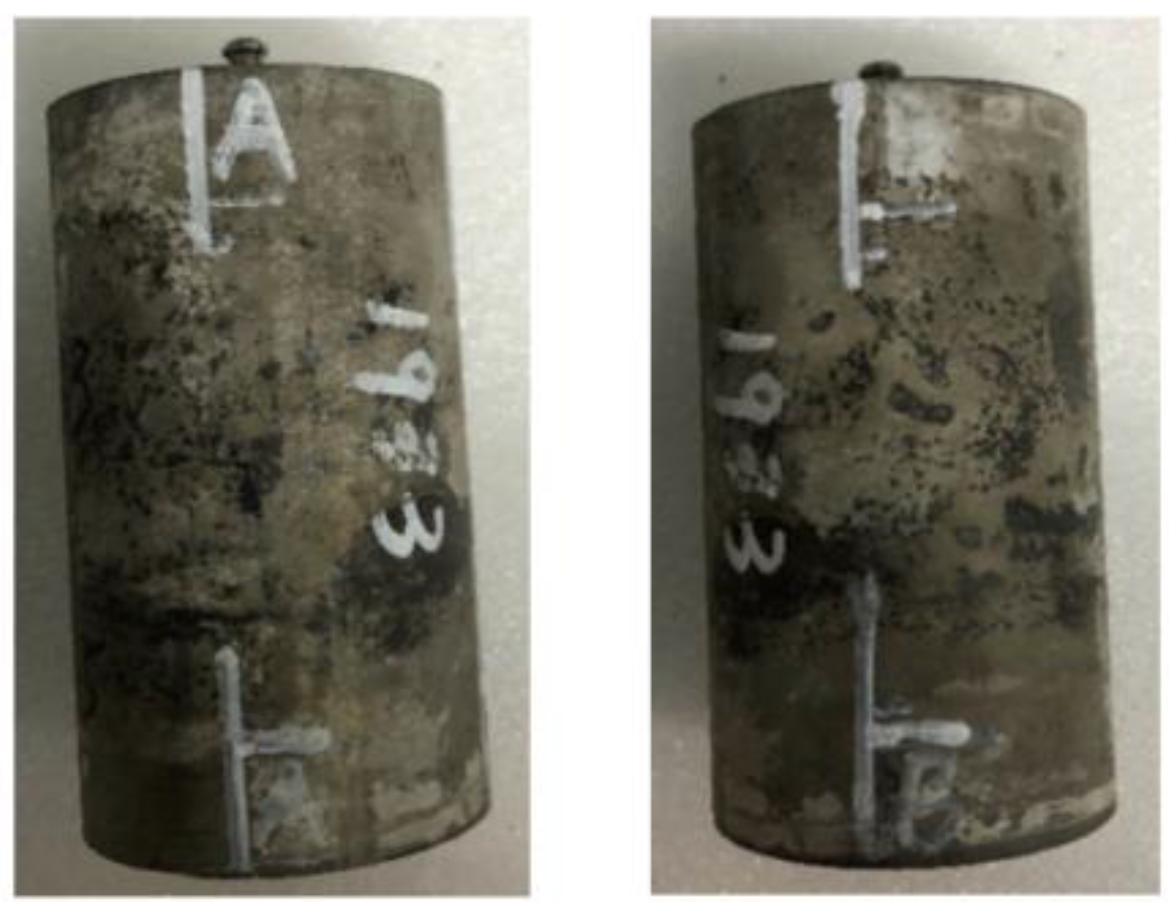
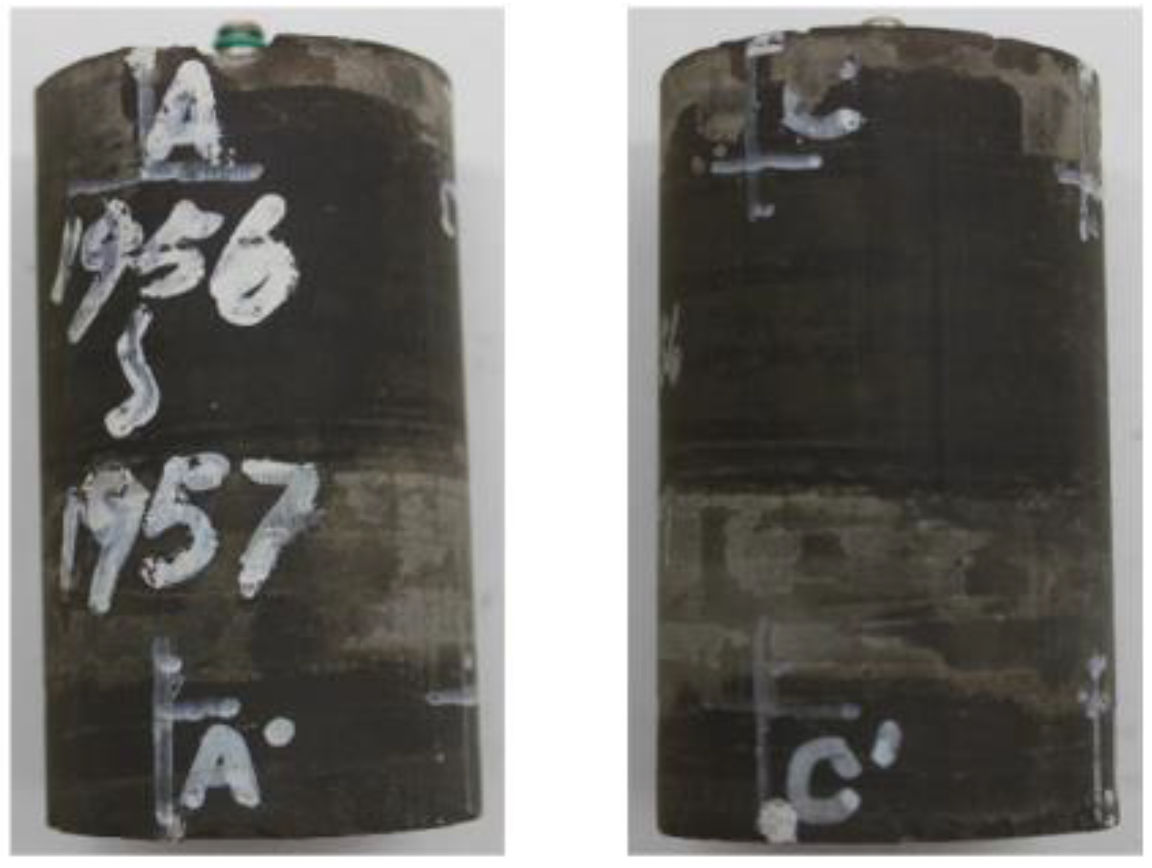
- Description before hydraulic fracturing: We observe the sample layer and natural crack development with the naked eye, and identify the weak distribution of the original structure by chalk or marker.
- (2)
- Gas tight inspection: Because the shale layer is more developed, it is very prone to shear damage during the preparation of the sample, causing wellbore sealing damage, so, before the experiment, we pump a certain amount of fluid into the wellbore, and the pressure is maintained at around 0.5 MPa, for 3–5 min, and we observe whether there is a fracturing liquid in the sample surface.
- (3)
- Acoustic emission probe installation: Eight acoustic emission probes are installed on the surface of the sample, and the probes are tightly bonded with the sample with a coupling agent, while gently tapping each probe to ensure that each probe can work normally.
- (4)
- Stress loading: We place the sample in a three-axis high-pressure chamber, sequentially load the peripheral pressure and axial pressure to the specified value, and maintain for 10–20 min to ensure that the internal force is uniform.
- (5)
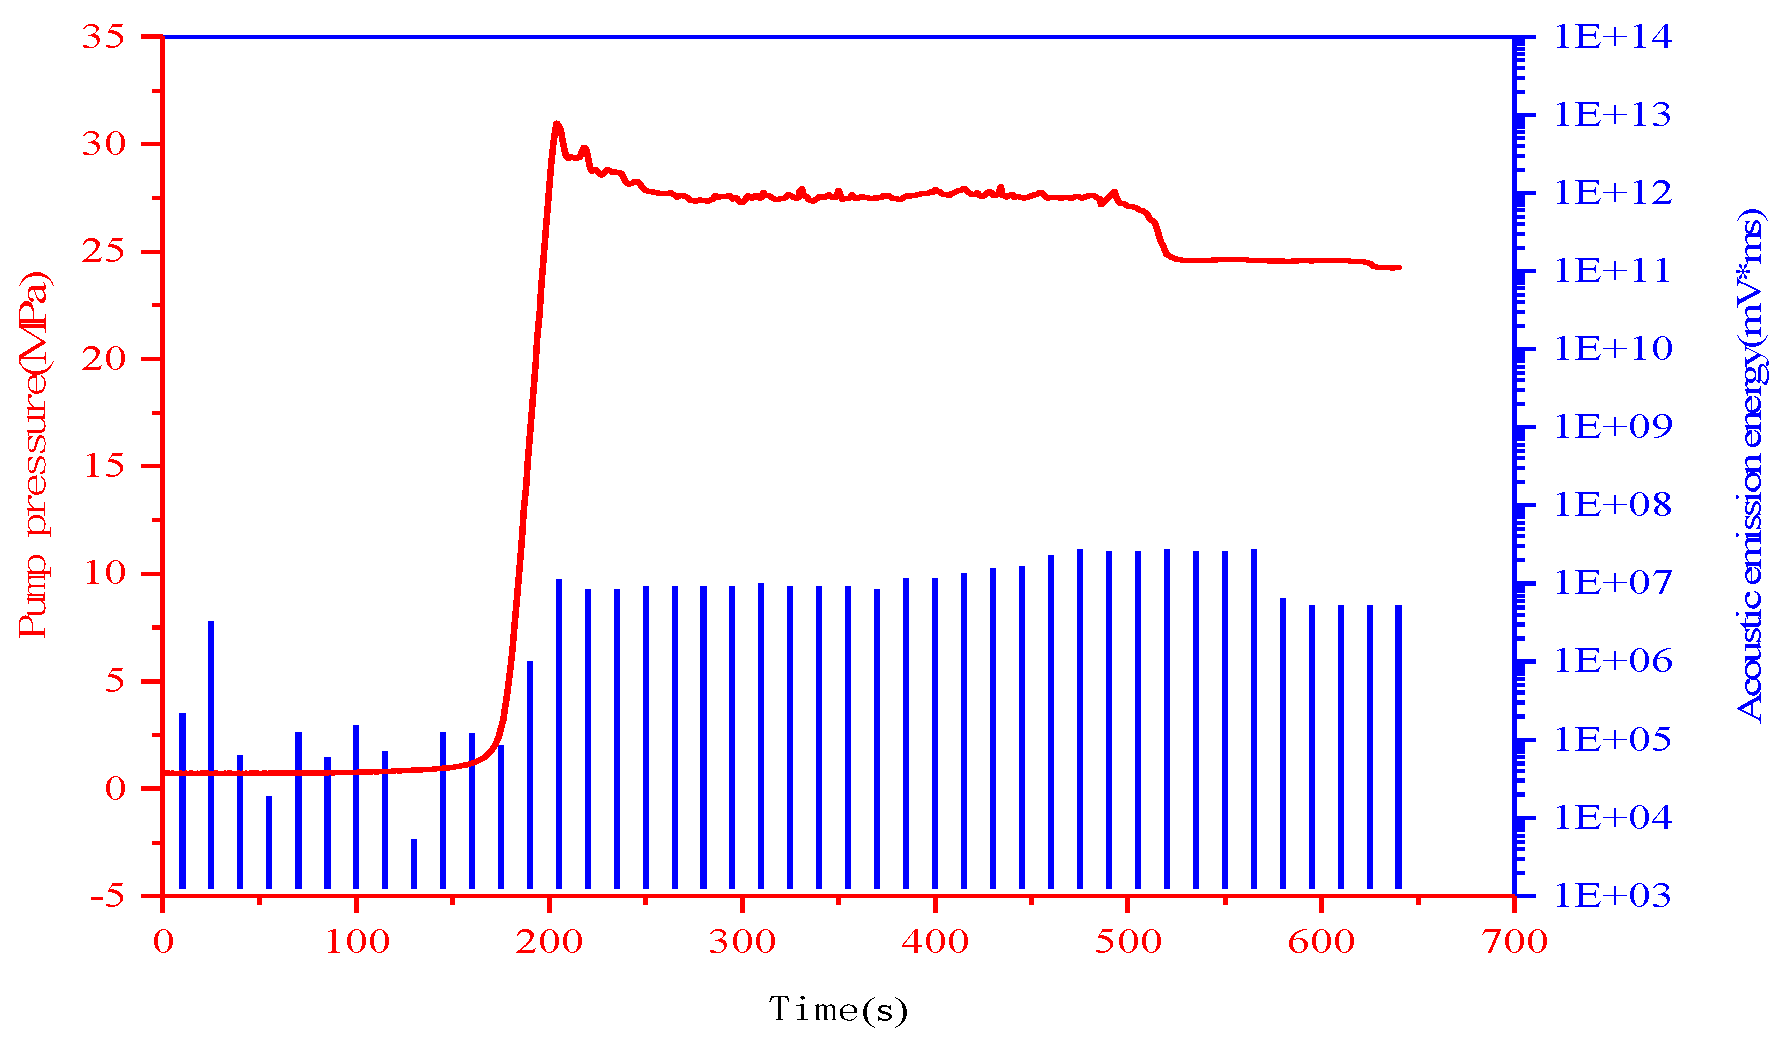
- Fracturing fluid injection: We start the Isco plunger pump, inject the fracturing fluid inside the sample according to the set displacement, and synchronously operate the sound emission detection; when the pump pressure has dropped significantly, we close the plunger pump and sound emission detection system, and remove the axial pressure and peripheral sequential.
- (6)
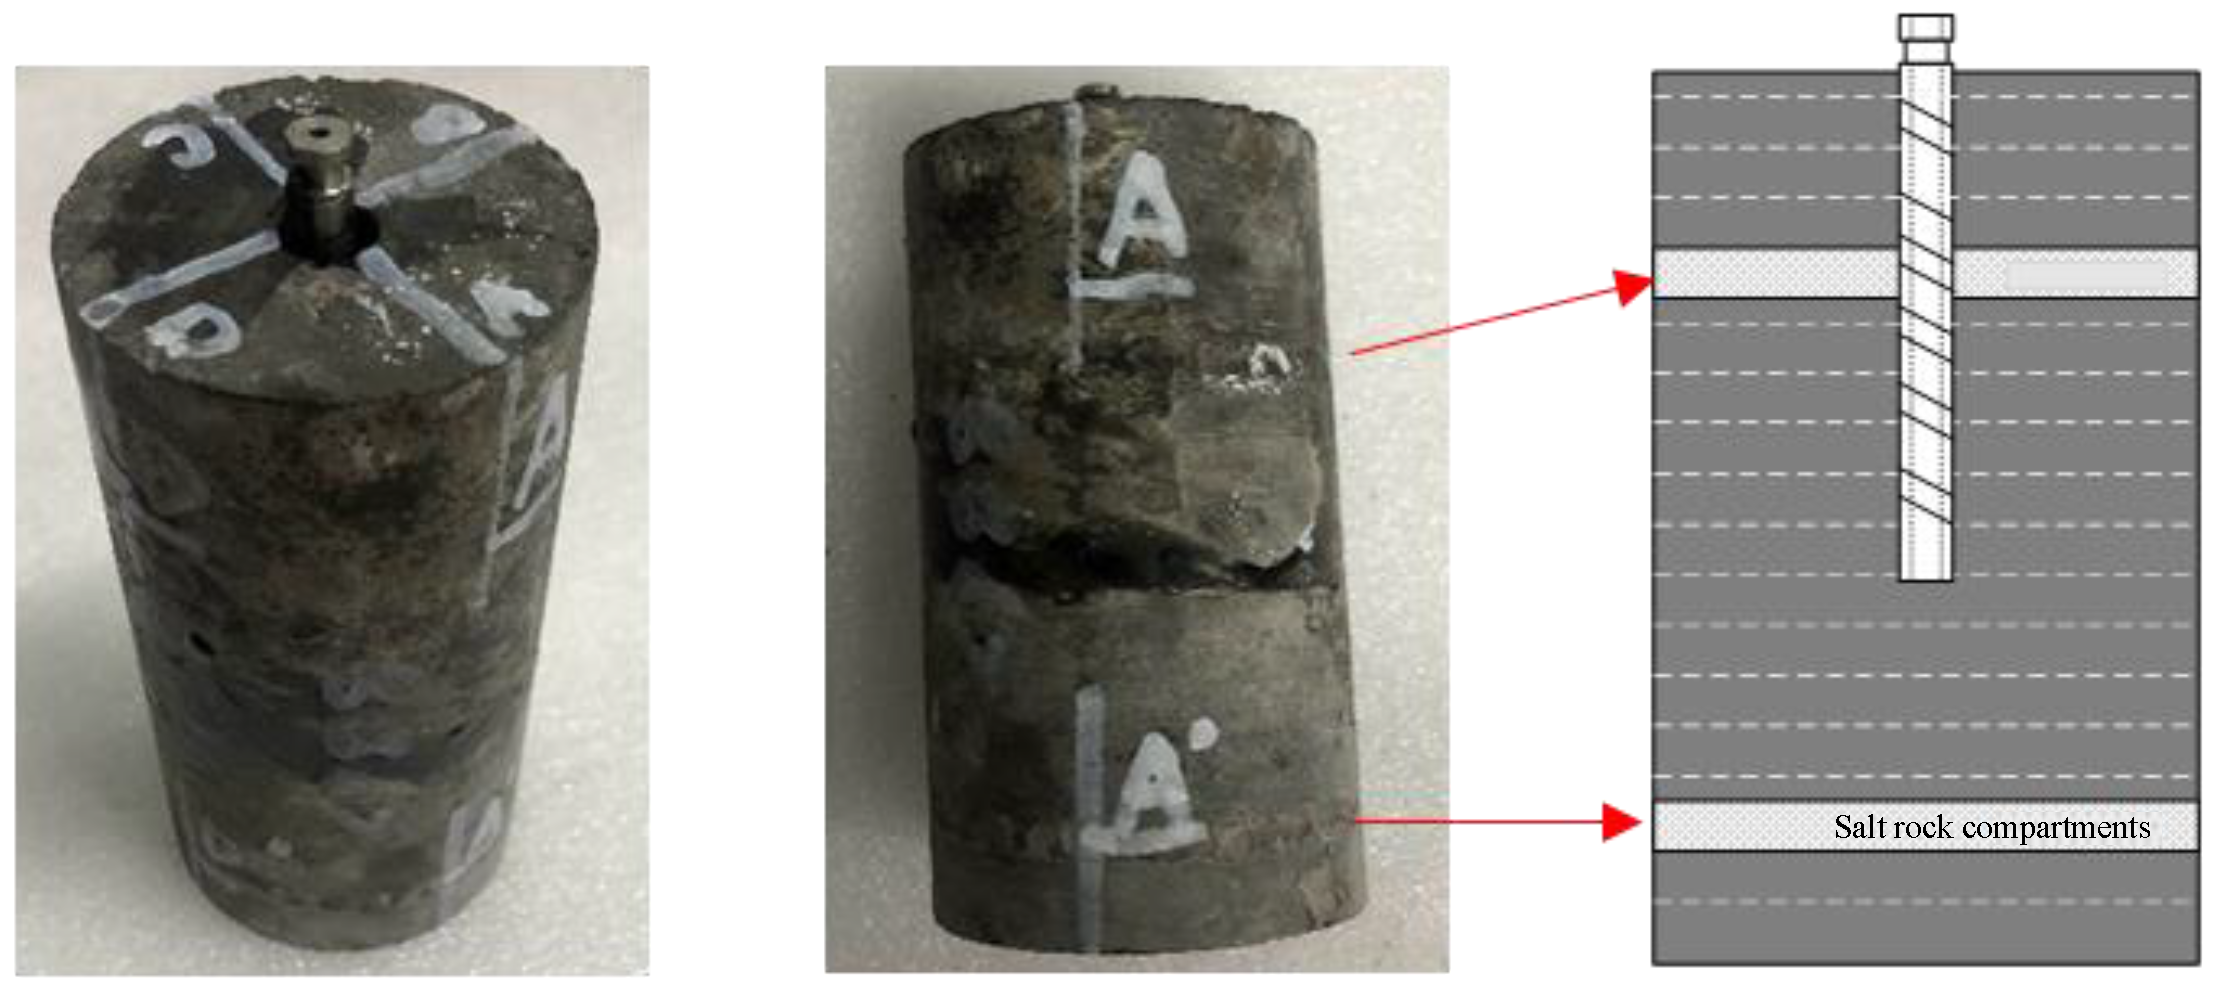
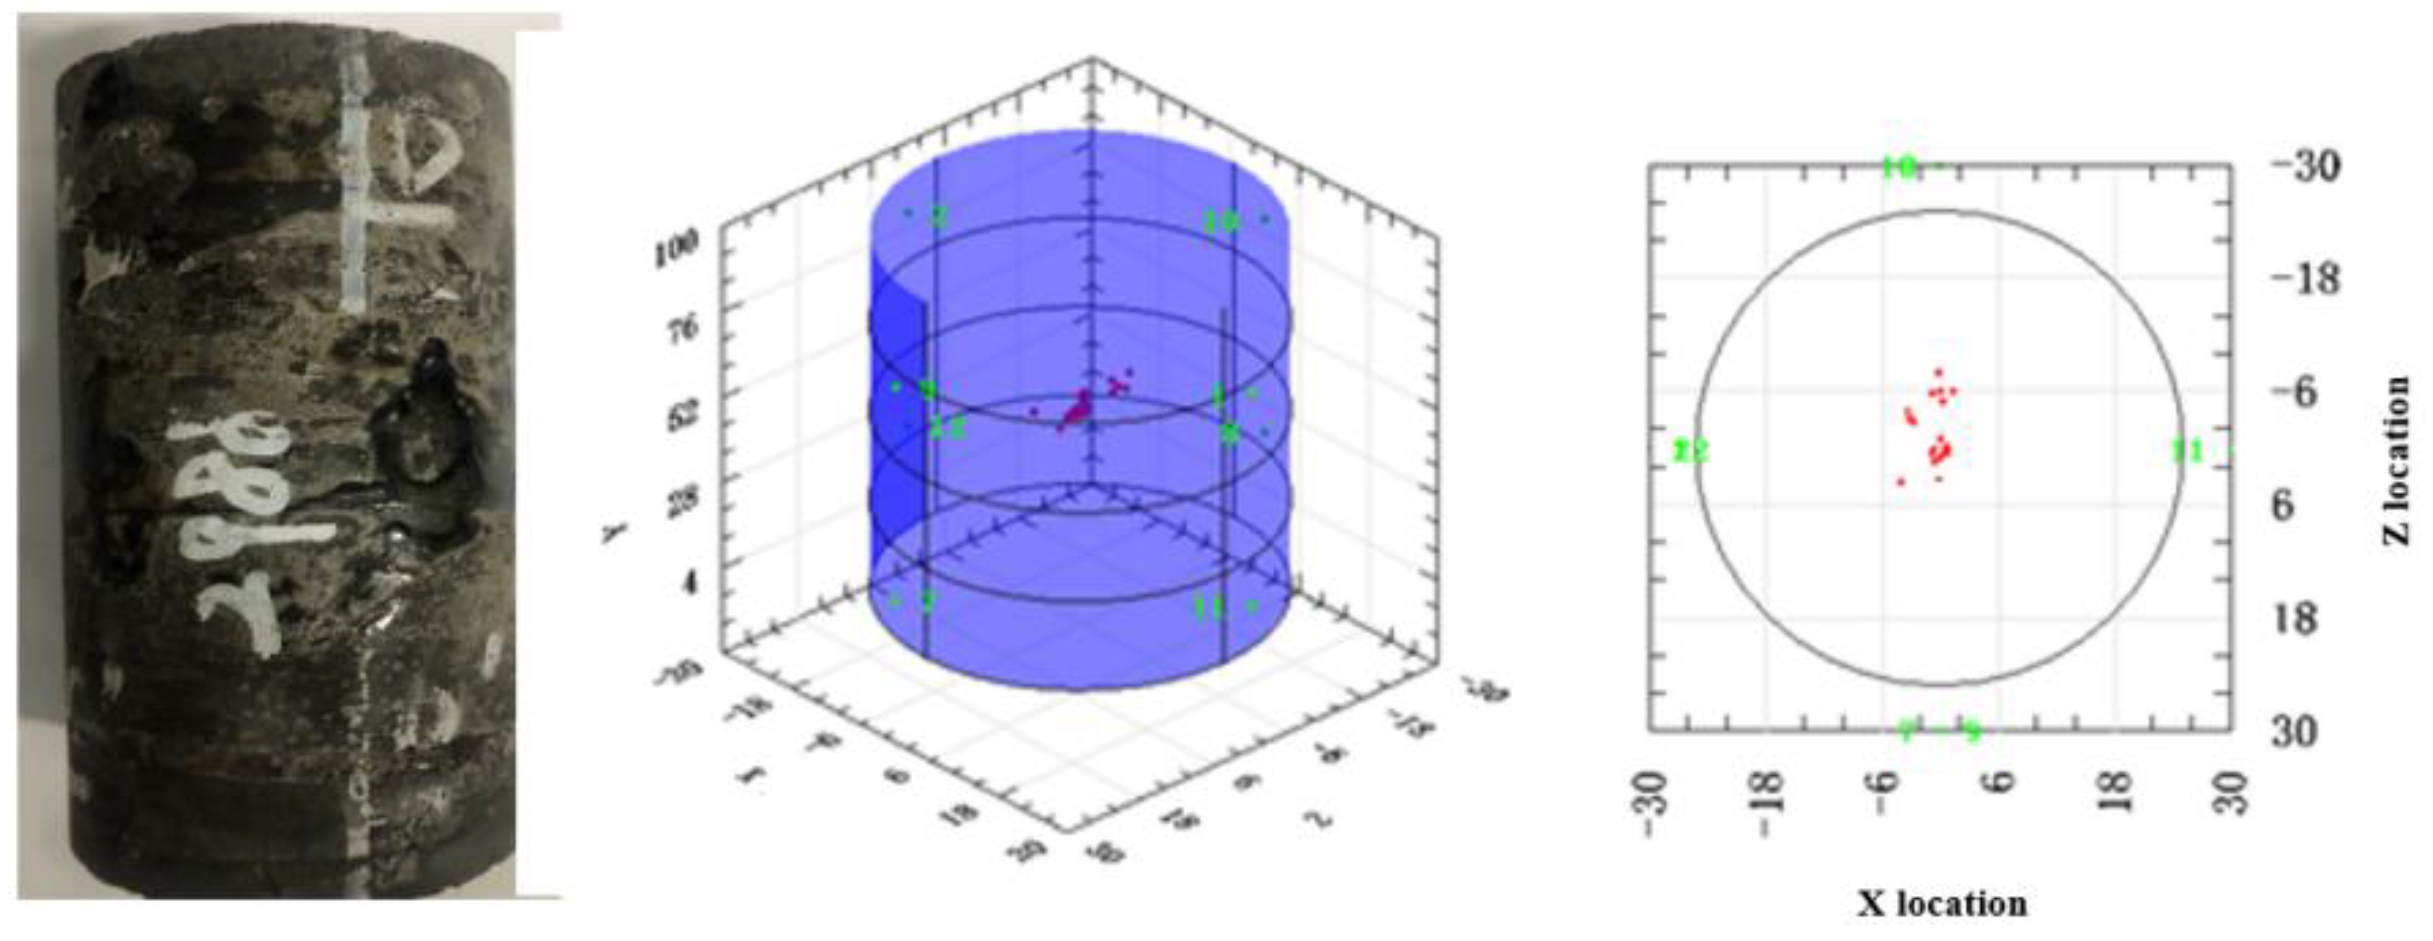
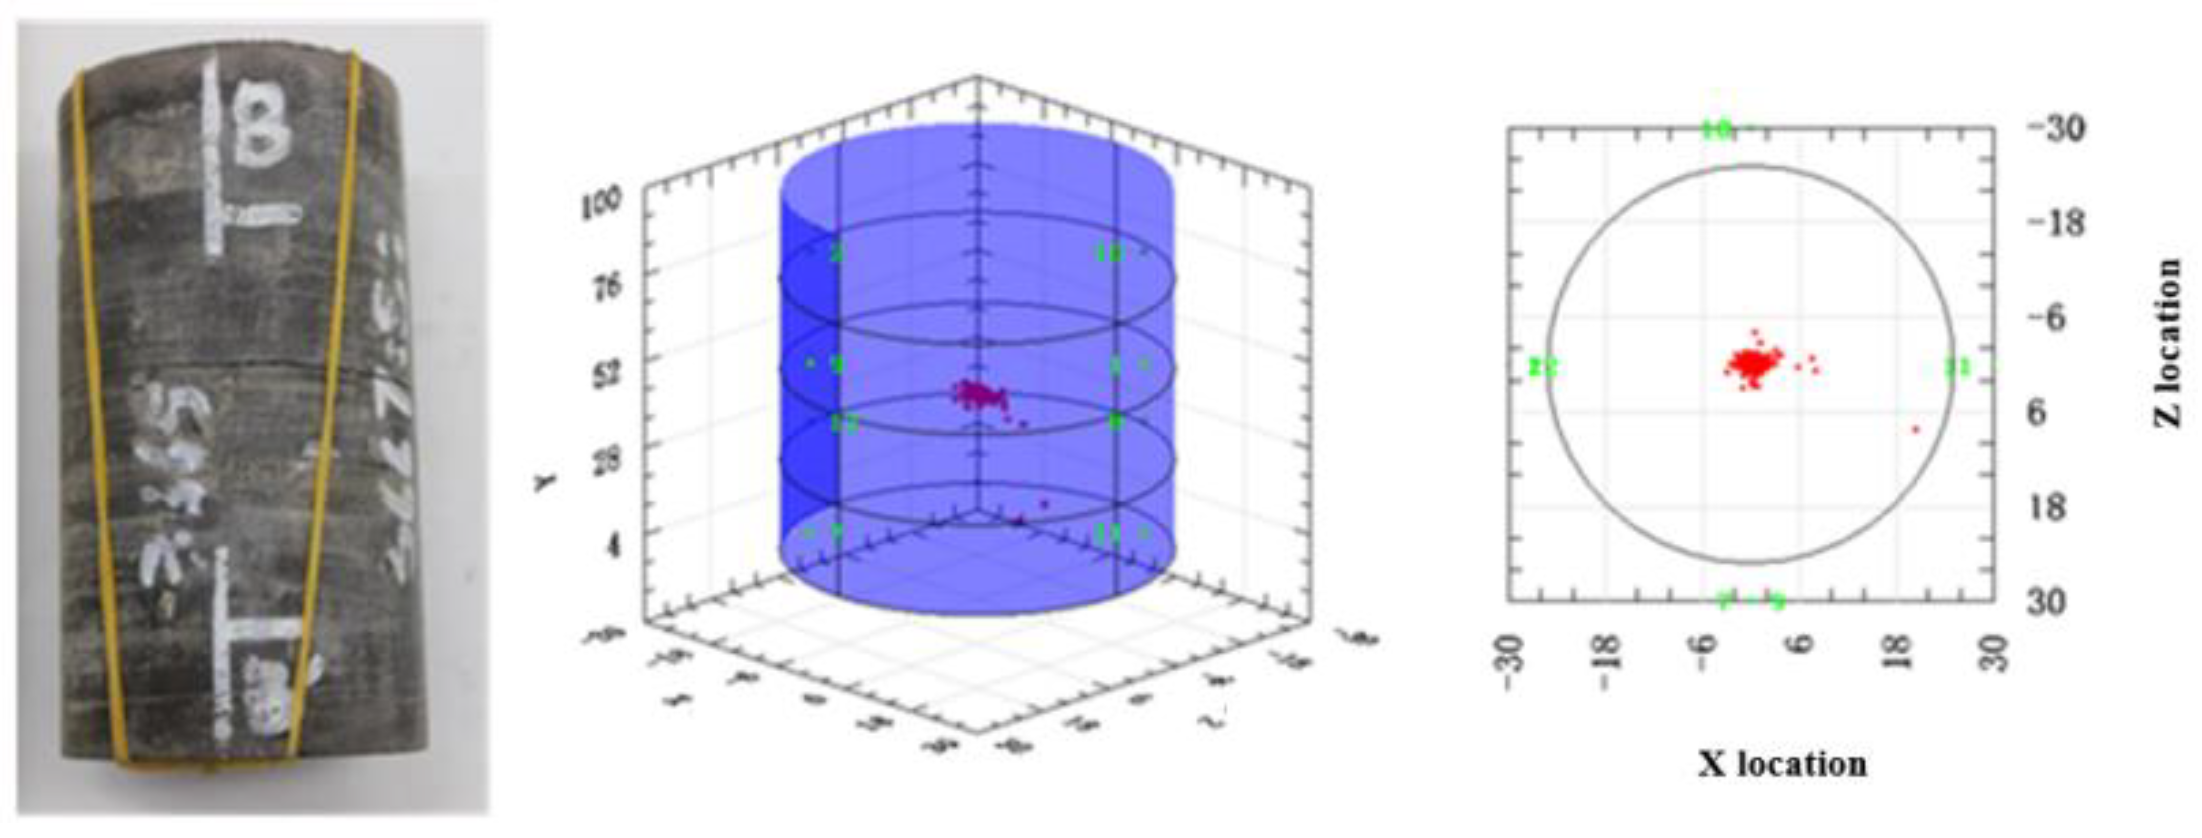
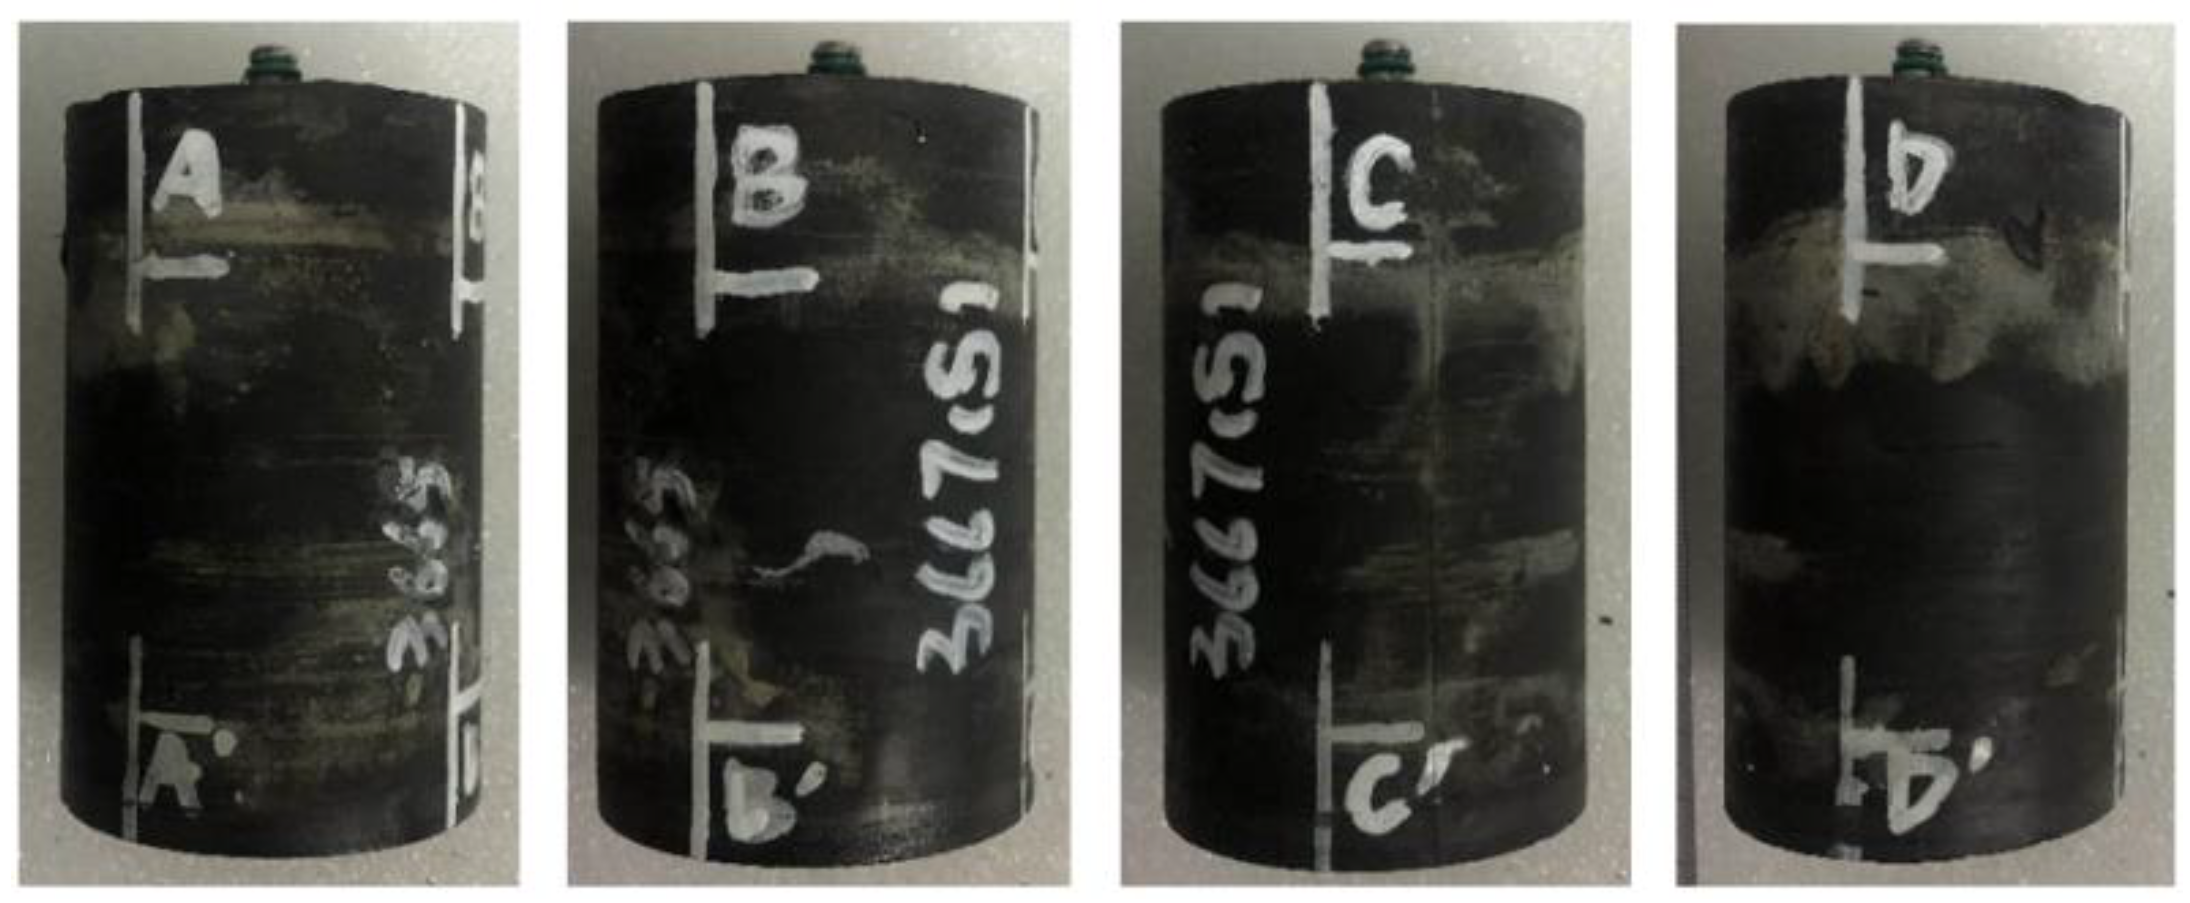
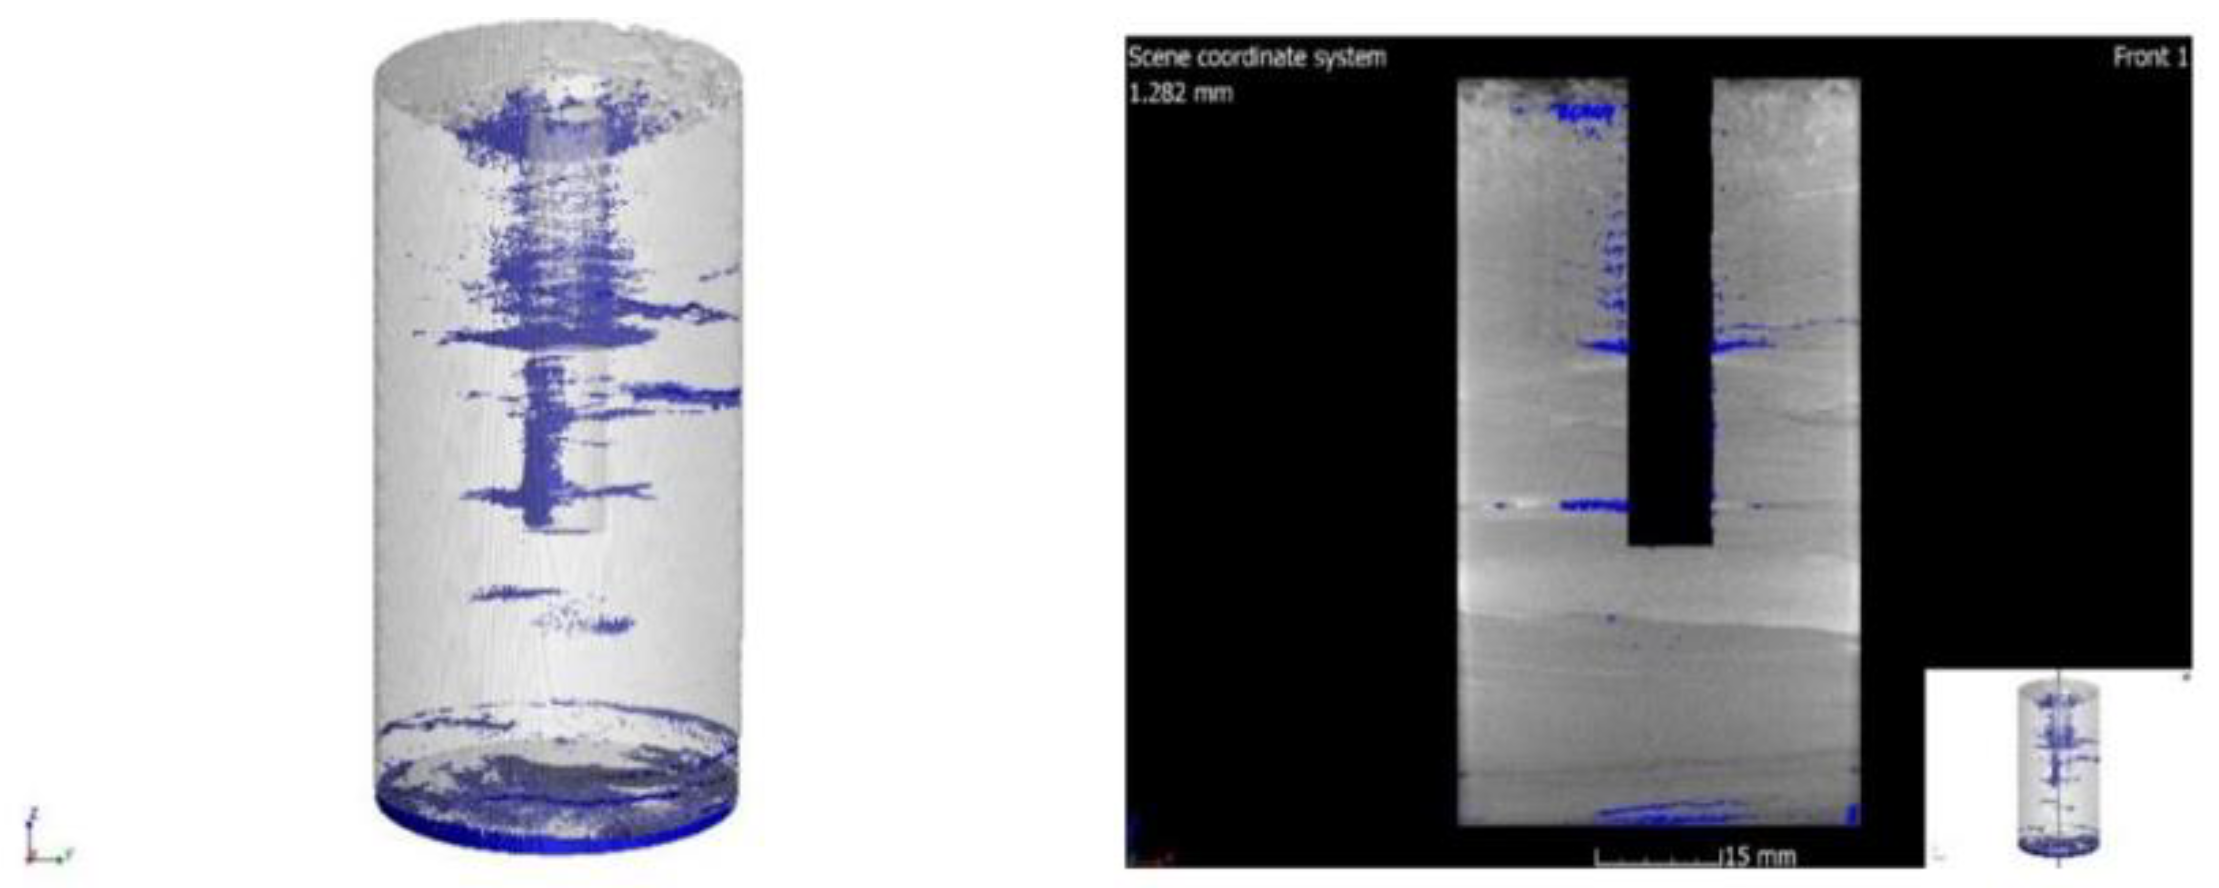
- Description after hydraulic fracturing: At the end of the experiment, a digital camera is first used to photograph the sample surface and record the surface cracks. Then, we select a partial sample to conduct a CT sweep surface, quantitatively characterize the spatial distribution of hydraulic cracks, and finally take the test sample after the test, and the hydraulic crack is displayed; then, we summarize the hydraulic crack expansion.
3. Results
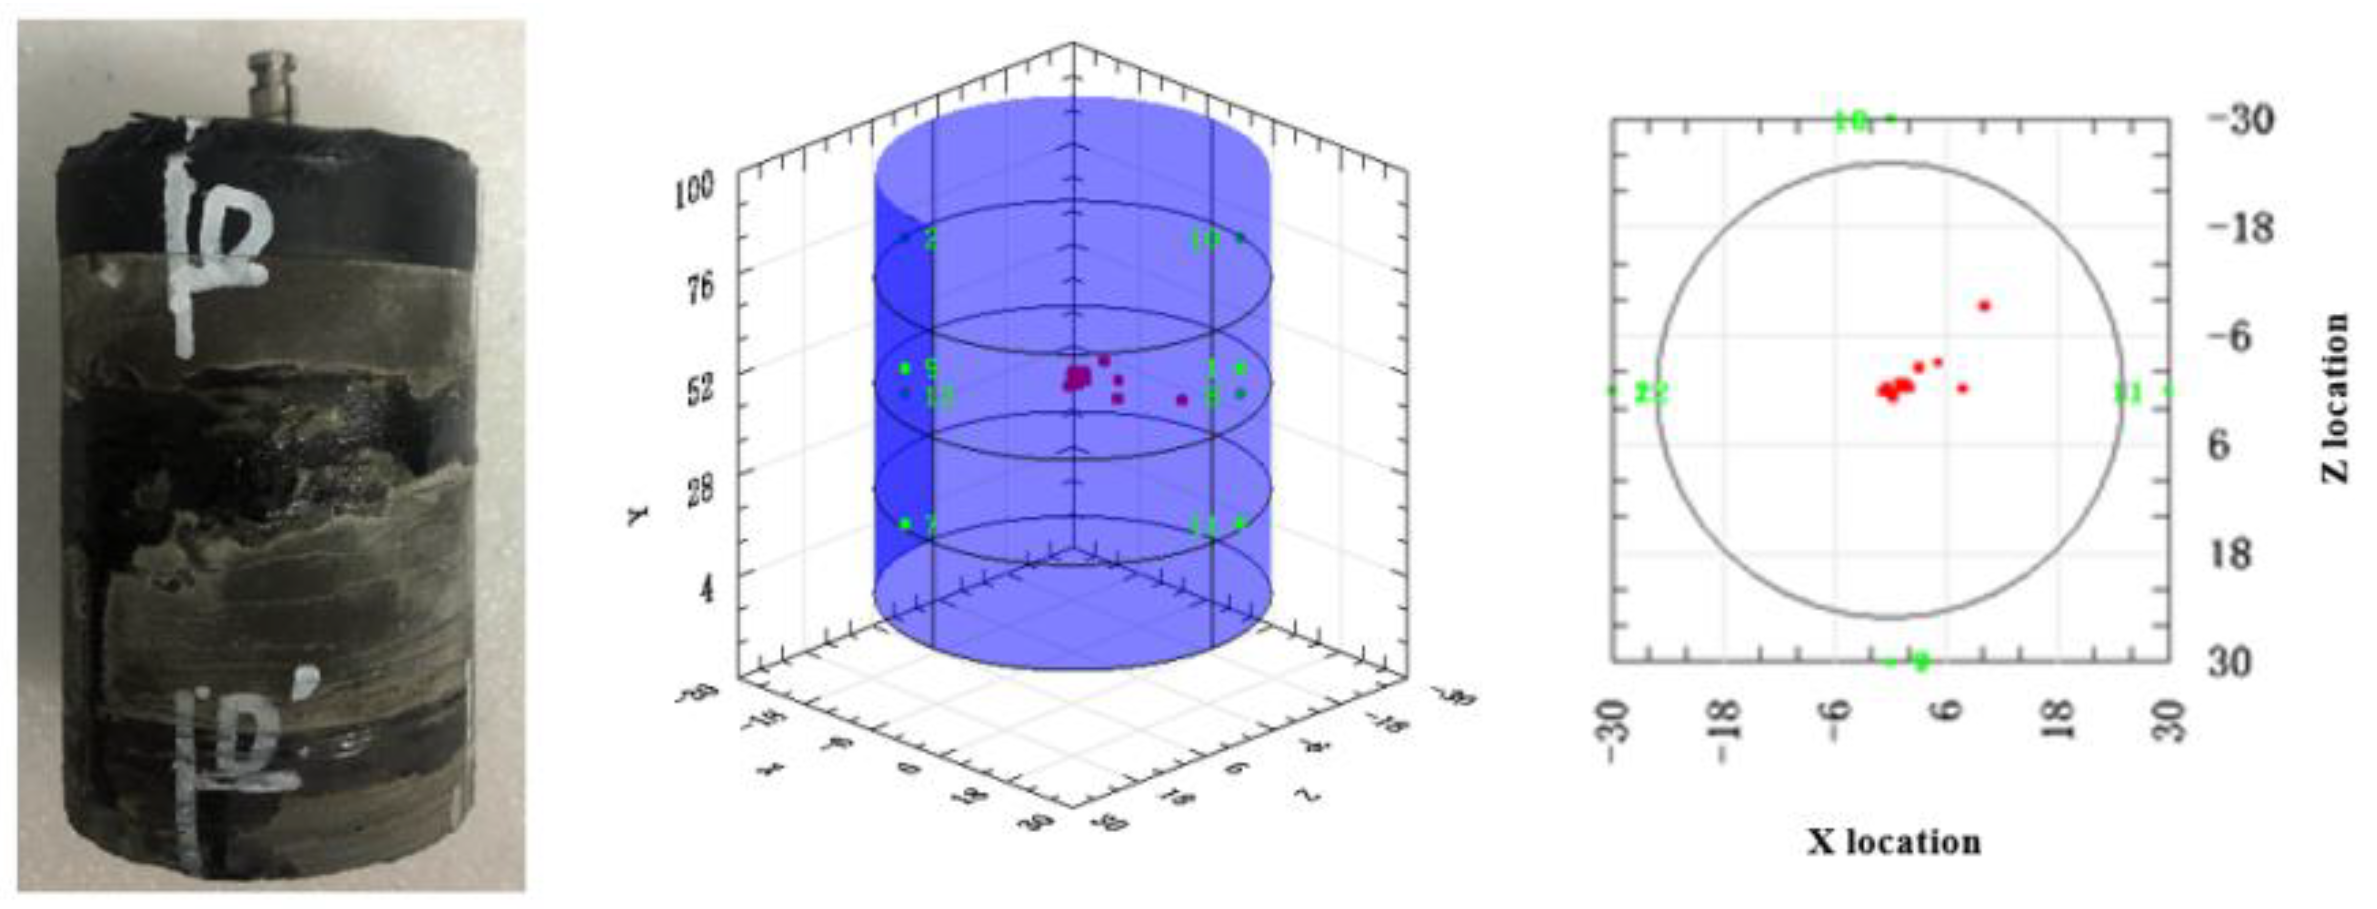
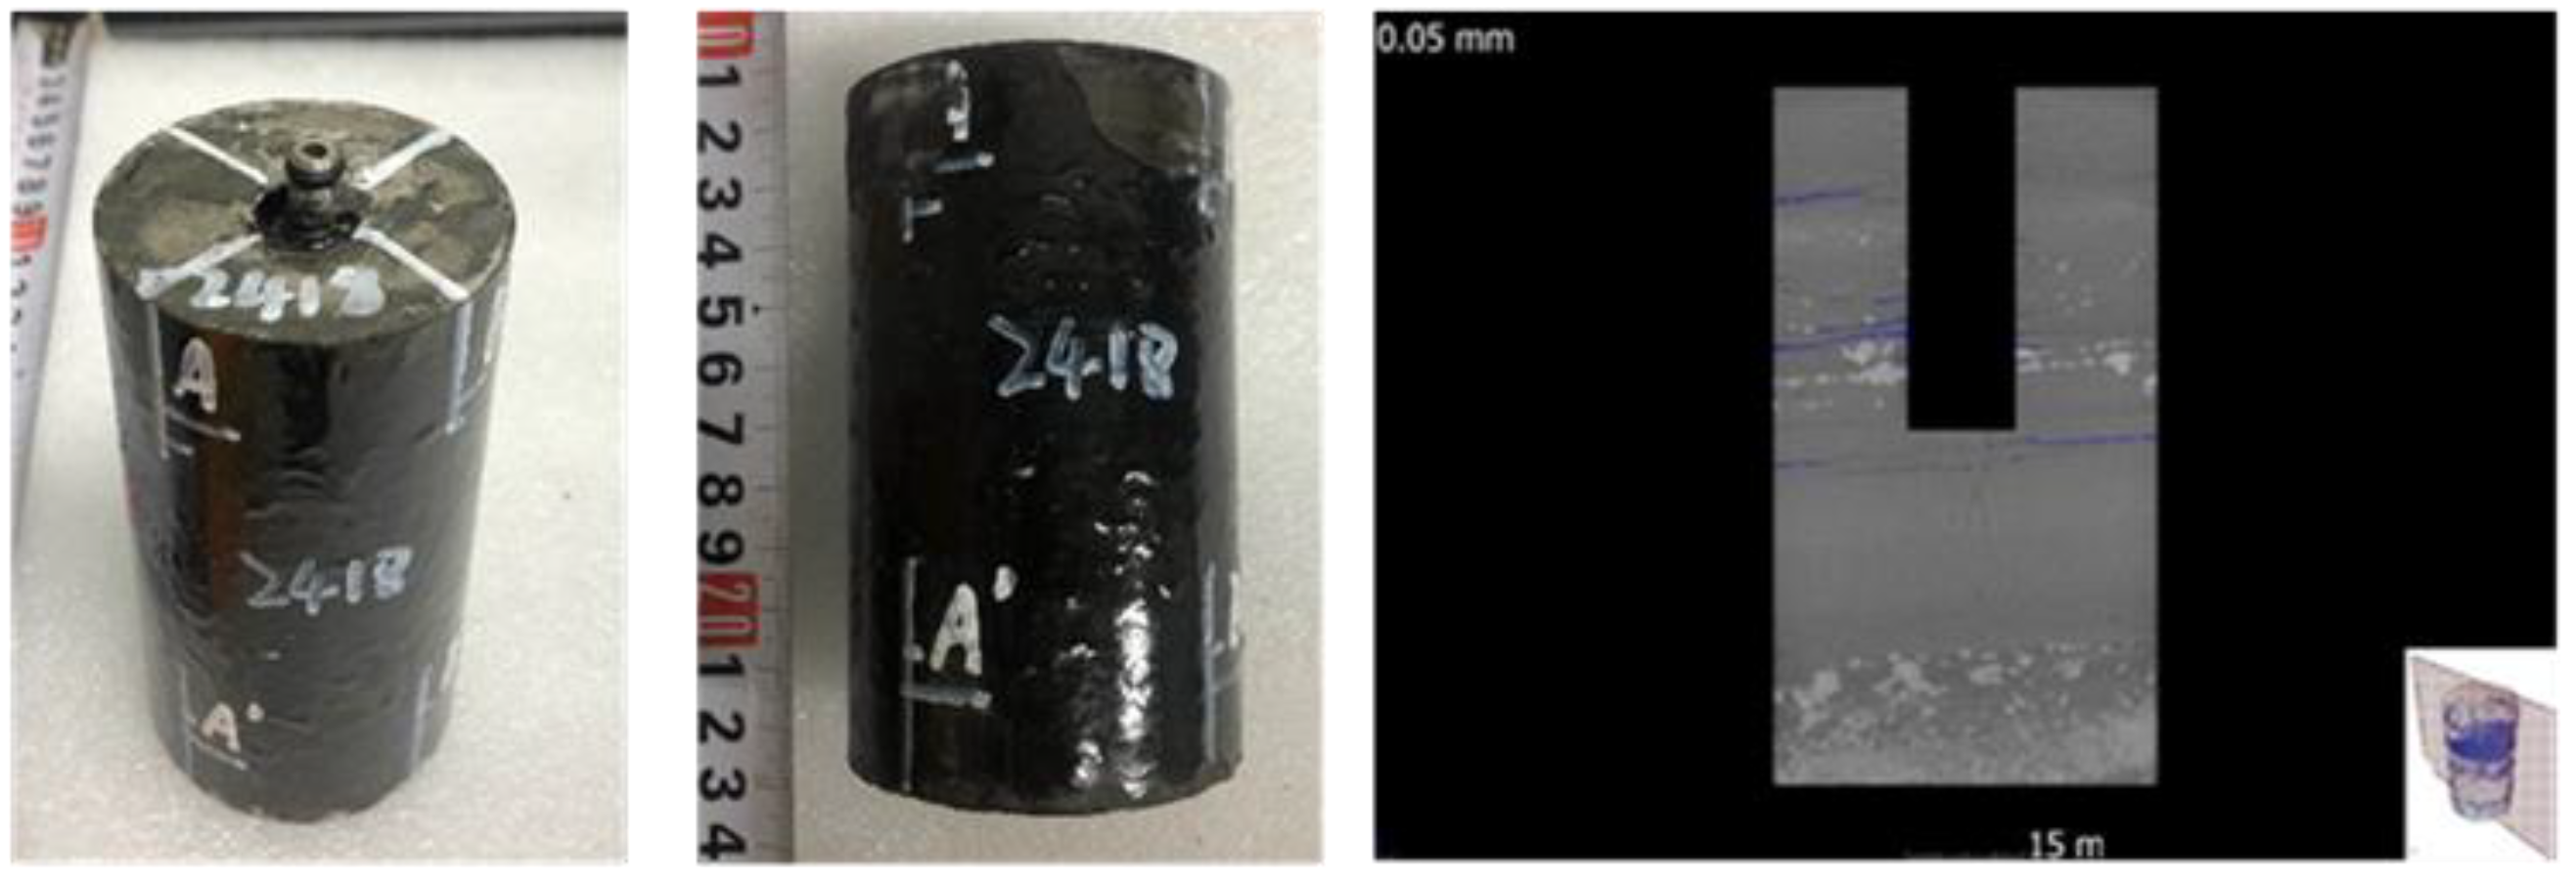
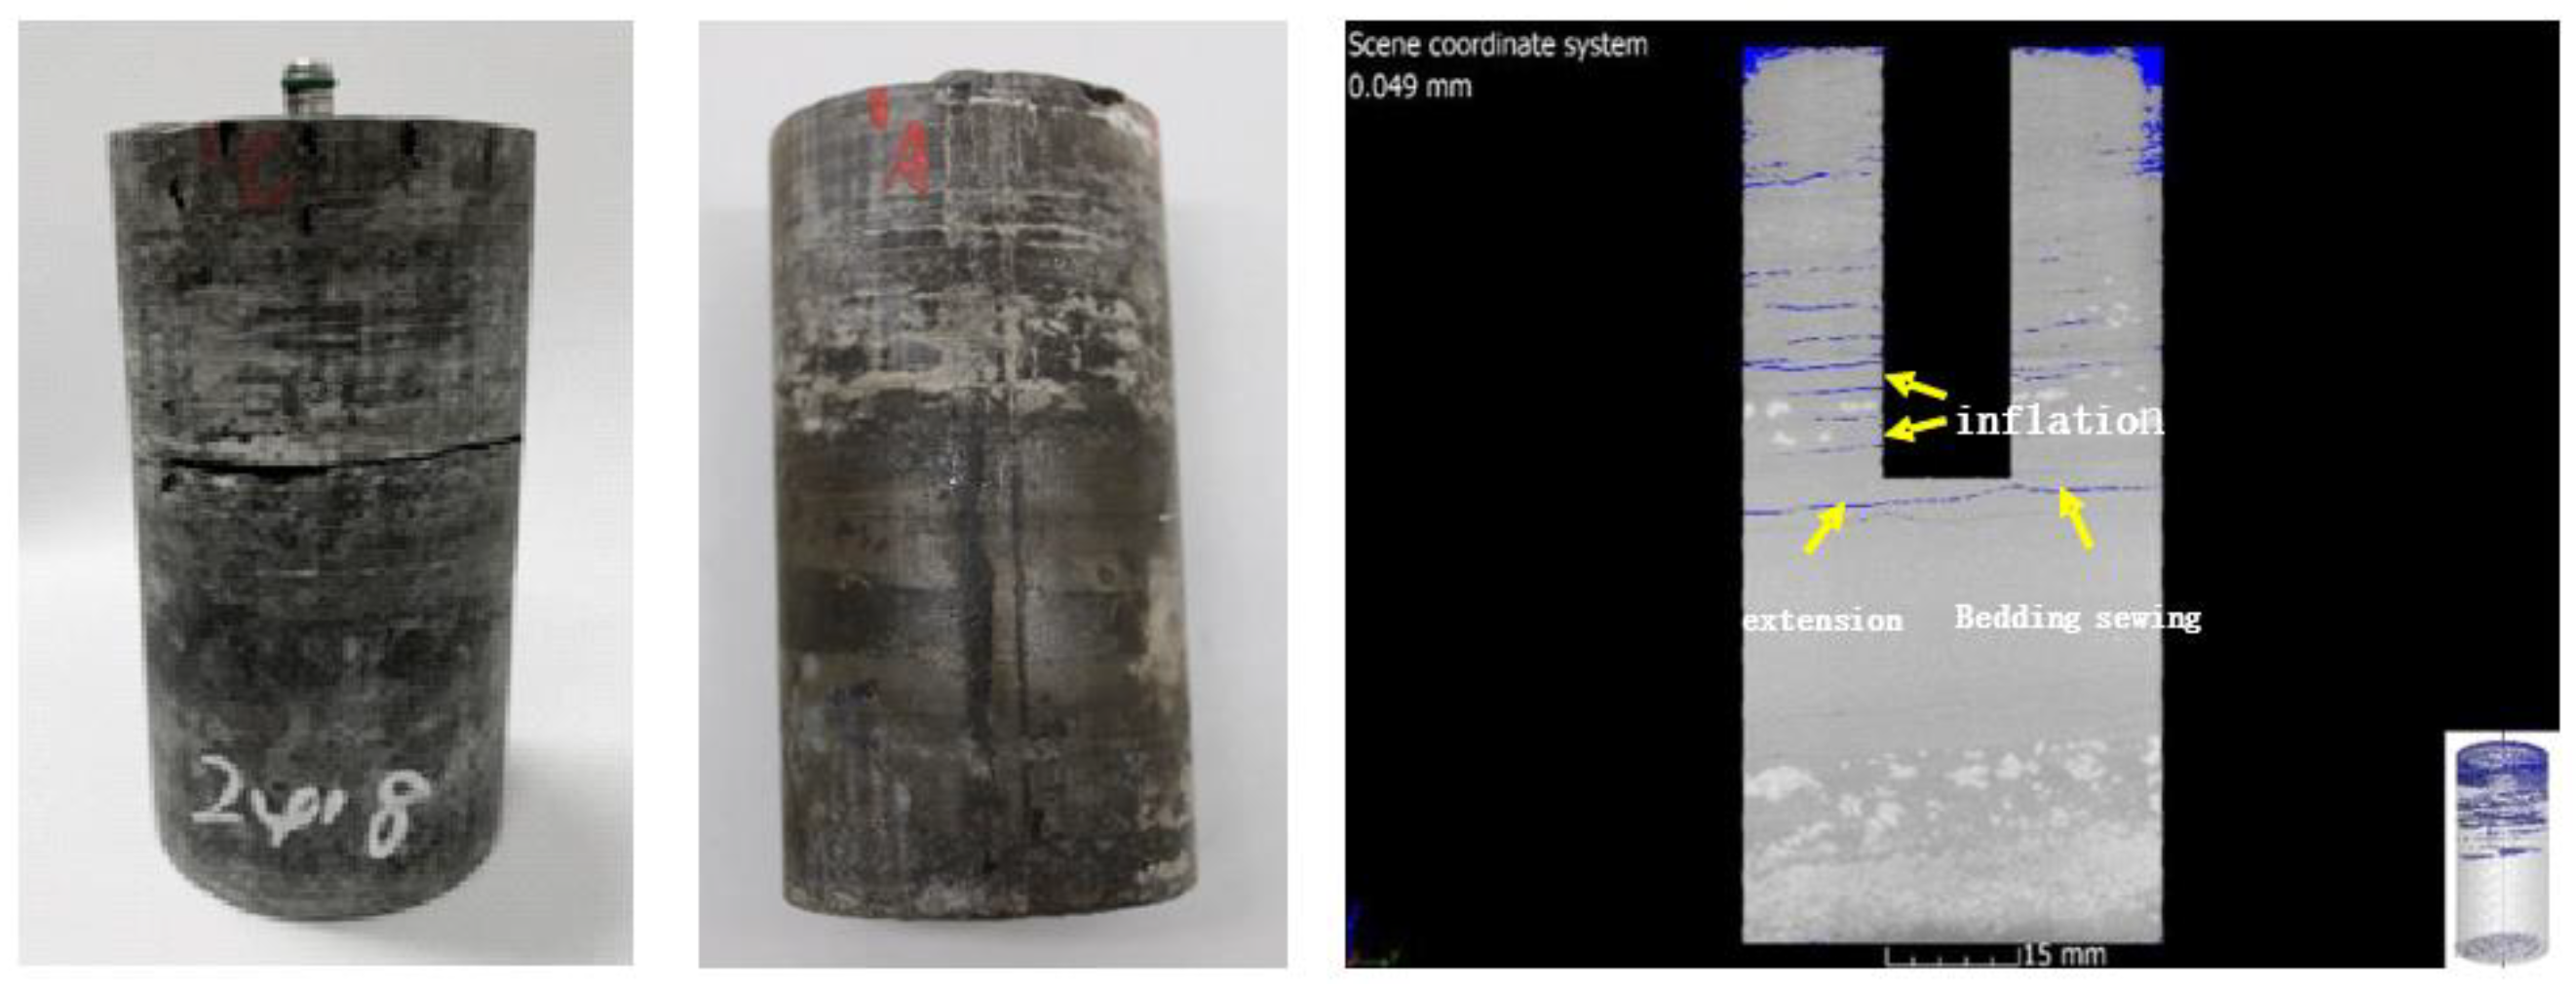
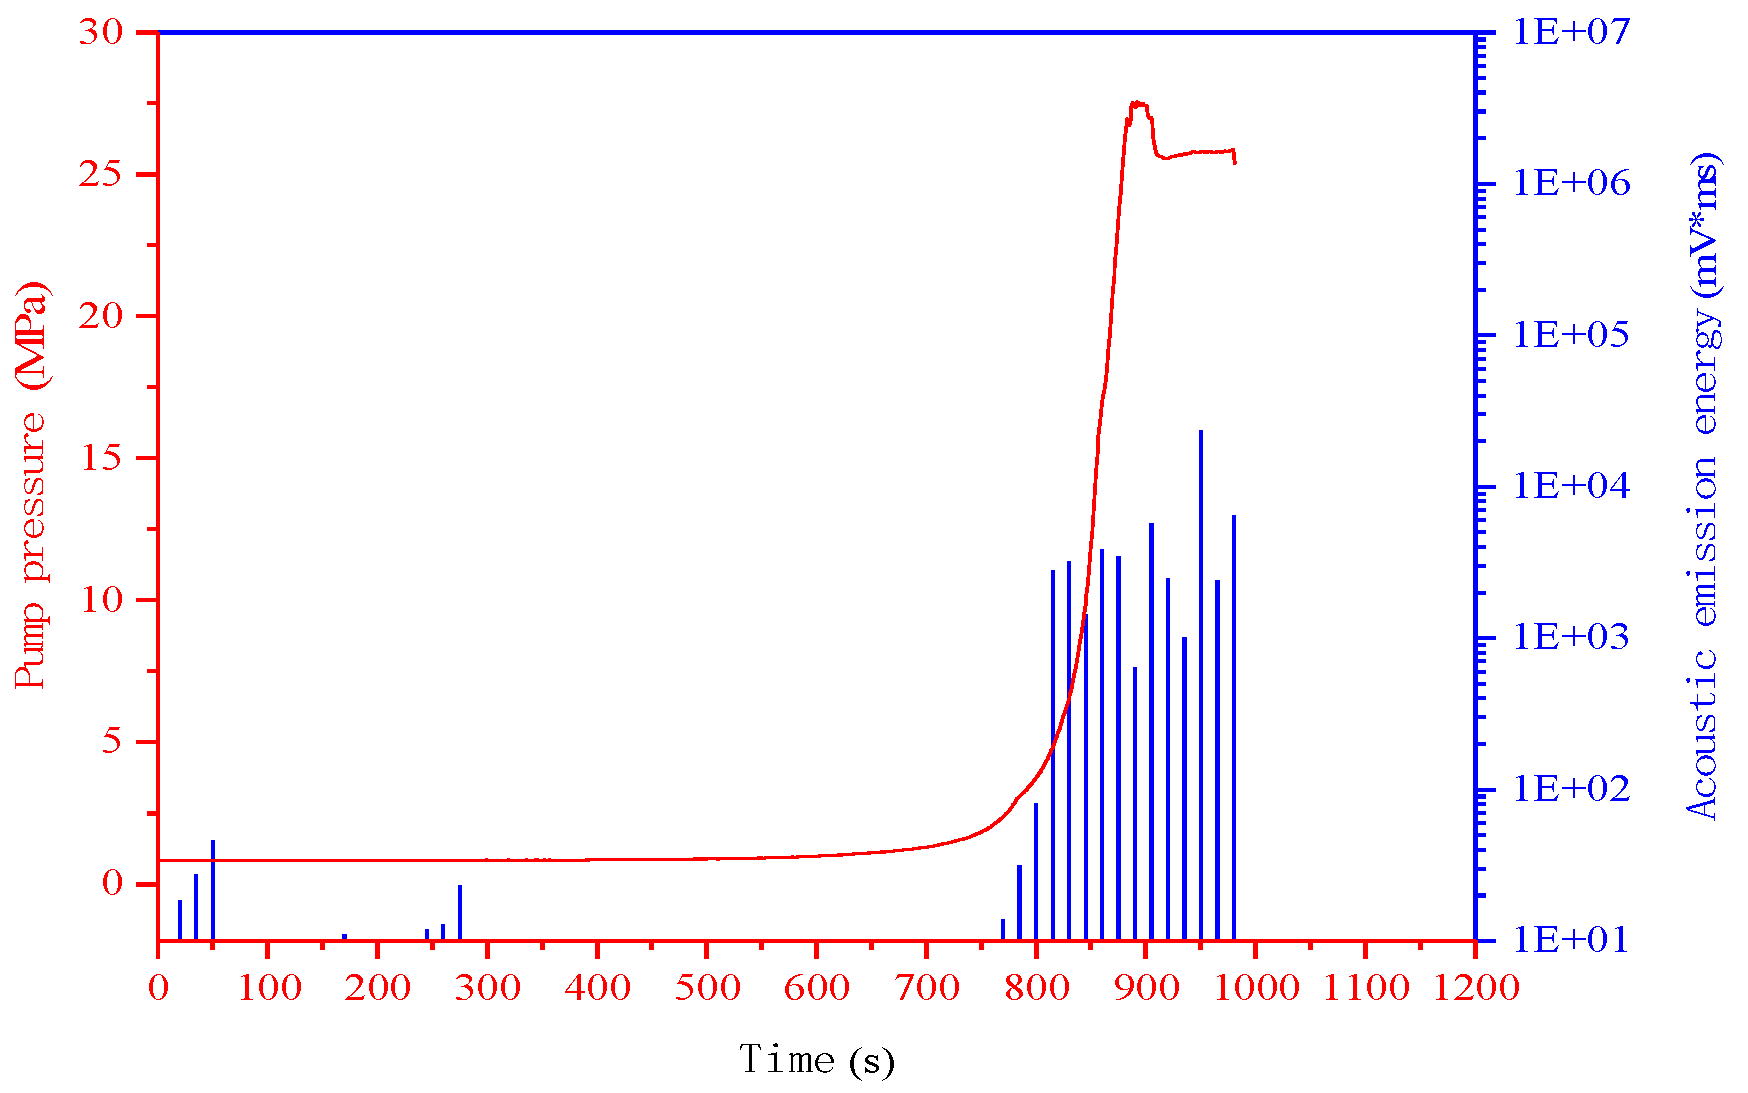
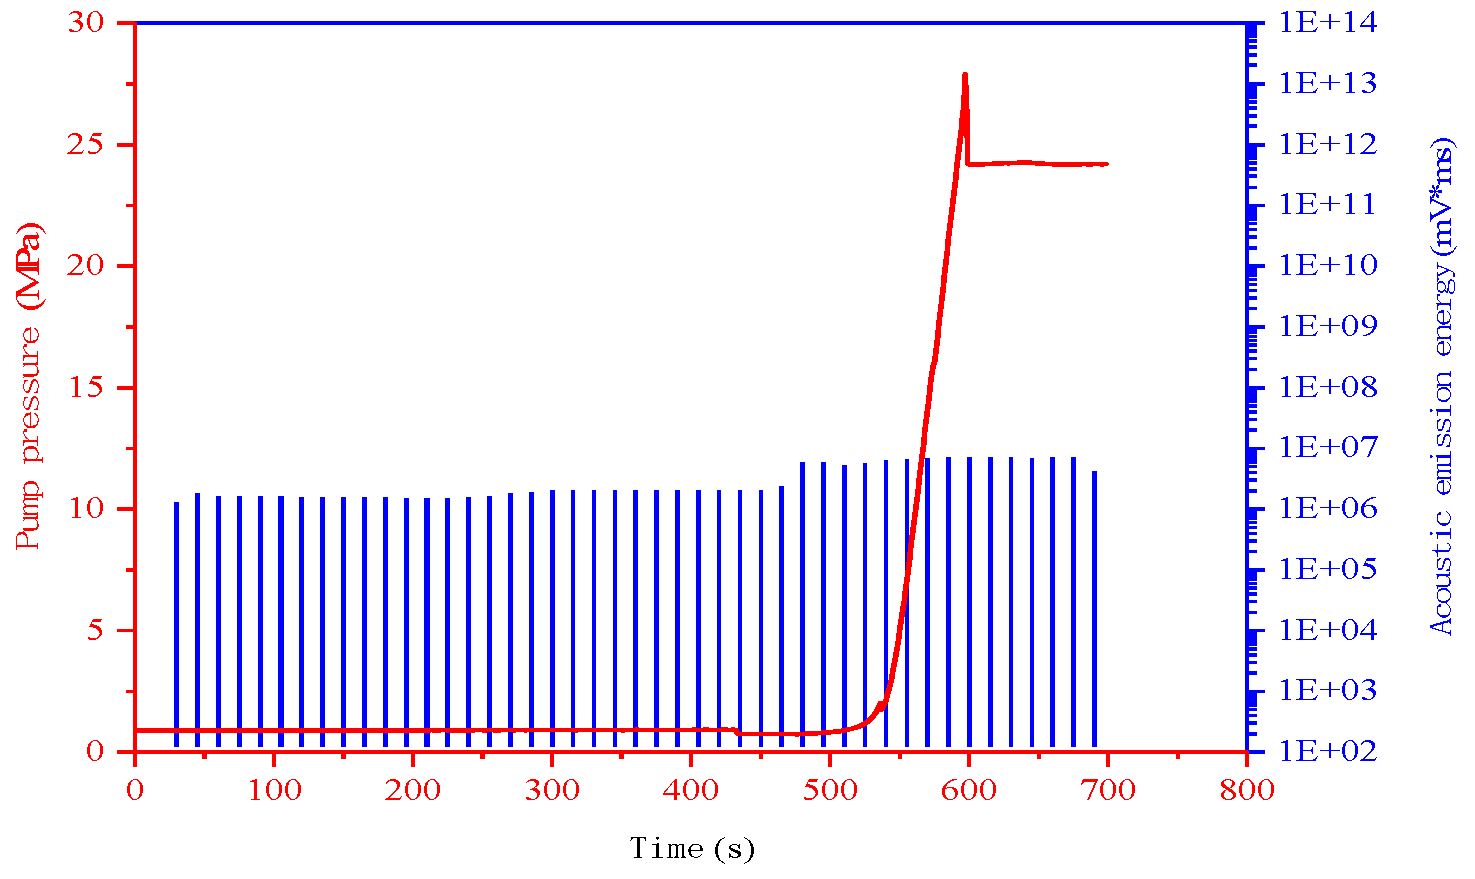
3.1. Slippery Water Fracturing Fluid
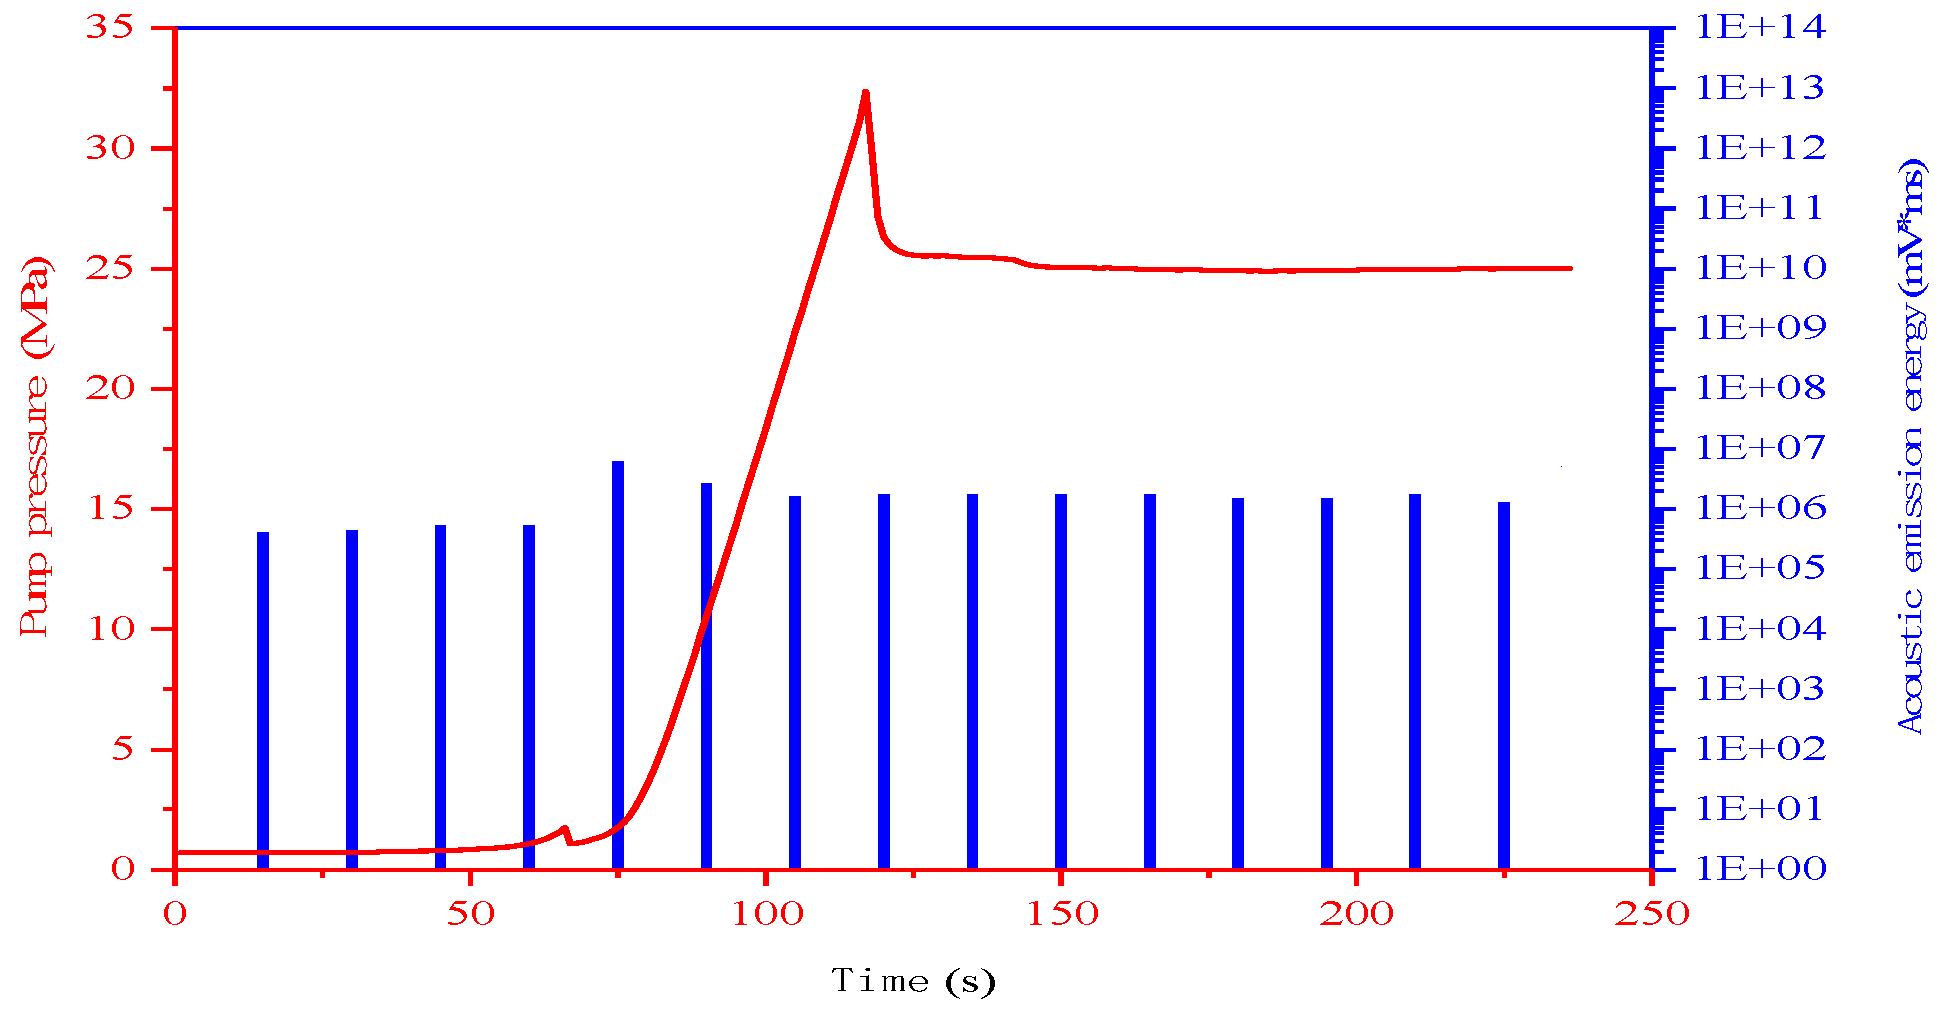
3.2. Guar Gum Fracturing Fluid
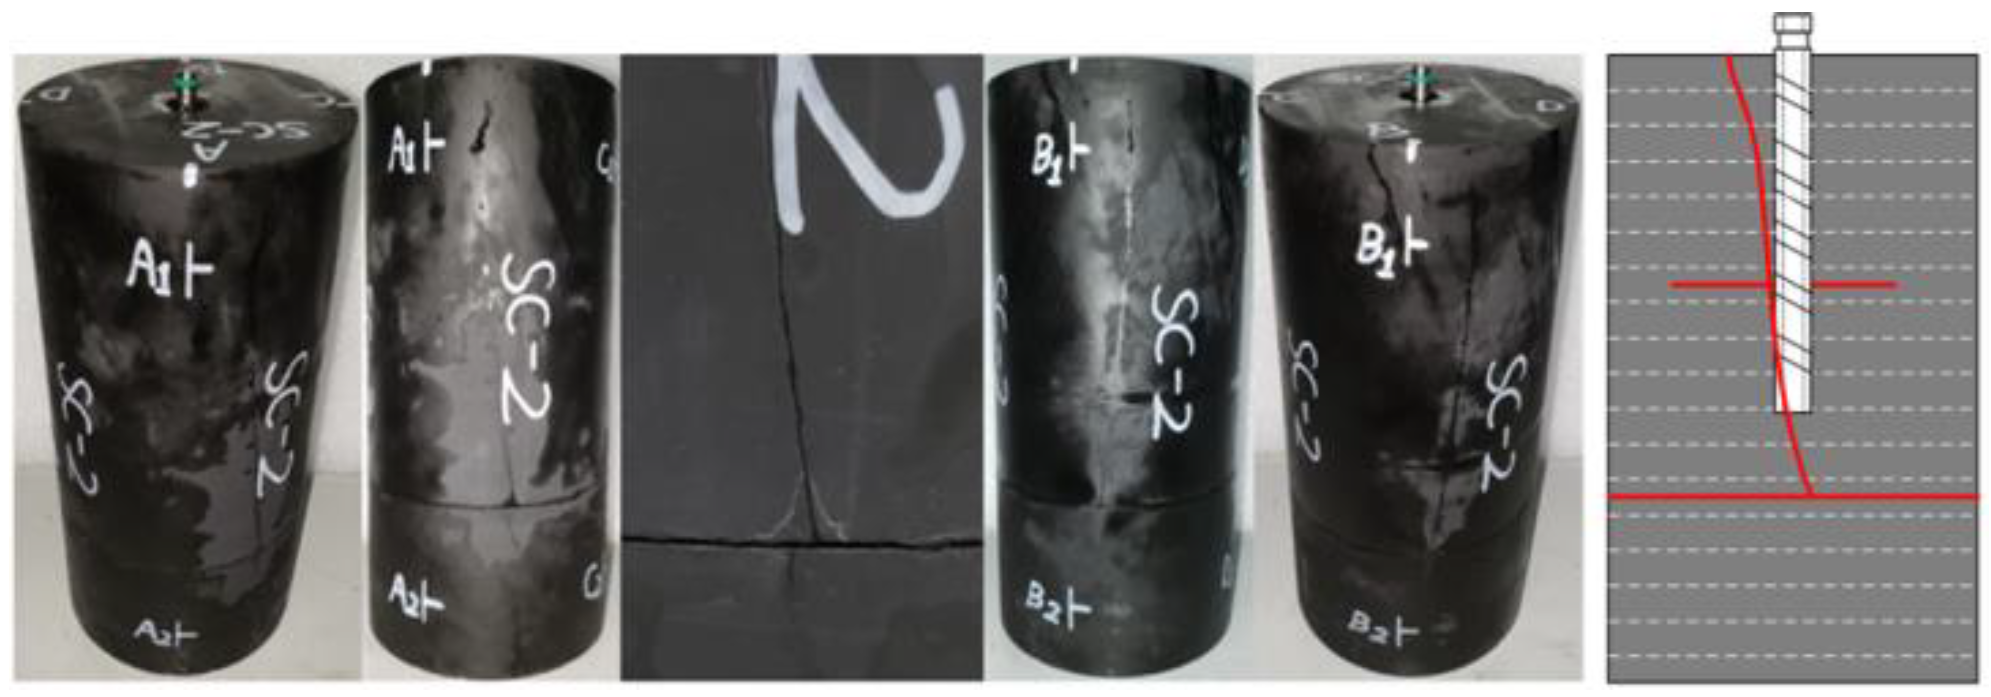
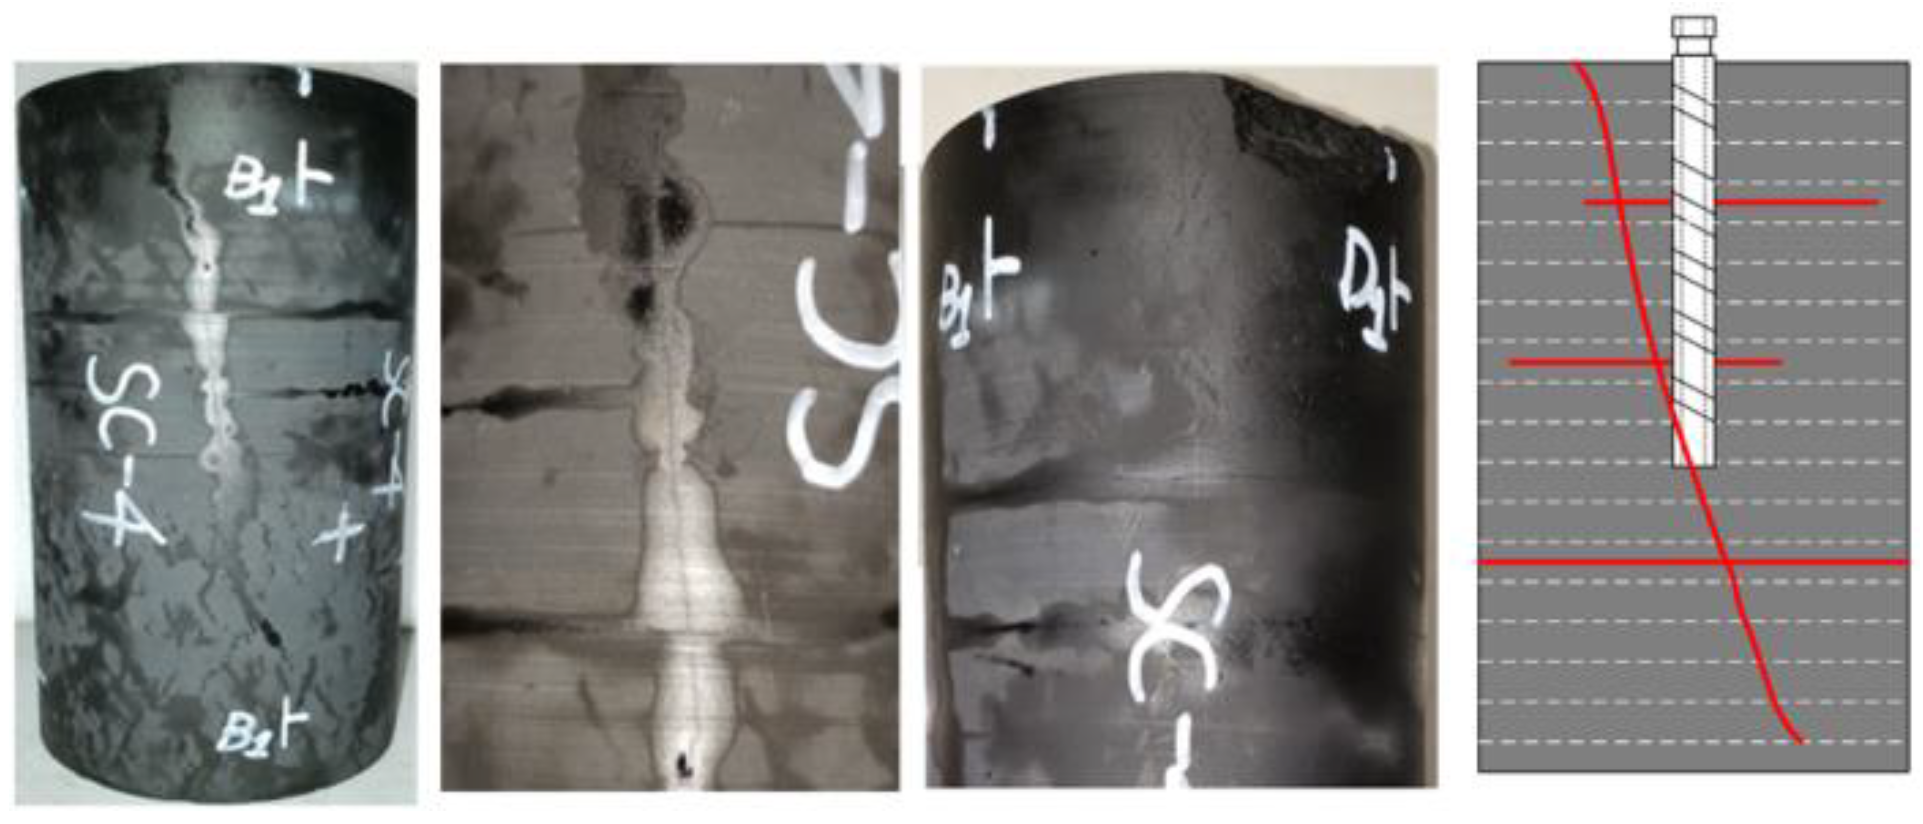
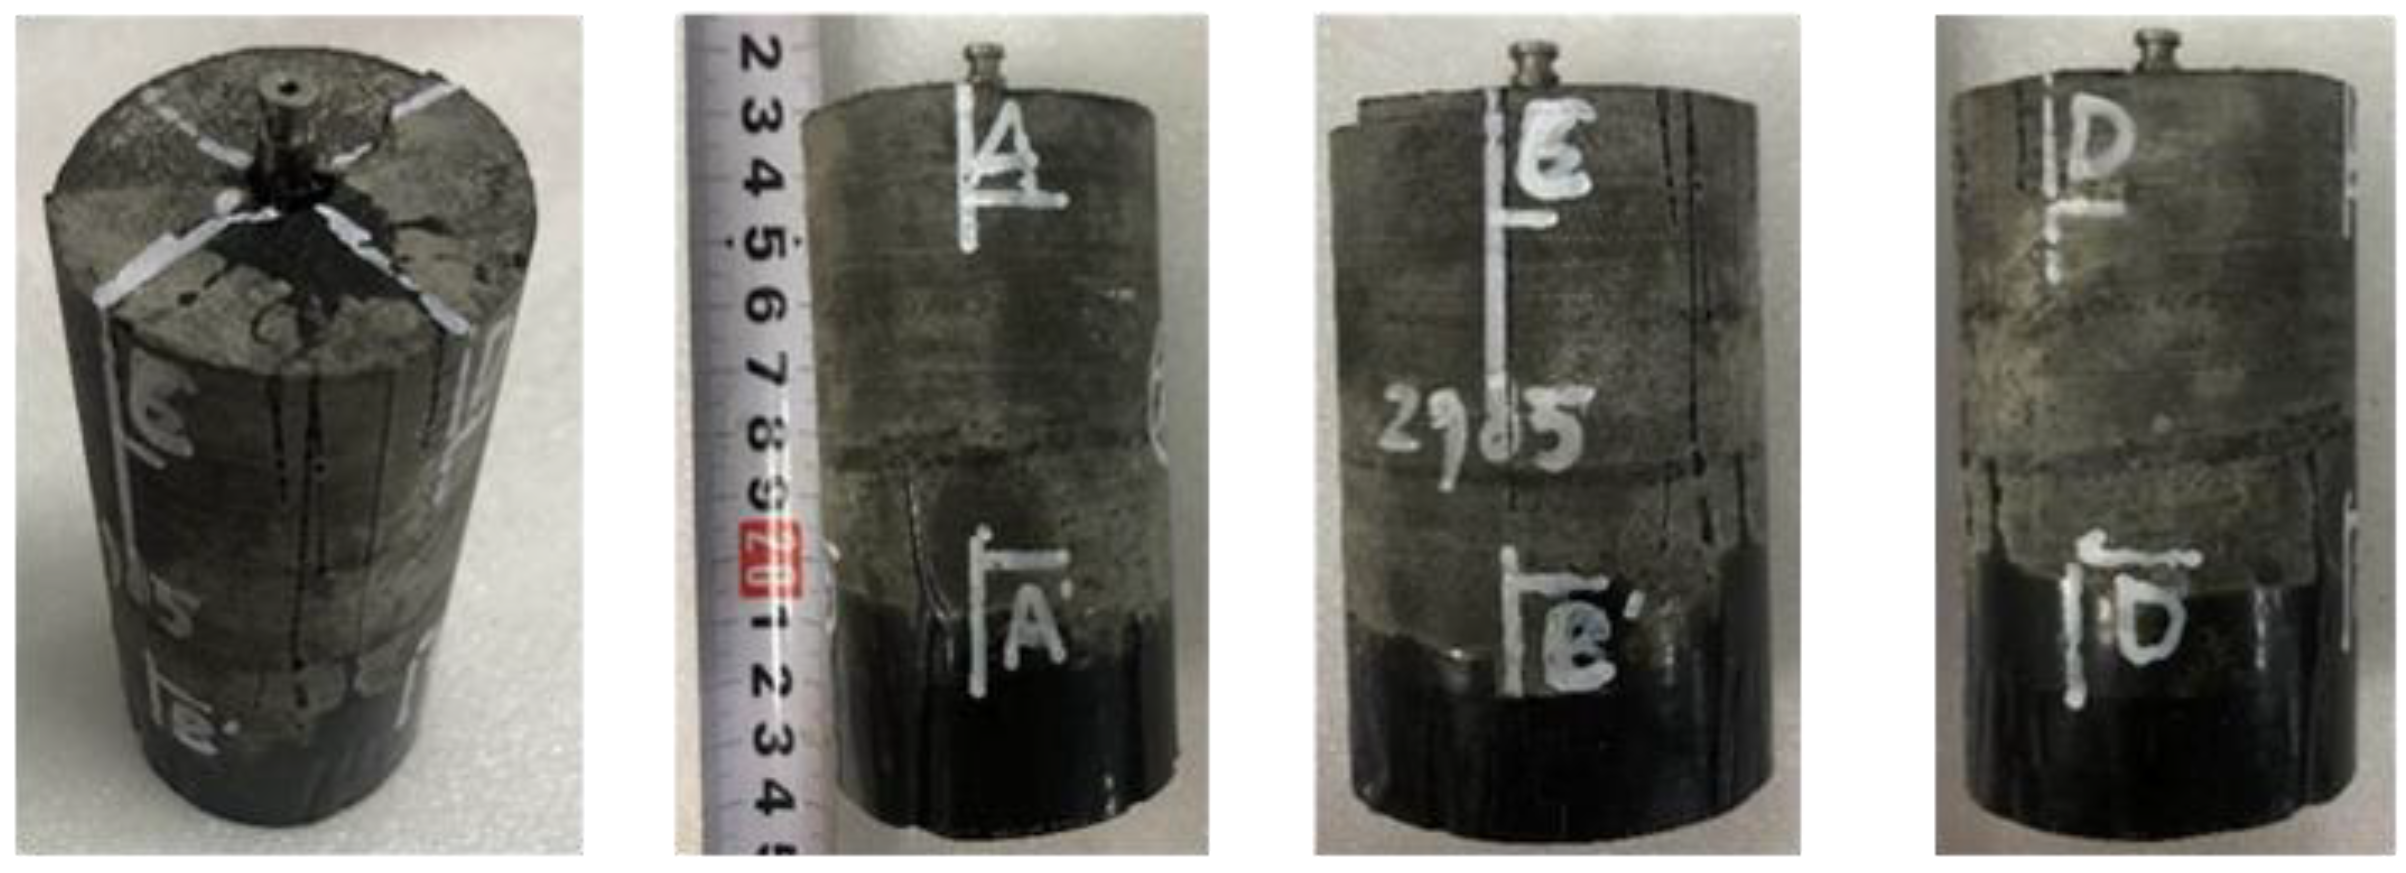
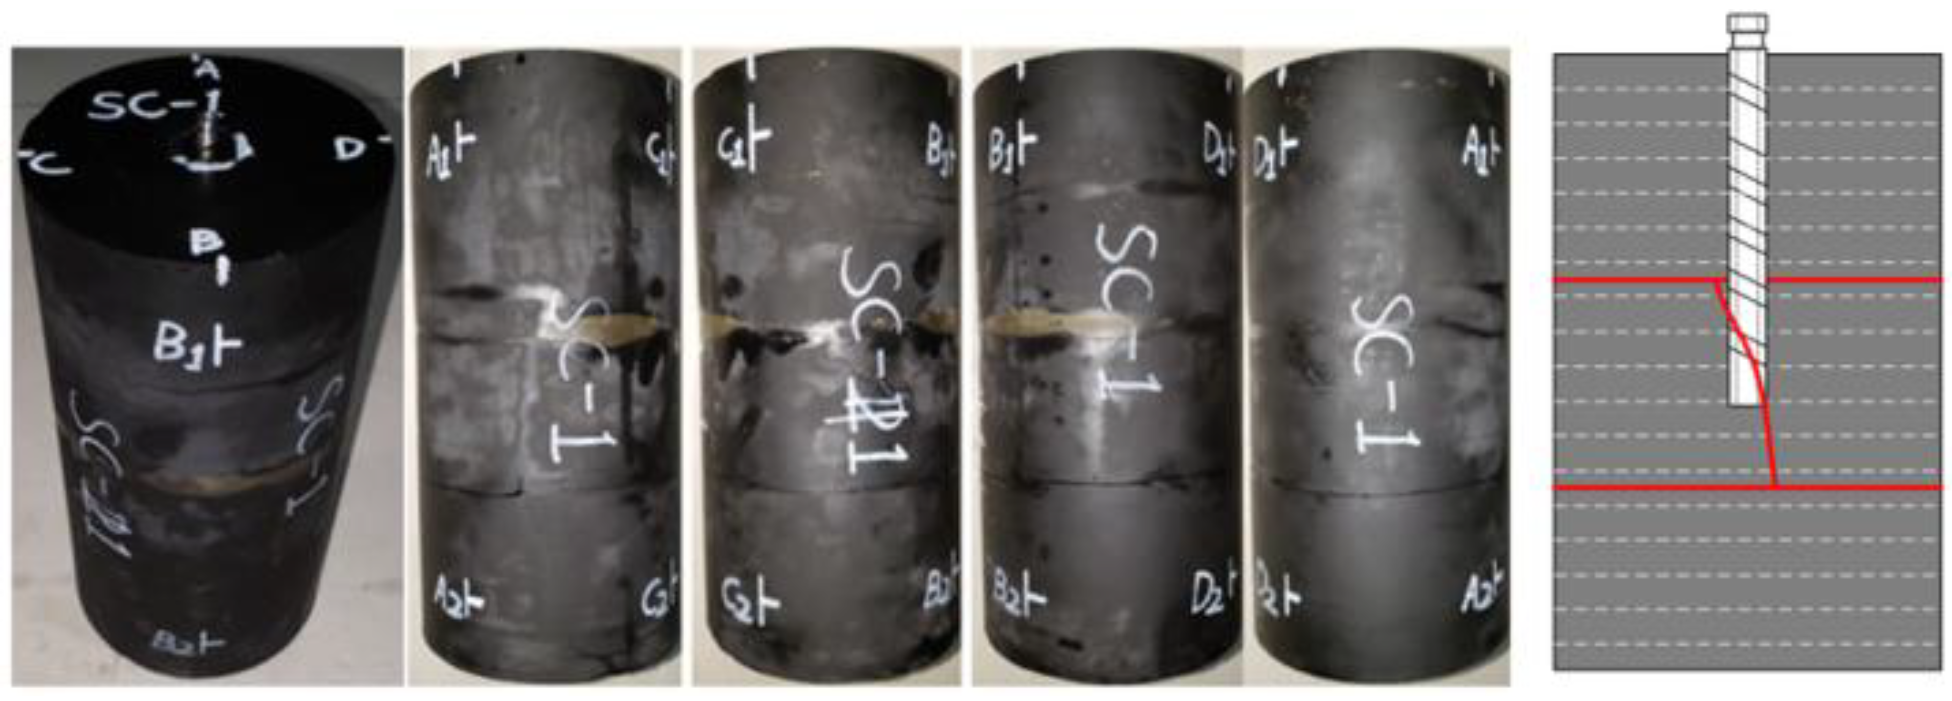
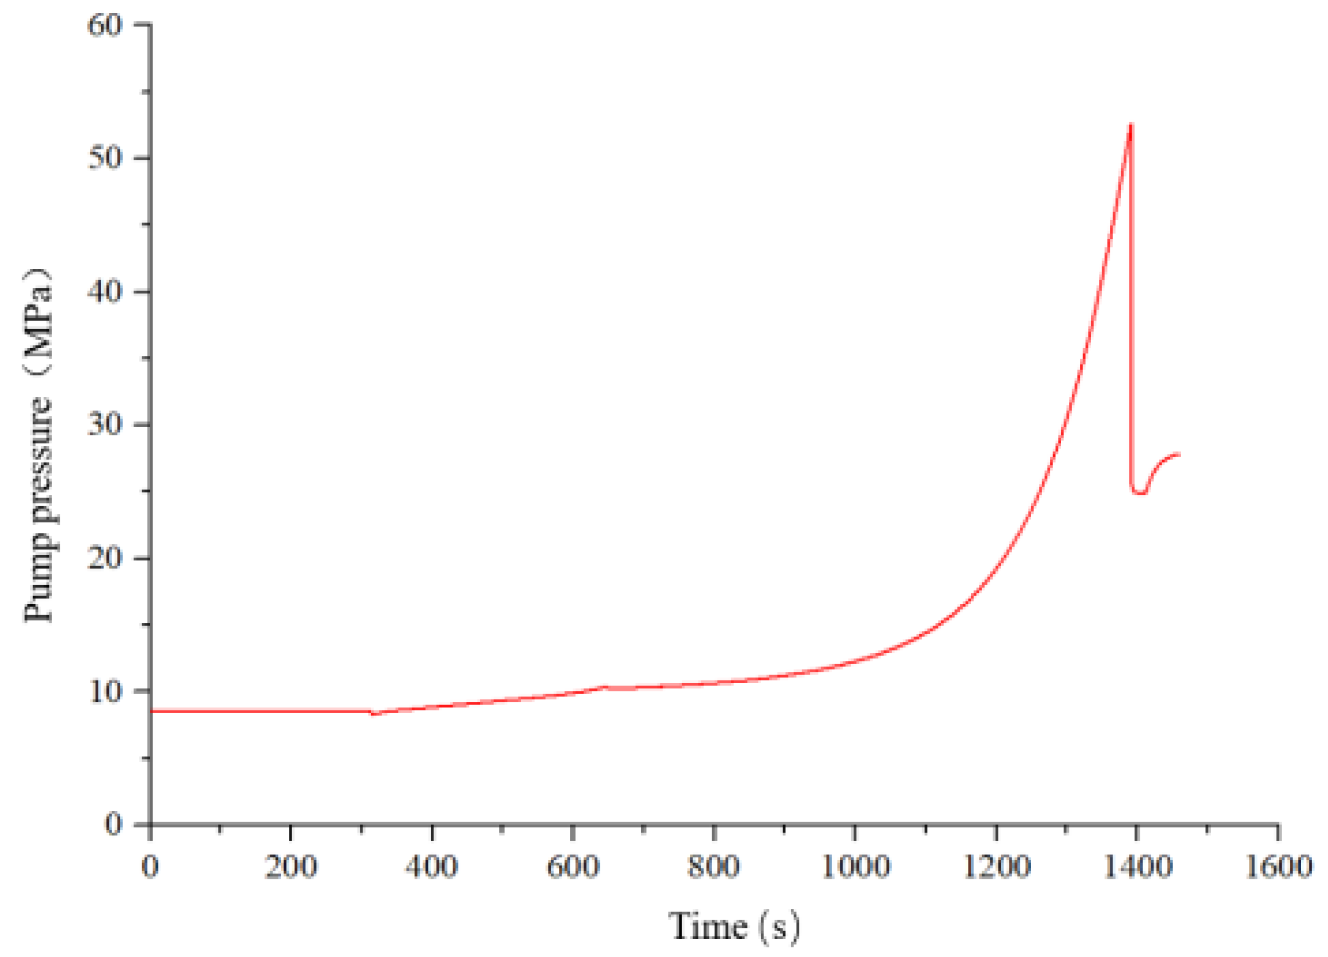
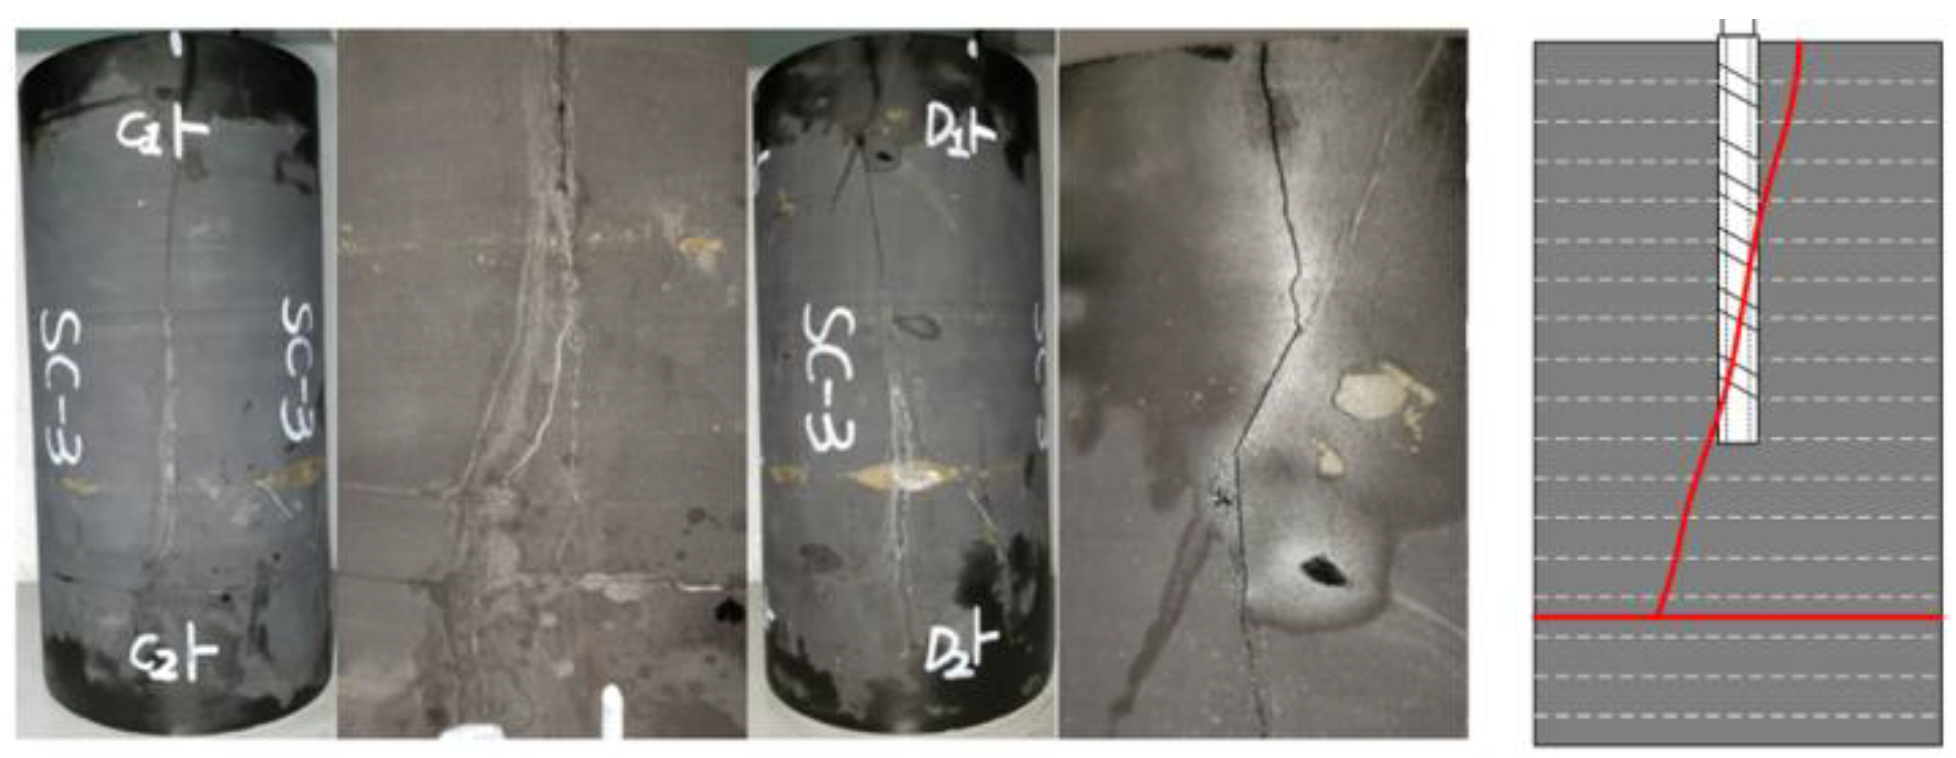
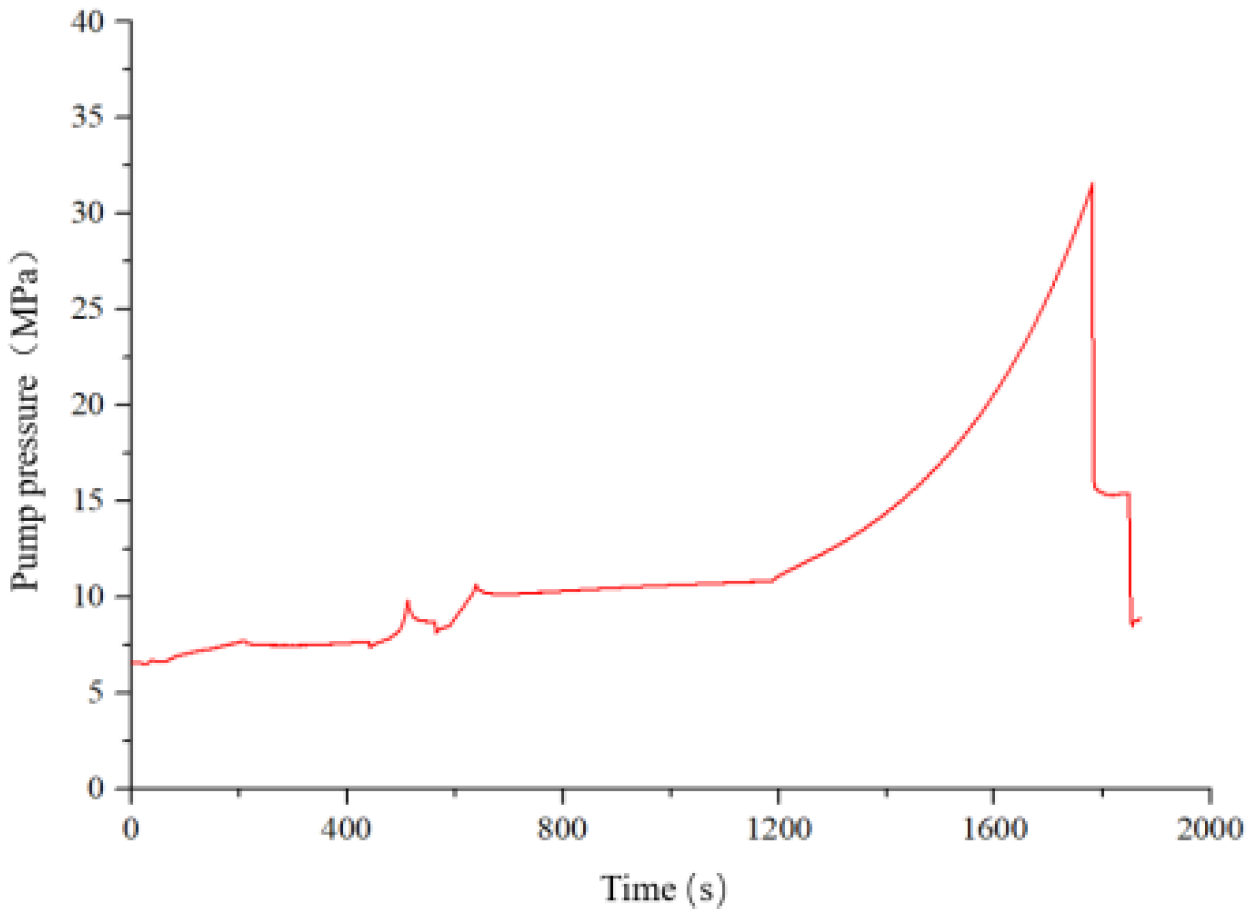
3.3. Supercritical Carbon Dioxide Fracturing Fluid
4. Discussion
4.1. Fracturing Fluid Viscosity
4.2. Ground Stress
4.3. Pump Displacement
5. Conclusions
- (1)
- Low-viscosity slick water fracturing fluid can more easily open bedding fractures and induce complex fracture networks in the reservoir. Guar gum fracturing has high viscosity and good sand-carrying performance, so high-viscosity guar fracturing fluid can still open bedding fractures around the wellbore. Supercritical carbon dioxide has low viscosity and high diffusion characteristics, which can easily activate natural bedding fractures and induce complex fracture networks in the formation, but the fracture width is generally small. In addition, due to the weak sand-carrying capacity of supercritical carbon dioxide, the fracture support is insufficient. At the same time, with the increase in viscosity, the occurrence time of fracturing pressure decreases gradually, and the fracturing pressure gradually increases. However, the fracturing pressure of supercritical carbon dioxide is much higher than that of other types of fracturing fluid due to its strong permeability and poor sand-carrying properties.
- (2)
- Under the condition of pumping supercritical carbon dioxide fracturing fluid, as the in-situ stress increases, the fracture pressure of the inter-salt shale gradually increases, the brittle–ductile characteristics of the shale will change, and the fracture toughness will be significantly enhanced. The difficulty of crack initiation and the ability to prevent crack propagation increase, and the complexity of cracks decreases.
- (3)
- With the increase in pumping displacement, the fracture pressure of inter-salt shale gradually increases, and a large number of micro-fractures will be opened in the early stage of fracturing fluid injection. At the same time, the greater the number of cracks passing through layers and opening bedding planes, the more bedding fractures are formed, and the complexity of the fracture network also increases. However, due to the low viscosity, high diffusion characteristics, and high permeability of supercritical carbon dioxide fracturing fluid, as the displacement increases, the fractures rapidly expand to the surface of the sample to form through-fractures, and most of the fracturing fluid flows out from the through-fractures to form pressure relief zones; it is difficult to continue to open new cracks to form a complex network of cracks. Therefore, the complexity of the seam network decreases with the increase in the displacement of supercritical carbon dioxide.
- (4)
- When hydraulically fracturing the inter-salt shale reservoirs in the field, a fracturing fluid with moderate viscosity should be selected as much as possible, while the pumping displacement should be increased to open more laminar fractures and form a complex fracture network. However, an excessively high pumping displacement will lead to higher fracture pressure and affect the safety of on-site construction, so a follow-up study will be carried out to investigate the influence of pumping methods and other effects on the expansion pattern of hydraulic fractures and the degree of fracture network development in inter-salt shale.
Author Contributions
Funding
Institutional Review Board Statement
Informed Consent Statement
Data Availability Statement
Acknowledgments
Conflicts of Interest
References
- Vikram, V.; Mohd, R.; Bankim, M.; Pradhan, S.P.; Singh, T.N. Temperature effect on the mechanical behavior of shale: Implication for shale gas production. Geosyst. Geoenviron. 2022, 1, 100078. [Google Scholar]
- Mohyuddin, S.G.; Radwan, A.E.; Mohamed, M. A review of Pakistani shales for shale gas exploration and comparison to North American shale plays. Energy Rep. 2022, 8, 6423–6442. [Google Scholar]
- Owusu, E.B.; Tsegab, G.H. The potential of shale gas resources in Peninsular Malaysia. IOP Conf. Ser. Earth Environ. Sci. 2022, 1003, 012024. [Google Scholar] [CrossRef]
- Liu, H.; Xu, S.; Zhu, B.; Zhou, L.; Huang, Y.; Li, B. Research and practice of volumetric fracturing technology for inter-salt shale oil. Spec. Oil Gas Reserv. 2022, 29, 149–156. [Google Scholar]
- Shu, H. Characteristics and Comparative Analysis of Oil Reservoirs in Jianghan Inter-salt Shale. J. Jianghan Pet. Staff. Univ. 2021, 34, 31–33. [Google Scholar]
- Li, Y. Characteristics of inter-salt shale oil reservoirs in the Jianghan Basin and countermeasures for their development. J. Jianghan Pet. Staff. Univ. 2019, 32, 24–26. [Google Scholar]
- Li, B. Analysis of key factors affecting fracturing construction and rejection characteristics of inter-salt shale reservoirs. J. Jianghan Pet. Staff. Univ. 2018, 31, 18–21. [Google Scholar]
- Zhang, Z. Evaluation of the Effectiveness of Artificial Fractures in Inter-Salt Shale Oil Reservoirs. China University of Petroleum Beijing. 2018. Available online: https://cdmd.cnki.com.cn/Article/CDMD-11414-1019927289.htm (accessed on 17 April 2022).
- Liu, J. Study on the Method of Evaluating the Compressibility of Inter-Salt Shale Oil Reservoirs. Chongqing University, Chongqing, China. 2018. Available online: http://cdmd.cnki.com.cn/Article/CDMD-10611-1018853435.htm (accessed on 17 April 2022).
- Zhang, X.; Bi, Z.; Chang, X.; Wang, L.; Yang, H. Experimental Investigation on Hydraulic Fracture Morphology of Inter-Salt Shale Formation. Frontiers 2021, 9, 893. [Google Scholar] [CrossRef]
- Wang, S.; Nie, H.; Ma, S.; Ding, Y.; Li, H.; Liang, W. Evaluation of inter-salt shale oil resources and sweet spot prediction in the Paleocene Qianjiang Formation, Qianjiang Depression, Jianghan Basin. Pet. Exp. Geol. 2022, 44, 94–101. [Google Scholar]
- Wen, H.; Lu, S.; Xue, H.; Wang, W.; Li, J.; Hu, Y.; Zhang, P.; Li, J. Main controlling factors of physical development of shale oil reservoirs in The Xingouzui Formation of Jianghan Basin. Oil Gas Geol. 2016, 37, 56–61. [Google Scholar]
- Zheng, Y. Key Technology for Enrichment Mechanism and Dessert Prediction of Onshore Shale Oil in Salt Lake Basin. Research Institute of Exploration and Development, Jianghan Oilfield Branch. China Pet. Chem. Corp. 2020, 12, 1. [Google Scholar]
- Zhi, X.; Shu, X.; Sang, L.; Zhang, Y. Analysis of formation patterns of inter-salt argillaline dolomite in Qianjiang Formation of Qianjiang Sag. J. Yangtze Univ. Nat. Sci. Ed. 2012, 9, 19–23+4–5. [Google Scholar]
- Shi, Z.; Jiang, J. Prediction of shallow oil and gas reservoirs in Jianghan Basin. Oil Gas Geol. 1988, 204–208. [Google Scholar]
- Shi, Z.; Pan, G. Hidden reservoirs and their exploration in Qianjiang Sag in Jianghan Salt Lake Basin. Daqing Pet. Geol. Dev. 1984, 119–129. [Google Scholar] [CrossRef]
- Chen, B.; Xiao, Q.; Cao, J.; Zhao, H. Comparison of exploration potential of non-sandstone oil and gas reservoirs between Qianjiang Formation and Shashi Formation in Jianghan Basin. Pet. Explor. Dev. 2017, 190–196. [Google Scholar]
- Yang, Z.; Li, R.; Li, H.; Luo, Y.; Chen, T.; Gao, T.; Zhang, Y. Experimental evaluation of the salt dissolution in inter-salt shale oil reservoirs. Pet. Explor. Dev. Online 2020, 47, 803–809. [Google Scholar] [CrossRef]
- Warpinski, N.R.; Clark, J.A.; Schmidt, R.A.; Huddle, C.W. Laboratory investigation on the-effect of in-situ stresses on hydraulic fracture containment. Soc. Pet. Eng. 1982, 22, 333–340. [Google Scholar] [CrossRef]
- Anderson, G.D. Effects of friction on hydraulic fracture growth near unbonded interfaces in rocks. Soc. Pet. Eng. 1981, 21, 21–29. [Google Scholar] [CrossRef]
- Blair, S.C.; Thorpe, R.K.; Heuze, F.E.; Shaffer, R.J. Laboratory observations of the effect of geological discontinuities on hydrofracture propagation. In Proceedings of the 30th US Symposium on Rock Mechanics, Morgantown, WV, USA, 19–22 June 1989; pp. 433–450. [Google Scholar]
- Blanton, T.L. An experimental study of interaction between hydraulically induced and pre-existing fractures. In Proceedings of the SPE Unconventional Gas Recovery Symposium, Pittsburgh, PA, USA, 16–18 May 1982; pp. 1–13. [Google Scholar]
- Blanton, T.L. Propagation of hydraulically and dynamically induced fractures in naturally fractured reservoirs. In Proceedings of the SPE Unconventional Gas Technology Symposium, Louisville, KY, USA, 18–21 May 1986; pp. 1–15. [Google Scholar]
- Daneshy, A.A. Hydraulic fracture propagation in layered formations. Soc. Pet. Eng. J. 1978, 18, 33–41. [Google Scholar] [CrossRef]
- Chen, Z.; Chen, M.; Huang, R.; Shen, Z. Vertical expansion of hydraulic cracks in layered media. J. Univ. Pet. Nat. Sci. Ed. 1997, 25–28+34+116. [Google Scholar]
- Suling, W.; Yiming, Z.; Minmin, J.; Yang, L. Study on the propagation mechanism of cracks in non-uniform rock formations. Mech. Pract. 2012, 34, 38–41+45. [Google Scholar]


| No. | Sample No. | Length/mm | Diameter/mm | Quality/g |
|---|---|---|---|---|
| 1 | 2418 | 49.88 | 98.94 | 500.94 |
| 2 | 2985 | 49.54 | 108.64 | 536.084 |
| 3 | 2988 | 49.24 | 101.42 | 490.268 |
| 4 | 3665 | 49.12 | 108.02 | 519.248 |
| 7 | 1933 | 49.06 | 100.3 | 490.36 |
| 8 | 1956 | 49.24 | 99.86 | 491.832 |
| 9 | 25-SC | 98.88 | 201.124 | 3955.308 |
| 10 | 26-SC | 98.88 | 199.28 | 3949.955 |
| 11 | 27-SC | 99.6 | 198.93 | 4031.648 |
| 12 | 28-SC | 99.08 | 196.28 | 3845.258 |
| No. | Sample No. | Fracturing Medium | Axial Stress/MPa | Perimum Pressure/MPa | Solid Discharge (mL/min) | Remark |
|---|---|---|---|---|---|---|
| 1 | 2418 | Slippery | 29 | 25 | 4.8 | BY-2 |
| 2 | 2985 | 29 | 25 | 7.2 | ||
| 3 | 2988 | Melter liquid | 29 | 25 | 4.8 | |
| 4 | 3665 | 29 | 25 | 7.2 | ||
| 7 | 1933 | 29 | 25 | 4.8 | ||
| 8 | 1956 | 29 | 25 | 7.2 | ||
| 9 | 25-SC | 28 | 25 | 6.0 | Shale outcrop | |
| 10 | 26-SC | 31 | 28 | 6.0 | ||
| 11 | 27-SC | 18 | 15 | 6.0 | ||
| 12 | 28-SC | 28 | 25 | 1.2 |
| No. | Sample No. | Fracturing Medium/MPa | Axial Stress/MPa | Solid Discharge (mL/min) | Burst Pressure/MPa | Pump Pressure Curve Characteristics | Crack Propagation Pattern |
|---|---|---|---|---|---|---|---|
| 1 | 2418 | 29 | 25 | 4.8 | 27.57 | It rises rapidly before the peak, and then quickly falls to the confining pressure after the peak. | Form 1 horizontal bedding seam. |
| 2 | 2985 | 29 | 25 | 7.2 | 30.97 | Rapid rise before the peak, obvious fluctuation after the peak, and gradually reduced to confining pressure. | Open multiple horizontal bedding seams. |
| No. | Sample No. | Fracturing Medium/MPa | Axial stress/MPa | Solid Discharge(mL/min) | Burst Pressure/MPa | Pump Pressure Curve Characteristics | Crack Propagation Pattern |
|---|---|---|---|---|---|---|---|
| 3 | 2988 | 29 | 25 | 4.8 | 27.89 | The pre-peak rises approximately linearly, and the post-peak rapidly drops to the confining pressure. | Open multiple horizontal bedding seams. |
| 4 | 2985 | 29 | 25 | 7.2 | 32.35 | The pre-peak rises approximately linearly, and the post-peak gradually decreases to the confining pressure. | Open multiple horizontal bedding seams. |
| No. | Sample No. | Fracturing Medium /MPa | Axial Stress /MPa | Solid Discharge (mL/min) | Burst Pressure /MPa | Pump Pressure Curve Characteristics | Crack Propagation Pattern |
|---|---|---|---|---|---|---|---|
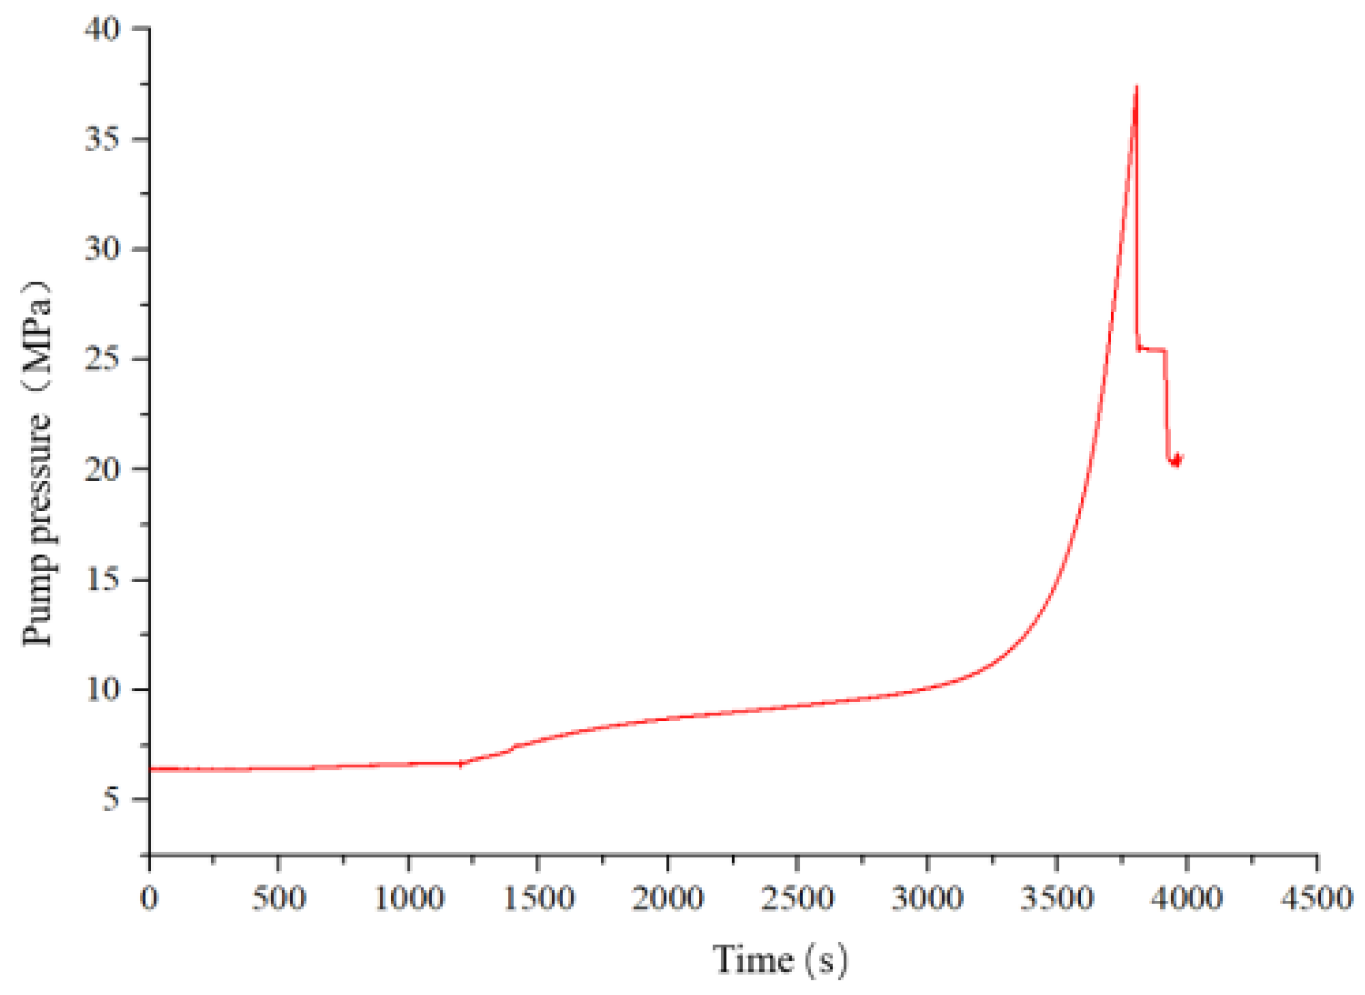
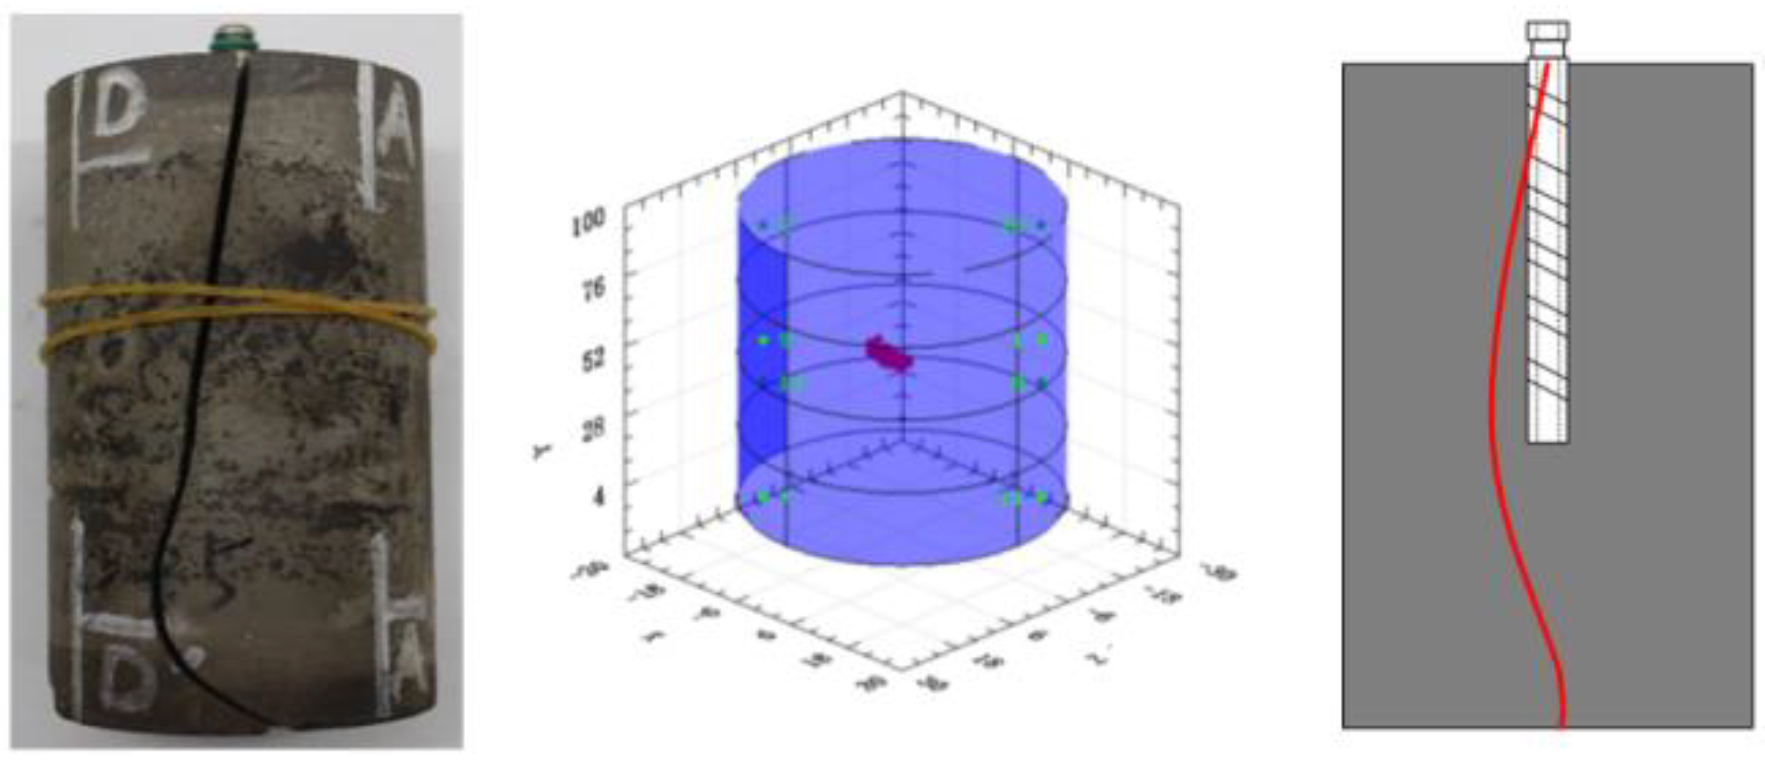
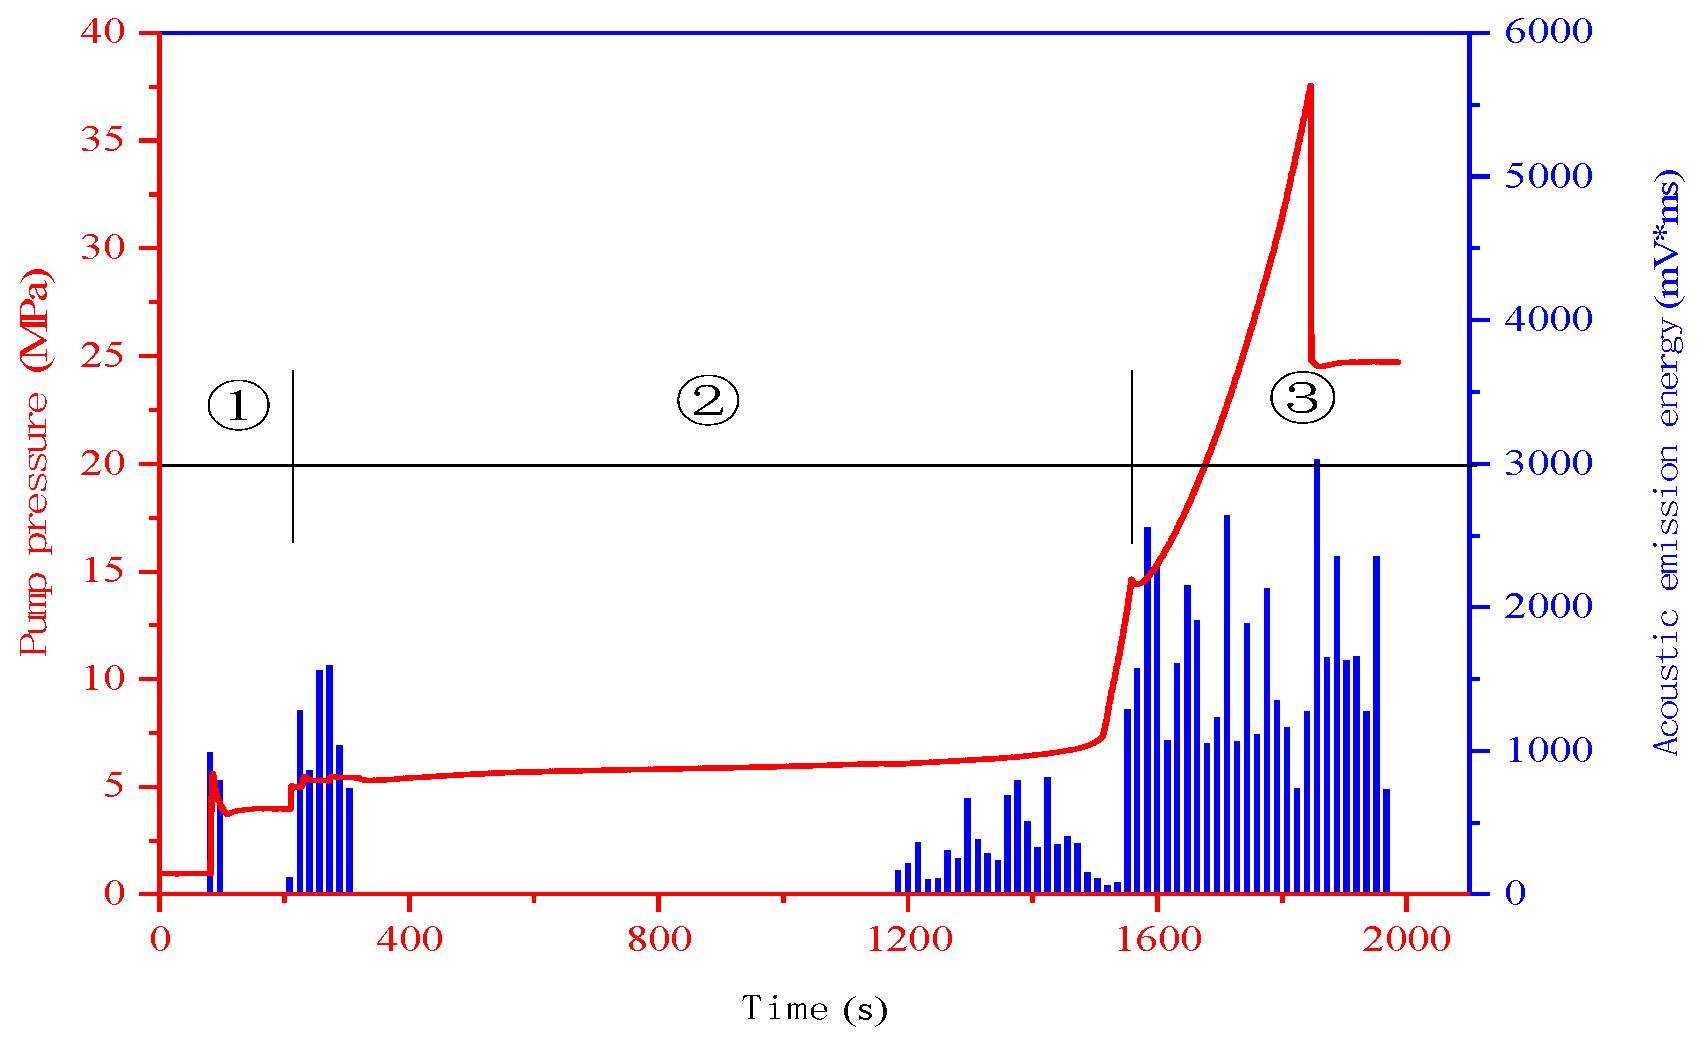
| 5 | 1933 | 29 | 25 | 4.8 | 37.55 | The pre-peak pump pressure curve rises slowly, and the post-peak curve rapidly drops to the confining pressure. | Forming a curved longitudinal crack. |
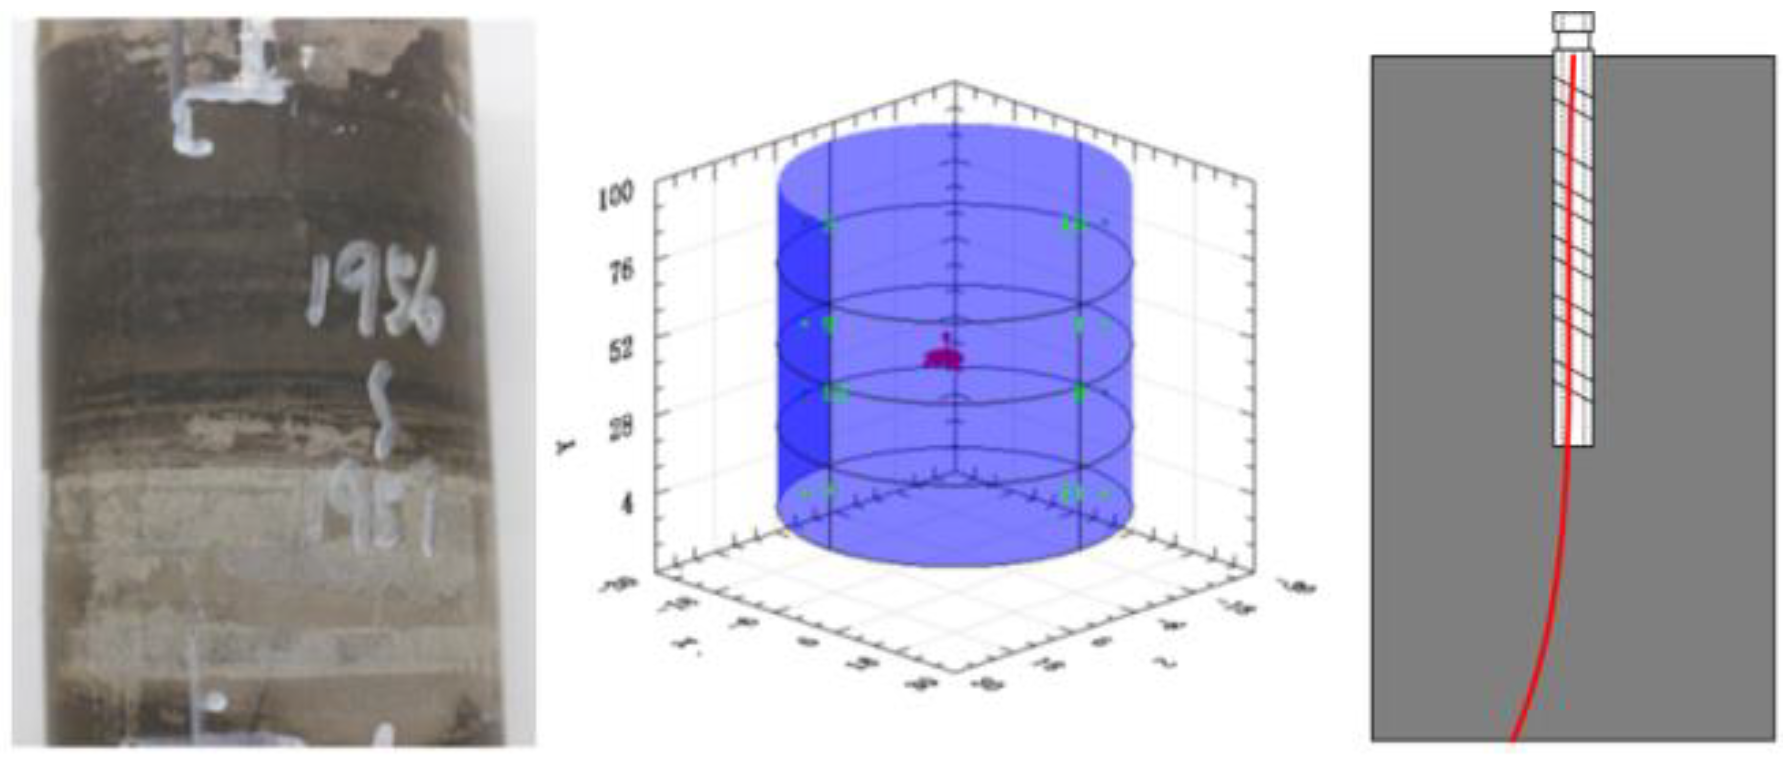
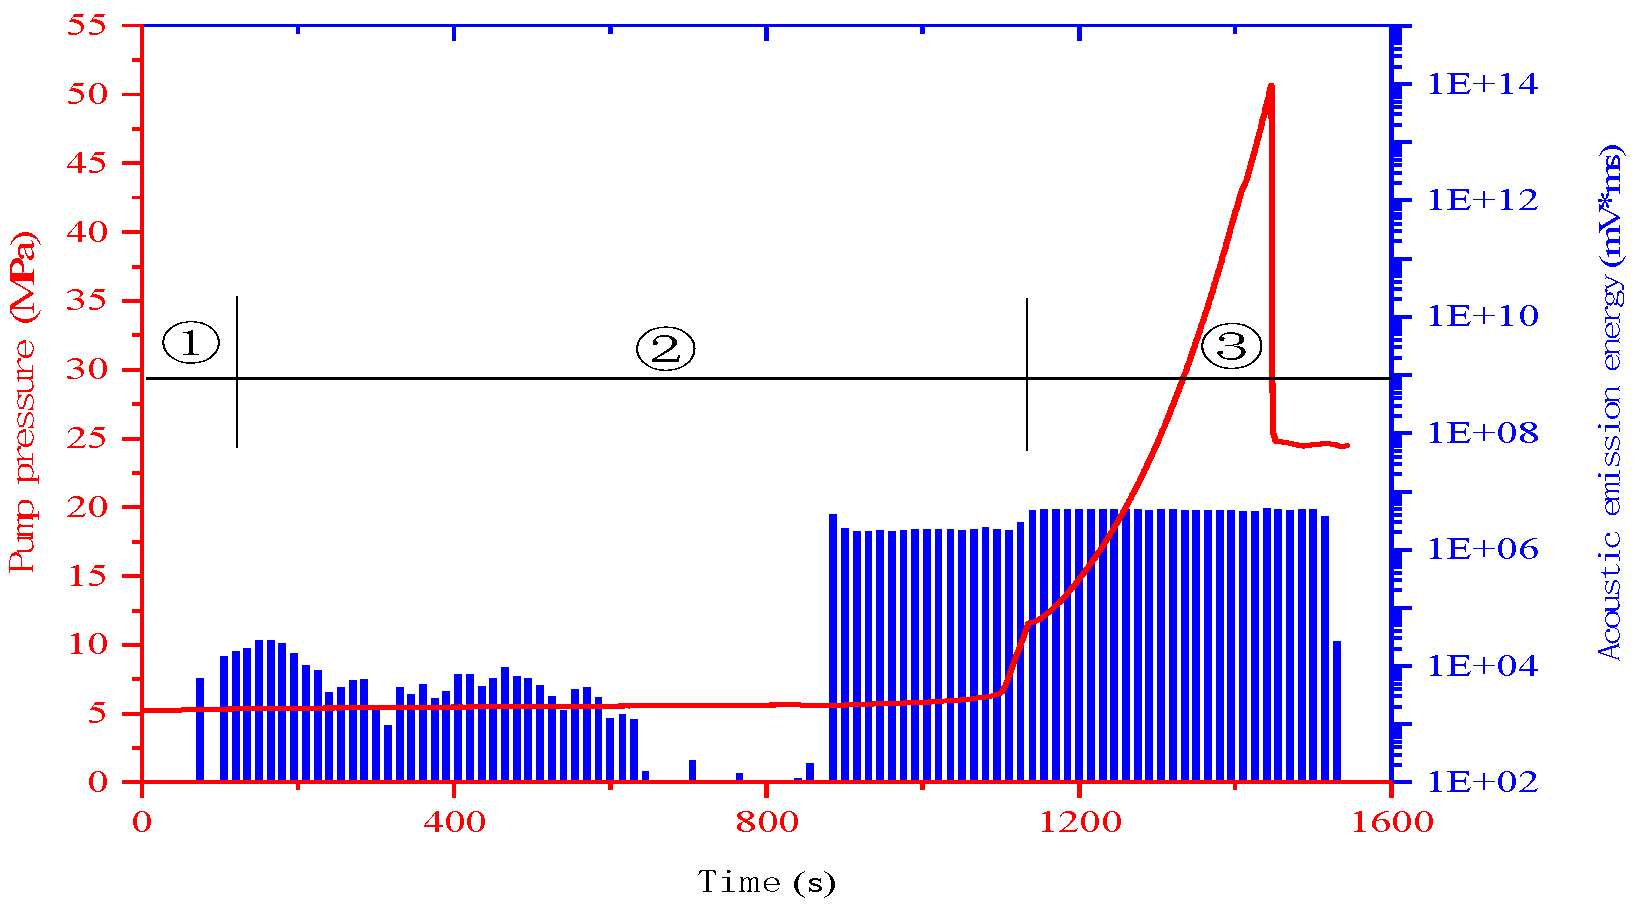
| 6 | 1956 | 29 | 25 | 7.2 | 50.77 | The pre-peak pump pressure curve rises slowly before the peak, and the post-peak curve rapidly drops to the confining pressure. | Forming a curved longitudinal crack. |
| 7 | 25-SC | 28 | 25 | 6.0 | 37.4 | The pre-peak rises slowly, and the post-peak curve rapidly drops to the confining pressure. | Generate 1 longitudinal main fracture and open 2 bedding fractures. |
| 8 | 26-SC | 31 | 25 | 6.0 | 52.6 | The pre-peak rises slowly, and the post-peak curve rapidly drops to the confining pressure. | Generate 1 longitudinal main fracture and open 2 bedding fractures. |
| 9 | 27-SC | 18 | 15 | 6.0 | 31.6 | The pre-peak rises slowly, and the post-peak curve rapidly drops to the confining pressure. | Generate 1 longitudinal main fracture and open 2 bedding fractures. |
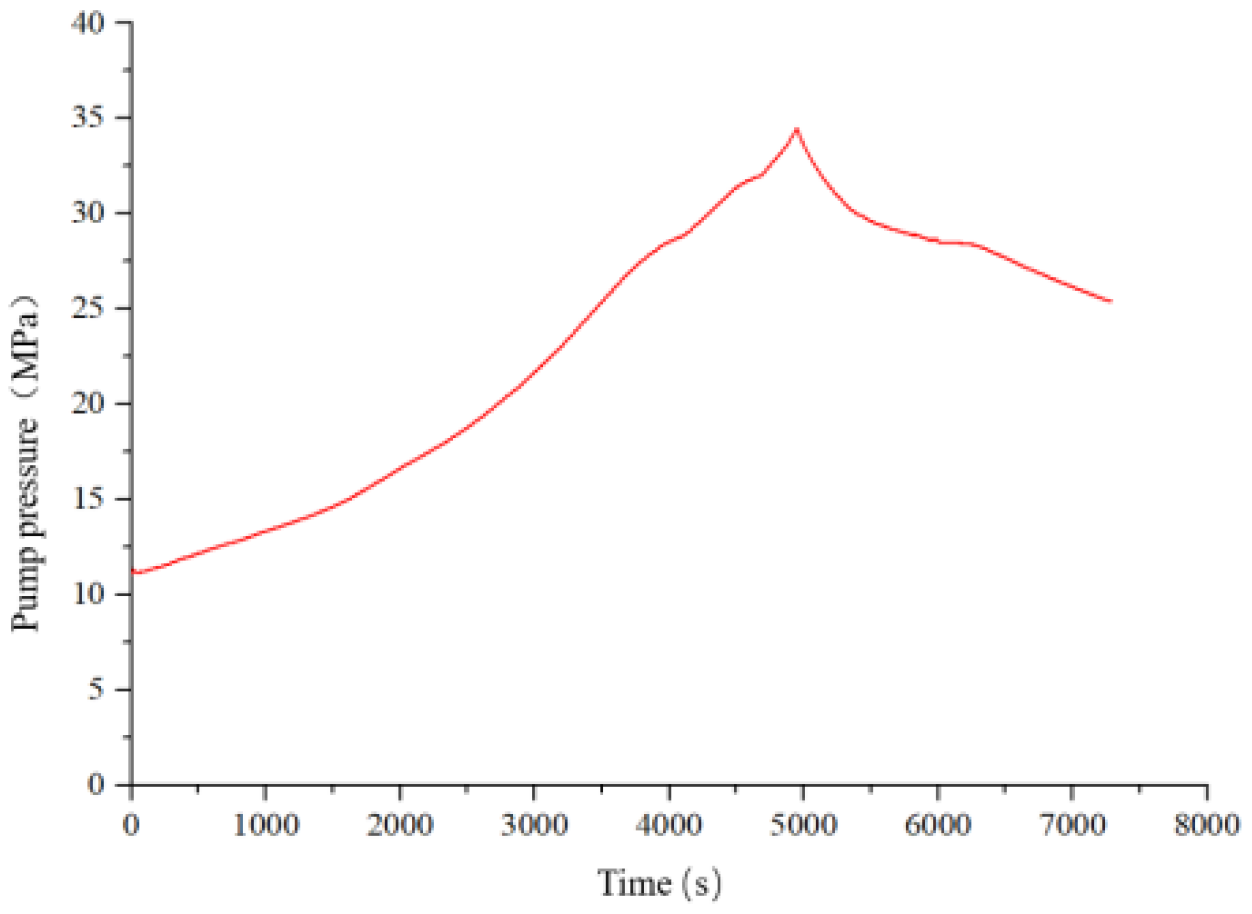
| 10 | 28-SC | 28 | 25 | 1.2 | 34.5 | The pre-peak rises slowly, and the post-peak curve rapidly drops to the confining pressure. | Generate 1 longitudinal main fracture and open 2 bedding fractures. |
Publisher’s Note: MDPI stays neutral with regard to jurisdictional claims in published maps and institutional affiliations. |
© 2022 by the authors. Licensee MDPI, Basel, Switzerland. This article is an open access article distributed under the terms and conditions of the Creative Commons Attribution (CC BY) license (https://creativecommons.org/licenses/by/4.0/).
Share and Cite
Shen, Y.; Hu, Z.; Chang, X.; Guo, Y. Experimental Study on the Hydraulic Fracture Propagation in Inter-Salt Shale Oil Reservoirs. Energies 2022, 15, 5909. https://doi.org/10.3390/en15165909
Shen Y, Hu Z, Chang X, Guo Y. Experimental Study on the Hydraulic Fracture Propagation in Inter-Salt Shale Oil Reservoirs. Energies. 2022; 15(16):5909. https://doi.org/10.3390/en15165909
Chicago/Turabian StyleShen, Yunqi, Zhiwen Hu, Xin Chang, and Yintong Guo. 2022. "Experimental Study on the Hydraulic Fracture Propagation in Inter-Salt Shale Oil Reservoirs" Energies 15, no. 16: 5909. https://doi.org/10.3390/en15165909
APA StyleShen, Y., Hu, Z., Chang, X., & Guo, Y. (2022). Experimental Study on the Hydraulic Fracture Propagation in Inter-Salt Shale Oil Reservoirs. Energies, 15(16), 5909. https://doi.org/10.3390/en15165909