Abstract
The article presents spectral sensitivity curves of 22 typical luxmeters and 3 smartphones as a result of laboratory measurements. Based on the measurement data, errors in the spectral correction of the considered instruments and devices were calculated. Due to the fact that the value of the measured illuminance is influenced by the spectral characteristics of the radiation, in order to determine the spectral corrections coefficients, 10 light sources with different spectral distributions of radiation were taken into account. Spectral corrections factors were determined using two methods for all luxmeters and smartphones. This paper presents the relationship between the shape of the spectral sensitivity curves of a given luxmeter and the measured values of f′1 errors. Moreover, the limitations related to the use of spectral corrections in environmental measurements with the use of a luxmeter were demonstrated.
1. Introduction
As reported in the literature [1], a human being’s most precious sense is sight. It is through sight that most of the information from the environment is provided. Lighting is indispensable, which can be realized in the form of natural or artificial light. Obviously, the necessity of using artificial lighting arises from conditions of insufficient or complete lack of daylight. The speed and accuracy of visual work depend on the quality of lighting, which can be characterized by a set of quantitative and qualitative features. In places with poor lighting (i.e., with too low levels of illuminance), small details may not be seen, which is important for the quality of products (which may generate production losses). In turn, when halls or passageways (corridors) are incorrectly illuminated, it makes it difficult to perceive dangers (e.g., obstacles on the road). In consequence, this may lead to an accident. Improper lighting of rooms and workstations may also cause health loss. For example, constant eye strain may cause one’s eyesight to become weaker. An important criterion for proper lighting is to ensure the required level of illuminance. Despite the fact that luminance is closer to the impression of light perceived by humans, usually, illuminance is a normative parameter characterizing the state of illumination.
The requirements for the average values of operational illuminance are regulated by relevant standards. Most frequently, measurements of illuminance of basic lighting in interiors are performed; then, the standards are applied [2]. Depending on the type of room, work, or activity, the required illuminance values vary. In the event of a sudden failure of electrical lighting in a public utility building, panic may occur, and accidents at work may result, i.e., a direct threat to human health and life. To prevent such situations, emergency lighting is used. The lighting requirements in the case of emergency lighting are specified in the standards [3], which are mainly directed at ensuring the required levels of illuminance.
Illuminance is also one of the main criteria when designing outdoor lighting, except for roads with M lighting class. Proper lighting of outdoor areas at night should ensure safe and comfortable performance of visual activities. Requirements for outdoor workplaces are included in the standards [4].
Proper lighting is also necessary when practicing sports. In order to ensure good visibility for both players and fans, the required illuminance values were specified in the standard [5]. The recommended illuminance values are also given for roads and pavements where pedestrians and/or cyclists travel [6].
The use of outdoor lighting, however, is associated with the emission of a luminous flux towards areas and objects that are not the target of lighting. The light reaching the walls of buildings, windows, and the upper half-space (towards the sky) is a source of light pollution and intrusive light. Due to the fact that light pollution causes numerous problems, affecting the well-being of building occupants and the functioning of the environment, requirements for reducing obtrusive light have been developed. One of the parameters to be verified when assessing obtrusive light reduction is the vertical illuminance (Ev). The value of illuminance on the vertical surface of the window, determined on the basis of field measurements [7], should not exceed the limits of the values given in the standard [4] and in the CIE 231 [8] and CIE 150 [9] reports. The assessment of night light, which consists of measuring the illuminance in terms of light pollution, is also performed both from the ground (ground measurements) [10,11] and from the air using unmanned aerial vehicles [12,13]. Monitoring light pollution by measuring the illuminance is also carried out in relation to aquatic ecosystems [14]; illumination measurements are made both above and below the water’s surface. It should be noted that illuminance is not the only parameter used during the assessment of night light. Many other photometric, colorimetric and also radiometric quantities are used. Information on this subject is provided in the literature [15,16,17].
Measurements of illuminance are also carried out in research laboratories, e.g., when testing car headlights [18] or assessing the cleanliness of cooking oil [19] and engine oil [20]. Measurement of illuminance is also useful in controlling public lighting [21,22], regulating yields in gardening and planting [23], studying solar panels [24,25], analyzing daylight transmitted through a pipe (often called a skylight) [26], and the lighting of educational rooms with daylight [27]. Measurements of illuminance are also carried out in medicine [28,29] and veterinary medicine [30], as well as in photography [31], where illuminance affects image quality.
It is worth mentioning that in the metrology of lighting technology, other photometric quantities are also determined on the basis of illuminance measurements. By measuring the illuminance in the measuring window of the integrating sphere, it is possible to determine the luminous flux [32,33]—the basic photometric parameter describing both light sources and the luminaires. With the luminous flux and the power of the light source or luminaire, another important photometric parameter can be determined, which is the luminous efficiency [34], which is a measure of energy efficiency in producing light.
In turn, by measuring the illuminance at a certain distance from the light source/luminaire, using the known law of the inverse square of the distance, one can obtain another photometric quantity: the luminous intensity in a given direction. With the luminous intensity, one can visualize a photometric solid, which is the basis for designing both external and internal lighting. The photometric solid is determined on the basis of the known goniophotometric method in which the illuminance is the measured quantity [35,36].
Illuminance measurements are made by an illuminance meter, which is also called a “luxmeter” or a “light meter”. It is a photometer that usually consists of two essential components: a photometric head (often referred to in common parlance as a “probe” or “sensor”) and a photoelectric current meter graduated in lux.
2. Research Problem
In the field of lighting technology, the entire system of photometric quantities and units is based on the properties of the human organ of vision, which do not react identically to particular wavelengths of visible radiation. Since the sensitivity curves of individuals differ, the International Commission on Illumination (CIE) has adopted a unified sensitivity curve V(λ) for day (photopic) vision, and in relation to this curve, photometers should be calibrated. This is one of the most important requirements for photometers. Unfortunately, the spectral sensitivity characteristics of the produced optical radiation detectors differ in shape from the V(λ) curve recommended by the CIE. Examples of sensitivity curves of several detectors are shown in Figure 1. The same figure shows the sensitivity curve V(λ).
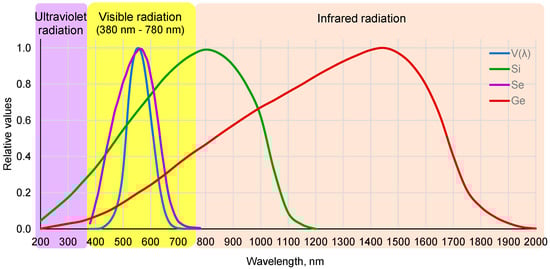
Figure 1.
Sensitivity curves of selected detectors together with sensitivity curve V(λ) for day (photopic) vision V(λ): Si—silicon, Se—selenium, and Ge—germanium.
In the past, the photovoltaic cells used selenium (Se) and, less frequently, germanium (Ge) [37]. Currently, silicon (Si) photovoltaic cells are used. Analyzing the data presented in Figure 1, one can notice significant deviations in the spectral characteristics of the detectors from the required V(λ) curve. The sensitivity of the detector depends on the material of which it is made. In the case of silicon and germanium detectors, the maximum sensitivity is for infrared radiation. The curve for the selenium cell shows the closest shape to the required V(λ) curve. For this reason, in the last century, selenium detectors were willingly used to build photometers, which required only the simple implementation of adjusting the detector’s sensitivity curve to the V(λ) curve. Unfortunately, these cells show a high sensitivity to ambient temperature [37], which is a significant drawback. Silicon detectors are less sensitive to temperature changes.
When using the detector in photometers, it is necessary to adjust its spectral sensitivity to the V(λ) curve. If the photometric head of a luxmeter is not correctly adjusted spectrally, an objective assessment of the illuminance is not possible, which was pointed out in [38]. This adjustment is made using correction filters that absorb radiation in both the long- and shortwave parts of the spectrum. The measurement of the photometric quantity gives the correct result when the relative sensitivity curve of the photoelectric receiver corresponds to the sensitivity curve of the eye adapted to daytime vision (i.e., photopic vision). Due to the significant differences in the shapes of the curves of the silicon detector and the V(λ) curve, in order to perform the spectral correction in practice, it is necessary to use a combination of several filters. These filters (with appropriately selected thicknesses) are put on one on another and then placed over the photosensitive surface of the detector. However, the use of a set of properly selected filters significantly increases the price of the luxmeter. Therefore, in cheaper luxmeters, the spectral correction is performed typically with a single filter. Examples of design solutions for photometric heads of modern luxmeters are shown in Figure 2.
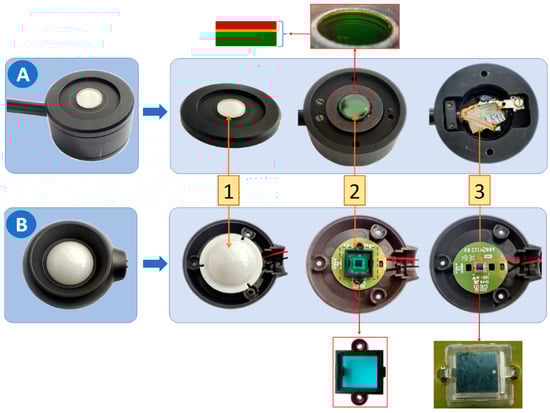
Figure 2.
Construction of exemplary photometric heads of luxmeters: (A) a more expensive solution with the use of a filter set; (B) a cheaper solution using of single filter. 1—scattering element for spatial correction, 2—a single filter or a set of filters for spectral correction, and 3—optical radiation detector.
Due to the fact that the luminous flux hits the photometric heads of the luxmeter at different angles, apart from the spectral correction, there is the need to perform spatial correction. For this purpose, a diffusing element (element “1” in Figure 2) is used, which is a flat disc (solution “A” in Figure 2) or a dome (solution “B” in Figure 2). In practice, these are the most commonly used solutions to reduce measurement errors in oblique incidences of light. Due to the complexity of the problem, the issue of spatial correction is beyond the scope of this article.
The parameter that measures the degree of mismatch between the sensitivity curve of the luxmeter’s photometric head and the required sensitivity curve V(λ) is the f′1 error, described by Equation (1) [39]:
where SA(λ) is the relative spectral distribution of a lamp’s radiation at which the luxmeter was calibrated, S(λ) is the relative spectral sensitivity of the real photometric head of a luxmeter, and V(λ) is the required relative spectral sensitivity of a photometric head.
According to the guidelines included in ISO/CIE 19476:2014 [39] and in CIE 231:2019 [8] as well as in the DIN 5032-7 Standard [40], four classes of luxmeters are distinguished. They are marked with the letters L, A, B, and C, and such designations are used by manufacturers. Occasionally, some manufacturers refer to JIS 1609 [41] in their technical specifications. In this standard, the classes of luxmeters take the following designations: precision class, general class AA, general class A, and general class B. The accepted class designations and error values differ from those given in ISO/CIE 19476:2014. The limits of the values for selected errors in the individual classes are presented in Table 1.

Table 1.
Limits of the values of the selected errors of the luxmeters for the specific classes.
L-class (precision class) photometers are the most expensive, while C-class (general class B) photometers are the cheapest. The luxmeters available on the market are enormous, and their prices vary widely. The cost of the cheapest luxmeters is a fraction of the cost of calibrating a photometer. It also happens that to verify the parameters of electric lighting smartphones can be used with an appropriate application installed, displaying the values in lux—the unit of illuminance.
In the photometric laboratories, incandescent lamps with a color temperature of 2856 K (illuminant A) are still used to calibrate luxmeters, as it is a simple operation (easy to obtain the required electrical parameters of the light bulb and fast stabilization of the luminous flux, which takes only several minutes) and provides acceptable stability of electrical and photometric parameters over time, which cannot be said in the case of discharge lamps. The literature [42,43] emphasizes the advantages of new, reference LED sources, which were included in a technical report by the International Commission on Lighting [44]. Unfortunately, currently, reference LED sources are not yet widely available, hence the need to use incandescent lamps.
The reported error value f′1, therefore, relates to an incandescent lamp. Currently, in lighting technology for lighting purposes, due to the low luminous efficiency, incandescent lamps are no longer used. For many years, they have been replaced by more efficient lighting sources, such as discharge lamps or by increasingly popular light emitting diodes. The spectral distributions of the radiation emitted by these lamps, due to the different methods of light production, differ from each other, because of the luxmeters’ calibration. In other words, the error value f′1 does not provide information regarding the error in measuring the radiation emitted by light sources other than the illuminant A. Therefore, the measurement error resulting from the discrepancy in shapes between the required relative spectral sensitivity of the photometric head V(λ) and the relative spectral sensitivity of the real photometric head of the luxmeter S(λ) depends on the spectral distribution of the measured radiation. In order to illustrate this problem, Figure 3 shows the consequences of measuring the radiation of an incandescent lamp (illuminant A) and the LED source with a luxmeter. Three scenarios are considered. The first scenario, marked with the letter “A”, is only theoretical. The light emitted by illuminant A is measured with a hypothetical luxmeter, the spectral sensitivity of which complies with the required V(λ) curve. As a result of multiplying the curve SA(λ) by the curve V(λ), the obtained area under the new curve is proportional to the signal measured by the luxmeter. In the second scenario, marked with the letter “B”, the V(λ) curve is replaced with the actual sensitivity curve of the exemplary photometric head of a luxmeter. In order to illustrate the problem, the sensitivity curve of the photometric head was used, which significantly differs from the required curve V(λ). In such a case, the area under the curve is evidently greater, which means that in practice, the display of the luxmeter is greatly overestimated. In the last, third scenario, marked with the letter “C”, illuminant A was replaced with an LED source with a correlated closest color temperature equal to 4000 K. The spectral characteristics of the LED tube are normalized in such a way that the luminous flux is identical to that of illuminant A. In other words, if the spectral characteristics of the LED tube multiplies by the curve V(λ), the obtained area under the new curve would be identical to that in variant A. In scenario C, the area under the curve, illustrating the response of the luxmeter, is smaller than in variant B, but greater than in the case of variant A.
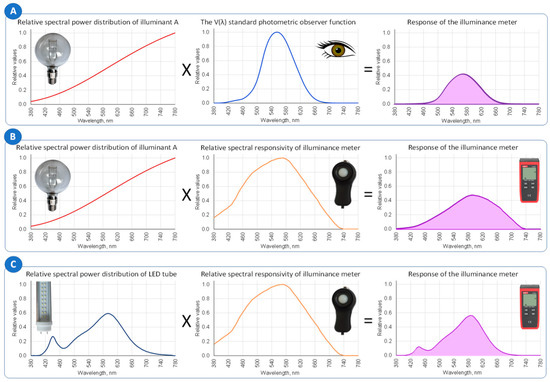
Figure 3.
Graphical illustration of the concept of luxmeter spectral correction: (A) theoretical variant, relative spectral power distribution of illuminant A and ideal relative spectral response of the illuminant intensity meter; (B) variant typical for calibrating luxmeters, relative spectral power distribution of illuminant A and the relative spectral response of an exemplary illuminance meter; (C) real variant, relative spectral distribution of the LED power tube and the relative spectral response of an exemplary illuminance meter.
When the spectral distribution of the measured radiation differs from the spectral distribution of the lamp, with which the luxmeter is calibrated, the measurement error is described by the parameter f1 (without the “superscript” symbol) and it is described by Equation (2):
where SM(λ) is the relative spectral distribution of the lamp radiation at which the measurement is carried out, k is the correction factor by which the luxmeter reading should be multiplied, and the rest of the quantities are identical as in Equation (1).
The problem of spectral correction is not a new one. Details on this subject can be found in the literature [37,45,46,47,48,49]. Unfortunately, despite the fact that this problem has been known for several decades, luxmeters and smartphones are used to measure light intensity, the spectral adjustment of which significantly differs from the curve V(λ). This fact will be a source of measurement errors, the values of which depend on the spectral characteristics of the radiation incident on the photosensitive part of the luxmeter or smartphone. One can find studies in which a variety of designs for luxmeters are presented, including the following, which are of the prototype form [31,50,51,52,53,54]. In these works, the problem of spectral correction is not discussed, or verification of the device indications is made by comparing the measured values of radiation emitted by selected lamps with the indication of a luxmeter, which is taken as a reference source.
Smartphones are used increasingly frequently to measure the intensity of illumination. They have become multifunctional mobile devices, the technical characteristics of which are often comparable to those of computers. Due to the fact that, in many cases, they are equipped with a light sensor, applications are available to measure the light intensity with its use. There are some suggestions in the literature to use smartphones as luxmeters [55,56,57]. Therefore, a reasonable question arises whether the smartphones meet the requirements for the precision of measurement. Analyzing the literature, the conclusions drawn from the measurements carried out with the use of smartphones are not unequivocal. For example, in [58], it was recognized that a smartphone can be a reliable tool for testing laryngoscopes. Meanwhile, the measurement results published by DIAL company [59] clearly indicate that smartphones are not useful for measuring the illuminance. In the case of smartphones, there is also the problem of linearity of light sensors. However, this is a complex issue and was not discussed in the work.
3. Scope and Methodology of the Studies
The laboratory measurements included 22 luxmeters and 3 smartphones. For the purposes of this study, individual luxmeters were described by the numbers from 01 to 22. Due to the fact that increasingly often smartphones are used to assess the parameters of electrical lighting, three smartphones were also included in the research for the comparison. A free application called Lux Light Meter was installed on each of them. The smartphones have been marked as S1, S2, and S3. The first smartphone (S1) was a Xiaomi 11T Pro equipped with a TCS3701 light sensor, the second smartphone (S2) was a Samsung Galaxy J7 equipped with a TMD3725 light sensor, while the third smartphone (S3) was a Xiaomi Redmi 4x with a stk3x1x alsprx detector.
The luxmeters selected for the study constitute a sample from the models available on the market. They represent different levels in terms of the quality, measurement accuracy, age of the device, region of production (i.e., country, continent), and market price. The price of the most expensive one was more than 40 times greater than that of the cheapest. The lowest purchase cost applied to luxmeter 21. Most of the analyzed group were new devices, which were purchased or borrowed for the purpose of carrying out the measurements. Three of the twenty-two luxmeters are no longer offered by the manufacturer: luxmeters 01, 02, and 08. Despite the fact that these luxmeters are no longer produced, they are still in use and also purchased at online auctions. Among the luxmeters tested, there are instruments from well-known manufacturers (used, among others, in photometric laboratories) as well as those of lower quality but at a very attractive price. Manufacturers usually provide information on the total error of the instrument in the technical specifications of the luxmeters. It is a measure of the degree of accuracy that provides information about the greatest allowable relative error of measurement. It is given in a percentage.
In order to determine the quality of the luxmeters, an important piece of information is the spectral sensitivity of the photometric head. In the case of high-class luxmeters, manufacturers provide in their specifications the limit value of the f′1 error along with the course of the relative spectral sensitivity. In the case of low-quality luxmeters, for which the f′1 error value usually exceeds 9%, the error value is not provided. Sometimes, one can find conclusive information that the luxmeter has been spectrally corrected to the curve V(λ), without giving the details of this matter, however. In some cases, the operating instructions contain a graphical representation of the sensitivity curve of the photometric head along with the V(λ) curve, which, in order to minimize the differences, has been shaped to match the sensitivity of the luxmeter.
The luxmeters can be classified according to various criteria. One of them may be, for example, the design, while the other may be the measurement error. In this study, the luxmeters were divided into two groups, assuming construction as the criterion. The first group (i.e., numbers 01–16) included the luxmeters that had photometric heads that were not integrated with a photoelectric current meter. The instruments that had a photometric head integrated into the housing of the meter were assigned to the second group. One luxmeter could be categorized into both groups because of its design: luxmeter 19. With this luxmeter, the photometric head may or may not be integrated with a photoelectric current meter. Within the distinctive groups, the luxmeters were ranked using the value of the spectral correction error as a criterion, which was determined on the basis of laboratory measurements (not based on the information given in the specifications of the luxmeters). The fundamental data on the luxmeters tested are included in Table 2. In turn, their actual photos are shown in Figure 4. In the case of difficulties encountered when obtaining information on the data concerning the luxmeters, the symbol “x” is inserted instead of the numerical values in Table 2.
Table 2.
The selected technical data of the luxmeters tested.
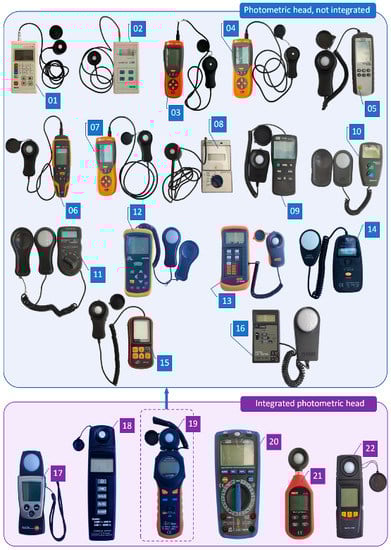
Figure 4.
Actual photos of the illuminance meters tested, 1–22: ordinal numbers.
The scope of the studies covered the following:
- Determination of the spectral sensitivity of luxmeters and smartphones in the range of 380–780 nm;
- Calibration of the luxmeters and smartphones;
- Registration of the illuminance when illuminating the photosensitive elements of luxmeters and smartphones with different spectral characteristics.
Illuminant A, seven linear fluorescent lamps, and three energy-saving LED tubes were used to measure the illuminance. The spectral characteristics of the individual lamps are presented in Figure 5. The numerical values given in the legend represent the closest color temperature (from the catalog), the unit of which is Kelvin (K). In practice, in the case of lighting the workplaces, usually, light sources with color temperatures that do not exceed 6500 K are used. Light sources with higher color temperatures are predestinated to be used in the illumination of rooms in warm climates (tropical climate zones). The cool color of the light gives the impression of refreshment.
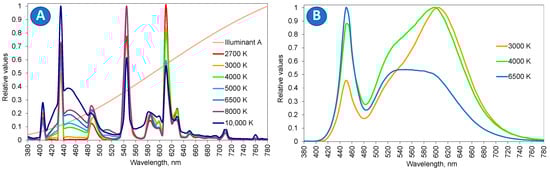
Figure 5.
Spectral characteristics of light sources of different color temperatures: (A) illuminant A with fluorescent lamps; (B) LED sources.
3.1. Measurement of Spectral Sensitivity
To determine the sensitivity curve of the photometric head of luxmeters, it would be most convenient to use a light source with equal energy spectral distribution of the power of the radiant energy. Due to the fact that in practice such a light source does not exist, a lamp with a known spectral distribution of the radiant energy was used to determine the sensitivity of luxmeters. Usually, an incandescent lamp is used. In order to determine the spectral sensitivity curve of the photometric head of a luxmeter, it was necessary to have a device enabling the separation of the radiation emitted by a given lamp from the radiation part, which is in the range of Δλ = λ1−λ2. From the entire range of visible radiation, such evenly distributed intervals of Δλ should be distinguished. The device that allows the refraction of light in order to obtain a beam of quasimonochromatic light is a monochromator. Recommendations for measuring the spectral response of the detectors are included in the technical report CIE 202:2011 [60]. The measurements were performed at the Optical Radiation Calibration and Research Laboratory (CARLO) [61]. Based on the guidelines contained in the CIE 202 document, a measurement stand was built, the diagram of which is shown in Figure 6.
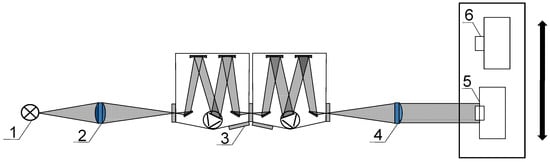
Figure 6.
Scheme of the measurement stand for determination of relative spectra curve: 1—halogen lamp of 100 W in power; 2—collimator; 3—double monochromator; 4—optical system allowing to obtain a beam with a diameter of about 30 mm; 5—reference detector; 6—photosensitive element of the tested device (illuminance meter/smartphone).
The measuring system consisted of three basic elements: a radiation source (powered from a stabilized power supply), a double monochromator, and a moving element (holder), on which a reference detector was mounted together with the tested light-sensitive element of a illuminance meter/smartphone. The radiation generated by the incandescent lamp is incident on a focusing lens, which directs polychromatic radiation to the monochromator entrance slit. In the double monochromator working in the Czerny–Turner system [62], due to the dispersion elements, a narrow wavelength range is selected from the spectrum of the introduced beam. After leaving the monochromator exit slit, the quasimonochromatic beam hits a collimator—an optical system that allows to obtain a parallel radiation beam. After passing through the collimator, a quasimonochromatic beam with a diameter of 30 mm and a half-width of 5 nm hits the surface of the reference detector, and after, the position of the handle onto the photosensitive surface of the tested luxmeter or smartphone is changed. As reference detectors, the spectroradiometer Spectis 5, touch calibrated with the use of blackbody of a color temperature of 3000 K, and the S1337 1010 BQ photodiode, the spectral sensitivity characteristics of which were determined at the Hamamatsu (Japan) laboratory, were used. The photodiode and spectroradiometer are calibrated in the range of 200 nm–1050 nm. The measurement uncertainty in the range from 350 nm to 850 nm is less than 1%. For each light meter and smartphone, a number of measurements were made in the range of visible radiation, with a step of 10 nm.
3.2. Calibration of a Luxmeter, Determination of Spectral Correction Factors
Calibration of the luxmeters was carried out on a measuring stand in the photometric darkroom, which is located in the calibration laboratory at the Regional Office of Measures in Łódź, Poland. This laboratory is accredited by the Polish Center for Accreditation, including the calibration of luxmeters. The main element of the stand was a 6.5 m long photometric bench. It was equipped with elements and instruments, enabling precise determination of the measurement geometry. The electrical parameters of the lamps installed on the test bench were controlled by an ammeter and a voltmeter. All standards and measuring instruments affecting the results of the measurements on the measuring stand were calibrated with a fixed frequency by accredited laboratories of the Regional Office of Measures in Łódź, Poland or by laboratories of the Central Office of Measures in Warsaw, Poland. A laboratory luxmeter type I-500 by LMT (class L) was used as the reference instrument. During the measurements, the environmental conditions (ambient temperature, humidity) were monitored. The uncertainties relevant to the measurements are included in the uncertainty budget for the measurement method. For measurements using a lamp with spectral characteristics similar to Illuminant A, the overall relative uncertainty is 2.5%. The structure of the test stand is shown in Figure 7.
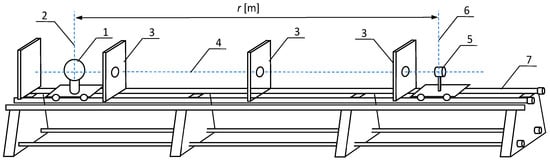
Figure 7.
Scheme of the measurement stand for calibration of a luxmeter and determination of spectra correction factors: 1—light source; 2—lamp symmetry axis; 3—aperture; 4—optical axis; 5—photometric head of a luxmeter; 6—vertical axis, which was tangent to the active part of the photometric head; 7—photometric bench.
The calibration of individual instruments (luxmeters and smartphones) was carried out using the luminous intensity standard as a light source, which is an incandescent lamp with a color temperature of 2856 K. Measurements were made at the same value of the luminous intensity standard at which the spectral correction coefficients were determined on the photometric bench.
In order to determine the coefficients (indicators) of the spectral correction, the luminous intensity standard (approximating the Illuminant A) with a color temperature closest to 2856 K and a trolley with a holder enabling the simultaneous mounting of the photometric cell of the tested luxmeter and the photometric cell of the reference luxmeter were set on the photometric bench. The active surfaces of the photometric cells were positioned in the same vertical plane, perpendicular to the optical axis of the bench. By means of the holder on the photometric bench, the reference luxmeter and then the tested luxmeter were placed successively. In the first step, the illuminance of the ESW on the surface of the photometric cell of the tested luxmeter and the illuminance of the EWW on the surface of the photometric cell of the reference luxmeter were measured using the luminous intensity standard (Illuminate A). Then, this standard was replaced with a light source another than Illuminate A. The illuminance of the EWB on the surface of the photometric cell of the reference luxmeter was measured, and the illuminance of the ESB on the surface of the photometric cell of the tested luxmeter was measured.
where EWB is the illuminance on the surface of the photometric cell of the reference luxmeter using a light source that is not an illuminant A, ESW is the illuminance on the surface of the photometric head of the tested luxmeter/smartphone sensor using a light standard (illuminant A), ESB is the illuminance on the surface of the photometric head of a luxmeter tested with a light source other than illuminant A, and EWW is the illuminance on the surface of the photometric head of a reference luxmeter using the luminous standard (approximating the Illuminant A).
Since during the measurements, care was taken due to the fact that the illuminance on the surface of the photometric head of the reference luxmeter using the luminance intensity standard and the non-illuminant A lamp was the same (in other words, the condition EWB = EWW was met), the dependence on the correction factor K was taken in the form of Equation (4):
It is worth mentioning that the method of determining spectral correction coefficients was recommended by the Central Office of Measures in Poland [63] and is also included in the metrological requirements for the luxmeters developed by the Czech Metrological Institute [64]. Each measurement is subject to measurement uncertainty, also in the case of the determination of the spectral correction coefficient based on Equation (4). The relative uncertainty of determining the spectral correction factor was estimated at 5% with the coverage factor k = 2. The main components of uncertainty in this case are the uncertainties of the test and reference luxmeter. The uncertainties related to the applied luxmeters take into account the uncertainties related to the measurement geometry on the measuring stand.
4. Results
Figure 8, Figure 9 and Figure 10 show the measurement results of the relative spectral sensitivity of luxmeters and smartphones. The data were normalized to the maximum value. The V(λ) curve is also presented on the same graphs in order to allow for noticing the differences between the spectral sensitivity curve required by the CIE and the one obtained on the basis of the performed measurements. Additionally, the error value f′1 is given, which is calculated using Equation (1). The numbering of the luxmeters in the individual charts is the same as in Table 1.
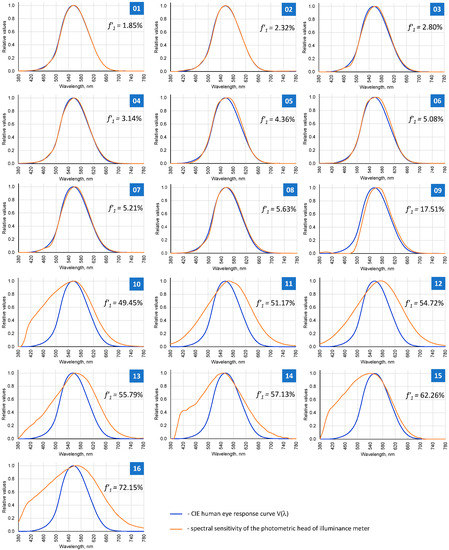
Figure 8.
The measured sensitivity curves of the photometric heads of luxmeters together with the reference curve V(λ).
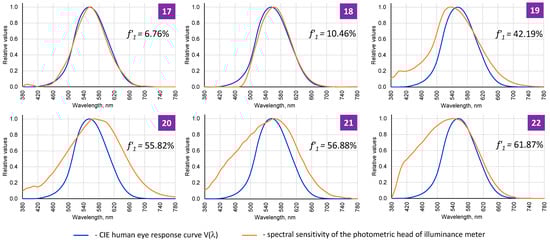
Figure 9.
The measured sensitivity curves of the photometric heads of luxmeters.
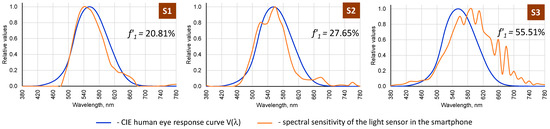
Figure 10.
Measured sensitivity curves of the smartphone light sensors.
With the data from the abovementioned figures and knowledge of the spectral characteristics of light sources (Figure 5), using Equation (2), the error f1 and the correction coefficient k were calculated, through which the indication of whether a luxmeter or smartphone should be multiplied in order to obtain the correct value was obtained. The results of the calculations are graphically illustrated in Figure 11.
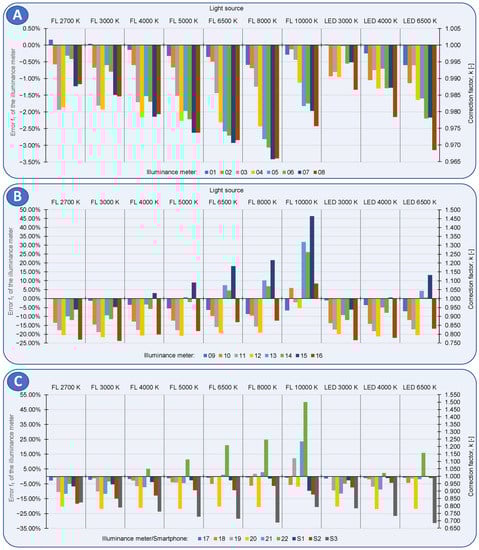
Figure 11.
Graphical illustration of the calculated values of the f1 error and the k correction factors for illuminance meters and smartphones when measuring the radiation emitted by lamps with different spectral characteristics. Negative error values for f1 mean that the values indicated by the luxmeters or smartphones were overestimated: (A) illuminance meters with error f′1 ≤ 6%; (B) illuminance meters with error f′1 > 6%; (C) illuminance meters with an integrated photometric head and smartphones.
Using the measured values of illuminance ESW and ESB and taking into account the relationship (4), the K coefficients were calculated. Due to the amount of data, instead of presenting the calculated values of the K correction coefficients, it was decided to present the differences between the k values obtained from Equation (2) and the K values calculated on the basis of (4).
On the basis of the results obtained from the conducted measurements, the relative measurement error was calculated for the individual values of the measured illuminance with the use of various luxmeters. The results are graphically illustrated in Figure 12. The y-axis represents the relative error of the measured illuminance, while the x-axis represents the designed number of the luxmeter/smartphone that was measured.
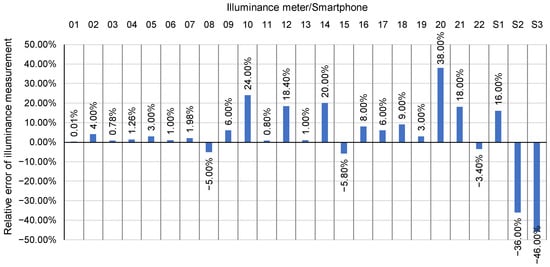
Figure 12.
Summary of the calculated values of the relative error of the illuminance measurement carried out with various luxmeters/smartphones.
By analyzing the data in Figure 12 and comparing them with the values in Table 3, it can be noticed that the error values determined during the calibration, in the case of several luxmeters, were greater than the declared accuracy.
Table 3.
Difference between correction factors calculated using both methods.
5. Discussion
The spectral correction factor is a parameter that allows for correction of the indications of the luxmeter when measuring the intensity of illumination coming from light sources with spectral characteristics different from Illuminant A. The condition for the correct application of the factor is to be familiar with the spectral characteristics of the light source. The large number of lighting solutions, both in terms of the light sources and the luminaires used, causes difficulties in applying spectral correction factors in practice. It is also worth mentioning that under real conditions, when measuring the intensity of illumination, e.g., at workplaces, the spectral characteristics of the radiation that reaches the photosensitive element of a luxmeter or smartphone is the result of the superposition of various partial streams from different light sources. Thus, the resultant spectral characteristics of the luminous flux will differ from that for a single light source. The determined spectral correction coefficients, based on measurements carried out in laboratory conditions, did not take into account the factors occurring in real conditions, which is undoubtedly a limitation of the method.
This article presents the spectral correction factors for luxmeters illuminated with typical light sources. Two methods were used to determine this coefficient. The first method of determining the spectral correction factor takes into account the spectral sensitivity of a given luxmeter, the spectral distribution of a given light source and the V(λ) curve. This method is more time consuming and expensive due to the specific measuring equipment. Hence, its use in commercial calibration laboratories of the luxmeters for common use is not too practical. One can look at the metrological verification of a luxmeter by the manufacturer of the device in a different way. In the case of using subassemblies of repeatable quality, the examination of even a single specimen in terms of spectral sensitivity and possible determination of spectral correction factors for the most popular light sources may provide users of vulnerabilities with useful information. The second method consists in comparing the indications of the tested luxmeter and the reference luxmeter (class L) illuminated by a given light source. In such a method, which should be considered as a simplified method, the indications of the tested luxmeter are compared with those of the reference luxmeter, both illuminated by the incandescent light source and the assumed light source.
6. Conclusions
The following conclusions may be formed on the basis of the experiments performed:
- (1)
- Among the 22 luxmeters that were measured, only 9 of them did not exceed the limit for the value of the spectral error f′1, which is 9%. This means that the other luxmeters (including smartphones) did not meet one of the basic requirements described in the standard [39]. Due to the significant value of the f1 error, it was impossible to classify them into any of the classes characterizing the quality of the luxmeter. Analyzing the spectral sensitivity curves and the calculated values of the f1 errors, the question arises whether these instruments should be called illuminance meters. The obtained values of illuminance measured with these devices may lead their users to erroneous conclusions regarding the fulfillment of the requirements in which the evaluation criterion is illuminance. The obtained values may be overstated or understated.
- (2)
- It is a disturbing fact that the spectral sensitivities of some of the luxmeters were even worse than the spectral sensitivity of smartphones.
- (3)
- Smartphones are not predisposed to measure illuminance, not only because of the significant deviation from the V(λ) curve, but also because of the lack of spatial correction. The light sensors installed in smartphones should not be treated as measuring devices. The function of these sensors is completely different. They are used to save energy by adjusting the luminance level of the display depending on the lighting conditions. The use of a smartphone when measuring illuminance can only be applied when using such the device as displaying the value, which was measured by peripheral device. In addition, it is important to state that smartphones can be treated only as lighting level indicators. According to the authors, they should not be used in professional measurements of illuminance. Even if smartphones are used for luminance measurement [16,65], our work shows they are not relevant for illuminance measurement.
- (4)
- For most of the luxmeters, an increase in the f1 error value could be observed as the closest color temperature of the light source increased. In this case, it is worth paying attention to the fact that the measurements of the illuminance produced by light sources of the same light color (with the same CCT value), but by different types of lamps will result in different values of the error f1, which is confirmed by the data shown in Figure 11. Different error values and, hence, the correction coefficients, were obtained for fluorescent lamps (FL), and for LED sources. These differences are most visible in the case of FL 6500 K and LED 6500 K lamps. Therefore, the question arises whether specifying the type of light source together with its color temperature value will solve the problem. Taking into account the fact that the spectral characteristics of light sources (of the same type) may differ, despite the same or similar color temperature value, the answer seems to be obvious. Giving the type of light source and the CCT value will not solve the problem, as the values of the correction factors may be different. The spectral correction factors can be determined by various methods, using various measuring instruments. Although the measurements with the two methods were carried out in calibrating laboratories, differences can be seen, which is understandable. The smallest discrepancies were noted in the case of luxmeters, the spectral sensitivity curve of which was closest to the shape of the V(λ) curve.
- (5)
- Determining the spectral correction coefficients requires advanced laboratory facilities, which in practice is very time consuming and expensive. It is also impossible to determine the correction factors for all available light sources and for each model of a luxmeter. Thus, there is a question about the validity of determining the correction coefficients. According to the authors, instead of incurring costs related to such measurements, in the case of measurements where high accuracy is required (e.g., when assessing compliance with the guidelines contained in standards or compliance with specifications), a cheaper solution will be to use a class A luxmeter. In the measurements performed in this work, all the luxmeters of a class A according to the standard [39] were characterized by an f′1 error lower than the limit value for this class. Moreover, the sensitivity curves of these luxmeters slightly differ from the V(λ) curve.
- (6)
- For 8 out of 10 luxmeters tested, for which the device specification included the class of the luxmeter, it may be stated based on the calculated error values f1 that this information was correct. Thus, this result can be considered as satisfactory. The situation is much less optimistic in the case of information on spectral errors. In many cases, the determined error value is greater than that specified in the instrument specification. The greatest difference was noted in the case of the luxmeter marked by 16. Due to the fact that this luxmeter was classified as class A in accordance with JISC 1609, the value of the spectral correction error should not exceed 16%, while the value obtained on the basis of the measurements carried out was over 4.5 times greater and was 72.15%.
- (7)
- A very low error value (less than 1%) determined during the calibration of the luxmeter does not guarantee that similar error values will be obtained when measuring the radiation emitted by light sources other than incandescent lamp. An example is the luxmeter marked as 11.
- (8)
- A higher value of f′1 does not necessarily mean that the measurement made with such a luxmeter will have a greater error. Examples that illustrate this phenomenon well were the luxmeters marked as 05 and 15. When measuring the radiation emitted by the FL 2700 K, FL 3000 K, LED 3000 K, and LED 4000 K lamps, the f1 error value for the 05 luxmeter was lower than for the 04 luxmeter (Figure 11). A similar regularity can be seen in the case of luxmeter 15, for which the calculated f1 errors were smaller than for luxmeter 14. In other words, based on the value of the parameter f′1, it is impossible to precisely assess the luxmeter in terms of the degree of deviation of the sensitivity curve of the photometric head from the V(λ) curve.
Author Contributions
Conceptualization, P.T.; data curation, P.T.; methodology, P.T. and J.W.; software, P.T.; validation, P.T. and J.W.; formal analysis, P.T. and J.W.; resources, P.T.; writing—original draft preparation, P.T.; writing—review and editing, P.T. and J.W.; visualization, P.T.; supervision, P.T. All authors have read and agreed to the published version of the manuscript.
Funding
This research received no external funding.
Institutional Review Board Statement
Not applicable.
Informed Consent Statement
Not applicable.
Data Availability Statement
The data presented in this study are available upon request from the corresponding author. The data are not publicly available due to the policy of research projects.
Acknowledgments
The authors would like to thank the GL Optic company for performing the measurements at the Calibration and Research Laboratory of Optical Radiation (CARLO). The authors would like to also thank the SONEL company for providing the luxmeters available in the commercial offer of the company.
Conflicts of Interest
The authors declare no conflict of interest.
References
- Enoch, J.; McDonald, L.; Jones, L.; Jones, P.; Crabb, D.P. Evaluating Whether Sight Is the Most Valued Sense. JAMA Ophthalmol. 2019, 137, 1317–1320. [Google Scholar] [CrossRef]
- European Standard EN 12464-1:2022; Light and lighting. Lighting of work places-Part 1. Indoor Work Places. European Committee for Standardization: Brussel, Belgium, 2022.
- European Standard EN 1838:2013; Lighting Applications-Emergency Lighting. European Committee for Standardization: Brussel, Belgium, 2013.
- European Standard EN 12464-2:2014; Light and lighting-Lighting of work places-Part 2: Outdoor Work Places. European Committee for Standardization: Brussel, Belgium, 2014.
- European Standard EN 12193:2018; Light and lighting-Sports Lighting. European Committee for Standardization: Brussel, Belgium, 2018.
- European Standard EN 13201-2:2015; Road lighting–Part 2: Performance Requirements. European Committee for Standardization: Brussel, Belgium, 2015.
- Skarżyński, K. Light Trespass Into Floodlit Buldings in Relation to the Requirements of the Polisch Standard. Pol. J. Sustain. Dev. 2017, 21, 107–116. [Google Scholar] [CrossRef]
- Technical Report CIE 231:2019; Classification System of Illuminace and Luminance Meter. CIE: Vienna, Austria, 2019.
- Technical Report CIE 150:2017; Guide on the Limitation of the Effects of Obtrusive Light from Outdoor Lighting Installations. CIE: Vienna, Austria, 2017.
- Ściężor, T. Light pollution as an environmental hazard. Tech. Trans. 2019, 8, 129–142. [Google Scholar] [CrossRef]
- Hänel, A.; Posch, T.; Ribas, S.J.; Aubé, M.; Duriscoe, D.; Jechow, A.; Kollath, Z.; Lolkema, D.E.; Moore, C.; Schmidt, N.; et al. Measuring night sky brightness: Methods and challenges. J. Quant. Spectrosc. Radiat. Transf. 2018, 205, 278–290. [Google Scholar] [CrossRef]
- Bouroussis, C.A.; Topalis, F.V. Assessment of outdoor lighting installations and their impact on light pollution using unmanned aircraft systems-The concept of the drone-gonio-photometer. J. Quant. Spectrosc. Radiat. Transf. 2020, 253, 107155. [Google Scholar] [CrossRef]
- Tabaka, P. Pilot Measurement of Illuminance in the Context of Light Pollution Performed with an Unmanned Aerial Vehicle. Remote Sens. 2020, 12, 2124. [Google Scholar] [CrossRef]
- Jechow, A.; Hölker, F. How dark is a river? Artificial light at night in aquatic systems and the need for comprehensive night-time light measurements. Wiley Interdiscip. Rev. Water 2019, 6, e1388. [Google Scholar] [CrossRef]
- Kolláth, Z.; Dömény, A. Night sky quality monitoring in existing and planned dark sky parks by digital cameras. arXiv 2017, arXiv:1705.09594. [Google Scholar] [CrossRef]
- Fiorentin, P.; Bertolo, A.; Cavazzani, S.; Ortolani, S. Calibration of digital compact cameras for sky quality measures. J. Quant. Spectrosc. Radiat. Transf. 2020, 255, 107235. [Google Scholar] [CrossRef]
- Bettanini, C.; Fiorentin, P.; Dumitriu, A.; Conte, E. Design and Test of Autonomous Scientific Payloads for Sounding Balloons. In Proceedings of the 7th IEEE International Workshop on Metrology for AeroSpace (MetroAeroSpace), Pisa, Italy, 22–24 June 2020; pp. 469–474. [Google Scholar]
- Ayas, M.; Altas, I.H.; Alçelik, T. Fast measurement of headlamps by means of a developed fuzzy luxmeter based on a fuzzy mapping algorithm. Turk. J. Electr. Eng. Comput. Sci. 2016, 24, 2627–2637. [Google Scholar] [CrossRef]
- Bahirah, A.; Rahmadi, A.; Rakhmadi, F.A. Application Measurement Tools of Luxmeter and White Diode Laser as Alternative Methods in Distinguishing Oil Candles Based Mixed the Light Intensity. In Proceedings of the International Conference on Science and Engineering 2019 (ICSE III), Yogyakarta, Indonesia, 28 November 2019; Volume 2, pp. 23–24. [Google Scholar] [CrossRef]
- Putri, M.D.D.; Slamet, R.; Rakhmadi, F.A. Characteristics Between New Oil and Used Oil by Using Laser Light Intensity and Lux Meter. In Proceedings of the International Conference on Science and Engineering, 2019 (ICSE III), Yogyakarta, Indonesia, 28 November 2019; Volume 2, pp. 111–112. [Google Scholar] [CrossRef]
- Roy, B.; Acharya, A.; Roy, T.K.; Kuila, S.; Datta, J. A smart street-light intensity optimizer. In Proceedings of the 2018 Emerging Trends in Electronic Devices and Computational Techniques (EDCT), Kalkata, India, 8–9 March 2018. [Google Scholar] [CrossRef]
- Gasparowski, D. Measurement of daylight illuminance levels in transient periods for public lighting control. Prz. Elektrotech. 2013, 6, 320–323. [Google Scholar]
- Khot, S.B.; Gaikwad, M.S. Development of cloud-based Light intensity monitoring system for green house using Raspberry Pi. In Proceedings of the 2016 International Conference on Computing Communication Control and Automation (ICCUBEA), Pune, India, 12–13 August 2016; pp. 1–4. [Google Scholar]
- Ruhle, K.; Juhl, M.K.; Abbott, M.D.; Kasemann, M. Evaluating Crystalline Silicon Solar Cells at Low Light Intensities Using Intensity-Dependent Analysis of I–V Parameters. IEEE J. Photovolt. 2015, 5, 926–931. [Google Scholar] [CrossRef]
- Hashmi, G.; Hasan, S.; Efat, M.H.; Rahman, H. Portable solar panel efficiency measurement system. SN Appl. Sci. 2019, 2, 56. [Google Scholar] [CrossRef]
- Malet-Damour, B.; Boyer, H.; Guichard, S.; Miranville, F. Performance Testing of Light Pipes in Real Weather Conditions for a Confrontation with Hemera. J. Clean Energy Technol. 2017, 5, 73–76. [Google Scholar] [CrossRef]
- Nocera, F.; Lo Faro, A.; Costanzo, V.; Raciti, C. Daylight Performance of Classrooms in a Mediterranean School Heritage Building. Sustainability 2018, 10, 3705. [Google Scholar] [CrossRef]
- Lee, S.-H.; Park, S.-J.; Kim, K.-M.; Lee, D.-J.; Kim, W.-J.; Park, R.-W.; Joo, N.-S. Effect of Sunlight Exposure on Serum 25-Hydroxyvitamin D Concentration in Women with Vitamin D Deficiency: Using Ambulatory Lux Meter and Sunlight Exposure Questionnaire. Korean J. Fam. Med. 2012, 33, 381–389. [Google Scholar] [CrossRef] [PubMed]
- Saraf, S.; Sahu, S.; Kaur, C.D.; Saraf, S. Comparative measurement of hydration effects of herbal moisturizers. Pharmacogn. Res. 2010, 2, 146–151. [Google Scholar] [CrossRef] [PubMed]
- Listewnik, P.; Wąsowicz, M.; Kosowska, M.; Mazikowski, A. A Measurement System for Quasi-Spectral Determination of Absorption and Scattering Parameters of Veterinary Tissue Phantoms. Appl. Sci. 2019, 9, 1632. [Google Scholar] [CrossRef]
- Marschner, S.R.; Greenberg, D.P. Inverse lighting for photography. In Proceedings of the Color and Imaging Conference, Scottsdale, AZ, USA, 17–20 November 1997; Society for Imaging Science and Technology: Springfield, VA, USA, 1997; Volume 1, pp. 262–265. [Google Scholar]
- Technical Report CIE 84-1989; The Measurement of Luminous Flux. CIE: Vienna, Austria, 1989.
- Tabaka, P.; Rozga, P. Assessment of methods of marking LED sources with the power of equivalent light bulb. Bull. Pol. Acad. Sci. Tech. Sci. 2017, 65, 883–890. [Google Scholar] [CrossRef][Green Version]
- Tabaka, P.; Rozga, P. Analysis of selected parameters of compact fluorescent lamps during their long-term operation. Metrol. Meas. Syst. 2020, 27, 541–557. [Google Scholar] [CrossRef]
- Technical Report CIE 121-1996; The Photometry & Goniophotometry of Luminaires. CIE: Vienna, Austria, 1996.
- Standard CEN-EN 13032-2:2017; Light and Lighting-Measurement and Presentation of Photometric Data of Lamps and Luminaires–Part 2: Presentation of Data for Indoor and Outdoor Work Places. European Committee for Standardization (CEN): Brussels, Belgium, 2017.
- Oleszyński, T. Miernictwo Techniki Świetlnej (Eng. Metrology of Lighting Technology); PWN: Warsaw, Poland, 1957. (In Polish) [Google Scholar]
- Hrbac, R.; Kolar, V.; Novak, T. Prototype of a Luxmeter with High Sensitivity Suitable for Long-Term Data Recording. In Proceedings of the 2015 International Conference on Applied Electronics (AE), Pilsen, Czech Republic, 8–9 September 2015. [Google Scholar]
- Standard ISO/CIE 19476:2014; Characterization of the Performance of Illuminance Meters and Luminance Meters. CIE: Vienna, Austria, 2014.
- German standard DIN 5032-7:2017-02; Lichtmessung-Teil 7: Klasseneinteilung von Beleuchtungsstärke-und Leuchtdichte Messgeräten (Eng. Photometry-Part 7: Classification of illuminance meters and luminance meters). Deutsches Institut für Normung: Berlin, German, 2017. (In German)
- Japanese Industrial Standard JIS C 1609:1993; Illuminance metres. Japanese Standards Association: Tokyo, Japan, 1993.
- Pulli, T.; Dönsberg, T.; Poikonen, T.; Manoocheri, F.; Kärhä, P.; Ikonen, E. Advantages of white LED lamps and new detector technology in photometry. Light. Sci. Appl. 2015, 4, e332. [Google Scholar] [CrossRef]
- Kokka, A.; Poikonen, T.; Blattner, P.; Jost, S.; Ferrero, A.; Pulli, T.; Ngo, M.; Thorseth, A.; Gerloff, T.; Dekker, P.; et al. Development of white LED illuminants for colorimetry and recommendation of white LED reference spectrum for photometry. Metrologia 2018, 55, 526–534. [Google Scholar] [CrossRef]
- Technical Report CIE 15:2018; Colorimrtry. CIE: Vienna, Austria, 2018.
- Fryc, I. Korekcja widmowa detektorów stosowanych w głowicach fotometrycznych (Eng. Spectral correction of detectors used in photometric heads). Prz. Elektrotech. 1997, 7, 191–195. [Google Scholar]
- Fryc, I. Spectral and Spatial Correction of Photometers; Polish Chapter of SPIE–The International Society for Optical Engineering: Warsaw, Poland, 2001; Volume 8. [Google Scholar]
- Ryer, A. Light Measurement Handbook; International Light Inc.: New York, NY, USA, 1998. [Google Scholar]
- Krüger, U.; Blattner, P. Spectral Mismatch Correction Factor Estimation for White LED Spectra Based on the Photometer’s f1’ Value. CIE x038:2013. In Proceedings of the CIE Centenary Conference: Towards a New Century of Light, Paris, France, 15–16 April 2013. [Google Scholar]
- Banaszak, A.; Tabaka, P.; Wtorkiewicz, J. Analiza Wybranych Właściwości Różnych Typów Luksomierzy (Eng. Analysis of the Chosen Attributes of Different Types of Luxmeters). Pr. Inst. Elektrotechniki 2015, 268, 83–99. (In Polish) [Google Scholar] [CrossRef]
- Hrbac, R.; Kolar, V.; Novak, T.; Bartłomiejczyk, M.; Novak, T.; Kolar, V. Prototype of a low-cost luxmeter with wide measuring range designed for railway stations dynamic lighting systems. In Proceedings of the 2014 15th International Scientific Conference on Electric Power Engineering (EPE), Brno-Bystrc, Czech Republic, 12–14 May 2014. [Google Scholar] [CrossRef]
- Gunawan, C.; Fauziah, F.; Hayati, N. Prototipe Light Meter Fotografi Studio Menggunakan Mikrokontroler ATMega328 Berbasis Sensor Cahaya dan Warna (Eng. Light meter prototype in studio photography using the ATMega328 microcontroller based on a light and color sensor). J. Media Inform. Budidarma 2021, 5, 763–778. [Google Scholar]
- Ahmad, M.; Noor, S.Z.M.; Rahman, N.F.A.; Haris, F.A. Lux Meter Integrated with Internet of Things (IoT) and Data Storage (LMX20). In Proceedings of the 2021 IEEE International Conference in Power Engineering Application (ICPEA), virtual, 8–9 March 2021. [Google Scholar] [CrossRef]
- Wijaya, N.H.; Sutrimo, S. Lux Meter Sebagai Alat Ukur Intensitas Cahaya Lampu Operasi Berbasis Arduino Uno R3. J. Ecotipe 2021, 8, 1–8. [Google Scholar] [CrossRef]
- Ahmad, J.; Yousuf, R. Light Dependent Resistor (LDR) Based Low Cost Light Intensity Measurement Circuit Design (LUX Meter). Int. J. Innov. Res. Comput. Commun. Eng. 2016, 4, 14735–14739. [Google Scholar] [CrossRef]
- Sumriddetchkajorn, S.; Somboonkaew, A. Low-Cost Cell-Phone-Based Digital Lux Meter. In Proceedings of the SPIE 7853, Advanced Sensor Systems and Applications IV, 78530L, Beijing, China, 9 November 2010. [Google Scholar] [CrossRef]
- Hariadi, T.K.; Juwito, A.K.H.; Chamim, A.N.N. Smartphone-based lux meter with decision support system. In Proceedings of the 2017 7th IEEE International Conference on Control System, Computing and Engineering (ICCSCE 2017), Penang, Malaysia, 24–26 November 2017. [Google Scholar] [CrossRef]
- Gutierrez-Martinez, J.-M.; Castillo-Martinez, A.; Medina-Merodio, J.-A.; Aguado-Delgado, J.; Martinez-Herraiz, J.-J. Smartphones as a Light Measurement Tool: Case of Study. Appl. Sci. 2017, 7, 616. [Google Scholar] [CrossRef]
- Machado, D.A.D.A.R.C.; Esteves, D.D.A.A.; Branca, P.M.A.D.S. Accuracy of a smartphone to test laryngoscope’s light and an audit to our laryngoscopes using an ISO standard. Rev. Bras. Anestesiol. 2017, 67, 180–183. [Google Scholar] [CrossRef]
- DIAL. Luxmeter App versus Measuring Device: Are Smartphones Suitable for Measuring Illuminance? Available online: https://www.dialux.com/en-GB/news-detail/luxmeter-app-versus-measuring-device-are-smartphones-suitable-for-measuring-illuminance (accessed on 20 March 2022).
- Technical Report CIE 202:2011; Spectral Responsivity Measurement of Detectors, Radiometers and Photometers. CIE: Vienna, Austria, 2011.
- Calibration and Research Laboratory of Optical Radiation (CARLO). Available online: https://gloptic.com/services/calibration-and-research-laboratory-for-optical-radiation/ (accessed on 19 March 2022).
- Ouyang, H.; Dai, C.; Huang, B.; Wu, Z. Bandwidth determination of a Czerny-Turner double monochromator with varied slit widths through experiment and data computation. In Proceedings of the 2011 International Conference on Optical Instruments and Technology: Optical Systems and Modern Optoelectronic, Beijing, China, 6–9 November 2011. [Google Scholar] [CrossRef]
- Zarządzenie nr 31 Prezesa Głównego Urzędu Miar (Eng. Decree No. 31 of the President of Central Office of Measures). Available online: https://www.gum.gov.pl/download/2/2812/pxdu061995.pdf (accessed on 20 March 2022). (In Polish)
- Český Metrologický Institut (Eng. Czech Metrological Institute). Available online: https://www.cmi.cz/sites/all/files/public/download/Uredni_deska/OOP/3443-ID-C.pdf (accessed on 20 March 2022). (In Czech).
- Burggraaff, O.; Schmidt, N.; Zamorano, J.; Pauly, K.; Pascual, S.; Tapia, C.; Spyrakos, E.; Snik, F. Standardized spectral and radiometric calibration of consumer cameras. Opt. Express 2019, 27, 19075–19101. [Google Scholar] [CrossRef] [PubMed]
Publisher’s Note: MDPI stays neutral with regard to jurisdictional claims in published maps and institutional affiliations. |
© 2022 by the authors. Licensee MDPI, Basel, Switzerland. This article is an open access article distributed under the terms and conditions of the Creative Commons Attribution (CC BY) license (https://creativecommons.org/licenses/by/4.0/).