
Repowering a Coal Power Unit with Small Modular Reactors and Thermal Energy Storage


Abstract
:1. Introduction
1.1. Nuclear Reactors for Retrofits
1.2. Molten Salt Thermal Energy Storage
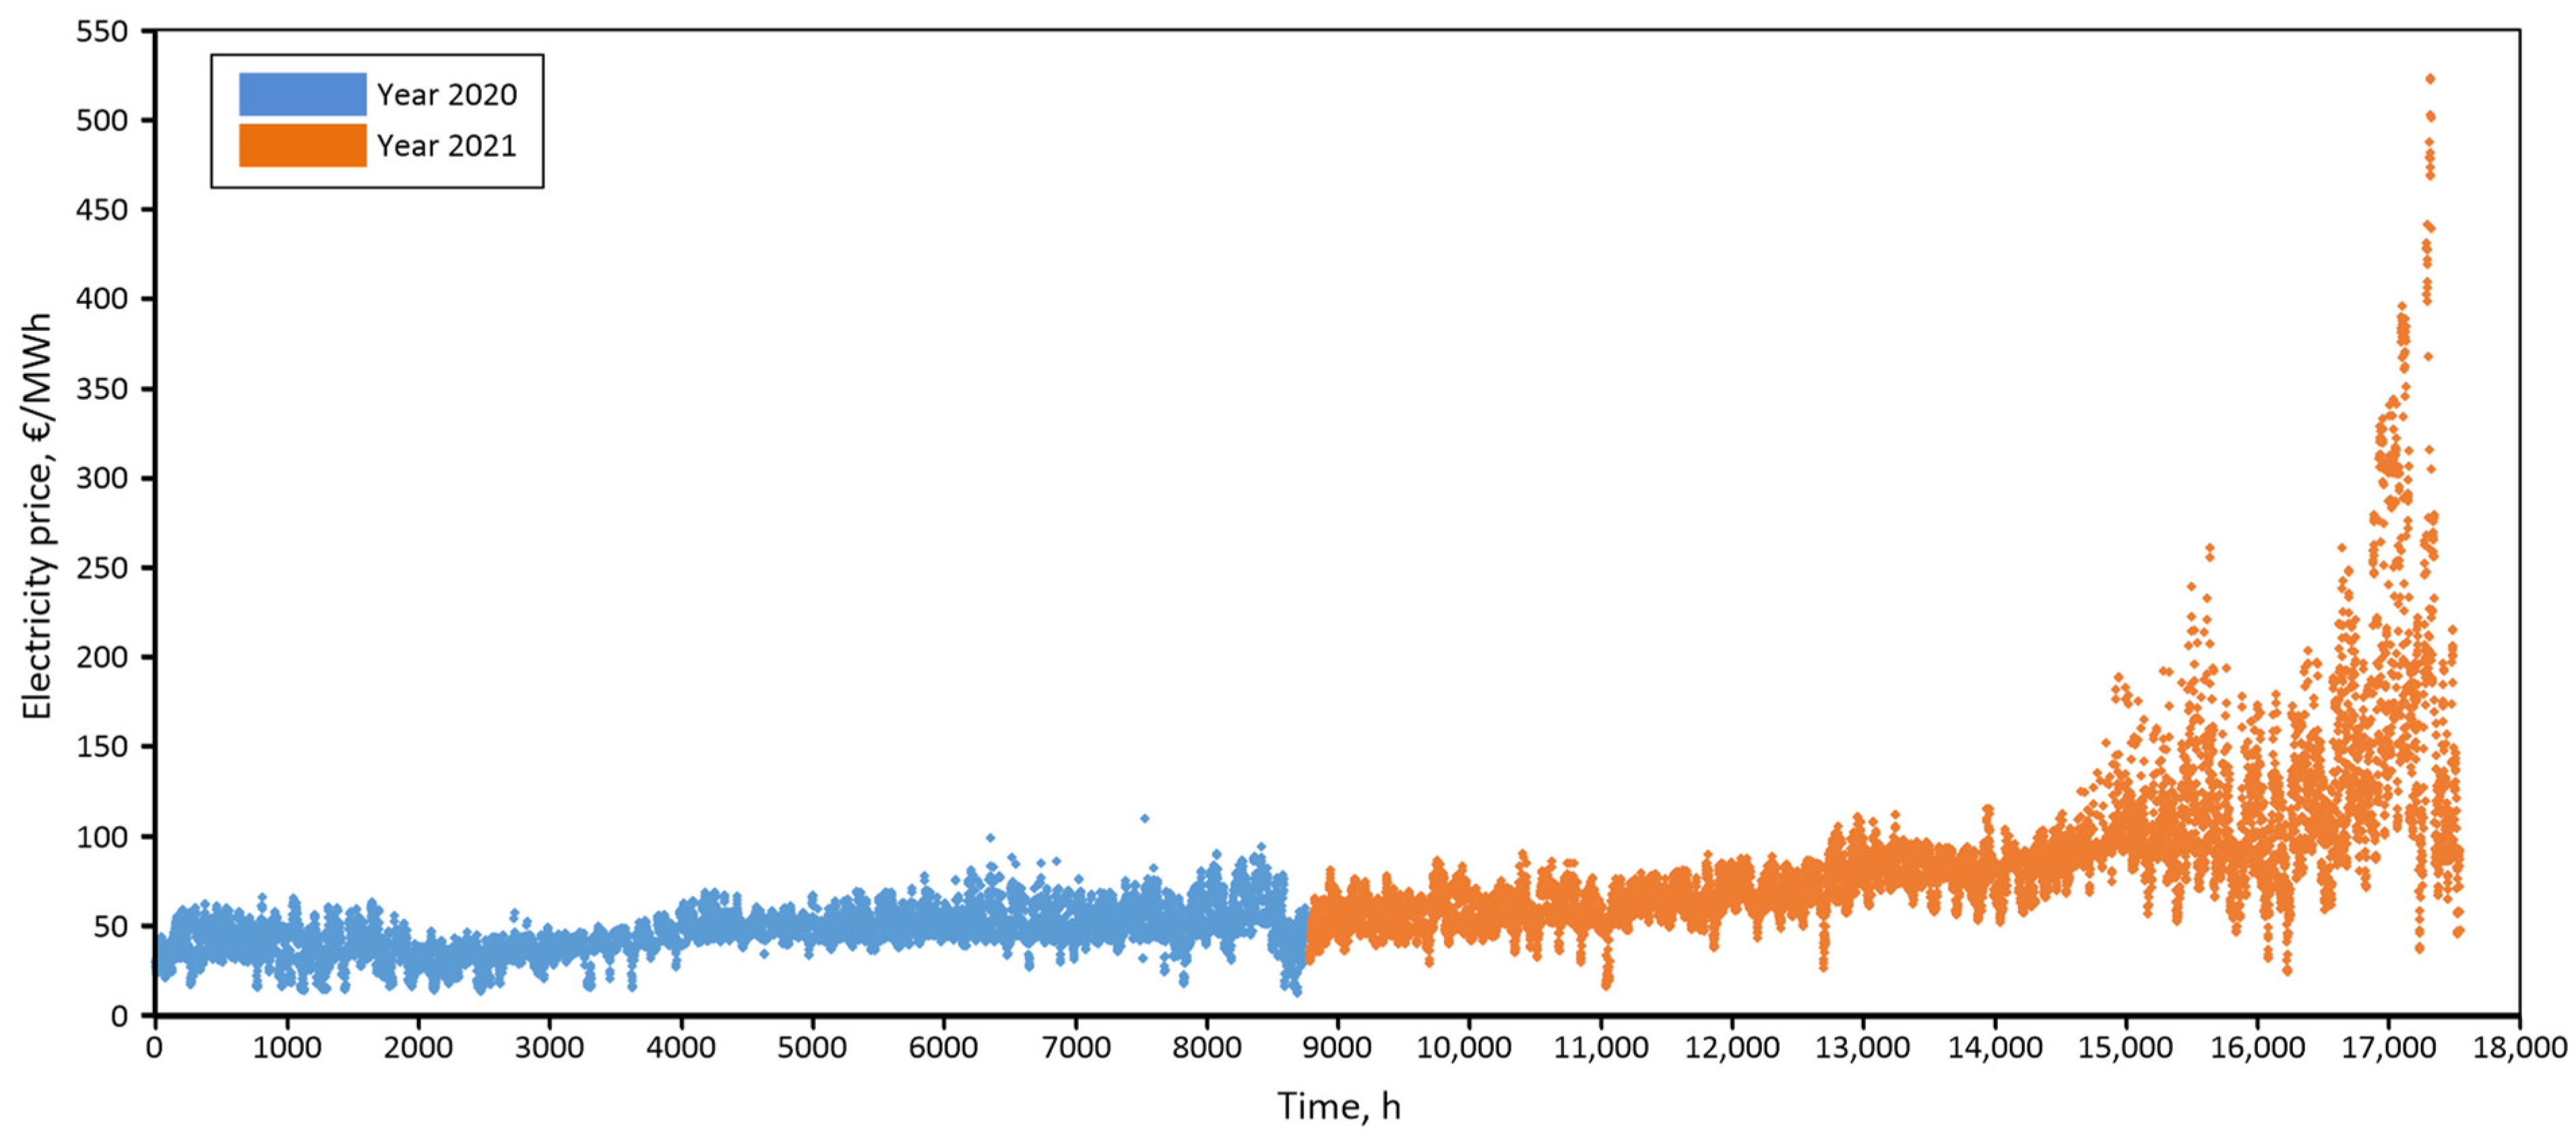
1.3. Energy Market in Poland
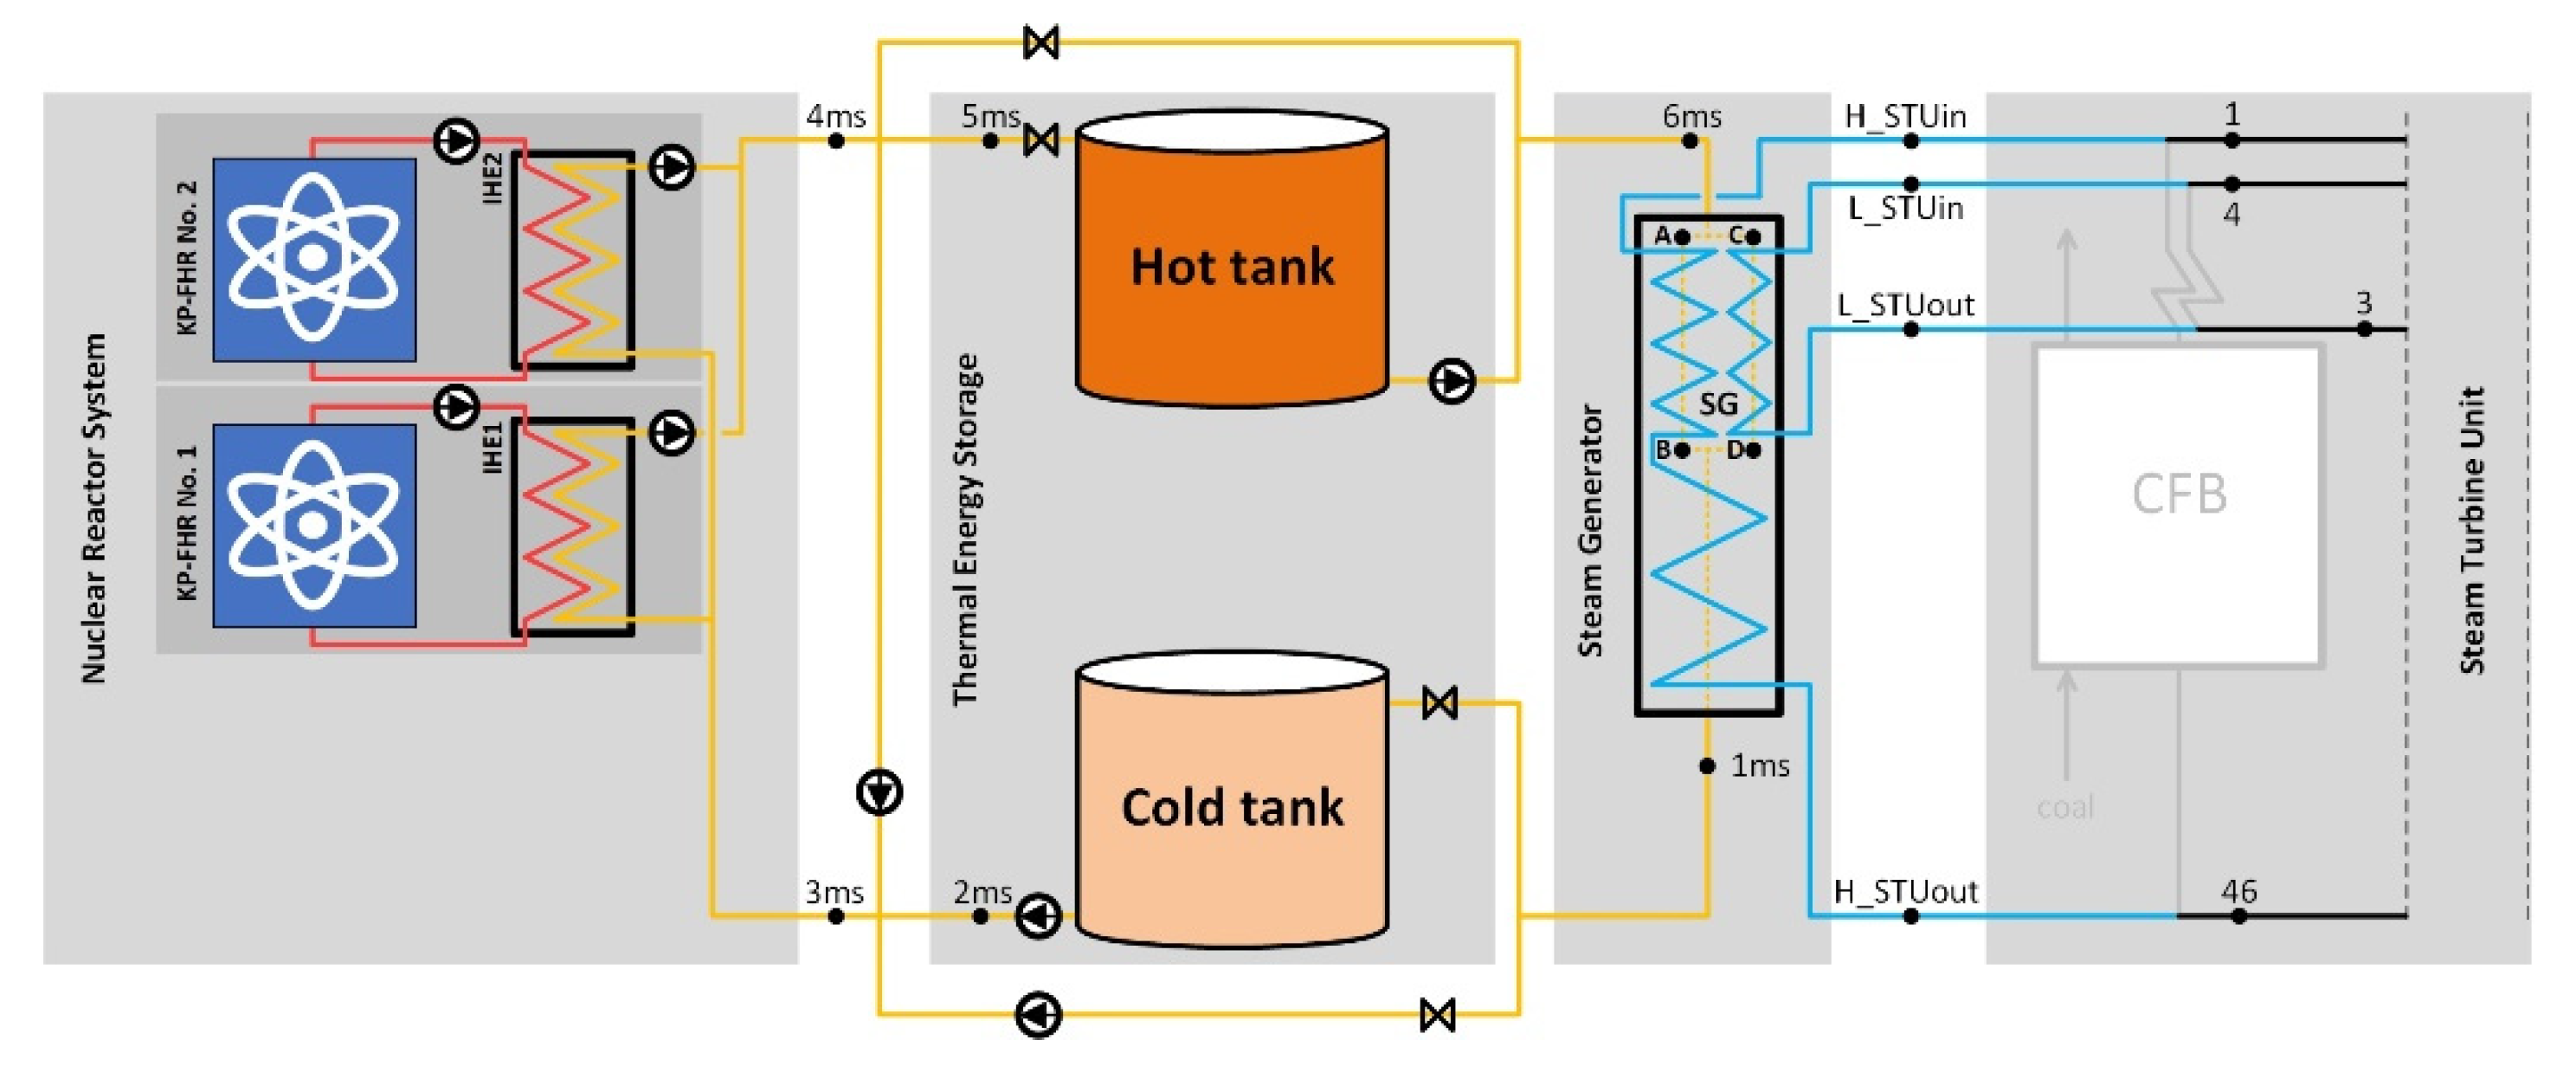
2. Methods
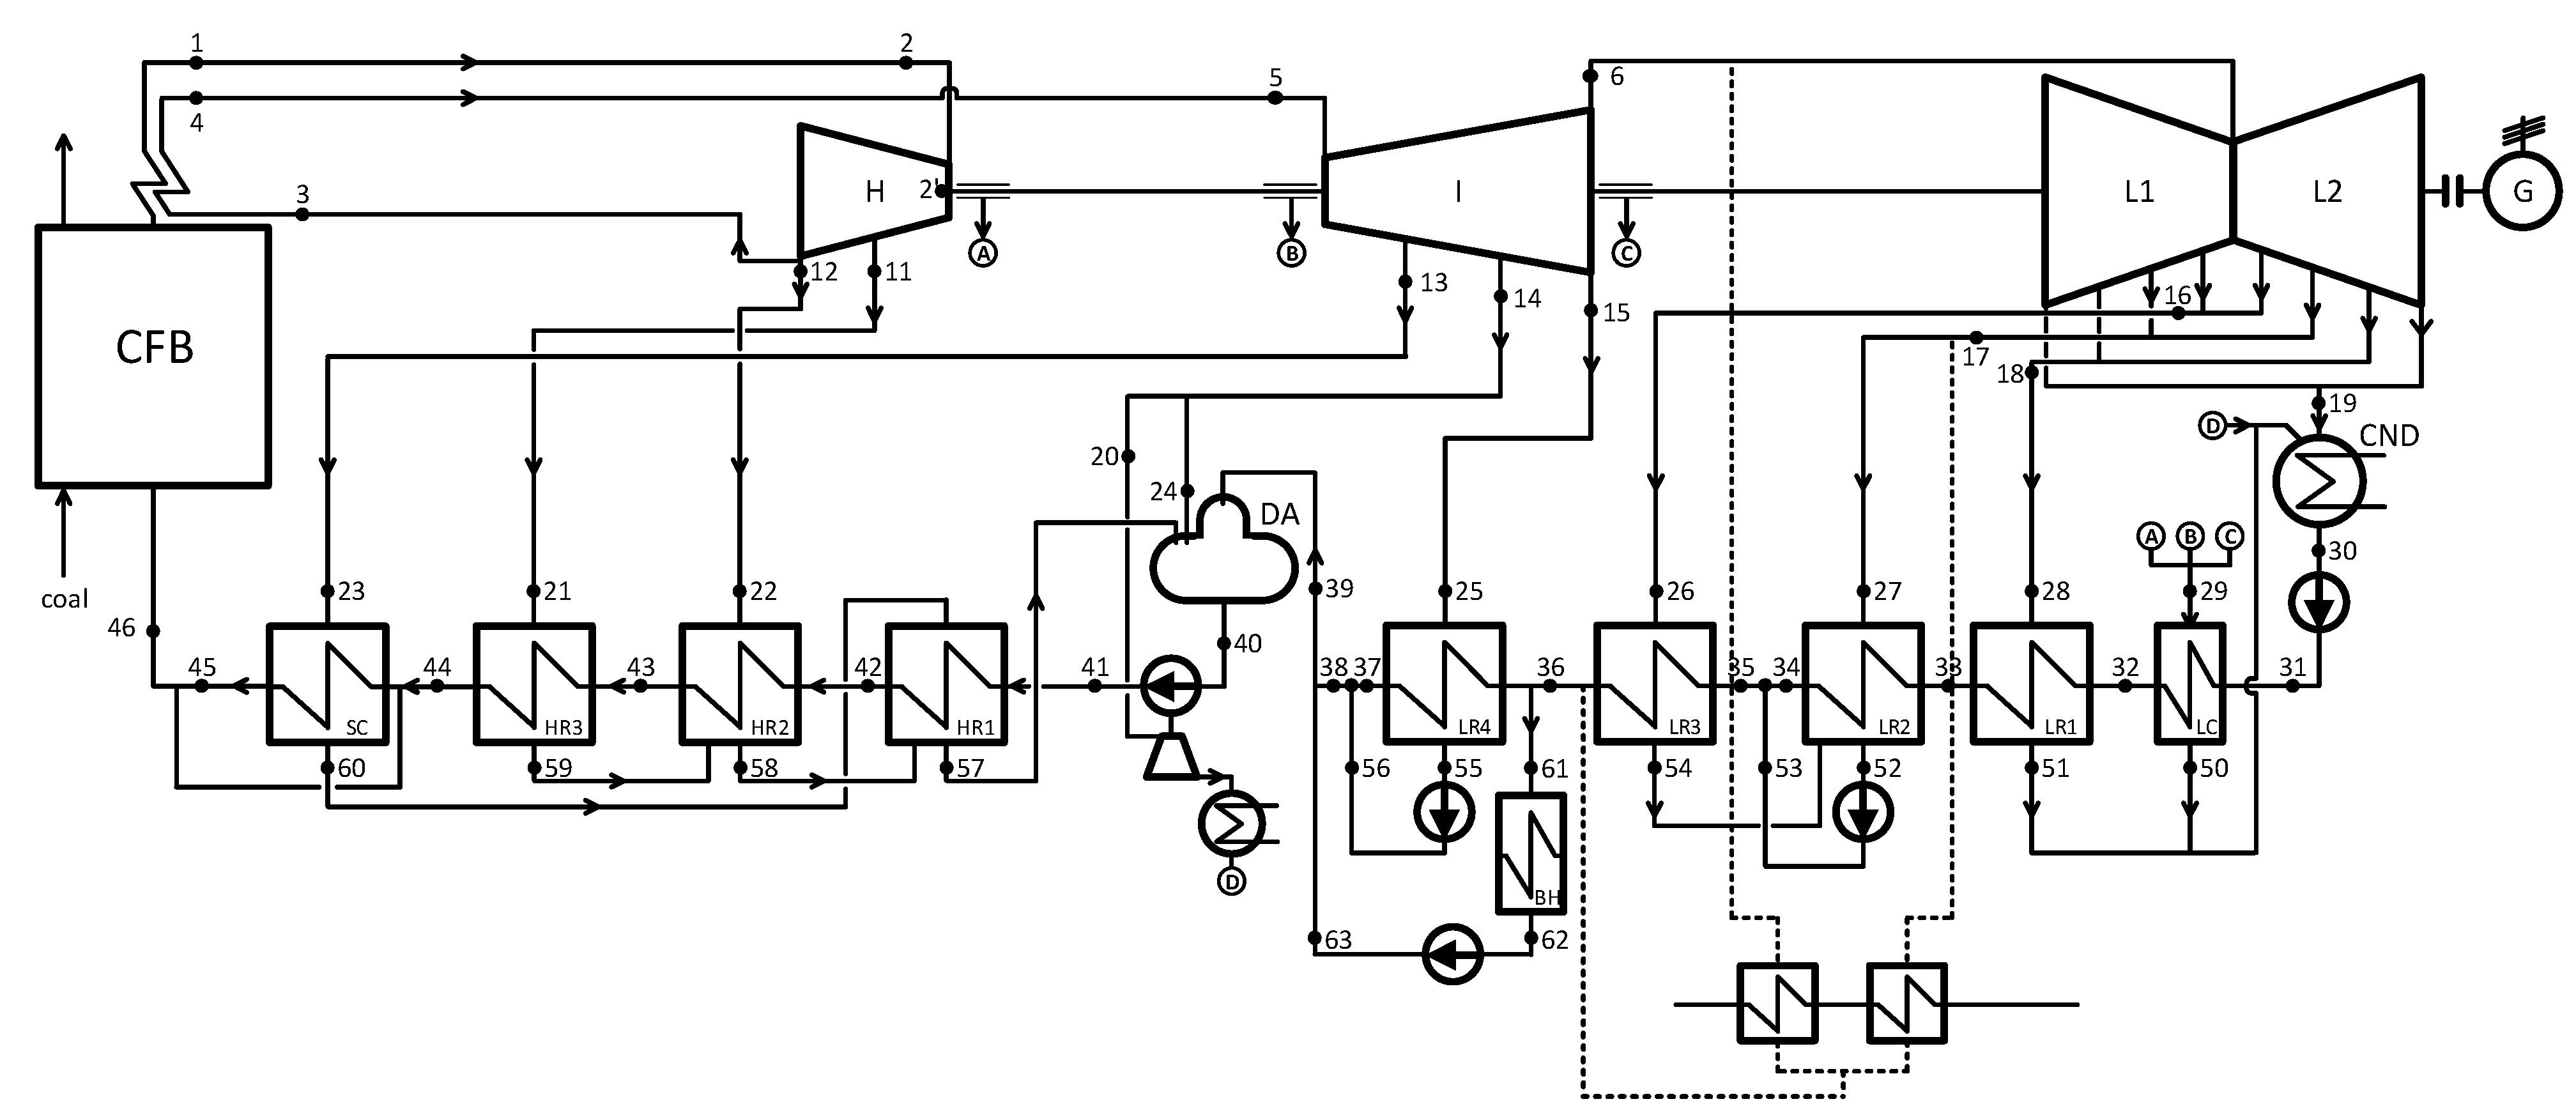
2.1. Coal-Fired Reference Unit
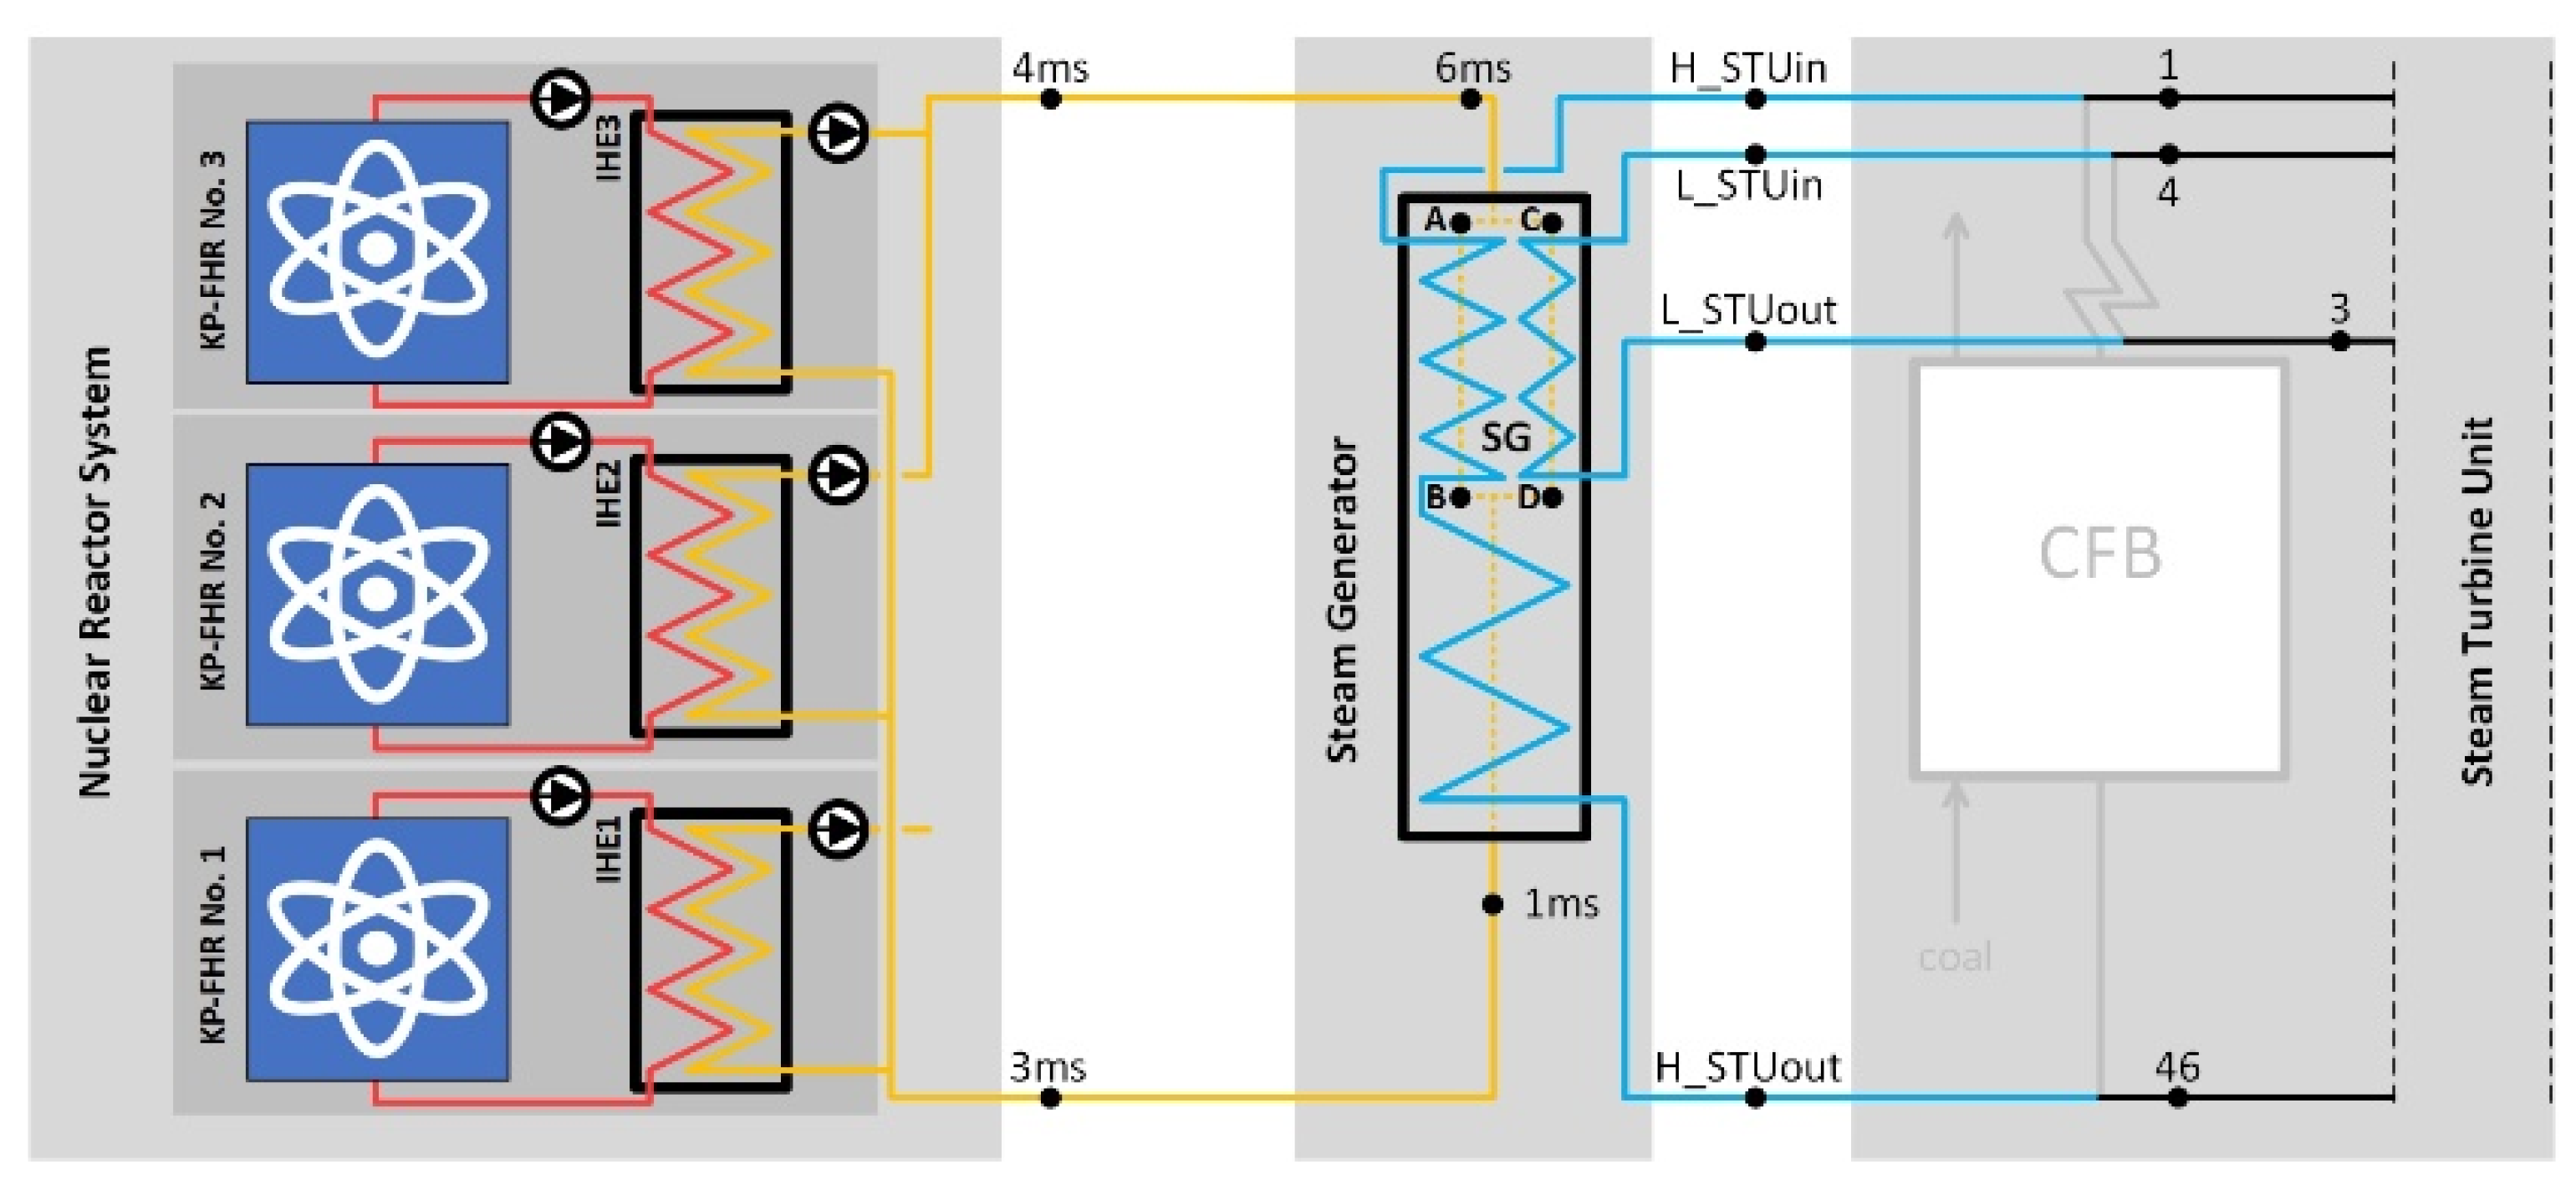
2.2. Nuclear Repowering Options
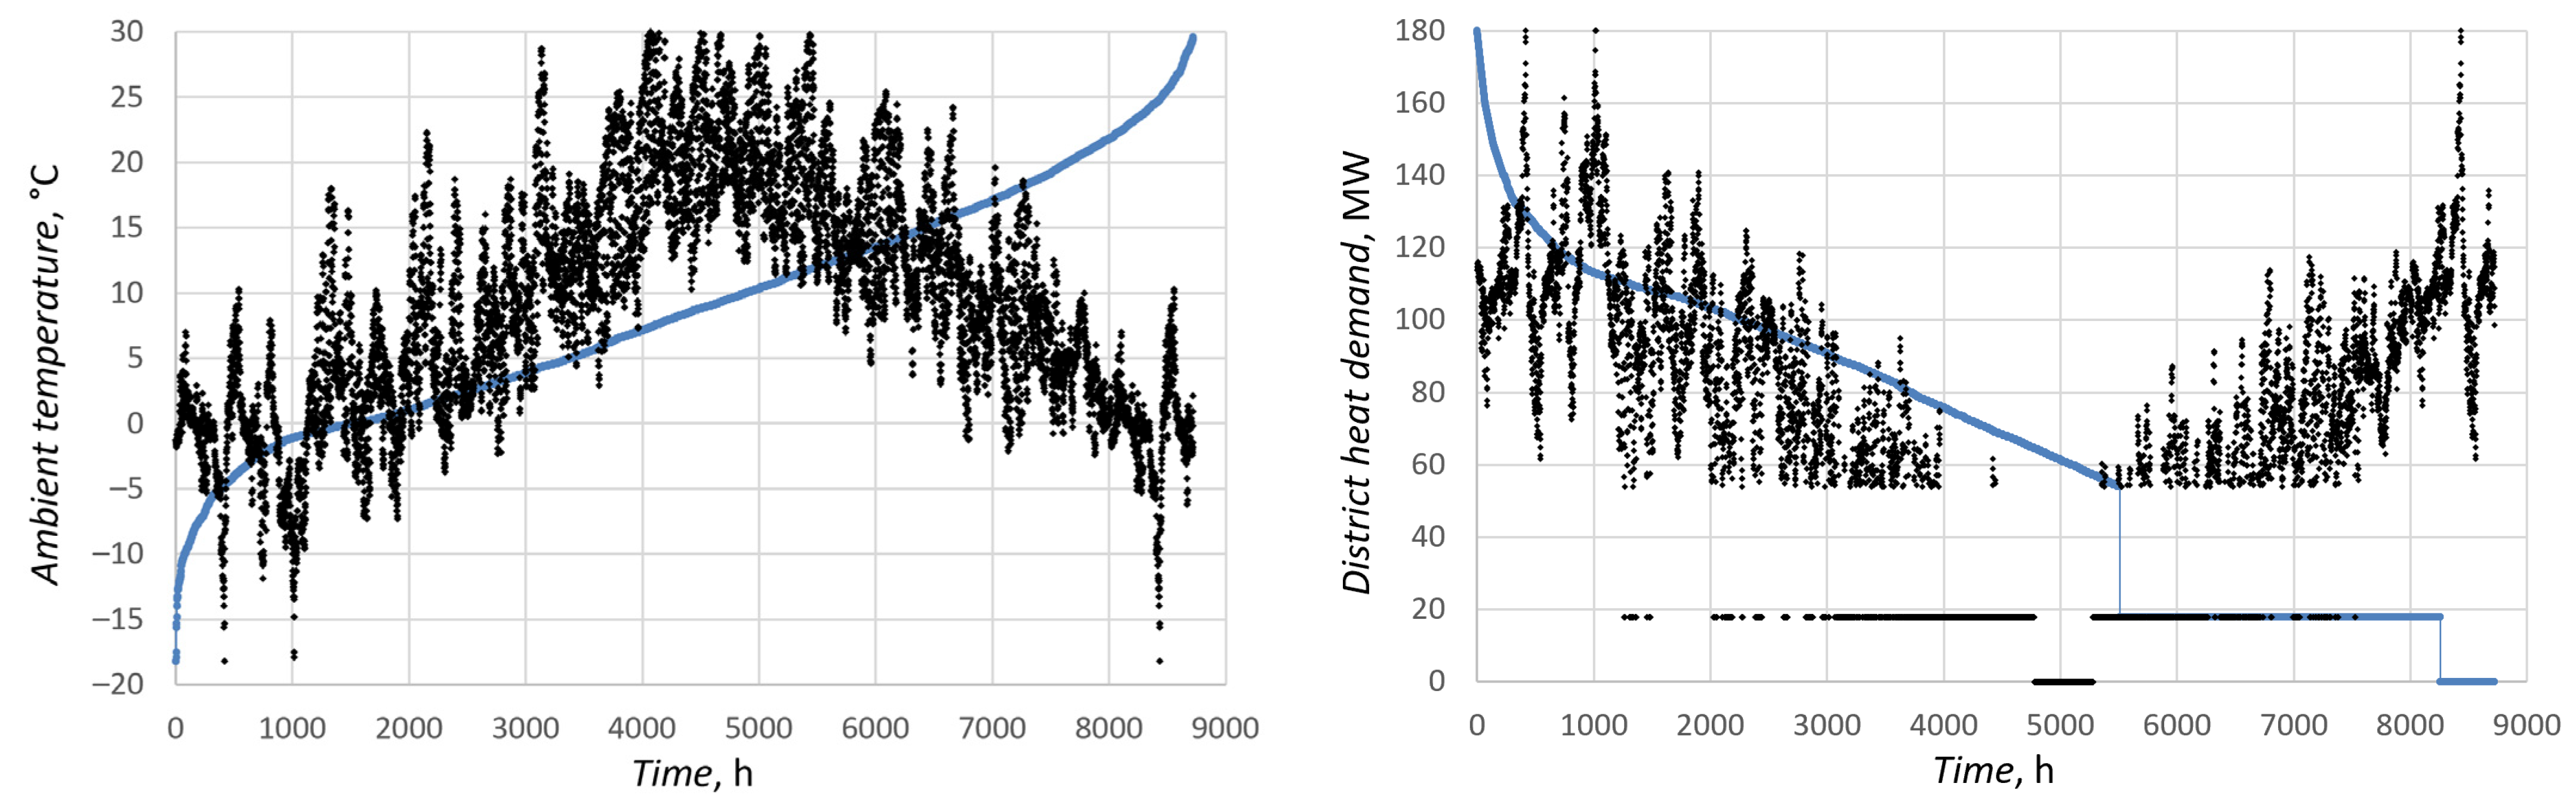
2.3. Modeling and Design
2.4. Economic Assessment
2.4.1. Assessment Indicators
2.4.2. Assumptions
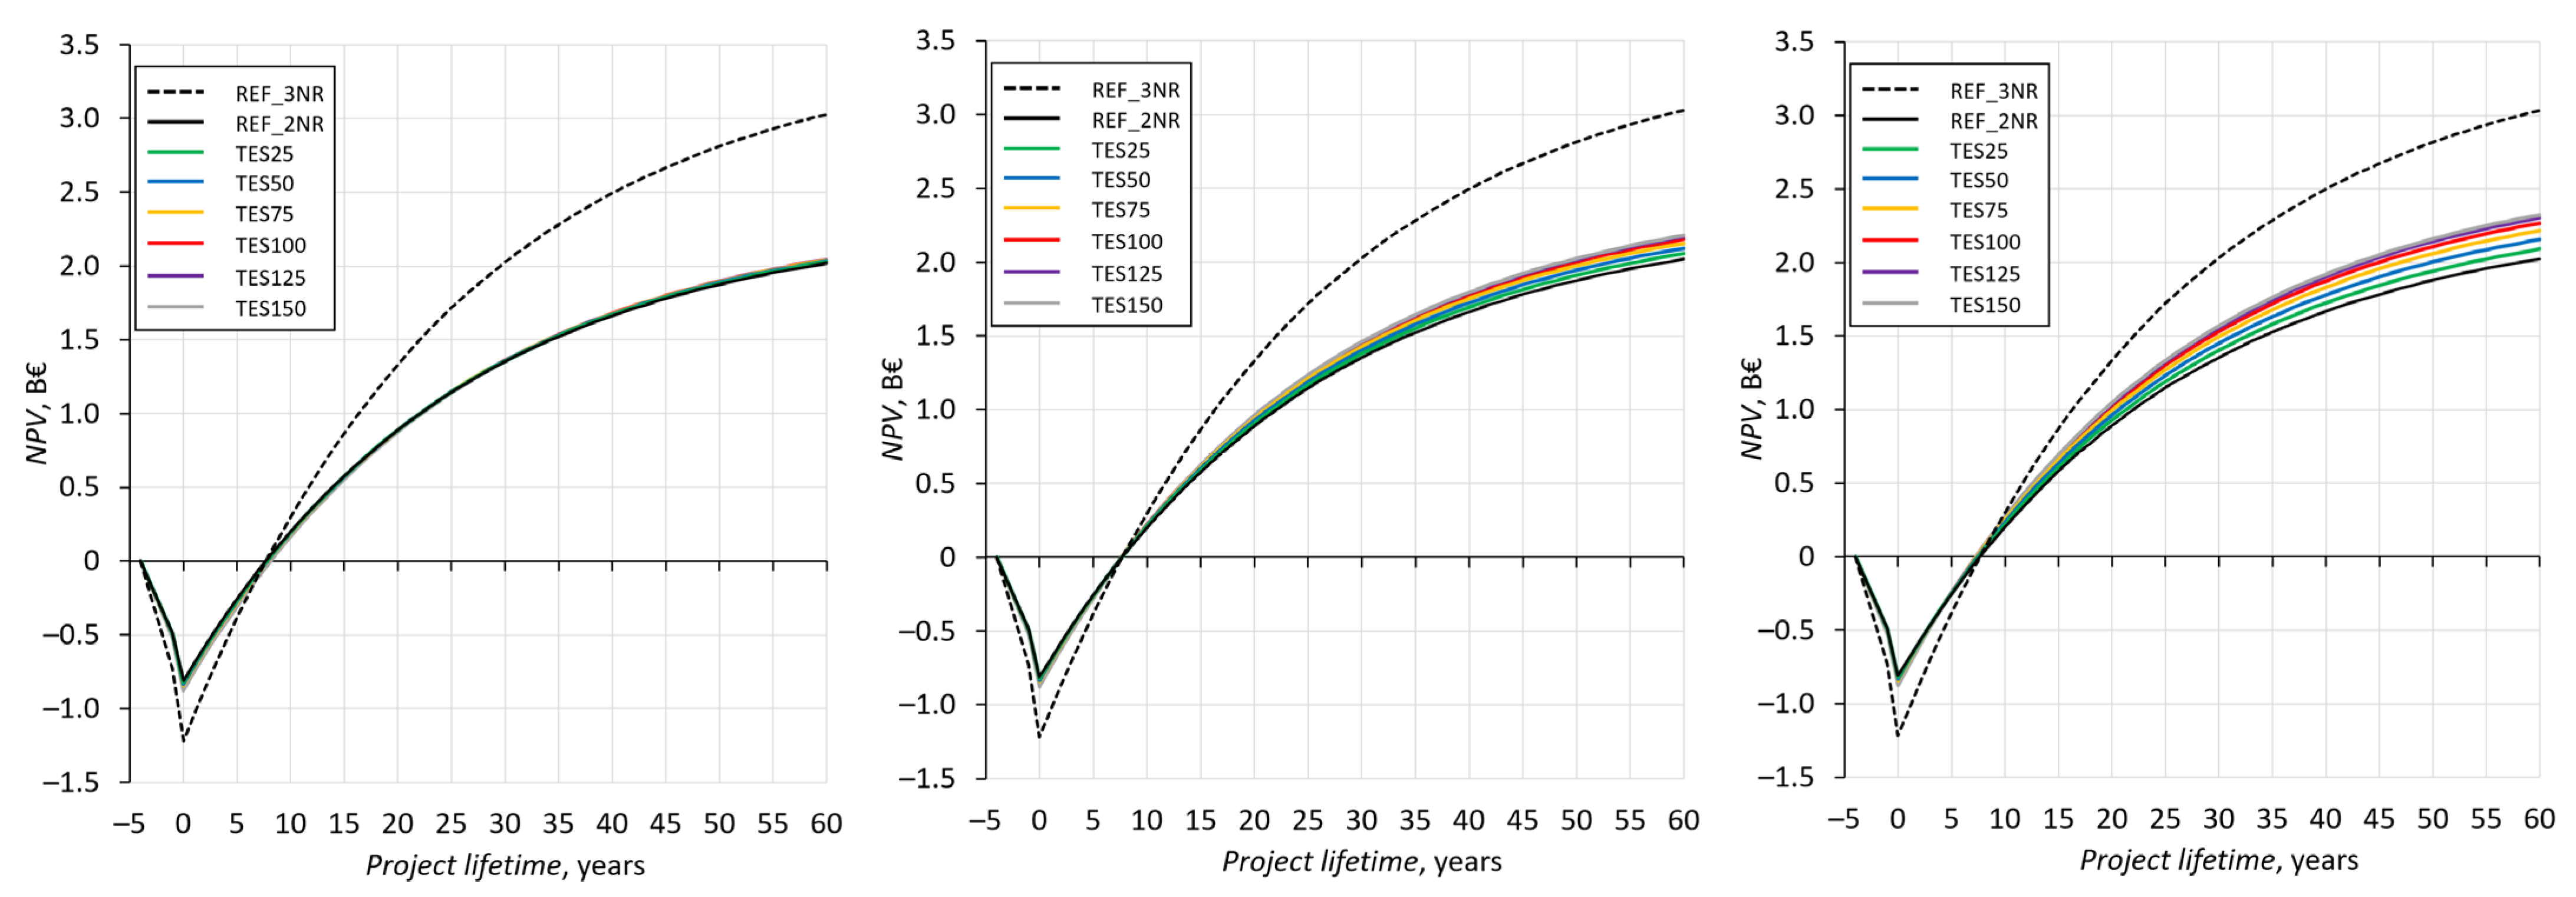
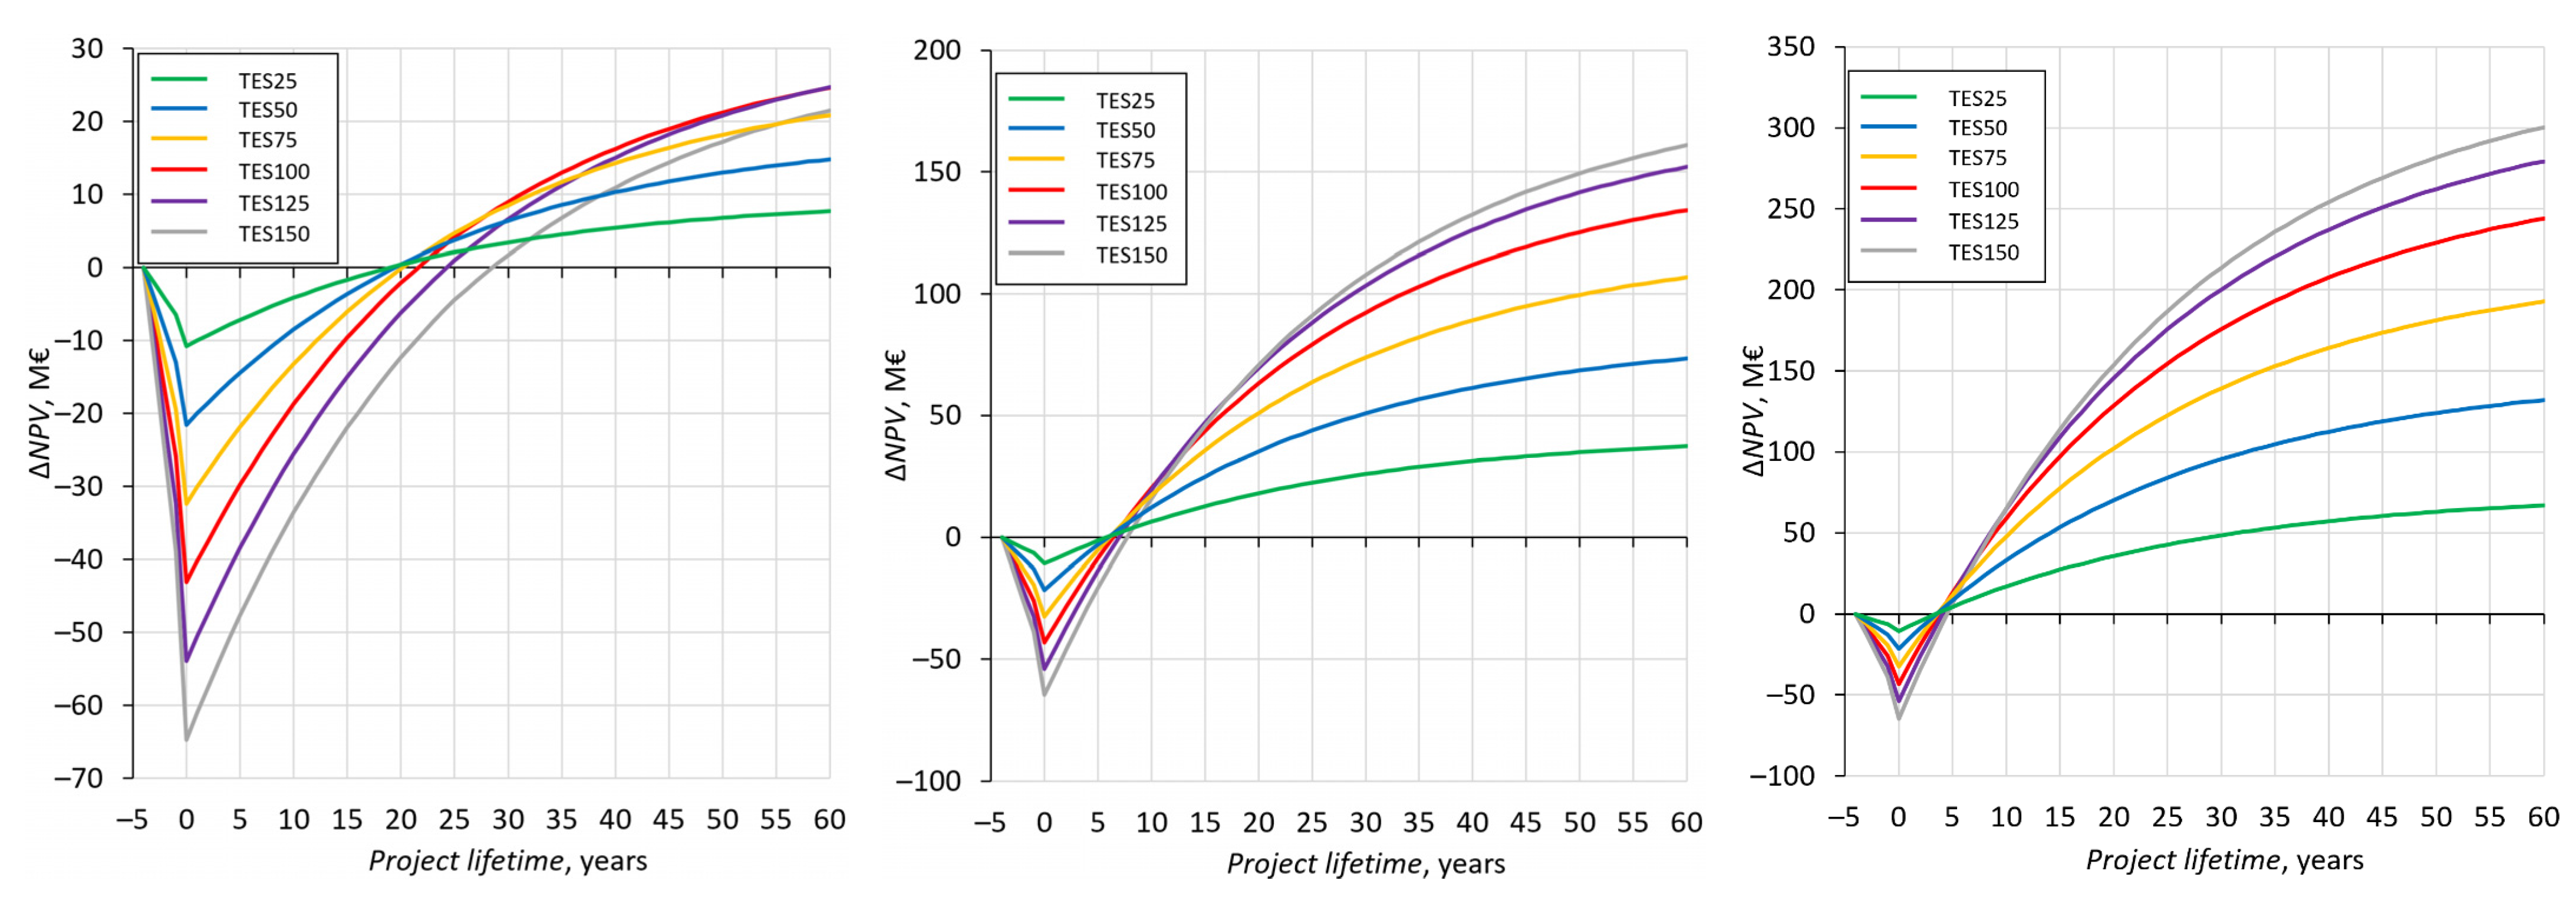
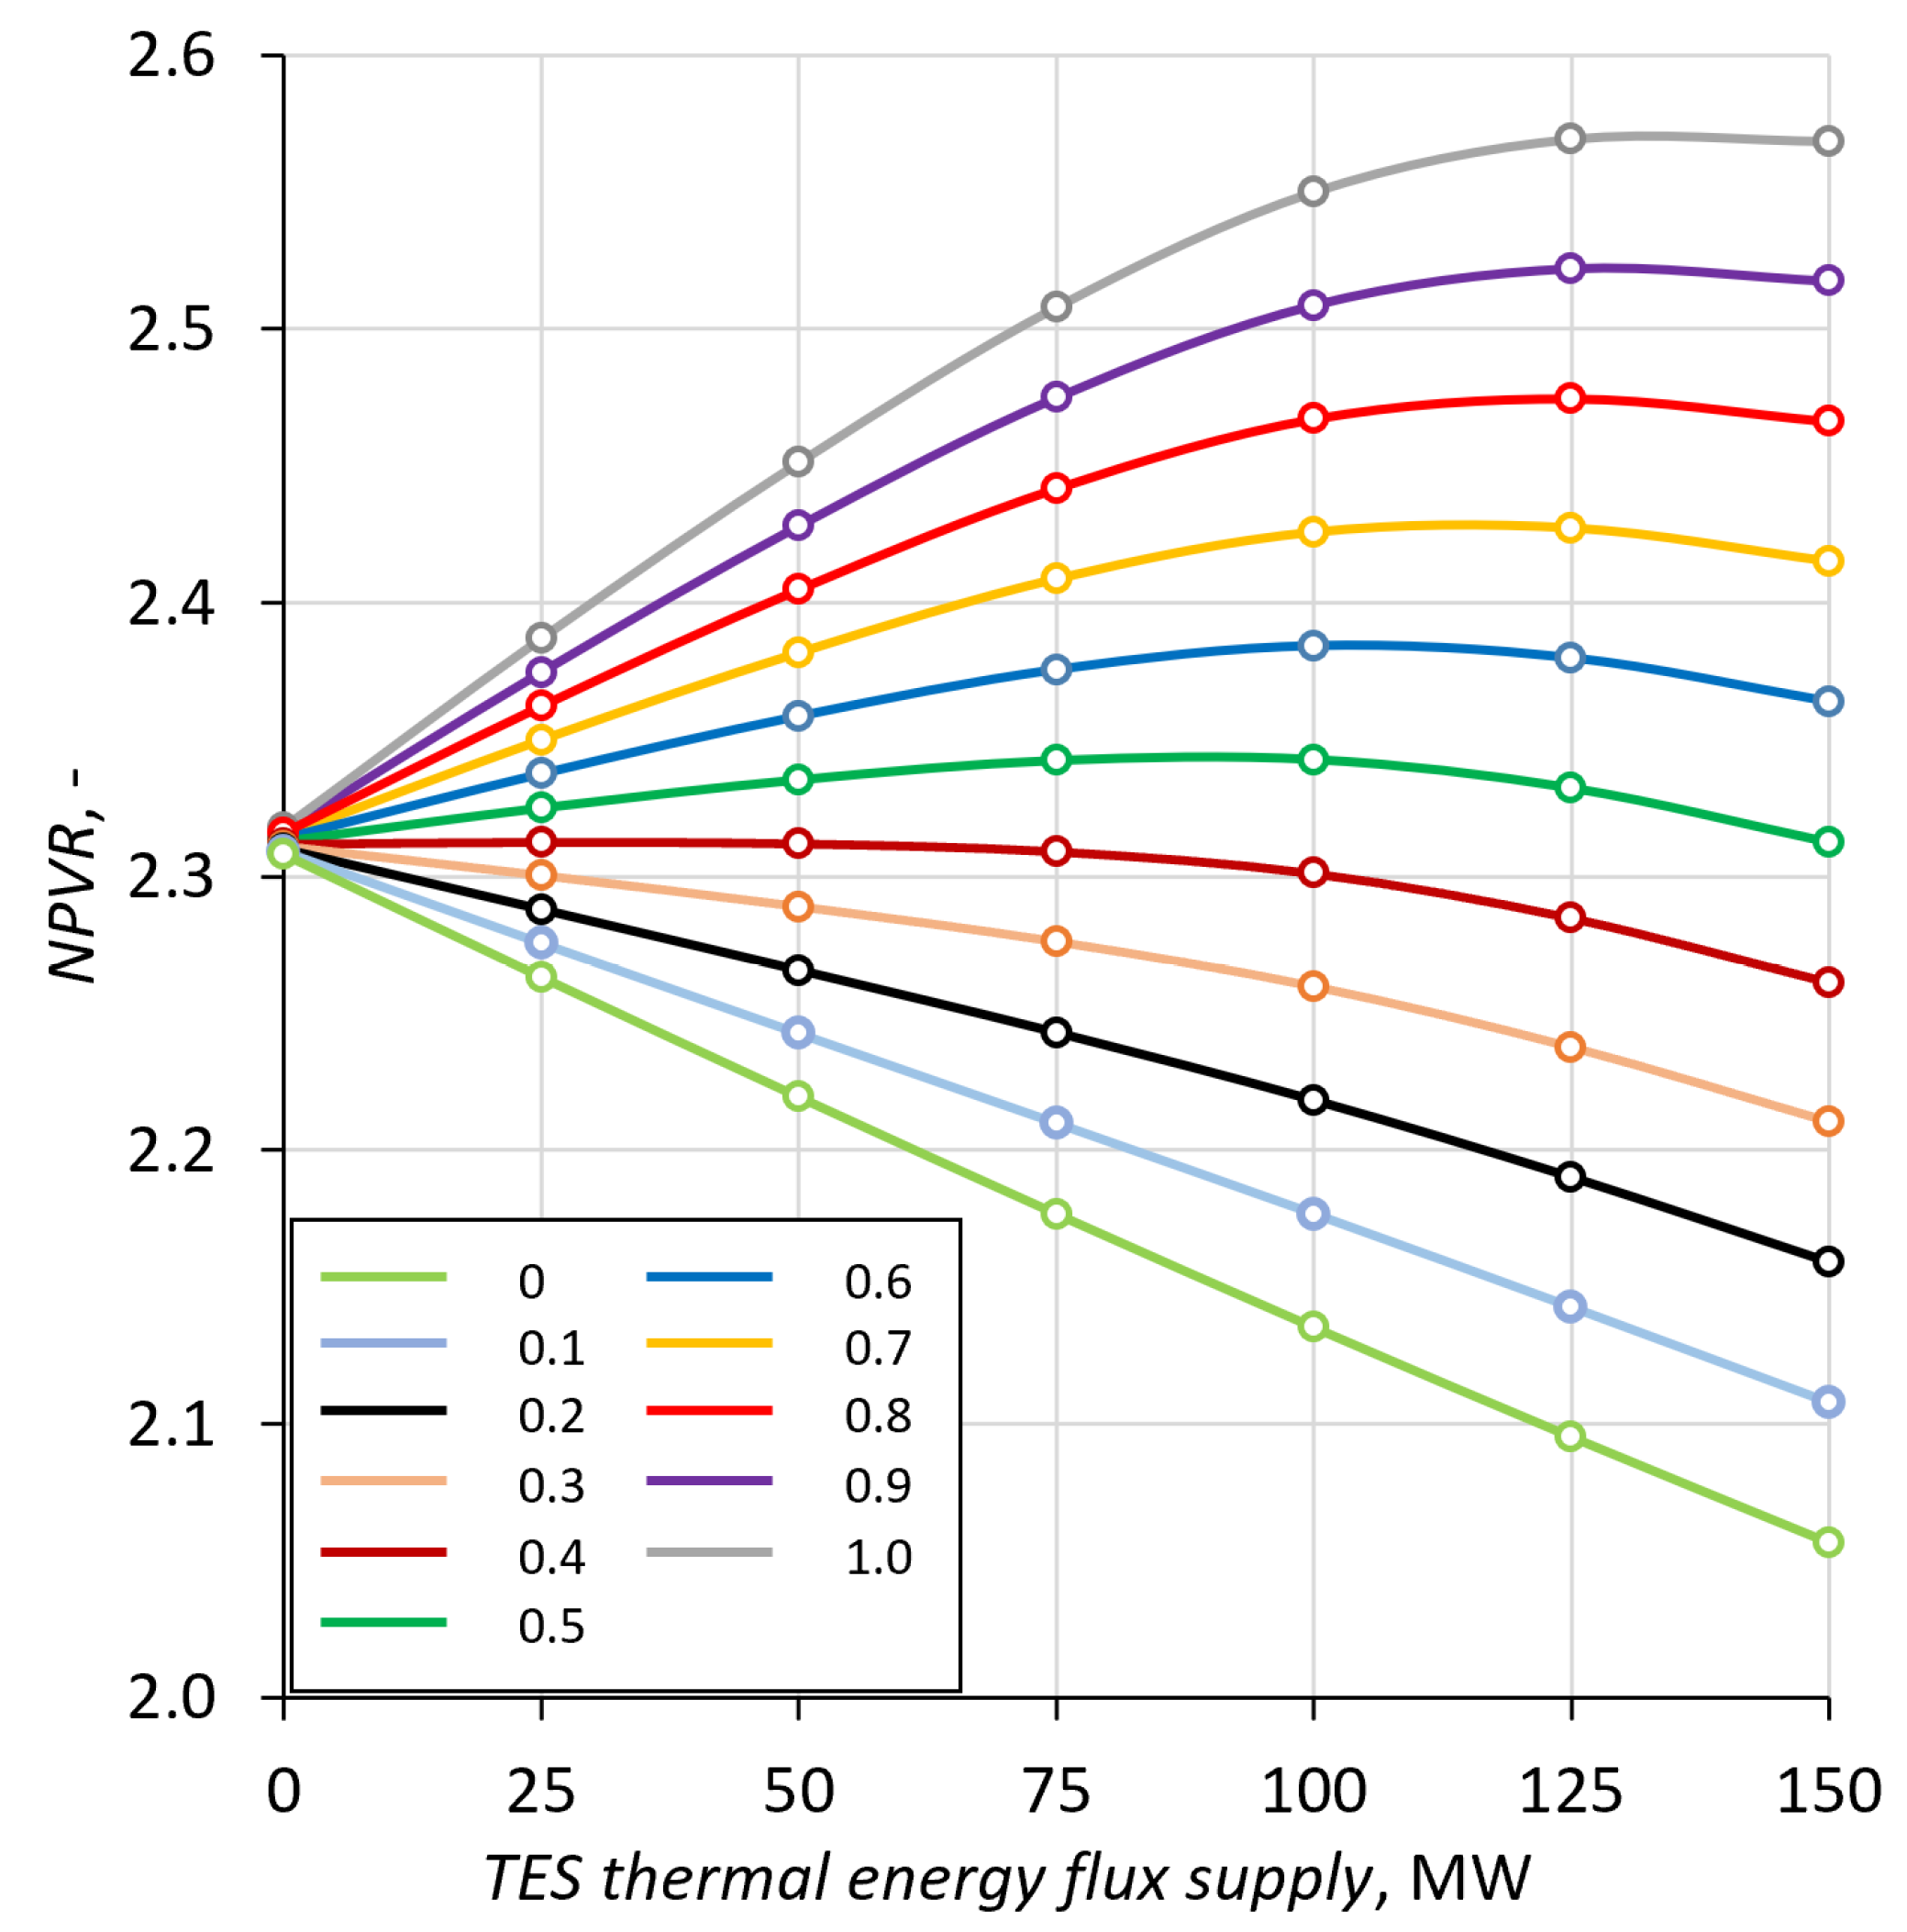
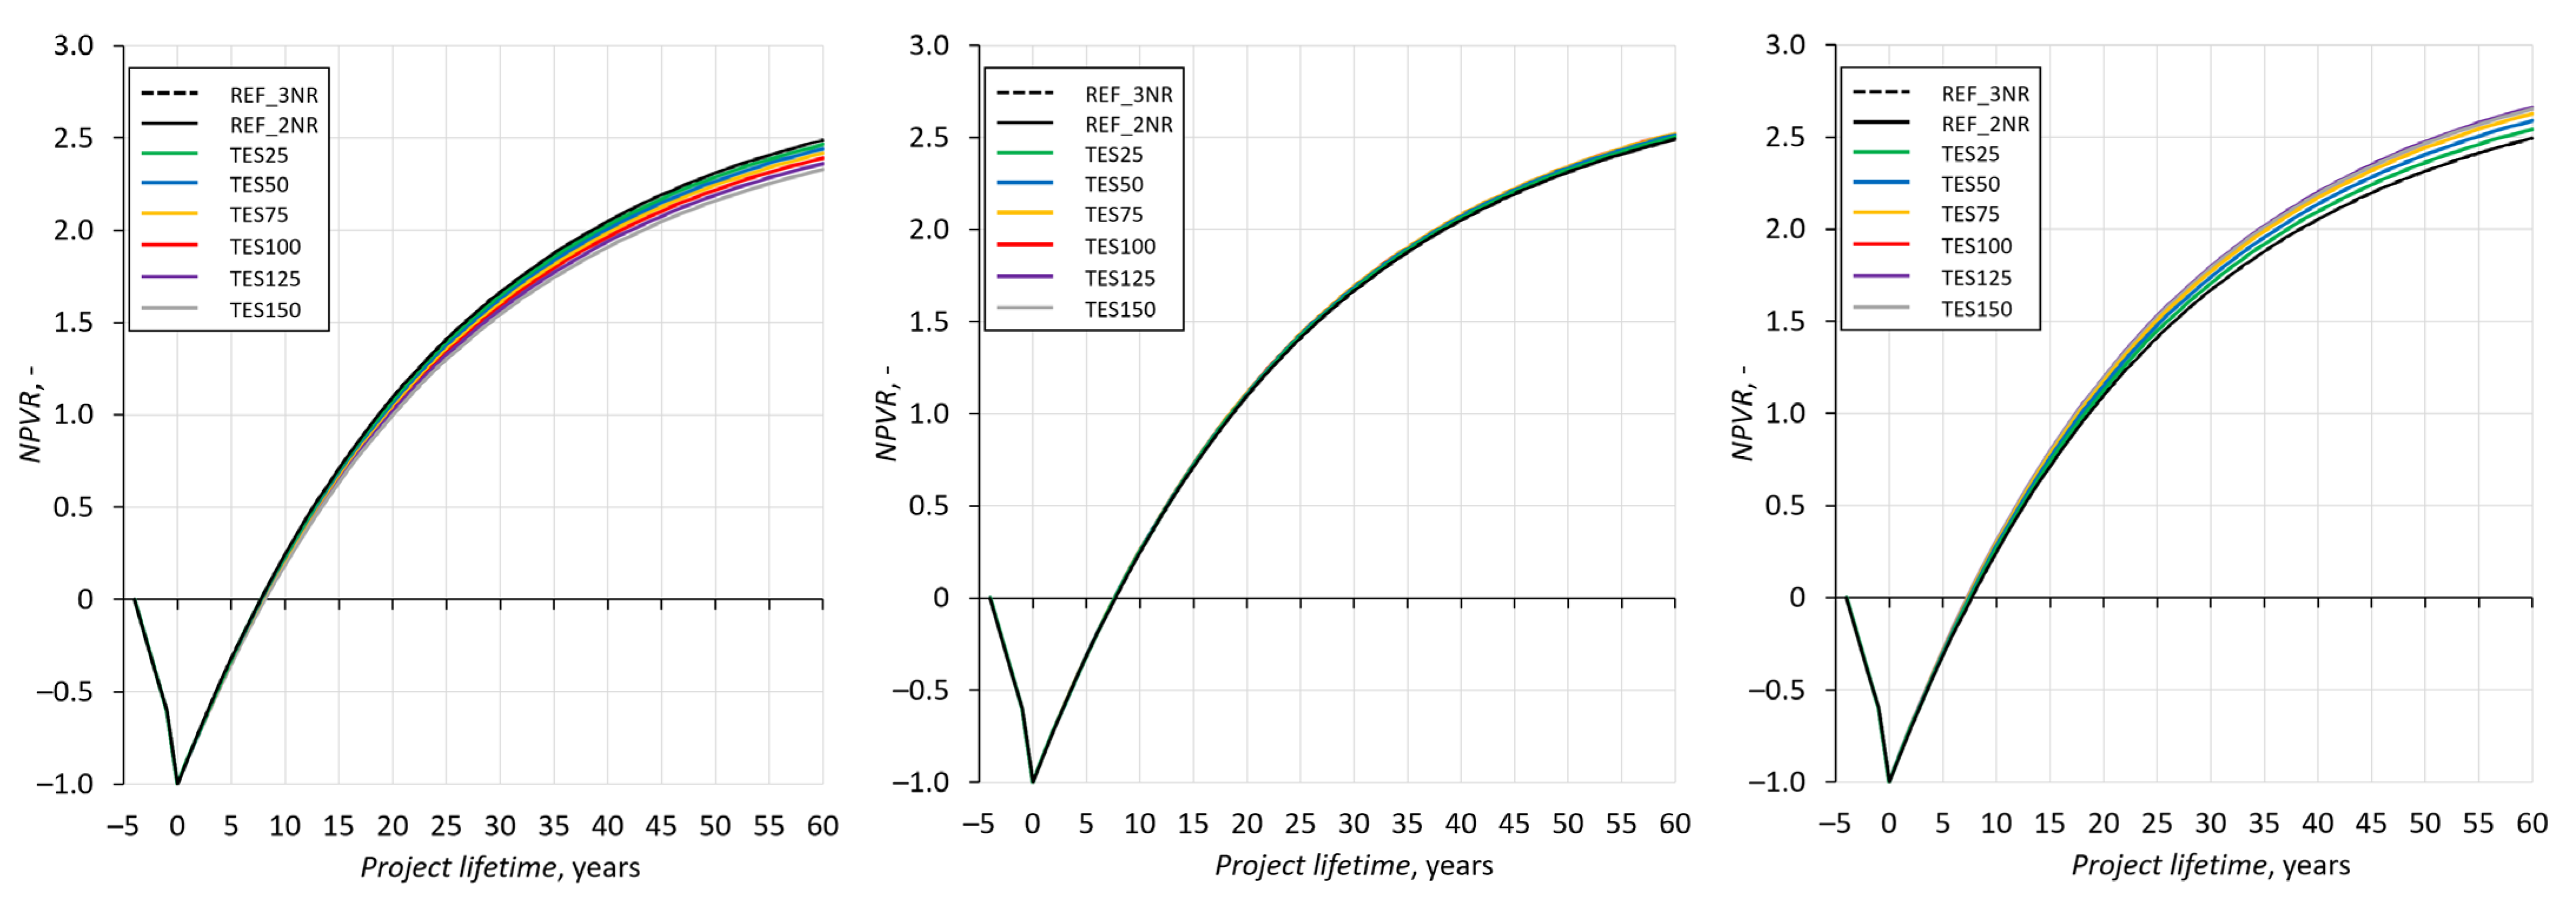
3. Results
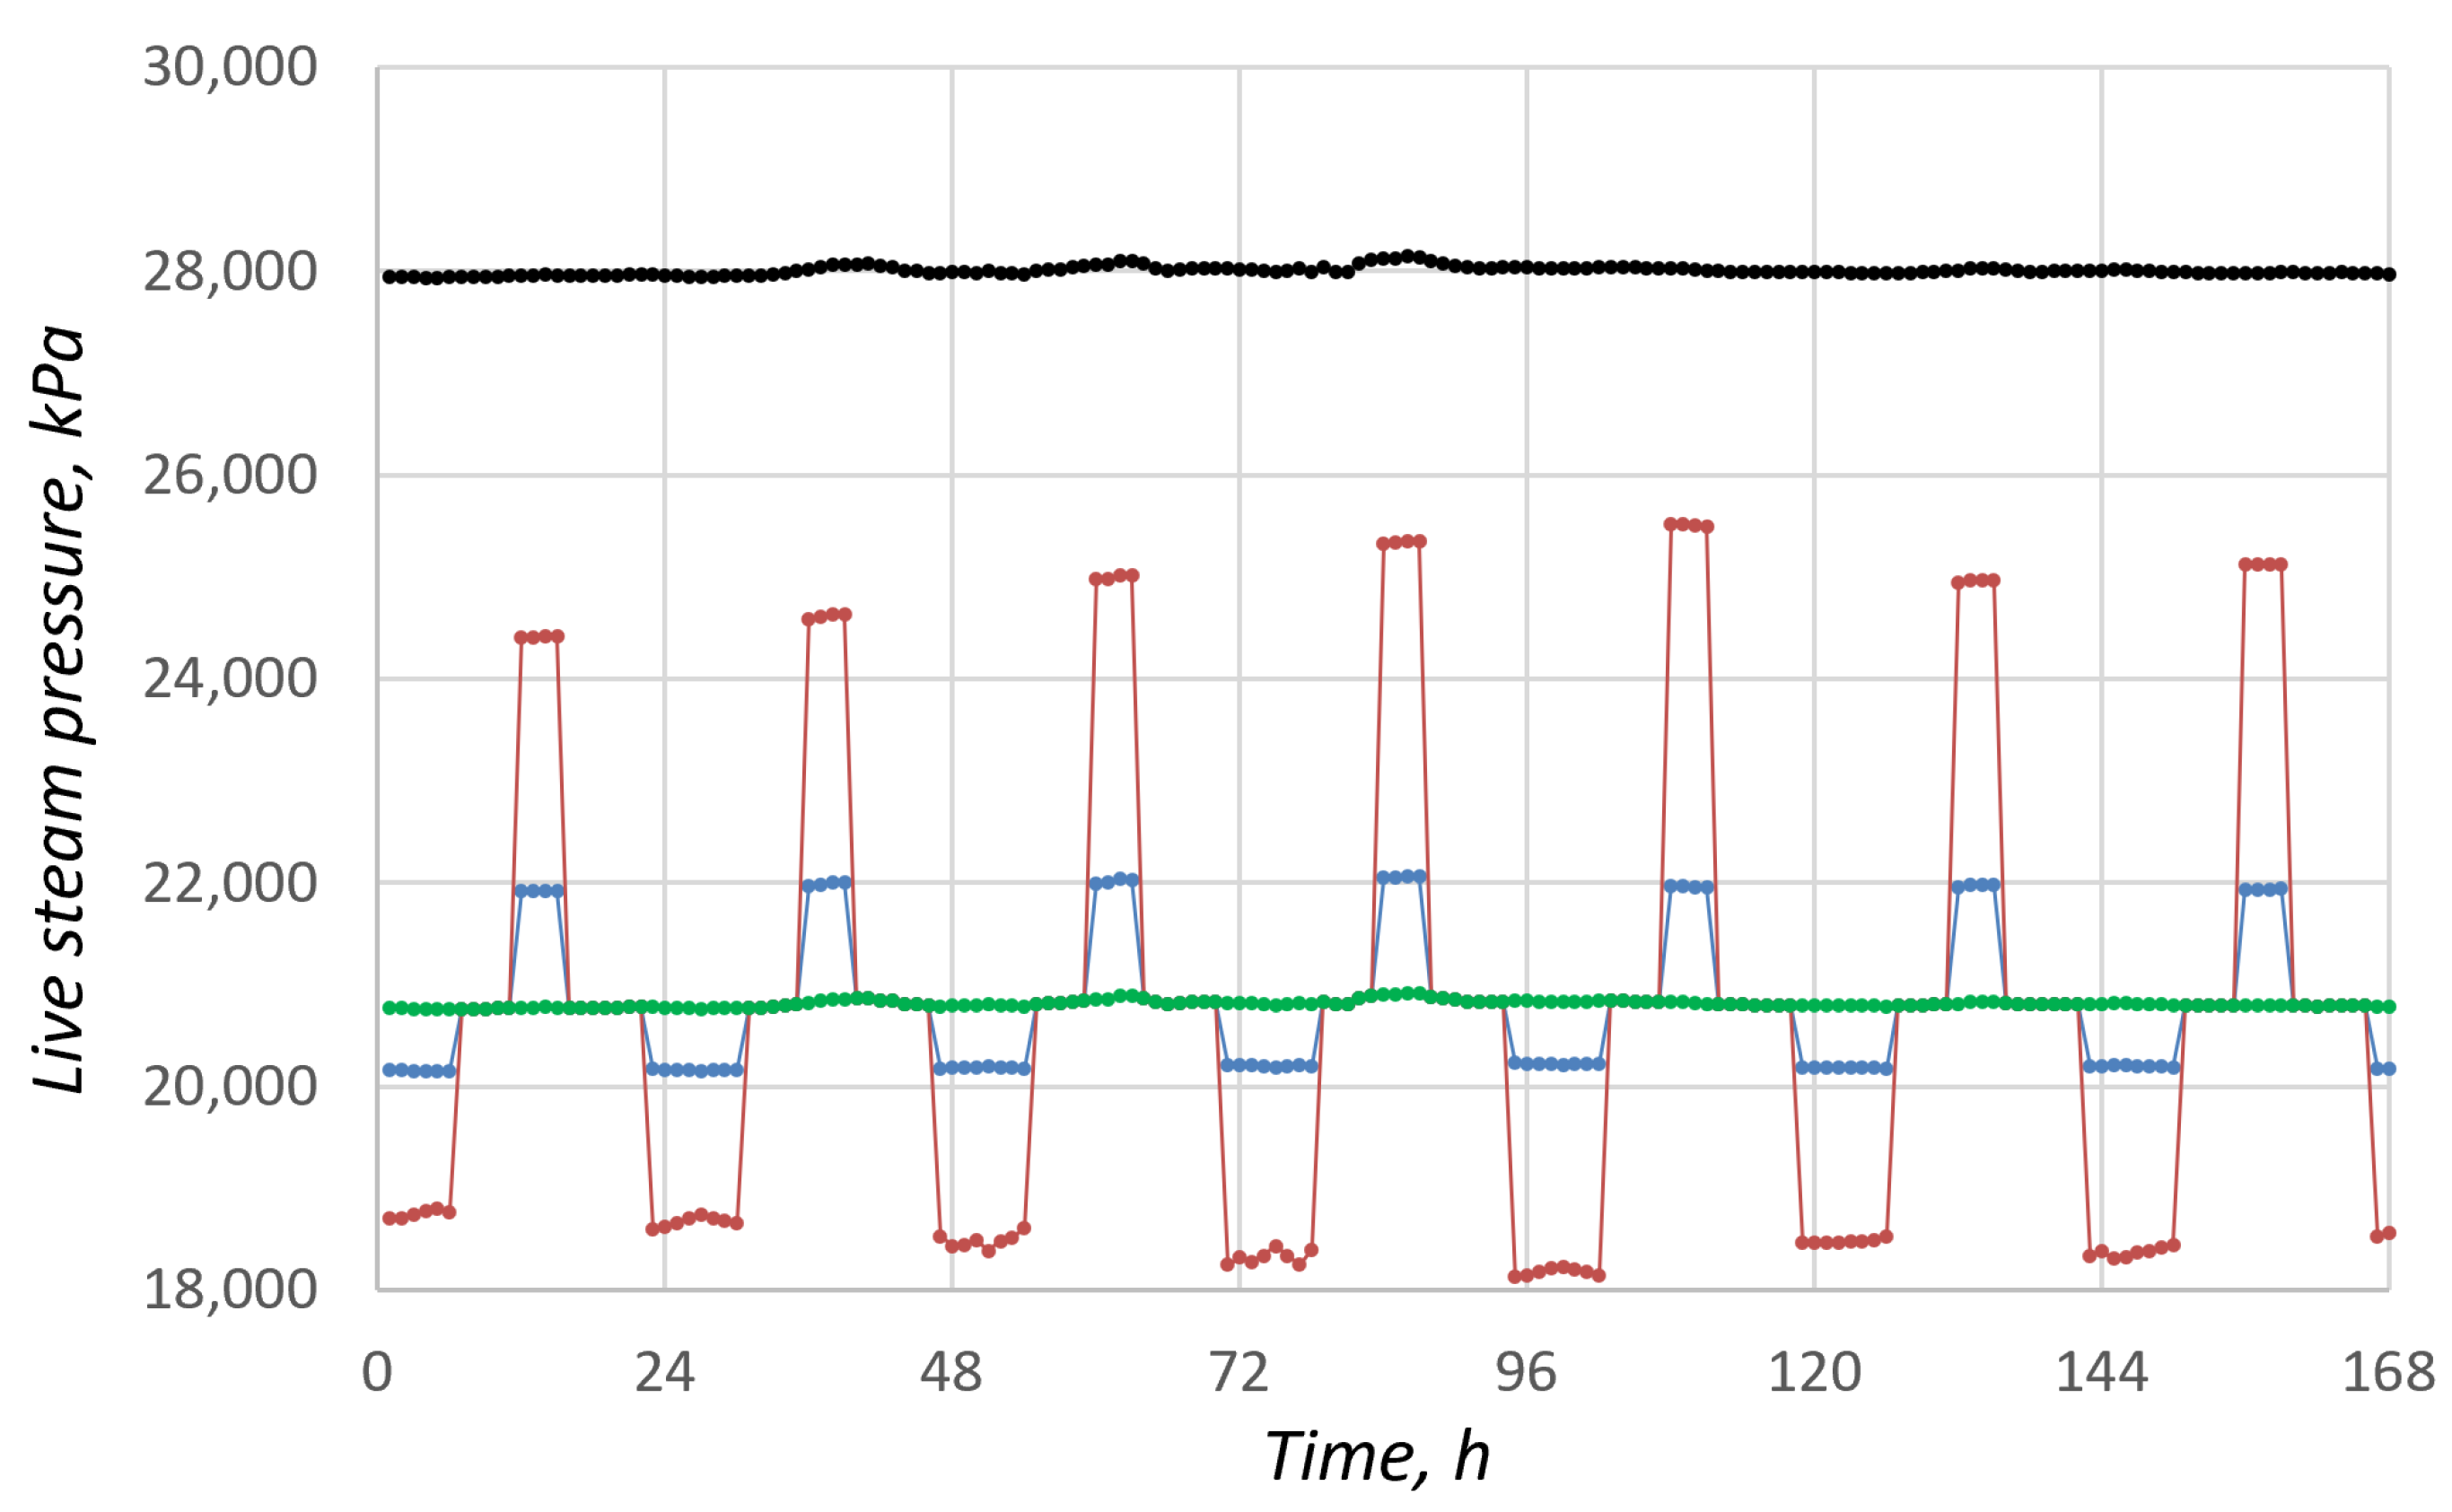
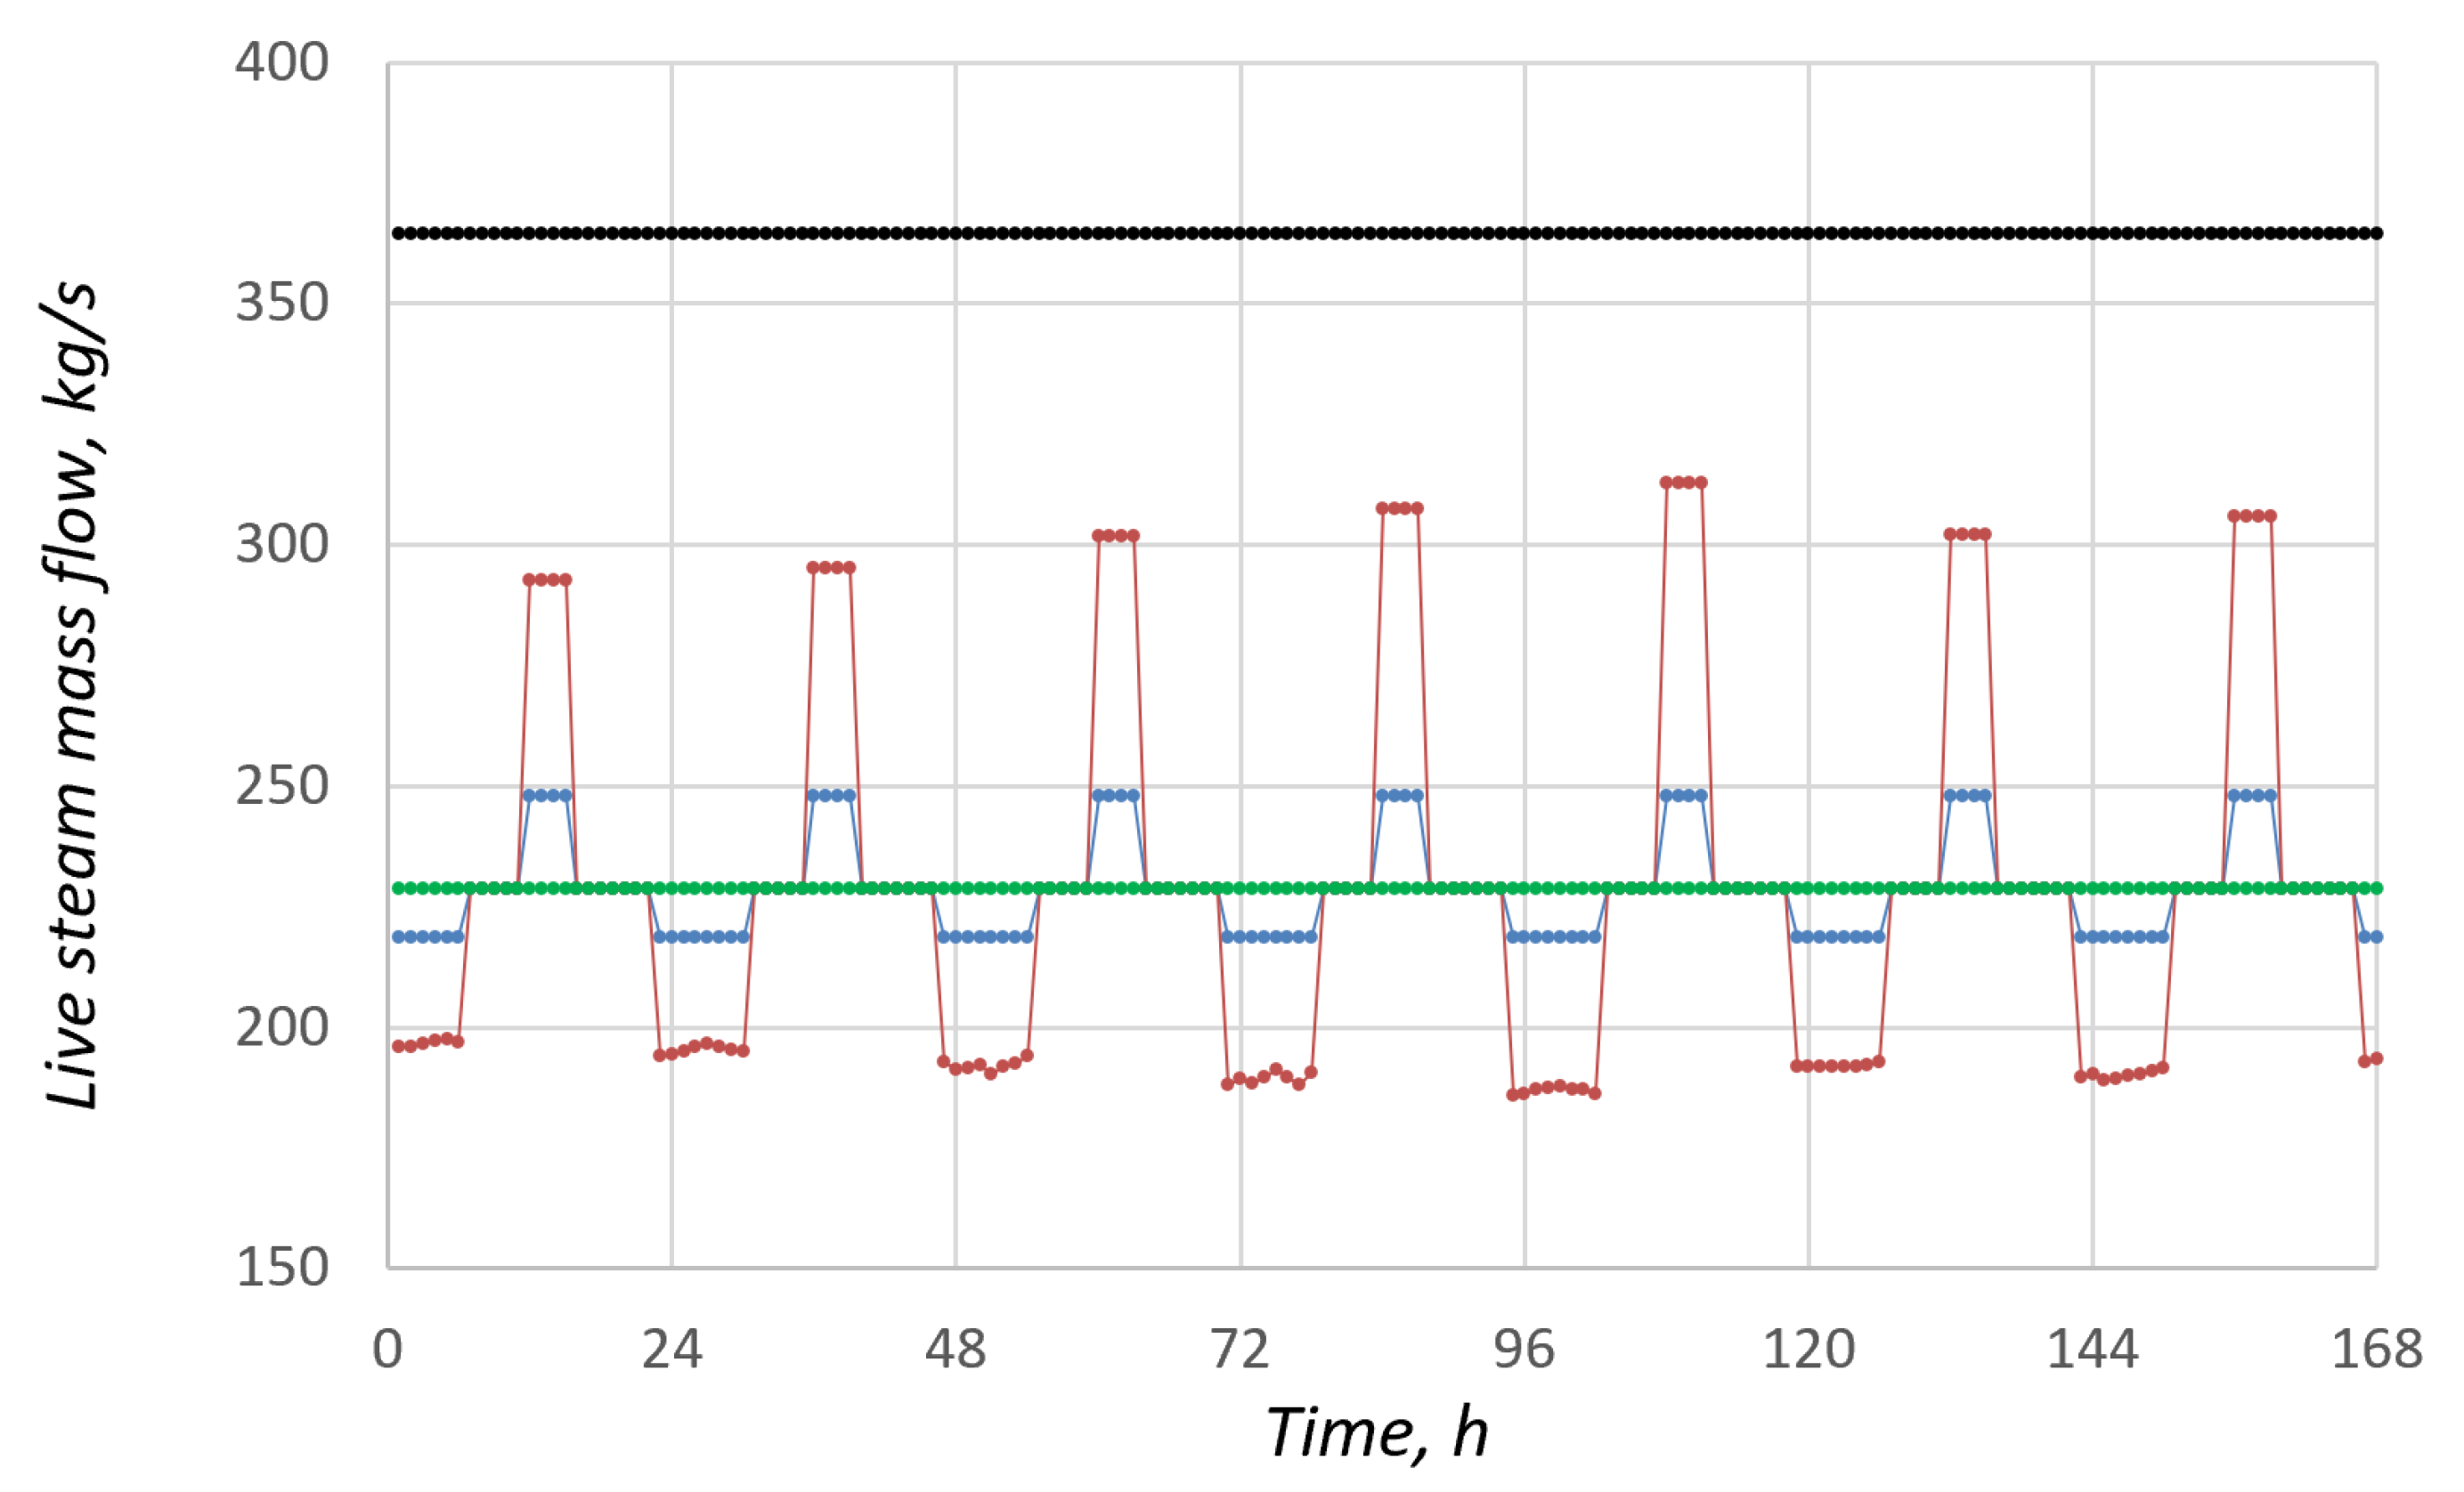
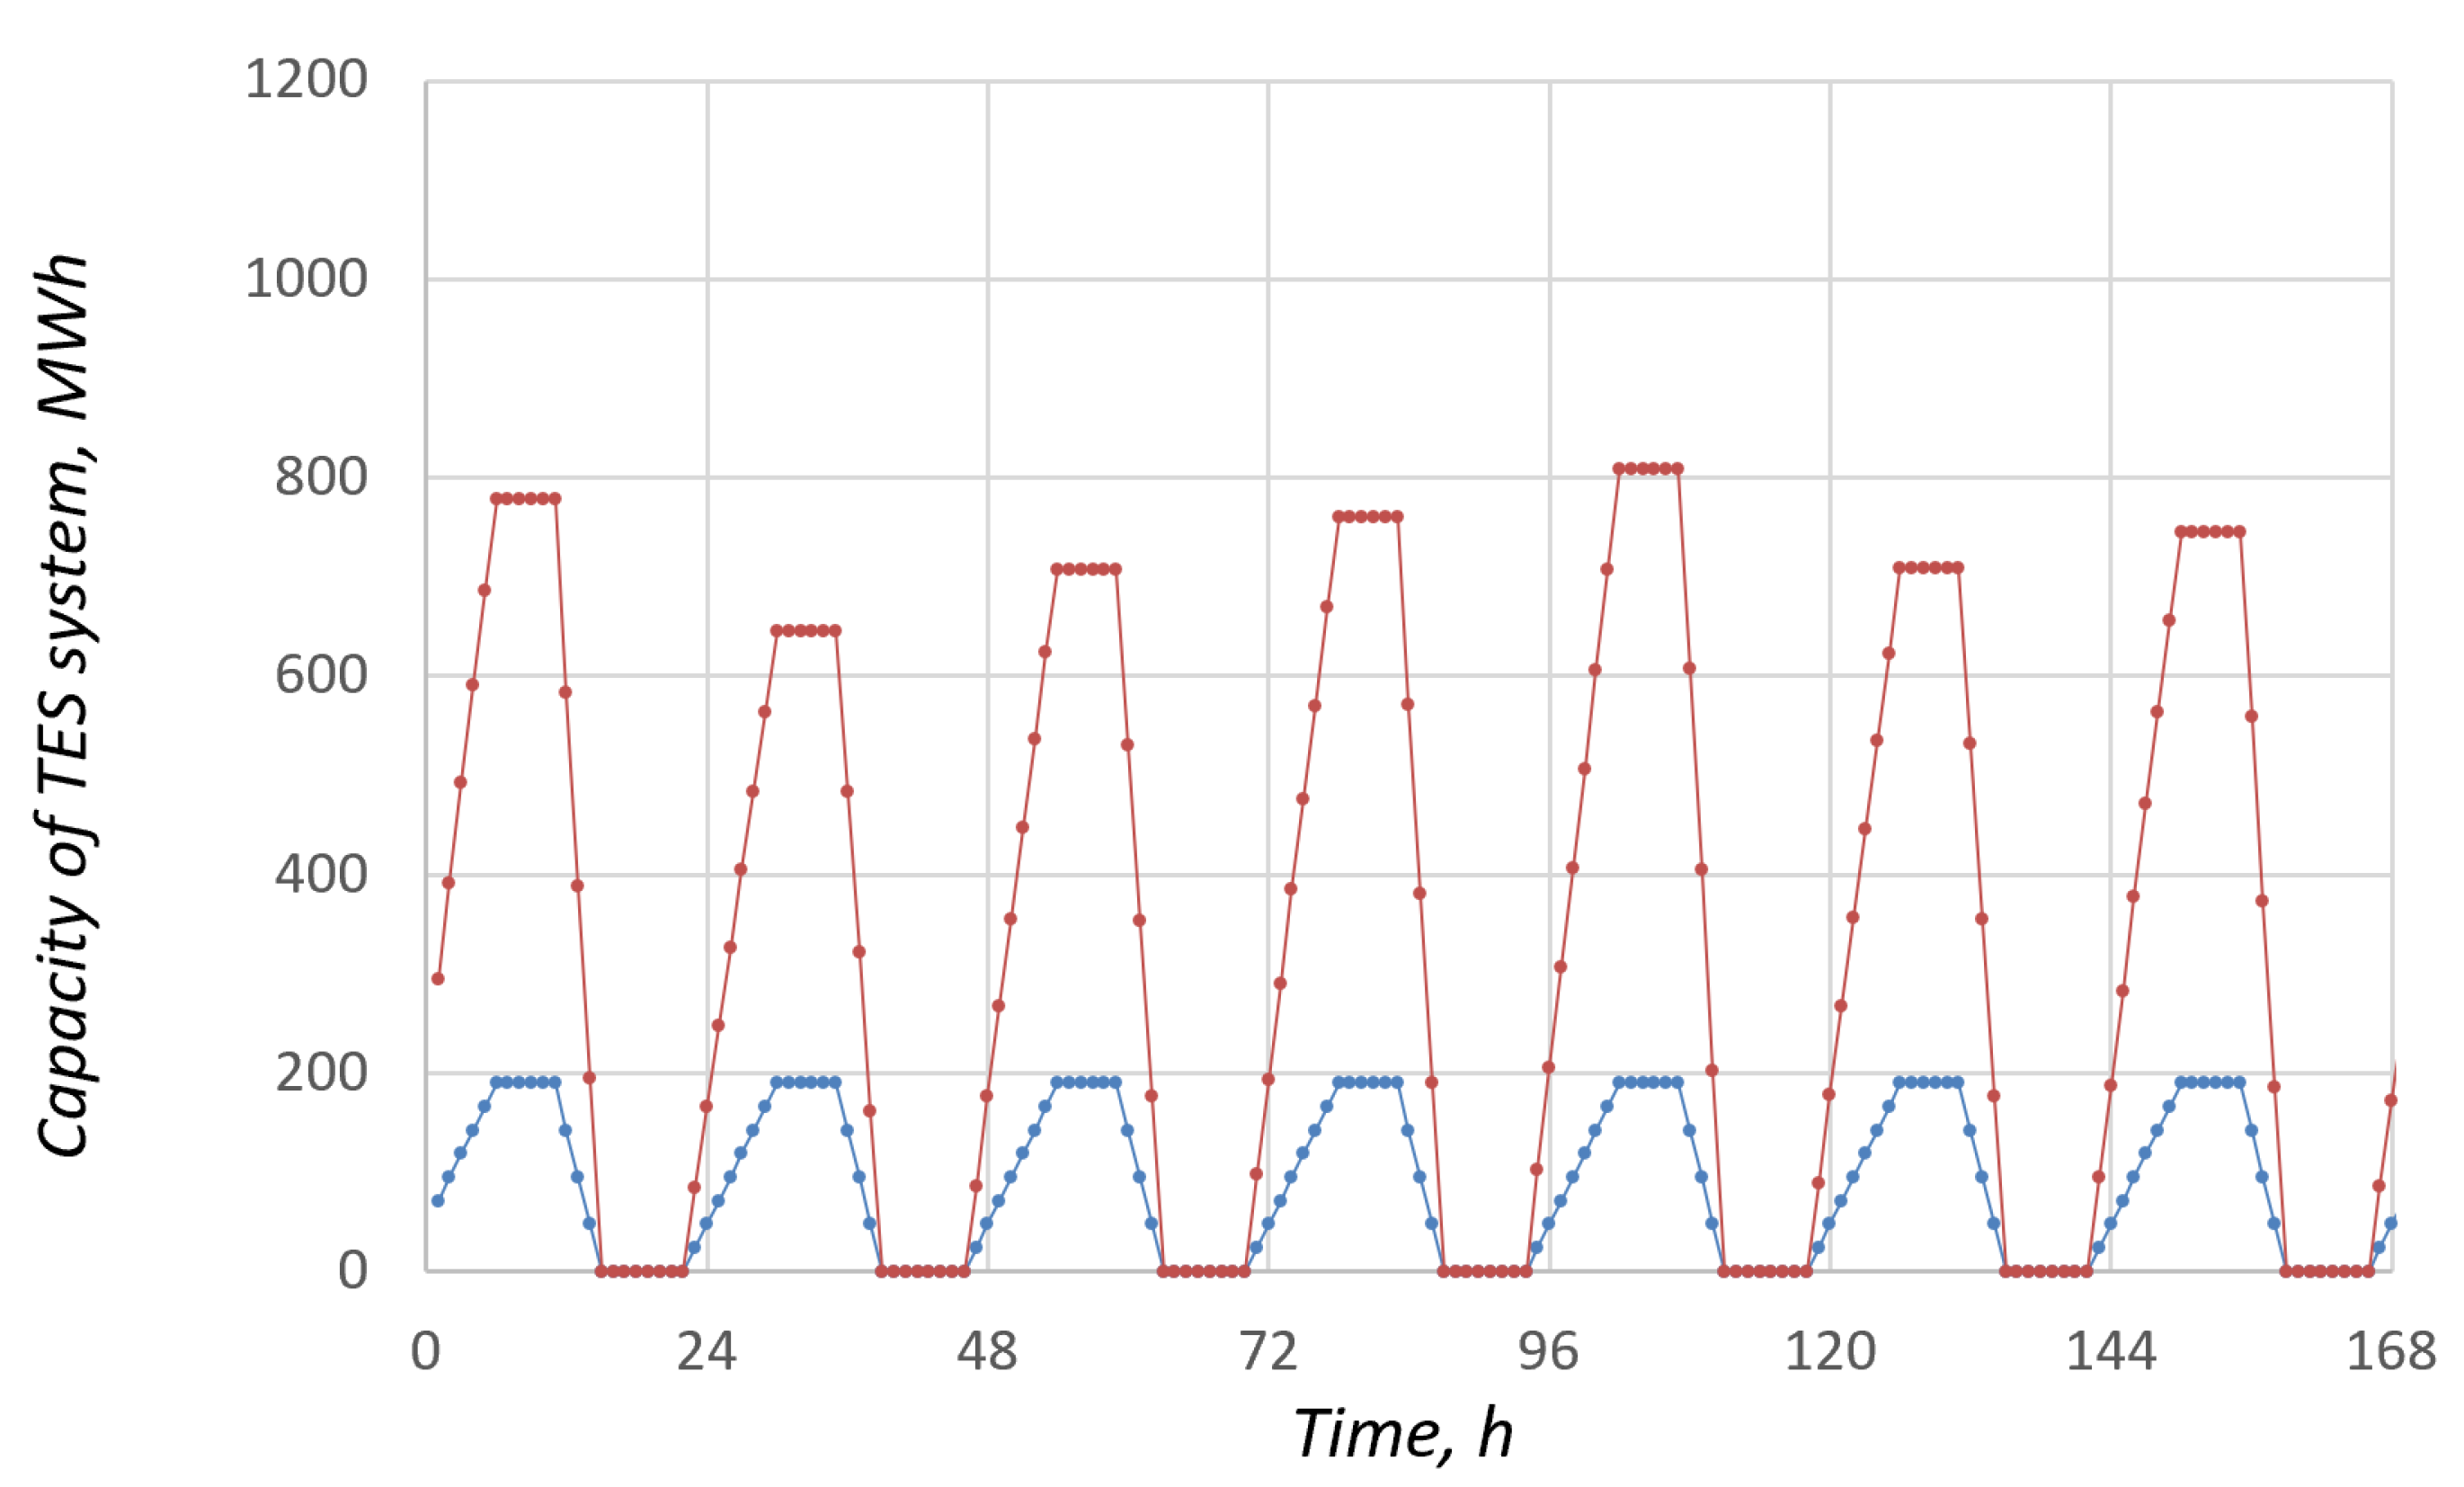
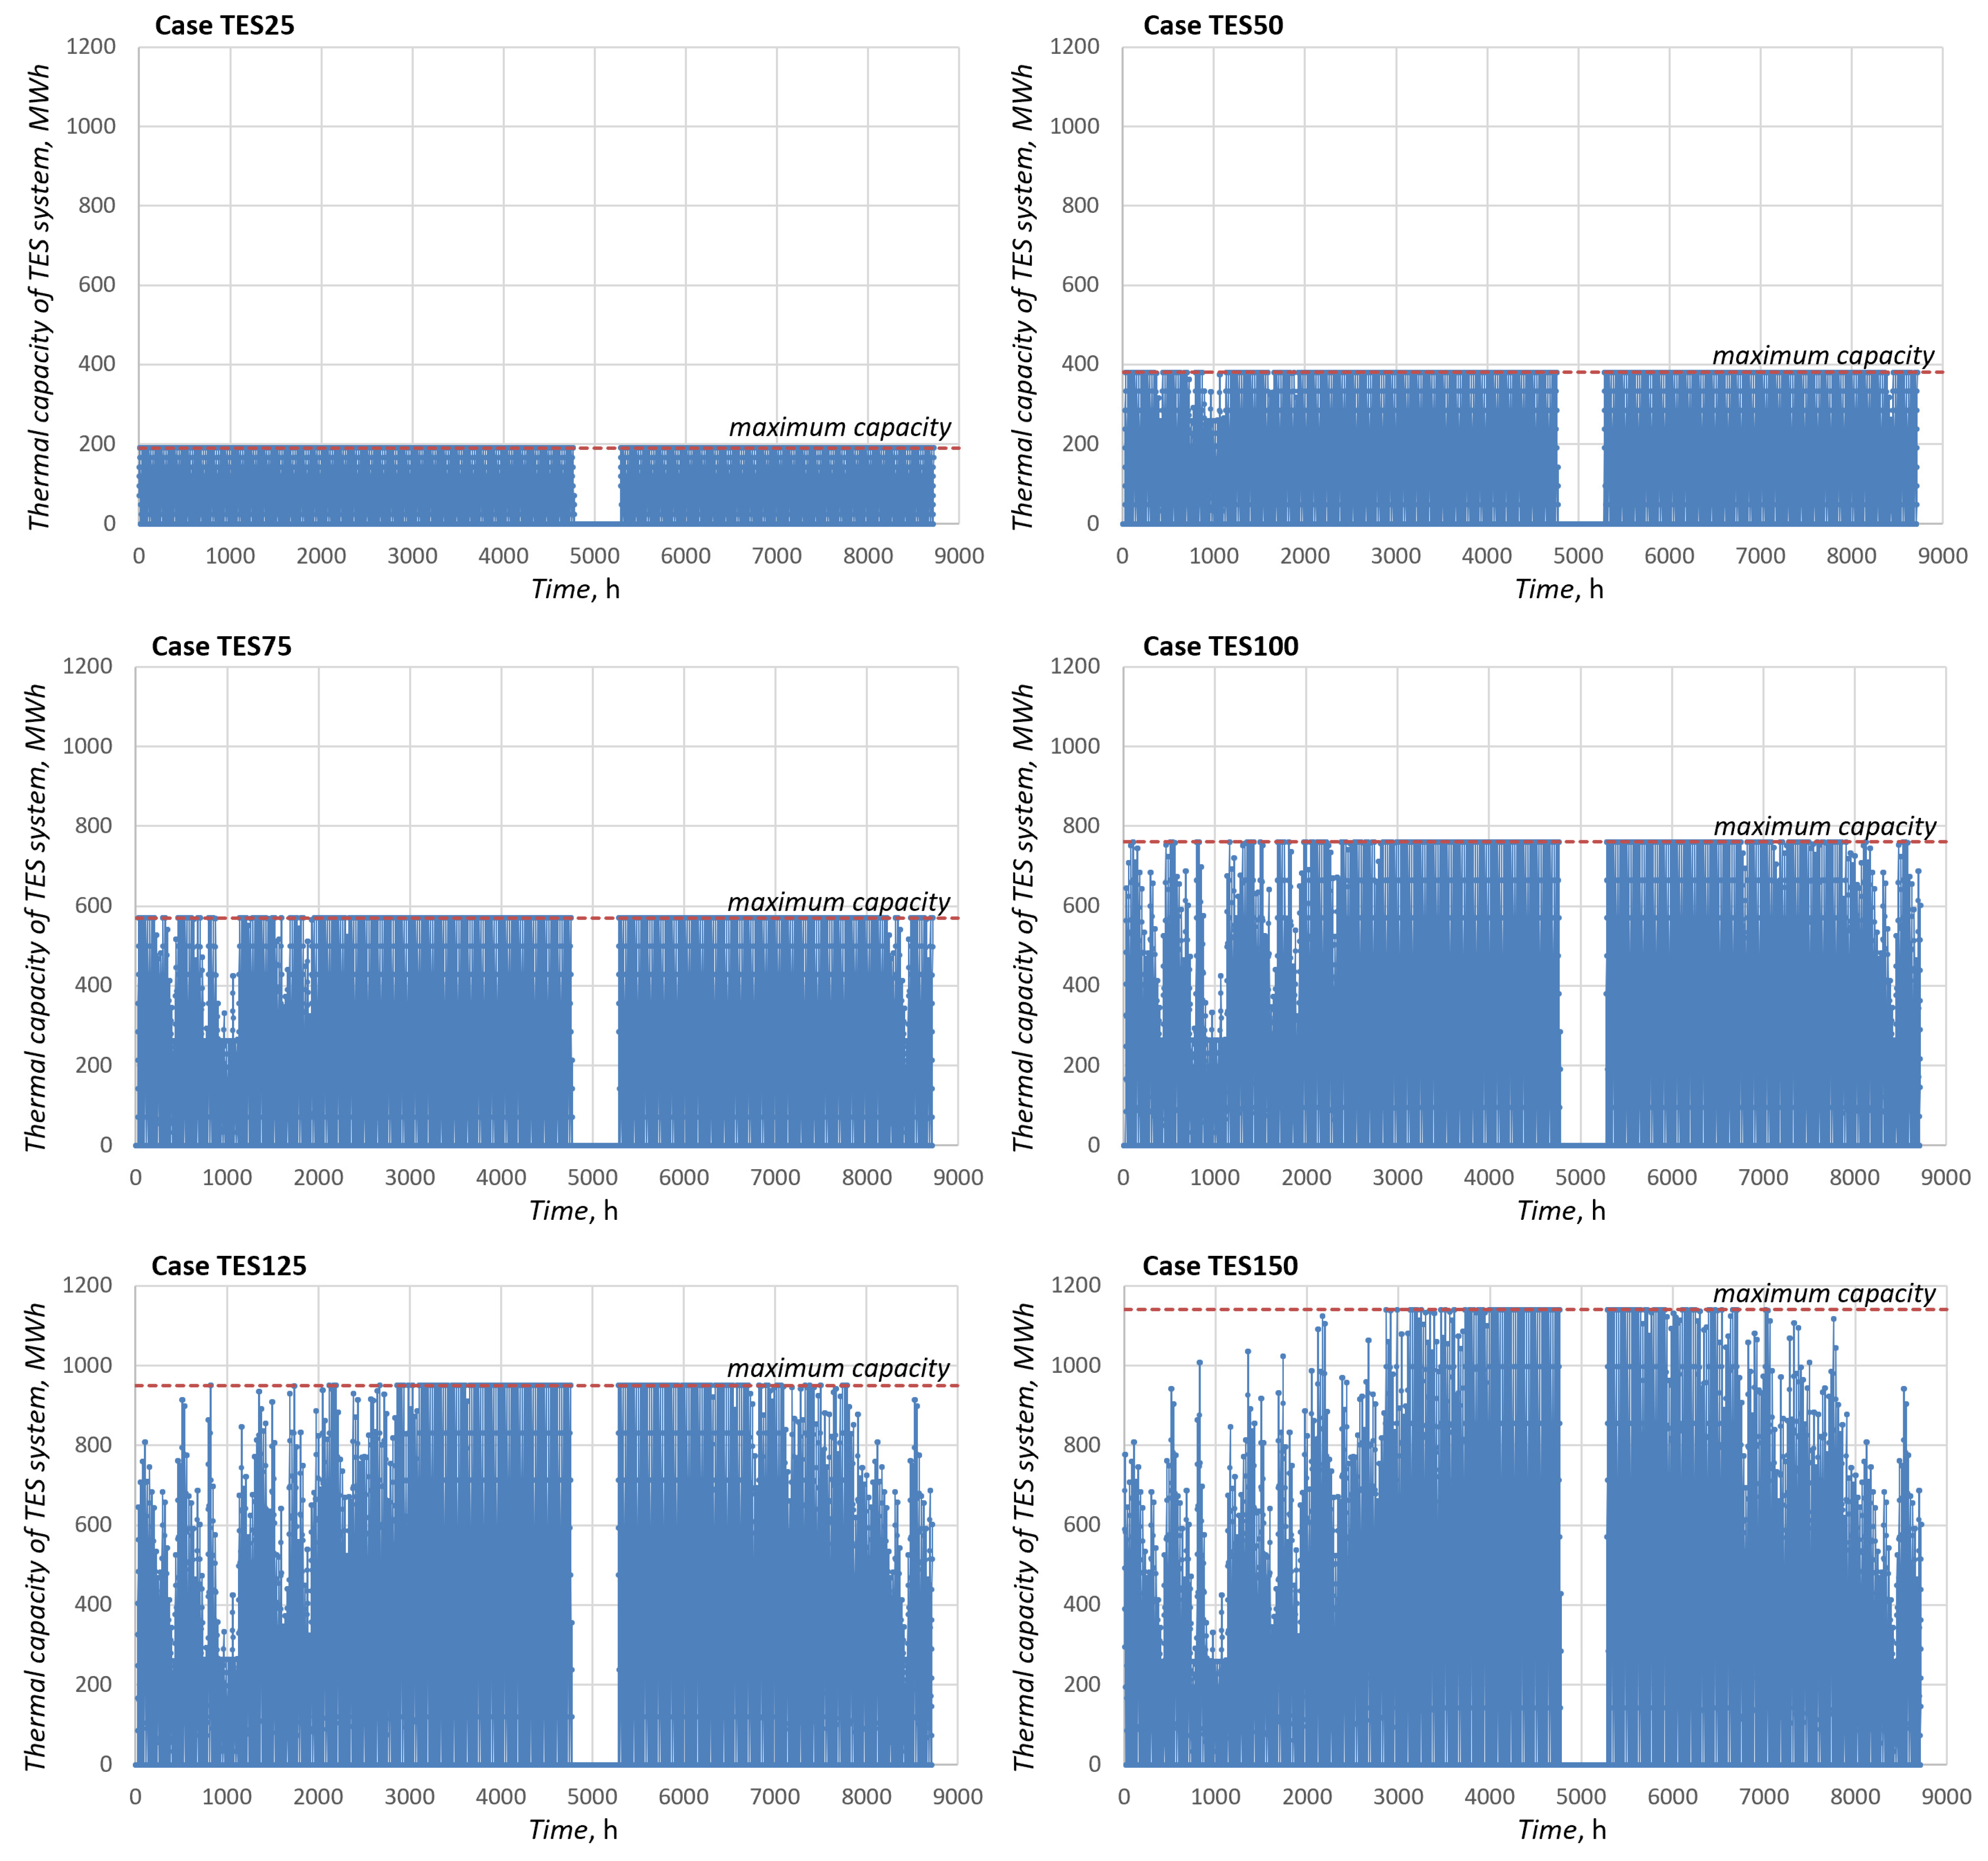
3.1. Technical and Energy Performance Assessment Results
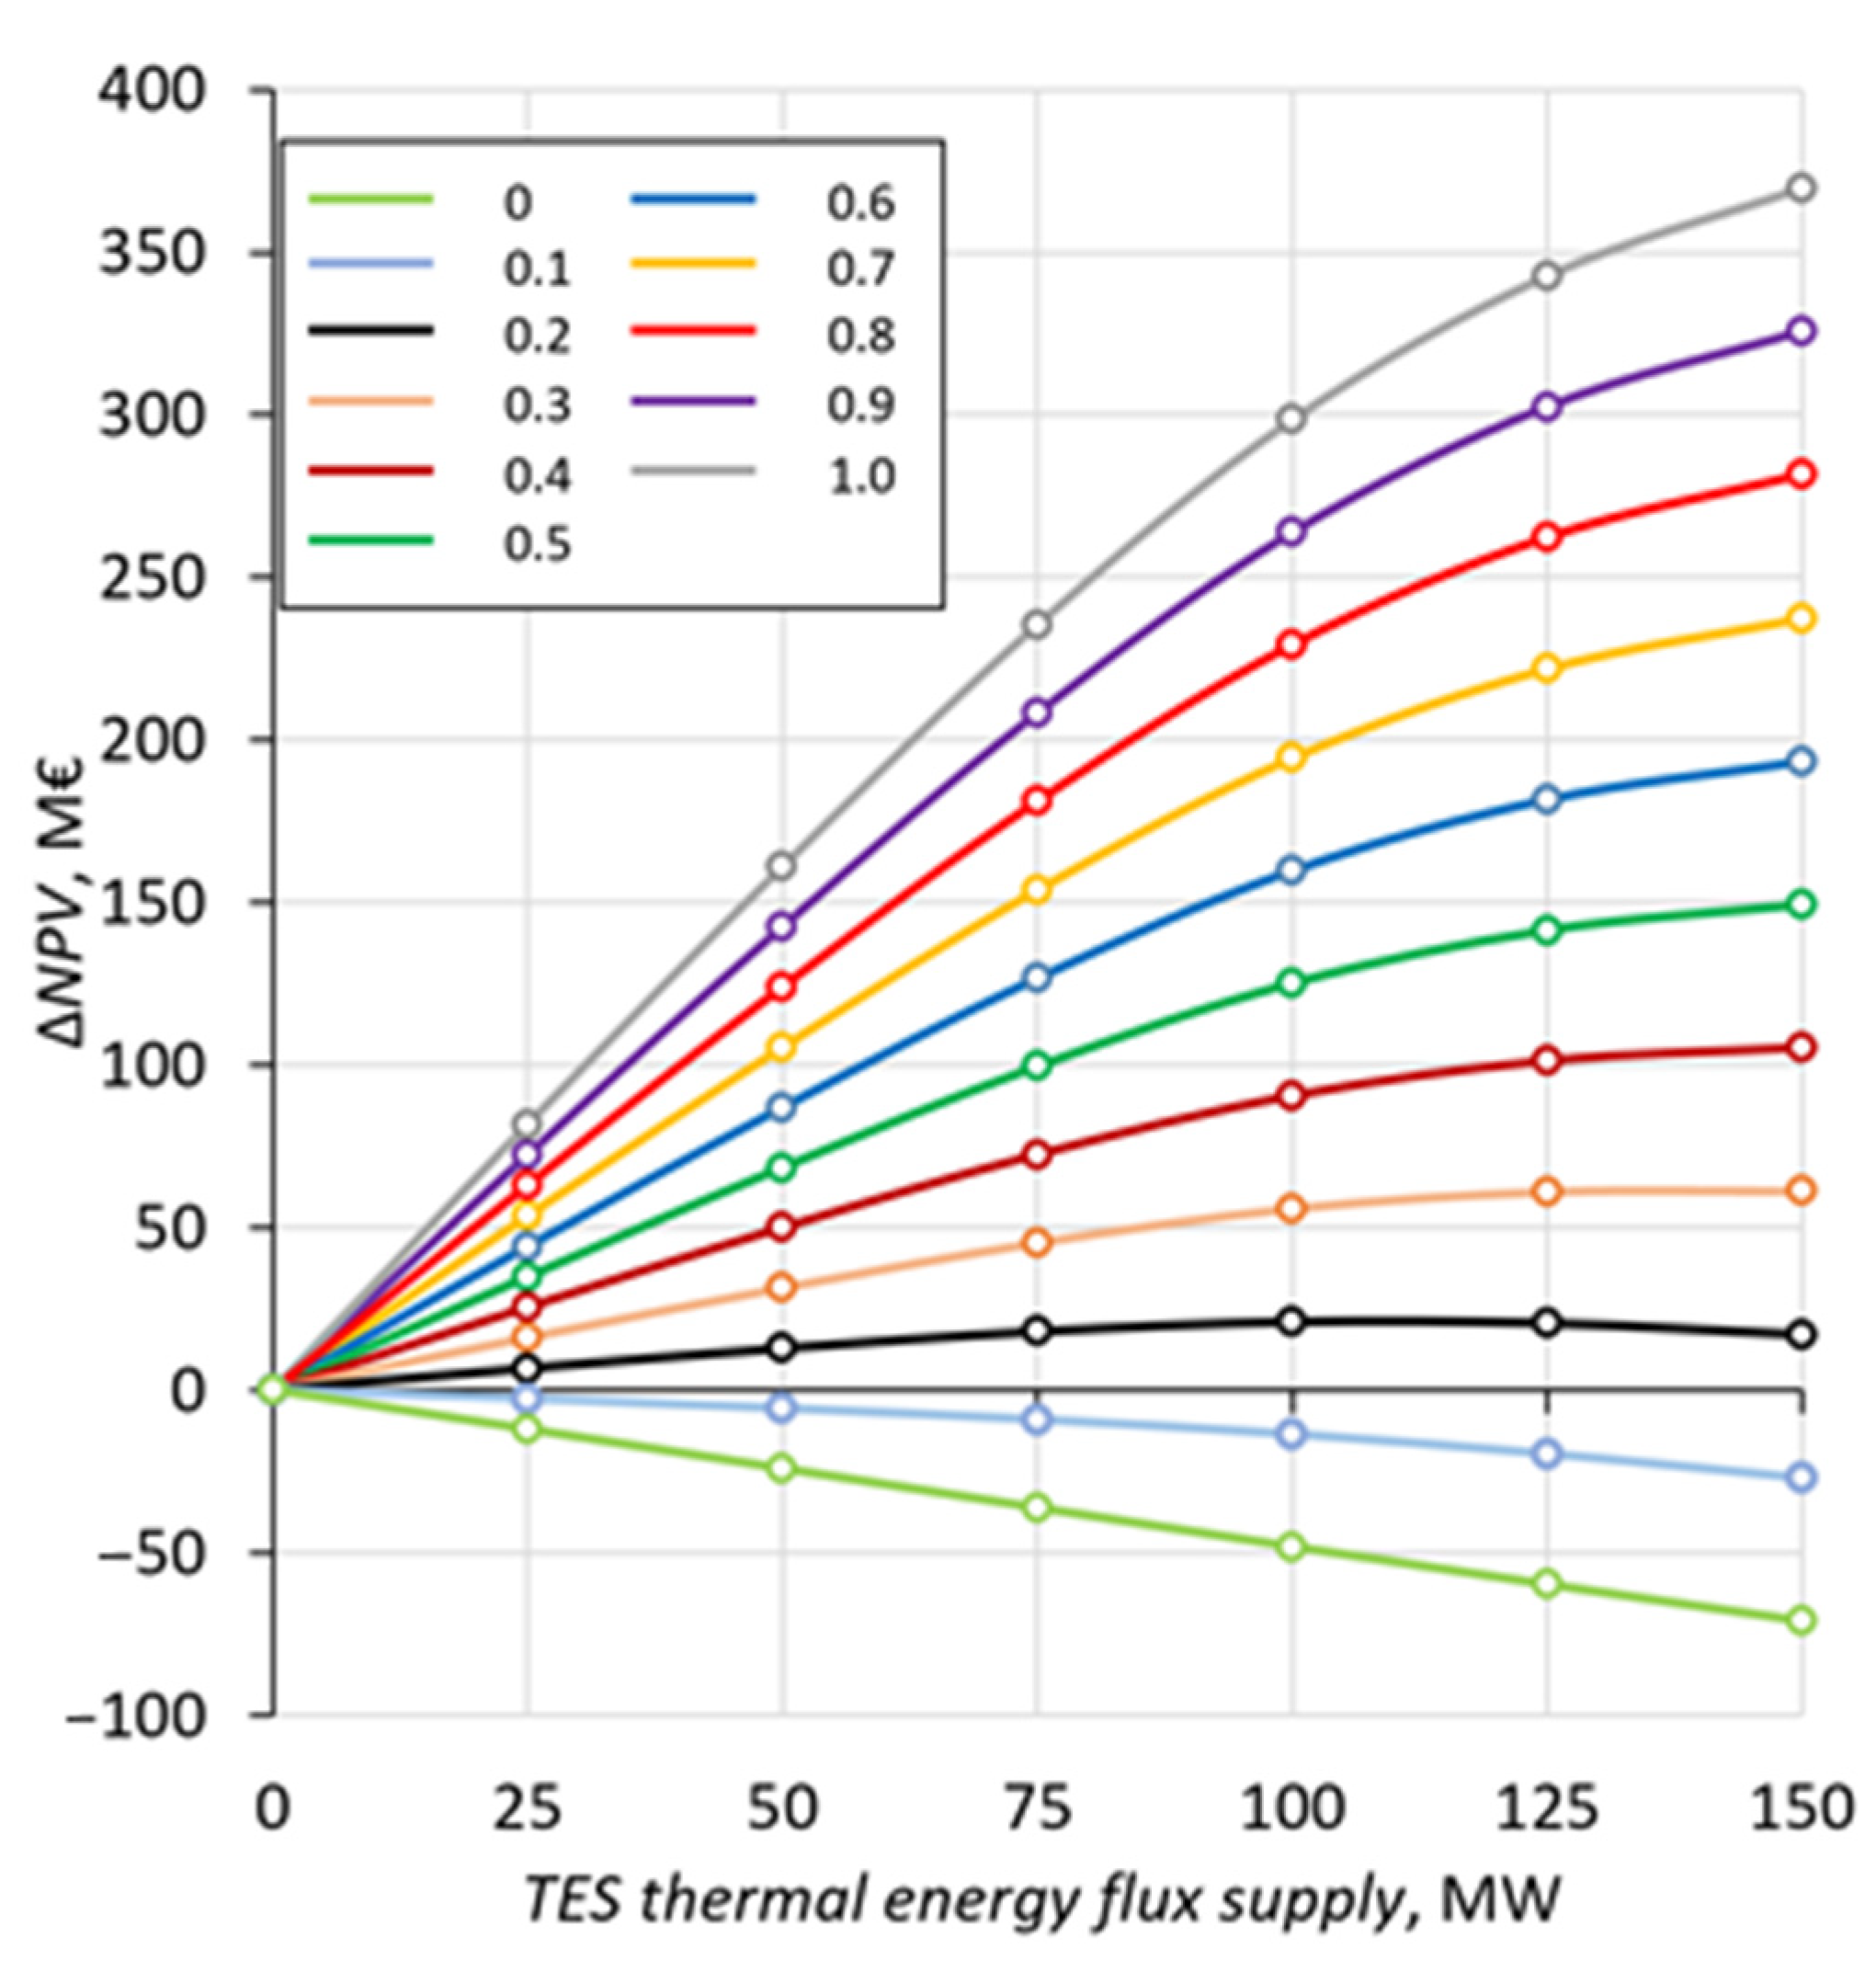
3.2. Results of Economic Analyses
4. Discussion
5. Conclusions
Author Contributions
Funding
Institutional Review Board Statement
Informed Consent Statement
Data Availability Statement
Acknowledgments
Conflicts of Interest
Appendix A

| Measurement Number | 1 | 2 | 3 | 4 | 5 | 6 | 7 | 8 | 9 | 10 | 11 | 12 | 13 | 14 | |
|---|---|---|---|---|---|---|---|---|---|---|---|---|---|---|---|
| District Heating Network Heat Demand, MW | 0 | 0 | 0 | 0 | 0 | 30 | 30 | 30 | 30 | 50 | 50 | 50 | 50 | 130 | |
| Live steam mass flow, kg/s | Report | 358.69 | 331.32 | 268.01 | 213.73 | 142.2 | 363.71 | 329.08 | 255.75 | 184.55 | 360.22 | 328.81 | 256.96 | 186.19 | 362.14 |
| Model | 358.47 | 331.53 | 268.1 | 213.44 | 142.04 | 364.62 | 329.17 | 256.05 | 184.76 | 360.31 | 328.71 | 257.05 | 186.36 | 362.13 | |
| Relative error, % | −0.06% | 0.06% | 0.03% | −0.13% | −0.12% | 0.25% | 0.03% | 0.12% | 0.12% | 0.03% | −0.03% | 0.04% | 0.09% | 0.00% | |
| Live steam pressure, kPa | Report | 28,127 | 26,846 | 23,381 | 20,269 | 15,640 | 27,954 | 26,673 | 22,568 | 18,183 | 27,942 | 26,743 | 22,650 | 18,180 | 27,758 |
| Model | 28,113.2 | 26,819.7 | 23,478 | 20,213.8 | 15,294.2 | 28,326 | 26,626.9 | 22,712.7 | 18,263.8 | 28,060.1 | 26,538.2 | 22,706.7 | 18,314.2 | 27,752.7 | |
| Relative error, % | −0.05% | −0.10% | 0.41% | −0.27% | −2.21% | 1.33% | −0.17% | 0.64% | 0.44% | 0.42% | −0.77% | 0.25% | 0.74% | −0.02% | |
| Reheated steam mass flow, kg/s | Report | 306.78 | 284.24 | 233.89 | 189.56 | 128.93 | 310.92 | 283.08 | 222.96 | 163.6 | 307.04 | 282.6 | 224.46 | 164.21 | 307.27 |
| Model | 306.14 | 284.97 | 234.03 | 188.71 | 127.1 | 310.77 | 282.91 | 223.94 | 164.11 | 307.21 | 282.36 | 224.58 | 165.29 | 307.27 | |
| Relative error, % | −0.21% | 0.26% | 0.06% | −0.45% | −1.42% | −0.05% | −0.06% | 0.44% | 0.31% | 0.06% | −0.09% | 0.05% | 0.66% | 0.00% | |
| Reheated steam pressure, kPa | Report | 4907 | 4518 | 3761 | 3030 | 2041 | 4959 | 4524 | 3586 | 2601 | 4865 | 4511 | 3598 | 2624 | 4891 |
| Model | 4879.8 | 4555.7 | 3760.3 | 3032.6 | 2010.4 | 4933.9 | 4508.6 | 3586.3 | 2617.7 | 4874.4 | 4494.6 | 3591.3 | 2632.7 | 4893.8 | |
| Relative error, % | −0.55% | 0.83% | −0.02% | 0.09% | −1.50% | −0.51% | −0.34% | 0.01% | 0.64% | 0.19% | −0.36% | −0.19% | 0.33% | 0.06% | |
| Feedwater mass flow, kg/s | Report | 350.23 | 316.07 | 243.77 | 199 | 128.8 | 360.21 | 313.97 | 232.38 | 166.88 | 359.33 | 322.7 | 241.77 | 169.85 | 356.28 |
| Model | 348.23 | 317.26 | 247.79 | 192.38 | 127.65 | 362.31 | 320.77 | 240.02 | 168.9 | 359.54 | 322.41 | 242.84 | 171.79 | 354.9 | |
| Relative error, % | −0.57% | 0.38% | 1.65% | −3.32% | −0.90% | 0.58% | 2.17% | 3.29% | 1.21% | 0.06% | −0.09% | 0.44% | 1.14% | −0.39% | |
| Feedwater temperature, °C | Report | 310.2 | 308.1 | 309.3 | 310.6 | 312.8 | 311 | 309.7 | 309.8 | 311.1 | 308.9 | 309.4 | 309.8 | 311.2 | 309.4 |
| Model | 309.33 | 309.25 | 309.56 | 310.46 | 312.72 | 309.16 | 309.09 | 309.59 | 311.12 | 309.09 | 309.04 | 309.57 | 311.08 | 309.41 | |
| Relative error, % | −0.28% | 0.37% | 0.09% | −0.04% | −0.03% | −0.59% | −0.20% | −0.07% | 0.01% | 0.06% | −0.12% | −0.08% | −0.04% | 0.00% | |
| Gross power, MW | Report | 452.34 | 419.73 | 350.32 | 281.17 | 189.65 | 452.58 | 413.01 | 329.81 | 238.98 | 444.48 | 407.78 | 326.47 | 236.67 | 434.02 |
| Model | 451.53 | 421.48 | 347.76 | 280.38 | 185.8 | 452.14 | 413.08 | 328.45 | 239.65 | 443.8 | 409.15 | 326.79 | 239.47 | 434.16 | |
| Relative error, % | 0.18% | −0.42% | 0.73% | 0.28% | 2.03% | 0.10% | −0.02% | 0.41% | −0.28% | 0.15% | −0.34% | −0.10% | −1.18% | −0.03% | |
| Thermal power of SB, MW | Report | 948.98 | 884.11 | 738.27 | 603.35 | 417.25 | 960.48 | 881.11 | 706.57 | 526.75 | 950.19 | 879.44 | 710.31 | 531.13 | 954.8 |
| Model | 949.13 | 883.88 | 738.24 | 602.84 | 416.23 | 962.04 | 881.39 | 707.39 | 527.07 | 950.25 | 879.4 | 710.55 | 531.82 | 954.82 | |
| Relative error, % | −0.02% | 0.03% | 0.00% | 0.08% | 0.24% | −0.16% | −0.03% | −0.12% | −0.06% | −0.01% | 0.00% | −0.03% | −0.13% | 0.00% | |
| Thermal efficiency of STU, % | Report | 47.67 | 47.47 | 47.45 | 46.6 | 45.45 | 47.12 | 46.87 | 46.68 | 45.37 | 46.78 | 46.37 | 45.96 | 44.56 | 45.46 |
| Model | 47.57 | 47.68 | 47.11 | 46.51 | 44.64 | 47 | 46.87 | 46.43 | 45.47 | 46.7 | 46.53 | 45.99 | 45.03 | 45.47 | |
| Relative error, % | 0.20% | −0.44% | 0.73% | 0.20% | 1.79% | 0.26% | 0.01% | 0.53% | −0.22% | 0.16% | −0.34% | −0.06% | −1.05% | −0.03% |
References
- Ministry of Economy of the Republic of Poland. Polish Nuclear Power Programme; Ministry of Economy of the Republic of Poland: Warsaw, Poland, 2014. [Google Scholar]
- Germany Fires Up Coal Plants to Avert Gas Shortage as Russia Cuts Supply. Available online: https://www.ft.com/content/f662a412-9ebc-473a-baca-22de5ff622e2 (accessed on 25 June 2022).
- Qvist, S.; Gładysz, P.; Bartela, Ł.; Sowiżdżał, A. Retrofit decarbonization of coal power plants—A case study for Poland. Energies 2021, 14, 120. [Google Scholar] [CrossRef]
- Bartela, Ł.; Gładysz, P.; Andreades, C.; Qvist, S.; Zdeb, J. Techno-Economic Assessment of Coal-Fired Power Unit Decarbonization Retrofit with KP-FHR Small Modular Reactors. Energies 2021, 14, 2557. [Google Scholar] [CrossRef]
- Blandford, E.; Brumback, K.; Fick, L.; Gerardi, C.; Haugh, B.; Hillstrom, E.; Johnson, K.; Peterson, P.F.; Rubio, F.; Sarikurt, F.S.; et al. Kairos power thermal hydraulics research and development. Nucl. Eng. Des. 2020, 364, 110636. [Google Scholar] [CrossRef]
- Reilly, H.E.; Kolb, G.J. An Evaluation of Molten-Salt Power towers Including Results of the Solar Two Project; Technical Report; Sandia National Labs: Albuquerque, NM, USA, 2001. [Google Scholar]
- Aljaerani, H.A.; Samykano, M.; Pandey, A.K.; Kadirgama, K.; George, M.; Saidur, R. Thermophysical properties enhancement and characterization of CuO nanoparticles enhanced HITEC molten salt for concentrated solar power applications. Int. Commun. Heat Mass Transf. 2022, 132, 105898. [Google Scholar] [CrossRef]
- Giaconia, A.; Balog, I.; Caputo, G. Hybridization of CSP Plants: Characterization of a Molten Salt Heater for Binary and Ternary Nitrate Salt Mixtures Fueled with Gas/Biogas Heaters. Energies 2021, 14, 7652. [Google Scholar] [CrossRef]
- San Miguel, G.; Corona, B. Economic viability of concentrated solar power under different regulatory frameworks in Spain. Renew. Sustain. Energy Rev. 2018, 91, 205–218. [Google Scholar] [CrossRef]
- Fritsch, A.; Frantz, C.; Uhlig, R. Techno-economic analysis of solar thermal power plants using liquid sodium as heat transfer fluid. Sol. Energy 2019, 177, 155–162. [Google Scholar] [CrossRef]
- Herrmann, U.; Kelly, B.; Price, H. Two-tank molten salt storage for parabolic trough solar power plants. Energy 2004, 29, 883–893. [Google Scholar] [CrossRef]
- Giaconia, A.; Tizzoni, A.C.; Sau, S.; Corsaro, N.; Mansi, E.; Spadoni, A.; Delise, T. Assessment and perspectives of heat transfer fluids for CSP applications. Energies 2021, 14, 7486. [Google Scholar] [CrossRef]
- Bielecki, A.; Ernst, S.; Skrodzka, W.; Wojnicki, I. Concentrated Solar Power Plants with Molten Salt Storage: Economic Aspects and Perspectives in the European Union. Int. J. Photoenergy 2019, 2019, 8796814. [Google Scholar] [CrossRef]
- Pacheco, J.E.; Wolf, T.; Muley, N. Incorporating Supercritical Steam Turbines into Advanced Molten-Salt Power Tower Plants Feasibility and Performance; Sandia National Laboratories: Livermore, CA, USA, 2013. [Google Scholar]
- Bartela, Ł.; Milewski, J. Directions for improving the flexibility of coal-fired units in an era of increasing potential of renewable energy sources. In Power Engineering. Advences and Challenges, Part A: Thermal, Hydro and Nuclear Power; Badescu, V., Lazaroiu, G.C., Barelli, L., Eds.; CRC Press, Taylor and Francis Group: Boca Raton, FL, USA, 2018; pp. 29–44. [Google Scholar]
- Garbrecht, O.; Bieber, M.; Kneer, R. Increasing fossil power plant flexibility by integrating molten-salt thermal storage. Energy 2017, 118, 876–883. [Google Scholar] [CrossRef]
- Kosman, W.; Rusin, A. The Application of molten Salt Energy Storage to Advance the Transition from Coal to Green Energy Power Systems. Energies 2020, 13, 2222. [Google Scholar] [CrossRef]
- Castro-Quijada, M.; Faundez, D.; Rojas, R.; Videl, A. Improving the working fluid based on a NaNO3-KNO3-NaCl-KCl molten salt mixture for concentrating solar power energy storage. Sol. Energy 2022, 231, 464–472. [Google Scholar] [CrossRef]
- Boretti, A.; Castelletto, S. High-temperature molten-salt thermal energy storage and advanced-Ultra-supercritical power cycles. J. Energy Storage 2021, 42, 103143. [Google Scholar] [CrossRef]
- Mendecka, B.; Lombardi, L.; Gladysz, P. Waste to energy efficiency improvements: Integration with solar thermal energy. Waste Manag. Res. 2019, 37, 419–434. [Google Scholar] [CrossRef]
- Al Kindi, A.A.; Aunedi, M.; Pantaleo, A.M.; Strbac, G.; Markides, C.N. Thermo-economic assessment of flexible nuclear power plants in future low-carbon electricity systems: Role of thermal energy storage. Energy Convers. Manag. 2022, 258, 115484. [Google Scholar] [CrossRef]
- Hovsapian, R.; Osorio, J.D.; Panwar, M.; Chryssostomidis, C.; Ordonez, J.C. Grid-Scale Ternary-Pumped Thermal Electricity Storage for Flexible Operation of Nuclear Power Generation under High Penetration of Renewable Energy Sources. Energies 2021, 14, 3858. [Google Scholar] [CrossRef]
- The European Council, the Council, the European and Social Committee and the Committee of the Regions. Communication from the Commission to the European Parliament; REPowerUE Plan. COM/2022/230 final; The European Council: Brussels, Belgium, 2022.
- Bartela, Ł.; Kotowicz, J.; Dubel, K. Technical-economic comparative analysis of energy storage systems equipped with a hydrogen generation installation. J. Power Technol. 2016, 96, 92–100. [Google Scholar]
- Report on Warranty and Operational Measurements after the Modernization of Unit No. 10 in Tauron Wytwarzanie SA, Branch Łagisza Power Plant; Branch Łagisza Power Plant: Będzin, Poland, 2020.
- F-Chart Software LLC. Engineering Equation Solver (EES) Professional, Version 11. Available online: http://fchartsoftware.com/ees (accessed on 18 July 2022).
- Boldon, L.; Sabharwall, P.; Painter, C.; Liu, L. An overview of small modular reactors: Status of global development, potential design advantages, and methods for economic assessment. Int. J. Energy Environ. Econ. 2014, 22, 437–459. [Google Scholar]
- Ingersoll, E.; Gogan, K.; Herter, J.; Foss, A. The ETI Nuclear Cost Drivers Project Full Technical Report; Energy Systems Catapult: Birmingham, UK, 3 September 2020. [Google Scholar]
- Hampe, J.; Madlener, R. Economic feasibility of high-temperature reactors for industrial cogeneration: An investor’s perspective. J. Nucl. Sci. Technol. 2016, 53, 1–19. [Google Scholar] [CrossRef]
- Nuclear Regulatory Commission. NRC Issues Subsequent Renewed Licenses for Turkey Point Reactors; US NRC: Rockville, MD, USA, 2019.
- Scully Capital Services Inc. Business Case for Small Modular Reactors; Report on Findings to the U.S. Department of Energy Office of Nuclear Energy; Scully Capital Services Inc.: Washington, DC, USA, 2014. [Google Scholar]
- Pannier, C.; Skoda, R. Comparison of Small Modular Reactor and Large Nuclear Reactor fuel cost. Energy Power Eng. 2014, 6, 45669. [Google Scholar] [CrossRef]
- Swedish Nuclear Waste Fund. Annual Report. 2020. Available online: http://www.karnavfallsfonden.se/download/18.5903daa61784af90c4619b3c/1616593059594/Annual%20report%202020.pdf (accessed on 20 April 2021).
- Parsons Brinckerhoff. Quantitative Analysis and Initial Business Case—Establishing Anuclear Power Plant and Systems in South Australia; WSP: Quebec City, QC, Canada, 2016. [Google Scholar]


| Hour of Day | |||||||||||||||||||||||||
|---|---|---|---|---|---|---|---|---|---|---|---|---|---|---|---|---|---|---|---|---|---|---|---|---|---|
| 1 | 2 | 3 | 4 | 5 | 6 | 7 | 8 | 9 | 10 | 11 | 12 | 13 | 14 | 15 | 16 | 17 | 18 | 19 | 20 | 21 | 22 | 23 | 24 | ||
| Average Hourly Electricity Prices | |||||||||||||||||||||||||
| Months in 2020 | Jan | 33.3 | 31.3 | 29.8 | 29.4 | 30.3 | 32.5 | 41.3 | 42.1 | 44.8 | 46.2 | 45.9 | 46.5 | 46.4 | 46.5 | 45.5 | 45.5 | 48.5 | 49.5 | 48.6 | 47.3 | 44.0 | 38.7 | 40.1 | 34.3 |
| Feb | 29.4 | 27.0 | 25.6 | 25.4 | 26.2 | 29.1 | 39.6 | 39.6 | 42.6 | 44.0 | 43.7 | 44.0 | 44.5 | 44.9 | 43.6 | 42.5 | 43.9 | 48.0 | 47.6 | 46.6 | 43.1 | 36.3 | 37.3 | 31.7 | |
| Mar | 30.6 | 29.3 | 28.2 | 28.1 | 28.4 | 29.5 | 35.9 | 35.9 | 38.8 | 39.3 | 38.0 | 38.5 | 38.9 | 39.0 | 37.3 | 35.8 | 35.6 | 37.8 | 43.1 | 43.2 | 39.6 | 35.0 | 36.4 | 31.9 | |
| Apr | 30.0 | 28.6 | 27.6 | 26.9 | 27.1 | 27.2 | 31.3 | 33.7 | 36.3 | 36.6 | 35.8 | 36.0 | 35.5 | 35.2 | 33.1 | 32.0 | 31.8 | 31.9 | 33.3 | 37.6 | 40.6 | 35.8 | 35.5 | 30.6 | |
| May | 34.6 | 33.8 | 33.1 | 32.7 | 32.6 | 31.7 | 37.6 | 38.8 | 40.9 | 41.2 | 40.7 | 40.7 | 40.8 | 40.2 | 38.8 | 38.2 | 37.8 | 37.3 | 37.8 | 39.4 | 41.0 | 39.9 | 40.0 | 35.1 | |
| Jun | 41.3 | 40.7 | 40.4 | 40.0 | 39.6 | 39.5 | 45.3 | 46.4 | 51.0 | 52.0 | 51.9 | 52.9 | 53.1 | 51.9 | 49.9 | 47.8 | 46.6 | 45.5 | 45.7 | 46.6 | 46.4 | 45.9 | 47.3 | 43.1 | |
| Jul | 44.7 | 43.9 | 43.6 | 43.4 | 42.8 | 42.6 | 49.0 | 47.6 | 50.4 | 51.1 | 51.0 | 52.4 | 52.9 | 51.9 | 50.3 | 49.7 | 48.9 | 48.2 | 47.9 | 48.9 | 48.8 | 49.1 | 50.7 | 46.2 | |
| Aug | 43.0 | 42.2 | 42.0 | 42.1 | 41.9 | 41.5 | 47.4 | 47.5 | 51.9 | 54.2 | 55.0 | 56.7 | 57.5 | 56.9 | 54.2 | 53.3 | 52.0 | 51.2 | 51.0 | 53.3 | 54.1 | 50.0 | 50.8 | 45.1 | |
| Sep | 44.8 | 44.2 | 43.6 | 43.5 | 44.0 | 44.8 | 51.2 | 54.1 | 58.9 | 57.4 | 55.1 | 55.0 | 55.0 | 54.0 | 52.3 | 52.6 | 53.3 | 55.3 | 58.6 | 67.1 | 64.5 | 54.0 | 52.8 | 47.7 | |
| Oct | 43.2 | 42.5 | 41.6 | 41.5 | 42.2 | 43.3 | 51.9 | 51.7 | 56.8 | 57.6 | 56.3 | 57.0 | 56.9 | 56.3 | 54.8 | 55.2 | 56.4 | 57.9 | 61.7 | 63.7 | 56.8 | 48.4 | 49.6 | 44.9 | |
| Nov | 43.1 | 41.1 | 40.1 | 40.1 | 40.9 | 43.6 | 50.2 | 50.4 | 55.3 | 57.0 | 57.4 | 58.5 | 58.6 | 59.1 | 58.3 | 59.0 | 63.5 | 65.6 | 60.9 | 57.8 | 53.8 | 48.2 | 49.9 | 45.1 | |
| Dec | 44.3 | 41.2 | 39.5 | 39.0 | 40.1 | 43.5 | 52.2 | 56.5 | 61.1 | 63.5 | 63.4 | 64.5 | 65.1 | 65.1 | 64.3 | 65.1 | 69.3 | 68.4 | 65.2 | 62.8 | 57.5 | 50.7 | 50.4 | 45.4 | |
| Months in 2021 | Jan | 45.8 | 44.0 | 43.1 | 42.6 | 43.0 | 44.9 | 51.6 | 54.3 | 57.8 | 60.0 | 60.3 | 61.0 | 60.9 | 60.7 | 59.6 | 59.8 | 63.1 | 65.0 | 63.7 | 61.4 | 57.8 | 52.8 | 52.4 | 47.7 |
| Feb | 47.6 | 47.0 | 46.2 | 45.9 | 46.7 | 49.8 | 58.1 | 59.9 | 64.0 | 65.5 | 64.1 | 63.2 | 61.9 | 61.4 | 60.4 | 59.6 | 61.2 | 66.3 | 66.8 | 64.6 | 60.8 | 54.7 | 54.8 | 48.7 | |
| Mar | 51.6 | 49.7 | 49.3 | 48.9 | 48.8 | 52.0 | 59.9 | 62.4 | 64.8 | 63.3 | 61.3 | 61.3 | 61.2 | 61.2 | 60.3 | 60.3 | 61.1 | 63.9 | 70.1 | 70.9 | 65.6 | 59.9 | 58.7 | 52.9 | |
| Apr | 55.5 | 52.9 | 51.9 | 51.8 | 52.5 | 54.1 | 62.1 | 64.4 | 66.9 | 63.9 | 60.5 | 59.7 | 58.1 | 56.8 | 54.8 | 54.6 | 55.7 | 57.4 | 62.9 | 68.6 | 70.8 | 65.6 | 64.4 | 58.1 | |
| May | 61.8 | 59.2 | 58.1 | 57.7 | 57.6 | 58.0 | 66.3 | 69.6 | 71.7 | 68.2 | 64.2 | 63.6 | 61.8 | 60.3 | 58.7 | 59.3 | 60.3 | 63.2 | 67.9 | 73.7 | 76.6 | 73.6 | 70.8 | 64.9 | |
| Jun | 70.4 | 66.3 | 64.2 | 63.2 | 62.5 | 64.5 | 72.8 | 77.3 | 80.4 | 78.9 | 75.6 | 75.0 | 73.8 | 72.2 | 70.9 | 71.4 | 72.5 | 76.1 | 82.4 | 88.3 | 89.0 | 85.7 | 81.5 | 75.4 | |
| Jul | 77.9 | 74.4 | 72.2 | 71.5 | 70.7 | 72.7 | 79.0 | 81.5 | 84.7 | 84.9 | 83.7 | 83.5 | 83.0 | 81.7 | 80.3 | 80.9 | 82.0 | 84.2 | 87.3 | 90.8 | 91.6 | 89.7 | 86.6 | 82.2 | |
| Aug | 76.4 | 73.0 | 71.4 | 70.5 | 70.5 | 72.5 | 79.8 | 82.2 | 85.9 | 85.6 | 83.0 | 82.8 | 81.9 | 79.7 | 77.7 | 78.1 | 79.7 | 84.0 | 88.9 | 93.2 | 95.6 | 90.7 | 87.5 | 80.8 | |
| Sep | 92.1 | 89.8 | 88.6 | 88.2 | 88.5 | 91.5 | 95.7 | 98.9 | 105.5 | 104.7 | 99.8 | 99.8 | 97.5 | 94.5 | 92.8 | 95.0 | 99.6 | 105.9 | 115.2 | 141.0 | 139.4 | 103.1 | 98.9 | 92.8 | |
| Oct | 81.3 | 78.1 | 76.6 | 76.9 | 78.8 | 85.9 | 102.2 | 110.8 | 123.3 | 121.2 | 110.7 | 105.6 | 100.2 | 96.9 | 96.5 | 103.5 | 113.3 | 129.5 | 151.2 | 155.3 | 130.1 | 96.0 | 93.0 | 84.4 | |
| Nov | 87.7 | 82.7 | 80.2 | 79.9 | 82.9 | 88.3 | 108.4 | 110.5 | 126.5 | 131.1 | 126.5 | 129.5 | 130.1 | 134.2 | 135.5 | 144.6 | 163.6 | 166.0 | 157.3 | 147.7 | 126.9 | 104.6 | 105.6 | 93.2 | |
| Dec | 123.9 | 116.1 | 111.8 | 110.6 | 114.3 | 124.8 | 153.7 | 152.1 | 200.1 | 217.2 | 218.2 | 225.3 | 226.1 | 232.2 | 224.6 | 230.9 | 245.8 | 240.0 | 226.6 | 213.1 | 179.6 | 136.9 | 148.2 | 126.8 | |
| Parameter | Symbol | Value | References |
|---|---|---|---|
| Lifetime | |||
| Construction time, years | CT | 4 | [28] |
| Time of operation in year, % | τa | 8256 | [25,29] |
| Total operation time assumed for the NPV analysis, years | TOT | 50 | [30] |
| Capital costs | |||
| Unit overnight capital cost (GF investment type, w/o TES system), EUR/kW | uOCCGF | 3500 | [28] |
| Unit overnight capital cost for TES system, EUR/kWht | uOCCTES | 50 | [20] |
| Retrofit savings, % | RS | 32 | [3] |
| Interest rates on construction loan, % | 5 | [28] | |
| Variable O&M costs | |||
| Refueling costs, EUR/MWh | uVOMC(RC) | 7 | [31,32] |
| Spent nuclear fuel costs, EUR/MWh | uVOMC(SFC) | 5 | [33,34] |
| Electricity average price, EUR/MWh | 85 | * | |
| Relative difference between the peak-production electricity price and the average price | 0.2 | * | |
| Relative difference between the valley-production electricity price and the average price | −0.2 | * | |
| Heat price, EUR/MWht | 36 | * | |
| Non-fuel and non-emission costs for turbine island, EUR/MWh | uVOMC(nnTI) | 1.50 | * |
| Fixed O&M costs, EUR/MW/y | uFOMC | 104,000 | [28] * |
| Turbine island, EUR/MW/y | uFOMC(TI) | 20,000 | * |
| Nuclear Island, EUR/MW/y | uFOMC(NI) | 84,000 | [28] |
| Others | |||
| Discount rate, % | 6 | * | |
| Annual inflation rate, % | 2 | ||
| Tax rate, % | 19 |
| Case | ||||||||
|---|---|---|---|---|---|---|---|---|
| REF_3NR | REF_2NR | TES25 | TES50 | TES75 | TES100 | TES125 | TES150 | |
| TES capacity (w/o losses), MWh | 0 | 0 | 200 | 400 | 600 | 800 | 1000 | 1200 |
| Electricity peak-production, GWh | 588.9 | 384.1 | 414.7 | 444.4 | 472.5 | 496.8 | 514.8 | 527.2 |
| Electricity energy valley-production, GWh | 1168.3 | 761.6 | 729.5 | 698.3 | 668.8 | 643.0 | 623.9 | 610.7 |
| Other production, GWh | 1760.9 | 1148.2 | 1148.2 | 1148.2 | 1148.2 | 1148.2 | 1148.2 | 1148.2 |
| Total electricity production, GWh | 3518.1 | 2293.9 | 2292.4 | 2290.9 | 2289.4 | 2288.0 | 2286.9 | 2286.1 |
| Heat production, TJ | 2026.4 | 2026.4 | 2026.4 | 2026.4 | 2026.4 | 2026.4 | 2026.4 | 2026.4 |
| Utilization rate of installed TES storage capacity, - | - | - | 1.0000 | 0.9867 | 0.9646 | 0.9226 | 0.8562 | 0.8216 |
| Annual thermal efficiency, - | 0.4645 | 0.4543 | 0.4540 | 0.4537 | 0.4534 | 0.4531 | 0.4529 | 0.4527 |
| Case | ||||||||
|---|---|---|---|---|---|---|---|---|
| REF_3NR | REF_2NR | TES25 | TES50 | TES75 | TES100 | TES125 | TES150 | |
| NPV, MEUR | 2810.27 | 1874.06 | 1880.83 | 1887.03 | 1892.23 | 1895.29 | 1894.86 | 1891.28 |
| ∆NPV, MEUR | - | - | 6.77 | 12.97 | 18.17 | 21.23 | 20.80 | 17.22 |
| DPP, years | 8 | 8 | 8 | 8 | 8 | 8 | 9 | 9 |
| DPP*, years | - | - | 19 | 20 | 21 | 22 | 24 | 29 |
| NPVR, - | 2.309 | 2.310 | 2.288 | 2.266 | 2.243 | 2.218 | 2.190 | 2.159 |
Publisher’s Note: MDPI stays neutral with regard to jurisdictional claims in published maps and institutional affiliations. |
© 2022 by the authors. Licensee MDPI, Basel, Switzerland. This article is an open access article distributed under the terms and conditions of the Creative Commons Attribution (CC BY) license (https://creativecommons.org/licenses/by/4.0/).
Share and Cite
Bartela, Ł.; Gładysz, P.; Ochmann, J.; Qvist, S.; Sancho, L.M. Repowering a Coal Power Unit with Small Modular Reactors and Thermal Energy Storage. Energies 2022, 15, 5830. https://doi.org/10.3390/en15165830
Bartela Ł, Gładysz P, Ochmann J, Qvist S, Sancho LM. Repowering a Coal Power Unit with Small Modular Reactors and Thermal Energy Storage. Energies. 2022; 15(16):5830. https://doi.org/10.3390/en15165830
Chicago/Turabian StyleBartela, Łukasz, Paweł Gładysz, Jakub Ochmann, Staffan Qvist, and Lou Martinez Sancho. 2022. "Repowering a Coal Power Unit with Small Modular Reactors and Thermal Energy Storage" Energies 15, no. 16: 5830. https://doi.org/10.3390/en15165830
APA StyleBartela, Ł., Gładysz, P., Ochmann, J., Qvist, S., & Sancho, L. M. (2022). Repowering a Coal Power Unit with Small Modular Reactors and Thermal Energy Storage. Energies, 15(16), 5830. https://doi.org/10.3390/en15165830