Article

A Theoretical Approach for Resonance Analysis of Wind Turbines under 1P/3P Loads

1
State Key Laboratory of Hydraulic Engineering Simulation and Safety, Tianjin University, Tianjin 300350, China
2
School of Civil Engineering, Tianjin University, Tianjin 300350, China
*
Author to whom correspondence should be addressed.
Energies 2022, 15(16), 5787; https://doi.org/10.3390/en15165787
Submission received: 6 July 2022 / Revised: 1 August 2022 / Accepted: 5 August 2022 / Published: 9 August 2022
(This article belongs to the Topic Wind, Wave and Tidal Energy Technologies in China)

Abstract

:
Wind turbines (WTs) are exposed to a dynamic/cyclic load environment, and are subjected to 1P/3P loads under operational conditions. Recent studies introduced the Sommerfeld Effect to explain the dynamic response amplification induced by 1P/3P loads. This study establishes a theoretical model to analyze the resonance of WTs under 1P/3P loads. Sensitiveness analysis was conducted for parameters b, c, S, F, and T to explore their influence on the dynamic response. The resonance phenomenon induced by 1P/3P frequency passing the natural frequency is discussed. The results show that there is no Sommerfeld Effect in soft–stiff WTs. Only if the imbalance reaches a much higher value (19200 kg·m in this study) should the Sommerfeld Effect be considered for soft WTs; otherwise, it can be ignored. The 3P resonance appeared when the 3P frequency approached the natural frequency, but it was not the Sommerfeld Effect.

1. Introduction

Under the growing pressure of the energy crisis and demand for environmental protection, wind energy has attracted worldwide attention in the past few decades. According to the data from the global wind energy council (GWEC), the global annual wind installation exceeded 90 GW in 2019 and 2020 consecutively, and the total installation reached a record of 837 GW in 2021, helping the world avoid over 1.2 billion tons of CO2 emissions annually [1]. To further reduce the levelized cost of electricity, wind turbines (WTs) present an upscaling trend of larger capacity, leading to longer blades, heavier heads, taller towers, and thus more flexible structures [2]. Meanwhile, a complex work environment exposes WTs to various dynamic/cyclic loads, such as turbulent wind, earthquakes, and operation loads. Therefore, WTs are dynamic, sensitive structures, and it is essential to make sure that the whole structure has enough vibration-bearing capacity.
Among these loads, operation loads are additional loads due to WT operation (i.e., rotation of wind rotor), compared with other types of slender and tall structures. Operation loads are divided into wind load, 1P (rotor rotational speed) load, and 3P (blade passing frequency) load—wind load is generated by wind pressure and depends on the inflow turbulence and frontal area of the blades, and 1P/3P loads are named according to their frequencies acting on turbines. The 1P load is mainly caused by mass and the aerodynamic imbalance of the rotor [3]—it is the inducement of fatigue damage to the main shaft, gearbox, and tower [4]. The 3P load is mainly caused by wind shear and tower shadow effects as blades pass through the front of the tower [5], and it causes power pulsation, which proves perilous for grid security [6]. Studies concerning 1P/3P loads are now mostly focused on wind turbine operation control, aiming to reduce the pulsation of the loads and enhance the quality of produced power through an individual pitch control strategy [7,8,9].
In 1902, Arnold Sommerfeld first observed an interesting phenomenon from a vibration system consisting of an eccentric rotor and its elastic foundation [10]. Most of the energy supplied by the external excitation source is spent to accumulate structural vibration when its rotation frequency approaches the natural frequency of the system, instead of increasing the rotation speed. It is even more strange that the vibration will change suddenly when the rotation frequency passes the natural frequency, and the amplitude in the process of energy increase is not the same as that in the decreasing process, as indicated in Figure 1a—the processes from b to c and from d to a are sudden changes and they are different routines. Later, several experiments were designed by Timoshenko (1934), Kalishuk (1939), and Martyshkin (1940) to explore this phenomenon [11,12].
In recent years, the Sommerfeld Effect has caught the eyes of researchers in wind energy engineering. In [13], Brasil et al. simplified the wind turbine system as a two-freedom system supported by a flexible column—a second degree of freedom was introduced to simulate the imbalance caused by the wind rotor. The appearance of the Sommerfeld Effect has been observed as expected (Figure 1b). In [14], Weihua Hu et al. developed a structural health monitoring system of a 5 MW WT prototype, and the Sommerfeld Effect was used to explain the aggravating resonance phenomenon as the rotation speed of the rotor approached 8 RPM (revolutions per minute). In [15], a 1.5 MW WT prototype was tested, and the characteristics of different vibration phenomena in the turbine during startup and shutdown processes were explained by the Sommerfeld Effect.
It can be found, from these studies, that the Sommerfeld Effect has not been well-studied in the wind engineering field. Brasil did not consider that the rotation speed of a soft–stiff WT will not pass the natural frequency, which is the presupposition for the Sommerfeld Effect to happen, and the parameters in this study were not rational for WTs. The prototype tests in [14,15] introduced the Sommerfeld Effect to explain the resonance of WTs, they lacked a theoretical basis; therefore, there is doubt as to whether the Sommerfeld Effect can be excited by the 3P load when the 3P frequency passes the natural frequency. In a word, these studies provided no compelling explanations. Hence, this paper studied the Sommerfeld Effect phenomenon at a theoretical level, and analyzed the mechanism by which the Sommerfeld Effect happens under 1P/3P loads in WTs. To overcome the shortcomings of the previous works, this work establishes a simplified WT model, and structural parameters that influence the response are determined and analyzed from a practical WT. Resonance analyses are performed in detail considering several cases, the side–side (SS) and fore–aft (FA) directions are discussed separately because the rotor of a WT is mass-imbalanced in the SS direction but balanced in the FA direction, and 1P/3P loads are considered, since the 1P/3P frequencies can potentially approach the natural frequency. Soft and stiff design principles of WTs are also considered, because the natural frequencies of these principles have different locations around 1P/3P ranges. This paper mainly consists of four parts. Firstly, the simplified theoretical WT model is established in Section 2, and motion equations are obtained by the Lagrange function, taking the SS and FA directions into consideration. Secondly, Section 3 introduces the selection of parameters for calculation from an offshore wind turbine (OWT) supported by a bucket foundation and analyses the influences of various parameters, including the rotational damping b, the structural damping c, the imbalance mass moment S, the 3P load F, and the torque T. Thirdly, in Section 4, the Sommerfeld Effect and 3P resonance caused by the 1P/3P operational frequency passing the natural frequency of a WT are studied in detail. Finally, all of the analyses are discussed in Section 5 and the conclusions are derived in Section 6. With this work, the Sommerfeld Effect and 3P resonance of WTs are explained clearly, the theoretical result solves the mechanism by which the Sommerfeld Effect occurs in WTs, and new knowledge on resonance can be obtained to understand the dynamic behavior of WTs.

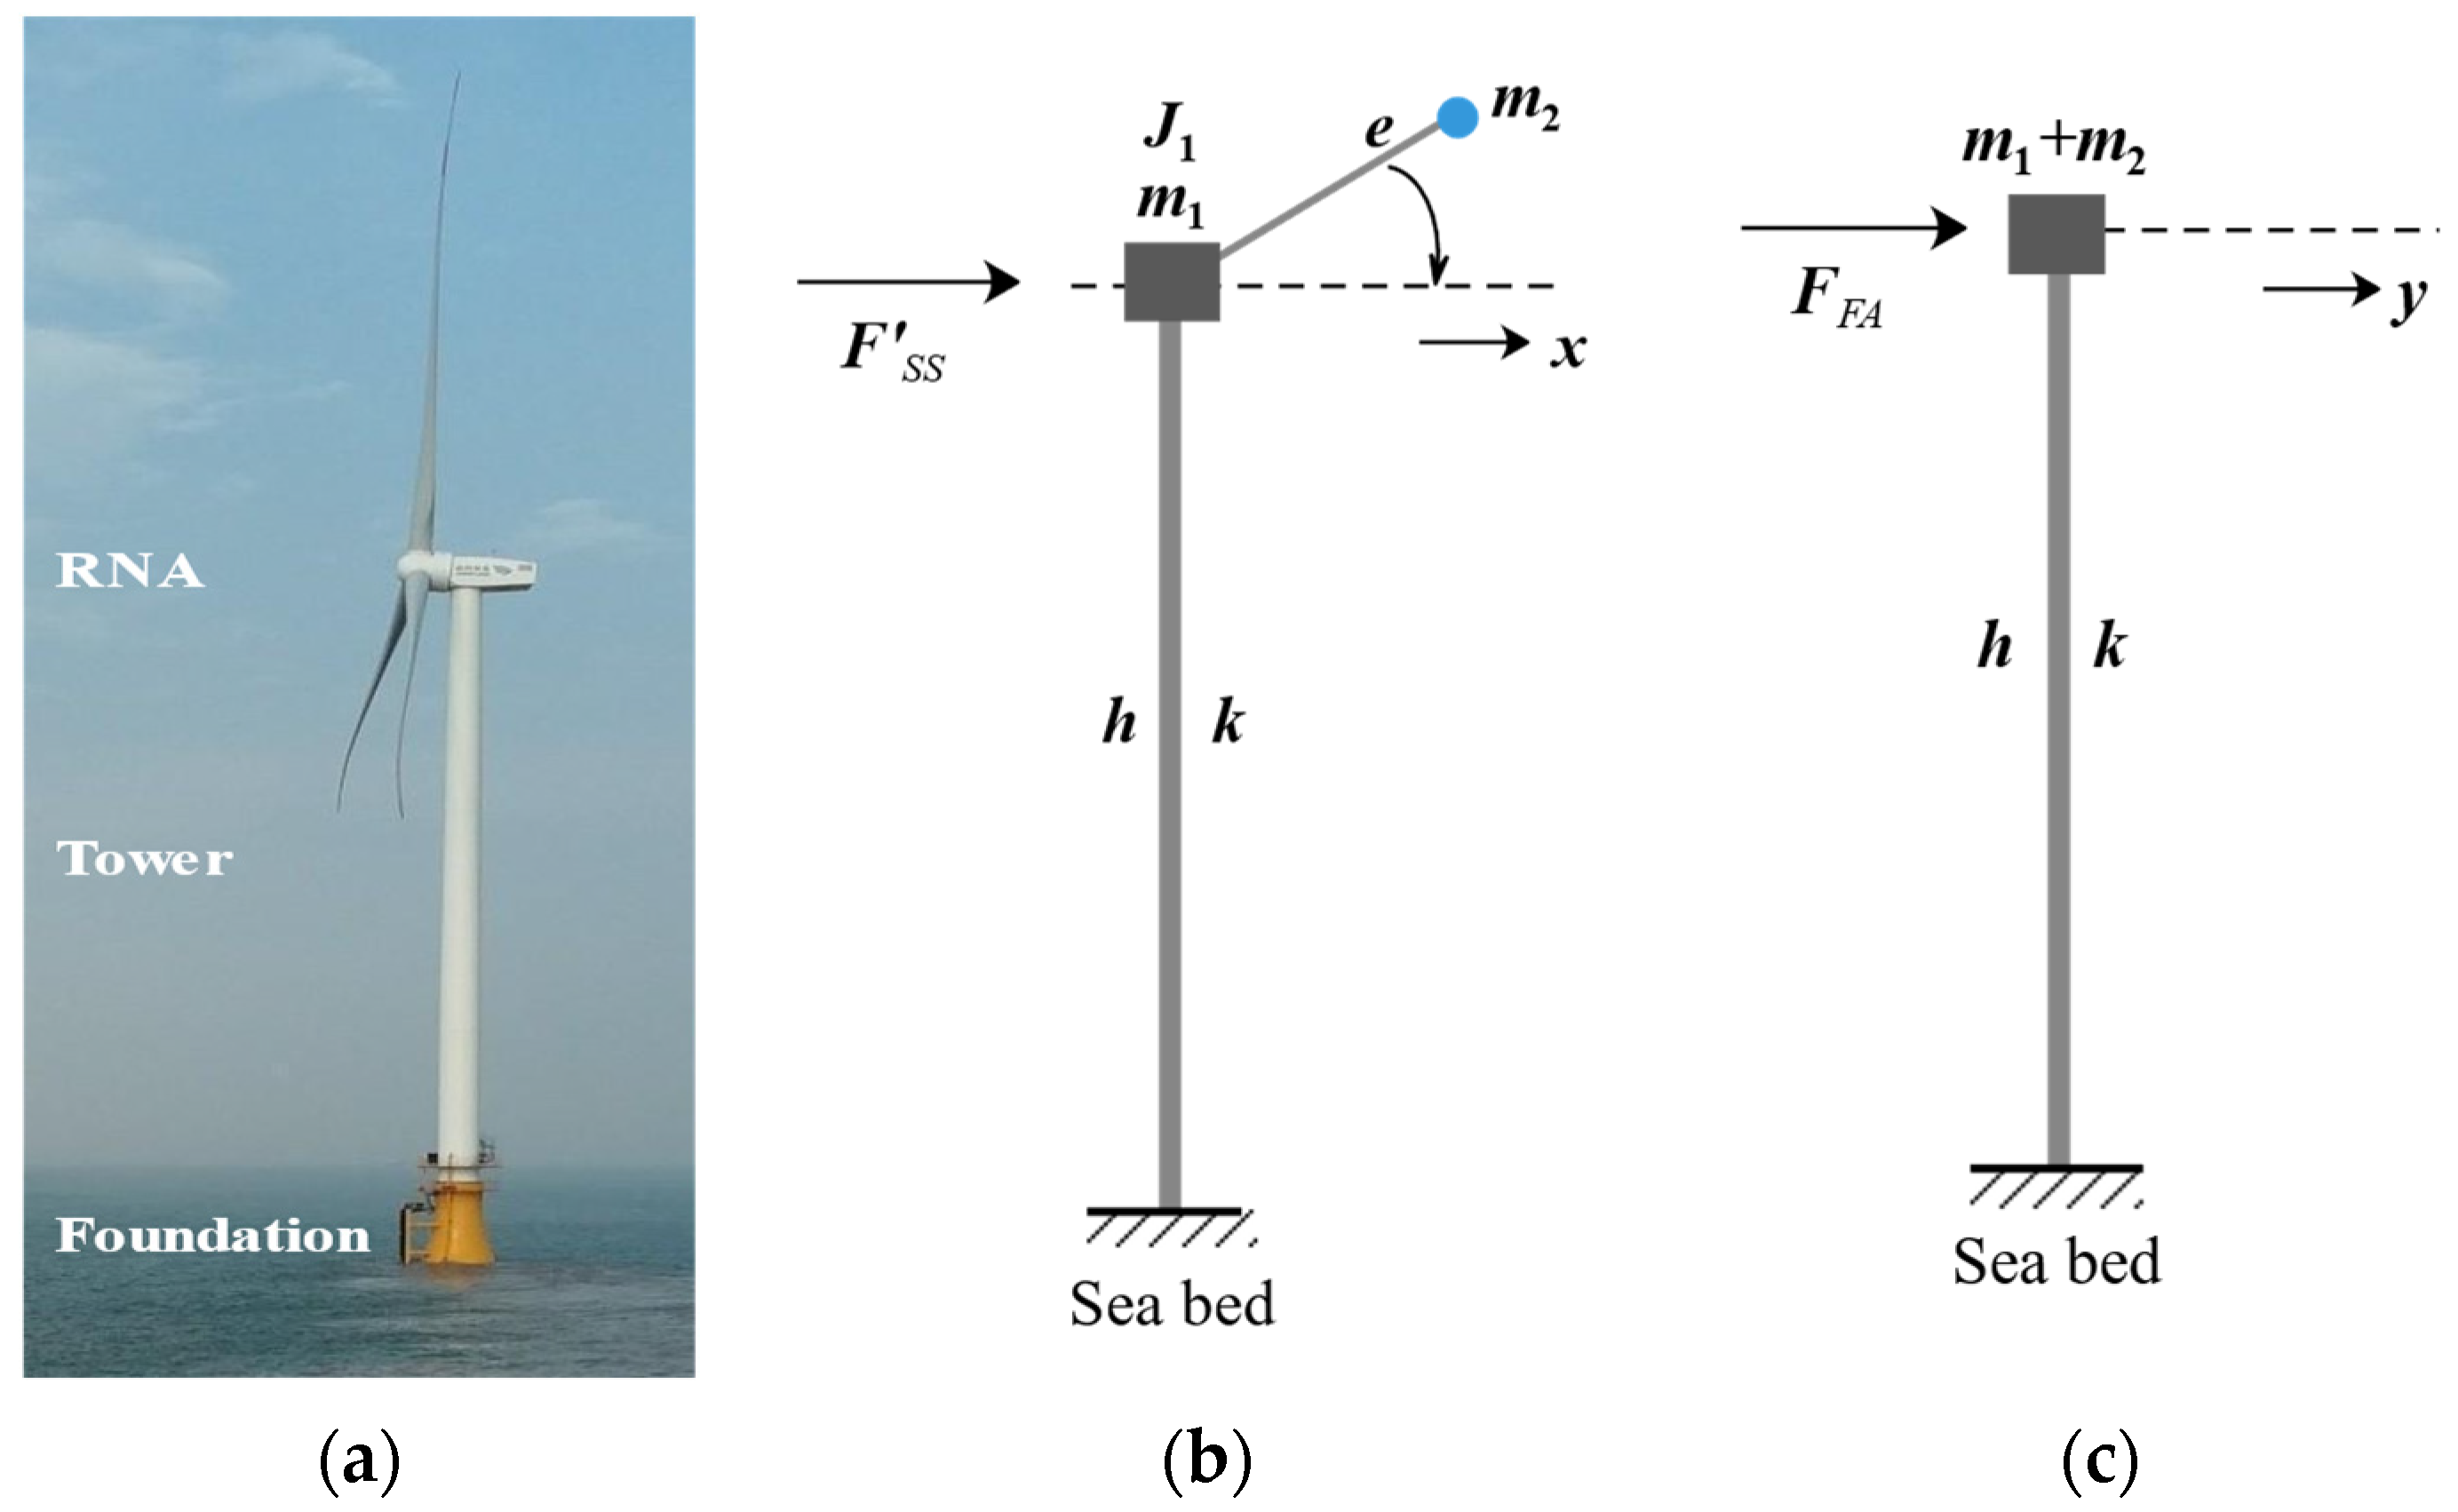
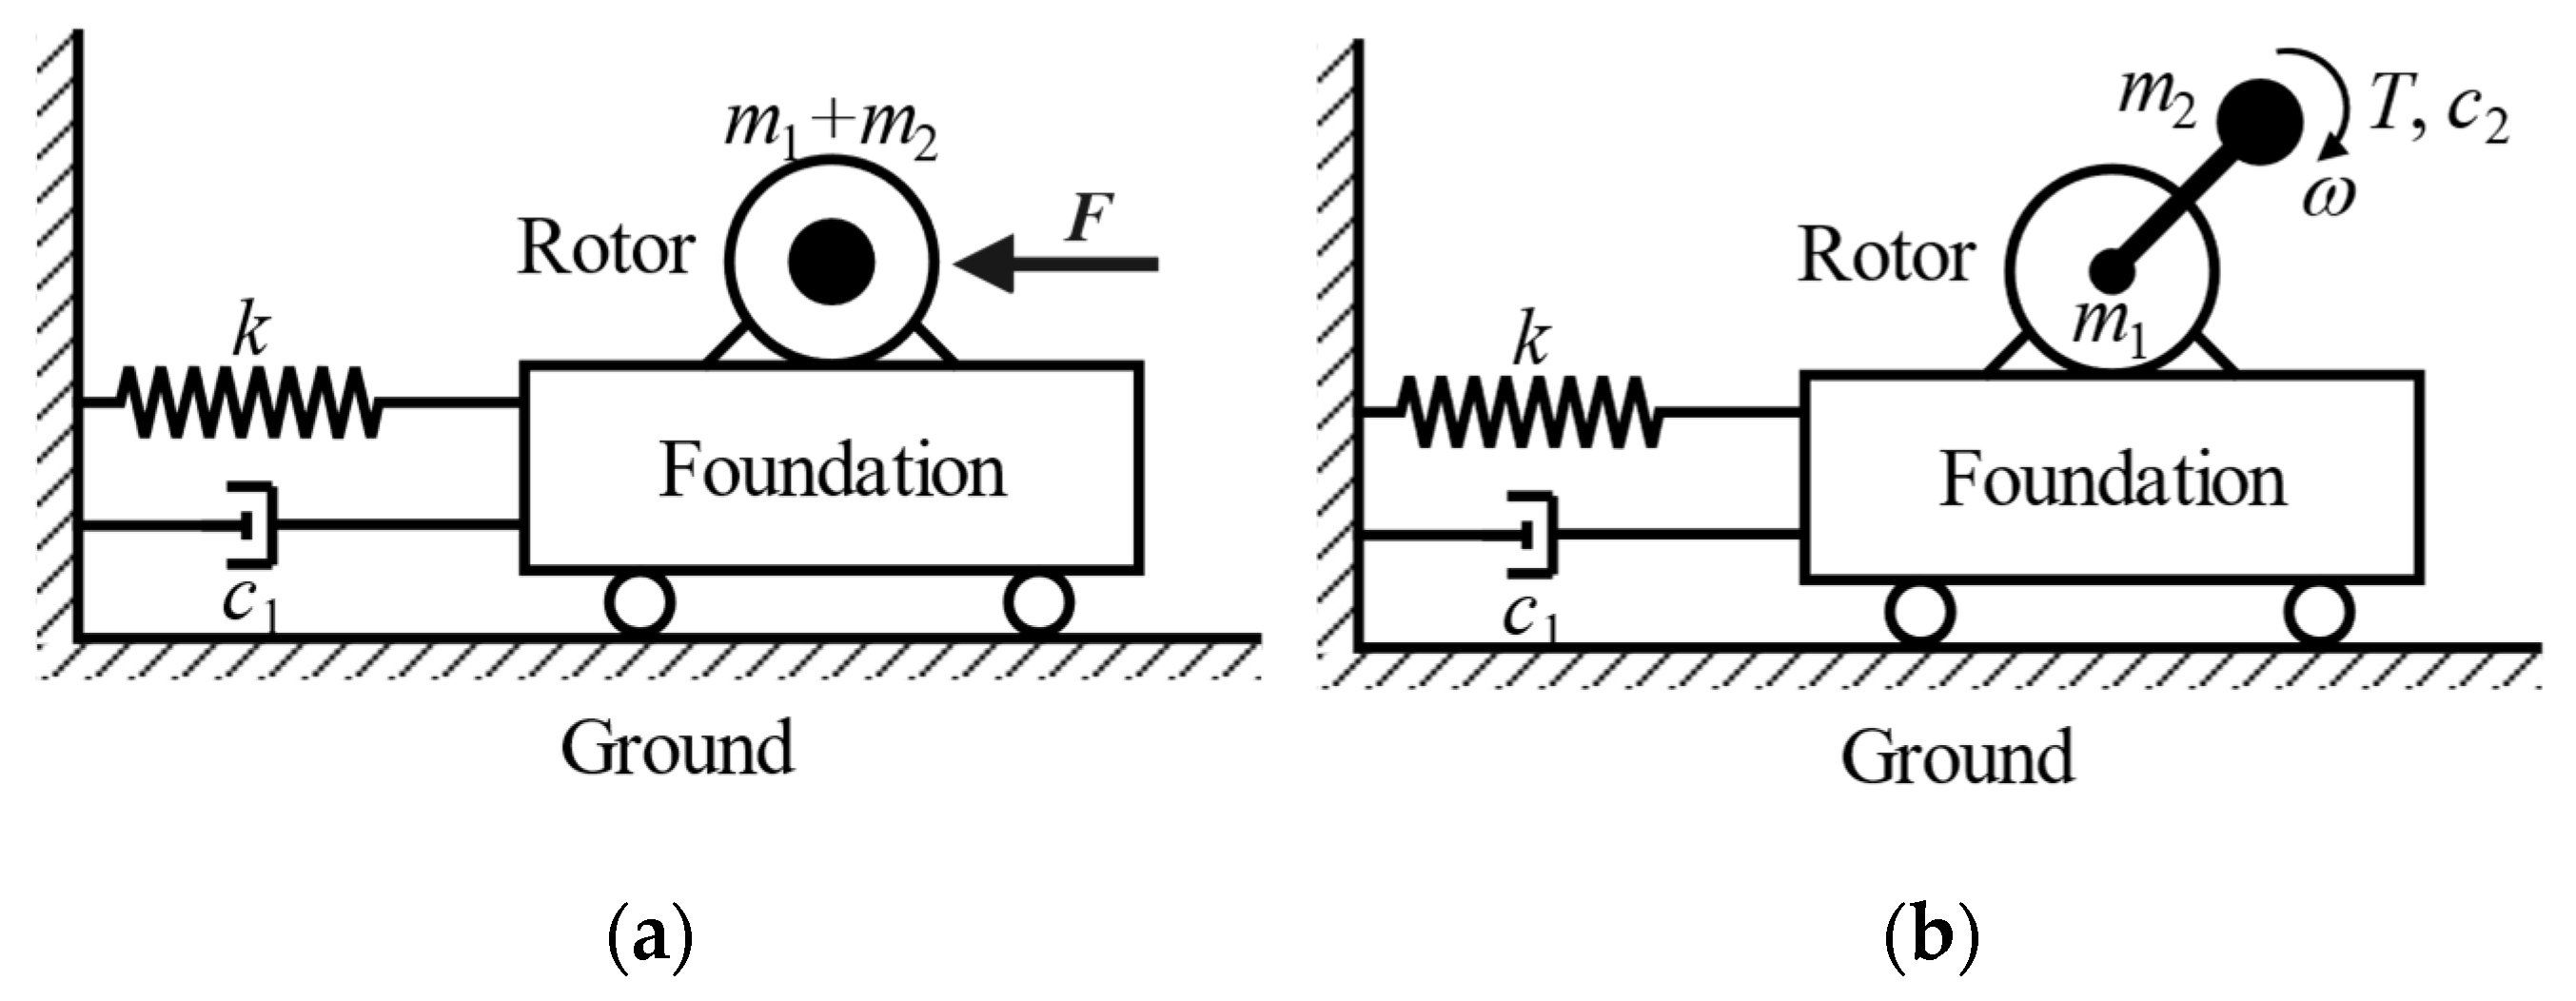
2. Theoretical Model of a WT

A WT consists of three components: the foundation, tower, and RNA (rotor–nacelle assembly), as shown in Figure 2a. For ease of analysis and calculation, structure and load simplification is necessary. In this paper, the WT structure was decomposed into two models along with the SS and FA directions, as shown in Figure 2b–c.
As shown in Figure 2b, in the SS direction, the tower and foundation of a WT were simplified as a cantilever column fixed to the seabed to support the whole structure. The column was considered not to change its height h as it undergoes lateral flexion. The stiffness related to horizontal motion is k. The mass m1 of RNA was supposed to be accumulated at the top of the column. The moment of inertia of this rotor was summed to J1. To simulate the 1P load resulting from mass imbalance, a small imbalanced mass m2 was introduced with the eccentricity e of the rotor axis. Its rotational speed is representative of the wind turbine’s rotation. Other loads were simplified as a concentrated force FSS located at the top of the cantilever. There was no rotatable mass imbalance in the FA direction, so total mass (m1 + m2) was accumulated at the center of the tower’s top (Figure 2c), and load was simplified as a concentrated force FFA. The mass overhang of the upper part is ignored in this paper.
To obtain the motion equation of the model in the SS direction, the Lagrange equation is introduced here.
d d t ( E q k ) E q k + V q k + ζ q k = Q k , k = 1 , 2 , n
where n is the number of degrees of freedom of the structure and
qk: motion in the k-th generalized coordinate, as displayed in Figure 1q1 is the horizontal motion in the x coordinate and q2 is the rotational motion of the imbalance mass in the θ coordinate;
E: kinetic energy;
V: potential energy;
ζ: dissipation function;
Qk: generalized force referring to the k-th coordinate.
Now, calculate the variables needed in Equation (1). The total kinetic energy E of the structure is
E = E 1 + E 2
where E1 is the kinetic energy of lumped mass m1 and E2 is the kinetic energy of imbalance mass m2:
E 1 = 1 2 m 1 x 2 + 1 2 J 1 θ 2
E 2 = 1 2 m 2 [ ( x e θ s i n θ ) 2 + ( e θ cos θ ) 2 ]
The total potential energy V was calculated by
V = V 0 + V 2
where V0 is the strain energy of the cantilever and V2 is the gravitational potential energy of m2:
V 0 = 1 2 k x 2
V 2 = m 2 g e sin θ
where g is the acceleration of gravity.
ξ is the dissipation function to model viscous structure damping and rotational damping:
ξ = 1 2 ( c x 2 + b θ 2 )
where b and c are damping constants referring to rotational and lateral motion, respectively.
Qk are conservative forces
Q 1 = F S S Q 2 = T
where T is the torque caused by the wind to introduce energy to the structure.
Now, introducing Equations (2)–(9) into Equation (1), the linear ordinary differential equations of motion for the model can be obtained:
{ M x + c x + k x = S ( θ s i n θ + θ 2 cos θ ) + F S S J θ + b θ = S ( x sin θ g cos θ ) + T
where M is the total mass of the upper part, S is the imbalance mass moment, and J is the total moment of inertia of this turbine, with expressions: M = m1 + m2, S = m2e, and J = J1 + m2e2.
Rewrite the functions as follows
{ x θ } = { J G 1 + S G 2 sin θ Δ M G 2 + S G 1 sin θ Δ }
with
G 1 = F S S + S θ 2 cos θ k x - c x
G 2 = T b θ S g cos θ
Δ = M J S 2 sin 2 θ
Similarly, the equation used to describe the FA motion can be arranged in the form:
M y + c y + k y = F F A
Structural damping c is supposed to be the same as that in the SS direction.
Removing the turbulent wind load, the rest load in the FA direction is mainly the 3P load under the effect of wind shear and tower shadow [16]. For ease of calculation, this paper simplifies FA load as a simple, sinusoidal function with load amplitude F (N) and frequency w (Hz).
F F A = F sin ( 6 π w t )
Rewrite Equation (15) as follows:
y = F F A k y c y M
Based on the analysis above, the 3 × 1 equation matrix (18) combining Equations (11) and (17) is the mathematical model to describe the vibration of WTs.
{ x θ y } = { J G 1 + S G 2 sin θ Δ M G 2 + S G 1 sin θ Δ F 3 P k y c y M }
To solve the second-order differential equations, order reduction is needed. Build a 6 × 1 matrix:
q = [ x x θ θ y y ]
Therefore, a group of first-order differential equations can be obtained.
d q d t = [ x x θ θ y y ] = [ q ( 2 ) ( J G 1 + S G 2 sin ( q ( 3 ) ) ) / Δ q ( 4 ) ( M G 2 + S G 1 sin ( q ( 3 ) ) ) / Δ q ( 6 ) ( F 3 P k y c y ) / M ]
Hence, the standard fourth-order Runge–Kutta algorithm can be used to solve the equation group (20).

3. Influence Analysis of Different Parameters

3.1. Parameters Prepared for Calculation

Equation (18) includes several parameters: b, c, M, k, S, F, J, and T. When solving the equations, the value ranges of these parameters need to be determined before calculation. Therefore, the numeric value of an OWT supported by a bucket foundation [17,18] is used in this paper. The TBF (Turbine with Bucket Foundation) was installed and connected to the grid in 2017. Its rated power is 3.0 MW, blade diameter is 120 m, and the hub height above sea level is 90 m. The rotation speed ranges from 7.5 RPM to 13.5 RPM. The parameters listed in Table 1 were obtained or estimated from this TBF. The values used in the later analysis are based on Table 1. Note that natural frequency ωn = (k/M)1/2/(2π) = 0.35 Hz, and damping ratio ζ = c × (kM)−1/2/2 = 0.02.
Steady-stage time histories of the rotation and vibration response of a specific case are displayed in Figure 3. Take the mean value of the 100 s to represent the rotational frequency of this period, and take the RMS (Root mean square) values to represent displacements.

3.2. Influences of b and c

To explore the influences of rotational damping b and structural damping c on the vibration of WTs, the value range of b was set to between 1 × 10⁵ and 6 × 10⁵ N·m·s, and five values of c were selected (8444.45, 12,666.68, 16,888.91, 21,111.13, and 25,333.36 N·s/m), leading the damping ratio ζ to have values of 0.01, 0.015, 0.02, 0.025, and 0.03, respectively. With torque T = 3.5 × 10⁵ N·m, S = 2 × 10⁴ kg·m, F = 3 × 10³ N, and the other parameters being the same as those listed in Table 1, the relative vibration displacements (displacement of a case divided by the maximum value of total cases) in two directions are plotted in Figure 4.
It can be seen from Figure 4a,c that displacements all have a trend of increasing first and then decreasing, except for the SS displacement at c = 8444.45 N·s/m in Figure 4a. However, from Figure 4b,d, the change in the two displacements with structural damping c is not obvious, which means that, in the range (0.01–0.03) of the damping ratio ζ, structural damping had a slight impact on vibration response. Therefore, in later studies, the structural damping ratio ζ is set to be a constant of 0.02.

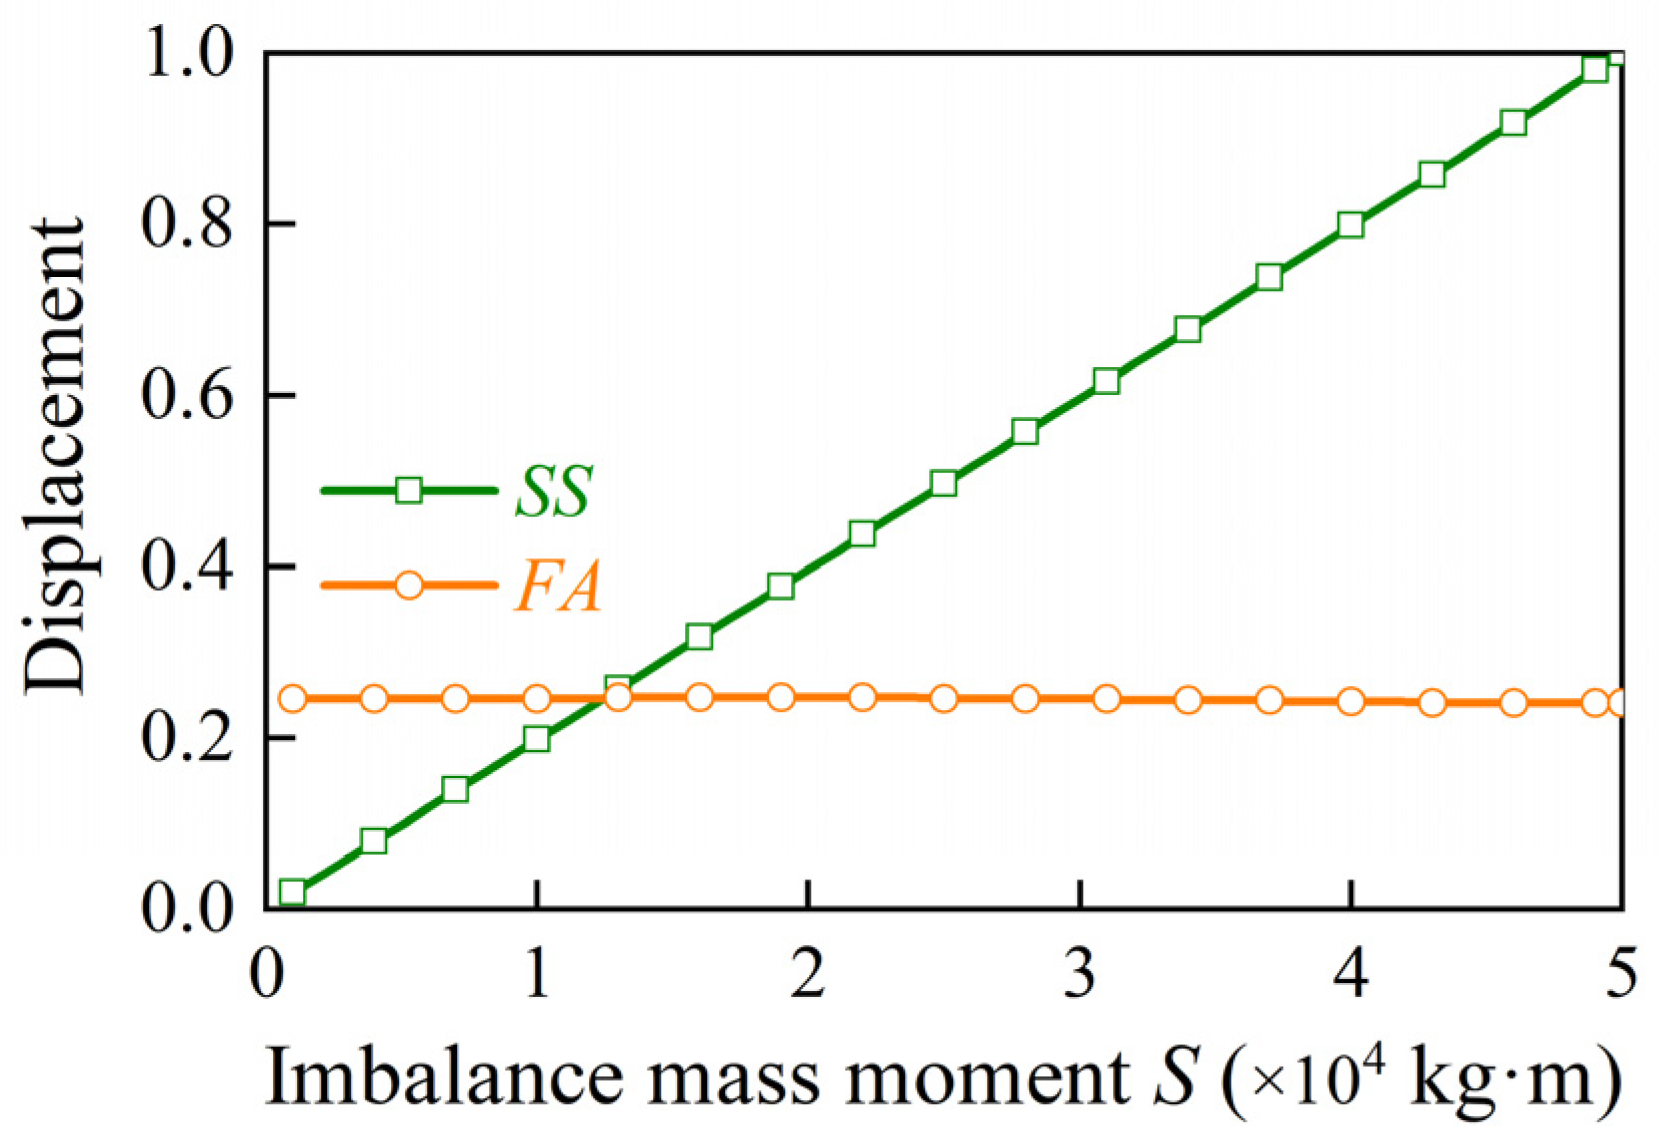
3.3. Influence of S and F

For a specific wind turbine, parameters such as the total mass M and structural stiffness k are certain values. At this point, it is more practical to explore the influence of imbalance mass moment S and the 3P load F on the vibration of WTs.
The influence of S on the structural vibration of WT is shown in Figure 5. Torque T = 3.5 × 10⁵ N·m, F = 3 × 10³ N, and rotational frequency = 0.125 Hz in all cases, and the other parameters are the same as those listed in Table 1. With the increase in S, the SS displacement increased linearly while the FA displacement remained almost unchanged, indicating that S did not affect FA responses.
Figure 6 shows the influence of FA load F on the vibration of the structure. Torque T = 3.5 × 10⁵ N·m, S = 2 × 10⁴ kg·m, and rotational frequency = 0.125 Hz in all cases, and the other parameters are the same as those listed in Table 1. The FA displacement increased linearly while F had no obvious effect on the SS responses. This is exactly the opposite of the effect of S, as shown in Figure 5.

3.4. Influence of Torque T

As the wind speed increases, the energy captured by a WT usually increases, reflected in an increase in torque T. Assuming that T rises from 3 × 10⁵ to 7 × 10⁵ N·m, the rotational frequency and displacements are plotted with T in Figure 7.
With the increase in torque T, the rotational frequency ω increased linearly from 0.107 Hz to 0.245 Hz, SS displacement increased monotonically with an increasing growth rate, and FA displacement showed a trend of increasing first and then decreasing. The different performance was determined by the difference between the load frequency and natural frequency. As for the SS response, the closer ω was to the natural frequency of 0.35 Hz, the larger the SS displacement was. As for the FA response, the load frequency was the 3P frequency, so the maximum occurred when ω was 0.117 Hz.

4. Resonance Phenomenon

4.1. The Sommerfeld Effect

To describe the Sommerfeld Effect, build two rotor systems, as shown in Figure 8. The first system consists of a flexible foundation and a fixed rotor without imbalance mass, which proceeds with a reciprocating motion under the horizontal load F. The rotor of the second system is unbalanced, with imbalance mass m2 and eccentricity e, whose rotation is supplied by an external source of energy T, and the foundation and rotor move horizontally on the ground driven by the rotation of the imbalance mass.
The following parameters are considered: m1 = 96 kg, m2 = 4 kg, e = 0.5 m, k = 3.95 × 10³ N/m, c1 = 100 N·s/m, c2 = 0.5 N·m·s, load F = m22cos(2πωt), and T = 1–11 N·m. Figure 9a shows the relationship between the horizontal displacement and load frequency (for system 1) or rotational frequency (for system 2). For system 1, displacement changed continuously with the load frequency and peaked at 1 Hz resulting from the resonance. For system 2, the trend of displacement was the same as that in system 1, but a gap forms at both the left and right sides around 1 Hz, indicating that the motion near the natural frequency of system 2 is different to that of system 1, since there is an eccentric mass. Therefore, the vibration behavior of the rotating eccentric mass near the natural frequency is a new dynamic problem, and it cannot be ignored by simplifying it as a concentrated 1P load, like system 1.
Figure 9b is a detailed plot of system 2 as torque T rises and falls. The arrows show the direction of energy change. As the energy supply T rises, the rotor speed gradually increases until it approaches the natural frequency of system 2. Accordingly, the vibration amplitude of this system increases rapidly from a to b. Afterward, if the energy supply T rises further, the rotor speed will suddenly jump to a higher value; meanwhile, the vibration amplitude will decrease rapidly from b to c, and there will be no steady vibration within the zone between b and c. Further, when the external energy continues to rise, displacement decreases slightly, and most energy is used for rotation. A similar phenomenon can be observed when the external energy supply gradually falls, but the transition path is from c to a via d, which is different from the process under rising energy. There is no steady vibration within the zone between d and a. This is the Sommerfeld Effect, and it has two significant characteristics:
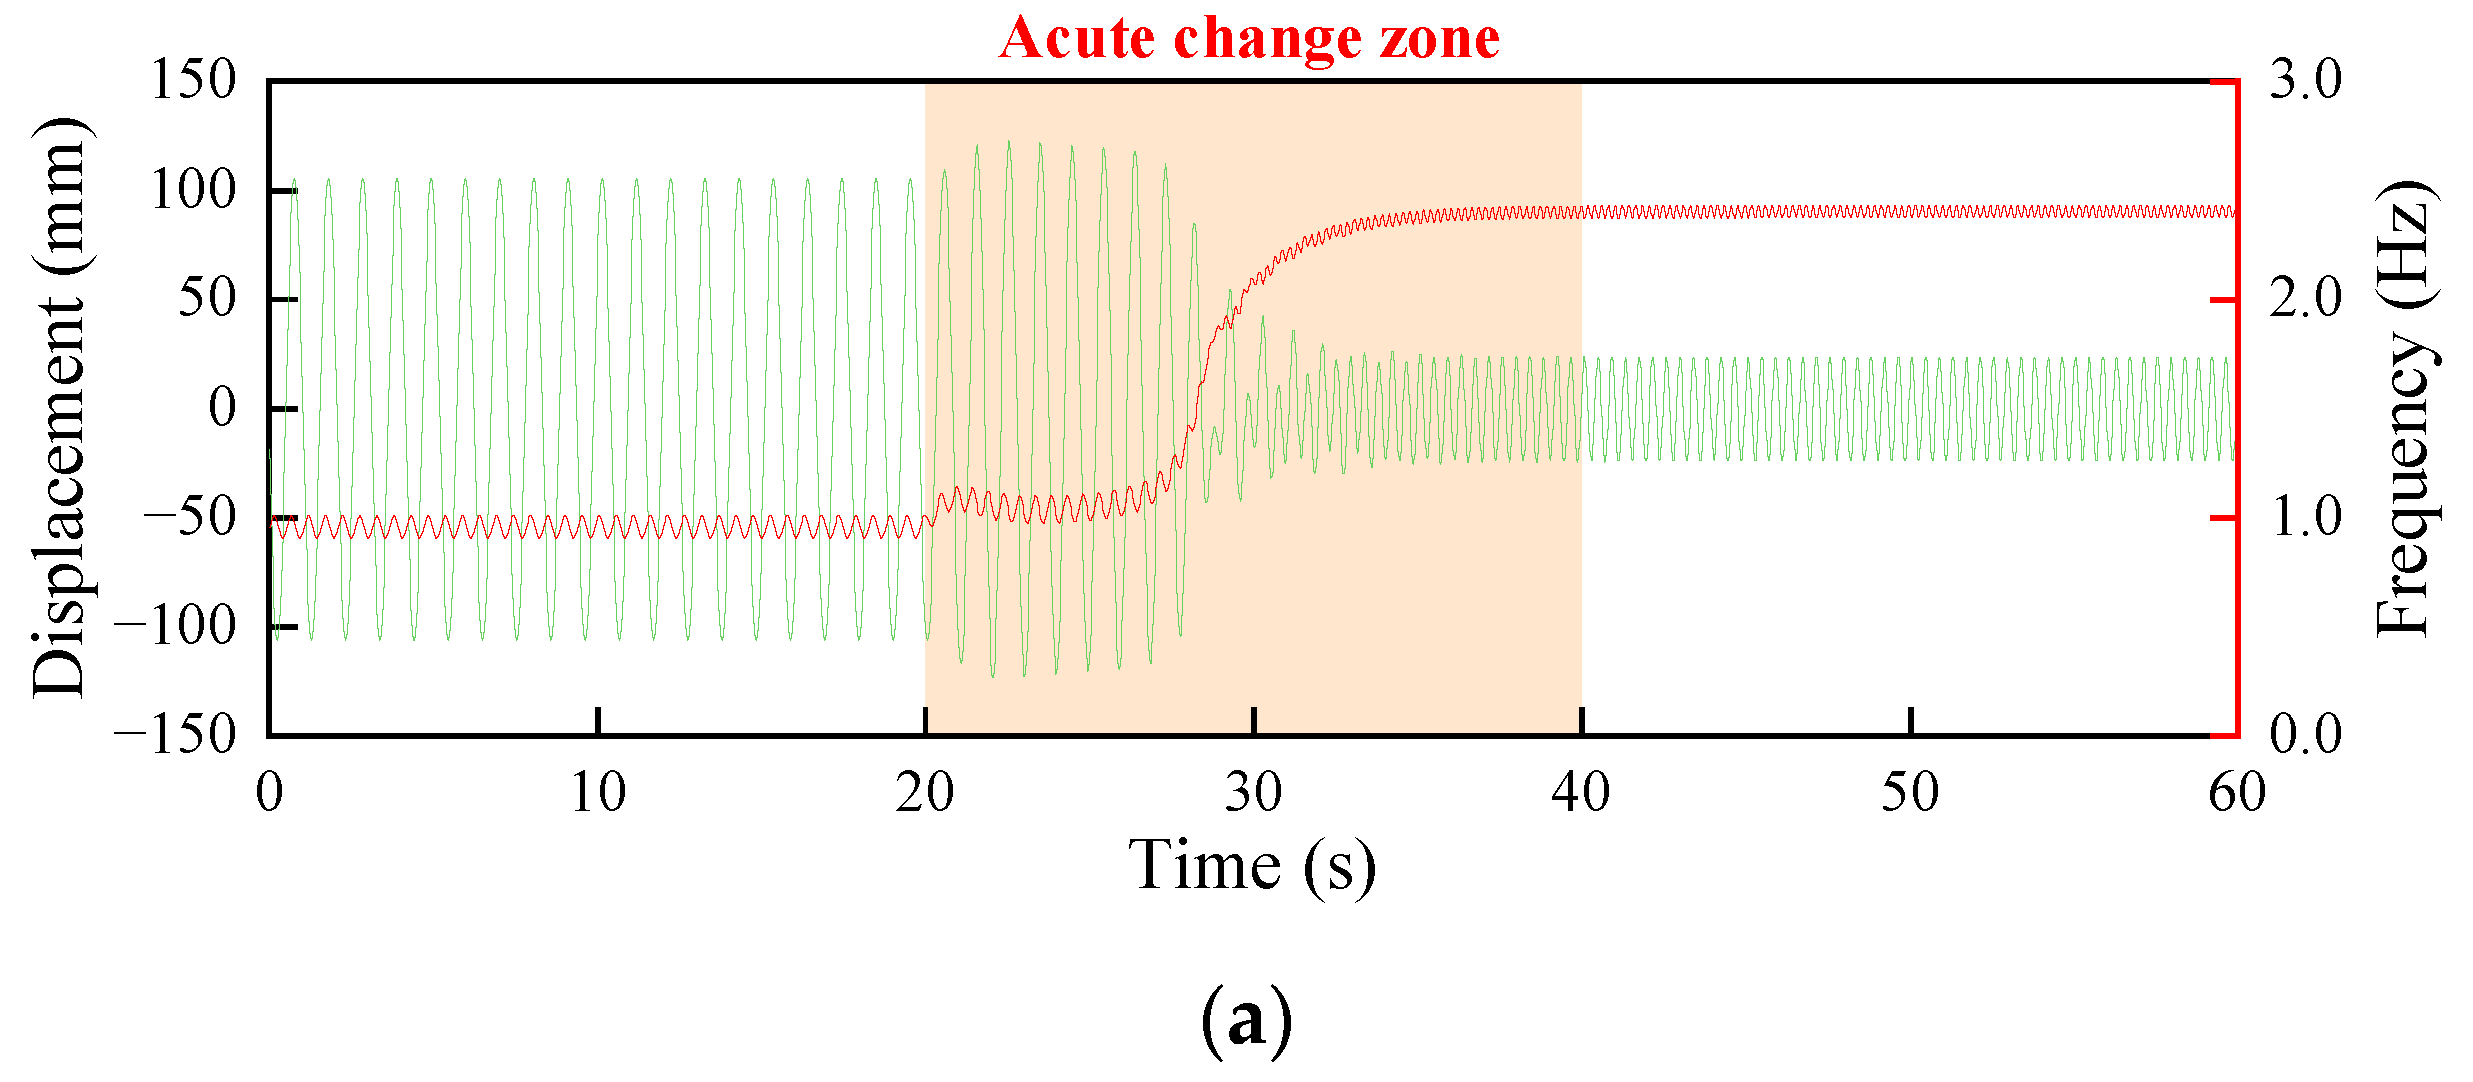
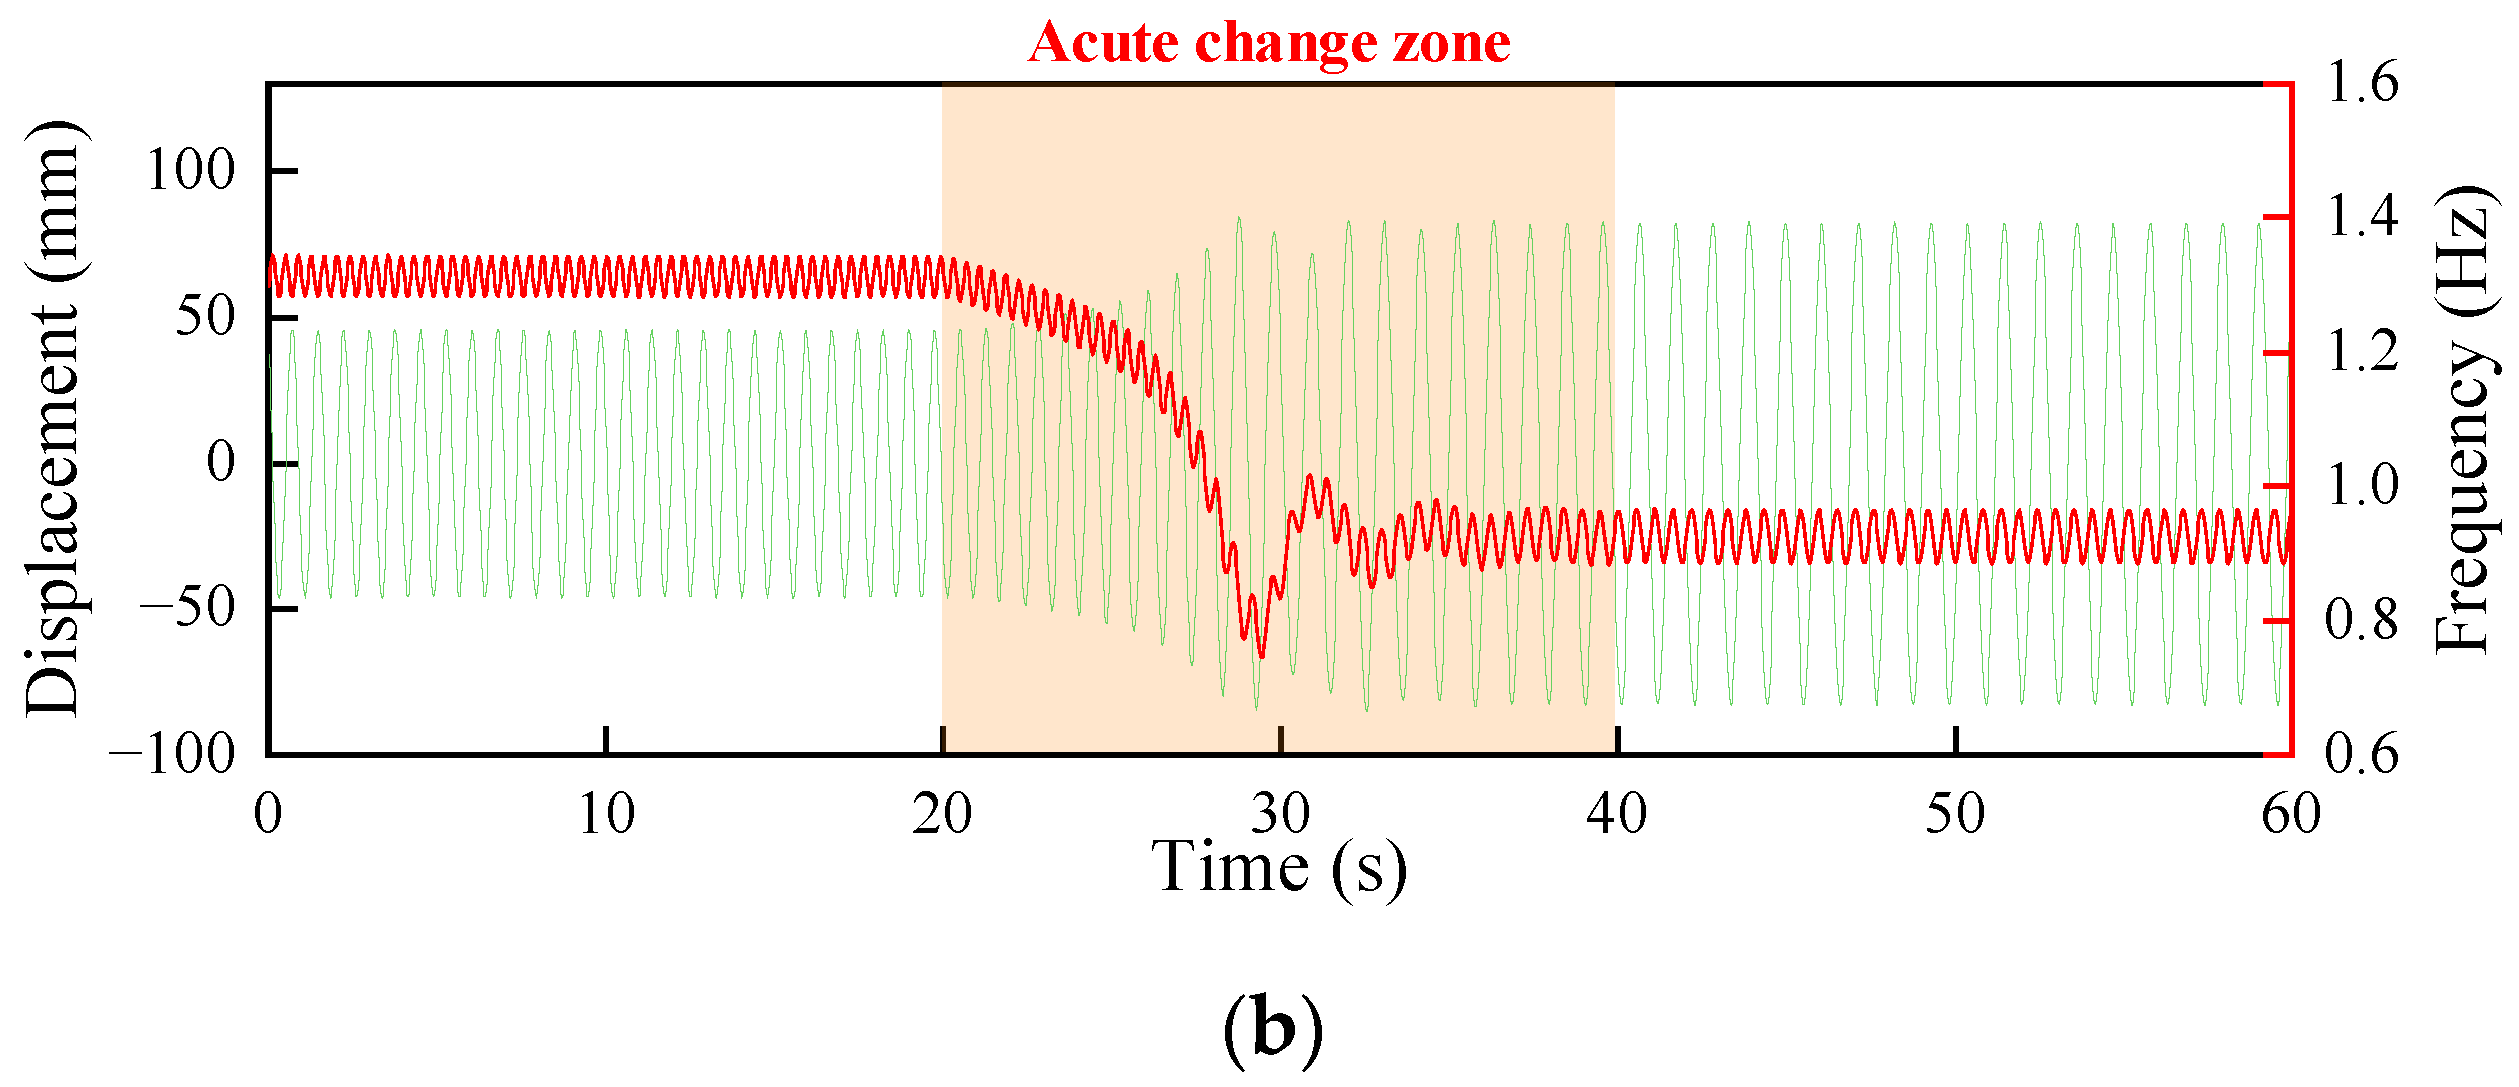
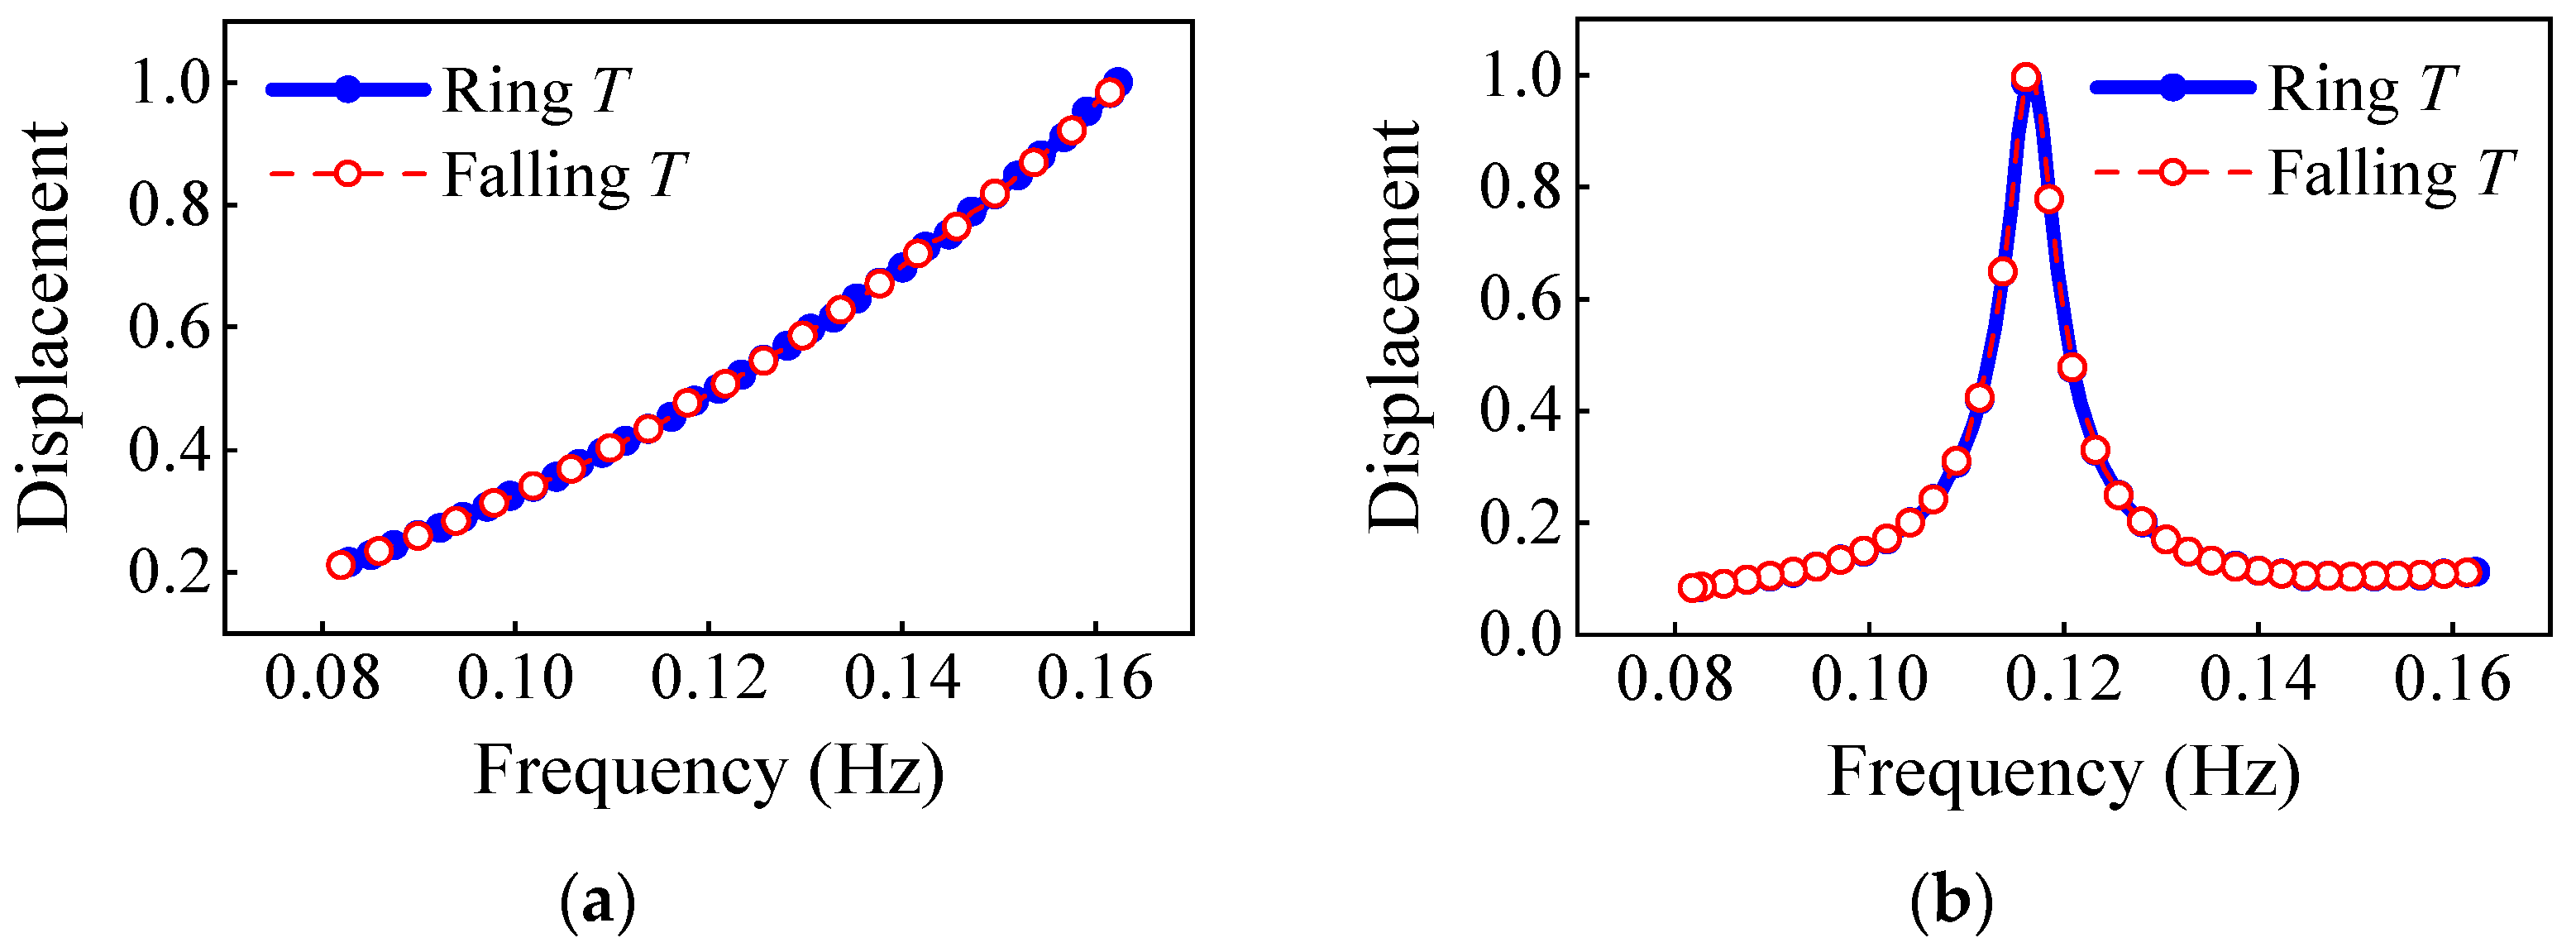
  • The rotor speed will ‘jump’ when passing the natural frequency, resulting in a sudden increase or decrease in the vibration response;
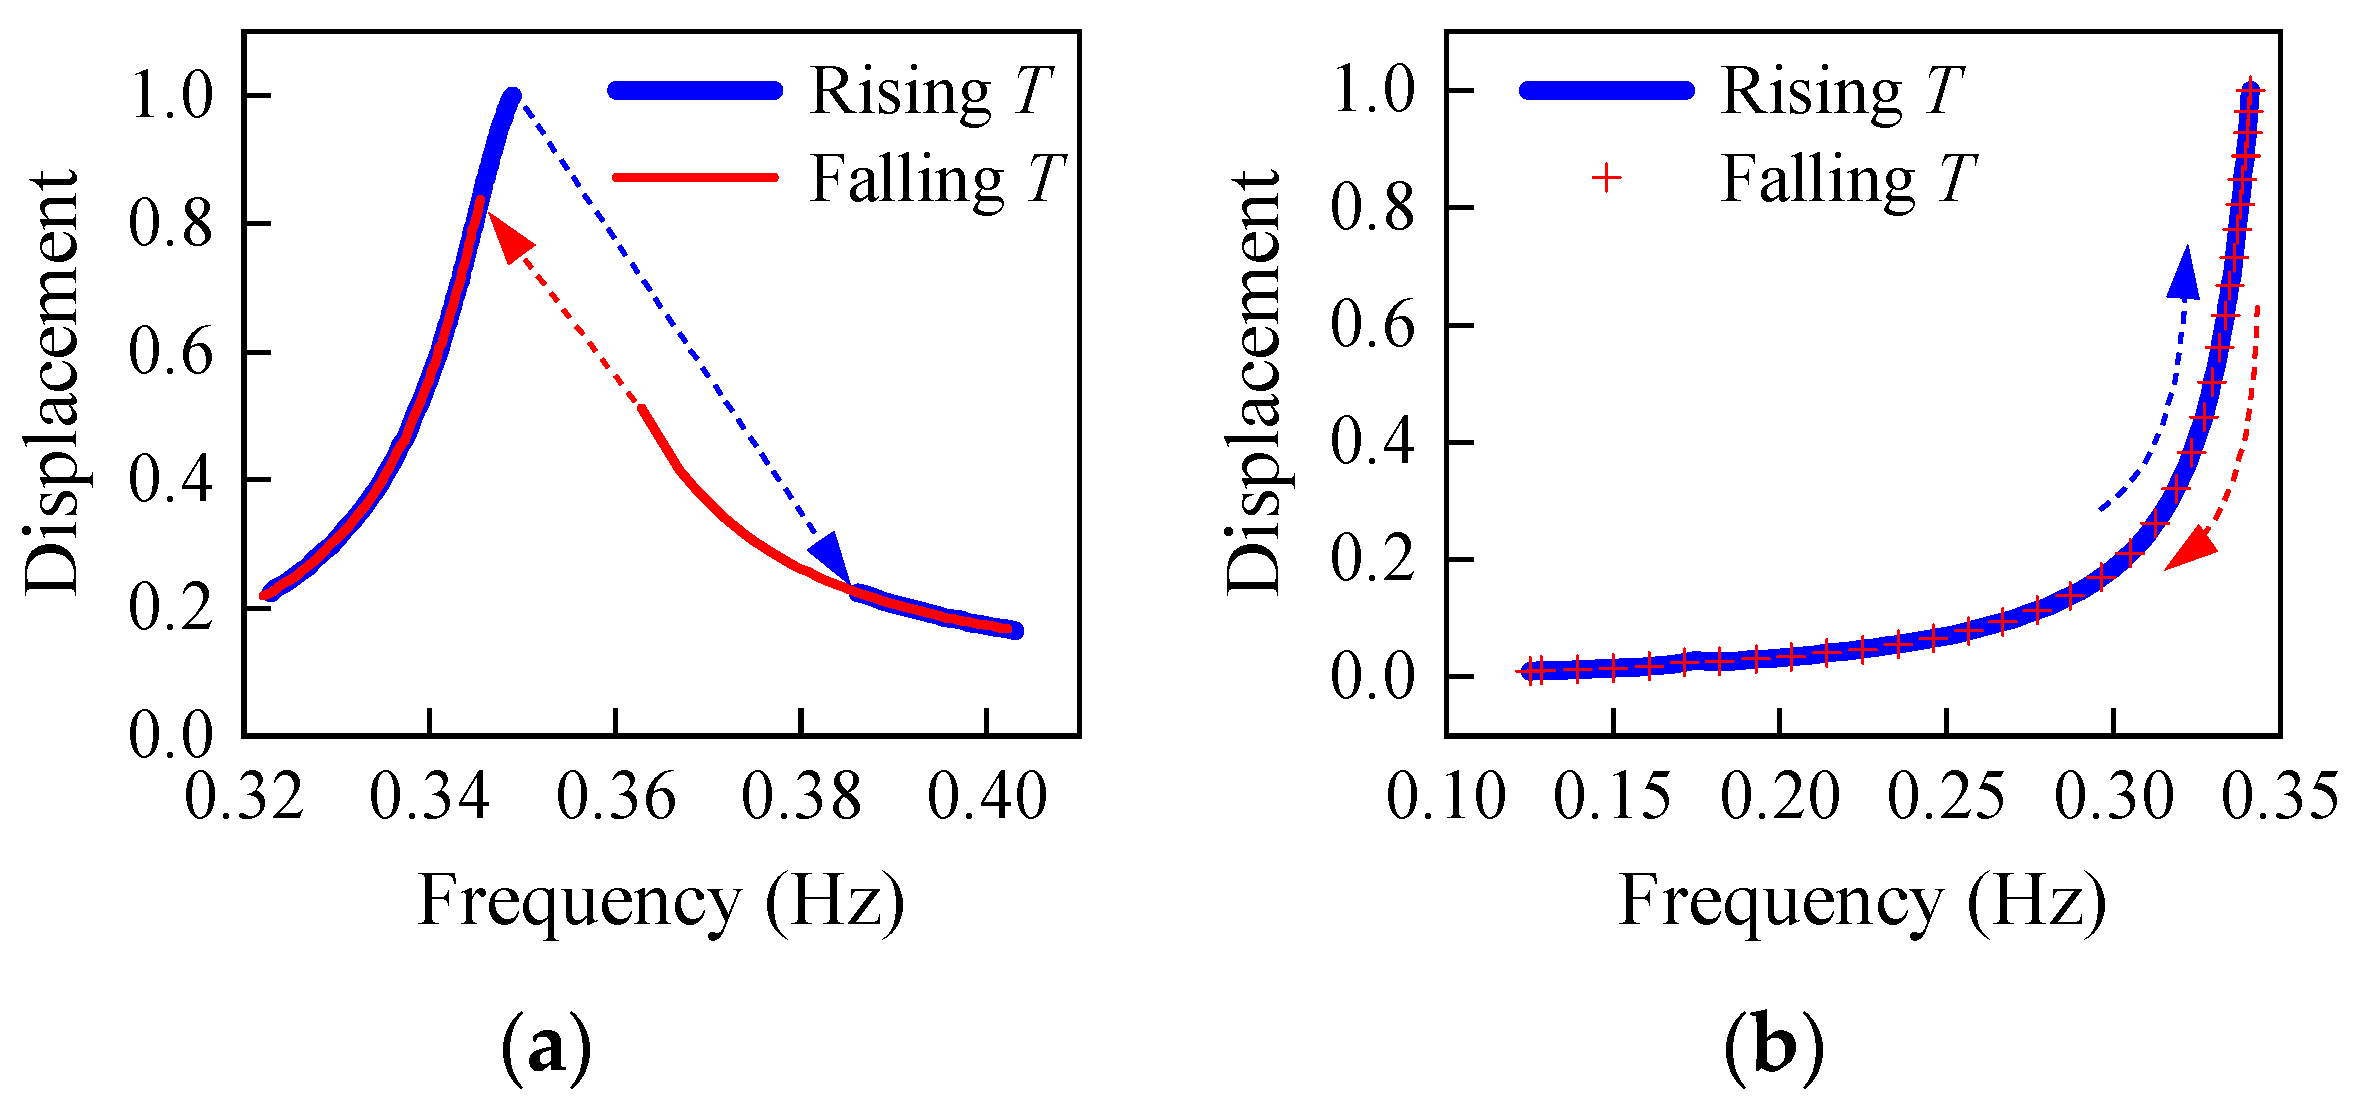
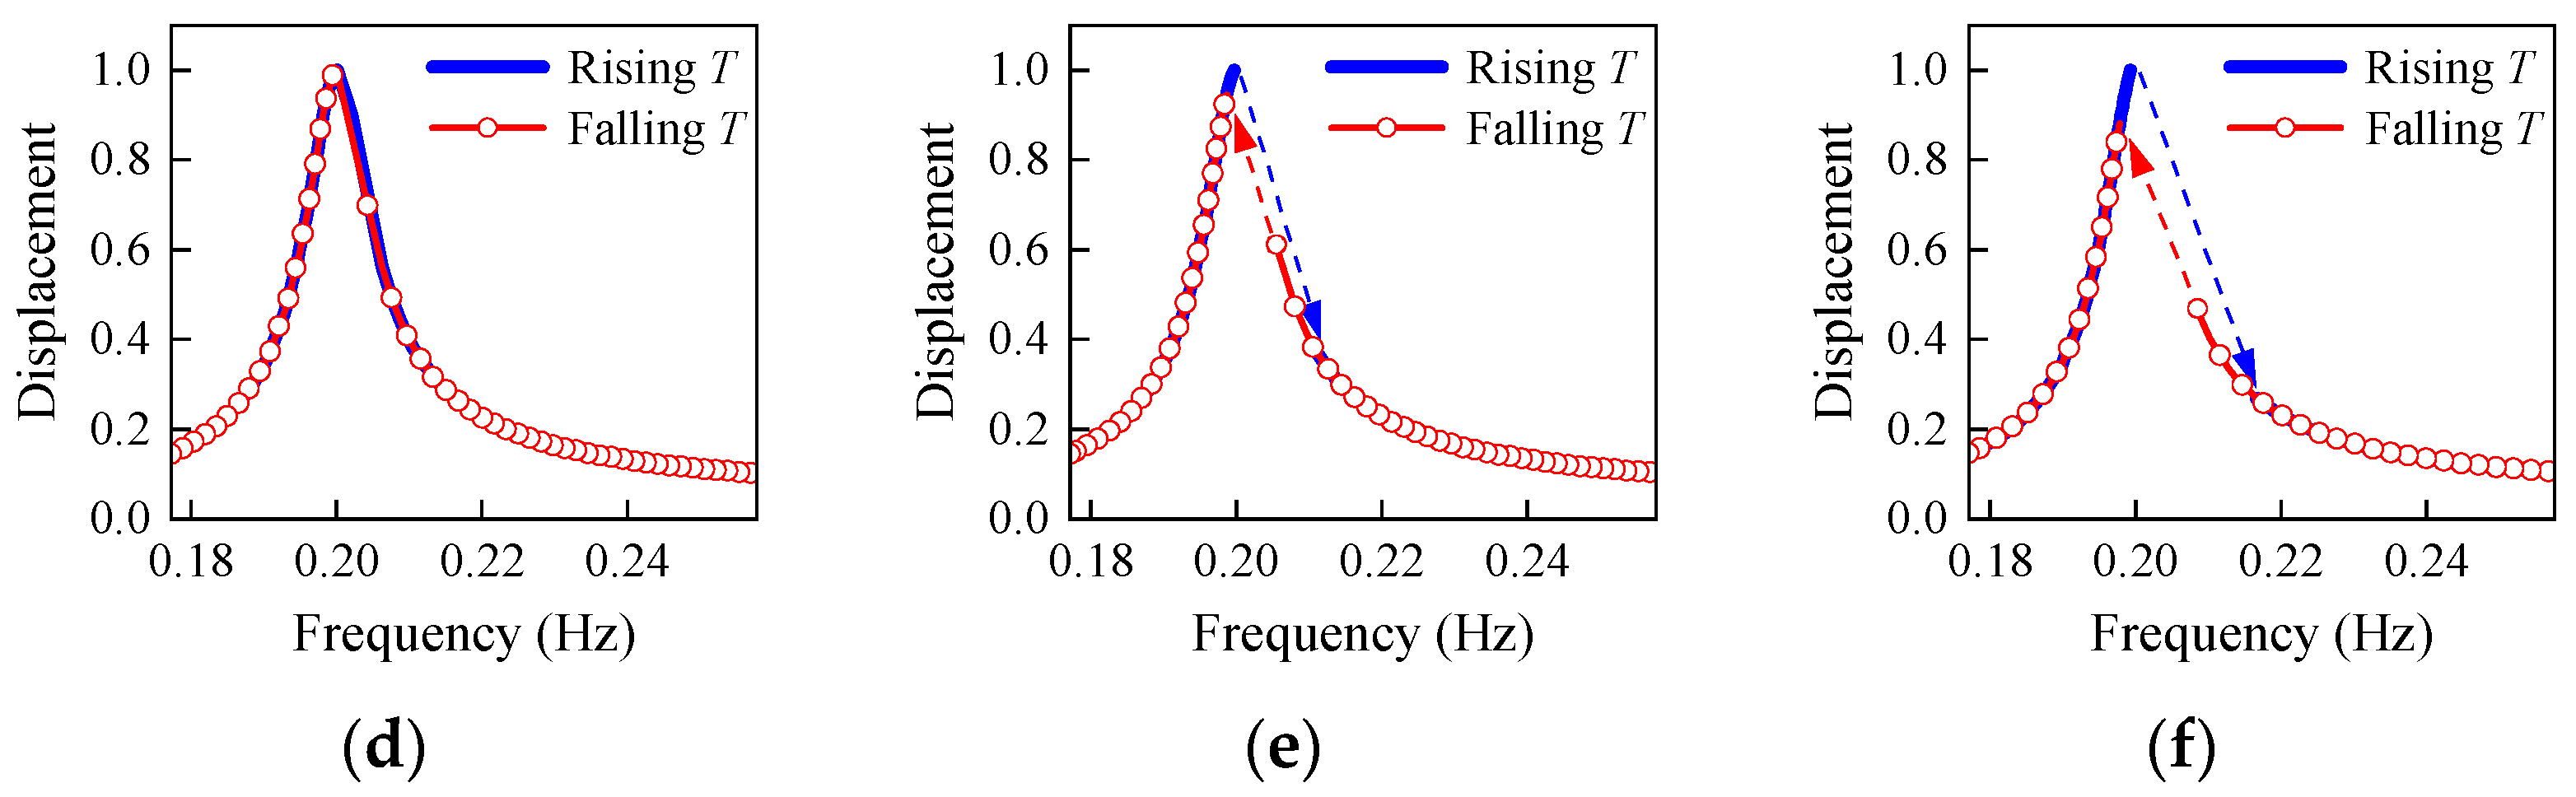
  • The jump phenomenon transits along different paths when the external energy supply rises or falls.
The time history of the jump phenomenon is shown in Figure 10—sudden changes in displacement and rotation in the acute change zone are severe, which is harmful to structures. Therefore, the Sommerfeld Effect has been widely investigated for the purpose of relieving or avoiding the sharp vibration when the rotation speed needs to pass the natural frequency, especially in mechanical rotor engineering [19,20,21].

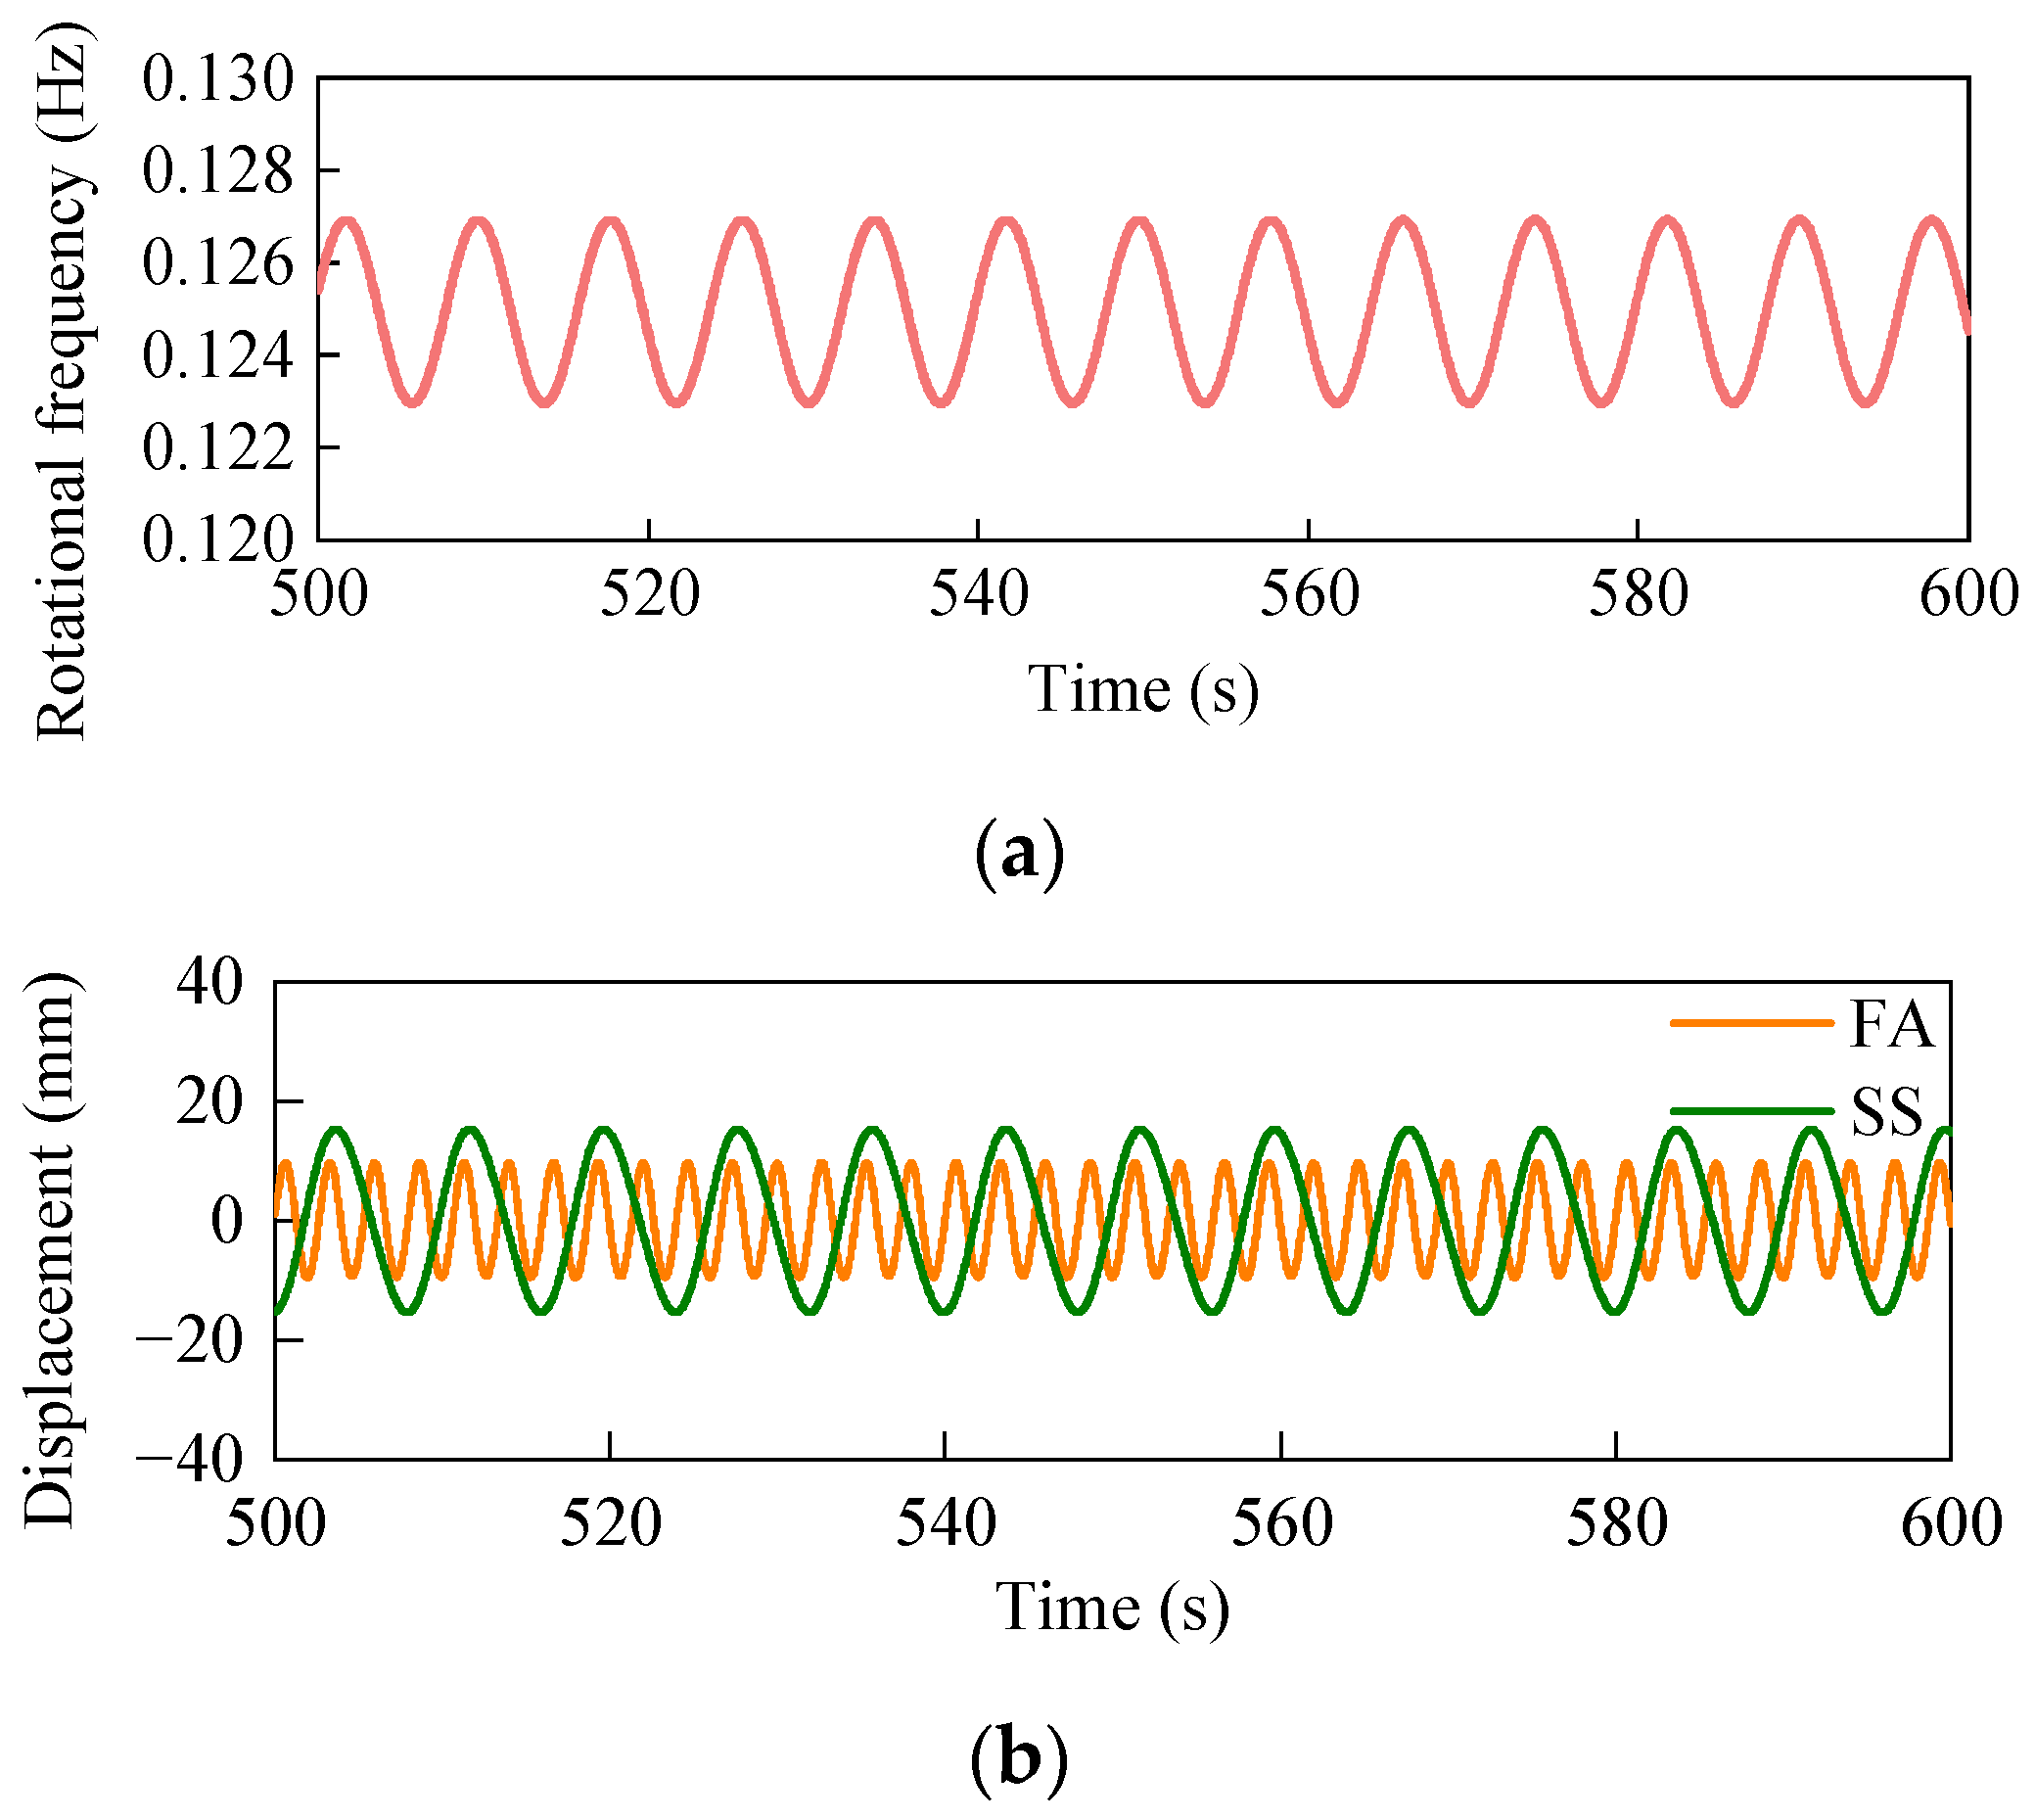
4.2. The Sommerfeld Effect of WT Structure

To design a wind turbine system, there are three zones for the natural frequency of the tower to choose from: (a) ‘soft–stiff’ zone, where the natural frequency of the tower is between the 1P range and the 3P range; (b) ‘soft–soft’ zone, where the natural frequency is below the 1P range; and (c) ‘stiff–stiff’ zone, where the natural frequency is exceeding the 3P range. The structure is too flexible (which means a huge dynamic amplitude and damage risk) if its natural frequency falls within the ‘soft–soft’ zone, and too stiff (which means heavy foundation and expensive costs) if it falls within the ‘stiff–stiff’ zone, so the most common design in current projects is ‘soft–stiff’.
However, to make full use of wind resources, WTs become more and more ‘soft’, a result partly of the application of flexible towers, such as steel–concrete towers, but also of the application of floating types of turbines [22,23]. For soft WTs, their natural frequencies are usually in the range of 0.15–0.25 Hz, which is also the typical rotation region of turbines, resulting in a coincidence of natural frequency with rotational frequency.
Therefore, the Sommerfeld Effect of the soft–stiff and soft principles are considered separately in this part, and the FA and SS directions are likewise studied alone. The flowchart of the works in this subsection is shown in Figure 11, where ‘√’ indicates that the case is discussed and ‘×’ indicates that the case is not discussed. The stiff design is not included in the work as it is not practical.

4.2.1. FA Direction

There is no rotatable imbalance mass in the FA direction of a WT, and the imbalance in the SS direction does not affect the FA response (Figure 5), which means that it does not meet the requirement for the Sommerfeld Effect to happen, so there is no Sommerfeld Effect in the FA direction.

4.2.2. SS Direction of Soft–Stiff WT System

The SS model of WT is a typical, non-ideal system with an eccentric rotor (imbalanced mass rotates caused by blades rotating) fixed on a flexible foundation, which seems to be a possibility of the Sommerfeld Effect.
Set the imbalance mass moment S = 1.92 × 10⁵ kg·m and let torque T rise from 9 × 10⁵ N·m to 1.12 × 10⁶ N·m, leading the rotational frequency of the structure to pass natural frequency. Figure 12a shows the performance of the SS model of the soft–stiff WT system. Jump phenomena are observed as the rotational frequency passes 0.35 Hz under both rising and falling levels of T, and the paths are different. This is the Sommerfeld Effect. The gap zone is between 0.345 Hz and 0.386 Hz.
However, for soft–stiff WT systems, it has already been considered in the design phase that the natural frequency is ±10% away from the rotational speed’s ranges [24]. For example, the maximum rotational frequency for TBF is 0.225 Hz, which is far away from the natural frequency, and it cannot produce jump vibration if rotation does not pass the natural frequency (Figure 12b). This means that there is no Sommerfeld Effect in the SS direction.

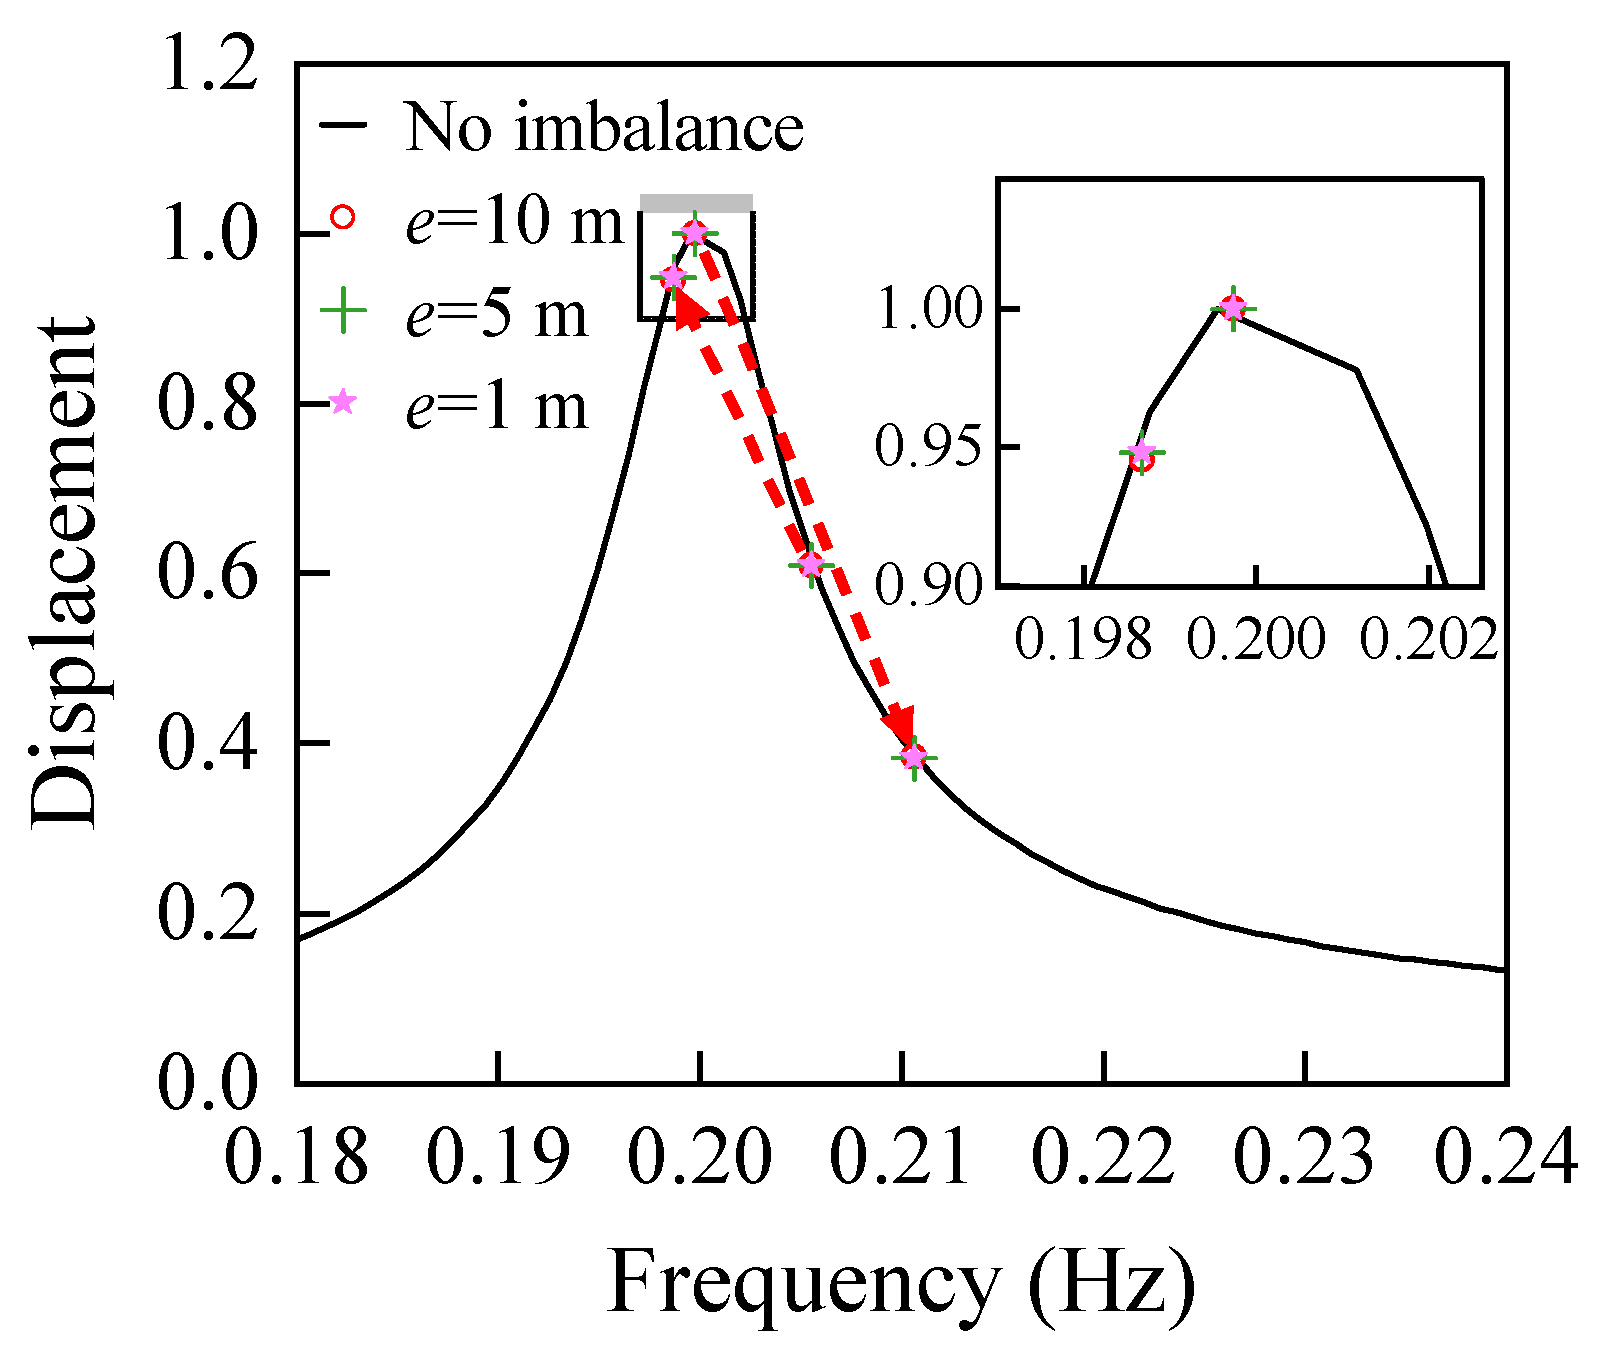
4.2.3. SS Direction for Soft WT Systems

For soft WT systems, the Sommerfeld Effect is possible (Figure 13f).
Generally, wind rotors are mass-balanced before leaving manufacturing factories, and standard [25] recommends that the imbalance mass moment is 0.005 mR for a balanced rotor, or 0.05 mR if the rotor is not unbalanced, where m is the mass of the rotor and R is the radius of the blades. For the TBF, m = 80 t and R = 60 m, so S is 2.4 × 10³ kg·m and 2.4 × 10⁴ kg·m for balanced and unbalanced situations, respectively. If the TBF is supported on a soft WT system with a natural frequency of 0.20 Hz, the Sommerfeld Effect performance for different S values is shown in Figure 13.
In Figure 13, the eccentricity e is 1 m, and different S values are obtained by changing the imbalance mass m from 2400 kg to 24,000 kg. From Figure 13a–d, as S increases from 2400 kg·m to 14,400 kg·m, there is no difference between the rising and falling process, and no jump phenomenon is presented. When S reaches 19,200 kg·m, a slight jump phenomenon can be seen. When S continues to grow to 24,000 kg·m, the two paths are different around 0.20 Hz, and the gap is obvious. Therefore, with the growth of S, the Sommerfeld Effect becomes clearer.
Considering the eccentricity e as a variable, Figure 14 shows the influence of e on the jump phenomenon as S has the same value of 19,200 kg·m. The jump points are the same, though they have different eccentricities; the conclusion from this figure is that eccentricity does not influence jump performance. Therefore, there will be no jump phenomenon if only S is less than 19,200 kg·m, no matter what the eccentricity is. If a rotor is mass-balanced and in good condition, the imbalance mass moment S will be far less than 19,200 kg·m, and there is no need to consider the appearance of the Sommerfeld Effect.
Without considering the Sommerfeld Effect, the vibration near the natural frequency for soft WTs is a common resonance problem. Creating a speed exclusion zone is an effective method to avoid large dynamic amplification [26].

4.2.4. 3P Resonance of WT Structure

Considering that the 3P frequency passes the natural frequency, Figure 15a shows the relationship between the displacement and rotational frequency around 0.117 Hz in the SS direction. The monotonically increasing curve does not show a jump phenomenon, whether in the energy rising or falling process, and displacement grows gradually with rotational frequency.
Of course, other loads are acting on WT except for imbalance. With F’SS = 5000sin (6πwt) N, the integrated response is shown in Figure 15b. There is a peak at 0.117 Hz because F’SS is a 3P load, and the 3P resonance happens. Obviously, the 3P resonance is not equal to the Sommerfeld Effect.
In reference [14], the natural frequency of an offshore wind turbine is 0.40 Hz, and the measured acceleration of this tower has an obvious peak near the rotor speed of 8 RPM (0.133 Hz), which was explained to have been caused by the Sommerfeld Effect. However, based on the analysis above, we offer a different explanation that this was just a 3P resonance phenomenon, since both the 3P frequency and natural frequency are equal to 0.40 Hz. Meanwhile, the vibration amplifications mentioned in [15,27] all result from 3P resonance, rather than the Sommerfeld Effect.

5. Discussion

Section 3 analyzed the influences of various parameters on the vibration displacement of wind turbines. Structural damping had little effect on vibration—it was set to be a constant of 0.02 in later studies. The imbalance mass moment S and 3P load F only controlled the structural response in the SS direction and the FA direction, respectively; they had no impact on the response of the other direction. Therefore, the resonance analysis in the two directions was studied one-by-one in the next section. Torque T generated an increase in rotational speed, leading to a larger SS displacement. Therefore, the needed rotation speed for the Sommerfeld Effect was obtained by changing T.
In Section 4, the Sommerfeld Effect was introduced and discussed, and the jump phenomenon was its unique characteristic. For wind turbines, since the vibrations in the SS and FA directions were separately influenced by S and F from Section 3, the Sommerfeld Effect in the two directions was studied one-by-one. There was no Sommerfeld Effect in the FA direction, since no rotatable imbalance mass was located in the FA direction; there was also no Sommerfeld Effect in the SS direction of soft–stiff WTs, since the rotational frequency did not pass the natural frequency. For soft WTs, with the growth of S, the appearance of the Sommerfeld Effect became clearer and clearer, and it could be ignored if S is less than 19,200 kg·m. The mass eccentricity did not influence jump performance. Therefore, it is not necessary to consider the Sommerfeld Effect for mass-balanced or well-conditioned WTs. The amplification caused by the 3P frequency passing the natural frequency does not meet the characteristics of the jump phenomenon, and 3P resonance is not the Sommerfeld Effect.
Of course, there are also some deficiencies in the current work. Some parameters of a WT are not fixed values. For example, the torque and damping are dynamically variable due to the fluctuation of the wind, but they were idealized to be constants in certain cases in this paper. The real situation is complex and more practical simulations are needed to obtain a more accurate value of the safe imbalance mass moment.

6. Conclusions

In this study, a simplified wind turbine theoretical model is built by considering the SS and FA directions separately. The paper mainly analyzes the Sommerfeld Effect and 3P resonance of wind turbines under 1P/3P loads. The main conclusions are as follows:
(1)
The model is built in the SS and FA directions separately because the mass imbalance is in the SS direction, and it is simulated by an eccentric mass point to generate a 1P load;
(2)
The structural damping has little effect on vibration, the imbalance mass moment and 3P load controls the response in the SS direction and the FA direction separately, and they have no impact on the response of the other direction. Torque is the source of rotational speed;
(3)
The vibration behavior of a rotating eccentric mass passing the natural frequency of the system is the so-called Sommerfeld Effect, which has two significant characteristics compared to common resonance phenomena. The first is that the rotation speed and response of the structure will jump when passing the natural frequency. Secondly, the jump phenomenon transits along different paths when the rotation speed rises or falls;
(4)
The Sommerfeld Effect does not exist in soft–stiff WTs because there is no rotating imbalance mass in the FA direction and the rotational frequency does not pass the natural frequency in the SS direction. This is a new understanding different from that of existing research;
(5)
For soft WTs, only if the imbalance reaches a much higher value (19,200 kg·m in this study) should the Sommerfeld Effect be considered; otherwise, it could be ignored;
(6)
The 3P resonance happens when the 3P frequency passes the natural frequency, which can amplify the response of the structure, but it does not meet the characteristics of the Sommerfeld Effect; therefore, it is not the Sommerfeld Effect.
In summary, it is hard to satisfy the conditions for the Sommerfeld Effect to occur in WTs, and 3P resonance is more common.

Author Contributions

Conceptualization, J.L.; methodology, X.D. and Zhou Huan; validation, X.D. and J.L.; formal analysis, H.Z.; investigation, J.L., X.D., and H.Z.; resources, J.L.; data curation, X.D. and H.Z.; writing—original draft preparation, H.Z.; writing—review and editing, X.D.; visualization, H.Z.; supervision, X.D.; project administration, J.L.; funding acquisition, J.L. All authors have read and agreed to the published version of the manuscript.

Funding

This research received no external funding.

Conflicts of Interest

The authors declare no conflict of interest.

References

  1. Global Wind Report. 2022. Available online: https://gwec.net/global-wind-report-2022/ (accessed on 2 April 2022).
  2. Lian, J.J.; Cai, O.; Dong, X.F.; Jiang, Q.; Zhao, Y. Health Monitoring and Safety Evaluation of the Offshore Wind Turbine Structure: A Review and Discussion of Future Development. Sustainability 2019, 11, 494. [Google Scholar] [CrossRef] [Green Version]
  3. Niebsch, J.; Ramlau, R.; Nguyen, T.T. Mass and Aerodynamic Imbalance Estimates of Wind Turbines. Energies 2010, 3, 696–710. [Google Scholar] [CrossRef] [Green Version]
  4. Tang, Q.Q.; Liu, H.M.; Ren, Q.Y.; Zhang, Z.K.; Chi, Y.N. Individual Pitch Control Strategy of Wind Turbine to Reduce 1P Aerodynamic Load and 3P Aerodynamic Torque Ripples. Acta Energ. Sol. Sin. 2018, 39, 2453–2461. [Google Scholar] [CrossRef]
  5. Bhattacharya, S. Design of Foundations for Offshore Wind Turbines, 1st ed.; John Wiley & Sons: Hoboken, NJ, USA, 2019; pp. 51–52. [Google Scholar]
  6. Thiringer, T.; Dahlberg, J. Periodic Pulsations from a Three-Bladed Wind Turbine. IEEE Trans. Energy Convers. 2001, 16, 128–133. [Google Scholar] [CrossRef]
  7. Bossanyi, E. Individual Blade Pitch Control for Load Reduction. Wind Energy 2003, 6, 119–128. [Google Scholar] [CrossRef]
  8. Bossanyi, E.; Fleming, P.; Wright, A. Validation of Individual Pitch Control by Field Tests on Two and Three-Bladed Wind Turbines. IEEE Trans. Control Syst. Technol. 2013, 21, 1067–1078. [Google Scholar] [CrossRef]
  9. Petrovic, V.; Jelavic, M.; Baotic, M. Advanced Control Algorithms for Reduction of Wind Turbine Structural Loads. Renew. Energy 2015, 76, 418–431. [Google Scholar] [CrossRef]
  10. Nayfeh, A.; Mook, D. Nonlinear Oscillations, 1st ed.; John Wiley & Sons: Hoboken, NJ, USA, 1995; pp. 224–227. [Google Scholar]
  11. Blekhman, I.I. Vibrational Mechanics: Nonlinear Dynamic Effects, General Approach, Applications, 1st ed.; World Scientific: Singapore, 1999; pp. 158–161. [Google Scholar]
  12. Fidlin, A. Nonlinear Oscillations in Mechanical Engineering, 1st ed.; Springer: Berlin, Germany, 2006; pp. 193–194. [Google Scholar]
  13. Brasil, R.; Feitosa, L.; Balthazar, J. A Nonlinear and Non-ideal Wind Generator Supporting Structure. Appl. Mech. Mater. 2006, 5–6, 433–442. [Google Scholar] [CrossRef]
  14. Hu, W.H.; Thons, S.; Rohrmann, R.G.; Said, S.; Rucker, W. Vibration-based Structural Health Monitoring of a Wind Turbine System. Part I: Resonance Phenomenon. Eng. Struct. 2015, 89, 260–272. [Google Scholar] [CrossRef]
  15. Zhao, Y.; Pan, J.N.; Wang, Z.Y. Analysis of Wind Turbine Vibration Characteristics during Startup and Shutdown Process. J. Hunan Univ. (Nat. Sci.) 2019, 16, 82–89. [Google Scholar] [CrossRef]
  16. Li, Z.W.; Wen, B.R.; Dong, X.J.; Peng, Z.K. Aerodynamic and Aeroelastic Characteristics of Flexible Wind Turbine Blades Under Periodic Unsteady Inflows. J. Wind Eng. Ind. Aerodyn. 2020, 197, 104057. [Google Scholar] [CrossRef]
  17. Lian, J.J.; Sun, L.Q.; Zhang, J.F.; Wang, H.J. Bearing Capacity and Technical Advantages of Composite Bucket Foundation of Offshore Wind Turbines. Trans. Tianjin Univ. 2011, 17, 132–137. [Google Scholar] [CrossRef]
  18. Ding, H.Y.; Lian, J.J.; Li, A.D.; Zhang, P.Y. One-step-installation of Offshore Wind Turbine on Large-scale Bucket-top-bearing Bucket Foundation. Trans. Tianjin Univ. 2013, 19, 188–194. [Google Scholar] [CrossRef]
  19. Samantaray, A.K.; Dasgupta, S.S.; Bhattacharyya, R. Sommerfeld Effect in Rotationally Symmetric Planar Dynamical Systems. Int. J. Eng. Sci. 2010, 48, 21–36. [Google Scholar] [CrossRef]
  20. Kovriguine, D.A. Synchronization and Sommerfeld Effect as Typical Resonant Patterns. Arch. Appl. Mech. 2012, 82, 591–604. [Google Scholar] [CrossRef]
  21. Sinha, A.; Bharti, S.K.; Samantaray, A.K.; Chakraborty, G.; Bhattacharyya, R. Sommerfeld Effect in an Oscillator with a Reciprocating Mass. Nonlinear Dyn. 2018, 93, 1719–1739. [Google Scholar] [CrossRef]
  22. Wang, Y.P.; Shi, W.; Michailides, C.; Wan, L.; Kim, H.; Li, X. WEC Shape Effect on the Motion Response and Power Performance of a Combined Wind-wave Energy Converter. Ocean Eng. 2022, 250, 111038. [Google Scholar] [CrossRef]
  23. Ren, Y.J.; Vengatesan, V.; Shi, W. Dynamic Analysis of a Multi-column TLP Floating Offshore Wind Turbine with Tendon Failure Scenarios. Ocean Eng. 2022, 245, 110472. [Google Scholar] [CrossRef]
  24. Det Norske Veritas; Risø National Laboratory. Guidelines for Design of Wind Turbines, 2nd ed.; Jydsk Centraltrykkeri: Copenhagen, Denmark, 2002. [Google Scholar]
  25. Standardization Administration of the People’s Republic of China. Wind Turbine Generator Systems Design Requirements (JB/T 10300-2001); Standards Press of China: Beijing, China, 2001. [Google Scholar]
  26. Licari, J.; Ekanayake, J.B.; Jenkins, N. Investigation of a Speed Exclusion Zone to Prevent Tower Resonance in Variable-Speed Wind Turbines. IEEE Trans. Sustain. Energy 2013, 4, 977–984. [Google Scholar] [CrossRef]
  27. Hu, W.H.; Tang, D.H.; Wang, M.; Liu, J.L.; Li, Z.H.; Lu, W.; Teng, J.; Said, S.; Rohrmann, R.G. Resonance Monitoring of a Horizontal Wind Turbine by Strain-Based Automated Operational Modal Analysis. Energies 2020, 13, 579. [Google Scholar] [CrossRef] [Green Version]
Figure 1. The Sommerfeld Effect: (a) Sketch of amplitude versus rotational frequency to show the Sommerfeld Effect; (b) results from [13] demonstrating the Sommerfeld Effect.
Energies 15 05787 g001
Figure 2. Wind turbine model: (a) OWT prototype; (b) simplified model in the SS direction; (c) simplified model in the FA direction.
Energies 15 05787 g002
Figure 3. Time histories of a specific case: (a) rotational frequency; (b) displacements of the FA and SS directions.
Energies 15 05787 g003
Figure 4. Impact of damping b, c on displacements: (a) SS displacement versus b; (b) FA displacement versus b; (c) SS displacement versus c; (d) FA displacement versus c.
Energies 15 05787 g004
Figure 5. Relationship of the vibration response versus imbalance mass moment S.
Energies 15 05787 g005
Figure 6. Relationship of vibration response versus FA load F.
Energies 15 05787 g006
Figure 7. Displacements and rotational frequency with T.
Energies 15 05787 g007
Figure 8. Demonstration for the Sommerfeld Effect: (a) System 1 without imbalance mass; (b) System 2 with imbalance mass.
Energies 15 05787 g008
Figure 9. The relationship between horizontal displacement and frequency: (a) comparison of two systems; (b) response detail of system two as rising or falling levels of T.
Energies 15 05787 g009
Figure 10. Time history of jump phenomenon: (a) rising T; (b) falling T.
Energies 15 05787 g010aEnergies 15 05787 g010b
Figure 11. Flowchart of the work to analyze the Sommerfeld Effect.
Energies 15 05787 g011
Figure 12. Sommerfeld Effect in the SS direction of a soft–stiff WT system: (a) response overview when the rotation frequency passes the natural frequency; (b) response when the rotation frequency does not pass the natural frequency.
Energies 15 05787 g012
Figure 13. Influence of S on the Sommerfeld Effect in the SS direction for soft WT systems: (a) S = 2400 kg·m; (b) S = 4800 kg·m; (c) S = 9600 kg·m; (d) S = 14,400 kg·m; (e) S = 19,200 kg·m; (f) S = 24,000 kg·m.
Energies 15 05787 g013aEnergies 15 05787 g013b
Figure 14. Influence of e on jump phenomenon with the same S value.
Energies 15 05787 g014
Figure 15. Response of WT when the 3P frequency passes the natural frequency: (a) only imbalance acting on structure; (b) a combination of imbalance and 3P load acting on the structure.
Energies 15 05787 g015
Table 1. Main parameters of the TBF.
ParameterValueParameterValue
M (kg)1.920 × 10⁵b (N·m·s)4.457 × 10⁵
k (N/m)9.285 × 105c (N·s/m)1.689 × 104
J (kg·m2)2 × 10⁷T (N·m)3.5 × 10⁵~1.12 × 10⁶
Publisher’s Note: MDPI stays neutral with regard to jurisdictional claims in published maps and institutional affiliations.

