Article

MILP-Based Profit Maximization of Electric Vehicle Charging Station Based on Solar and EV Arrival Forecasts

Faculty of Electrical Engineering, Bialystok University of Technology, ul. Wiejska 45D, 15-351 Bialystok, Poland
*
Author to whom correspondence should be addressed.
Energies 2022, 15(15), 5760; https://doi.org/10.3390/en15155760
Submission received: 7 July 2022 / Revised: 29 July 2022 / Accepted: 5 August 2022 / Published: 8 August 2022

Abstract

:
Electric vehicles (EVs) will be dominating the modes of transport in the future. Current limitations discouraging the use of EVs are mainly due to the characteristics of the EV battery and lack of easy access to charging stations. Charging schedules of EVs are usually uncoordinated, whereas coordinated charging offers several advantages, including grid stability. For a solar photovoltaic (PV)-based charging station (CS), optimal utilization of solar power results in an increased revenue and efficient utilization of related equipment. The solar PV and the arrival of EVs for charging are both highly stochastic. This work considers the solar PV forecast and the probability of EV arrival to optimize the operation of an off-grid, solar PV-based commercial CS with a battery energy storage system (BESS) to realize maximum profit. BESS supports the sale of power when the solar PV generation is low and subsequently captures energy from the solar PV when the generation is high. Due to contrasting characteristics of the solar PV and EV charging pattern, strategies to maximize the profit are proposed. One such strategy is to optimally size the BESS to gain maximum profit. A mixed integer linear programming (MILP) method is used to determine the optimal solution.

Graphical Abstract

1. Introduction

One of the major environmental concerns is the gas emissions from the use of fossil fuels. As such, renewable energy (RE) is considered the most crucial replacement for fossil-fueled energy, which also supports energy security. The share of RE worldwide continues to grow, which is also evident from the growth in the EU-28 countries, where the usage of RE sources by all sectors of the economy increased from 5.1% in 2004 to 10.2% in 2019 [1]. From among the various RE sources, solar PV continues to see a steep growth globally [2], from just 72,216 MW in 2011 to 843,086 MW in 2021 [3].
In addition to increased use of RE sources, strenuous effort is made to maximize the use of electric vehicles (EV). Electric vehicles include Battery Electric Vehicles (BEV), Hybrid Electric Vehicles (HEV), Plug-in Hybrid Electric Vehicles (PHEV), and Fuel Cell Electric Vehicles (FCEV). Despite the promotion of EVs, sales have not been promising, primarily due to the limited driving range, charging time, battery replacement cost, and other limitations of the EV batteries [4,5,6]. Therefore, efforts are being made to enhance the effectiveness of batteries used in EVs. Additionally, usage of EVs is also affected by the lack of EV charging infrastructure [7].
On the use of solar energy for charging EVs, the characteristic of the solar irradiance is such that it is higher during mid-day and low in the morning and night hours. Therefore, it is expected that surplus energy would be available during mid-day, but the availability of EVs for charging during mid-day is generally low. Any surplus energy will have to be saved using a battery energy storage system (BESS), which will be used when solar PV generation is low. In addition to the stochastic nature of solar power, the system performance also depends on the state-of-charge (SOC) of the battery. Although solar power charging stations are convenient for EVs, the solar and EV characteristics are not well-synchronized, as EVs are generally charged at night when solar power is at its lowest. The charging of EVs is preferred at night, as the load is lower at night, which is also called ‘valley filling’ [8]. This is one of the reasons why a BESS is required to support the operation of a solar PV-based charging station effectively.
There are three levels of charging standards for EVs based on the speed and power. The Electric Power Research Institute (EPRI) and Society of Automotive Engineers (SAE) have categorized EV charging levels as alternating current (AC) level-1, AC level-2, and direct current (DC) fast charging, i.e., level-3 [9,10,11]. These standards are, briefly:
(i)
Level-1, AC voltage at 120/240 V with a maximum current of 15 A and a maximum power of 3.3 kW;
(ii)
Level-2, AC voltage at 240 V with a maximum current of 60 A and a maximum power of 14.4 kW; and
(iii)
Level-3, through a charging station, DC voltage directly to the battery via a DC connector, with a maximum power of 240 kW.
Public commercial charging stations worldwide use both Level-2 and Level-3 [8]. As per [12], it has been estimated that every 1 million EVs with a 322 km range in the United States (US) require 500 fast charging sessions per day, and that 45% of this charging would take place between 15 h and 19 h. The EV charging fee varies from region to region. To understand the charging pattern of EVs by the users, ref. [13] has found that most EV users charge their vehicle when the EV battery SOC is between 25% and 75% and that the EVs are likely to be charged shortly after the users return home from work during weekdays or leisure activities during weekends. They further state that the pattern does not significantly change as per seasons and therefore, the charging of EVs is categorized into weekdays and weekends. As per [14], 50% to 80% of charging events for plug-in EVs (PEVs) occur at home, approximately 15% to 20% at the workplace, and approximately 5% of the charging events occur at public locations such as shopping malls or parking lots and those located on travel corridors. Although there is a low share of charging points at public locations, infrastructure is still required to encourage adoption of the EVs. As per [14], publicly available fast charging options can reduce range anxiety and encourage adoption of EVs. In the recent years, DC fast charging options are being offered in public charging stations and these chargers are generally more crucial for long-range BEV owners.
In this paper, a commercial off-grid solar PV-based charging station is considered, where the mismatch issue of solar PV characteristics and EV charging patterns is prioritized to gain maximum profit from the sale of electricity with the support of a BESS.
Several papers related to profit maximization of charging stations are available, and various features have been highlighted and methods proposed. For example, [15] considers profit maximization in a variable electricity price market where the charging station is directly connected to the grid, while in [16], an algorithm to reduce the operational costs is proposed. In [17], a novel joint admission and pricing mechanism of EVs are considered and [18] considers long-term profit for the charging station owner considering the delays in the charging of the EV. Further, in [19], optimal investment in the equipment is proposed so that profit can be maximized from the charging station operator’s perspective. For a grid-connected charging station, usually the charging location of CS is not considered in scheduling and related work; however, it is important to note that several EVs concentrated in a narrow area supplied by an undersized capacity feeder and line could lead to breakdown of the distribution system. Therefore, grid capacity constraints must be included in such formulation [20]. Further, while integrating the CS with the grid, it is necessary to prevent EV charging from occurring at peak demand to avoid constraints due to the distribution feeders. A grid may have sufficient power to charge EVs; however, there would be few residential areas that would be heavily loaded during certain instants. Therefore, the concentration of EVs at a particular location may lead to network loading, voltage profile, phase imbalance, and power quality issues [21]. Additionally, for a larger EV market penetration, electricity demand patterns change significantly because of EV charging. Ref. [22] proposes a strategy to coordinate the decentralized charging of a large population of autonomous EVs using concepts from noncooperative games. However, in this work, the analysis is restricted to smaller-sized, publicly available charging stations. Ref. [23] proposes a distributed waterfilling algorithm for networked control systems to minimize the energy cost of the EV fleet while satisfying all constraints of the individual EVs under charge.
In this paper, we consider the probability of EV arrival, or the probability of load demand and the solar PV forecast data, and subsequently make use of a mixed integer linear programming (MILP) method to determine the optimal solution.
The problem is typical, as the solar power characteristics and EV charging pattern contrast with one another. In such a case, strategies are necessary to ensure maximum profit for the charging stations. Strategies include the following:
(i)
Using different sizes of batteries; and/or
(ii)
Connecting to the grid and importing power when solar power is inadequate.
The main contributions of the paper are as follows:
(1)
Scheduling strategy for an off-grid solar PV charging station based on 24-h day-ahead solar forecast and probability of vehicle arrival for charging.
(2)
Emphasizing and illustrating the dependency of a solar PV-based charging station on the size of the BESS, and subsequently indicating that the net profit is dependent on the size of the BESS.
(3)
Offering an optimization technique to realize maximum profit from an off-grid solar PV charging station.
(4)
Highlighting the shortfalls of an off-grid solar PV charging station.
(5)
Demonstrating an application of the MILP method in determining the solution for such optimization problem.
The remainder of this paper is organized as follows: Section 2 gives the model and formulation of solar PV, EV load, BESS, and the overall system, followed by Section 3, where results and analysis are presented. In Section 4, conclusions are drawn on the results and the overall formulation.

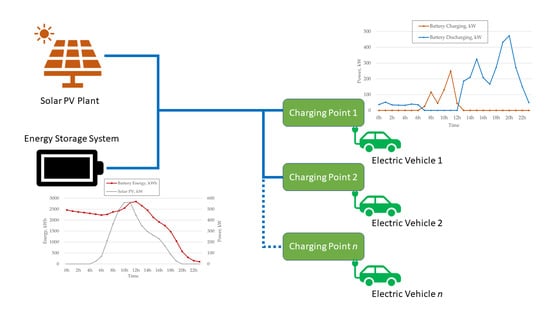
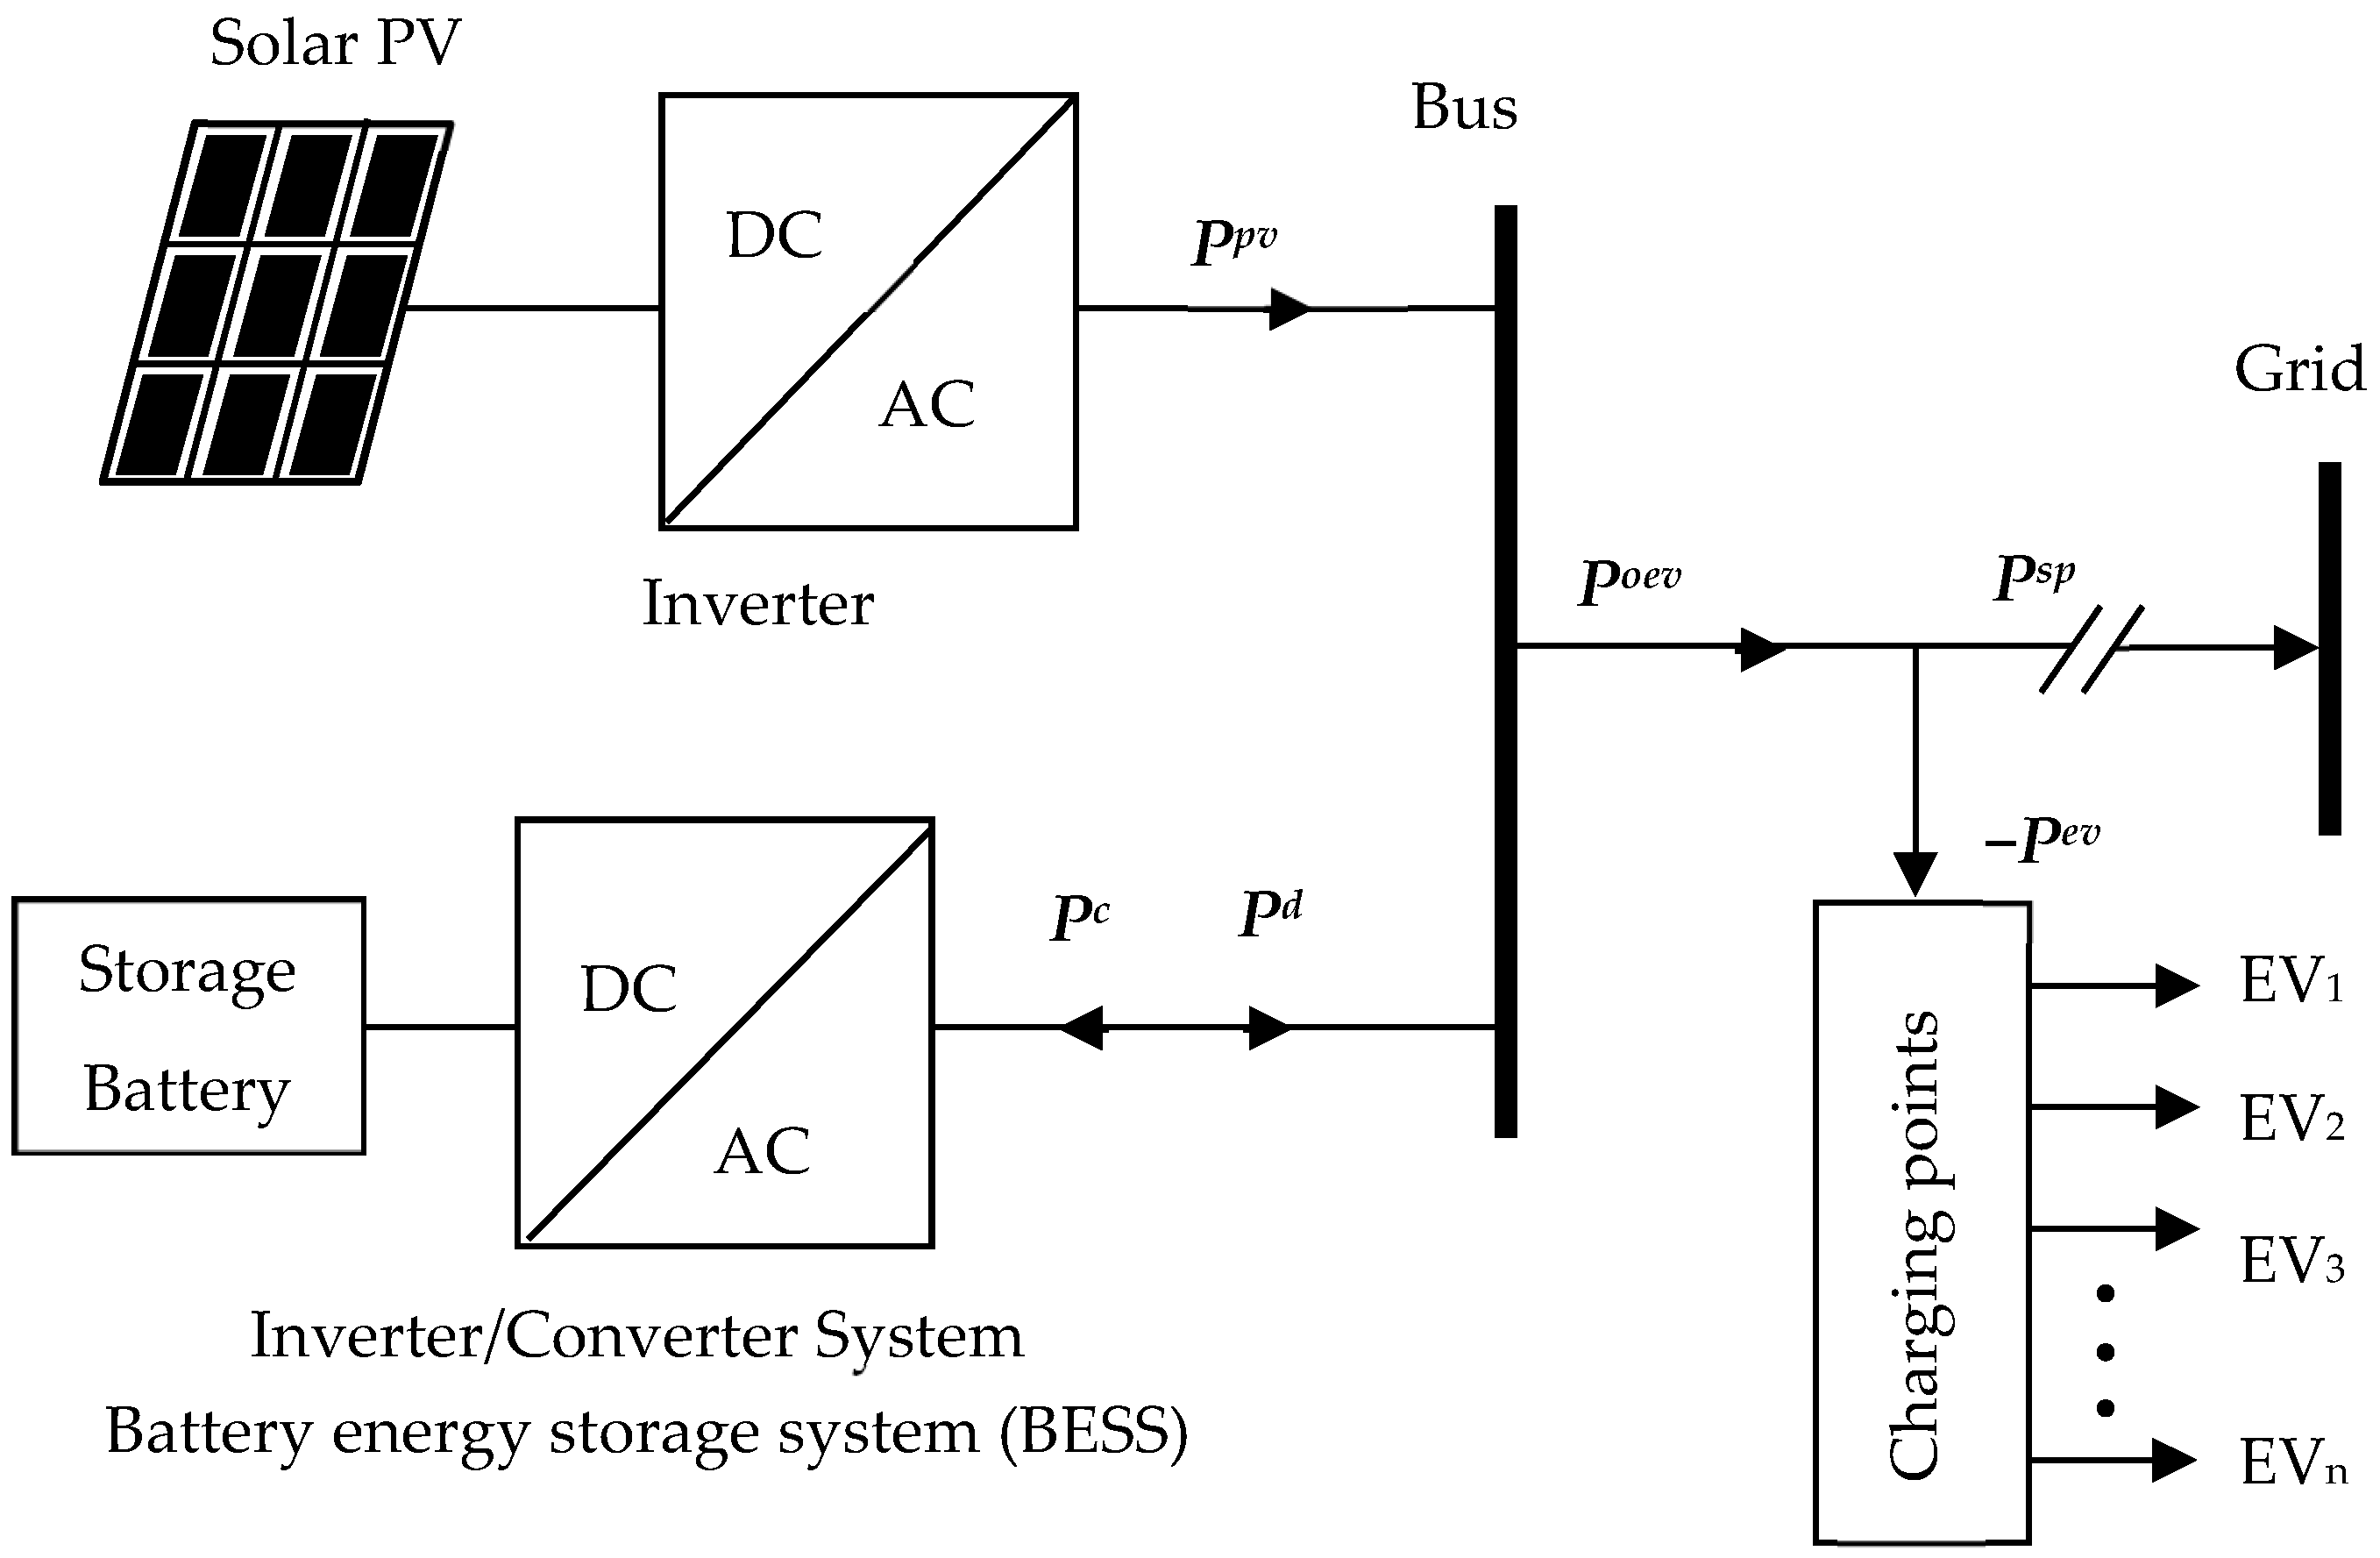
2. Solar PV Charging System Model and Formulation

For a known solar irradiance at a location, the solar PV output power P t p v can be calculated as [24]:
P t p v = P e R 1000 [ 1 + γ T ( T 25 ) ]
where P e is the PV-rated power which is measured at a standard solar irradiance (1000 W/m2) and 25 °C, R is the hourly mean value of the solar irradiance at the Earth’s surface in sunny days, γ T is the temperature coefficient of photovoltaic cells, and T is the working temperature. Therefore, the discussion in this paper pertains to solar PV power output, P t p v , at time t. The general layout of the proposed system structure is shown in Figure 1. The solar PV and the BESS provide power to the load EV.

2.1. EV Charging Modality, Grid, and Revenue

In this work, the total profit for the day, i.e., for an NT period of 24 h, is considered. A fixed EV charging rate α is considered instead of two different ‘peak’ and ‘off-peak’ charging rates for EVs. Therefore, the revenue from the sale of electricity to the EVs at the tth hour with a net power output P t o e v will be:
R e v t = α   P t o e v
Further, when the solar power P p v = [ P 1 p v ,   P 2 p v ,   P 3 p v , ,   P N T p v ] is higher than the EV load P e v = [ P 1 e v ,   P 2 e v ,   P 3 e v , ,   P N T e v ] , which usually occurs during mid-day or when there are fewer EVs at the charging station, it results in surplus power P s p = [ P 1 s p ,   P 2 s p ,   P 3 s p , ,   P N T s p ] , which is stored in the battery to be used at a favorable time. The surplus power at the tth time is:
P t s p = P t o e v P t e v
An off-grid solar PV charging station is considered in this study and therefore it does not draw power from the grid. However, in the event that P s p is substantially high, the system can be connected to the grid, and the surplus power can be sold to the grid to generate maximum revenue.

2.2. Solar PV Economic Model

The solar irradiance can be satisfactorily described by a Beta distribution [25,26,27]. As such, the median of the Beta probability density function is considered the best forecast [28]. Therefore, the median of the day-ahead solar PV forecast   P p v ˜ is considered the best forecast, which is then constrained by a binary variable U t p v , a component of U p v = [ U 1 p v , U 2 p v , U 3 p v ,   , U N T p v ] that represents the operational status of the solar PV. At the tth hour, the solar PV output P t p v is constrained as:
0     P t p v   P t p v ˜   U t p v
To proceed further with the economic model of the PV system, we also take into consideration both fixed and linearly varying costs of the solar PV plant. We consider the fixed cost,   A p v , and linearly varying costs, B p v , as given in [29]. The total cost at the tth hour C P V t is then:
C P V t = A p v U t p v + B p v P t p v

2.3. EV-Load Model

As per [30], fast chargers between 7 kWh to 22 kWh are the most common in the parking lots. Therefore, we consider a commercial EV charging station of 36 units with each unit of 22 kWh. As the arrival of EV for charging is highly stochastic, it is not possible to accurately predict the demand for a charging station. Although accurate demand forecasting remains a challenge, there are various works that model such EV charging demand forecasts so that successful management and planning of EV charging can be executed [31,32,33]. In our work, we base our analysis on the EV arrival probability as given in [13]. The EV load P t e v at every tth hour is the probability of EV arrival, which is defined in terms of percentage ρ t e v of the capacity of the charging station K, as given below.
P t e v = K   ρ t e v

2.4. BESS Model

Solar power is one of the variable renewable energy sources, as it cannot be dispatched whenever required due to its fluctuating nature. Solar power is affected by various factors. It is generally high during the day and low in the morning and night hours, which is in contrast with EV charging patterns. Therefore, this has an impact on the overall revenue generation. To mitigate this undesirable effect, a BESS is used. However, for a BESS, costs are functions of the battery charging, discharging, efficiency, and charge cycle costs. The net power output from the combined solar PV and BESS at the tth hour P t o e v is:
P t o e v = P t p v + η b P t d P t c
where P t d   and   P t c are the power delivered/discharged and consumed/charged by the battery at the tth hour, respectively, and η b is the battery’s efficiency. Further, using the binary variables U t c and U t d to denote the operational status of the battery while charging and discharging at time t, respectively, the following constraints are used for the battery.

2.4.1. Limitation While Getting Charged at the tth Hour

For the battery, limitation on the charging power is given by,
0     P t c   P t c ¯   U t c

2.4.2. Limitation While Getting Discharged at the tth Hour

0     P t d   P t d ¯ U t d
where P t c ¯ and P t d ¯ are the upper bounds of the charging and discharging power, respectively.
In order to ensure that the battery either charges or discharges only at any given time t, the following constraint is implemented:
U t c + U t d   1

2.4.3. Minimizing Costs Related to Charge–Discharge Cycle

The number of charging cycles that a battery undergoes limits its life; therefore, the cost of a battery is apportioned to each charging cycle as a constant C b . To keep track of one complete charge–discharge cycle of the battery, a binary variable S = [ S 1 ,   S 2 ,   S 3 , , S N T ] is used. At the tth hour, S is given by:
S t = max { U t c U t 1 c , 0 }
Taking C b as the cost per cycle, the costs associated with the battery charge–discharge cycle κ b are:
κ b = t = 1 N T C b S t

2.4.4. Limits on the Total Amount of Battery Energy Et

For the given system, the features of the BESS have a significant impact on the overall outcome. Both the size of the battery and the initial SOC of the battery E(0) impact the performance. The total amount of battery energy E t at the tth hour is then:
E t = E ( 0 ) + s = 1 t [ P s c P s d ]
The battery energy E t has the following limit:
0     E t   E ¯
where E ¯ is the upper bound for the battery energy.
Next, we take into consideration the fixed and linearly varying costs for the BESS. The fixed and linearly varying costs during charging and discharging periods are A c and B c , and A d   and B d , respectively. The total cost for the battery T C b is then:
T C b = κ b + t = 1 N T [ ( A c U t c + B c P t c + A d U t d + B d · P t d ) ]

2.5. Profit and the Overall System Output

The overall profit PR from the sale of electricity to the EV load for the entire day is given by the difference between the revenue given in Equation (2) and the combined battery costs given in Equations (5) and (15), which is:
P R = t = 1 N T R e v t C P V t T C b
Or:
P R = t = 1 N T [ α ( P t p v + η b P t d P t c ) ] t = 1 N T ( C b S t + j p v , c , d N T ( A j U t j + B j P t j ) )
Therefore, the complete solution is then defined by:
X = [ U c , U d , P c , P d , S ]
It is also observed that the size of the battery required to satisfy the constraint in Equation (14) is considerably higher than the capacity of the charging station. Therefore, the formulation was revised to include both E t and E ( 0 ) as decision variables so that the optimal size and SOC of the battery could be determined. In the revised case, the complete solution is given by:
X = [ U c , U d , P c , P d , S ,   E ,   E ( 0 ) ]
Considering the formulation from Equations (2)–(19) with the given restrictions/limits, we can observe that the problem conveniently translates to an MILP problem. Therefore, we make use of the MILP solver function ‘intlinprog’ of MATLAB R2022a to solve the MILP problem. The objective is to maximize the profit given in Equation (17) subject to the given constraints. The revised solution in Equation (19) is used to determine the battery size and the SOC that results in an optimal solution.
In the next section, we present the results, analysis, and strategies to derive maximum profit.

3. Results and Analysis

This section provides information on the data used, results, analysis, and subsequent explanations.

3.1. Data

3.1.1. Solar PV and BESS

The proposed formulation is implemented on a solar PV-based EV charging station of 1 MWp capacity located at 52.2297° N, 21.0122° E (Warsaw, Poland). The 24 h day-ahead solar PV generation data have been taken from [34] for summer days (19 July 2019) when the value is at its highest, and is shown in Figure 2. A fixed-type solar panel with a tilt angle of 35° PV system has been considered. The fixed and linearly varying costs of solar PV station and other data that affect the financial operation of a solar PV plant have been taken from [29].
Further, a lithium-ion (Li-ion) battery is considered as the energy storage device in the BESS. Related costs of the Li-ion battery were obtained from [35]. The battery cycle cost has been computed for 3500 cycles at 80% depth of discharge (DoD) and a total life of 10 years as given in [35]. These costs, including relevant data, are given in Table 1.

3.1.2. EV Arrival and Tariff

Referring to several papers that forecast EV arrival, mainly in terms of the power demand [36,37], it has been observed that the variation in the loading pattern, which refers to EV arrival, does not differ much. In [36], forecasts have been made based on the power demand due to one million EVs for charging.
Likewise, in [37], they have carried out a short-term load forecasting for EV charging stations in terms of the probability of EV arrival for charging in a 24 h period. As the study has been carried out for a substantial number of EVs, we make use of the EV probability data from [37]. However, for suitability, the data have been normalized to the CS capacity K and further translated in terms of percentage of K as given by Equation (6). We consider the capacity of the charging station K = 36 units × 22 kWh = 792 kWh. We further assume a maximum occupancy of 70% at a given instant in NT period which occurs at 15 h. Therefore, the EV load at 15 h is 554 kW. The data are given in Table 2. We do not consider the effect of the SOCs of the EVs but rather consider the load as a percentage of the charging station capacity ρ e v .
As per Greenway Poland [38], the standard cost of charging an EV at public charging facility for DC ≤ 100 kW chargers is 2.09 PLN/kWh (0.44 USD/kWh). Therefore, α is taken as 0.44 USD/kWh in this paper.

3.2. Analysis

Lithium-ion batteries have one of the highest efficiencies. Therefore, in this work, the efficiency of the battery, η b , is considered to be 90%, and depth of discharge (DoD) is considered to be 80%. For the initial analysis, the capacity of the battery is taken as 1 MWh. As the battery size E and initial state of charge E(0) have a significant influence on the results, we present the discussions based on these data.

3.2.1. Battery Size, E ¯ = 1000 kWh, E(0) = 500 kWh

The solar PV generation and EV arrival data are shown in Figure 2. Solar power is zero during hours 0 to 4 h and 20 h to 23 h in NT period, during which, BESS must supply power to meet the EV load demand. Only between 7 h and 12 h, that is, for a total of 6 h, is P p v higher than P e v ; therefore, the battery must get charged during this period. In case of any substantial P s p , it must be sold to the grid to gain maximum profit. During this period, solar power is adequate to meet the load demand and simultaneously charge the battery. The constraint in Equation (14) suffers violation as the initial battery size of 1 MWh is unable to meet the total load demand. Therefore, the constraint E t 0 in Equation (14) is relaxed to allow the change in the battery size, which is indicated by relaxing and allowing battery discharge power P d to vary to realize optimal solution.
As shown in Figure 3, battery supplies power to the load and subsequently gets charged at 7 h. For the remaining period after 13 h, the battery must support the solar power to meet the load demand, which is higher during this period. However, as the size of the battery is limited to 1 MWh, and the EV load demand continues to be higher than the solar power after 12 h, the battery continues to supply power to the load. The battery energy E < 0 eventually at 15 h, indicating the need for a larger-sized battery, as shown in Figure 4. In this case, a total of 1900 kWh of additional energy is required to meet the load demand at the same costs.
The profit from the sale of electricity to the EV without the implementation of any optimization algorithm is computed at $1977.4. The net profit after optimization is $2723.3.
It must be noted that in this case, no lower limit constraint on the size of the battery E has been imposed, thereby indicating negative energy. This also indicates that the size of the battery is not suitable. Therefore, the battery with a size of 1 MWh and initial SOC of 500 kWh is insufficient to meet the load demand. In this case, there are two viable options:
(i)
Buy additional power from the grid at the prevailing price of the hour and resell to the EV; or
(ii)
Use a larger-sized battery to meet the load demand, in which case, the fixed and linearly varying costs of the BESS will increase.
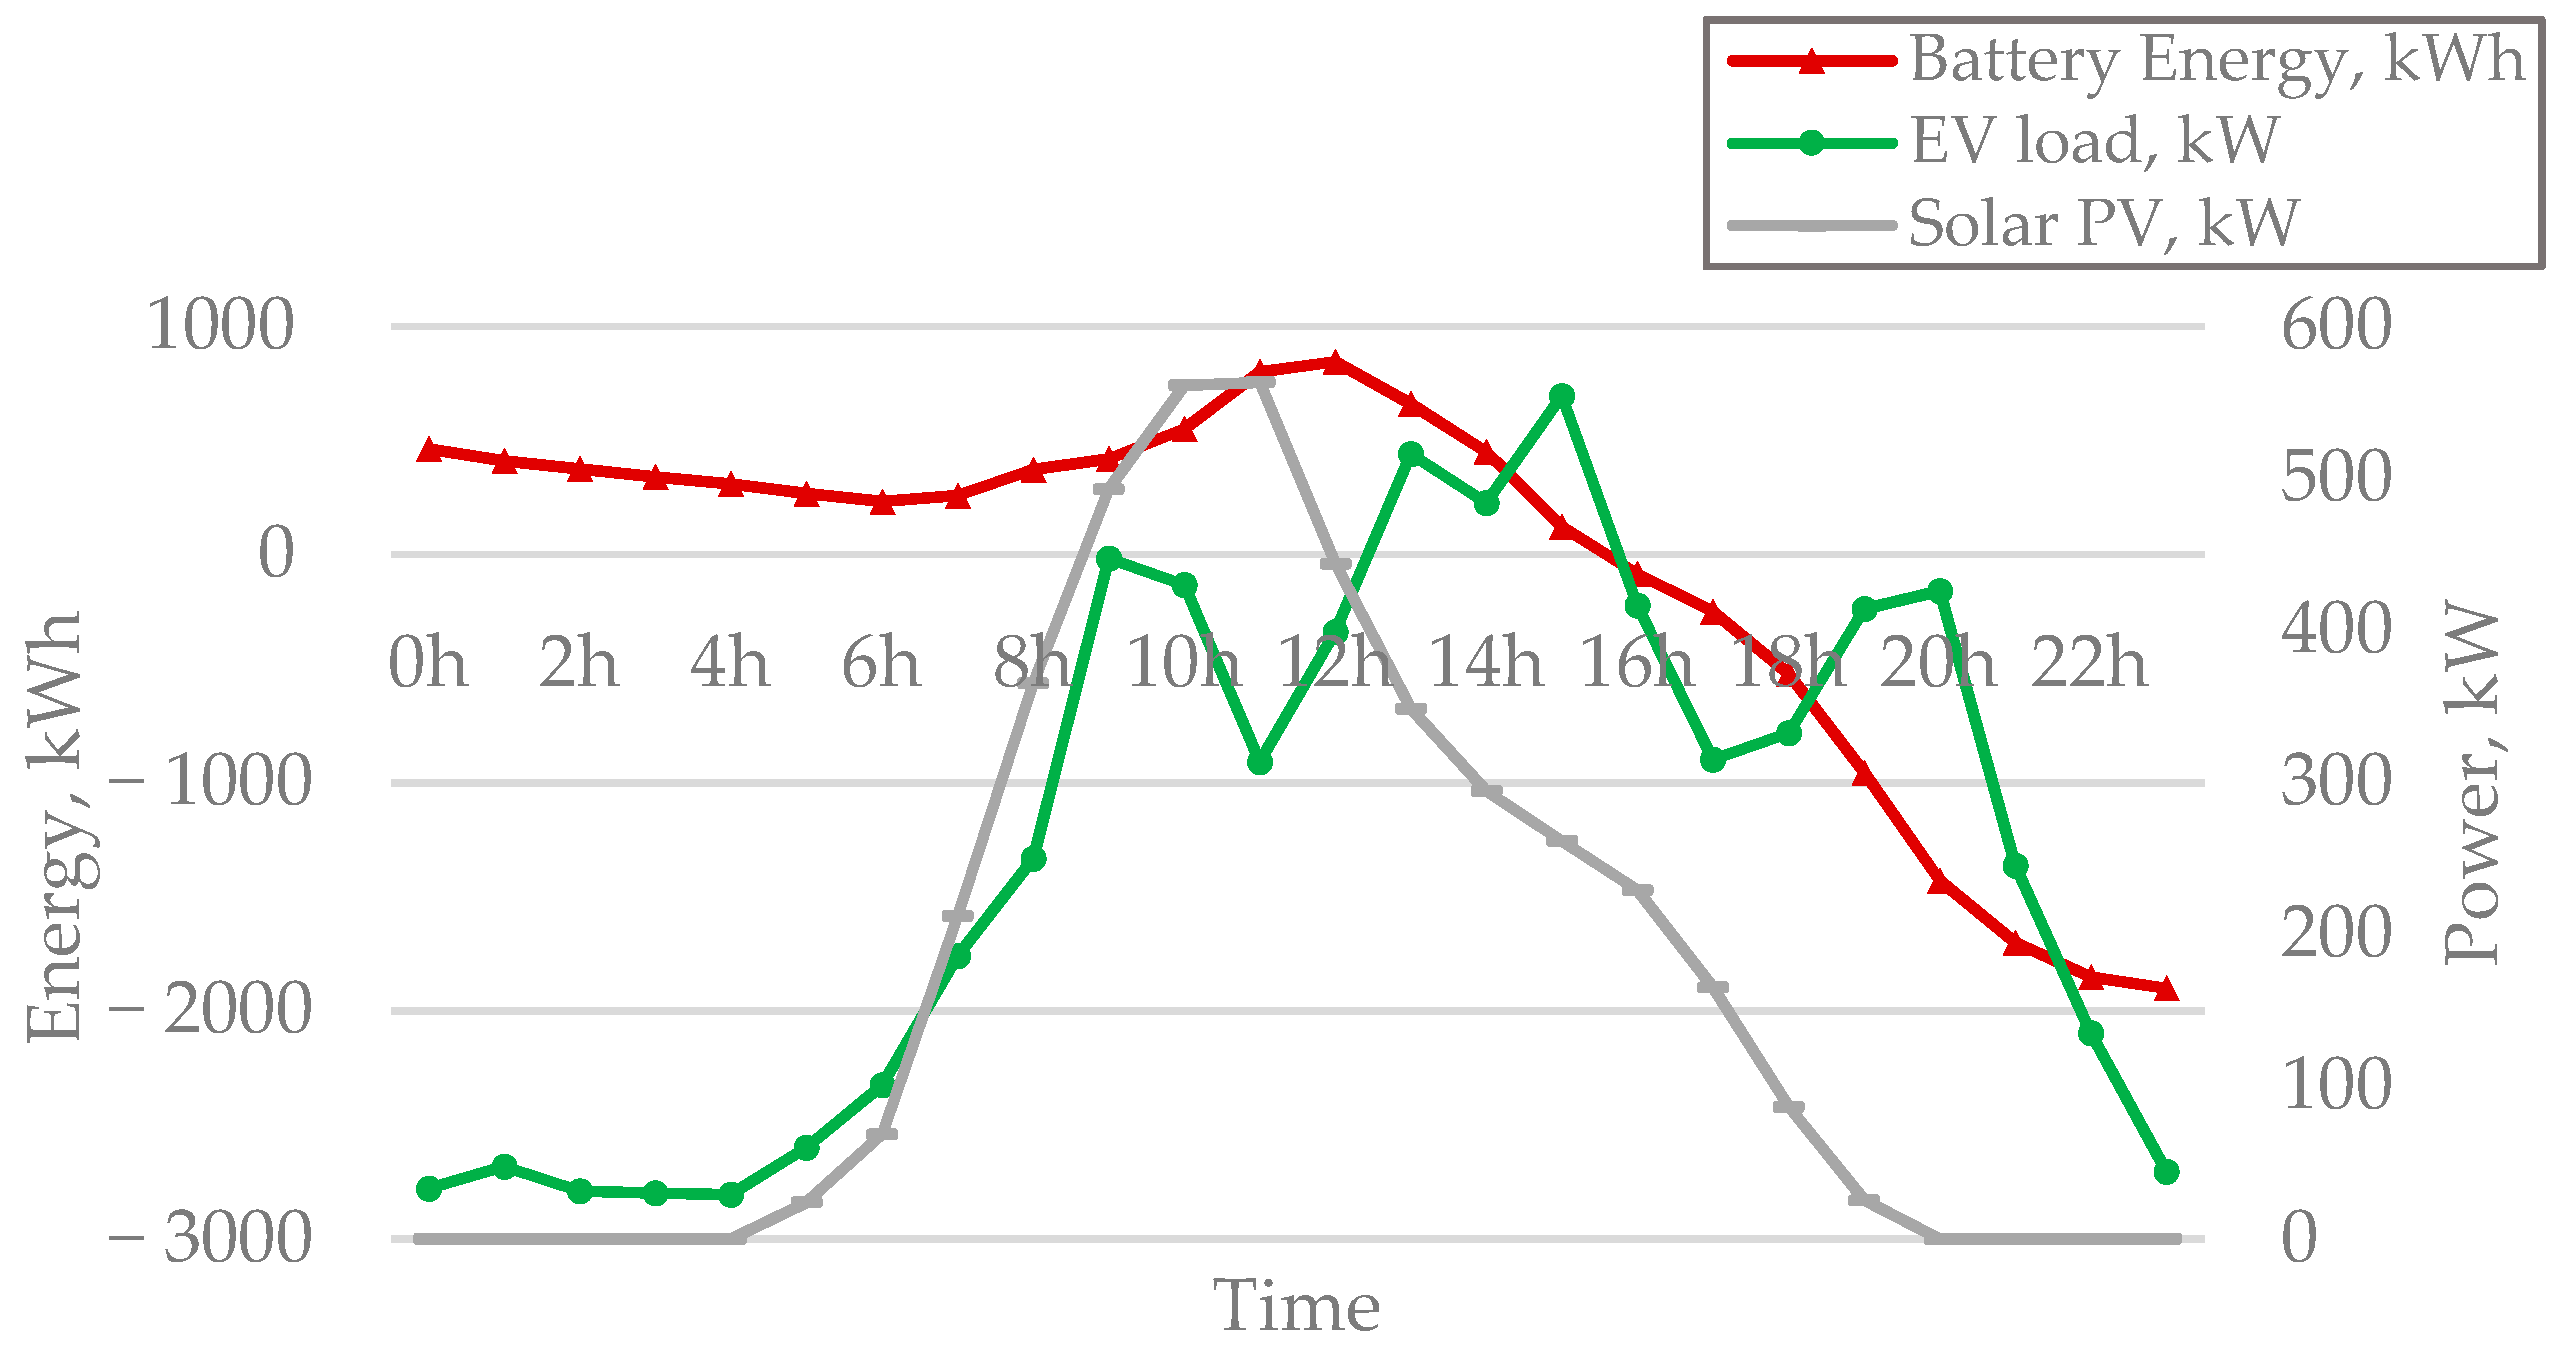
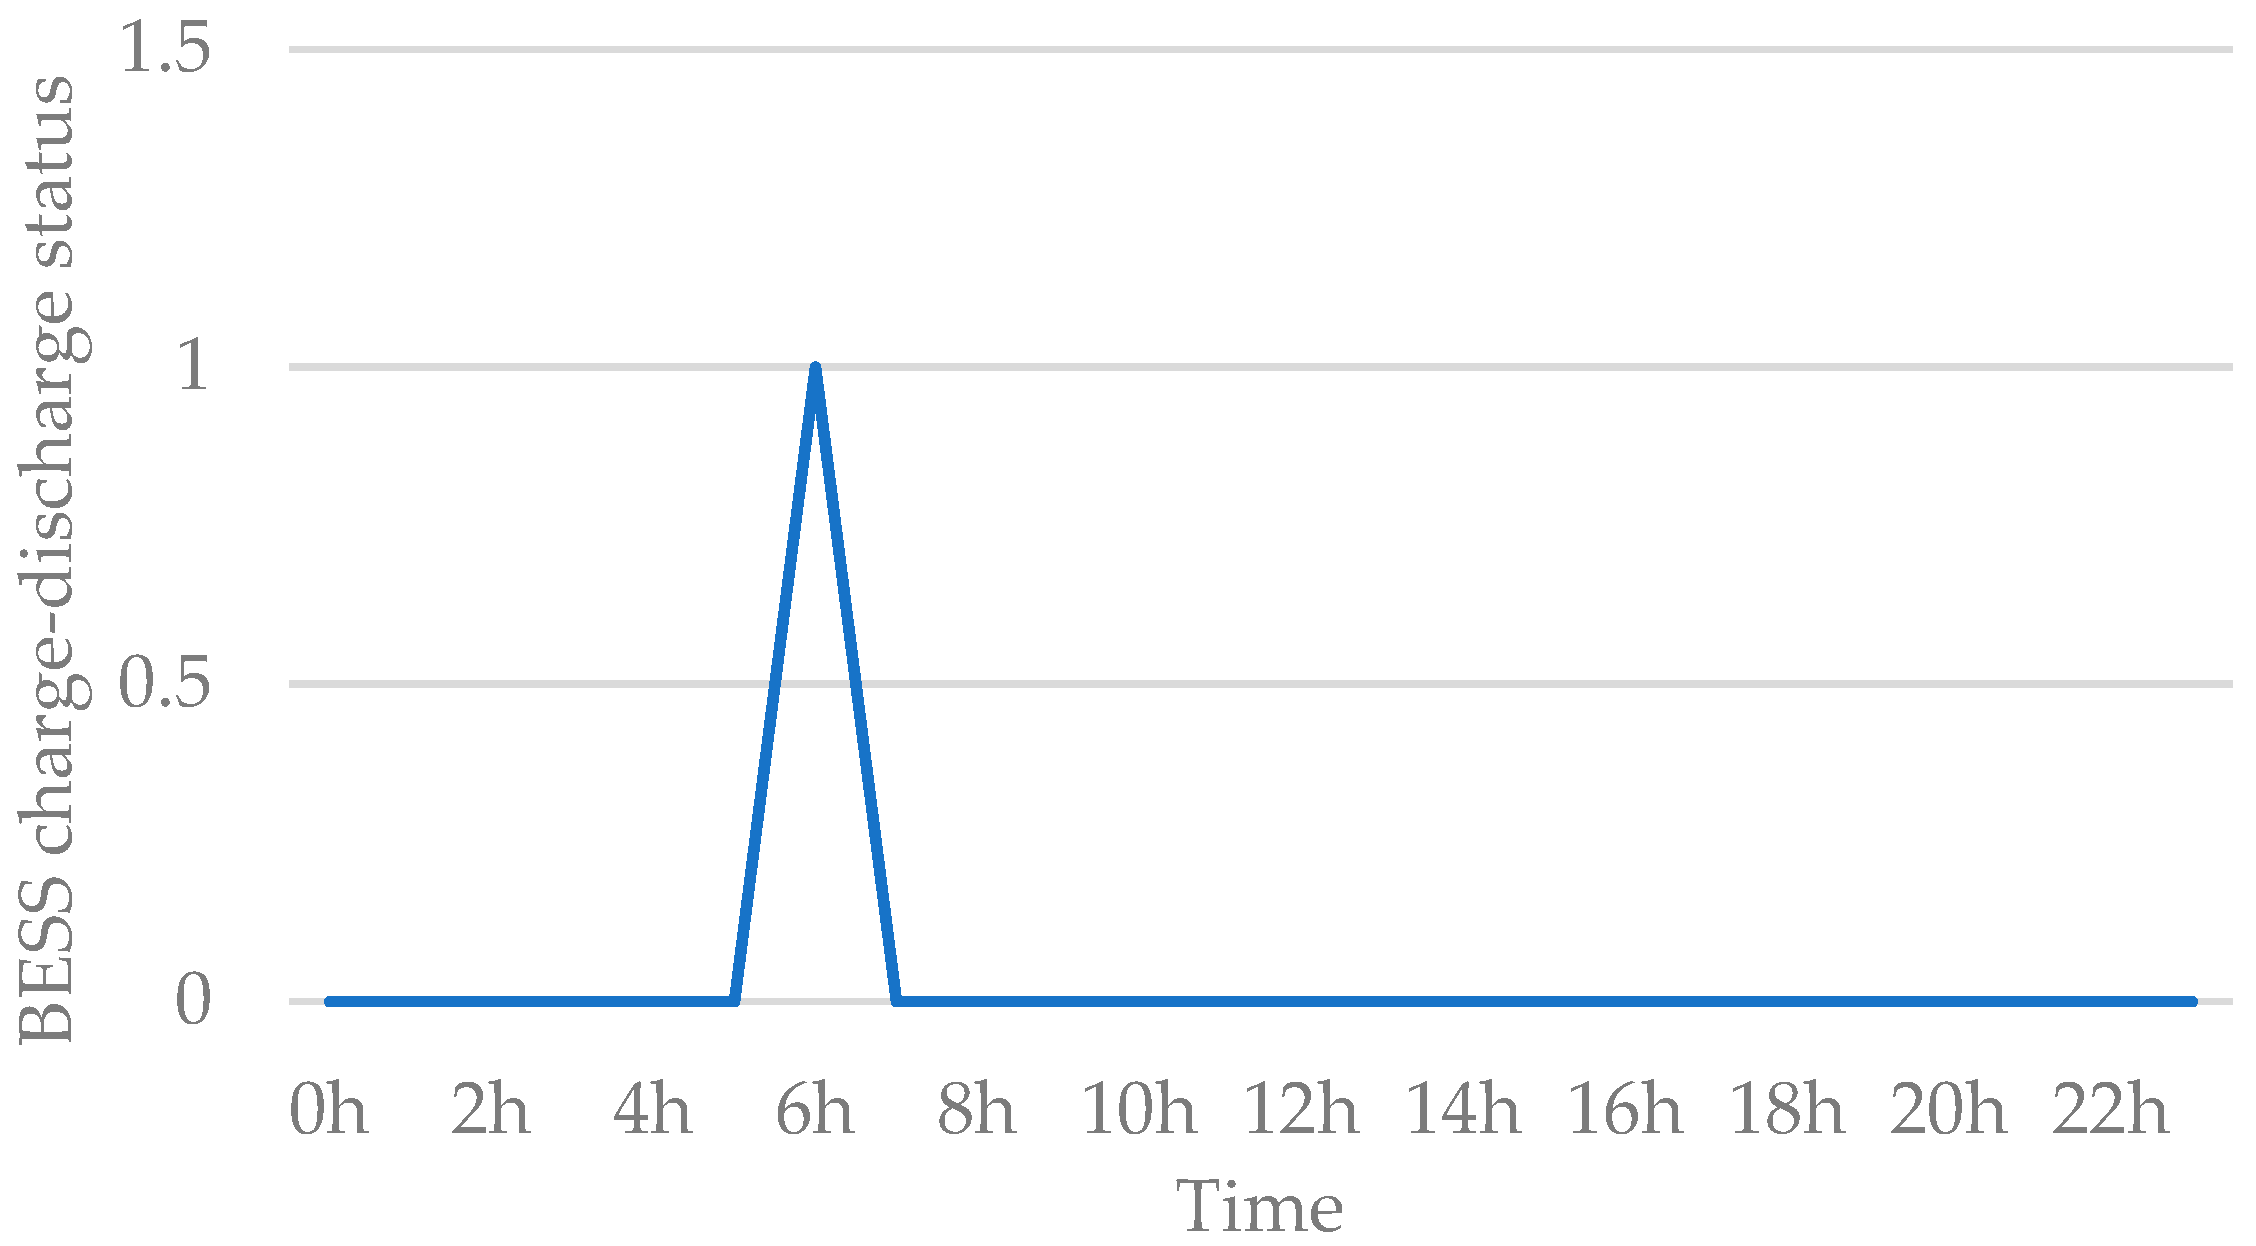
Figure 5 shows the operational status of the battery represented by the binary variables U t c and U t d . The BESS delivers power to meet the load demand until 6 h. It also ensures that the battery is either charging or discharging only at a given instant. The charge–discharge cycle S, which is one of the optimization variables, is shown in Figure 6. For the entire day, S is maintained at 1, which is seen at 6 h.
The proposed formulation enables the surplus power, which is otherwise wasted instead of being used for charging the battery or sold to the grid at the prevailing price of the day, thereby making optimum use of the available solar power and the BESS.

3.2.2. Optimal Battery Size, E ¯ = E ¯ o p t , E ( 0 ) = E ( 0 ) o p t

To ensure that the battery size E ¯ 0 , the proposed formulation is revised to determine the optimal battery size E ¯ and the initial state of charge E ( 0 ) , which are now considered to be decision variables.
The revised algorithm is rerun to determine the optimal values of E ¯ and E ( 0 ) , and the values are found to be:
-
E ¯ o p t   = 2746 kWh; and
-
E ( 0 ) o p t   = 2400 kWh
These values are for load at 70% maximum CS capacity at any instant during the entire NT period. The size of the battery and the initial SOC are dependent on the loading capacity of the CS. As the associated costs of the BESS need to be accordingly revised, for suitability, the following values of battery size and E(0) are used:
-
E ¯ = 3000 kWh;
-
E(0) = 2500 kWh; and
-
Revised fixed and linearly varying costs of the BESS.
The proposed formulation is further rerun with the above data. The profit with the proposed formulation is found to be USD 2674.3 for the entire day. There is no significant change in the profit compared to the profit where the constraint E ≥ 0 was relaxed. This is because the revised costs for the larger-sized battery are used in the subsequent analysis. The corresponding battery power, EV load, and solar PV generation are shown in Figure 7. As seen, battery energy is maintained at E ≥ 0, thereby satisfying all constraints and meeting the load demand even when the solar PV is lower or absent. An alternative solution to maximizing the profit without changing the size of the BESS is to purchase power from the grid at the prevailing rate and sell it to the EVs.

3.2.3. Optimal Solution with and without the Formulation

To carry out a comparative analysis of the results obtained through the proposed formulation, the analysis has been divided into the following three cases:
(i)
Case A: solution without BESS and optimization;
(ii)
Case B: solution with BESS, but without optimization; and
(iii)
Case C: solution with the proposed formulation.
Case A:
The profit is generated only from the sale of electricity when P p v is available. Therefore, the profit is given by:
P R A = t = 1 N T R e v t A C P V t
where R e v t A is the revenue for Case A at time t.
Case B:
The solution is obtained without the implementation of any optimization algorithm but through direct computation based on the availability of P p v ,   P e v , and E ¯ data of the CS. The profit is given by:
P R B = t = 1 N T R e v t B C P V t T C b
where R e v t B is the revenue for Case B at time t.
To appreciate the effectiveness of the proposed formulation, comparative results of the three cases are shown in Table 3.
As seen from Table 3, the proposed formulation gives a total profit of USD 2674.3 for the entire day. The total simulation time taken to run the above three cases is 2.038 s.

4. Conclusions

In this paper, an MILP formulation is carried out on a solar PV-based commercial EV charging station to derive maximum profit from the sale of electricity to the EVs. As most EVs are charged at night when the solar PV is at its lowest, a battery energy storage system (BESS) is used to meet the load demand. Day-ahead solar PV forecast and the probability of EV arrival for charging during the entire 24 h period are considered. However, the solar power and the EV arrival for charging are both highly stochastic. During the NT period, when the solar PV generation is low, BESS delivers power to the load, while it consumes/charges during the period when the solar power is high. Further, the operation of the BESS and solar PV are conditioned in a manner to derive maximum profit. The desired operation of these entities is made possible through binary variables U t p v   ,   U t c , and U t d , thereby resulting in a coordinated charging schedule for EVs.
Due to the contrasting characteristics of solar power and EV charging, BESS has a significant influence on the profit margin. Solar PV alone is unable to meet the load demand and therefore, such demands can be met by:
(i)
Increasing the size of battery; or
(ii)
Importing additional power from the grid.
The worst-case scenario would be to increase the capacity of the charging station for the same load. To determine the optimal size of the battery and E(0) for maximum profit, the formulation is revised using Equation (19). Both the optimal size of the battery and the maximum profit are then determined. Using the revised size of the battery, the initial SOC, and the revised battery costs in the proposed formulation, it is observed that the total profit for the entire day is increased compared to the case without the implementation of any optimization algorithm.

Author Contributions

Conceptualization, A.D.; methodology, A.D. and B.B.; software, A.D.; validation, A.D. and B.B.; formal analysis, A.D.; investigation, A.D.; resources, A.D.; data curation, A.D.; writing—original draft preparation, A.D.; writing—review and editing, B.B.; visualization, A.D.; supervision, B.B.; project administration, A.D. and B.B.; funding acquisition, A.D. and B.B. All authors have read and agreed to the published version of the manuscript.

Funding

This research received no external funding; however, the APC was funded by the Ministry of Education and Science, Poland, at the Bialystok University of Technology (Politechnika Białostocka), Faculty of Electrical Engineering, under research project WZ/WE-IA/2/2020.

Institutional Review Board Statement

Not applicable.

Informed Consent Statement

Not applicable.

Data Availability Statement

The datasets are publicly available. Solar PV data can be obtained from: https://www.renewables.ninja/ (accessed on 9 June 2022). EV arrival data is given in Section 3, for which the raw dataset has been obtained from the reference as provided.

Conflicts of Interest

The authors declare no conflict of interest.

References

  1. Piekut, M. The consumption of renewable Energy Sources (RES) by the European Union Households between 2004 and 2019. Energies 2021, 14, 5560. [Google Scholar] [CrossRef]
  2. Victoria, M.; Haegel, N.; Peters, I.M.; Sinton, R.; Jäger-Waldau, A.; del Cañizo, C.; Breyer, C.; Stocks, M.; Blakers, A.; Kaizuka, I.; et al. Solar Photovoltaics Is Ready to Power a Sustainable Future. Joule 2021, 5, 1041–1056. [Google Scholar] [CrossRef]
  3. Solar Energy. Available online: https://www.irena.org/solar (accessed on 1 June 2022).
  4. Wassiliadis, N.; Schneider, J.; Frank, A.; Wildfeuer, L.; Lin, X.; Jossen, A.; Lienkamp, M. Review of Fast Charging Strategies for Lithium-Ion Battery Systems and Their Applicability for Battery Electric Vehicles. J. Energy Storage 2021, 44, 103306. [Google Scholar] [CrossRef]
  5. Fitt, H.M.; Espiner, N.T. Looking beyond Limitations: Electric Vehicle Use in New Zealand Holidays; Lincoln University|Te Whare Wānaka o Aoraki. LEaP: Lincoln, New Zealand, 2021. [Google Scholar]
  6. Miri, I.; Fotouhi, A.; Ewin, N. Electric Vehicle Energy Consumption Modelling and Estimation-A Case Study. Int. J. Energy Res. 2021, 45, 501–520. [Google Scholar] [CrossRef]
  7. Wang, G.; Xu, Z.; Wen, F.; Wong, K.P. Traffic-Constrained Multiobjective Planning of Electric-Vehicle Charging Stations. IEEE Trans. Power Deliv. 2013, 28, 2363–2372. [Google Scholar] [CrossRef]
  8. Mukherjee, J.C.; Gupta, A. A Review of Charge Scheduling of Electric Vehicles in Smart Grid. IEEE Syst. J. 2015, 9, 1541–1553. [Google Scholar] [CrossRef]
  9. Khan, W.; Ahmad, A.; Ahmad, F.; Saad Alam, M. A Comprehensive Review of Fast Charging Infrastructure for Electric Vehicles. Smart Sci. 2018, 6, 256–270. [Google Scholar] [CrossRef]
  10. Tian, H.; Tzelepis, D.; Papadopoulos, P.N. Electric Vehicle Charger Static and Dynamic Modelling for Power System Studies. Energies 2021, 14, 1801. [Google Scholar] [CrossRef]
  11. Falvo, M.; Sbordone, D.; Bayram, I.S.; Devetsikiotis, M. EV Charging Stations and Modes: International Standards. In Proceedings of the International Symposium on Power Electronics, Electrical Drives, Automation and Motion, SPEEDAM 2014, Ischia, Italy, 1 June 2014; pp. 1134–1139. [Google Scholar]
  12. Bryden, T.S.; Hilton, G.; Cruden, A.; Holton, T. Electric Vehicle Fast Charging Station Usage and Power Requirements. Energy 2018, 152, 322–332. [Google Scholar] [CrossRef]
  13. Quiros-Tortos, J.; Ochoa, L.; Butler, T. How Electric Vehicles and the Grid Work Together: Lessons Learned from One of the Largest Electric Vehicle Trials in the World. IEEE Power Energy Mag. 2018, 16, 64–76. [Google Scholar] [CrossRef]
  14. Lee, J.H.; Chakraborty, D.; Hardman, S.J.; Tal, G. Exploring Electric Vehicle Charging Patterns: Mixed Usage of Charging Infrastructure. Transp. Res. Part D Transport. Environ. 2020, 79, 102249. [Google Scholar] [CrossRef]
  15. Alghamdi, T.G.; Said, D.; Mouftah, H.T. Profit Maximization for EVSEs-Based Solar Energy in Smart Cities. In Proceedings of the 2021 International Wireless Communications and Mobile Computing (IWCMC), Harbin, China, 28 June 2021–2 July 2021; IEEE: Harbin, China, 28 June 2021; pp. 1575–1580. [Google Scholar]
  16. Yan, Q.; Zhang, B.; Kezunovic, M. Optimized Operational Cost Reduction for an EV Charging Station Integrated with Battery Energy Storage and PV Generation. IEEE Trans. Smart Grid 2019, 10, 2096–2106. [Google Scholar] [CrossRef]
  17. Wang, S.; Bi, S.; Zhang, Y.-J.A.; Huang, J. Electrical Vehicle Charging Station Profit Maximization: Admission, Pricing, and Online Scheduling. IEEE Trans. Sustain. Energy 2018, 9, 1722–1731. [Google Scholar] [CrossRef] [Green Version]
  18. Bagherzadeh, E.; Ghiasian, A.; Rabiee, A. Long-Term Profit for Electric Vehicle Charging Stations: A Stochastic Optimization Approach. Sustain. Energy Grids Netw. 2020, 24, 100391. [Google Scholar] [CrossRef]
  19. Baik, S.; Jin, Y.; Yoon, Y. Determining Equipment Capacity of Electric Vehicle Charging Station Operator for Profit Maximization. Energies 2018, 11, 2301. [Google Scholar] [CrossRef] [Green Version]
  20. Carli, R.; Dotoli, M. A Distributed Control Algorithm for Optimal Charging of Electric Vehicle Fleets with Congestion Management. IFAC-PapersOnLine 2008, 51, 373–378. [Google Scholar] [CrossRef]
  21. Stüdli, S.; Crisostomi, E.; Middleton, R.; Shorten, R. A flexible distributed framework for realising electric and plug-in hybrid vehicle charging policies. Int. J. Control. 2012, 85, 1130–1145. [Google Scholar] [CrossRef]
  22. Ma, Z.; Callaway, D.S.; Hiskens, I.A. Decentralized Charging Control of Large Populations of Plug-in Electric Vehicles. IEEE Trans. Contr. Syst. Technol. 2013, 21, 67–78. [Google Scholar] [CrossRef]
  23. Carli, R.; Dotoli, M. A Distributed Control Algorithm for Waterfilling of Networked Control Systems via Consensus. IEEE Control. Syst. Lett. 2017, 1, 334–339. [Google Scholar] [CrossRef]
  24. Lv, Y.; Guan, L.; Tang, Z.; Zhao, Q. A Probability Model of PV for the Middle-Term to Long-Term Power System Analysis and Its Application. Energy Procedia 2016, 103, 28–33. [Google Scholar] [CrossRef]
  25. Singla, A.; Singh, K.; Kumar Yadav, V. Optimization of Distributed Solar Photovoltaic Power Generation in Day-Ahead Electricity Market Incorporating Irradiance Uncertainty. J. Mod. Power Syst. Clean Energy 2021, 9, 545–560. [Google Scholar] [CrossRef]
  26. Khatod, D.K.; Pant, V.; Sharma, J. Evolutionary Programming Based Optimal Placement of Renewable Distributed Generators. IEEE Trans. Power Syst. 2013, 28, 683–695. [Google Scholar] [CrossRef]
  27. Ruiz-Rodriguez, F.J.; Hernández, J.C.; Jurado, F. Probabilistic Load Flow for Radial Distribution Networks with Photovoltaic Generators. IET Renew. Power Gener. 2012, 6, 110. [Google Scholar] [CrossRef]
  28. Dukpa, A.; Duggal, I.; Venkatesh, B.; Chang, L. Optimal Participation and Risk Mitigation of Wind Generators in an Electricity Market. IET Renew. Power Gener. 2010, 4, 165. [Google Scholar] [CrossRef]
  29. Lugo-Laguna, D.; Arcos-Vargas, A.; Nuñez-Hernandez, F. A European Assessment of the Solar Energy Cost: Key Factors and Optimal Technology. Sustainability 2021, 13, 3238. [Google Scholar] [CrossRef]
  30. Development of Rapid Ultra Rapid Charging UK. Available online: https://uk.mer.eco/news/the-development-of-rapid-ultra-rapid-charging-in-the-uk/ (accessed on 6 June 2022).
  31. Nait-Sidi-Moh, A.; Ruzmetov, A.; Bakhouya, M.; Naitmalek, Y.; Gaber, J. A Prediction Model of Electric Vehicle Charging Requests. Procedia Comput. Sci. 2018, 141, 127–134. [Google Scholar] [CrossRef]
  32. He, Y.; Venkatesh, B.; Guan, L. Optimal Scheduling for Charging and Discharging of Electric Vehicles. IEEE Trans. Smart Grid 2012, 3, 1095–1105. [Google Scholar] [CrossRef]
  33. Xydas, E.S.; Marmaras, C.E.; Cipcigan, L.M.; Hassan, A.S.; Jenkins, N. Forecasting Electric Vehicle Charging Demand Using Support Vector Machines. In Proceedings of the 48th International Universities’ Power Engineering Conference (UPEC 2013), Dublin, Ireland, 2–5 September 2013; IEEE: Dublin, Ireland, September 2013; pp. 1–6. [Google Scholar]
  34. Renewables.ninja. Available online: https://www.renewables.ninja/ (accessed on 9 June 2022).
  35. Mongird, K.; Viswanathan, V.; Balducci, P.; Alam, J.; Fotedar, V.; Koritarov, V.; Hadjerioua, B. An Evaluation of Energy Storage Cost and Performance Characteristics. Energies 2020, 13, 3307. [Google Scholar] [CrossRef]
  36. Lojowska, A.; Kurowicka, D.; Papaefthymiou, G.; van der Sluis, L. Stochastic Modeling of Power Demand Due to EVs Using Copula. IEEE Trans. Power Syst. 2012, 27, 1960–1968. [Google Scholar] [CrossRef]
  37. Li, Y.; Huang, Y.; Zhang, M. Short-Term Load Forecasting for Electric Vehicle Charging Station Based on Niche Immunity Lion Algorithm and Convolutional Neural Network. Energies 2018, 11, 1253. [Google Scholar] [CrossRef] [Green Version]
  38. Twój Partner, W.; Zakresie Elektromobilności, W. Europie Środkowo-Wschodniej-GreenWay. Available online: https://greenwaypolska.pl/uslugi-ladowania (accessed on 8 June 2022).
Figure 1. Solar PV-based EV charging system with the grid.
Energies 15 05760 g001
Figure 2. Solar PV and EV arrival (load) in kW.
Energies 15 05760 g002
Figure 3. Charging and discharging powers of battery.
Energies 15 05760 g003
Figure 4. Battery energy, load EV, and the solar power.
Energies 15 05760 g004
Figure 5. Operational status of the BESS.
Energies 15 05760 g005
Figure 6. The number of charge-discharge in 24 h.
Energies 15 05760 g006
Figure 7. Battery energy, E > 0 with larger sized battery.
Energies 15 05760 g007
Table 1. Costs and other data for solar PV and battery.
Solar PV: Apv ($)1.267Fixed cost of solar PV system for fixed plate that includes installation costs, soft costs, and hardware costs [34]
Solar PV: Bpv ($/kWh)0.000017Variable cost (operation and maintenance) of solar PV system [34]
Battery: Ac ($/kWh)0.0011Fixed cost of charging Li-ion battery [35]
Battery: Bc ($/kWh)0.0011Variable cost of charging Li-ion battery [35]
Battery: Ad ($/kWh)0.0011Fixed cost of charging Li-ion battery [35]
Battery: Bd ($/kWh)0.0011Variable cost of charging Li-ion battery [35]
Battery: C b ($/Cycle)0.134Cost-per-cycle of Li-ion battery [35] with 3500 cycles at 80% DoD
Battery: Efficiency, η b   (%)90Efficiency of Li-ion battery; Li-ion batteries have one of the highest efficiencies
Depth of Discharge:
DOD (%)
80Battery allowed to discharge to 80%
Battery Size: E ¯ (kWh)1000Size of the battery
Table 2. Day-ahead EV arrival forecast based on the results of [37].
TimeEV Arrival Data from [37]
(kW)
EV Probability ρ e v
(%)
0 h2824.2
1 h4026.0
2 h2694.0
3 h2513.8
4 h2463.7
5 h5037.6
6 h85012.8
7 h156023.5
8 h210031.6
9 h375756.5
10 h361254.3
11 h263539.6
12 h335450.4
13 h433565.2
14 h406361.1
15 h465470.0
16 h349852.6
17 h264739.8
18 h279542.0
19 h347952.3
20 h357753.8
21 h205931.0
22 h113517.1
23 h3745.6
Table 3. Comparative analysis of the solution.
Case ACase BCase C
Profit ($)1462.82612.12674.3
Publisher’s Note: MDPI stays neutral with regard to jurisdictional claims in published maps and institutional affiliations.

