1. Introduction
Congestion volumes in European power networks have been on the rise in recent years. The need and thus the according costs of redispatch, the main mechanism to relieve congestion, are currently increasing in Austria and other European countries [
1]. This is caused by a rising amount of distributed generation from renewable energy sources (RES) and the geographical distribution of generation and demand. Activation of redispatch implies a symmetric change of dispatch—typically of power plants—whereas the dispatch is reduced upstream and increased downstream of the congestion point. While hydro pump storage power plants are expected to be available for redispatch provision in the future, conventional power plants, which are currently predominantly used for redispatch, will likely no longer be available due to their planned phase-out in the course of the energy transition. Therefore, smaller and/or renewable generation units need to be aggregated in order to provide redispatch services in the future.
Redispatch is not as harmonized as other electricity markets in Europe due to different procurement and remuneration models. This is caused by the differences in the occurrence of grid congestion and national rules. Some countries remunerate redispatch providers only by reimbursing their costs, while others apply market-based approaches, including using bids from other market platforms for redispatch purposes. For instance, in the Netherlands, bids from the intraday trading platform can be used for congestion management by adding geographical information to the bids. In Austria, at the moment, only bilateral contracts with specific plant operators are used.
RES that so far have mostly been only curtailed in the event of congestion could arguably be engaged in redispatch provision on par with other technologies, provided that aggregation is allowed and appropriate incentives are in place.
This work has been carried out in the context of the ERA-Net-founded project REgions, which focuses on providing services for congestion management with RES. The core technology that has been chosen for this project is photovoltaic plants (PV). Therefore, the objective of this work is to find out which incentives are needed for PV-based virtual power plants (PV-VPPs) to participate in providing redispatch services. To achieve this objective, a bidding strategy considering the different value streams from spot and balancing markets as well as redispatch has been developed in this paper and implemented in a model, using linear optimization techniques. In addition, a market-based procurement scheme for redispatch has been suggested and different remuneration schemes have been proposed and compared. For further comparison, a pricing strategy, which considers the subdivision of the Austrian control area into three different zones and is determined by the TSO for redispatch remuneration, has been additionally developed. Note that, in this paper, RES-VPP participation is only evaluated in a European context.
The remainder of this paper is structured as follows:
Section 2 gives an overview of the state of the art in the scientific literature and highlights the contribution of this paper.
Section 3 introduces the developed optimization model for bidding, as well as the data used, before the results are presented in
Section 4. Conclusions from the analysis as well as suggestions for future research are provided in
Section 5.
2. State of the Art
This section describes the current market and boundary conditions of spot markets, ancillary services and congestion management, which renewable energy suppliers are facing when participating in electricity markets, as well as the related research. Note that although the main focus of this work is on Austria, where the evaluated VPP is located, the results can be easily transferred and might be of relevance for other EU countries. Furthermore, in this section, we provide an overview of previous work on the economic viability of PV plants, as well as the gaps that this work aims to address.
2.1. Participation of RES in Spot and Balancing Markets
Since the adoption of the
Clean Energy for All European Package (CEP) [
2] in 2019, RES in the EU have been legally enabled to participate in all electricity markets. Whereas, in the past, RES were restricted to the feed-in tariff, possibilities for commercialization on spot, day-ahead and intraday and balancing markets as well as congestion management services are currently arising.
Day-ahead and intraday markets are coupled across multiple EU countries and are open for the participation of RES. The gate closure time (GCT) for the coupled EU day-ahead market is D-1 12:00, and the pricing mechanism is pay-as-cleared.
In particular, intraday markets with short lead times and product duration are suitable for variable RES whose generation forecasting is still linked to varying degrees of uncertainty. In Austria, there are hourly and quarter-hourly intraday products available; they start at each quarter or full hour. The continuous market offers products with a lead time of up to 5 min before delivery for intra-zonal delivery and up to 60 min for cross-border delivery. The price determination is carried out via continuous trading or auctions and the clearing mechanism of the continuous market is pay-as-bid [
3].
In addition, minimum required bid sizes have recently decreased in multiple marketplaces, allowing easier market participation of smaller units [
4]. Nevertheless, in many national markets, smaller-scale RES are still constrained by the minimum bid size and can only participate through aggregation. The most well-known effect of renewables on the spot markets is that—due to close-to-zero marginal costs or government-funded support without market integration (feed-in tariff policies offer guaranteed prices for fixed periods of time for electricity produced from RES, and these prices are generally offered for every kWh of electricity produced [
5])—conventional power plants with higher marginal costs are being pushed out of the merit order. This effect occurs during times in which high shares of renewable electricity are produced and often leads to a decrease in—or even negative—price, commonly known as the merit order effect (MOE) [
6]. In addition, the volatility of prices has been increasing with the rising share of renewable generation, as the residual load is most of the time more volatile than the total demand [
7].
Balancing reserves are used to stabilize the frequency of the power grid, by ensuring that generation equals demand at all times. Three standard balancing products, frequency containment reserve (FCR), automatic frequency restoration reserve (aFRR) and manual frequency restoration reserve (mFRR), are available to be activated within a sequential process. Lead times on the balancing markets of a week or longer [
8] were not suitable for RES in the past. The European Balancing Guideline adopted at the end of 2017 [
9], however, mandated daily or more frequent auctions for balancing energy.
In the Austrian balancing capacity auction, a capacity and an energy price can be offered the day before delivery with a GCT at 10:00; if accepted, the respective capacity has to be reserved. Since the market changes in 2020 [
10], a VPP does not necessarily have to reserve capacity to participate in the balancing energy market, as there are hourly auctions for energy during the day. In this case, only the activated balancing energy is remunerated; there is no remuneration for capacity reservation. The gate closure time for balancing energy was, at the time of simulation, one hour before the product delivery; capacity price as well as energy prices were settled pay-as-bid. Gate closure times (GCT) have further been adjusted; from 2022, the implementation of the platforms MARI and PICASSO [
11] for the common cross-border procurement of balancing products mFRR and aFRR, respectively, enables the trading of balancing energy up to 25 min ahead of product delivery. This allows RES to more safely estimate their true availability.
Participation is currently possible as long as all participating components fulfill prequalification requirements [
6]. These, for instance, differ in their ramping and reaction time for FCR, aFRR and mFRR, as well as backup requirements, and might not be able to be completely fulfilled by all renewables yet.
The authors of [
12] investigated the effects of the participation of renewables in a free-bidding balancing market with marginal pricing for the Swedish market, by using an agent-based model. This study shows, among others, that if RES entry into ancillary service markets is facilitated, this can lead to an increased market efficiency and RES taking a proactive role in contributing to grid stability. Based on these results, the participation of RES would be highly favorable.
2.2. Redispatch in Austria and in Europe
Congestion management aims to resolve power grid congestion using different methods:
non-costly remedial actions (the use of phase shift transformers or line switching) or
costly remedial actions such as cross-border redispatch or the use of pre-contracted reserves. National redispatch is a type of remedial action for congestion management, where a strategically planned increase and coupled decrease in generation is used to solve grid congestion while ensuring that the power grid remains balanced in the process. In Austria, increasing amounts of electricity exchange between neighboring countries and an increasing amount of production from wind and PV have led to increasing costs and volumes of redispatch. This is further aggravated by the insufficient expansion of transmission grids [
13].
In contrast to balancing,
redispatch does not come in the form of a harmonized market and is implemented differently by each TSO. Art. 13 of the Electricity Market Regulation [
2] requires all member states to provide access to redispatching for all providers (including RES, demand response and storage systems) [
14]. It furthermore states that a market-based approach to redispatch should be considered by default [
15]. Therefore, only a handful of EU countries use cost-based redispatch (such as Germany and Austria), whereas most other countries use some form of market-based approach (e.g., France, the Netherlands, Great Britain and Italy). In some cases, the redispatch market is coupled with other markets, mainly balancing markets. The Netherlands is the only example, to our knowledge, of procuring redispatch over the intraday market.
Table 1 gives a short overview of selected countries and their remuneration methods for redispatch. Some authors ([
16,
17]) propose nodal prices or local marginal pricing for redispatch. The authors of [
17] state that producers maximize their payoffs by simply bidding their marginal costs and that the accepted offers do in fact maximize short-run social welfare.
In the following paragraph, Germany and the Netherlands will serve as two examples of different approaches to redispatch provision.
Germany uses a cost-based model, where redispatch provision is mandatory for all producers and storage operators larger than 100 kW [
23]. The feed-in priority for renewables is ensured by modifying the costs for RES, which are used for determining the merit order. The costs of plants that are affected by the feed-in tariff are multiplied by a factor of 10. This only applies to the activation sequence, not to the real remuneration. Lost revenues can be compensated and opportunity costs can be claimed by all participating plants.
In the Netherlands, a market-based model is in use, by utilizing intraday bids and matching them symmetrically, considering locational and cost information. This is carried out via the platform GOPACS [
24], which is connected to the intraday market platform. In this way, participation in the redispatch market is easily possible for all participants that are already trading in the intraday markets.
2.3. Prior Work on Economic Viability of PV
The business case of the participation in the electricity markets has been investigated for distributed PV systems in conjunction with household loads or battery storage systems in several papers. Many of them focus on the investigation of current feed-in tariffs [
25,
26]. An overview study of different markets suggests that distributed PV has great prospects in the environment of the electricity markets [
27], especially in the context of the aggregation of distributed energy resources (DER) by using optimal planning and operation methods [
28].
Several authors investigated bidding strategies for the day-ahead market of RES and identified the uncertainty of generation forecasts as the largest challenge [
29]. The authors of [
30] state that consideration of additional markets, such as intraday or balancing reserve markets, can increase profits and decrease imbalances and should therefore be pursued. MILP problem formulations with the objective to maximize profits are frequently used to optimize bidding strategies [
31,
32,
33], but also robust (stocastic) optimization [
34] and agent-based models [
35] are typical.
Further, the effects of distributed RES on the distribution grid have been investigated, and it has been found that emerging DERs have diverse and highly nonlinear impacts on transmission operation constraints, and thus on congestion management in electricity markets [
36]. Congestion in the distribution grid will also likely occur in the future, and alternative mechanisms other than grid reinforcement have been recommended—for instance, local flexibility markets [
37].
Several studies focus on cost-effectiveness when participating in ancillary service provision [
38], and propose to combine PV plants with other types of generation or load, such as thermal or wind generation [
39], with household loads [
40] or as part of industry sites [
38]. These studies therefore highlight the economic benefits of operating PV as part of a VPP. In this context, a VPP can be defined as a cluster of geographically dispersed generating units, controllable loads and storage systems, all aggregated to operate as a single power plant. The generators can use both fossil and renewable energy sources, and the “heart” of a VPP is an energy management system (EMS) that coordinates the power flows coming from the generators, controllable loads and storage systems [
41]. Mixed integer linear programming (MILP) methods are a common means of modeling and optimizing scheduling and planning problems for VPPs (e.g., [
40,
42]). The authors of [
43] solved a general capacity allocation problem for several markets in a co-optimization.
2.4. Progress beyond the State of the Art
While previous work—which is, for instance, mentioned in
Section 2.3—mainly investigated the bidding strategies for VPPs in spot or balancing markets, this paper contributes findings about bidding in an additional potential redispatch market for a PV-VPP while simultaneously considering value streams from spot and balancing markets. The optimization problem is formulated as a sequential process, reflecting the real current timing of the markets. The provision of balancing energy at the distribution grid level could increasingly conflict with network security measures [
44]. It is investigated how this correlation of balancing and congestion management is reflected in the bidding behavior of the PV-VPP. Thus far, only distributed PV and its influence on congestion in the DSO grid have been investigated. Thus, in this paper, we address the question of how a PV-VPP could contribute to redispatch for the TSO. Moreover, different compensation mechanisms beyond the state of the art are compared and a methodology for redispatch calculation in Austria using the division into three different network zones is proposed.
The main research questions addressed in this paper are as follows.
- 1
Redispatch has a very strong locational component. How can we consider this aspect in the optimization? How does the profitability of a PV-based plant participating in redispatch vary between different zones in Austria?
- 2
How can the different markets be considered in an optimization that is carried out at different points in time?
- 3
How does the remuneration of redispatch need to be designed to provide sufficient incentives for RES to provide redispatch?
- 4
Is pre-curtailment for upward redispatch profitable for a PV-VPP?
3. Model and Method
In this section, the day-ahead market, the balancing capacity and balancing energy market, the intraday market, as well as assumptions for the potential redispatch market are described, since all of these markets are required to model redispatch and the correlating bidding behavior correctly. Not only the respective assumptions that are made should be presented, but also the context of the optimization model should be drawn, which is described in detail in
Section 3.7. The timeline of necessary optimization steps for carrying out the bidding algorithm and therefore the order of optimization events will be explained in
Section 3.6. It is again important to note that all described market rules are oriented by the Austrian market regime. Moreover, it needs to be mentioned that currently no redispatch market exists in Austria. Therefore, for this work, a redispatch market is suggested by the authors.
3.1. Day-Ahead
The gate closure time of the day-ahead market is defined according to the current EU market rules described in
Section 2.1. It will be linked with both the balancing and redispatch markets; otherwise, the optimization tool would determine the selling of the total generation at the day-ahead market as the optimal solution. This assumption implies that there are no negative prices, which would cause costs through feed into the grid. The optimization algorithm calculates a schedule considering perfect price forecasts. The use of perfect forecasts is seen as unproblematic, since the VPP is able to offer a very low price due to the low near-zero short-term marginal costs of the photovoltaic power plant, and therefore receives bid acceptance. It will then be remunerated by the marginal clearing price. No flat remuneration is possible for PV in case of participation in balancing markets; therefore, this will be not considered within this paper. If the VPP plans to offer upward redispatch (see
Section 3.4), the requirement has been defined that the plant has offered power at the day-ahead market but did not receive bid acceptance because it was outside of the merit order range. If this case is desired, the selling price for power will be 150% of the forecasted day-ahead price. Therefore, there are two merit-order list positions for trading at the day-ahead market possible, one at a low merit-order position to be accepted and at a high-merit-order position to be rejected in order to participate in the upward redispatch market.
3.2. Automatic Frequency Restauration Reserve (aFRR)
Reflecting the current European market conditions as stated in
Section 2.1, it is assumed that upward (positive aFRR) as well as downward products (negative aFRR) can be offered by the VPP and that no symmetric bids are required. The participation at the aFRR in the downward direction is directly linked to prior market participation in the day-ahead market, in case the plant is not able to absorb electricity from the grid. It is assumed that a certain schedule traded at the spot markets has to be followed. Only if the plant is generating and injecting into the grid, power can be curtailed and negative aFRR can be provided. In order to offer upward aFRR, pre-curtailment of the PV production is obligatory if there is no additional storage available. In anticipation of the quarter-hourly products for PICASSO, it has been decided that hourly products can be offered by the VPP (contrary to the 4-h products at the time of carrying out the simulations for this paper). From the perspective of the redispatch providers, the redispatch marketer needs to be able to provide constant maximum power within the respective hour.
The balancing market rules are implemented according to the rules for balancing markets in Austria described in
Section 2.1. GCT was, at the time of carrying out the simulations, assumed to be one hour before product delivery; the change to 25 min before product delivery with PICASSO would not change any results, though, as the forecasts remain the same within this hour. For the optimization, call probabilities are calculated for each timeslot. The profits, in the event that the probable amount is activated, are part of the objective function. The extreme cases for maximum activation in upward and downward direction are considered as well (also see
Section 3.7). Call probabilities for aFRR are calculated as average probability per hour, based on historic data gathered from the website of the Austrian transmission grid operator in the period of the year 2019.
3.3. Intraday Market
In case of deviations of the PV forecast, intraday trading to compensate for these deviations, as shortly described in
Section 2.1, is allowed as well. In the simulation, hourly products of the continuous market have been considered. For simplicity, the intraday optimization is carried out on an hourly basis. There, trading is either allowed combined with the balancing energy or redispatch optimization, or only for the next hour, to compensate for the instantaneous deviations.
3.4. Redispatch
As stated in
Section 2.2, there is no harmonized approach to the procurement of redispatch on the EU level, whereas in Austria, it is remunerated on a cost basis, which removes any incentive for a PV-VPP to participate. In order to investigate the effect of different alternative types of redispatch remuneration on the bidding strategy of a VPP, we make a number of assumptions, as to the GCT, product length and pricing schemes in a potential redispatch market. The assumptions have been drawn in line with the current balancing energy and capacity market regulations. In zonal markets, the demand for redispatch is directly determined by the outcome of the trades in the day-ahead market. Therefore, redispatch already has to be considered when trading at the day-ahead market. All the generation that has been offered and accepted at the day-ahead market can be offered as downward redispatch, and everything that has been offered at the day-ahead market and not been accepted (because it was out of the merit order range) can be still offered as upward redispatch energy. Following logic similar to the balancing market, in order for RES-based plants to provide upward redispatch, pre-curtailment would be necessary. Furthermore, it has been assumed that there is only one energy price but no remuneration for reservation of capacity for redispatch.
The timeframe for redispatch procurement is assumed to be the same as balancing energy, which is one hour before product delivery. This assumption is derived from the fact that, in some countries, the same bids are used for balancing and redispatch. Moreover, a slightly different GCT would not make much difference for the assumed optimization algorithm in this paper, as always both markets, redispatch and balancing, have to be considered simultaneously to prevent everything being sold on the market with the earlier GCT. The PV forecast used in the simulation only changes between D-1 and the day of delivery; therefore, a different GCT for redispatch within the same day would produce the same results.
To estimate the call frequency of redispatch products, the APG control area is, for this work, split into three “small technical zones”, as shown in
Figure 1.
The zones roughly correspond to (1) Vienna, Lower Austria and Burgenland (Zone East); (2) Upper Austria and Styria (Zone Mid); (3) Salzburg, Carynthia, Tyrol and Voralberg (Zone West). This subdivision was introduced in the ENTSOE Ten Year Network Development Plan 2018 methodology [
4]. It is not proposed to split the Austrian bidding zone into smaller bidding zones. This division is meant purely to facilitate the allocation of call probabilities that—given the specificity of redispatch—depend on the unit’s location in the grid. In Austria, the bulk of wind and solar generation is located in Zone East, whereas Zone West contains most hydro and pump storage plants. Gas-fired power plants are spread across the country, with a focus on Zone East and Zone Mid. (See also
https://globalenergymonitor.org/, accessed on 25 July 2022) In addition, Austria is an electricity transit country, which means that a lot of congestion is caused by the transit flows from the neighboring countries (please note that the Austrian TSO, for security reasons, does not publish the exact location of internal congestion). Each small technical zone is considered a copperplate. The call probabilities are varying on an hourly basis but not in between days. Ergo, no congestion forecasts are conducted for the simulation. However, a simulation of redispatch on a nodal basis is carried out, which considers cross-border activations, generation and consumption data. The call probabilities for the different regions are dependent on the geographical location of the congestions, direction (upward or downward), the frequency per year of a called product (within one time slot per day) and the volumes, as an outcome of the nodal simulation.
3.5. Redispatch Pricing Scenarios
Different pricing schemes have been used to identify the level of remuneration appropriate for a PV-based VPP to provide redispatch, considering that there are also other commercialization options. The proposed possible pricing schemes for redispatch are listed in
Table 2. The idea behind not coupling the prices for redispatch with intraday prices or balancing prices is the following: even though redispatch is sometimes remunerated with the balancing prices, this option was not included in the simulation since a dedicated simulation would not reveal additional information. That is, from the optimizer’s perspective, if the prices are the same, the market with a higher call probability will be bid into. Intraday prices are only known afterwards, and due to the volatility, their outcome is very unclear for the plant operator. On the contrary, day-ahead spot prices are already known at the point of redispatch bidding and, furthermore, redispatch results more or less directly from the day-ahead market results. Cost-based remuneration schemes would not provide any incentive for RES-VPP, as their costs are usually close to zero; therefore, it has been excluded from the analysis. In order to determine price levels, where a PV-VPP provides redispatch bids, a sensitivity analysis with varying prices has been carried out. Nevertheless, if the price for upward redispatch would be the same as the day-ahead price, the plant would always choose the day-ahead market because of the higher probability of being accepted. This is why multiples of the day-ahead price have been chosen in order to identify an adequate compensation level for a PV-VPP to provide redispatch. Downward redispatch achieves additional profits, since such a provider has already been awarded in the DA market and is only competing with the balancing market. Therefore, it can be lower than the DA price and is varied between 25% and 100%. Nodal prices that have been proposed in some studies (see
Section 2.2) have been considered in a separate scenario for comparison.
Calculating energy prices using optimization models can be conducted in two different ways: on a nodal or zonal level. While the first considers all transmission line capacities, the latter splits the grid into several zones (bidding zones, countries, etc.) and drops all constraints from the model that are linked to transmission line capacities within a zone. The often used copperplate model is essentially the most simple zonal model: with only one node (the copperplate) per zone, no constraints except for cross-zonal lines are added to the model. Grids that keep more than one node per zone will, in contrast, still consider flow-related constraints, even when dropping the line capacity constraints. To relate this to redispatch, one can look at it in the following way:
In the nodal model, all transmission lines are constrained by their respective maximum capacity. This means that in order to prevent lines being congested, more expensive generators will be used.
In the zonal model, all transmission lines within a single zone can be used as much as necessary to achieve the objective minimal costs. This includes utilizing lines above their capacity limits. To ensure that the market outcome becomes feasible again, post-clearing remedial actions such as redispatch are necessary in a second step.
Comparing the results of the nodal and the zonal model, for every node, three possibilities arise:
- 1
Possibility 1: The dispatch of all generators is the same. The price at the respective node equals the cost of the most expensive generator utilized there (which is guaranteed to be ≤ the zonal price).
- 2
Possibility 2: Less capacity is utilized in the nodal than in the zonal model, which will only be the case if this is needed to prevent congestion (since the outcome of the zonal model is guaranteed to be optimal without considering possible congestion). This can lead to a reduced nodal price (if expensive generators drop out).
- 3
Possibility 3: More capacity is utilized in the nodal than in the zonal model. The generators awarded in the nodal market can be more expensive than in the zonal model. This happens to offset the reduction in generation on another node (see possibility 2).
Considering the nodal prices resulting from the three different possibilities, one can deduce that “low nodal prices” (possibility 2) are more likely to occur on nodes that induce congestion by increasing their generation and “high nodal prices” (possibility 3) on those that lead to congestion by decreasing their generation. Since there are multiple ways to perform/calculate redispatch (minimizing costs or activations, ranking technologies, etc.), an unambiguous transformation between nodal and zonal results cannot be formulated. However, it can be concluded (using the previously stated scenarios) that redispatch (with a remuneration based on nodal prices) “corrects” the zonal model results in the following way:
If upward redispatch is activated, this is likely to happen at a node that had a higher generation in the nodal model (since the congestion that the nodal model prevented endogenously is now being corrected). This additional generation is awarded using the “upper limit” of the cost of generation at this node. As long as the redispatch does not use more capacity at a given node than the nodal market, this holds true. Depending on the redispatch algorithm, it can of course happen that the generation exceeds this amount and that generators would be used for redispatch that are based on costs above the nodal price.
If
downward redispatch is activated, this is likely to happen at a node that had a lower generation in the nodal market.
Table 2 shows that a remuneration for downward redispatch that lies below the remuneration for upward redispatch could be considered rational. Since the nodal price at a node where downward redispatch is called is more likely to be low as well (due to less and therefore cheaper generation being utilized), this rational behavior is endogenously replicated.
3.6. Order of Optimization Events
In this section, the chronological sequence of gate closure times for different markets and the associated optimization runs at certain time steps are described. The optimization model is carried out as a rolling horizon optimization. The used sequence and optimization runs can be derived from the following list, as well as from the flowchart in
Figure 2. The term “D-1” indicates the day-ahead timeframe; “D-0” indicates the day of product delivery.
D-1
- 1
Joint optimization of day-ahead, balancing reserve and redispatch considering all forecasts.
- 2
If balancing bids are not accepted at the market, another day-ahead optimization can be carried out optionally.
- 3
If the forecasted day-ahead (bidding) price lies within the merit order, the amounts of energy can be offered for downward redispatch; if it lies outside the merit order, the bidding amounts of energy are allowed to be offered for upward redispatch.
D-0
- 1
Optimization of balancing energy and redispatch market bids, considering the intraday market simultaneously.
- 2
Rebuy of forecast deviations on the intraday market.
3.7. Optimization Model to Determine Ideal Market Bids
This section outlines the mathematical formulation of the linear programming (LP) problem, used to find the optimal bidding behavior for the photovoltaic virtual power plant. The nomenclature for the model is provided in
Section 3.7.1; the formulation of the model itself can be found in
Section 3.7.2.
3.7.2. Problem Formulation
The optimization problem of the ideal combination of market bids is a profit maximization problem. The profits and, if with negative sign, costs coming from day-ahead and intraday market bids have to be considered, as well as profits coming from bidding at the balancing market and the potential redispatch market. Depending on the optimization run, all variables are considered, but some of them are fixed and pre-initialized with results from the previous optimization. For instance, the scheduling of bids for the balancing capacity auction is optimized at 10:00 a.m., the scheduling for the day-ahead market is optimized at 12:00 a.m., while the results from the balancing capacity market are fixed within the day-ahead optimization run. The objective function comprises the profits summed up over the whole optimization time period:
As stated in
Section 3.4, there are two merit-order positions available in terms of the day-ahead market for the optimizer to choose. The low-merit-order position is assumed to guarantee the bids to be accepted and is therefore defining the expected profits. For the day-ahead price, a perfect forecast is used, which corresponds to the final clearing price:
The expected profits from the balancing market consist of the balancing capacity prices, each for the upward and downward total offered and accepted amount. The profits for balancing energy consist of the expected balancing energy price multiplied with the expected amount, summarized over all mol positions. The expected amount is calculated based on a call probability, which is derived from historical values. Here, 0.25 is the conversion factor from hours to quarter hours, and 0.001 is the conversion factor from kW to MW.
For redispatch, no remuneration is foreseen for capacity reservation. Only the delivered amounts of energy are accounted for with remuneration. Therefore, the expected profits for redispatch consist of the redispatch energy price multiplied with the expected activated amount, which is the total offered amount multiplied with a call probability, which is derived from the redispatch simulation on a nodal basis (see
Section 3.4). The conversion factors are according to the conversion factors for balancing profits.
The power of the VPP at the grid connection point (gcp) has to fulfill all requirements in terms of availability caused by the bids at the different markets. The possible cases of maximum upward or downward regulation have to be considered, as well as the bids at the day-ahead high position, which could be potentially accepted as well. Moreover, the probable case represents the based on the call probabilities expected behavior and goes into the objective function. The maximum upward and downward case only guarantee the feasibility in case of maximum activation. For this case, an additional parameter is assigned to the power at the gcp. This is the same for the physical components of the optimization model; they all have to be built three times (‘
prob’, ‘
pos’, ‘
neg’), for each of the cases, which have to be considered in terms of physical feasibility of offered bids.
In the case of the day-ahead optimization before day-ahead market closing, instead of the downward redispatch, the high position of day-ahead bids is considered, because, in case of acceptance, this has to be fulfilled as well:
Moreover, there are constraints for downward redispatch, which has to be less than or equal to the amount bid at the day-ahead market at the low position. Upward redispatch has to be less than or equal to the amount bid at the high position.
The amount at the high position can only be less than or equal to zero, because nothing can be bought at a price that is too high.
The profits of the intraday market are as follows:
Within the product length of one hour, the offered bid has to be constant, each for balancing and redispatch. The parameter
is an array of timesteps, including the timesteps of each product that end at every full hour.
For the physical components, namely the photovoltaic plant, the power is variable between zero and the maximum power.
The curtailed PV power, which could also consist of a combination of plants and storages, is connected to the grid connection point for each case (probable, positive (upward), negative (downward)):
All physical components are connected to the grid, which is modeled as an ideal copperplate without losses. Therefore, the power fed into the grid has to be equal to the consumed power.
To maintain the balance of the grid, another component that serves as a source or sink for the injected power of the VPP and all potential other loads/generators is required:
The equation that connects the PV-VPP grid connection point via the grid with the slack is therefore:
4. Results
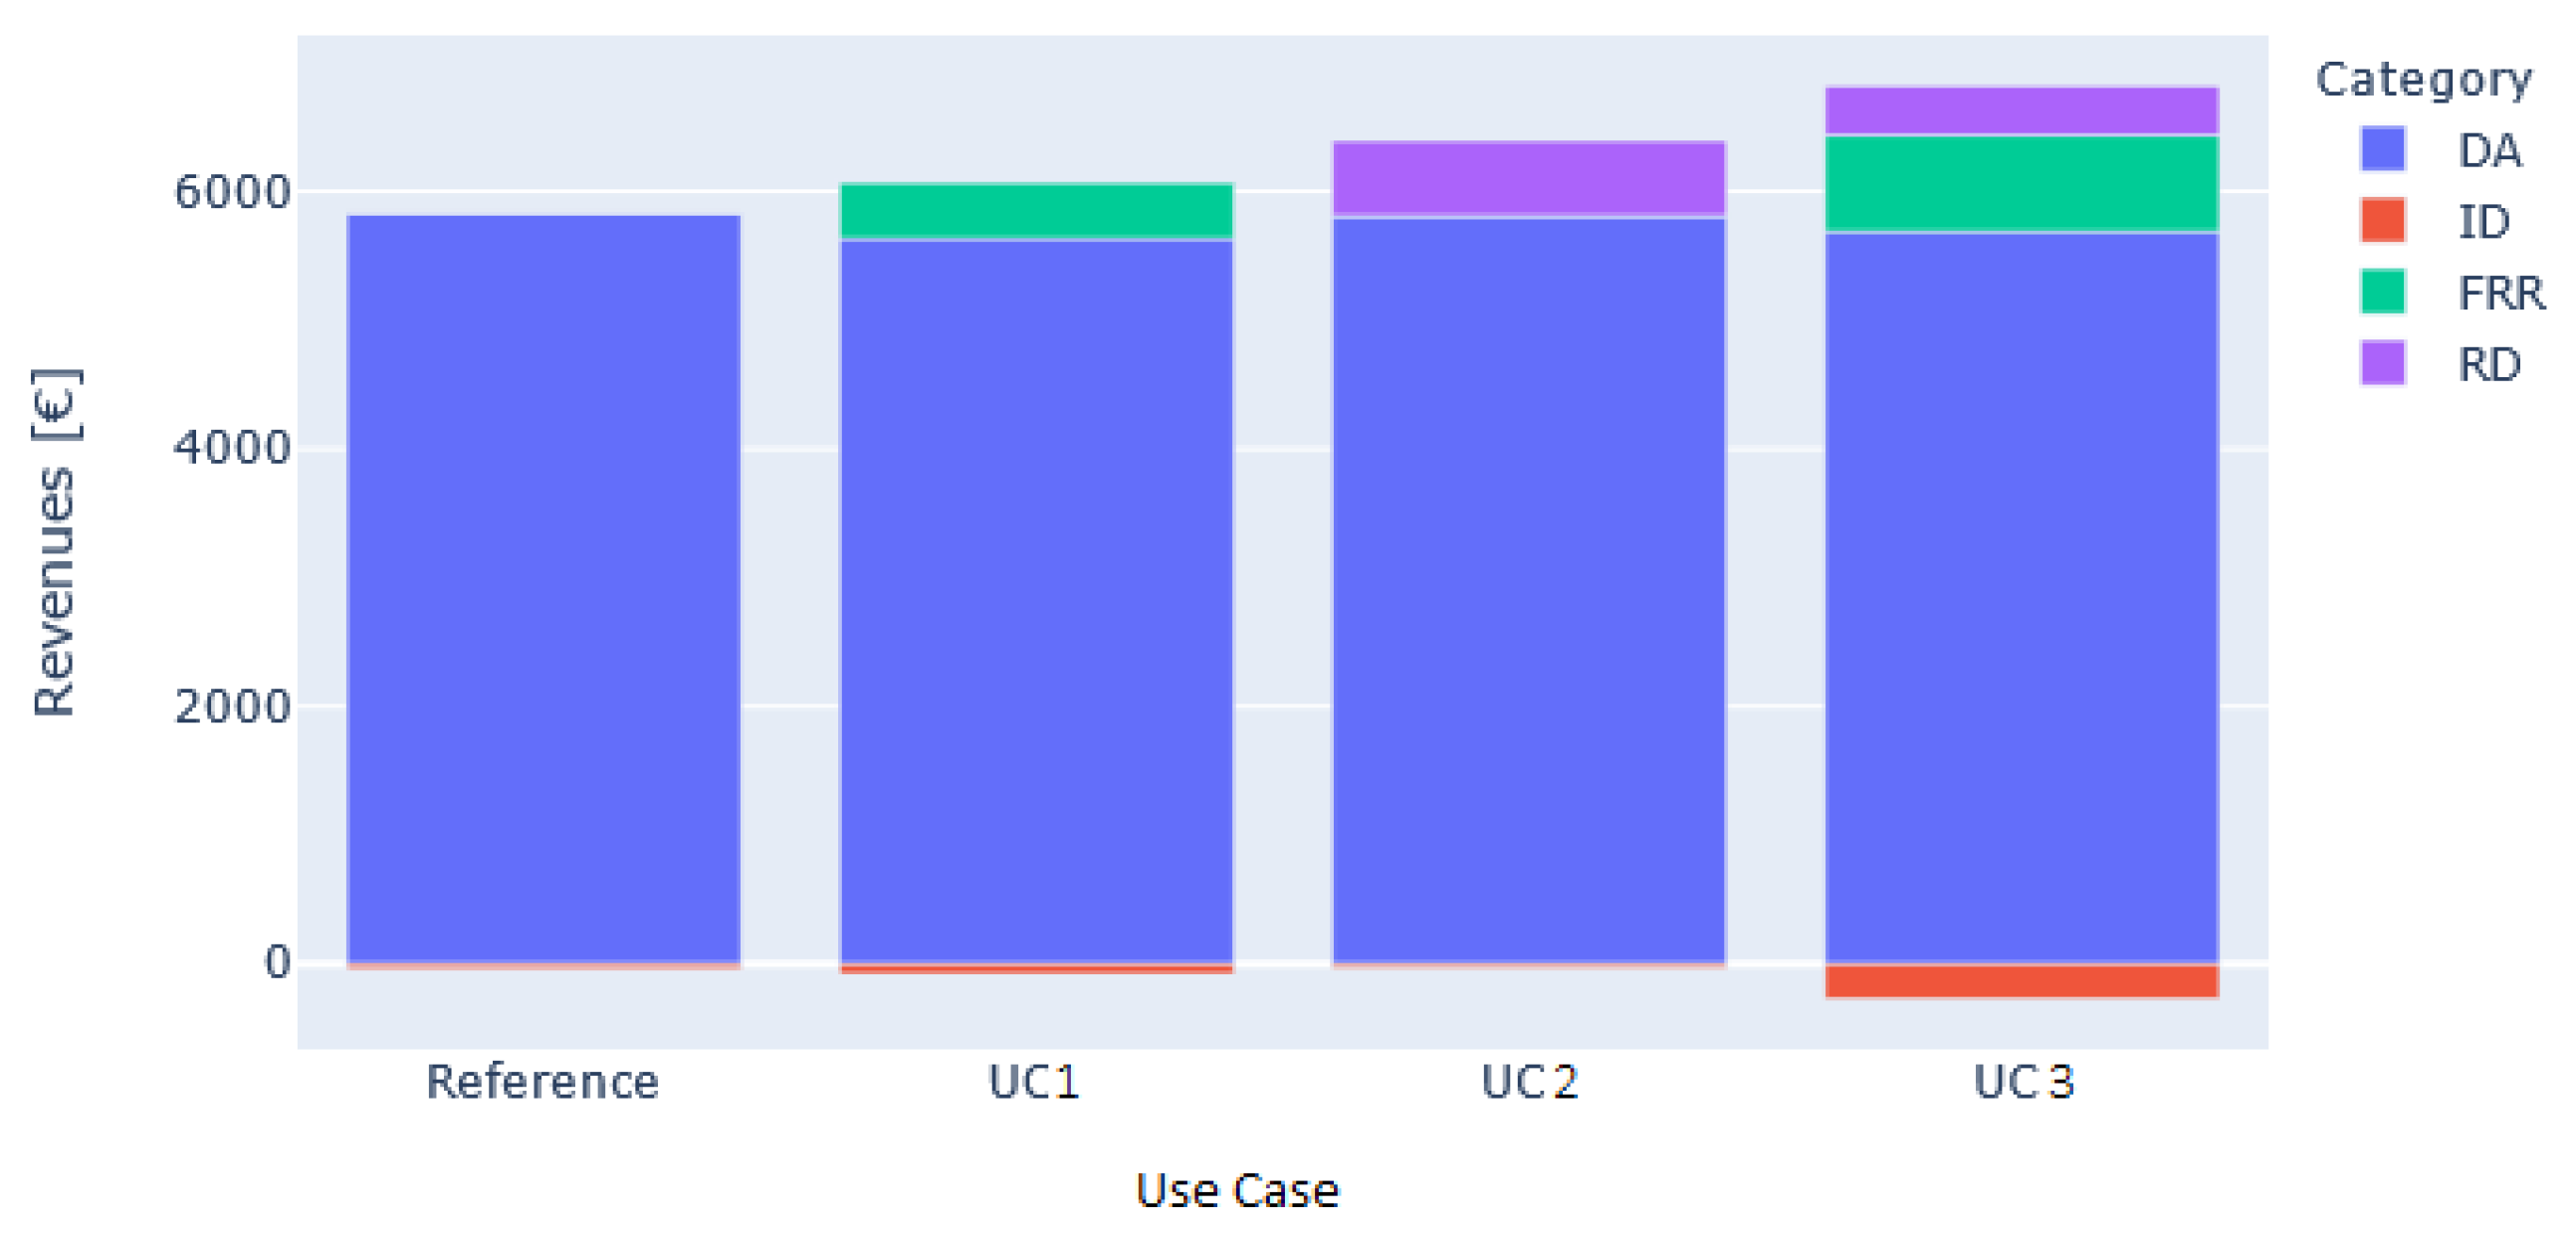
The optimization runs have been carried out for the time period from the 10 June 2019 to 14 December 2019. For this time period, a full set of measuring data from a photovoltaic power plant located at Bisamberg, Austria was available and the balancing prices and market design in this time period remained more or less stable. Nevertheless, this period of half a year also captures seasonal variations in demand and PV availability quite well. In a first step, we calculated a reference scenario (reference) where only trading at spot markets (day-ahead and intraday) is allowed. In two use cases, balancing (UC1) or redispatch (UC2) bids were offered exclusively as an addition to the spot markets. The third use case represents a scenario where a combination of all markets is possible. For the calculations in this case, nodal prices (see
Table 2, scenario 9) have been used.
Figure 3 shows the results for the reference scenario and use cases 1–3 for Zone West. The results of Zone East and Zone Mid are showing a similar behavior; therefore, only the results of Zone West are provided.
As expected, a higher degree of freedom of possible market bids leads to higher revenues. The redispatch scenario (UC2) with nodal prices performs better than the balancing scenario (UC1). Since the prices are based on assumptions, the results shall not imply that provision of redispatch is always more profitable than provision of balancing. It can be stated that the call probabilities for redispatch are generally much higher than for balancing. Therefore, the prices do not have to be as high as for balancing, in order to pay off. Furthermore, the costs for intraday rebuy are lower in the redispatch scenario. This is due to the assumption that balancing capacity can already be traded the day before, whereas for redispatch, an intraday market has been assumed. Since the production forecasts of PV become more precise closer to the delivery date, the bidding amounts of energy correlate better with the real generation.
To evaluate the profitability of different pricing schemes, simulations for nine different redispatch remuneration schemes have been carried out, according to
Table 2. Moreover, a sensitivity analysis has been performed, where the percentage of the D-1 PV forecast that is available for bidding at the day-ahead and balancing capacity markets has been varied.
Figure 4 shows the bidding amounts of energy for the redispatch and balancing markets, depending on the different pricing schemes. It can be pointed out that redispatch and balancing amounts of energy in each direction are correspondingly inversely proportional to each other. The more redispatch energy is offered, the less balancing energy is bid in the same direction. This statement is valid both in the positive and negative direction. This behavior can be explained with the varying day-ahead spot prices. If the prices are low or even negative, the VPP tends to pre-curtail. If spot prices are high, the VPP generates and offers the free capacities at downward markets. The curtailed or injected amounts of energy will be offered either for balancing or redispatch.
The zones differ significantly in their redispatch call probabilities. Zone East is the only zone where, in total, more downward than upward redispatch is required over the year. This is the reason that even with high prices up to 400% of the mean day-ahead price, almost no upward redispatch is offered. As mentioned before, this leads to the situation that, in this region, more upward balancing energy is offered by the VPP, because balancing energy is location-independent. This can be problematic, because the upward direction in this area is the one that is statistically causing grid congestions. Therefore, upward balancing calls could potentially worsen the congestion situation by acting in the opposite direction of redispatch measures.
Since balancing prices are assumed to be the same in all zones, the location of the intersection between the two curves of balancing and redispatch indicates how profitable bidding for redispatch is in this region. The more to the left of the x-axis the intersection between the two lines is located, the more profitable redispatch will be compared to balancing. Downward redispatch is most profitable in Zone Mid, upward redispatch in Zone West. The requirement for the VPP to provide upward redispatch is that the expected revenues have to be higher than the revenues from the spot market, as well as the revenues from the balancing markets. This means that the redispatch price multiplied by the call probability has to be higher than the spot price at this timestep. This is only possible when call probabilities are high, or the prices are defined to be very high, or both. Nevertheless, it has to be considered that if there are not many upward redispatch activations in a region, other plants might be more economically and environmentally suitable for this purpose than a PV plant, which has to be curtailed, because the potentially produced energy within this time period would be lost. Another solution for this problem could be the installation of energy storage.
As shown in
Figure 5, most of the revenues arise from the day-ahead market, despite the availability of the other three commercialization options at balancing, redispatch and intraday markets.
Increasing the remuneration for upward redispatch, the share of revenues from upward redispatch is increasing for Zone Mid and Zone West. This behavior is expected, since there can be gained more revenues for the same bidding amounts of energy and there is an increasing number of bids in total, due to the higher rentability of this product. Only for Zone East, where, on average, no upward redispatch is required, the revenues stay almost the same for all positive (upward) remuneration schemes. Again, it can be noticed that the more amounts of energy are pre-curtailed, the less energy has to be rebought at the intraday market.
The nodal pricing strategy is too low to offer upward redispatch in any zone. In comparison, upward balancing products are more profitable. For downward redispatch, it can be said that also low prices (25% of the day-ahead spot price) are sufficient for the VPP to offer downward redispatch. This is due to the high call probabilities.
Moreover, the nodal pricing seems to be a viable solution for downward redispatch. Despite a lower average price (see
Figure 4), the amounts of energy offered for downward redispatch in scenario 4 and scenario 9 are almost the same. Therefore, this would be a good compromise for a cost-minimizing TSO.
The sensitivity analysis investigates whether different bidding strategies in terms of the offered percentage of the forecasted generation day-ahead are leading to different total revenues. The idea is that bidding less of the forecasted amount in the day-ahead timeframe could lead to more revenues. The chance of overestimating the generation is decreasing. Therefore, less amounts of energy have to be rebought at the intraday market in case of forecast deviations.
The pink line in
Figure 6 shows the total cumulative revenues in Euro for the period between July and December 2019. The cost gradient between the scenarios is slightly decreasing, from a gradient of 314 between 70% and 80% to a gradient of 260 between 90% and 100%. For the scenarios with 90% and 100%, more intraday costs are incurred than revenues. The reason for this is that there are more timesteps where the generation forecast lies above the real generation, than timesteps where the generation forecast lies below it. The difference between the amounts of energy sold day-ahead and real generation has to be rebought. Otherwise, the sold energy amounts cannot be delivered. Nonetheless, more revenues can be gained at the day-ahead market in comparison to the intraday market. Therefore, selling as much as possible within the day-ahead timeframe still leads to the highest revenues.
5. Conclusions and Outlook
In this work, a bidding strategy for VPPs of PV units located in different areas of Austria has been formulated and analyzed. This enables us to offer the most profitable combination of market bids at the day-ahead, balancing, (future) redispatch and intraday markets. Since no redispatch market exists in Austria at the time of writing this paper, assumptions for a potential redispatch market and different remuneration schemes have been proposed and contrasted in the context of multiple commercialization opportunities. For the matter of redispatch simulations, this paper uses the Austrian example, since the redispatch service is location-specific. Hence, the actual call probabilities will depend on the underlying grid and the provider’s position in it. Nevertheless, all other markets are considered on the European level; therefore, especially the methodology as well as the general results also apply to other EU countries.
Downward redispatch is offered in all scenarios, regardless of the remuneration scheme. This is due to the high call probabilities in all zones with the remuneration level for downward redispatch between 25% and 50% of the day-ahead price. In order to incentivize upward redispatch, high call probabilities (which are only given in Zone West and Zone Mid of Austria) and much higher prices than for downward redispatch have to be available, since the revenues from the day-ahead market will be missed in case of pre-curtailment. Pre-curtailment is only recommendable for zones with high upward redispatch demand; otherwise, pre-curtailment will not be economically viable for an RES-based VPP. Moreover, it should be considered for environmental reasons to curtail other, fossil-fuel-based power generation plants first.
Results show a large difference in offered redispatch energy amounts between the different zones within Austria. This is due to the differing redispatch demands between the zones, required for each direction. Zone East, for instance, requires almost no upward redispatch and, in total, more downward redispatch over the evaluated time period. Zone Mid and Zone West require more upward than downward redispatch, with Zone West having the highest required upward redispatch energy amounts. Therefore, different zones will lead to different price levels, in order for the PV to offer redispatch in each direction. On the one hand, the different call probabilities influence the redispatch bidding amounts of energy significantly. On the other hand, the pricing strategy influences the bidding behavior of the VPP, and, at the same time, the overall economic costs for the TSO. The pricing scheme chosen by the TSO could be used to additionally influence the bidding behavior of the plants and therefore the total available redispatch energy amounts within each region. In case of the proposed nodal pricing, the prices would be higher when more downward redispatch is required, because more expensive plants have to be activated.
The sensitivity analysis performed in this paper shows that bidding the entire forecasted generation in the day-ahead market leads to the highest revenues, even when the forecast is not met properly and certain amounts of energy have to be rebought at the intraday market. This is due to the fact that potential revenues on the intraday market would be lower than what can be earned on the day-ahead spot market—even when considering costs for necessary repurchases.
When considering redispatch bids, the amounts of offered balancing energy closely correlate to the node where the plant is located. If redispatch is unprofitable due to low call probabilities or low remuneration prices, more balancing energy is offered in the same direction. The balancing activation will then counteract the redispatch demand in the opposite direction. It can be concluded that offering redispatch can be beneficial—from a purely financial point of view—for a VPP even in a market design where multiple competing opportunities are present. This can be related to the fact that, due to the dependency of redispatch on the exact geographical location, opportunities can arise that are not present in location-independent markets (such as balancing markets).
To further investigate the economic value in pre-curtailing a PV, additional work is planned to be carried out, with the inclusion of battery storage in the modeled VPPs. The business cases could be more profitable if storage options were available as well, because the curtailed energy would not be lost and could be used and monetized at a later point in time. In this way, revenues from two is not remunerated at all would be solved. Moreover, the optimal sizing of a battery coupled with a RES-VPP for participation in different markets could be another interesting topic of investigation.
The model could be used for the bidding optimization of other RES technologies as well, but the outcomes could be different. For instance, wind forecasts are less accurate than PV forecasts, which means that the relative share of forecast generation bid in the markets of interest is expected to be lower. Nonetheless, in a combined wind and solar VPP, the different usual times of production could complement each other well.
Another idea is to connect two or more different PV plants in several zones and place a symmetrical redispatch bid (in one zone upward, in the other zone downward) that can be used for solving congestion between these zones. This could potentially reduce effort for the TSO in finding matching redispatch bids.


 ,
, 


