1. Introduction
Generally, bricks are the cornerstone of building construction and many industrial structures, such as industrial furnaces and boiler fire rooms, with additional uses in many other industrial applications. Bricks are healthy, fire-resistant, anti-allergic, chemically resistant, wind- and weather-resistant, and energy-efficient [
1]. Although local clay is the main ingredient in bricks [
2], bricks are also produced from other materials [
3,
4,
5]. The selection of the materials depends on the availability in the local market and the type and purpose of the bricks. However, the brick material also affects the surface roughness of the bricks [
6].
The main stages of brick manufacturing are brick shaping (molding) [
7], drying, and firing [
8,
9,
10]. Several technologies and techniques, which range from manual to modern, are involved in all stages of brick production. For example, bricks are shaped using manual, die, mechanical, or other molding methods. In some molding techniques, the clay column is shaped, glazed, and coated before being cut into individual bricks. In die shaping, the dye is covered by sand or water to prevent the clay from sticking. Moreover, different methods of brick machining, rolling, brushing, scratching, or cutting by saw, laser, or abrasive water jet are used [
11], where each technique has its own outcome in terms of the brick surface roughness. Therefore, the brick surface finish depends on the brick material and the brick molding, machining, cutting, coating, texture, and glazing processes. Hence, the order of surface roughness can vary from micrometers to millimeters.
Tunnel kilns are the most widely used furnaces for brick production worldwide [
12]. The firing temperatures for bricks range from 800 to 1800 °C. For instance, the firing temperature range for common bricks is about 900–1050 °C, for fireclay bricks is 1250–1500 °C, for basic bricks is 1400–1800 °C, and for high-alumina bricks is 1500–1800 °C [
13]. For such firing temperatures, brick manufacturing is considered one of the energy-intensive industries. The specific consumption represents the energy used to produce 1 kg of fired bricks. The actual brick-specific energy consumption ranges from 2.31 to 3.51 MJ/kg [
12], according to the fuel type and kiln efficiency. Brick-specific energy consumption rates of between 2.04 and 3.51 MJ/kg in [
14] and of 3.47 MJ/kg in [
15] are reported in the literature. The specific energy consumption rates for brick manufacturing may be higher for ineffective kilns.
Since the theoretical specific energy consumption rate is less than half the actual rate, efforts have been directed to reducing the specific energy consumption of bricks, including by reducing the intensity of the brick arrangement in the kiln car (brick setting density). Among these efforts are the steady-state and transient simulations of tunnel kiln firing [
15,
16,
17] or fast firing [
18], improvements of the kiln performance [
19,
20,
21,
22,
23,
24] through the use of modern equipment [
25,
26], fuel consumption improvements [
14,
27], the optimization of recovered air [
28], flow uniformity improvements [
29,
30], and flow mixing improvements via air side injection [
31]. As the heat transfer in tunnel kilns contains about 80% convection and 20% radiation, extensive efforts have been made to investigate the heat transfer in tunnel kilns [
32,
33,
34,
35,
36,
37,
38]. The improvements in the design data have allowed better simulation and modeling of different aspects in tunnel kilns [
39,
40,
41,
42], including in kiln control [
43,
44,
45]. Additionally, various environmental challenges have been assessed to restrict the generated pollutants from this intense energy-consuming sector due to the huge number of bricks produced annually [
13,
46,
47,
48,
49,
50].
In addition to the varying levels of brick roughness due to the materials and molding techniques used, various brick settings on the kiln car can be arranged by allowing different spacings between the rows or columns of bricks. It is noted that the density of the brick arrangement (setting density) on the kiln cars varied greatly from one company to another, as some companies believe that increasing the setting density increases the kiln productivity and lowers the specific energy consumption at the same time. Several papers [
17,
18,
31,
33,
36,
37,
38] have tested the different lattice brick settings and concluded that the arrangement of the bricks inside the tunnel kiln affects the heat transfer, pumping power, and brick production. However, those papers did not explicitly investigate the effect of the setting density. A comprehensive project started in 2016 by the same research team as for this paper aimed to enhance the tunnel kiln performance by developing reliable design data for tunnel kilns [
29,
33,
34,
51,
52]. Accurate three-dimensional CFD models were developed, using the k-ω turbulence model to study the different aspects of the tunnel kilns, including the flow uniformity [
29], convection heat transfer [
33,
34], setting density [
51], and surface roughness [
52] of the bricks and kiln boundaries.
Regarding the effects of the brick setting density, this research team investigated the effects of two lattice settings of different densities (high-density setting, HDS; low-density setting, LDS) [
51]. The HDS was composed of 768 bricks, whereas the LDS contained 512 bricks, i.e., the HDS had 50% more bricks than the LDS. The authors [
51] reported higher convective heat transfer coefficients and a lower pressure drop in the LDS than the HDS. Additionally, the LDS provided more consistent and more multifaceted convection heat transfer coefficients than the HDS. The authors [
51] concluded that as the convective heat transfer coefficients improved in the LDS, the required firing time was lowered, meaning the bricks productivity rates for both the LDS and HDS were about the same. Therefore, the LDS required a lower firing time and pumping power than the HDS. Additionally, the LDS produced better quality bricks due to the more homogenous flow and face convection heat transfer coefficients. However, the work in [
51] was limited to smooth brick and kiln wall surfaces.
Concerning the effects of the surface roughness of the kiln boundaries and bricks on the performance of the tunnel kilns, Almesri et al. [
52] investigated the effects of the surface roughness on the fluid flow, pressure drop, and heat transfer using the low-density setting for bricks in tunnel kilns. The authors found that the surface roughness enhances the heat transfer considerably. The convective heat transfer coefficients increased by up to 97% and the associated pressure drop in the tunnel kilns increased by up to 80.4% as the brick surface roughness increased from 0 to 4 mm. As a result, the ratio of the heat transfer to the pumping power and energy consumption was enhanced due to the surface roughness. However, the effect of the surface roughness in [
52] was limited to the low-density setting only.
The above literature survey revealed that in tunnel kilns, the brick setting density [
51] and brick roughness [
52] affect the fluid flow and heat transfer characteristics, and consequently the brick drying and firing processes. Alrahmani et al. [
51] showed the benefits of the LDS over the HDS for smooth bricks and kiln walls. On the other hand, Almesri et al. [
52] reported enhancements in the features of tunnel kilns loaded using the LDS due to the brick roughness. However, the combined effect of the brick setting density and surface roughness of the bricks or kiln walls on the brick firing needs to be identified. In other words, the reported advantage of the LDS over the HDS for smooth bricks needs to be investigated for rough bricks and kiln walls. Therefore, the quantitative effect of the brick or kiln wall roughness when using the HDS on the kiln characteristics is obtained and compared with the LDS. Additionally, the ratio of the heat transfer rate to pumping power for both brick settings is compared to identify the best surface roughness that achieves the maximum ratio. These issues are the aims of the present work, which should help understand the relationship between surface roughness and brick setting density.
Therefore, CFD models are developed in which surface roughness levels of 0, 1, 2, 3, and 4mm are examined for kiln boundaries and bricks using the HDS and LDS. The obtained results from the validated models are used to explore the combined effect of the brick roughness and setting density on the kiln characteristics and to determine the impacts on the total heat transfer rate-to-pumping power ratio for both brick settings. The developed results of the present work provide reliable pumping power and heat transfer data for the design and operation of tunnel kilns.
2. Numerical Modeling and Simulation
The numerical modeling of the fluid flow and convection heat transfer between the flowing air and two different lattice brick settings, namely high- and low-density settings, is discussed in this section. The model was developed using the CFD code FLUENT version 18.2. This CFD program uses the finite volume method to solve the governing equations (i.e., mass, momentum, and energy conservation equations) numerically. The second-order upwind scheme was used for the pressure, momentum, energy, turbulent kinetic energy, and specific dissipation rates. The pressure and velocity fields were coupled using the “coupled” algorithm. The prescribed convergence criterion for the energy equation was and for the continuity and momentum equations was set to .
The governing equations that are solved in the computational cells involve the conservation of mass, conservation of momentum, and conservation of energy, which are represented by Equations (1)–(3), respectively:
where
is the air density,
is the time,
represents the velocity vector components (
u,
v, and
w), and
is the Cartesian coordinate axis (
x,
y, and
z).
where
p represents the pressure,
is the dynamic viscosity, and
is the body force in the
x,
y, and
z directions.
where
T is the temperature,
k is the thermal conductivity of the brick,
is the specific heat, and
is the source term.
The governing equations mentioned above were time-averaged to produce Reynolds-averaged Navier–Stokes (RANS) equations. The additional terms (turbulent stresses) that were derived from the averaging process were solved using a turbulence model. Three different turbulence models were tested to predict the airflow across the intricate settings and the surface temperature of the bricks.
2.1. Computational Domain and Boundary Conditions
The present study simulates the wind tunnel experiments for the lattice brick settings that were performed by Abou-Ziyan [
33] using CFD models. Abou-Ziyan [
33] used a 1:4 laboratory-scale experiment to test six different brick settings. The author adopted a steady-state technique to obtain the convective heat transfer coefficients (CHTCs) for longitudinal and transverse bricks. In this technique, the bricks were made of actual brick material and arranged in a lattice setting. Inside the setting, some bricks were replaced by copper heaters to dissipate heat to the flowing air. Thus, the CHTCs between the flowing air and the intricate settings of bricks could be obtained. The same steady-state technique has been used by many investigators, including Refaey et al. [
37]. The steady-state approach adopted in [
33,
37] was used to obtain reliable convection heat transfer data. This technique is limited to obtaining the heat transfer characteristics that can be used later to model the tunnel kiln in transient conditions.
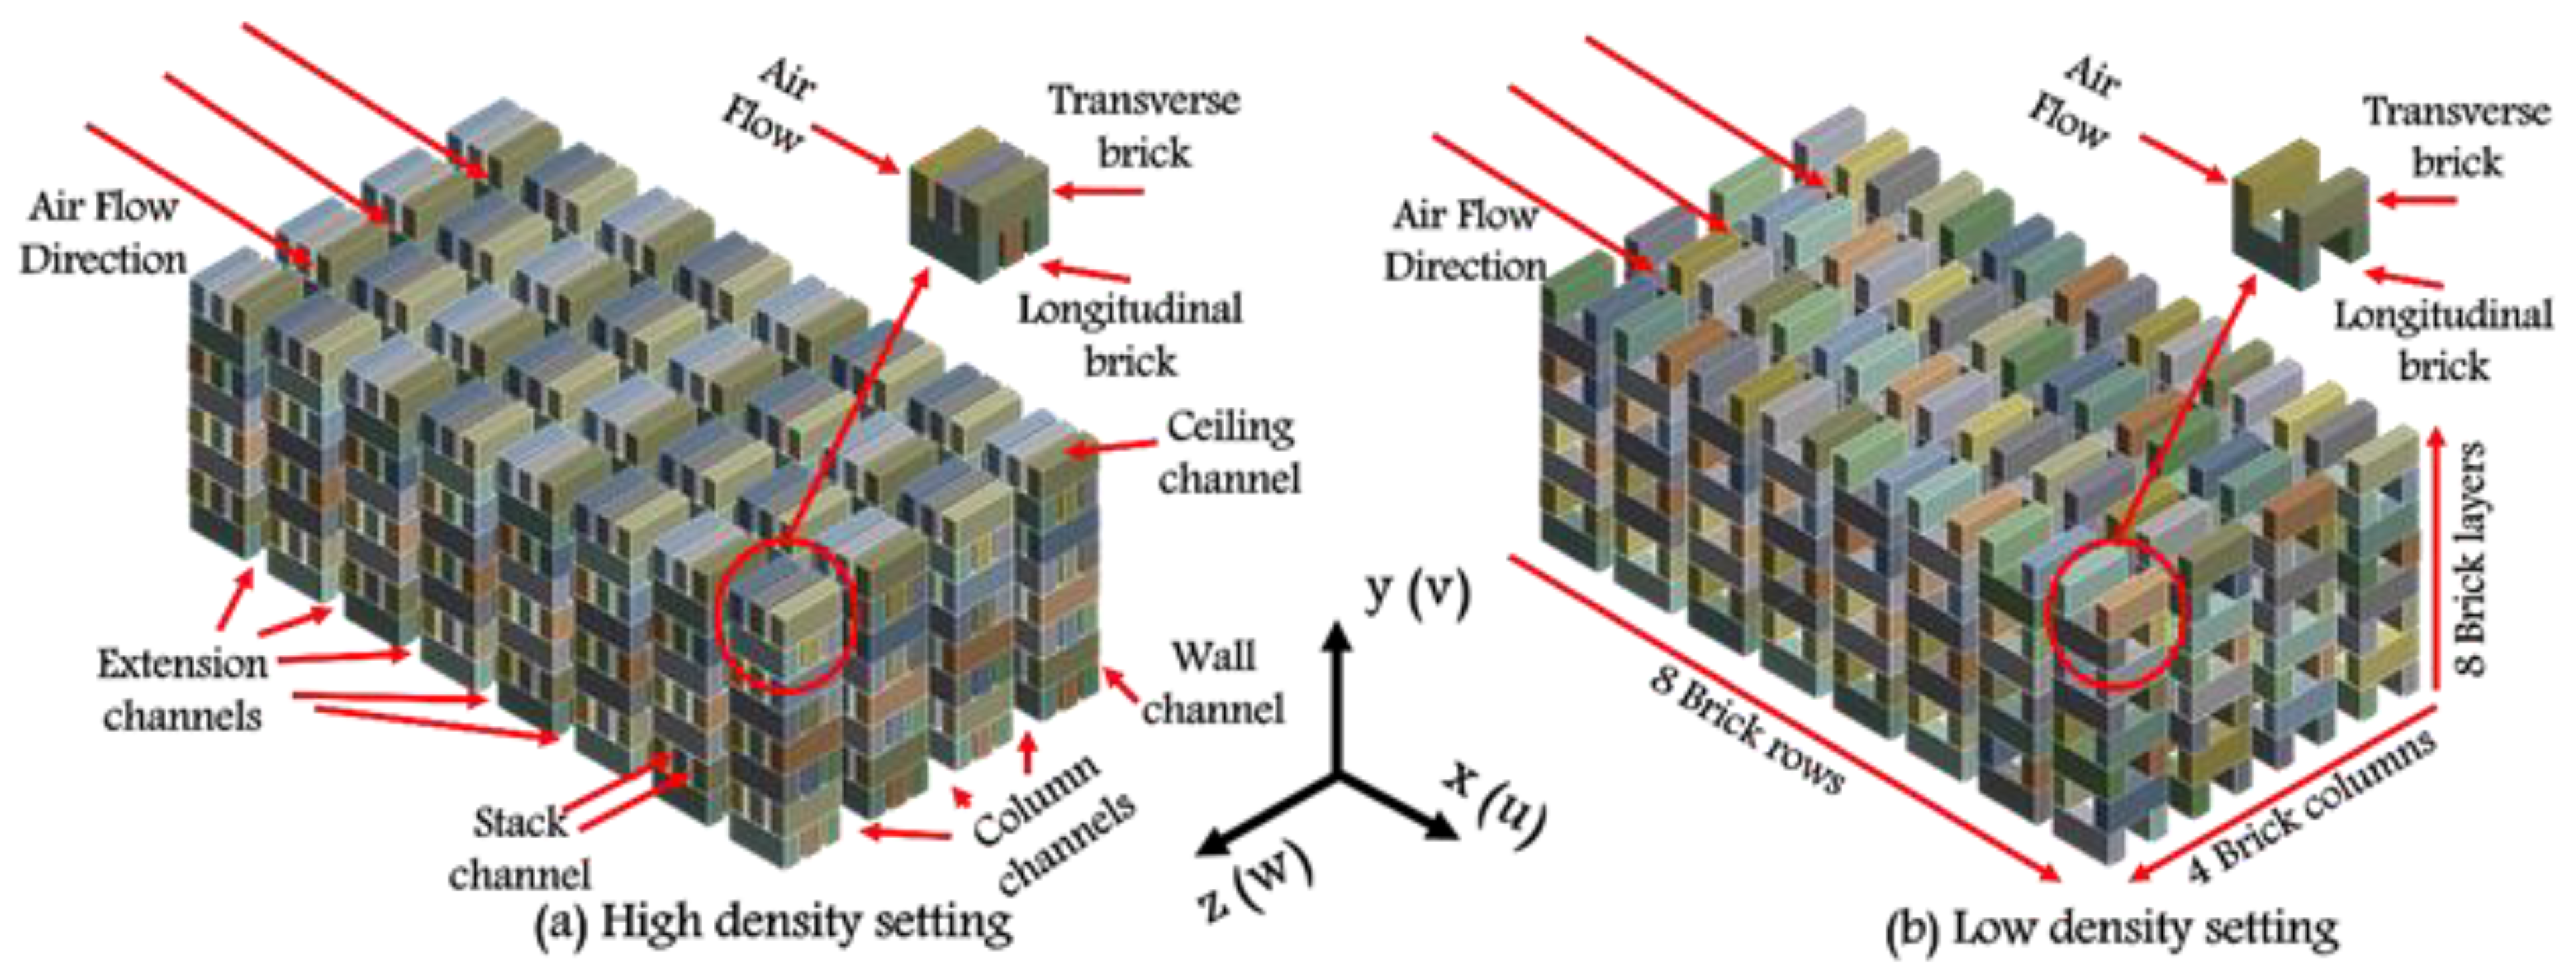
The two lattice brick settings tested in this study were the high- and low-density settings. The high-density setting (HDS) consisted of 768 bricks, while the low-density setting (LDS) comprised 512 bricks (see
Figure 1). The bricks were made of fire clay and had a block shape with dimensions of 58 × 28 × 16 mm. The bricks were arranged longitudinally and transversely to the direction of the flow. The wind tunnel used in the CFD simulations was 3.75 m long, 0.35 m wide, and 0.236 m in height, as was the optimized case achieved by Abou-Ziyan [
34]. Both brick settings were located at 1.75 m from the entrance to eliminate the entrance effect. The arrangement of the settings in the kiln produced five types of flow channels, namely three column channels (spacing between columns), two wall channels (spacing between the tunnel wall and the brick column), one ceiling channel (spacing between the kiln’s ceiling and the top brick in the setting), seven extension channels (spacing between rows), and many stack channels (channels between bricks within the setting). For both settings, the dimensions of the ceiling and the extension channels were 12 and 21 mm, respectively, whereas the wall, column, and stack channels were 30, 14, and 5 mm for the HDS and 29.2, 15.2, and 26 mm for LDS, respectively. These dimensions of the flow channels of the brick settings produced a uniform flow in the column, wall, and ceiling channels, as reported for the HDS [
29].
An accurate CFD simulation requires the proper use of the boundary conditions. The average approach was used to determine the convective heat transfer coefficient, where all longitudinal bricks located in all layers of the first and second columns and all transverse bricks located in all layers of the third and fourth columns were used as instrumented bricks, as shown in
Figure 2 for both settings. A heat rate of 14W was supplied to both the longitudinal and transverse bricks. An air velocity of 5 m/s and an air temperature of 303 K were utilized as the boundary conditions of the inlet airflow. The surface roughness of the clay bricks varied from 0 to 4 mm, and the tunnel walls were assumed as adiabatic surfaces. A no-slip condition at the boundaries of the wind tunnel and the brick surfaces was applied. A pressure of zero Pa at the outlet of the wind tunnel was applied.
2.2. Validation of the CFD Model
The entire domain of the wind tunnel, for the case of the HDS, was meshed using four different unstructured grids to validate the CFD model and identify the least computationally expensive numerical grid that produces results independent of the grid size. The number of grids varied from 1.44 to 6.64 mega cells. The CFD model was validated in previous studies [
29,
33,
34,
51,
52].
The pressure drop across the entire brick arrangement (between X = 1.7 m and X = 3.0 m) and the surface temperature of the longitudinal and transverse instrumented bricks were used to validate the accuracy of the predicted values for the tested numerical grids against the experimental ones obtained in Abou-Ziyan’s study [
33], as listed in
Table 1. The brick settings used to validate the numerical results were composed of six rows, as in the experimental work in [
33]. Then, the brick settings of the eight rows were used in the numerical simulation to extend the effect of the row numbers on the fluid flow development and the heat transfer establishment. It is worth mentioning that the computed and measured values of the pressure drop and the bricks’ surface temperatures were collected at an inlet air velocity of 6.9 m/s and an inlet air temperature of 303 K.
From
Table 1, grids 3 and 4 predicted the pressure drop and the bricks’ surface temperatures quite accurately compared to the other grids. The differences in the brick temperatures between grid 3 and grid 4 were 0.3 K and 0.1 K for the longitudinal and transverse bricks, respectively. Additionally, the difference in the computed pressure drop between those grids was 4.5 Pa. Although grid 4 showed slightly better results than grid 3, it involved a longer computation time. Hence, grid 3 was chosen and used to examine the performances of the three turbulence models (standard k-ε, RNG k-ε, and k-ω) in predicting the characteristics of the fluid flow over the brick settings and the heat transfer between the bricks’ surfaces and the flowing air for the HDS.
Table 2 shows that the k-ω turbulence model produces better predictions of pressure drop and brick surface temperatures than the other two models. The computed results were in good agreement with the measured values. Hence, the k-ω model was used to predict the air flow pattern across the brick setting and the brick surface temperatures under different conditions.
Figure 3 shows the grid image for the unstructured grid with refined cells near the setting bricks and the tunnel walls. The grid was employed to discretize and solve the computational domain. The near-wall function was used to treat the grids close to the boundaries of the bricks and kiln walls. Since grid 3 with the k-ω turbulence model was used for the high-density setting (HDS) and produced accurate results, as mentioned above, it was also implemented for the low-density setting (LDS).
Table 3 shows the predicted values of the pressure drop and brick surface temperatures against the measured values using grid 3 and the k-ω model for the LDS. The comparison was made at an inlet air velocity of 6.9 m/s and an inlet air temperature of 303 K. It is noted that the computed values of the pressure drop and the surface temperatures of the bricks were in good agreement with the measured values. The difference between the computed and the measured value of
was 1.47%, and the highest difference between the computed and measured bricks’ surface temperature was only 0.65%. Hence, grid 3 with the k-ω model was adopted to run further simulations for the LDS under various test conditions.
2.3. Simulation of Surface Roughness
The CFD model utilizes the modified law-of-the-wall to incorporate the surface roughness, which has the following form [
53]:
where
and
are functions that depend on the type and size of the roughness. There is no universal roughness function that is valid for all types of roughness. Nevertheless, for the sand grain roughness and similar uniform roughness elements,
is well-correlated with the non-dimensional roughness height,
, where
is the physical roughness height. The roughness function is not a single function of
, but it takes different forms depending on the
value. According to the values of
, three different roughness regimes are output as follows [
53]:
Hydrodynamically smooth (): ;
Transitional (): ;
Fully rough (); .
The two surface roughness parameters must be specified in the CFD model, namely the roughness height,
, and the roughness constant,
. As mentioned before, the roughness height varied from 0 to 4 mm while the roughness constant was kept unchanged with a value of 0.5 due to the assumption of uniform roughness [
53]. The roughness height of 0 mm was used in the hydrodynamically smooth regime, whereas the roughness values of 1, 2, 3, and 4 mm were used in the fully rough regime.
4. Results and Discussion
The results are presented for the effects of the roughness on the two different brick settings in this section. First, the effect of the kiln boundary roughness is discussed, followed by the effect of the brick roughness. Finally, the effect of the kiln and brick roughness on the ratio of the total heat transfer rate to pumping power is discussed.
4.1. Effect of Kiln Wall Roughness
In this section, the surface roughness of the kiln boundaries (walls) is changed from 0 to 1, 2, 3, and 4 mm to study its effect on the fluid flow characteristics and the convective heat transfer coefficient. The tunnel kiln is loaded using either the high-density setting (HDS) or low-density setting (LDS) for the bricks.
4.1.1. Fluid Flow Characteristics
The contours of the velocity in the wall, column, extension (space between rows), and stack (space between bricks in the same row and column) channels for the LDS and HDS using smooth bricks and walls (middle frame), a rough kiln wall (right), and rough bricks (left) are shown in
Figure 4. Comparing the middle and right frames for the same setting reveals the effect of the wall roughness, while comparing the contours under the same roughness condition (vertically) reveals the impact of the setting density. For both the HDS and LDS, the resistance to flow increases in rough kiln walls. Thus, the velocity in the wall channels decreases and that in the column channels increases, particularly after the fourth row. Additionally, the air velocity in the stack channels increases in the rough walls for the LDS. The velocity level in the wall and column channels for the HDS is higher than for the LDS because the velocity in the stack channels for the LDS is higher than for the HDS under the same air flow rate.
The effect of the kiln boundary surface roughness on the air velocity in the different kiln channels for the LDS and HDS is shown in
Figure 5. The dashed lines represent the low-density setting, while the solid lines represent the high-density setting.
Figure 5 shows the effects of changing the kiln boundary surface roughness on the air velocity in the different channels in the tunnel kiln, namely on the wall channels, the column channels, and the ceiling channel. Since there are two wall channels and three column channels, their average value was used in all calculations. The air velocity was calculated for each channel in a layer between rows 5 and 6, because the flow is considered to be established (fully developed) in this region of the setting [
29]. Generally,
Figure 5 shows that the HDS has higher velocities than the LDS because of the narrower channels among the bricks (stack channels) in the HDS. It can also be seen that increasing the roughness increases the column channel velocities and decreases the wall and ceiling channel velocities for both brick settings. This is mainly because the channels formed with kiln walls experience higher resistance than the column channels. Thus, more air tends to flow in the column channels.
To understand the effects of increasing the roughness on the velocities,
Table 4 shows the percentage reductions in air velocities in the different channels in the kiln for the roughness levels of 1, 2, 3, and 4 mm compared with the roughness of 0 mm for the two examined settings, the HDS and LDS. The increase in the kiln boundary roughness from 0 to 4 mm reduces the average velocity in the wall channels and the ceiling channels of the HDS by 16.05% for both channels while decreasing the wall channel velocity by 11.85% and the ceiling channel by 15.11% in the LDS. However, the average velocity in the column channel increases with the increase in the kiln boundary roughness in both settings by 5.55% in the HDS and 4.72% in the LDS. The percentage change in the air velocity in the kiln channels for the HDS is always greater than for the LDS. This can be attributed to the extra space available between the bricks in the LDS (stack channels), whereas the HDS stack has less space between bricks, which encourages the flow to escape toward the column channels.
Changing the kiln wall roughness also affects the pressure drop across the brick setting.
Table 5 shows the pressure drops across the entire setting for different kiln boundary roughness values. Two layers were set at 1.7 m and 3.0 m from the inlet of the tunnel kiln, where the pressure was measured to obtain the pressure drop across the setting. Then, the effect of the surface roughness was measured by calculating the percentage increase in the pressure drop from the case with 0 mm roughness. The pressure drops increased as a result of increasing the kiln boundary roughness for both settings, and approximately by the same percentage, as can be seen in
Table 5. Additionally, the ratio of the pressure drop for the HDS to that of the LDS was calculated for each roughness level, showing almost a constant value for all kiln wall roughness levels (1.49). In other words, the pressure drop for the LDS was about 0.67 times that for the HDS for smooth and rough kiln walls. This may have been due to the constant brick roughness having a stronger effect on the pressure drop than the kiln wall roughness.
4.1.2. Convective Heat Transfer
The contours of the brick temperature and the air temperature in the wall, column, extension, and stack channels for the HDS and LDS using smooth brick and kiln walls (middle frame), rough kiln walls (right), and rough bricks (left) are shown in
Figure 6. The longitudinal bricks (layer 5) in the HDS and LDS are shown in
Figure 6a,c, whereas the transverse bricks (layer 4) for the two settings are shown in
Figure 6b,d, respectively. The middle brick for the HDS has the highest temperature of both the longitudinal and transverse bricks because the middle brick is in the small stack channels measuring 5 mm, and a low amount of air flows in such tiny channels. Additionally, the third transverse brick in the HDS has a higher temperature than the first brick because of the airflow direction. For the LDS, both bricks in either the longitudinal or transverse direction have almost the same temperature because the stack channels have a large width (26 mm) similar to the column channels and close to the extension channels (21 mm).
The temperature contours in
Figure 6 indicate a small effect of the wall roughness, as the brick temperature is similar in the middle and right frames of the longitudinal or transverse bricks for either the HDS or LDS. Both the smooth and rough kiln wall cases have the same temperature scale for the LDS. Additionally, the small effect of the wall roughness is confirmed in
Figure 7, as the air temperatures in both the smooth and rough kiln walls are similar.
The convective heat transfer coefficient (CHTC) is presented in
Figure 8 for the highest and lowest studied kiln roughness levels for both settings (HDS and LDS) against the row number. The CHTC always starts with a high CHTC value (at the first row) and reduces along the lattice setting. The LDS always has a greater CHTC than the HDS along the setting for both smooth and rough kiln walls. It can be observed that changing the kiln boundary roughness has a small impact on the CHTC for both settings. The kiln roughness enhances the CHTC by less than 1% in the first row for both settings, which is because the effect of the flow turbulence in the entrance of the brick setting overcomes the effect of the kiln boundary roughness. The maximum influence of the kiln boundary roughness can be seen at the exit point of the setting, whereby increasing the roughness from 0 to 4 mm increases the CHTC for the HDS by 4.97% and by 3.37% for the LDS. The small effect of the kiln roughness on the CHTC for both settings is expected because the change in roughness does not occur on the brick. This agrees with the observation reported by Almesri et al. [
52].
The ratio (α) of the CHTC of the LDS to the CHTC of the HDS is presented in
Figure 9 for each kiln boundary roughness along the kiln from rows 1 to 8. In general, the α increases as the row number increases because the boundary layer develops, and the turbulence effect decreases. It reaches a fixed ratio at rows 6 and 7 for each kiln boundary roughness. This is expected because the CHTC reaches a steady value at row 6, as can be seen in
Figure 8, which is consistent for all roughness values. The ratio (α) at row 8 increases due to the exit effect from the brick setting. The average ratio (α) increases from ~13.5% in row 1 to ~22.5% in row 7. From rows 2 to 8, the kiln roughness of 3 mm shows the lowest α among the different roughness levels, while the kiln roughness of 0 mm has the highest α in all rows, except for row 2, where the roughness of 1 mm has a slightly higher ratio (α). There is an irregular pattern that can be seen starting from row 3 to row 8, whereby the roughness of 0 mm always has the highest ratio (α), followed by roughness levels of 4, 2, 1, and 3 mm.
4.2. Effect of Brick Roughness
In this section, the surface roughness of the bricks will be changed to study its effect on the fluid flow characteristics and the convective heat transfer coefficient between the brick settings and the flowing air. The same two brick settings, the HDS and LDS, are considered and compared.
4.2.1. Fluid Flow Characteristics
As discussed earlier, the contours of the velocity rates in the wall, column, extension, and stack channels for the LDS and HDS using smooth (middle frame) and rough bricks (left frame) are shown in
Figure 4. For rough bricks in the HDS and LDS, the velocity rates in the wall and extension channels are higher than with the smooth bricks and kiln wall because of the increase in the resistance in the column and stack channels. Along the kiln (x-direction), a higher velocity starts after the third row in the rough brick cases, while it starts after the fourth row in the smooth brick cases. In the LDS, the effect of the wall roughness on the air velocity in the stack channels is higher than the effect of the brick roughness (compare right and left frames in
Figure 4b.
To study the effect of the brick roughness on the fluid flow, a layer was created between rows 5 and 6 to compute the velocity at that location. The average value of the air velocity was calculated for the wall channels, column channels, and the ceiling channel then plotted for both brick settings for different brick roughness levels, namely 0, 1, 2, 3, and 4 mm, while keeping the kiln surfaces roughness constant at 0 mm to identify the effect of the brick roughness.
The effect of the brick surface roughness on the measured air velocities is compared for the HDS and the LDS, as presented in
Figure 10. In general, the air velocities in the case of the HDS are always higher than the LDS in all channels. Increasing the brick surface roughness has almost no impact on the average column velocities for the HDS and LDS; however, it increases the ceiling channel velocity rates for both settings. For the HDS, the air velocities in the wall and column channels appear to remain constant at ∼12.4 m/s and 13.4 m/s, respectively, for all brick surface roughness values. Additionally, the air velocity in the ceiling channel increases from ∼12.6 to 13 m/s with the increase in brick surface roughness from 0 to 4 mm. On the other hand, the air velocity in the column channel for the LDS appears to remain constant at ∼10.5 m/s for all brick surface roughness values. Additionally, the air velocity in the wall channels increases from ∼10.2 to 10.5 m/s while the air velocity in the ceiling channel increases from ∼9.6 to 10 m/s as the brick surface roughness increases from 0 to 4 mm.
Table 6 shows the percentage increase in the air velocity for both brick settings when the brick surface roughness is increased from 0 to 1, 2, 3, and 4 mm. The change in the air velocity in the column channels is small, at less than 0.30%, for both settings. The average air velocity in the wall channel shows a relatively higher increase in the LDS compared to the HDS. It is less than 0.3% in the HDS and exceeds 2.8% in the LDS when the brick surface roughness is increased to 4 mm. This means that the change in brick surface roughness affects the wall channel velocity in the LDS more than in the HDS. On the other hand, the air velocity in the ceiling channel shows the most significant increase as compared to the other channels. It increases by 3.19% for the HDS and 4.35% for the LDS as the brick roughness increases from 0 to 4 mm. Thus, the air velocity in the ceiling channel experiences a greater increase in the LDS compared with the HDS for brick roughness of 3 and 4 mm, and vice versa for the lower brick roughness.
Table 7 shows the effect of changing the brick surface roughness on the pressure drops across the setting for both the HDS and LDS brick settings. The pressure drops across the HDS are greater than the LDS because of the greater number of bricks and the narrow stack channels in the HDS. Increasing the brick surface roughness increases the pressure drop across both settings; however, the effect of the brick roughness in the LDS is larger than that in the HDS, as can be seen in
Table 7. The pressure drop increases by ∼70% for the HDS and by ∼80% for the LDS as the roughness increases from 0 to 4 mm. The ratio of the pressure drop for the LDS to that of the HDS was calculated for each roughness level, and it increases slightly with the increase in brick roughness. It started at a ratio of 0.673 for the roughness of 0 mm and ended up at a ratio of 0.716 for the roughness of 4 mm. As listed in
Table 7, the average ratio of the pressure drop of the LDS to that of the HDS is about 0.675. However, the brick roughness has a greater impact on the LDS than the HDS.
4.2.2. Convective Heat Transfer
The brick and air temperature contours in the wall, column, extension, and stack channels for the LDS and HDS using smooth (middle frame) and rough bricks (left frame) are shown in
Figure 6 and
Figure 7. The temperature scale for the rough bricks is smaller than for smooth or rough kiln walls for the HDS, and that scale of the rough bricks is used for the three considered cases in the LDS. For both the HDS and LDS, the convective heat transfer between the rough bricks and the flowing air is enhanced over that of the smooth or rough kiln walls. This is evident because of the lower brick and air temperatures of the rough bricks (left frame) than smooth (middle frame) and rough walls (right frame) in
Figure 6 and
Figure 7. As discussed earlier, the middle bricks in the longitudinal and transverse layers in the HDS have high temperatures because the flowing air around them have low velocity rates due to the tiny stack channels. Thus, the middle and last transverse bricks within the HDS have different heat transfer and baking times than the first brick. On the other hand, the rough bricks in the LDS (
Figure 6c,d) have similar and lower temperatures than the rough or smooth bricks in the HDS, indicating higher and more homogenous heat transfer between the air and the LDS rough bricks.
Figure 7 confirms the lower air temperature in the three considered cases in the LDS than the similar cases in the HDS.
The convective heat transfer coefficient (CHTC) values are presented in
Figure 11 for the highest and lowest studied brick surface roughness levels for both brick settings. The CHTC values start in row 1 with a high value and reach an established value toward rows 5 and 6 for both brick settings for smooth and rough bricks. In general, the rough brick surface enhances the CHTC values greatly compared with the smooth bricks for both settings. The CHTC values in row 1 increase from ~82 to ~143 W/m
2K for the HDS and from ~94 to ~166 W/m
2K for the LDS as the brick roughness increases from 0 to 4 mm. The established CHTC values in rows 6 and 7, where the flow is fully developed, increase from ~46 to ~87 W/m
2K for the HDS and from ~57 to ~117 W/m
2K for the LDS, as the brick roughness increases from 0 to 4 mm. The large enhancement in CHTCs due to the brick roughness could be due to many factors, such as the turbulence enhancement and the increase in the brick contact area with the air flow. Both factors are related to the alteration of the brick surface roughness.
The ratios (α) of the CHTC of the LDS to that of the HDS for different brick surface roughness levels are presented in
Figure 12. In row 1, the variation in α is less than 1% for all brick roughness values due to the large turbulence effect at the inlet of the brick settings. In the flow transition region between rows 2 and 5, the ratio (α) increases as the row number increases. The CHTC ratio (α) of the smooth bricks is lower than α for the roughened bricks for rows 2 to 7. For the fully developed flow in rows 6 and 7, the ratio (α) of the smooth bricks is about 1.23, and for brick surface roughness levels of 1 to 4 mm, α reaches almost a constant value of 1.34, as can be seen in
Figure 12. Thus, the brick roughness enhances the ratio (α) for the LDS more than in the HDS by about 11% in the fully developed flow region.
The bricks with a surface roughness of 4 mm reach the constant ratio (α) in row 4, followed by the roughness of 3 mm in row 5 and bricks with roughness levels of 1 and 2 mm in row 6. Thus, the large brick roughness enhances the development of the flow, and the boundary layer is fully developed at a short length in the brick setting. The ratio (α) experiences an increase in the last row, row 8, because of the exit effect of the air from the brick setting.
4.3. Effect of Roughness on the Ratio (β) of Total Heat Transfer Rate to Pumping Power
The brick firing undergoes a complicated chemical process, whereby the rate of the heat transfer supplied to the bricks is very important. The brick baking requires a long time of up to 24 h or more. During this period, the total rate of the heat transfer supplied to the brick per one degree equals Qt (), and the pumping power required to force the air along the brick equals the PP (); is the volume flow rate of the air). The surface roughness of the bricks and kiln walls enhances the convection heat transfer coefficient (h) and increases the pressure drop. Thus, the ratio (β) of Qt/PP indicates the effect of the surface roughness on the brick-making process. As (β) increases, the roughness enhances the kiln performance, and vice versa.
The effects of the kiln wall and brick surface roughness on the pressure drop and CHTCs of the HDS and LDS bricks have been discussed before. In this section, the ratio of the heat transfer rate to pumping power (β) and the effect of the surface roughness will be used to compare the examined brick settings. The ratio (β) can be viewed as an indicator of the tunnel kiln performance, as it measures the cost of the pumping power to carry out the baking process. The relationships between β and the surface roughness of either the kiln walls or the bricks are presented in
Figure 13 for both the LDS and HDS.
Figure 13 shows the effect of the kiln walls or brick surface roughness on the ratio (β) of the heat transfer rate, per one-degree temperature difference (W/K), to the total required pumping power (W) of the kiln for both examined brick settings. The ratio (β), for smooth kiln walls and bricks, starts from about 2.7 for the LDS and 2.3 for the HDS. The LDS always shows a higher β for all surface roughness values. Increasing the tunnel wall surface roughness continuously decreases the ratio (β) for both settings. The ratio (β) decreases from 2.70 to 2.45 (9.7%) for the LDS, and from 2.30 to 2.08 (9.4%) for the HDS. Accordingly, the kiln wall surface roughness has almost a similar impact on both brick settings, the HDS and LDS, as the difference is only 0.4%.
On the other hand, increasing the brick surface roughness increases the ratio (β) by up to a roughness value of 2 mm and decreases afterward for both settings. The ratio (β) increases from 2.7 to 3.2 (17%) for the LDS, and from 2.3 to 2.6 (13%) for the HDS. Thus, the effect of the brick surface roughness enhances the LDS more than the HDS by 4%. In conclusion, the maximum ratio (β) reaches 3.2 for the LDS and 2.6 for the HDS with a difference of about 23.1% at a brick roughness of 2 mm.
4.4. Concluding Discussion
The heat transfer-to-pumping power ratio (β) for the LDS is higher than for the HDS by about 17.4% (2.7/2.3) for smooth kiln and bricks. Additionally, the ratio (β) increases to 23.1% for the brick roughness of 2 mm, i.e., the surface roughness adds to the benefits of the LDS over the HDS. Therefore, the LDS still provides advantages over the HDS in terms of having higher convection heat transfer coefficients, lower pressure drops and pumping powers, and a higher ratio of heat transfer to pumping power.
The energy required for brick manufacturing includes the brick shaping, which is the same in both settings, and the brick drying and firing. The theoretical specific energy consumption (SEC) for brick production is about 0.74 MJ/kg (0.54 MJ/kg for drying and 0.2 MJ/kg for firing [
51,
52]). The actual brick SEC depends on the clay material, manufacturing technology, kiln technology, fuel type, and operational practice. As discussed earlier in the introduction, the actual SEC values range from 2.31 to 3.51 MJ/kg [
12]. The difference between the real and theoretical SEC values is attributed to energy losses in the kilns, such as exhaust losses (about 30%) and wall losses (about 25%), while almost 30% of the energy can be recovered by cooling the air during brick drying [
47,
54]. As a result, increasing the energy efficiency can significantly reduce the SEC. Since the ratio of the heat transfer to pumping power (β) for rough bricks in the LDS is higher than that for the HDS by 23.1%, the required SEC for the LDS will be lower than for the HDS and adds more advantages to the LDS approach.
Complex chemical reactions and thermodynamic processes are involved in the brick firing process [
54]. Aside from brick drying, the kiln firing process includes evaporation (20–150 °C), dehydration (149–650 °C), oxidation (300–982 °C), vitrification (800–1316 °C), flashing or soaking (1150–1316 °C), and cooling (1316 °C-ambient). The brick firing takes 50–100 h in tunnel kilns [
22], depending on the firing temperature and brick setting. Knowing that the CHTCs of the LDS, at any kiln roughness, are approximately 22.5% greater than that of the HDS (
Figure 9), and that the CHTCs of the LDS, at any brick roughness, are approximately 34% greater than that of the HDS (
Figure 12), the brick firing time in the LDS is less than that required in the HDS by about one-third. Thus, the enhancement in the CHTC results in a short firing time in the kiln with better quality brick production due to the even heat transfer on the various faces of the bricks [
51]. In conclusion, the LDS provides higher quality brick production with similar kiln productivity.


