
Propagation Characteristics and Identification of High-Order Harmonics of a Traction Power Supply System


Abstract
:1. Introduction
2. Transmission Characteristics of High-Order Harmonics in a Traction Power Supply System
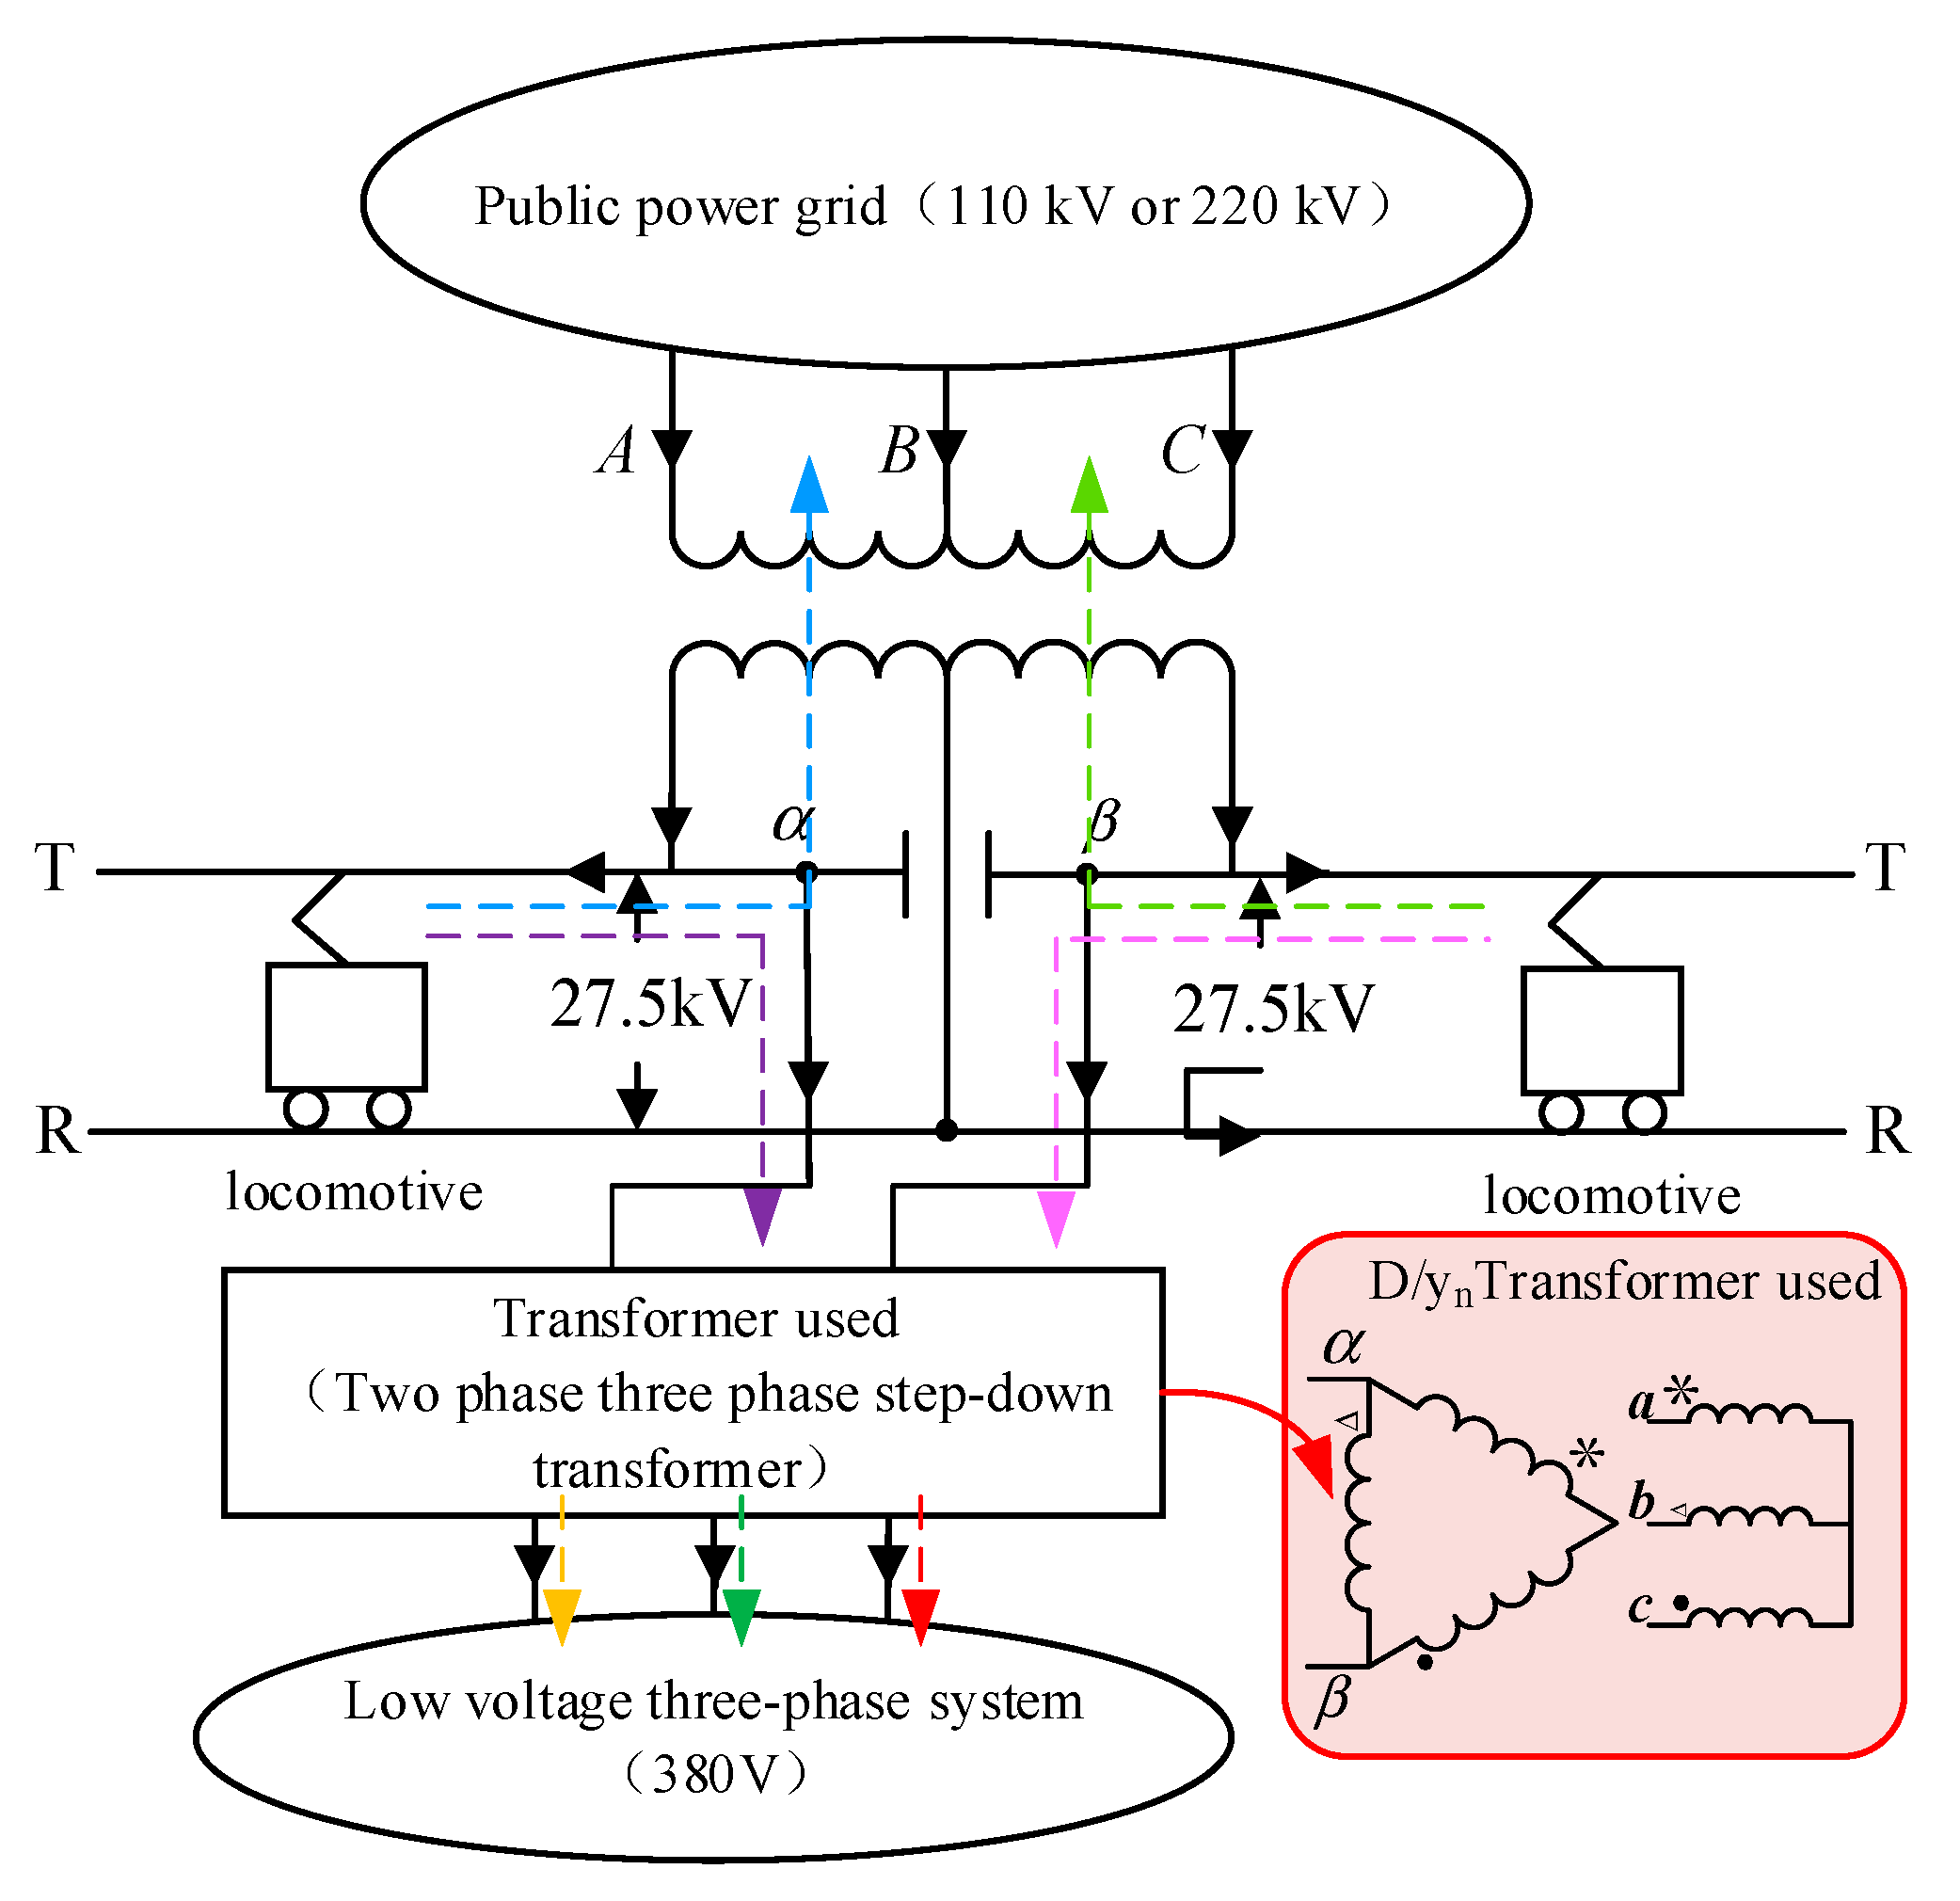
2.1. V/v Wiring Traction Substation Model
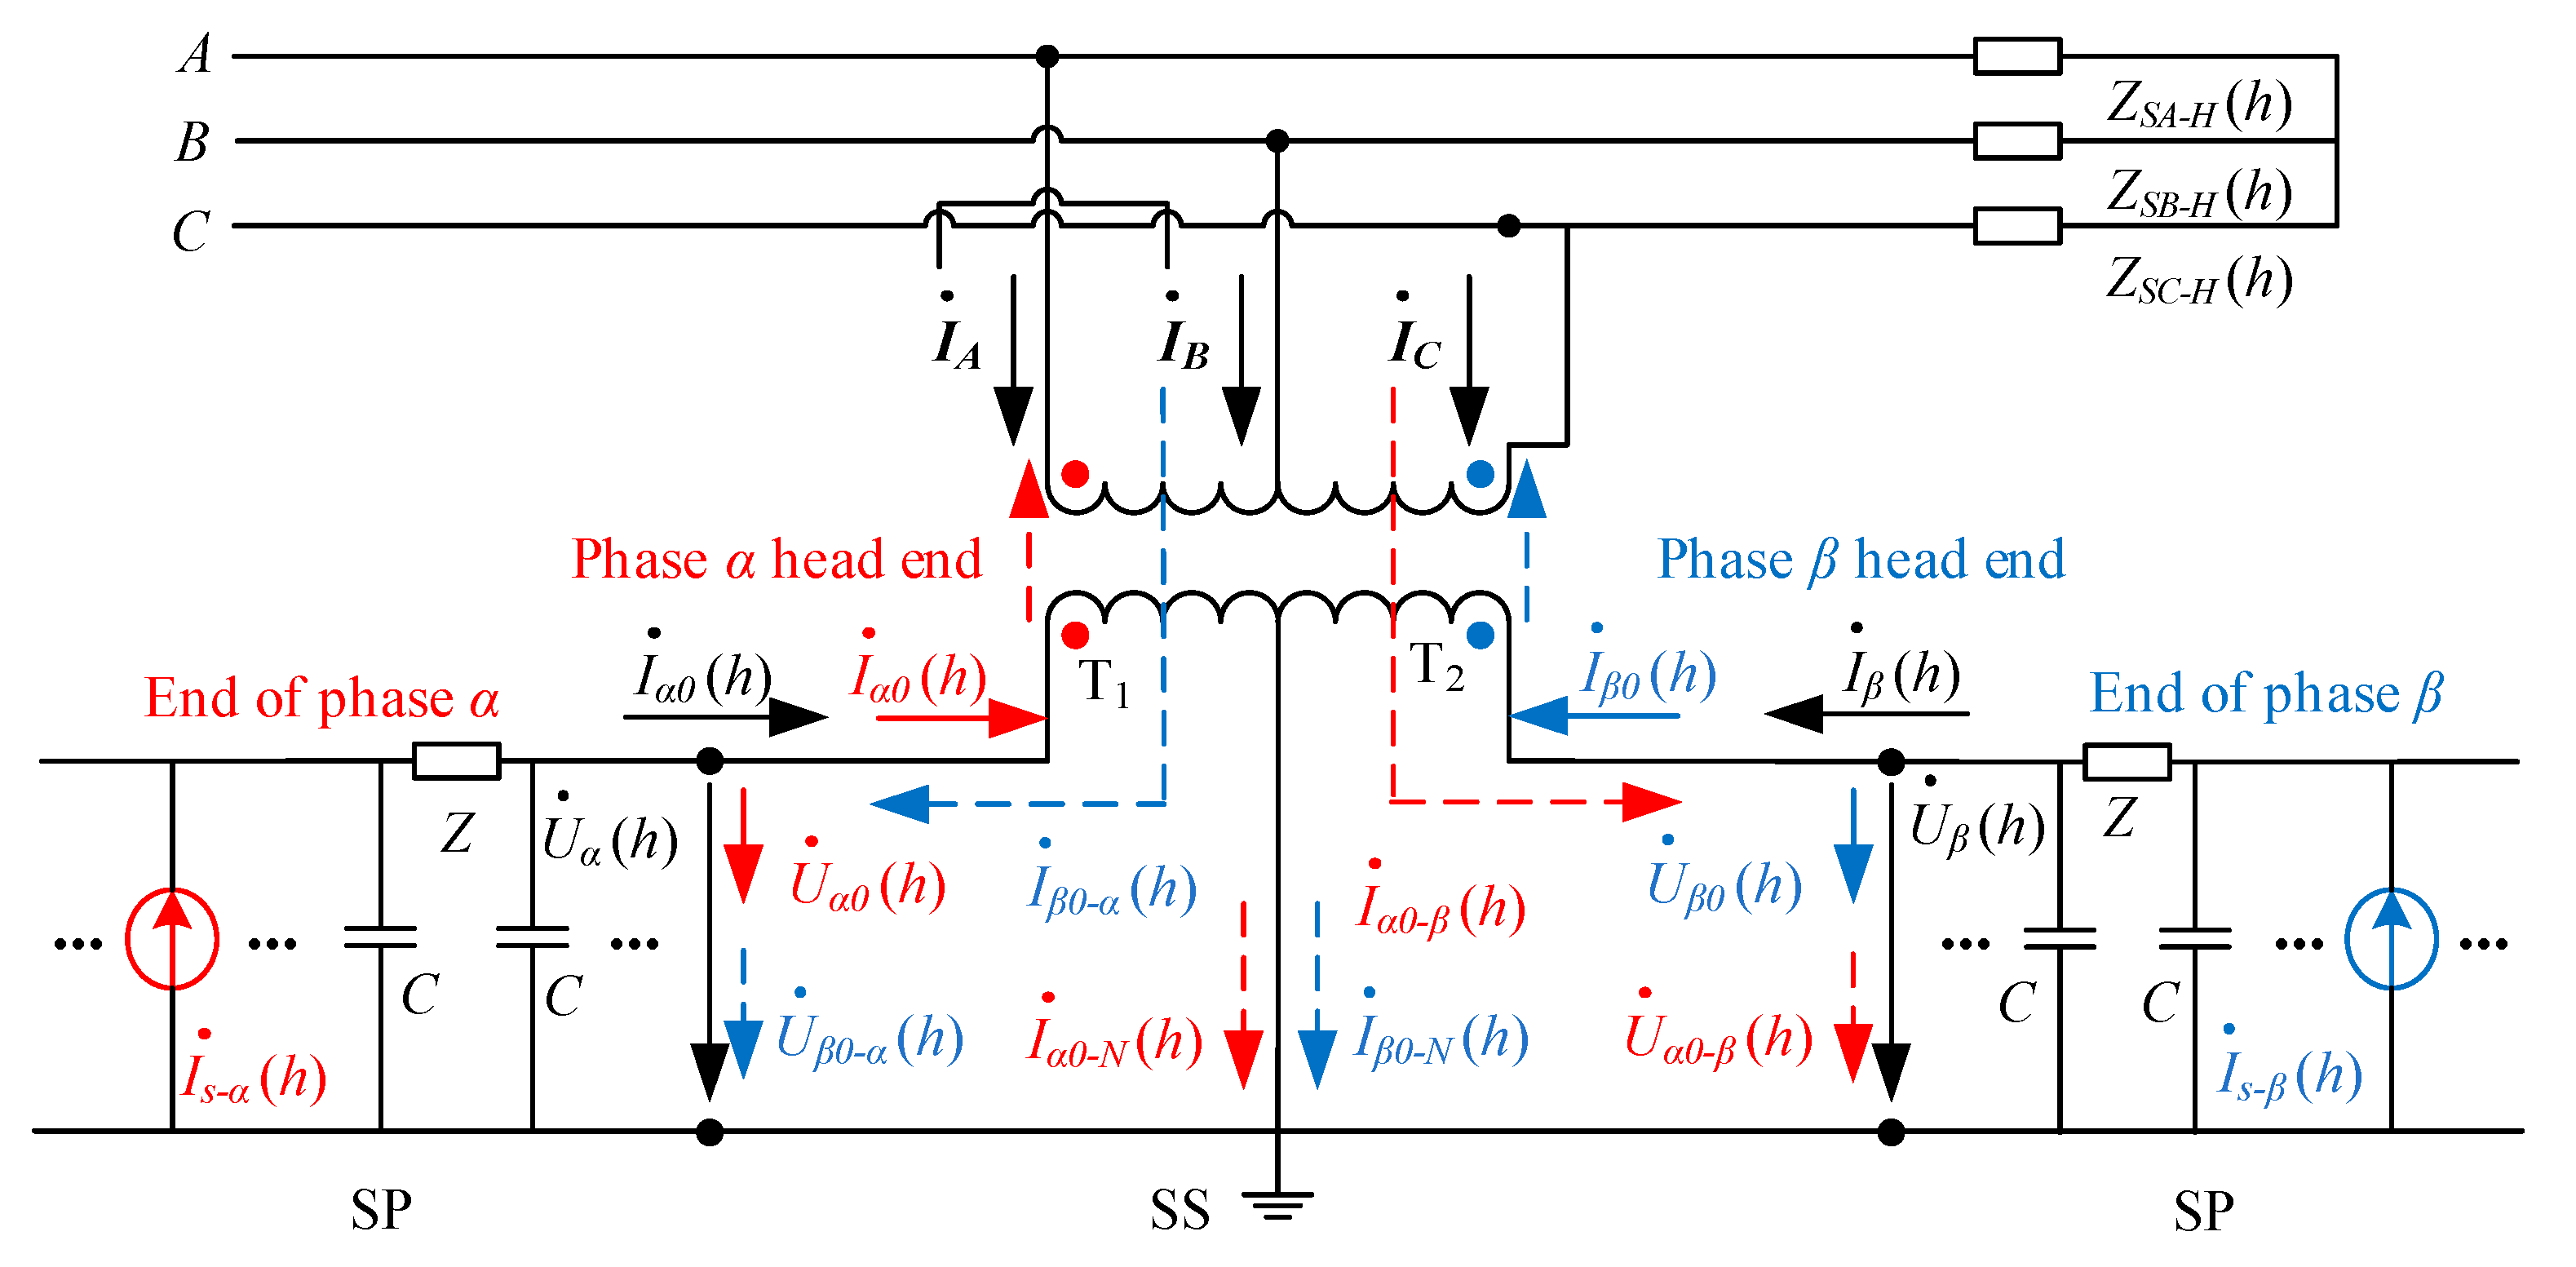
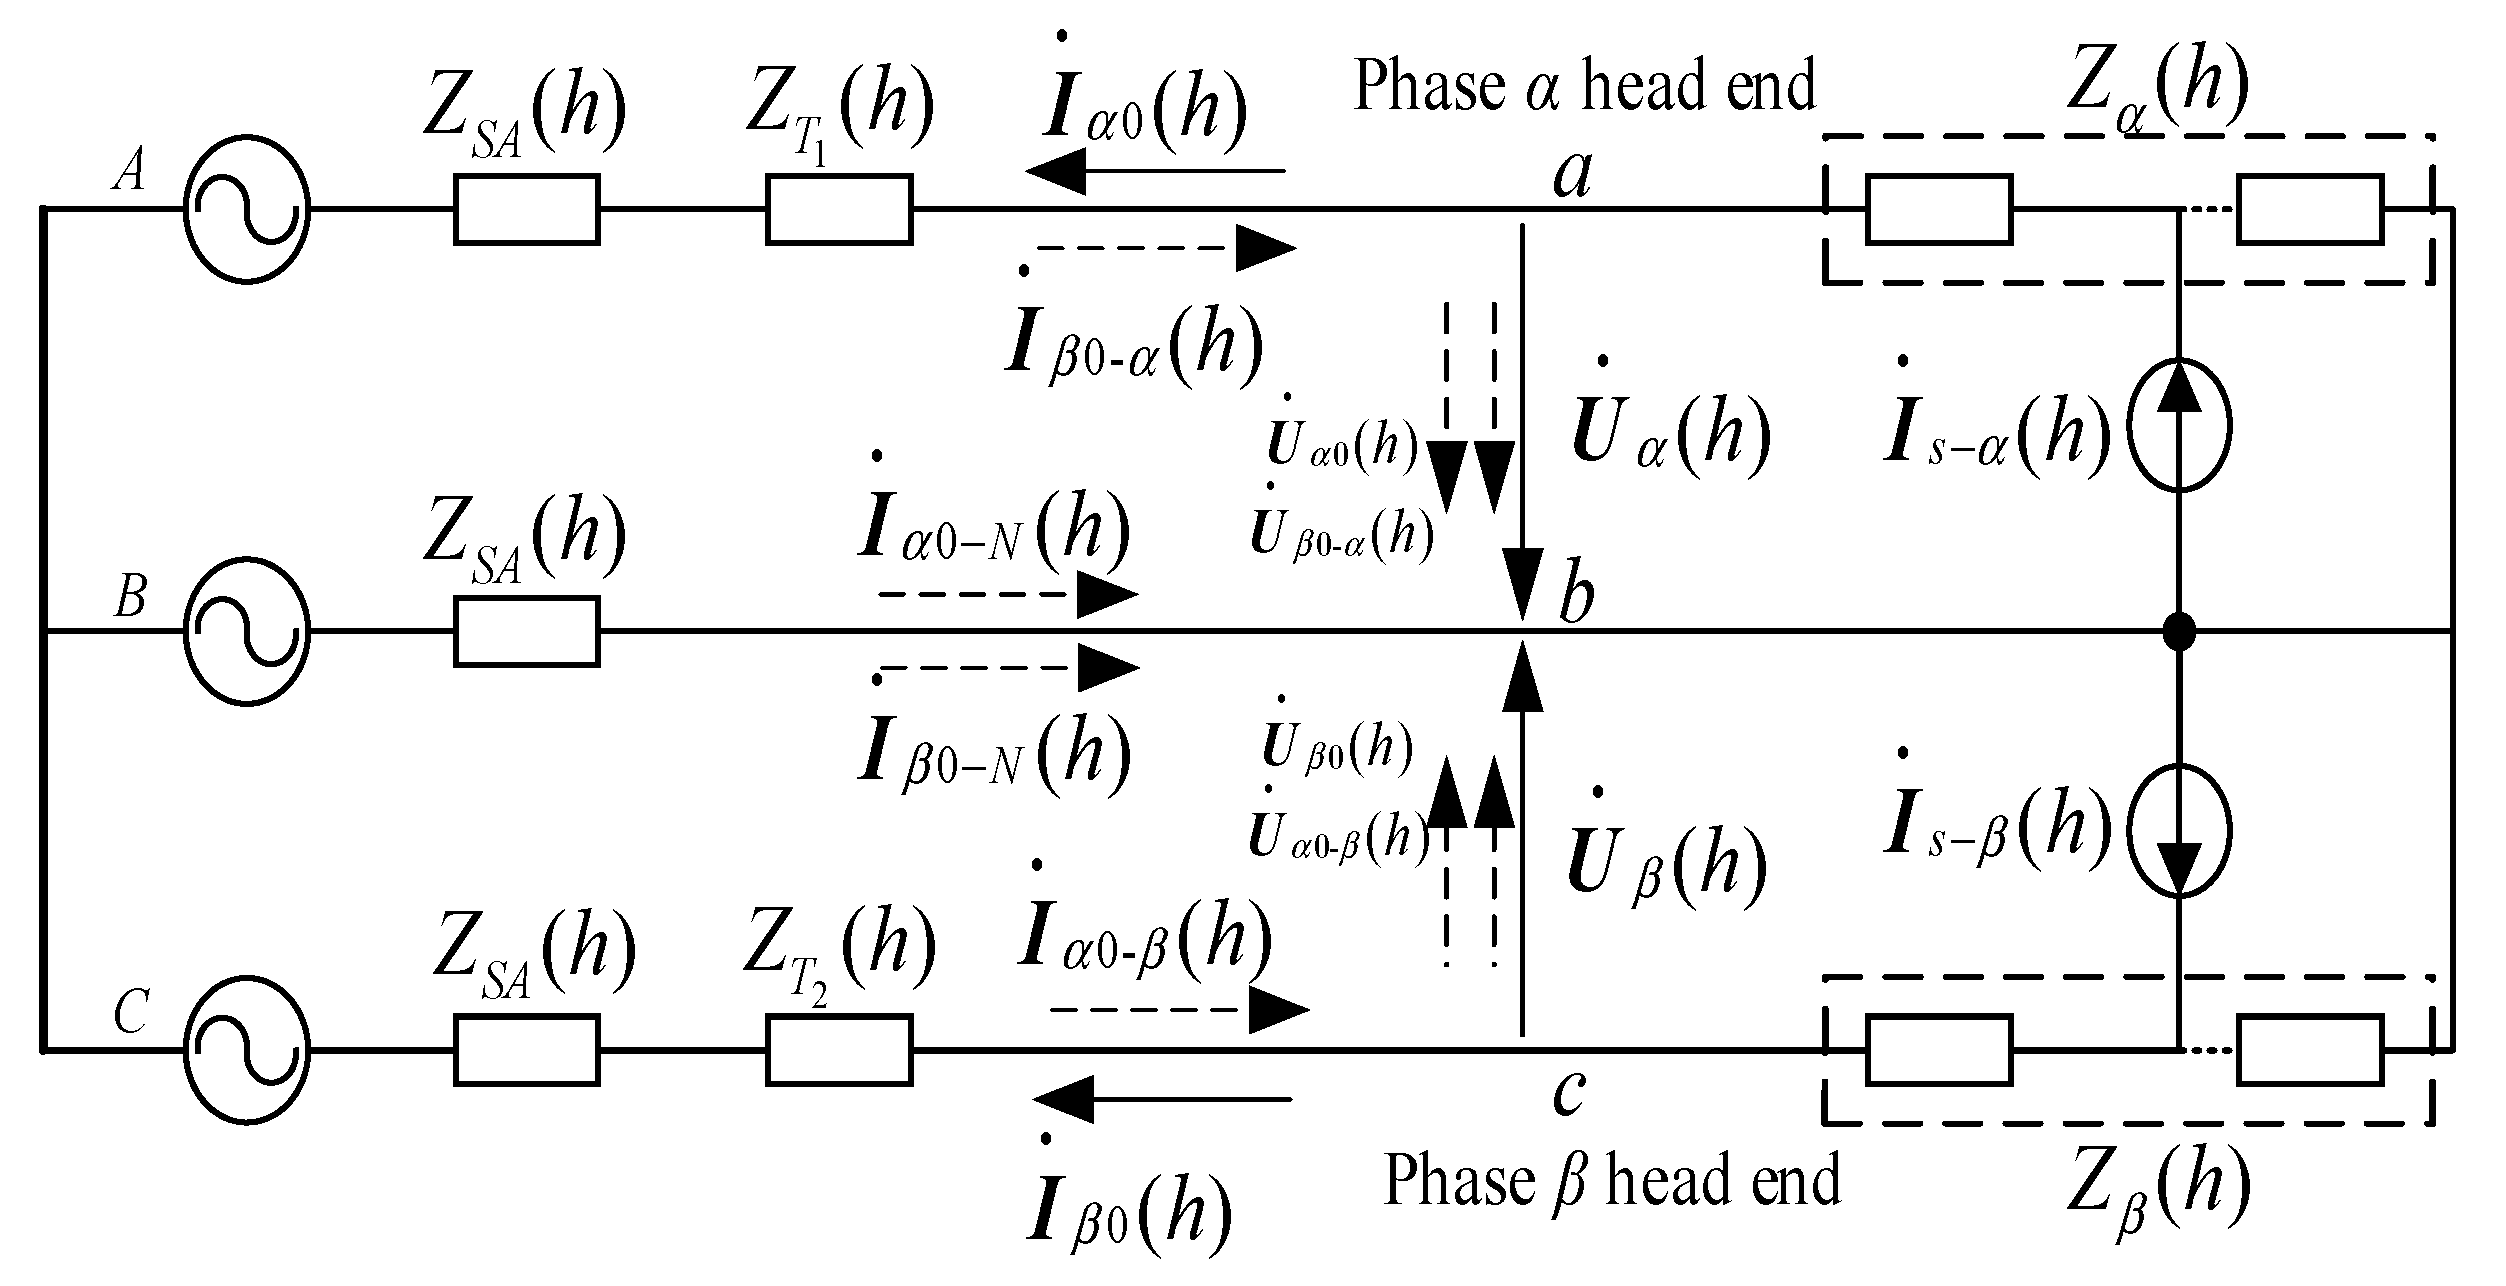
2.2. Analysis of Transverse Propagation Characteristics of High-Order Harmonics in Traction Load
2.3. Analysis of Longitudinal Propagation Characteristics of High-Order Harmonics in Traction Load
3. Impedance Identification Based on the SVD Algorithm
3.1. Influence and Key Factor Analysis Based on Simulation Data
- (1)
- The size of high-order harmonics in the low-voltage three-phase system will be affected by the capacity of the transformer used. When the capacity is small, the impact is greater, but when the capacity is large, there is no significant impact;
- (2)
- The magnitude of the higher harmonics in the low-voltage three-phase system is greatly affected by the length of the line and the location of the locomotive.
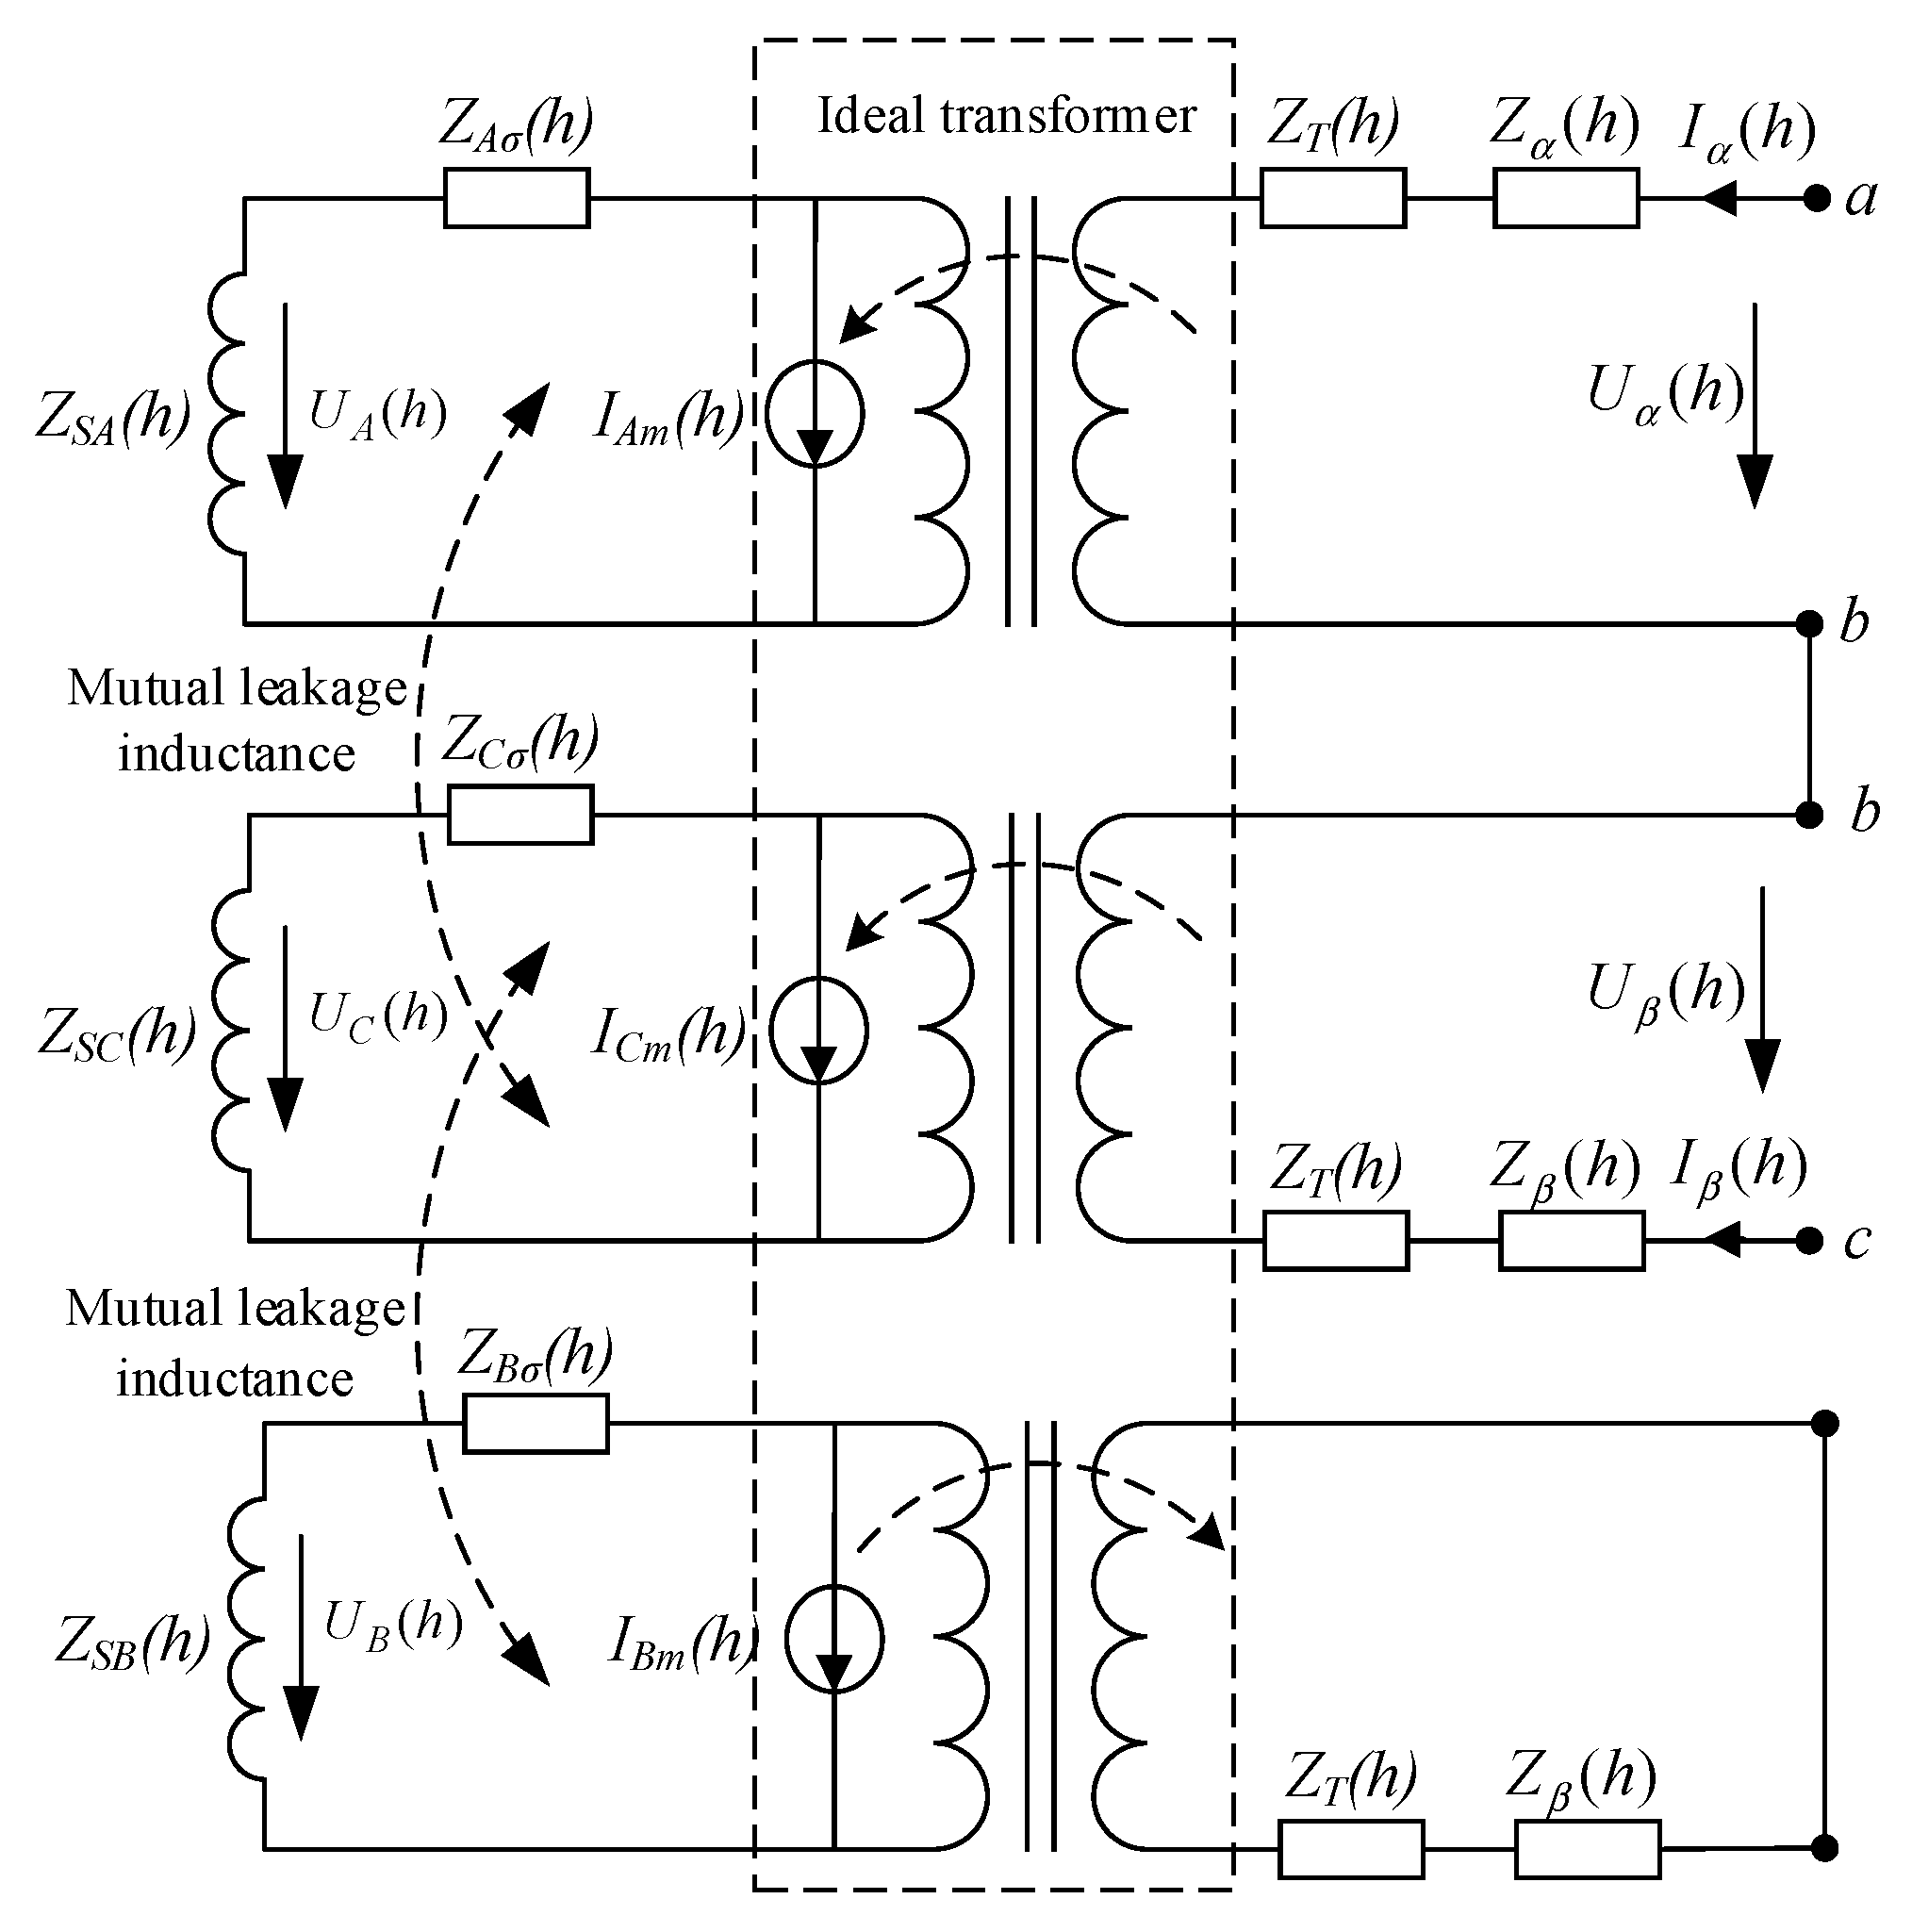
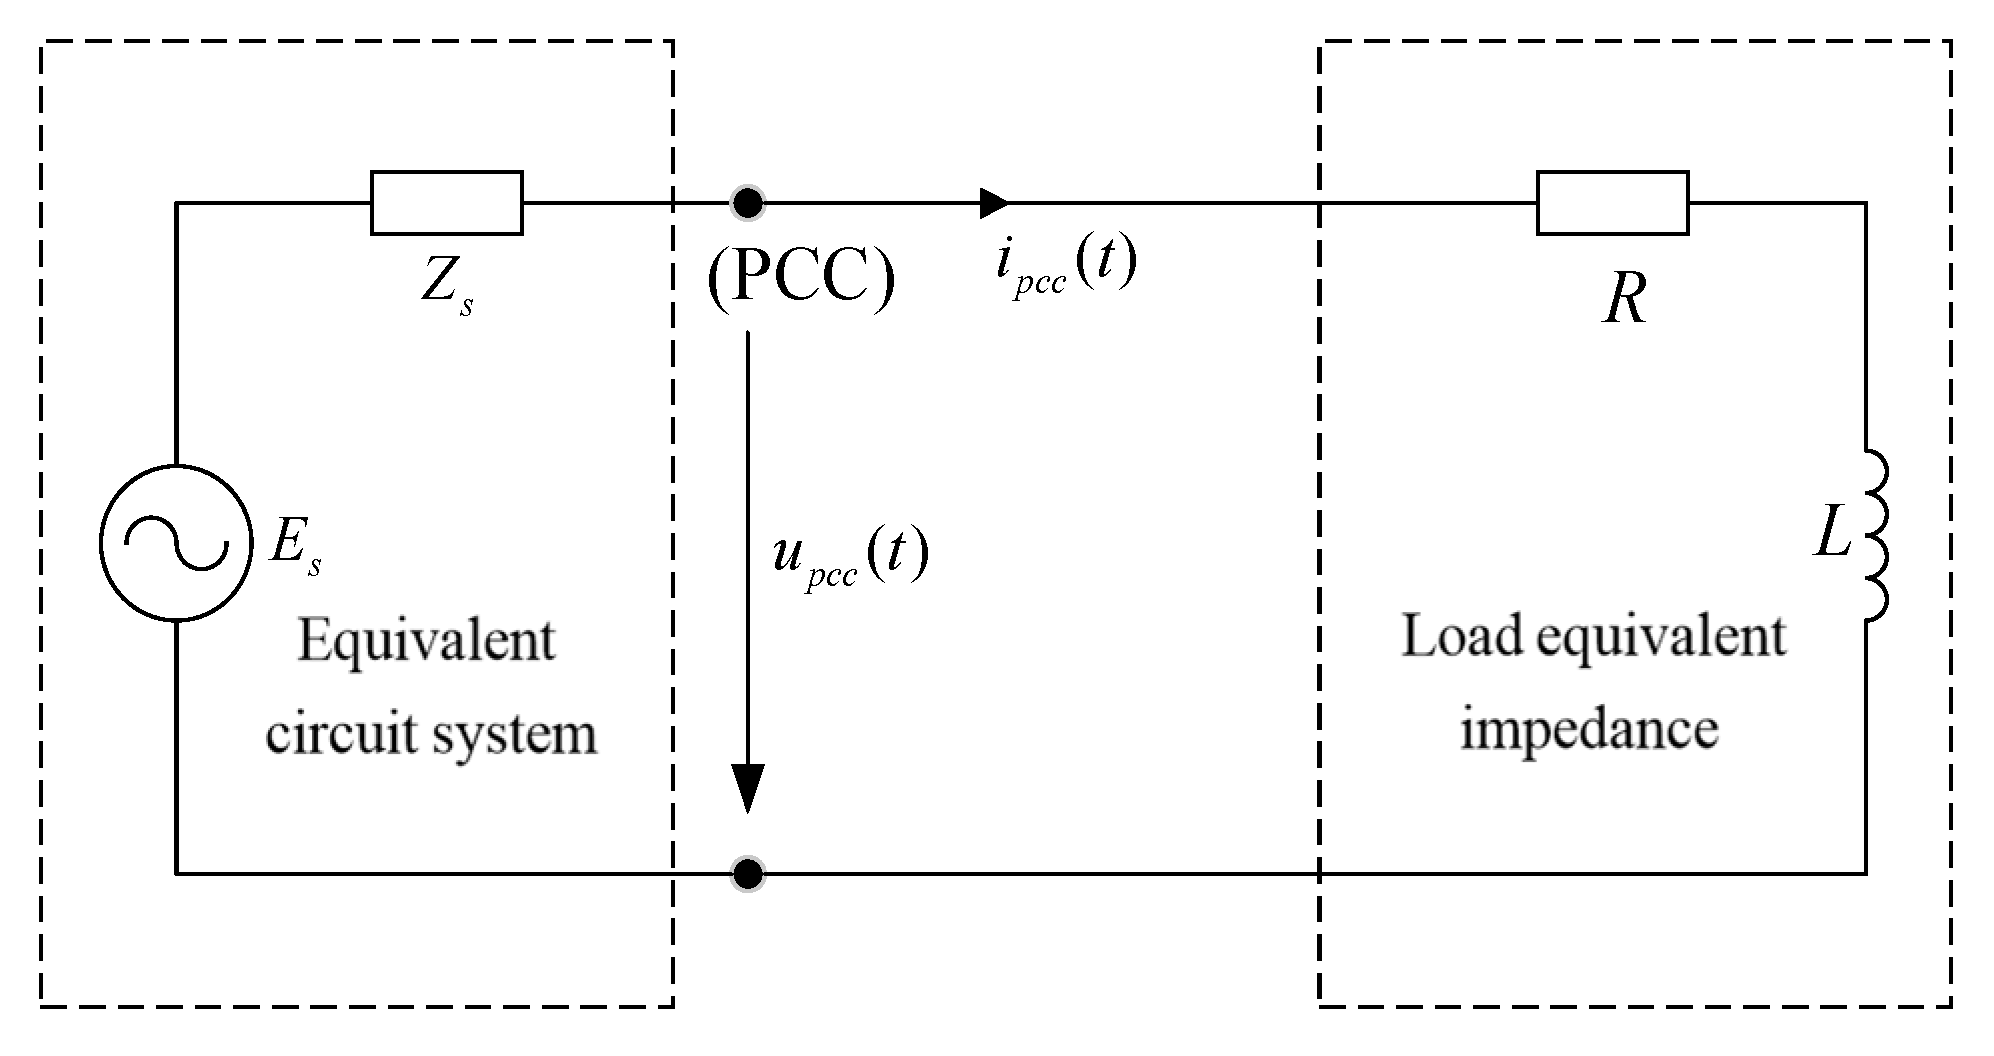
3.2. Mathematical Model and Circuit Model of a Low-Voltage Self-Use Power System
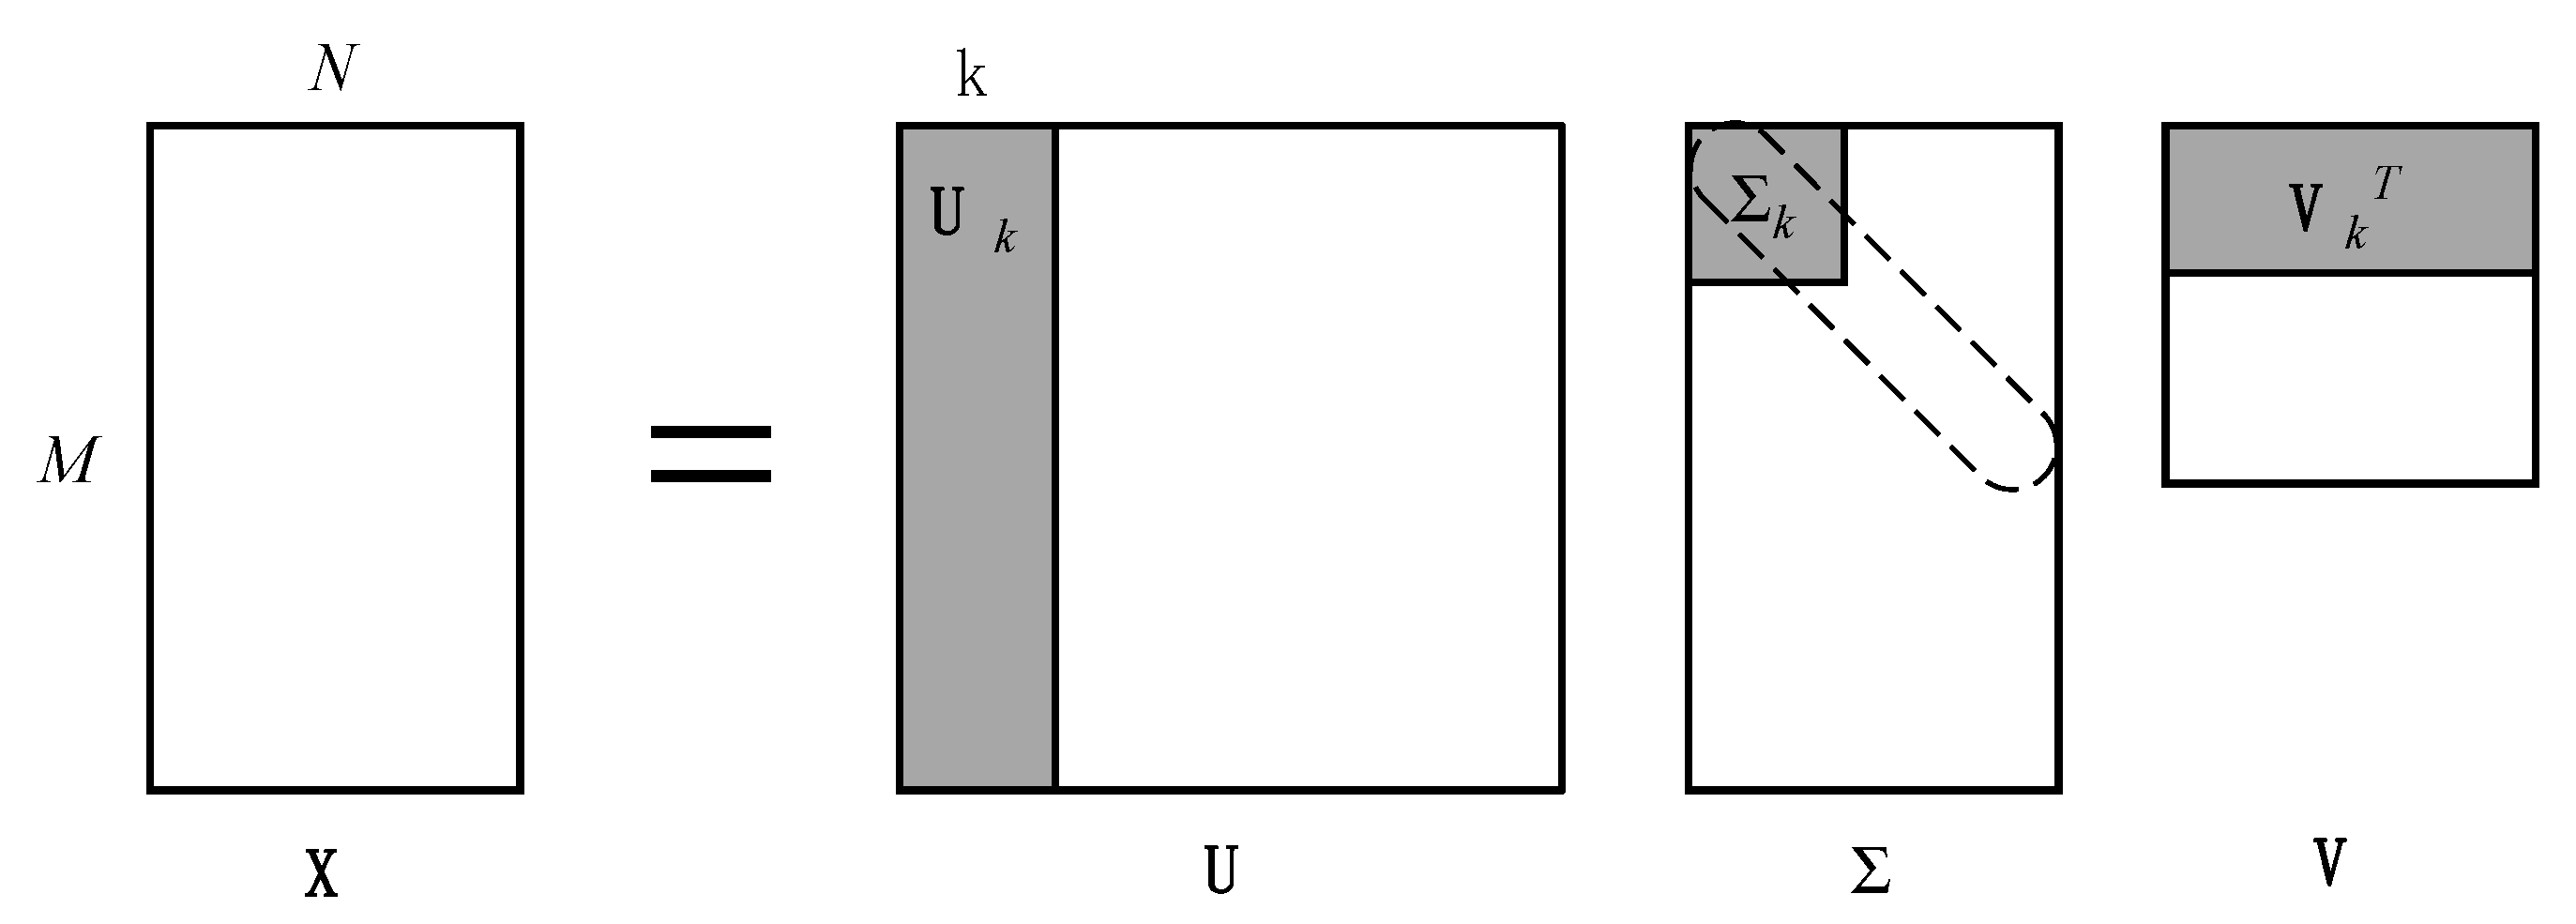
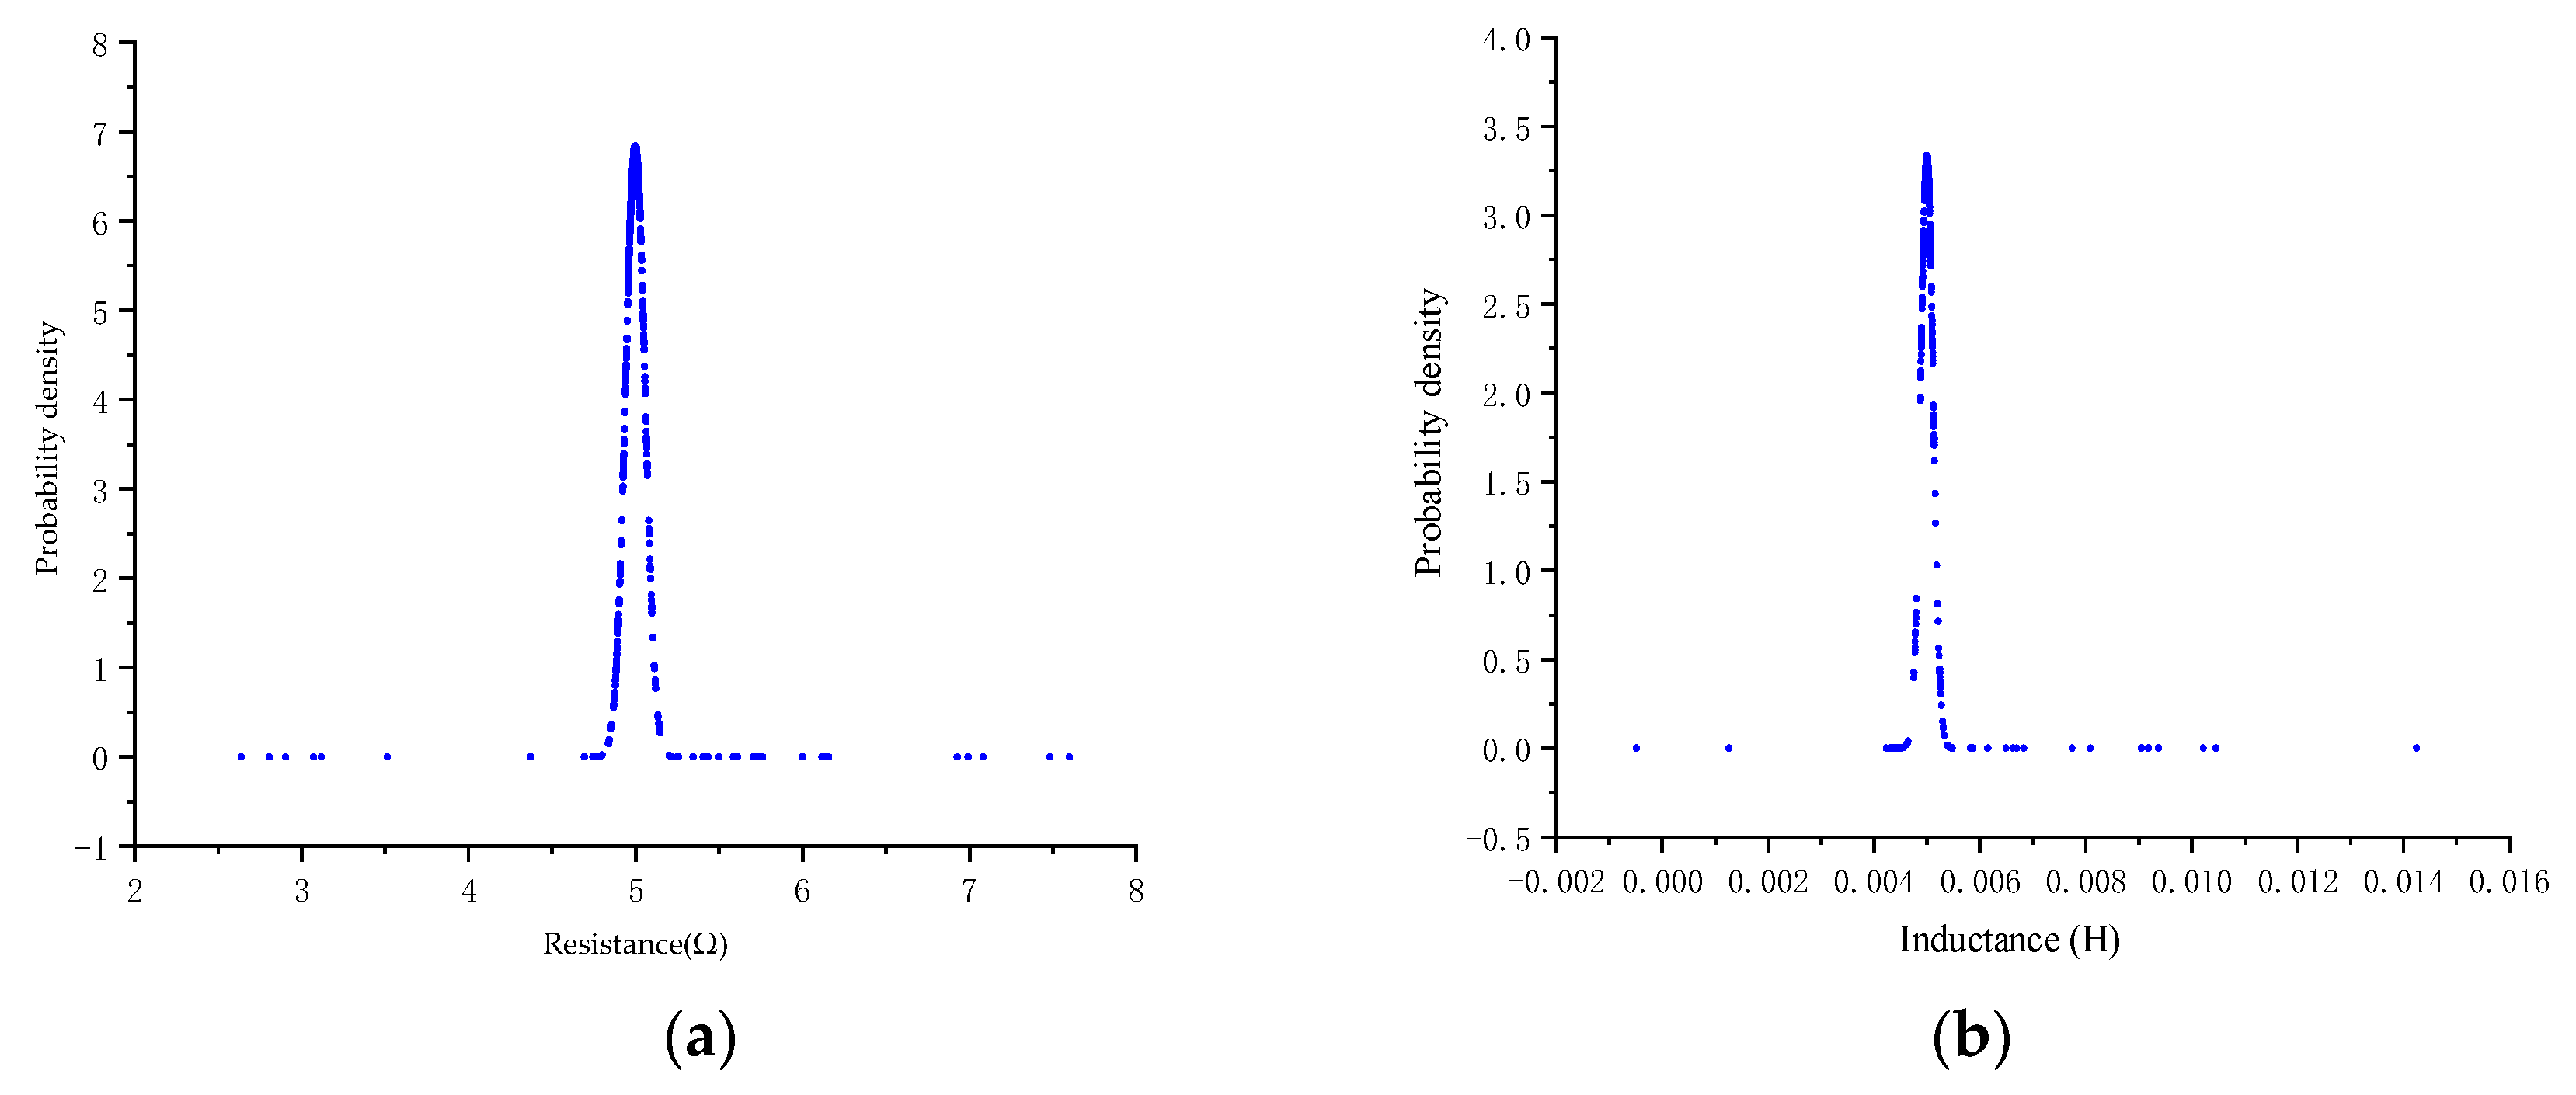
3.3. Parameter Identification Method Based on Singular Value Decomposition
4. Overvoltage Identification Based on Deep Learning
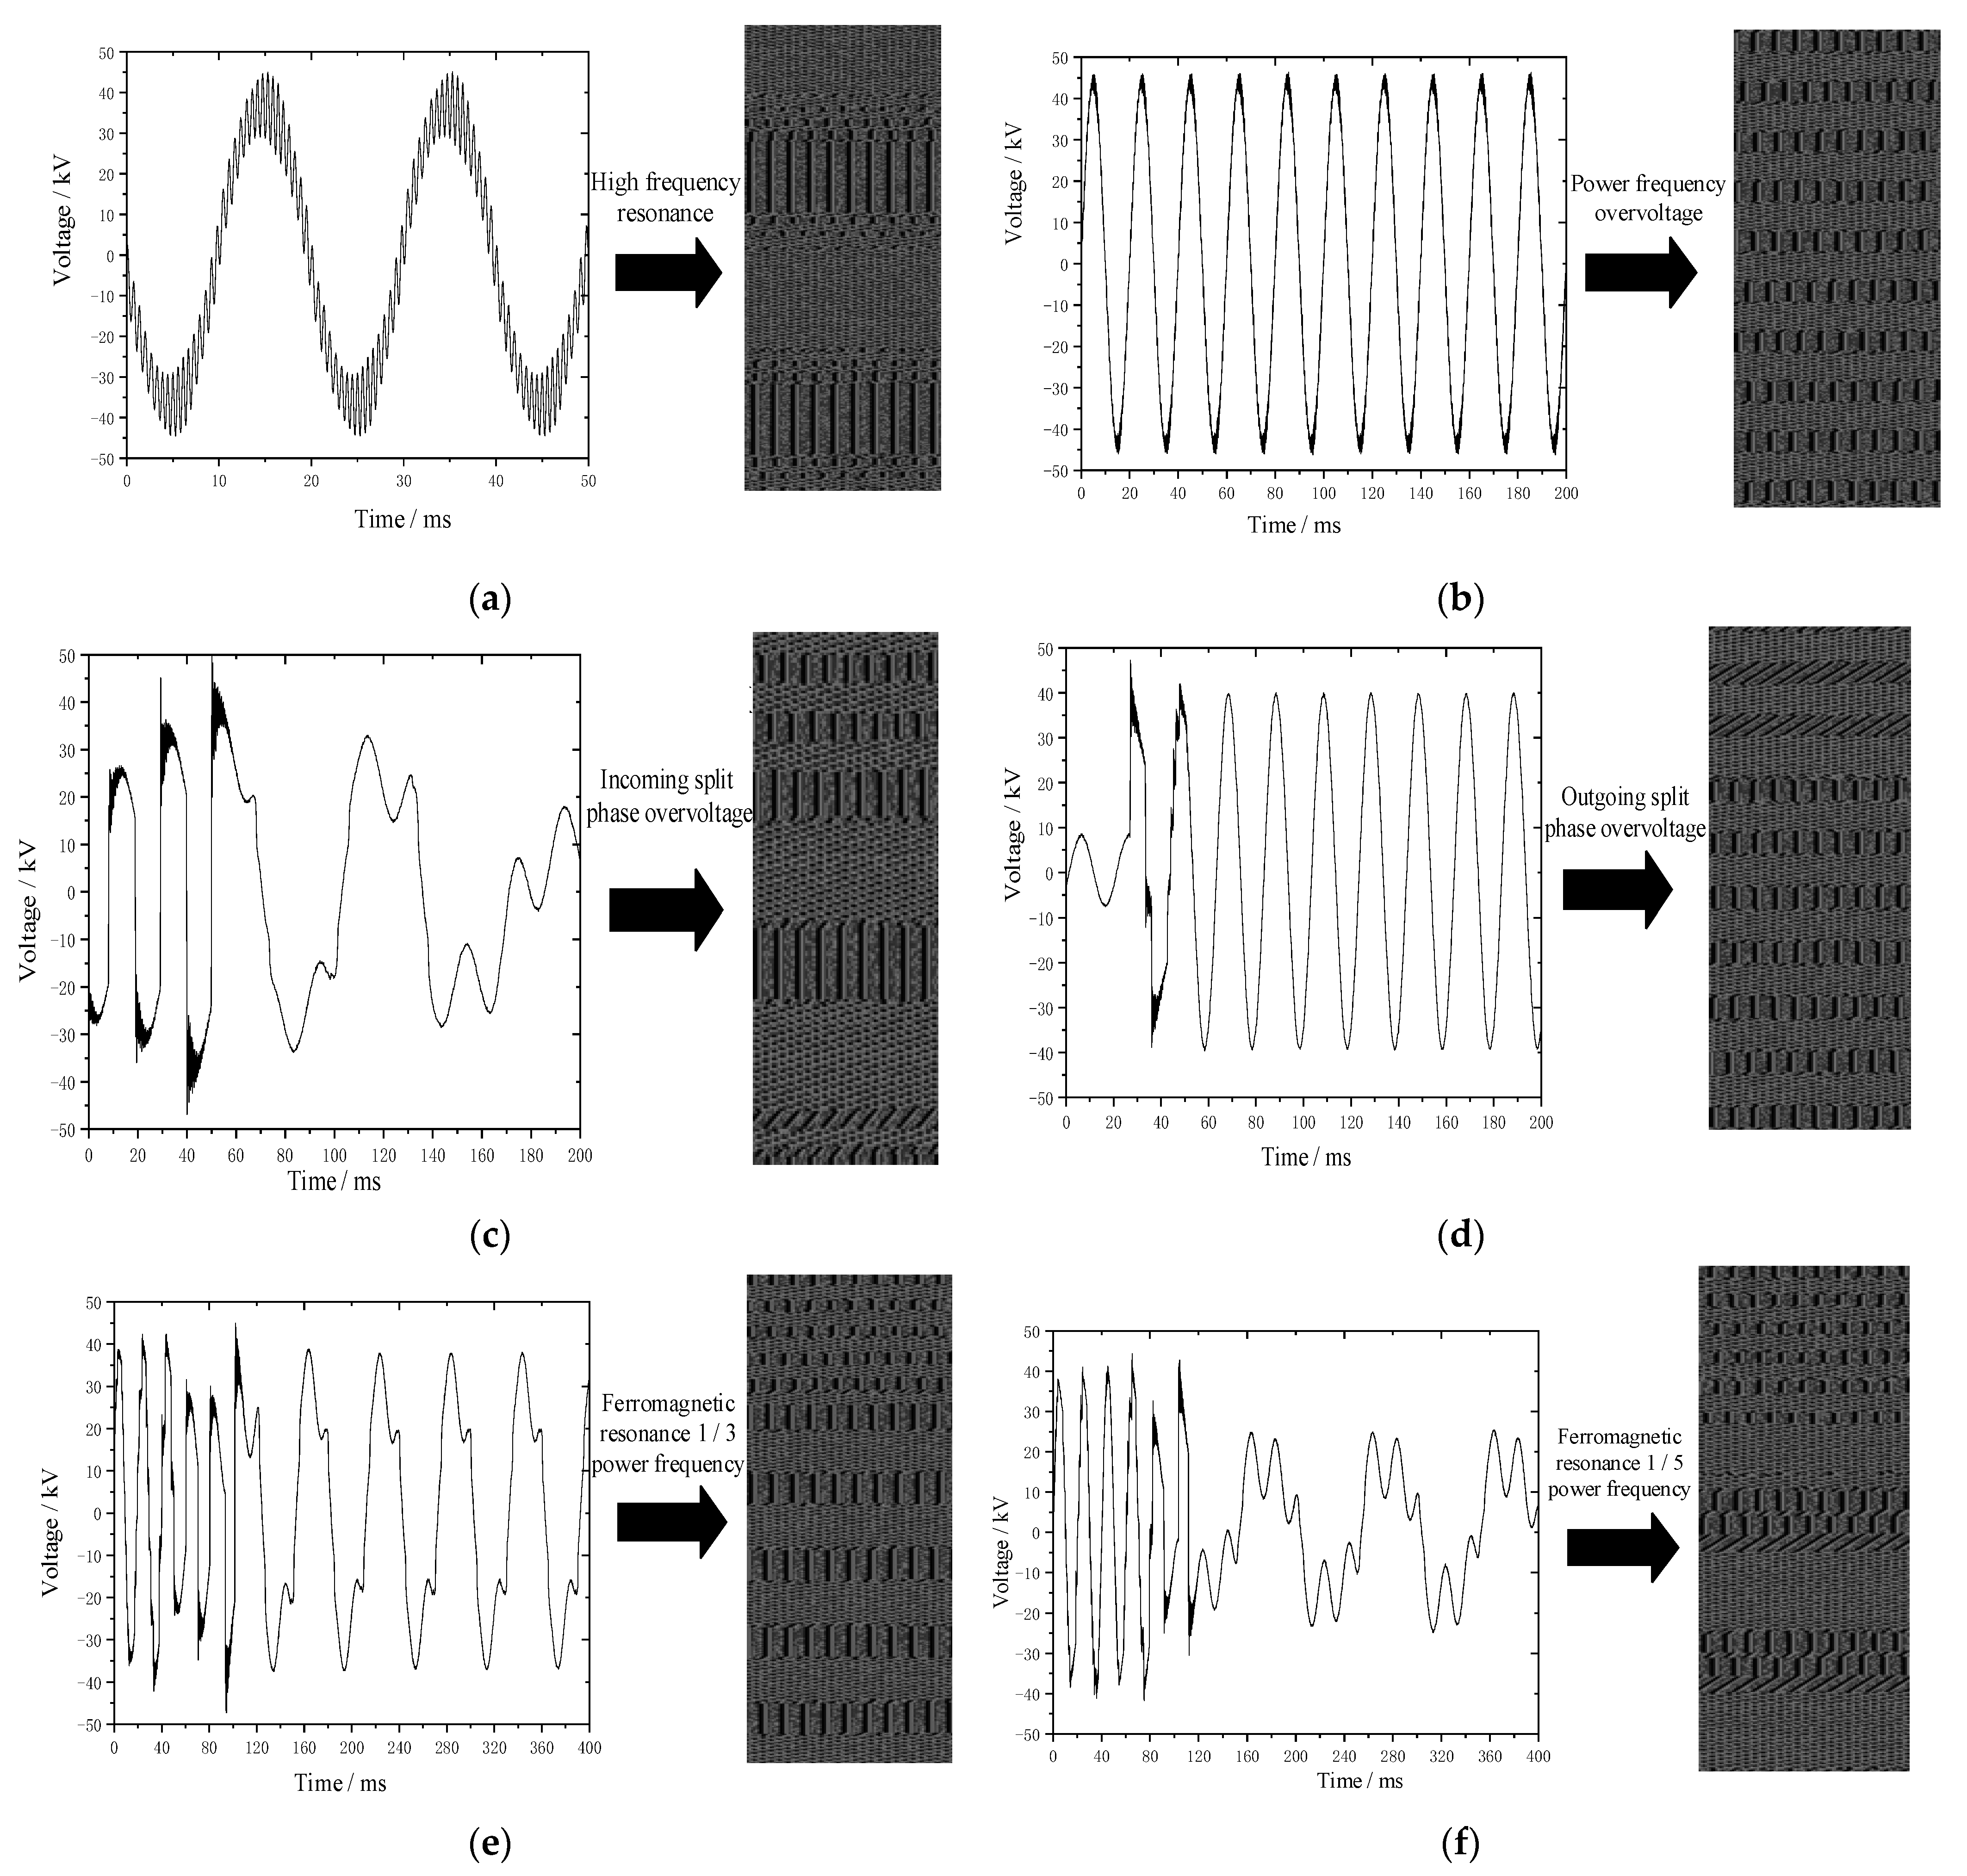
4.1. Overvoltage Grayscale Image Mapping Algorithm
4.2. Overvoltage Identification Based on ShuffleNet
5. Conclusions
Author Contributions
Funding
Institutional Review Board Statement
Informed Consent Statement
Data Availability Statement
Conflicts of Interest
References
- Holtz, J.; Krah, J.O. Suppression of time-varying resonances in the power supply line of ac locomotives by inverter control. IEEE Trans. Ind. Electron. 1992, 39, 223–229. [Google Scholar] [CrossRef]
- Caramia, P.; Morronr, M.; Varilone, P. Interaction between supply system and EMU loco in 15 kV-16/sup 2/3/Hz AC traction systems. In Proceedings of the Power Engineering Society Summer Meeting, Vancouver, BC, Canada, 15–19 July 2001; pp. 198–203. [Google Scholar]
- Zynovchenko, A.; Xie, J.; Jank, S. Resonance phenomena and propagation of frequency converter harmonics the catenary of railways with single-phase A.C. In Proceedings of the European Conference on Power Electronics and Applications, Dresden, Germany, 11–14 September 2005; pp. 1–10. [Google Scholar]
- IEEE Std 519-2014 (Revision of IEEE Std 519-1992); IEEE Recommended Practice and Requirements for Harmonic Control in Electric Power Systems. Institute of Electrical and Electronics Engineers: Piscataway, NJ, USA, 2014; pp. 1–29.
- Holtz, J.; Kelin, H.J. The propagation of harmonic currents generated by inverter-fed locomotives in the distributed overhead supply system. IEEE Trans. Power Electron. 1989, 4, 168–174. [Google Scholar] [CrossRef]
- Zhang, L.; Liang, S.; Li, X.; Jia, Y. Modelling on novel cable traction power supply system and power distribution analysis. IEEE Trans. Power Deliv. 2022, 37, 745–754. [Google Scholar] [CrossRef]
- Yang, S.; Wang, Y.; Song, K.; Wu, M.; Konstantinou, G. Stability and suppression study for low-frequency oscillations in network-train system. IEEE Access 2020, 8, 30575–30590. [Google Scholar] [CrossRef]
- Ma, X.; Yang, Q.; Chen, C.; Luo, H.; Zheng, D. Harmonic and interharmonic analysis of mixed dense frequency signals. IEEE Trans. Ind. Electron. 2021, 68, 10142–10153. [Google Scholar] [CrossRef]
- Taufiq, J.A.; Shen, J. Frequency domain modelling of traction PWM converters. In Proceedings of the 1993 Fifth European Conference on Power Electronics and Applications, Brighton, UK, 13–16 September 1993; Volume 7, pp. 63–67. [Google Scholar]
- Shen, J.; Taufiq, J.A.; Mansell, A.D. Analytical solution to harmonic characteristics of traction PWM converters. IEE Proc.-Electr. Power Appl. 1997, 144, 158–168. [Google Scholar] [CrossRef]
- Liu, Q.; Ai, Y.; Li, S.; Ding, J. Recognition of branch series resonance based on port equivalent method. CPSS Trans. Power Electron. Appl. 2019, 4, 197–203. [Google Scholar] [CrossRef]
- Holtz, J.; Krah, J.O. Adaptive optimal pulse-width modulation for the line-side converter of electric locomotives. IEEE Trans. Power Electron. 1992, 7, 205–211. [Google Scholar] [CrossRef]
- Krah, J.O.; Holtz, J. Total compensation of line-side switching harmonics in converter-fed AC locomotives. IEEE Trans. Ind. Appl. 1995, 31, 1264–1273. [Google Scholar] [CrossRef]
- Zhang, Y.; Dai, K.; Chen, X.; Kang, Y.; Dai, Z. Stability analysis of SAPF by viewing DFT as cluster of BPF for selective harmonic suppression and resonance damping. IEEE Trans. Ind. Appl. 2019, 55, 1598–1607. [Google Scholar] [CrossRef]
- Li, Y.; An, T.; Zhang, D.; Pei, X.; Ji, K.; Tang, G. Analysis and suppression control of high frequency resonance for MMC-HVDC system. IEEE Trans. Power Deliv. 2021, 36, 3867–3881. [Google Scholar] [CrossRef]
- Anzalchi, A.; Moghaddami, M.; Moghaddasi, A.; Sarwat, A.I.; Rathore, A.K. A new topology of higher order power filter for single-phase grid-tied voltage-source inverters. IEEE Trans. Ind. Electron. 2016, 63, 7511–7522. [Google Scholar] [CrossRef]
- Gao, W.; Wai, R.-J.; Liao, Y.-F.; Guo, M.-F.; Yang, Y. Internal overvoltage identification of distribution network via time-frequency atomic decomposition. IEEE Access 2019, 7, 85110–85122. [Google Scholar] [CrossRef]
- Tang, W.; Gu, Y.; Xin, Y.; Liang, Q.; Qian, T. Classification for transient overvoltages in offshore wind farms based on sparse decomposition. IEEE Trans. Power Deliv. 2022, 37, 1974–1985. [Google Scholar] [CrossRef]
- Yang, H.; Zhang, A.; Li, G. A new singular spectrum decomposition method based on cao algorithm and amplitude aware permutation entropy. IEEE Access 2021, 9, 44534–44557. [Google Scholar] [CrossRef]
- Seghouane, A.; Shokouhi, N.; Koch, I. Sparse principal component analysis with preserved sparsity pattern. IEEE Trans. Image Process. 2019, 28, 3274–3285. [Google Scholar] [CrossRef] [PubMed]
- Iqbal, M.; Jawad, M.; Jaffery, M.H.; Akhtar, S.; Rafiq, M.N.; Qureshi, M.B.; Ansari, A.R.; Nawaz, R. Neural networks based shunt hybrid active power filter for harmonic elimination. IEEE Access 2021, 9, 69913–69925. [Google Scholar] [CrossRef]


| Type | Actual Value | Predictive Value | Correct Rate |
|---|---|---|---|
| High-frequency resonance overvoltage | 10 | 10 | 100% |
| Power frequency overvoltage | 24 | 24 | 100% |
| Entering neutral section overvoltage | 11 | 9 | 82% |
| Out neutral section overvoltage | 20 | 20 | 100% |
| Ferroresonant overvoltage (1/3 power frequency) | 19 | 19 | 100% |
| Ferroresonant overvoltage (1/5 power frequency) | 27 | 27 | 100% |
| Type | Precision Rate | Recall Rate | Specificity | Accuracy Rate |
|---|---|---|---|---|
| High-frequency resonance overvoltage | 100% | 100% | 10% | 98.44% |
| Power frequency overvoltage | 100% | 100% | 4% | |
| Entering neutral section overvoltage | 82% | 100% | 0% | |
| Out neutral section overvoltage | 100% | 100% | 0% | |
| Ferroresonant overvoltage (1/3 power frequency) | 100% | 100% | 0% | |
| Ferroresonant overvoltage (1/5 power frequency) | 100% | 93% | 0% |
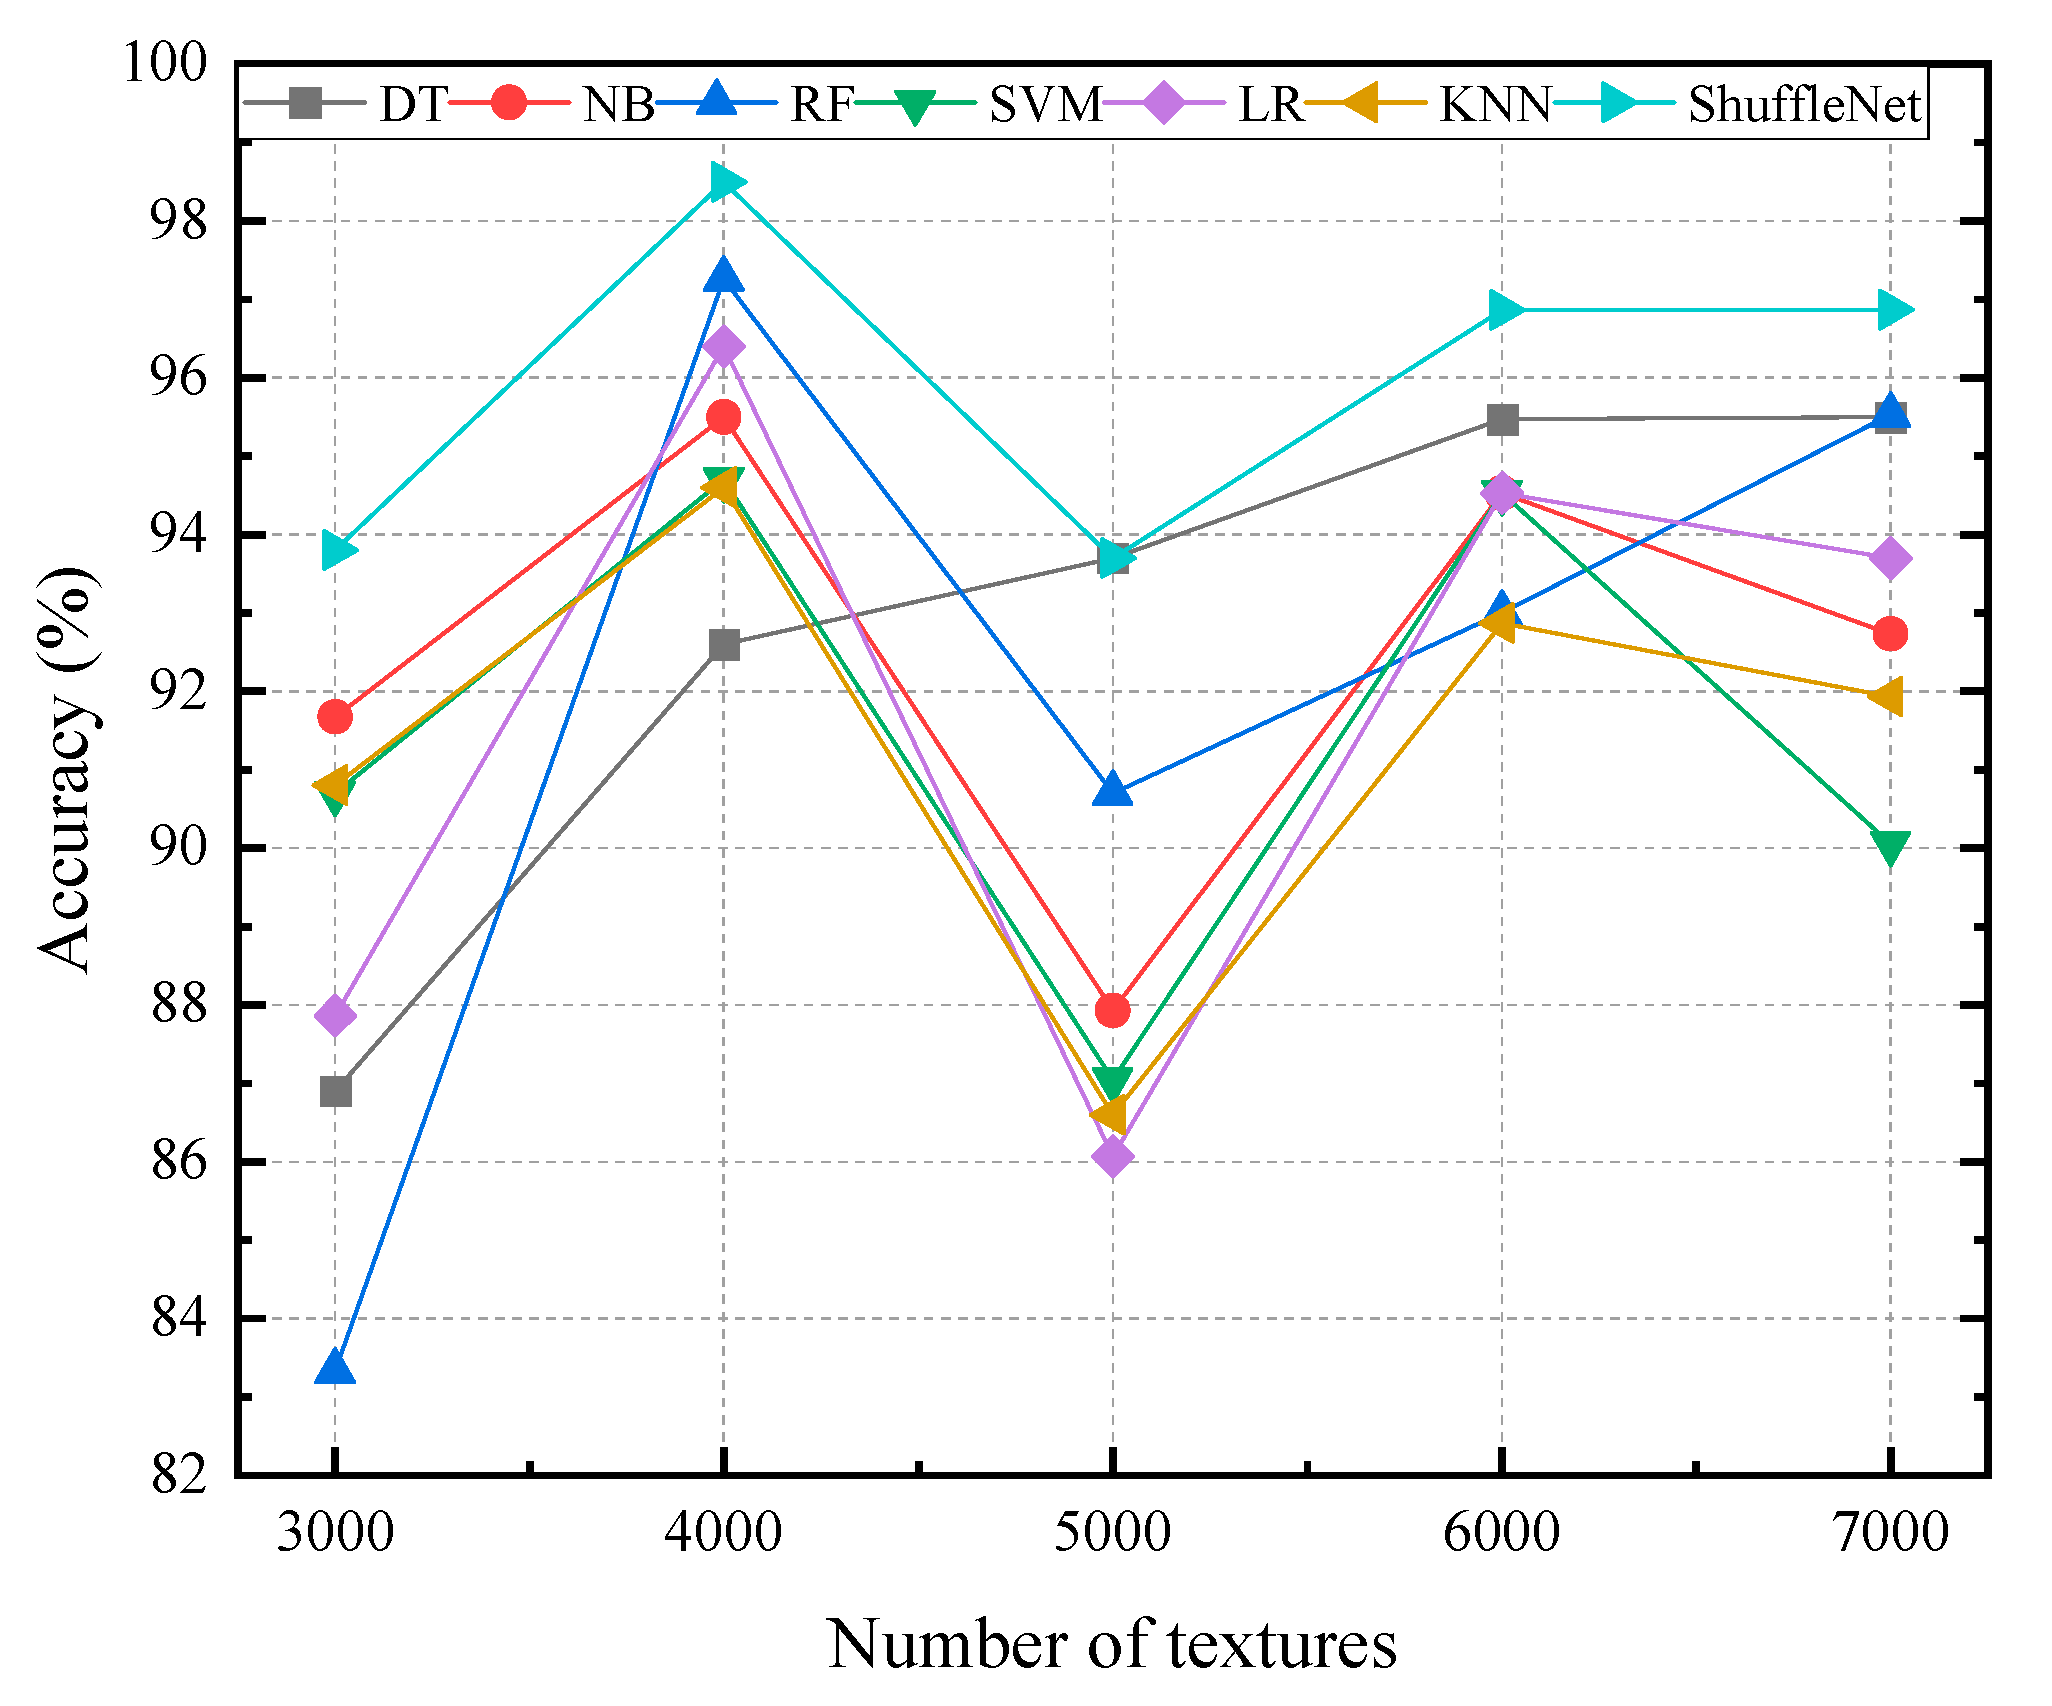
| Textures Number | Decision Tree (DT) | Naive Bayes (NB) | Random Forest (RF) | Support Vector Machine (SVM) | Logistic Regression (LR) | K Nearest Neighbor (KNN) | ShuffleNet (Proposed) |
|---|---|---|---|---|---|---|---|
| 3000 | 92.59 | 83.33 | 91.67 | 90.74 | 87.86 | 90.74 | 93.75 |
| 4000 | 95.50 | 95.50 | 97.3 | 94.77 | 96.40 | 94.77 | 98.44 |
| 5000 | 87.04 | 89.76 | 90.74 | 87.04 | 86.11 | 86.59 | 93.75 |
| 6000 | 95.50 | 94.59 | 93.69 | 94.59 | 94.59 | 92.79 | 96.88 |
| 7000 | 93.69 | 92.70 | 95.50 | 90.10 | 93.69 | 91.89 | 96.88 |
Publisher’s Note: MDPI stays neutral with regard to jurisdictional claims in published maps and institutional affiliations. |
© 2022 by the authors. Licensee MDPI, Basel, Switzerland. This article is an open access article distributed under the terms and conditions of the Creative Commons Attribution (CC BY) license (https://creativecommons.org/licenses/by/4.0/).
Share and Cite
Jin, M.; Yang, Y.; Yang, J.; Wu, M.; Xie, G.; Song, K. Propagation Characteristics and Identification of High-Order Harmonics of a Traction Power Supply System. Energies 2022, 15, 5647. https://doi.org/10.3390/en15155647
Jin M, Yang Y, Yang J, Wu M, Xie G, Song K. Propagation Characteristics and Identification of High-Order Harmonics of a Traction Power Supply System. Energies. 2022; 15(15):5647. https://doi.org/10.3390/en15155647
Chicago/Turabian StyleJin, Miaoxin, Yuehuan Yang, Jiapeng Yang, Mingli Wu, Ganghui Xie, and Kejian Song. 2022. "Propagation Characteristics and Identification of High-Order Harmonics of a Traction Power Supply System" Energies 15, no. 15: 5647. https://doi.org/10.3390/en15155647
APA StyleJin, M., Yang, Y., Yang, J., Wu, M., Xie, G., & Song, K. (2022). Propagation Characteristics and Identification of High-Order Harmonics of a Traction Power Supply System. Energies, 15(15), 5647. https://doi.org/10.3390/en15155647